Embed Size (px)
Citation preview
Department ofTransport
Department of Transport
Annual Report 2020-21
Planning and delivering transport solutions for the prosperity of Western Australians
Department of Transport
Annual Report 2020-21
Acknowledgment of Country
The Department of Transport acknowledges the Traditional Custodians of this Land and their connection to land, waters and community. We pay our respects to all members of Aboriginal communities, their cultures and Elders past, present and emerging.
Within Western Australia, the term Aboriginal is used in reference to Aboriginal and Torres Strait Islander, in recognition that Aboriginal people are the original inhabitants of Western Australia. Aboriginal and Torres Strait Islander may be referred to in the national context.
© Department of Transport 2021
Use of this report in part or as a whole is permitted provided there is acknowledgement of any material quoted or reproduced.
This report was published by the Department of Transport, October 2021.
Disclaimer
The Department of Transport makes the information in this report available on the understanding that users exercise their own skill and care with respect to its use and interpretation. Changes in circumstances after this document is made available may impact on the accuracy of the information.
Alternative formats
This publication is available in alternative formats upon request. Contact us to request a copy or submit an enquiry.
Contact us
Department of Transport Communications Branch
Office of the Director General GPO Box C102, PERTH WA 6839
Email: [email protected] Website: www.transport.wa.gov.au
ContentsOur Purpose ............................................................................................................................................... 7
Our Outcomes........................................................................................................................................... 7
Our Values .................................................................................................................................................. 7
Overview ..................................................................................................... 11
Director General’s Foreword ..............................................................................................................12
Managing Director’s Foreword ......................................................................................................... 14
Highlights .................................................................................................................................................. 16
DoT’s response to COVID-19 ............................................................................................................ 20
Embedding DoT’s integrity culture .................................................................................................23
Financial Summary ..............................................................................................................................24
Operational Structure ......................................................................................................................... 26
Transport Portfolio ............................................................................................................................... 28
Department of Transport Organisational Chart ....................................................................... 29
Corporate Executive ................................................................................ 30
Administered Legislation .......................................................................33
Outcome Based Management Framework ................................................................................ 34
Shared Responsibilities............................................................................36
Agency Performance ...............................................................................47
Report on Operations .........................................................................................................................48
Actual Financial Results Versus Budget Targets...................................................................... 92
Disclosures and Legal Compliance ........................................................93
Certification of Financial Statements ........................................................................................... 99
Notes to the Financial Statements ....................................................... 105
Certification of Key Performance Indicators ............................................................................ 175
Ministerial Directives .............................................................................. 195
Other Financial Disclosures ................................................................... 195
Governance Disclosures .................................................................................................................. 204
Other Legal Requirements ..............................................................................................................205
Government Policy Requirements ................................................................................................ 213
ANNUAL REPORT 2020-21 PAGE 5PAGE 4 DEPARTMENT OF TRANSPORT
Department of Transport
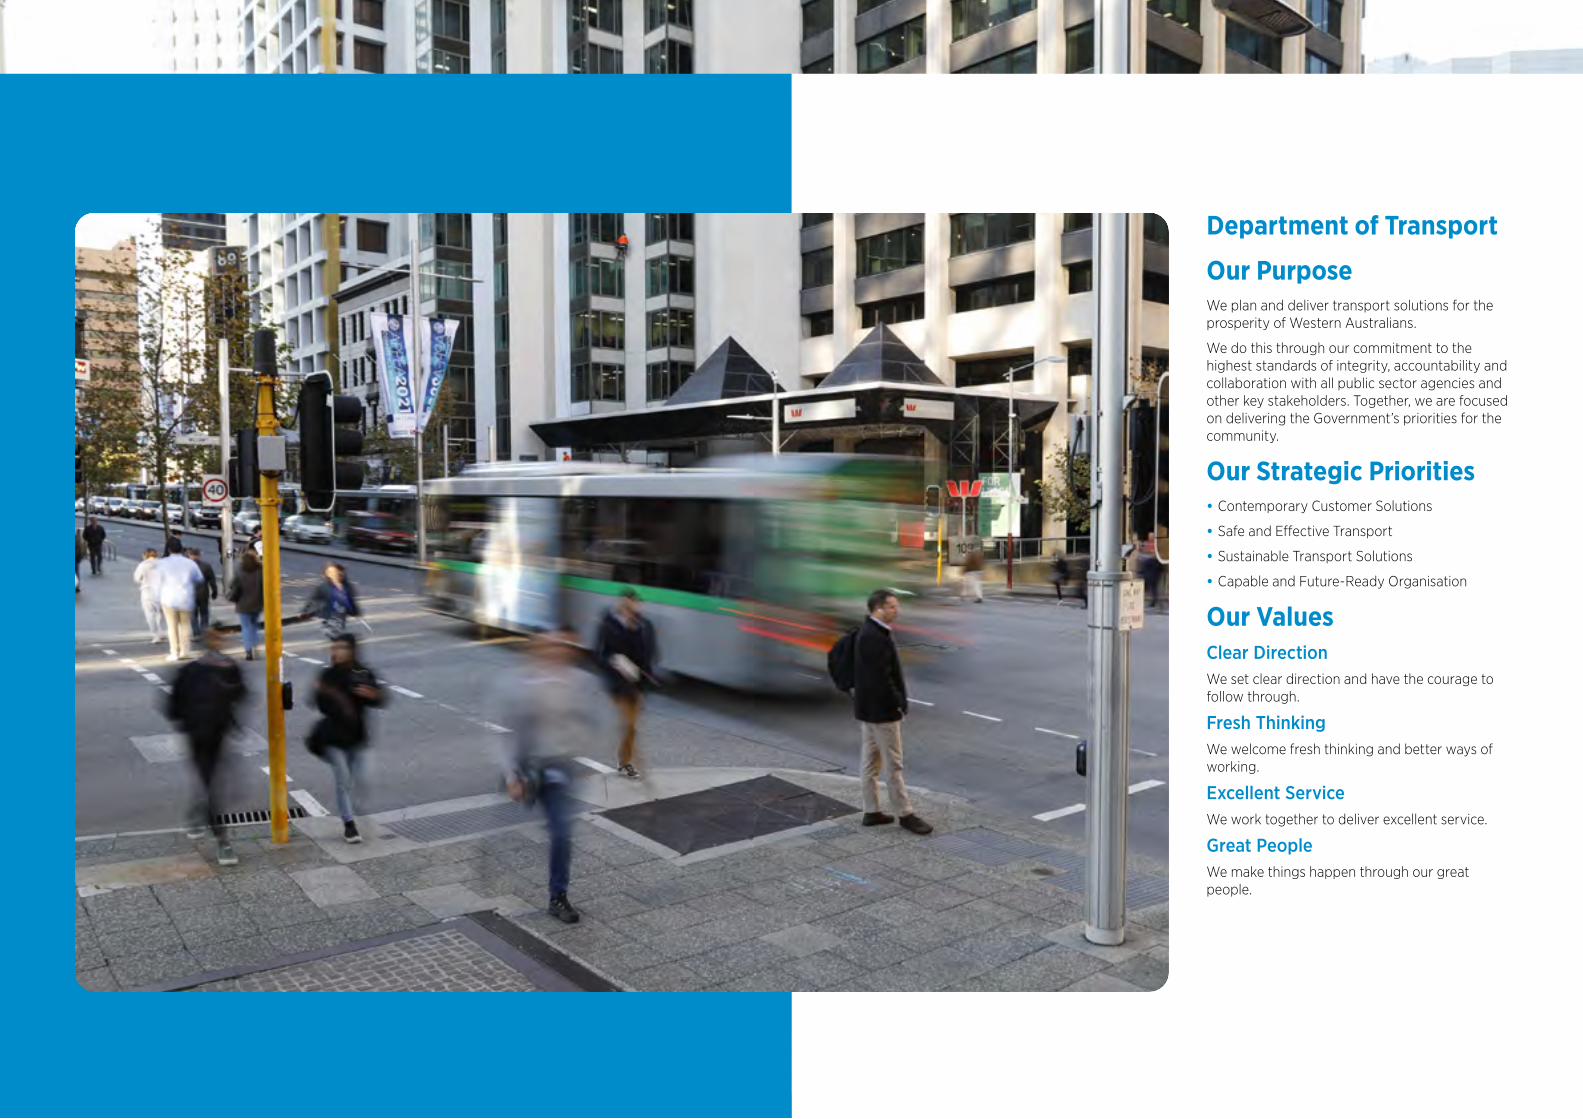
Our PurposeWe plan and deliver transport solutions for the prosperity of Western Australians.
We do this through our commitment to the highest standards of integrity, accountability and collaboration with all public sector agencies and other key stakeholders. Together, we are focused on delivering the Government’s priorities for the community.
Our Strategic Priorities • Contemporary Customer Solutions
• Safe and Effective Transport
• Sustainable Transport Solutions
• Capable and Future-Ready Organisation
Our ValuesClear DirectionWe set clear direction and have the courage to follow through.
Fresh ThinkingWe welcome fresh thinking and better ways of working.
Excellent ServiceWe work together to deliver excellent service.
Great PeopleWe make things happen through our great people.
Statement of Compliance with the Financial Management Act 2006For the year ended 30 June 2021
To the Hon. Rita Safoti MLA
Minister for Transport
In accordance with Section 63 of the Financial Management Act 2006, I hereby submit for your information and presentation to Parliament, the Annual Report of the Department of Transport for the financial year ended 30 June 2021.
The Annual Report has been prepared in accordance with the provisions of the Financial Management Act 2006 and fulfils DoT’s reporting obligations under the Public Sector Management Act 1994, the Disability Services Act 1993 and the Electoral Act 1907.
Peter Woronzow Acting Director General – Transport
Overview
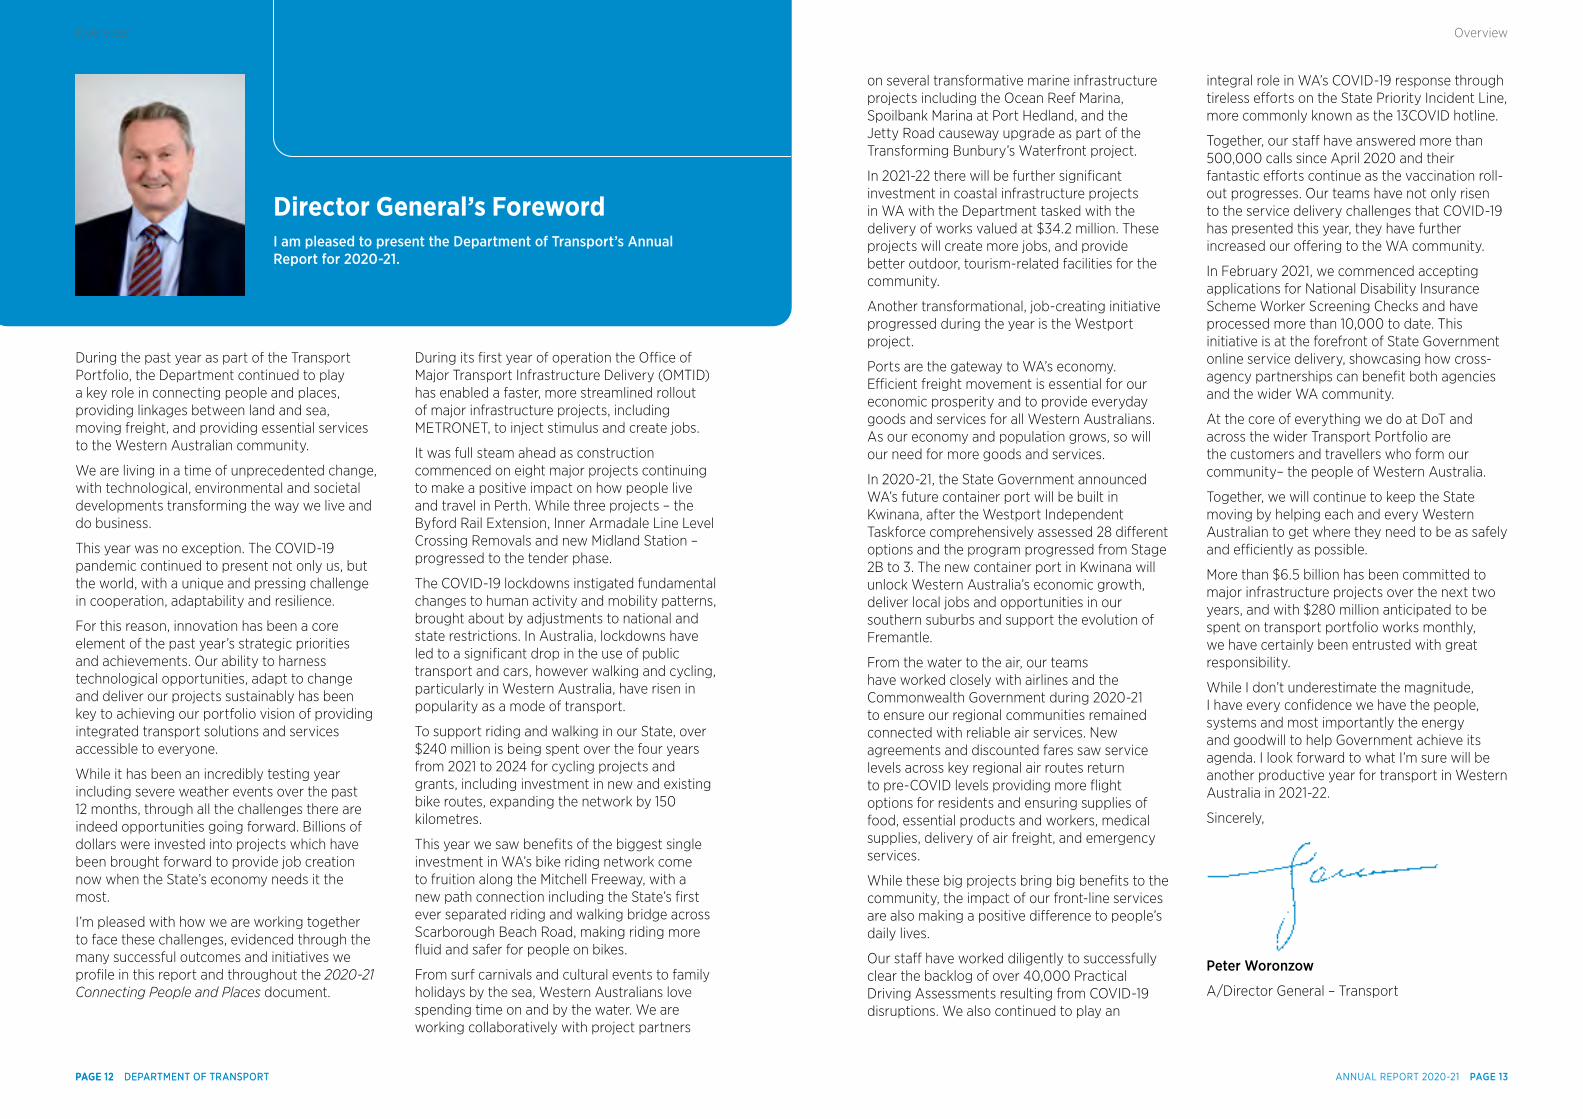
During the past year as part of the Transport Portfolio, the Department continued to play a key role in connecting people and places, providing linkages between land and sea, moving freight, and providing essential services to the Western Australian community.
We are living in a time of unprecedented change, with technological, environmental and societal developments transforming the way we live and do business.
This year was no exception. The COVID-19 pandemic continued to present not only us, but the world, with a unique and pressing challenge in cooperation, adaptability and resilience.
For this reason, innovation has been a core element of the past year’s strategic priorities and achievements. Our ability to harness technological opportunities, adapt to change and deliver our projects sustainably has been key to achieving our portfolio vision of providing integrated transport solutions and services accessible to everyone.
While it has been an incredibly testing year including severe weather events over the past 12 months, through all the challenges there are indeed opportunities going forward. Billions of dollars were invested into projects which have been brought forward to provide job creation now when the State’s economy needs it the most.
I’m pleased with how we are working together to face these challenges, evidenced through the many successful outcomes and initiatives we profile in this report and throughout the 2020-21 Connecting People and Places document.
During its first year of operation the Office of Major Transport Infrastructure Delivery (OMTID) has enabled a faster, more streamlined rollout of major infrastructure projects, including METRONET, to inject stimulus and create jobs.
It was full steam ahead as construction commenced on eight major projects continuing to make a positive impact on how people live and travel in Perth. While three projects – the Byford Rail Extension, Inner Armadale Line Level Crossing Removals and new Midland Station – progressed to the tender phase.
The COVID-19 lockdowns instigated fundamental changes to human activity and mobility patterns, brought about by adjustments to national and state restrictions. In Australia, lockdowns have led to a significant drop in the use of public transport and cars, however walking and cycling, particularly in Western Australia, have risen in popularity as a mode of transport.
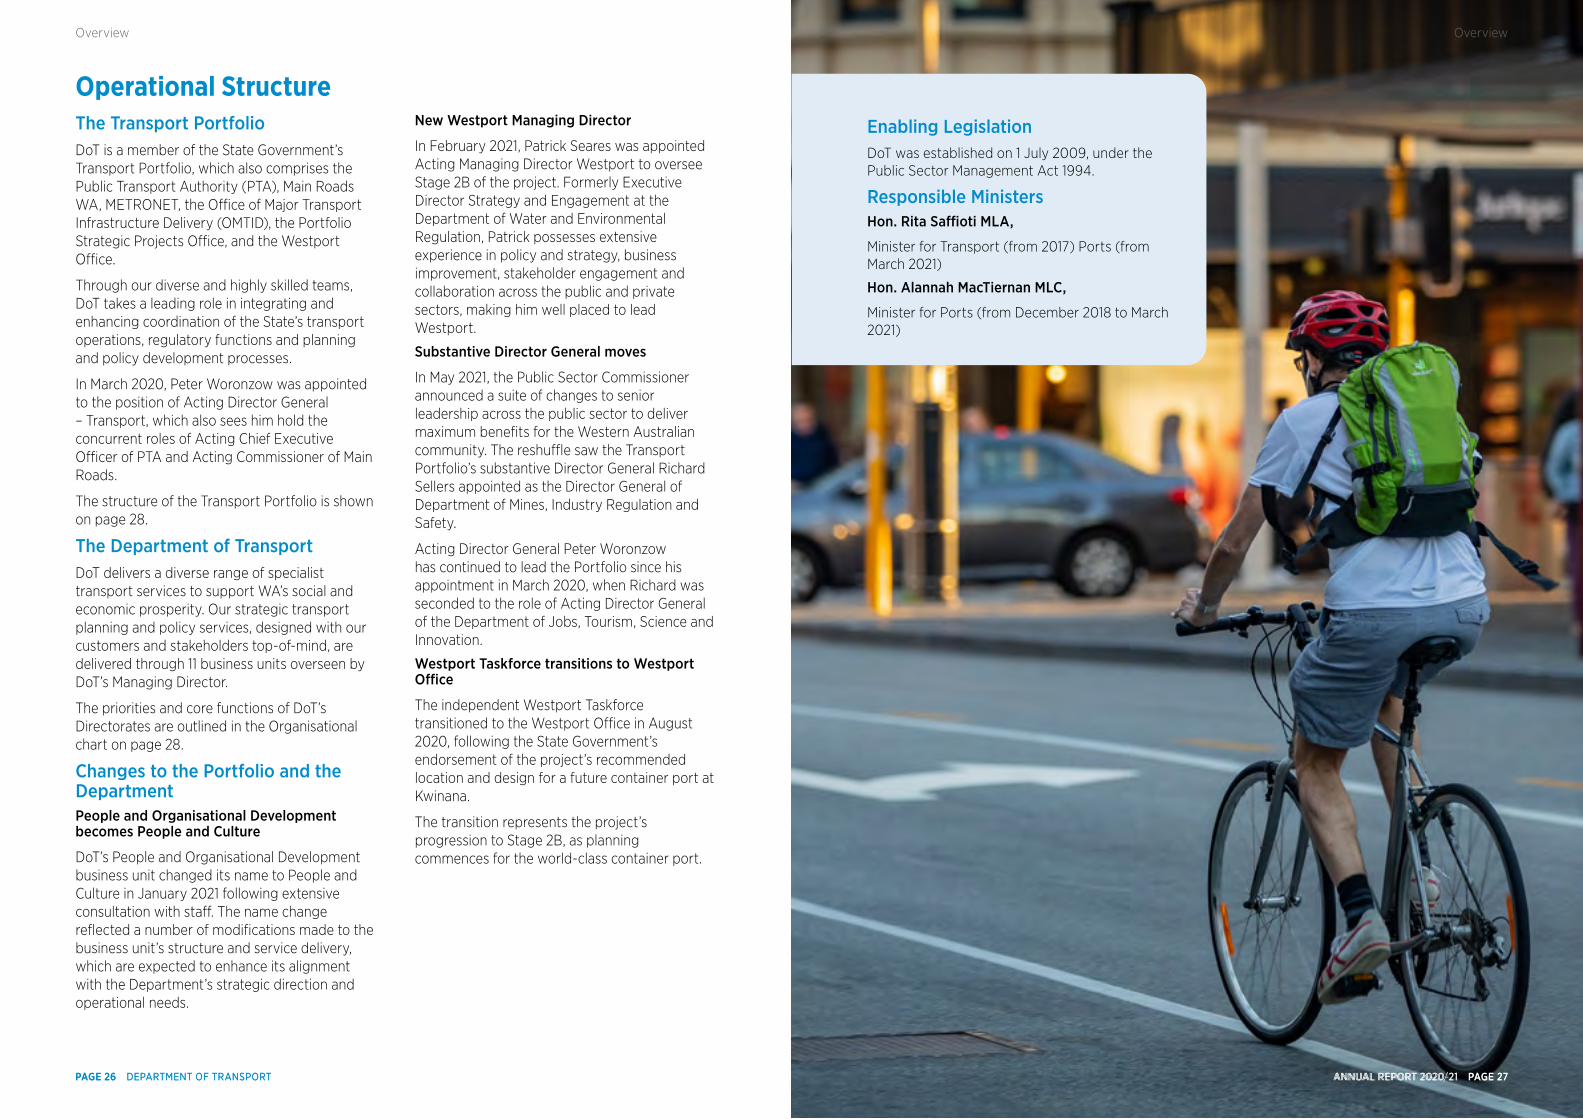
To support riding and walking in our State, over $240 million is being spent over the four years from 2021 to 2024 for cycling projects and grants, including investment in new and existing bike routes, expanding the network by 150 kilometres.
This year we saw benefits of the biggest single investment in WA’s bike riding network come to fruition along the Mitchell Freeway, with a new path connection including the State’s first ever separated riding and walking bridge across Scarborough Beach Road, making riding more fluid and safer for people on bikes.
From surf carnivals and cultural events to family holidays by the sea, Western Australians love spending time on and by the water. We are working collaboratively with project partners
Director General’s ForewordI am pleased to present the Department of Transport’s Annual Report for 2020-21.
on several transformative marine infrastructure projects including the Ocean Reef Marina, Spoilbank Marina at Port Hedland, and the Jetty Road causeway upgrade as part of the Transforming Bunbury’s Waterfront project.
In 2021-22 there will be further significant investment in coastal infrastructure projects in WA with the Department tasked with the delivery of works valued at $34.2 million. These projects will create more jobs, and provide better outdoor, tourism-related facilities for the community.
Another transformational, job-creating initiative progressed during the year is the Westport project.
Ports are the gateway to WA’s economy. Efficient freight movement is essential for our economic prosperity and to provide everyday goods and services for all Western Australians. As our economy and population grows, so will our need for more goods and services.
In 2020-21, the State Government announced WA’s future container port will be built in Kwinana, after the Westport Independent Taskforce comprehensively assessed 28 different options and the program progressed from Stage 2B to 3. The new container port in Kwinana will unlock Western Australia’s economic growth, deliver local jobs and opportunities in our southern suburbs and support the evolution of Fremantle.
From the water to the air, our teams have worked closely with airlines and the Commonwealth Government during 2020-21 to ensure our regional communities remained connected with reliable air services. New agreements and discounted fares saw service levels across key regional air routes return to pre-COVID levels providing more flight options for residents and ensuring supplies of food, essential products and workers, medical supplies, delivery of air freight, and emergency services.
While these big projects bring big benefits to the community, the impact of our front-line services are also making a positive difference to people’s daily lives.
Our staff have worked diligently to successfully clear the backlog of over 40,000 Practical Driving Assessments resulting from COVID-19 disruptions. We also continued to play an
integral role in WA’s COVID-19 response through tireless efforts on the State Priority Incident Line, more commonly known as the 13COVID hotline.
Together, our staff have answered more than 500,000 calls since April 2020 and their fantastic efforts continue as the vaccination roll-out progresses. Our teams have not only risen to the service delivery challenges that COVID-19 has presented this year, they have further increased our offering to the WA community.
In February 2021, we commenced accepting applications for National Disability Insurance Scheme Worker Screening Checks and have processed more than 10,000 to date. This initiative is at the forefront of State Government online service delivery, showcasing how cross-agency partnerships can benefit both agencies and the wider WA community.
At the core of everything we do at DoT and across the wider Transport Portfolio are the customers and travellers who form our community– the people of Western Australia.
Together, we will continue to keep the State moving by helping each and every Western Australian to get where they need to be as safely and efficiently as possible.
More than $6.5 billion has been committed to major infrastructure projects over the next two years, and with $280 million anticipated to be spent on transport portfolio works monthly, we have certainly been entrusted with great responsibility.
While I don’t underestimate the magnitude, I have every confidence we have the people, systems and most importantly the energy and goodwill to help Government achieve its agenda. I look forward to what I’m sure will be another productive year for transport in Western Australia in 2021-22.
Sincerely,
Peter Woronzow
A/Director General – Transport
ANNUAL REPORT 2020-21 PAGE 13PAGE 12 DEPARTMENT OF TRANSPORTPAGE 12 DEPARTMENT OF TRANSPORT
OverviewOverview
Station and Hutton Street in July 2020; the biggest single investment in WA’s PSP network to date. Focused on delivering safe, accessible active transport solutions and improving their uptake, the team successfully delivered the Your Move Stirling program to 19 schools and 16,150 residents.
DoT’s ongoing commitment to integrity and accountability was reinforced in 2020-21 through the Corporate Executive’s endorsement of the Integrity Strategy Implementation Plan in November 2020 and update of the Department’s Integrity Framework in May 2021 to include new initiatives. The Framework and Implementation Plan outline the high standards of professional and ethical conduct expected of DoT employees, agents and contractors, ensuring they act with honesty, accountability and integrity for the benefit of the WA community.
A diverse and progressive agency, DoT’s Multicultural Plan and Workforce Inclusion and Diversity Plan were both launched in 2020-21. The plans will ensure DoT remains committed to improving outcomes and access to services for culturally and linguistically diverse Western Australians, but also fostering a culture of acceptance, inclusion and diversity internally.
In a year unlike any other, our people were required to adapt to the challenges of supporting WA’s economic recovery while simultaneously responding to COVID-19 lockdowns and restrictions. Grant schemes, such as the Coastal Adaptation Protection grants and Regional Airports Development Scheme, provided a much-needed stimulus boost to the economy, while support was provided to the aviation industry to ensure regional air routes remained connected.
DVS’s 13COVID hotline continued to play an integral role in the State’s COVID-19 response, providing the latest information on the vaccination roll-out, lockdown information and travel advice for concerned Western Australians. More than 200 staff from across DoT and the wider public sector were trained to assist the hotline during peak lockdown periods.
As WA moved in and out of lockdown, the Communications team worked hard to deliver the latest information on restrictions and travel to staff and stakeholders efficiently and timely, while the Finance and Procurement Services team worked to ensure contracts for fast-tracked projects were awarded in a timely manner to aid economic recovery while maintaining high standards of accountability and integrity.
Despite the difficult and often hard to predict circumstances, our people continued to persevere and overcome adversity to deliver their best for our community. I am proud of the efforts of our employees with our partners and stakeholders and thank everyone for their hard work and valuable contributions.
Sincerely,
Iain Cameron
Managing Director Department of Transport
Managing Director’s ForewordIn an unprecedented year, the Department of Transport continued to play an integral role in supporting the Western Australian economy and the community throughout the COVID-19 pandemic and subsequent economic recovery.
Our great people at DoT have gone above and beyond to deliver excellent service to the people of WA overcoming challenges presented by COVID-19 to deliver projects, provide key services, operate facilities and lead reforms that support the safety, mobility, wellbeing and prosperity of the State.
On-demand Transport (OdT) staff completed the third and final stage of reform under the Transport (Road Passenger Services) Act 2018. The most comprehensive overhaul of the taxi and passenger transport industry in WA’s history, the reform represents a transformational change in customer-focused legislation by improving accountability, safety, flexibility and choice for both customers and businesses. The completion of the reform is the culmination of six years of hard work for the OdT team, with extensive support from across the agency.
Driver and Vehicle Services (DVS) introduced the Concessions for Classics scheme in April 2021. A voluntary concession available to owners of eligible street rods, cars and motorcycles, the scheme provides a 75 per cent reduction on the licence fee component of the vehicle licence and a significant reduction of motor insurance premiums. In addition to bringing WA into line with other states and territories, the scheme is benefitting all Western Australians by helping to preserve our automotive history.
The Freight, Ports, Aviation and Reform (FPAR) team worked hard to deliver the final stage of the Ports Governance Review, set to finish early July 2021. The reform will see four ports governed by DoT transferred to regional port authorities; a move 11 years in the making. Despite the impacts of COVID-19 on
domestic travel, regional Western Australian communities also continued to benefit from Regular Public Transport air services operated by seven different airlines on 18 air routes thanks to financial support and deeds of agreement between the FPAR team and the aviation industry.
The Regional Services team continued to deliver much needed transport vehicle and licensing services to regional and remote communities across the State. Staff continued to provide essential services and support the recovery of regional communities in the Mid West region in the aftermath of Tropical Cyclone Seroja.
The completion of the West Pilbara Plan and Dampier Peninsula Working Group has seen the team’s commitments absorbed into their business as usual operations, ensuring Western Australians in regional and remote communities are able to access services on an ongoing basis. Internally, staff enjoyed the benefits of moving to agile-based working environments and ability to work from alternative office locations thanks to metropolitan office refurbishments.
Maritime partnered with State and Local Government agencies to deliver significant coastal and marine infrastructure projects across the State. The completion of the Jetty Road Causeway Upgrade, a major component of the Transforming Bunbury’s Waterfront project, has helped to create vibrant shorelines for all Western Australians to enjoy, as well as deliver infrastructure to stimulate marine and tourism industries.
Urban Mobility celebrated the opening of the new section of Mitchell Freeway Principal Shared Path (PSP) between Glendalough
Despite the difficult and often hard to predict circumstances, our people continued to persevere and overcome adversity to deliver their best for our community
ANNUAL REPORT 2020-21 PAGE 15PAGE 14 DEPARTMENT OF TRANSPORTPAGE 14 DEPARTMENT OF TRANSPORT
OverviewOverview
Highlights
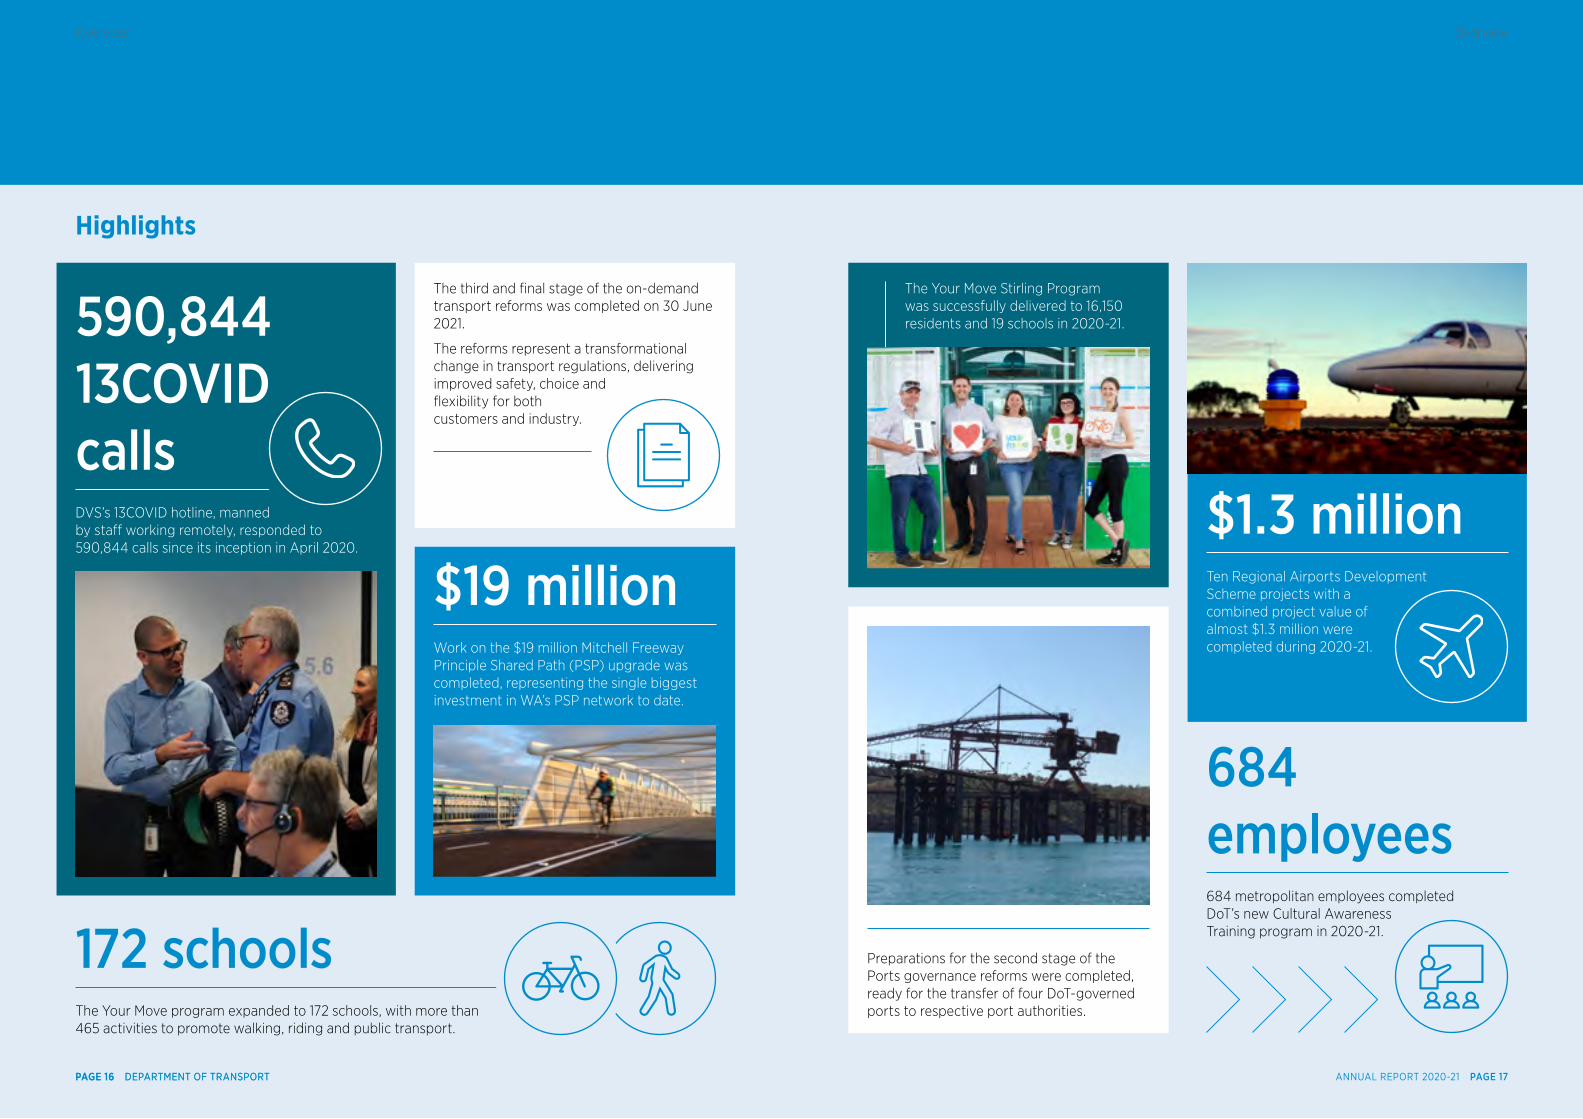
590,844 13COVID callsDVS’s 13COVID hotline, manned by staff working remotely, responded to 590,844 calls since its inception in April 2020.
The third and final stage of the on-demand transport reforms was completed on 30 June 2021.
The reforms represent a transformational change in transport regulations, delivering improved safety, choice and flexibility for both customers and industry.
$19 millionWork on the $19 million Mitchell Freeway Principle Shared Path (PSP) upgrade was completed, representing the single biggest investment in WA’s PSP network to date.
172 schoolsThe Your Move program expanded to 172 schools, with more than 465 activities to promote walking, riding and public transport.
The Your Move Stirling Program was successfully delivered to 16,150 residents and 19 schools in 2020-21.
684 employees684 metropolitan employees completed DoT’s new Cultural Awareness Training program in 2020-21.
$1.3 millionTen Regional Airports Development Scheme projects with a combined project value of almost $1.3 million were completed during 2020-21.
Preparations for the second stage of the Ports governance reforms were completed, ready for the transfer of four DoT-governed ports to respective port authorities.
ANNUAL REPORT 2020-21 PAGE 17PAGE 16 DEPARTMENT OF TRANSPORTPAGE 16 DEPARTMENT OF TRANSPORT
OverviewOverview
Highlights
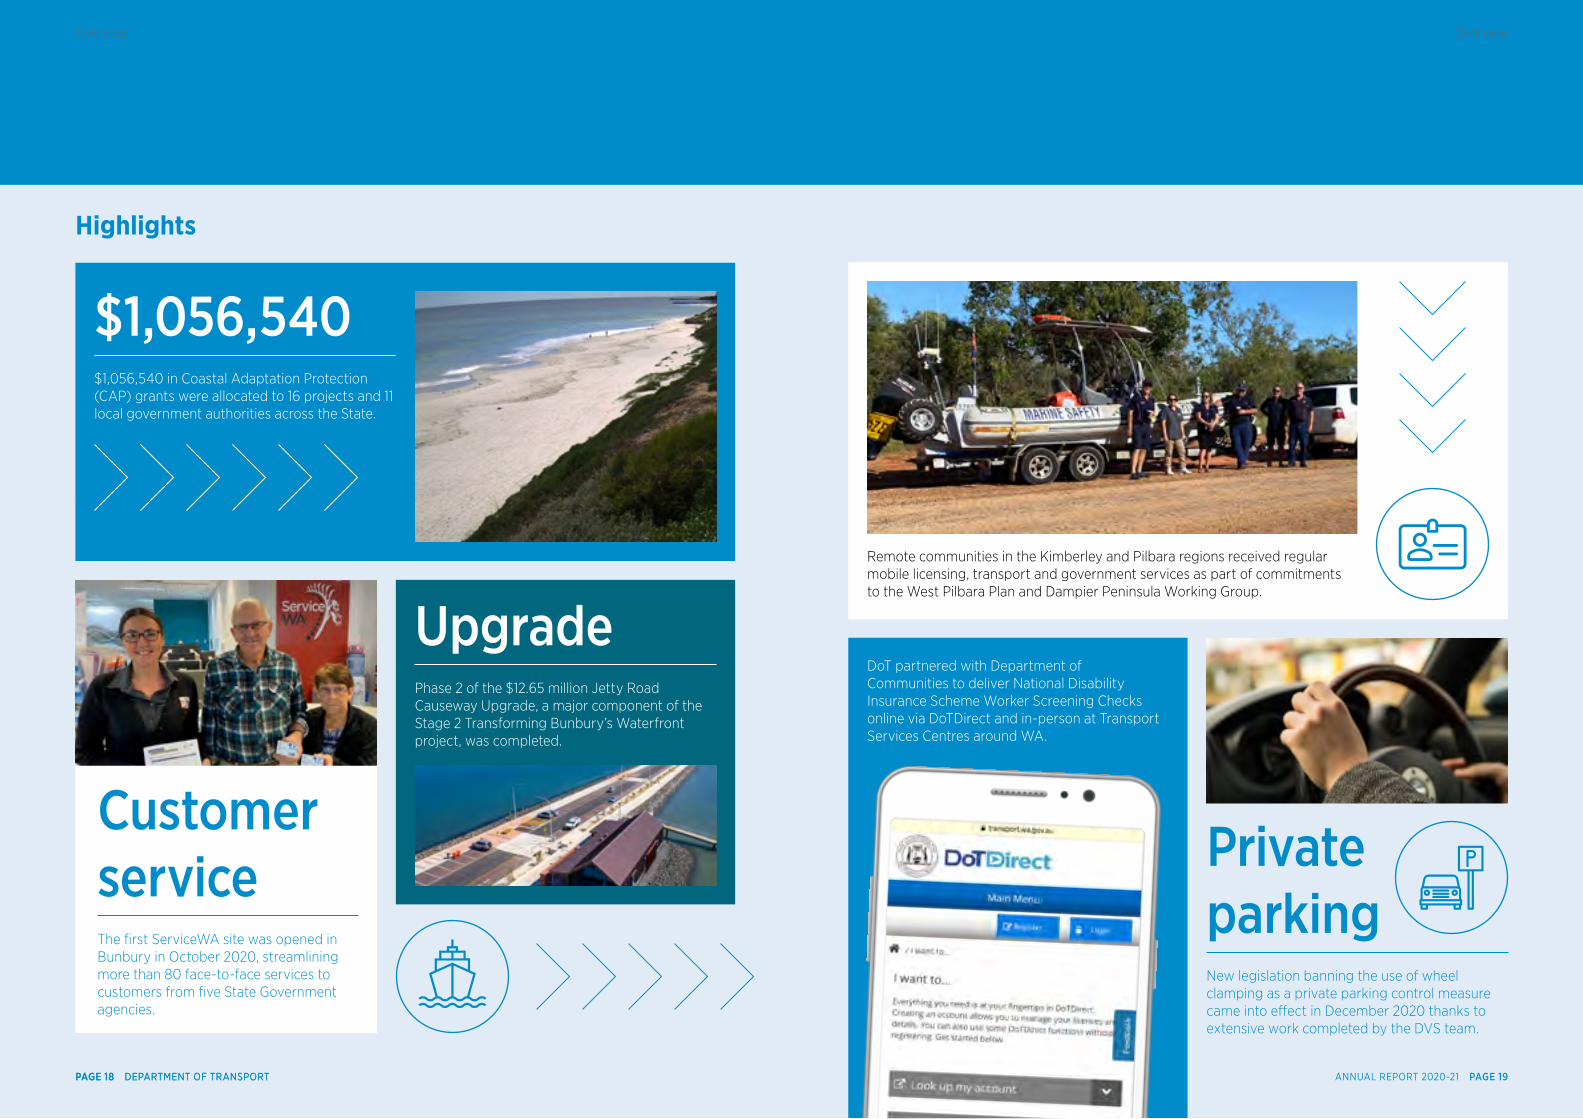
$1,056,540$1,056,540 in Coastal Adaptation Protection (CAP) grants were allocated to 16 projects and 11 local government authorities across the State.
Private parkingNew legislation banning the use of wheel clamping as a private parking control measure came into effect in December 2020 thanks to extensive work completed by the DVS team.
Customer serviceThe first ServiceWA site was opened in Bunbury in October 2020, streamlining more than 80 face-to-face services to customers from five State Government agencies.
UpgradePhase 2 of the $12.65 million Jetty Road Causeway Upgrade, a major component of the Stage 2 Transforming Bunbury’s Waterfront project, was completed.
DoT partnered with Department of Communities to deliver National Disability Insurance Scheme Worker Screening Checks online via DoTDirect and in-person at Transport Services Centres around WA.
Remote communities in the Kimberley and Pilbara regions received regular mobile licensing, transport and government services as part of commitments to the West Pilbara Plan and Dampier Peninsula Working Group.
ANNUAL REPORT 2020-21 PAGE 19PAGE 18 DEPARTMENT OF TRANSPORTPAGE 18 DEPARTMENT OF TRANSPORT
OverviewOverview
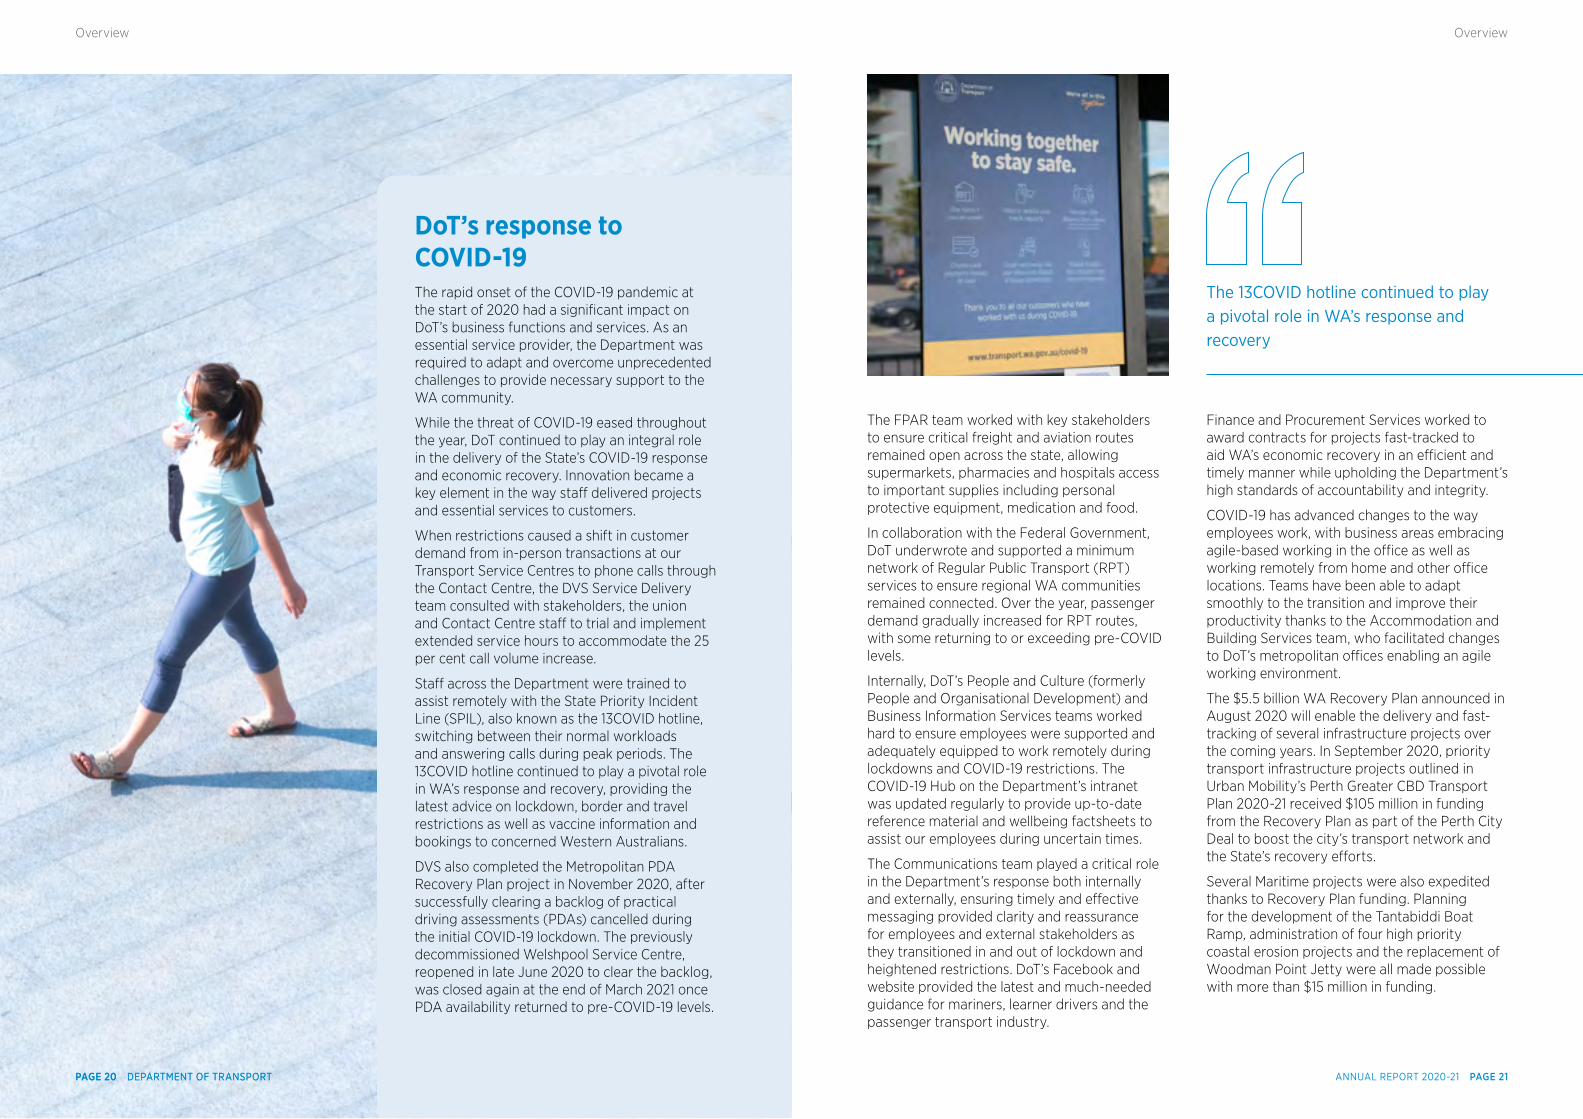
DoT’s response to COVID-19The rapid onset of the COVID-19 pandemic at the start of 2020 had a significant impact on DoT’s business functions and services. As an essential service provider, the Department was required to adapt and overcome unprecedented challenges to provide necessary support to the WA community.
While the threat of COVID-19 eased throughout the year, DoT continued to play an integral role in the delivery of the State’s COVID-19 response and economic recovery. Innovation became a key element in the way staff delivered projects and essential services to customers.
When restrictions caused a shift in customer demand from in-person transactions at our Transport Service Centres to phone calls through the Contact Centre, the DVS Service Delivery team consulted with stakeholders, the union and Contact Centre staff to trial and implement extended service hours to accommodate the 25 per cent call volume increase.
Staff across the Department were trained to assist remotely with the State Priority Incident Line (SPIL), also known as the 13COVID hotline, switching between their normal workloads and answering calls during peak periods. The 13COVID hotline continued to play a pivotal role in WA’s response and recovery, providing the latest advice on lockdown, border and travel restrictions as well as vaccine information and bookings to concerned Western Australians.
DVS also completed the Metropolitan PDA Recovery Plan project in November 2020, after successfully clearing a backlog of practical driving assessments (PDAs) cancelled during the initial COVID-19 lockdown. The previously decommissioned Welshpool Service Centre, reopened in late June 2020 to clear the backlog, was closed again at the end of March 2021 once PDA availability returned to pre-COVID-19 levels.
The FPAR team worked with key stakeholders to ensure critical freight and aviation routes remained open across the state, allowing supermarkets, pharmacies and hospitals access to important supplies including personal protective equipment, medication and food.
In collaboration with the Federal Government, DoT underwrote and supported a minimum network of Regular Public Transport (RPT) services to ensure regional WA communities remained connected. Over the year, passenger demand gradually increased for RPT routes, with some returning to or exceeding pre-COVID levels.
Internally, DoT’s People and Culture (formerly People and Organisational Development) and Business Information Services teams worked hard to ensure employees were supported and adequately equipped to work remotely during lockdowns and COVID-19 restrictions. The COVID-19 Hub on the Department’s intranet was updated regularly to provide up-to-date reference material and wellbeing factsheets to assist our employees during uncertain times.
The Communications team played a critical role in the Department’s response both internally and externally, ensuring timely and effective messaging provided clarity and reassurance for employees and external stakeholders as they transitioned in and out of lockdown and heightened restrictions. DoT’s Facebook and website provided the latest and much-needed guidance for mariners, learner drivers and the passenger transport industry.
Finance and Procurement Services worked to award contracts for projects fast-tracked to aid WA’s economic recovery in an efficient and timely manner while upholding the Department’s high standards of accountability and integrity.
COVID-19 has advanced changes to the way employees work, with business areas embracing agile-based working in the office as well as working remotely from home and other office locations. Teams have been able to adapt smoothly to the transition and improve their productivity thanks to the Accommodation and Building Services team, who facilitated changes to DoT’s metropolitan offices enabling an agile working environment.
The $5.5 billion WA Recovery Plan announced in August 2020 will enable the delivery and fast-tracking of several infrastructure projects over the coming years. In September 2020, priority transport infrastructure projects outlined in Urban Mobility’s Perth Greater CBD Transport Plan 2020-21 received $105 million in funding from the Recovery Plan as part of the Perth City Deal to boost the city’s transport network and the State’s recovery efforts.
Several Maritime projects were also expedited thanks to Recovery Plan funding. Planning for the development of the Tantabiddi Boat Ramp, administration of four high priority coastal erosion projects and the replacement of Woodman Point Jetty were all made possible with more than $15 million in funding.
The 13COVID hotline continued to play a pivotal role in WA’s response and recovery
ANNUAL REPORT 2020-21 PAGE 21PAGE 20 DEPARTMENT OF TRANSPORTPAGE 20 DEPARTMENT OF TRANSPORT
OverviewOverview
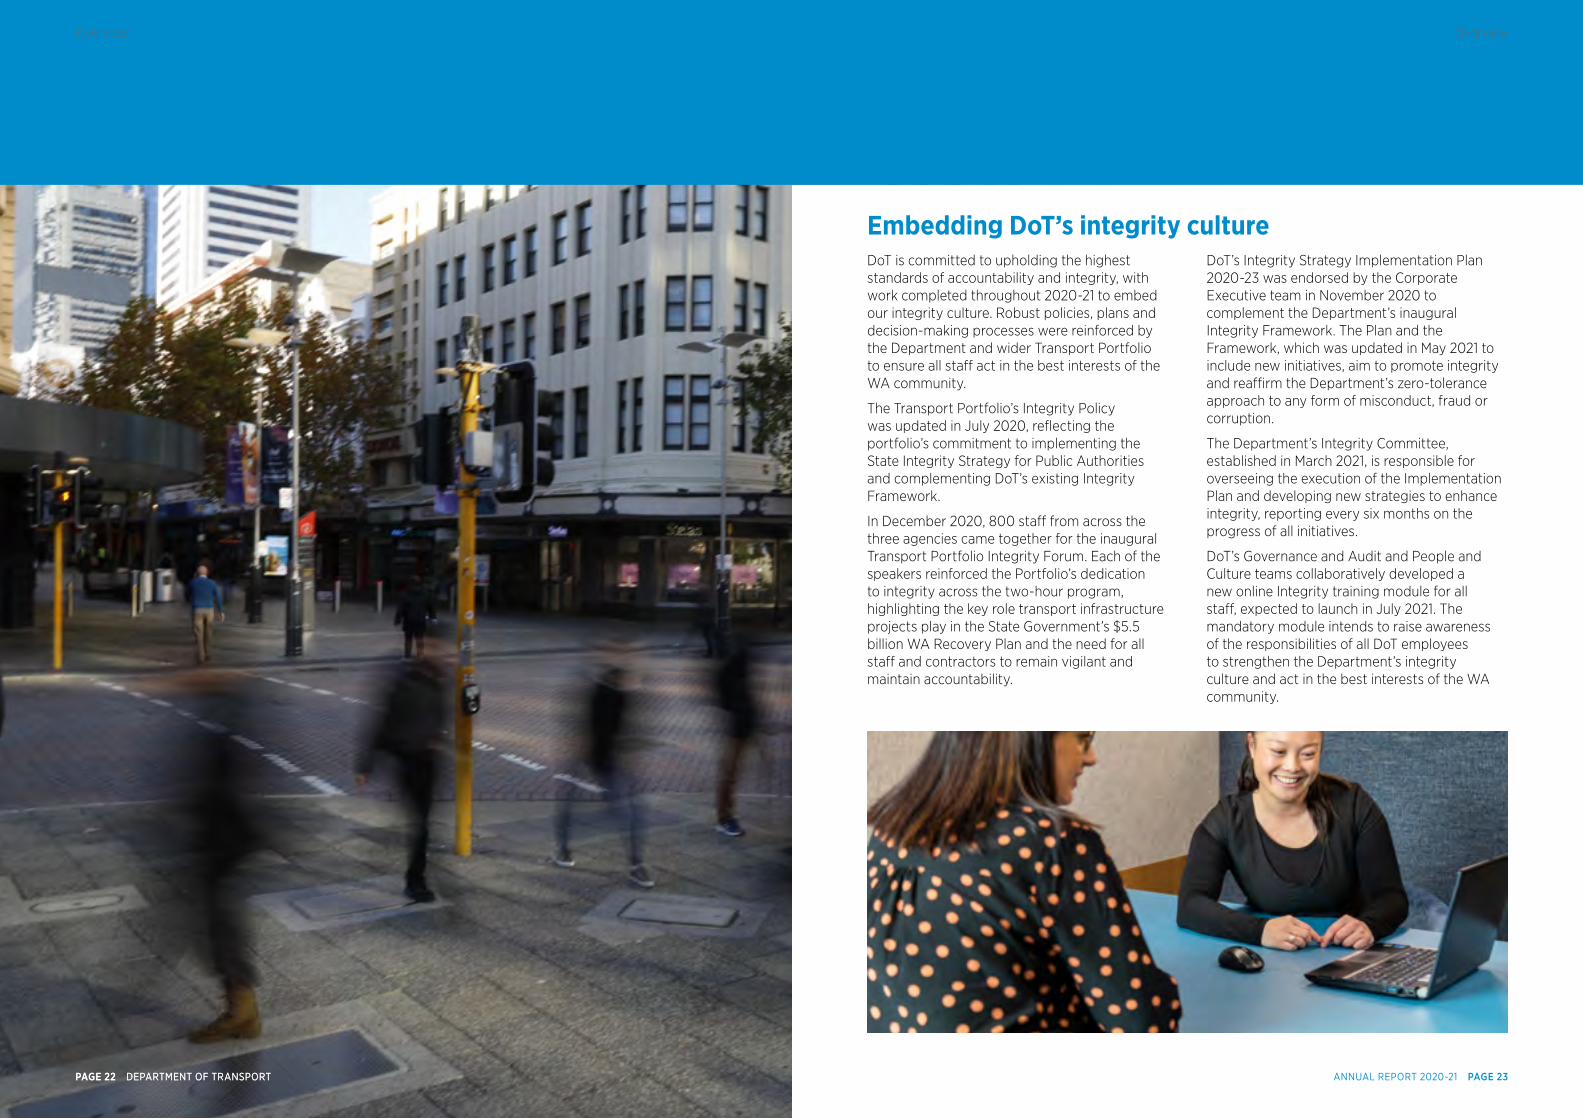
Embedding DoT’s integrity cultureDoT is committed to upholding the highest standards of accountability and integrity, with work completed throughout 2020-21 to embed our integrity culture. Robust policies, plans and decision-making processes were reinforced by the Department and wider Transport Portfolio to ensure all staff act in the best interests of the WA community.
The Transport Portfolio’s Integrity Policy was updated in July 2020, reflecting the portfolio’s commitment to implementing the State Integrity Strategy for Public Authorities and complementing DoT’s existing Integrity Framework.
In December 2020, 800 staff from across the three agencies came together for the inaugural Transport Portfolio Integrity Forum. Each of the speakers reinforced the Portfolio’s dedication to integrity across the two-hour program, highlighting the key role transport infrastructure projects play in the State Government’s $5.5 billion WA Recovery Plan and the need for all staff and contractors to remain vigilant and maintain accountability.
DoT’s Integrity Strategy Implementation Plan 2020-23 was endorsed by the Corporate Executive team in November 2020 to complement the Department’s inaugural Integrity Framework. The Plan and the Framework, which was updated in May 2021 to include new initiatives, aim to promote integrity and reaffirm the Department’s zero-tolerance approach to any form of misconduct, fraud or corruption.
The Department’s Integrity Committee, established in March 2021, is responsible for overseeing the execution of the Implementation Plan and developing new strategies to enhance integrity, reporting every six months on the progress of all initiatives.
DoT’s Governance and Audit and People and Culture teams collaboratively developed a new online Integrity training module for all staff, expected to launch in July 2021. The mandatory module intends to raise awareness of the responsibilities of all DoT employees to strengthen the Department’s integrity culture and act in the best interests of the WA community.
ANNUAL REPORT 2020-21 PAGE 23PAGE 22 DEPARTMENT OF TRANSPORTPAGE 22 DEPARTMENT OF TRANSPORT
OverviewOverview
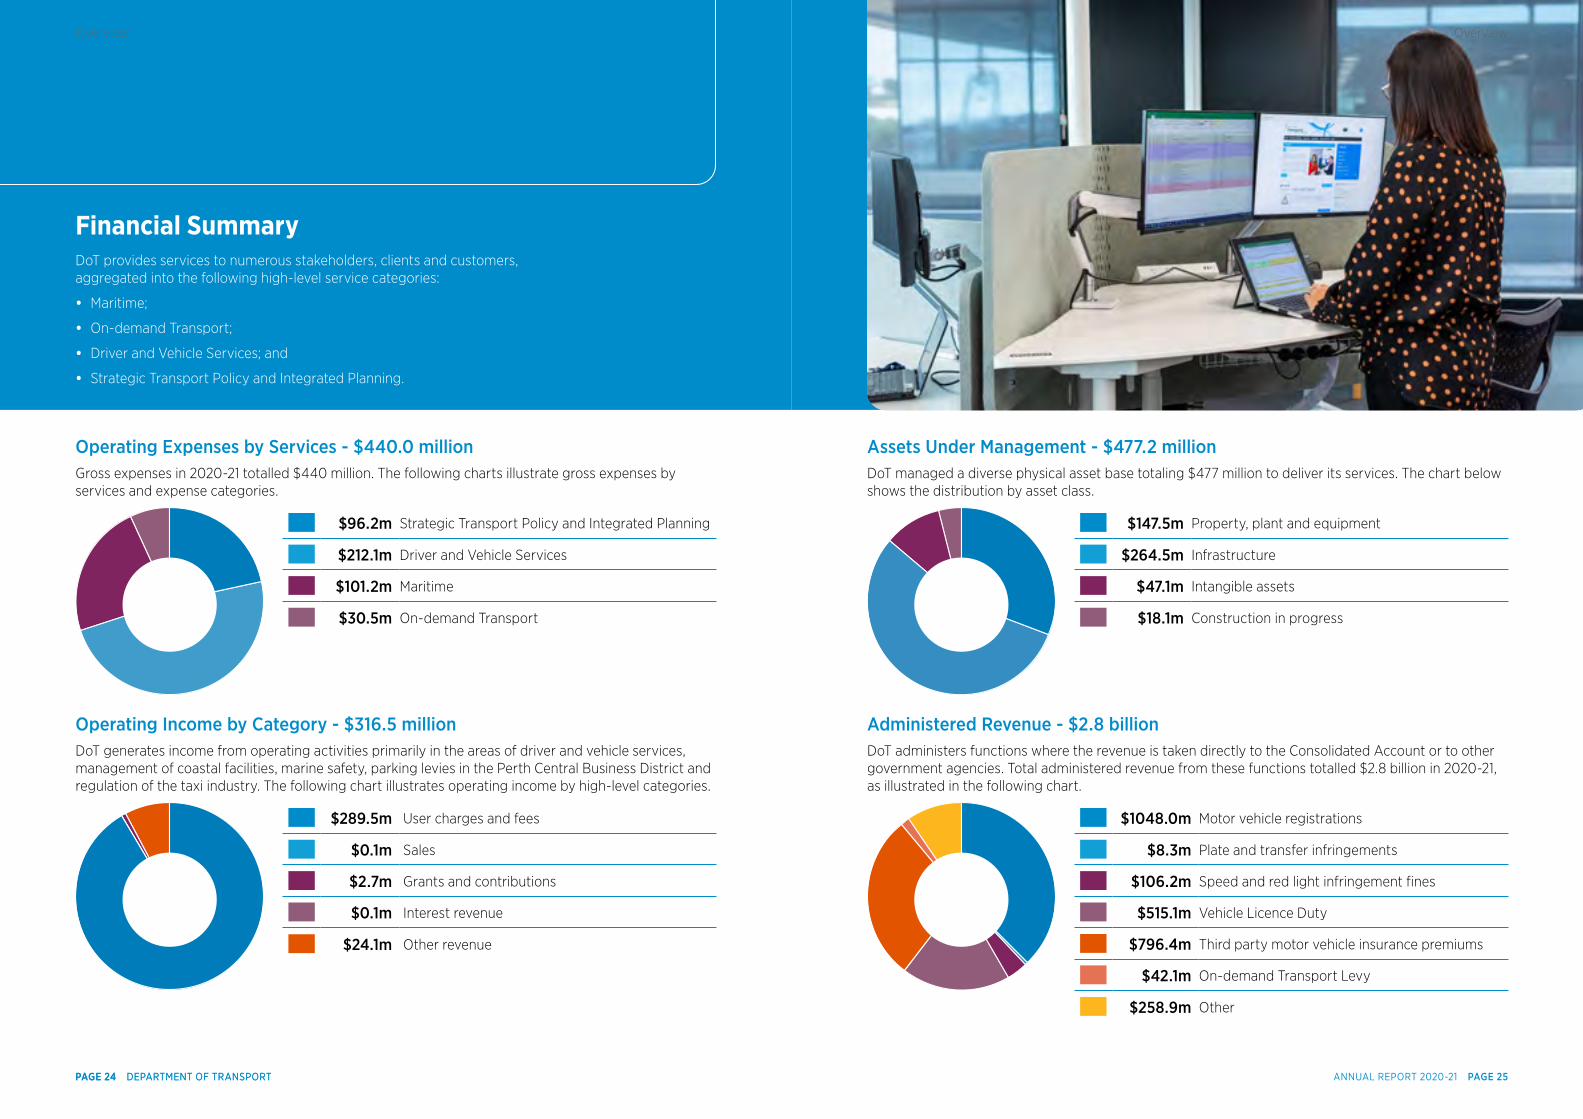
Operating Expenses by Services - $440.0 millionGross expenses in 2020-21 totalled $440 million. The following charts illustrate gross expenses by services and expense categories.
$96.2m Strategic Transport Policy and Integrated Planning
$212.1m Driver and Vehicle Services
$101.2m Maritime
$30.5m On-demand Transport
Operating Income by Category - $316.5 millionDoT generates income from operating activities primarily in the areas of driver and vehicle services, management of coastal facilities, marine safety, parking levies in the Perth Central Business District and regulation of the taxi industry. The following chart illustrates operating income by high-level categories.
$289.5m User charges and fees
$0.1m Sales
$2.7m Grants and contributions
$0.1m Interest revenue
$24.1m Other revenue
Financial Summary DoT provides services to numerous stakeholders, clients and customers, aggregated into the following high-level service categories:
• Maritime;
• On-demand Transport;
• Driver and Vehicle Services; and
• Strategic Transport Policy and Integrated Planning.
Assets Under Management - $477.2 millionDoT managed a diverse physical asset base totaling $477 million to deliver its services. The chart below shows the distribution by asset class.
$147.5m Property, plant and equipment
$264.5m Infrastructure
$47.1m Intangible assets
$18.1m Construction in progress
Administered Revenue - $2.8 billionDoT administers functions where the revenue is taken directly to the Consolidated Account or to other government agencies. Total administered revenue from these functions totalled $2.8 billion in 2020-21, as illustrated in the following chart.
$1048.0m Motor vehicle registrations
$8.3m Plate and transfer infringements
$106.2m Speed and red light infringement fines
$515.1m Vehicle Licence Duty
$796.4m Third party motor vehicle insurance premiums
$42.1m On-demand Transport Levy
$258.9m Other
ANNUAL REPORT 2020-21 PAGE 25PAGE 24 DEPARTMENT OF TRANSPORTPAGE 24 DEPARTMENT OF TRANSPORT
OverviewOverview
Operational StructureThe Transport PortfolioDoT is a member of the State Government’s Transport Portfolio, which also comprises the Public Transport Authority (PTA), Main Roads WA, METRONET, the Office of Major Transport Infrastructure Delivery (OMTID), the Portfolio Strategic Projects Office, and the Westport Office.
Through our diverse and highly skilled teams, DoT takes a leading role in integrating and enhancing coordination of the State’s transport operations, regulatory functions and planning and policy development processes.
In March 2020, Peter Woronzow was appointed to the position of Acting Director General – Transport, which also sees him hold the concurrent roles of Acting Chief Executive Officer of PTA and Acting Commissioner of Main Roads.
The structure of the Transport Portfolio is shown on page 28.
The Department of TransportDoT delivers a diverse range of specialist transport services to support WA’s social and economic prosperity. Our strategic transport planning and policy services, designed with our customers and stakeholders top-of-mind, are delivered through 11 business units overseen by DoT’s Managing Director.
The priorities and core functions of DoT’s Directorates are outlined in the Organisational chart on page 28.
Changes to the Portfolio and the DepartmentPeople and Organisational Development becomes People and Culture
DoT’s People and Organisational Development business unit changed its name to People and Culture in January 2021 following extensive consultation with staff. The name change reflected a number of modifications made to the business unit’s structure and service delivery, which are expected to enhance its alignment with the Department’s strategic direction and operational needs.
New Westport Managing Director
In February 2021, Patrick Seares was appointed Acting Managing Director Westport to oversee Stage 2B of the project. Formerly Executive Director Strategy and Engagement at the Department of Water and Environmental Regulation, Patrick possesses extensive experience in policy and strategy, business improvement, stakeholder engagement and collaboration across the public and private sectors, making him well placed to lead Westport.
Substantive Director General moves
In May 2021, the Public Sector Commissioner announced a suite of changes to senior leadership across the public sector to deliver maximum benefits for the Western Australian community. The reshuffle saw the Transport Portfolio’s substantive Director General Richard Sellers appointed as the Director General of Department of Mines, Industry Regulation and Safety.
Acting Director General Peter Woronzow has continued to lead the Portfolio since his appointment in March 2020, when Richard was seconded to the role of Acting Director General of the Department of Jobs, Tourism, Science and Innovation.
Westport Taskforce transitions to Westport Ofce
The independent Westport Taskforce transitioned to the Westport Office in August 2020, following the State Government’s endorsement of the project’s recommended location and design for a future container port at Kwinana.
The transition represents the project’s progression to Stage 2B, as planning commences for the world-class container port.
Enabling LegislationDoT was established on 1 July 2009, under the Public Sector Management Act 1994.
Responsible MinistersHon. Rita Safoti MLA,
Minister for Transport (from 2017) Ports (from March 2021)
Hon. Alannah MacTiernan MLC,
Minister for Ports (from December 2018 to March 2021)
ANNUAL REPORT 2020-21 PAGE 27PAGE 26 DEPARTMENT OF TRANSPORT ANNUAL REPORT 2020/21 PAGE 27PAGE 26 DEPARTMENT OF TRANSPORT
OverviewOverview
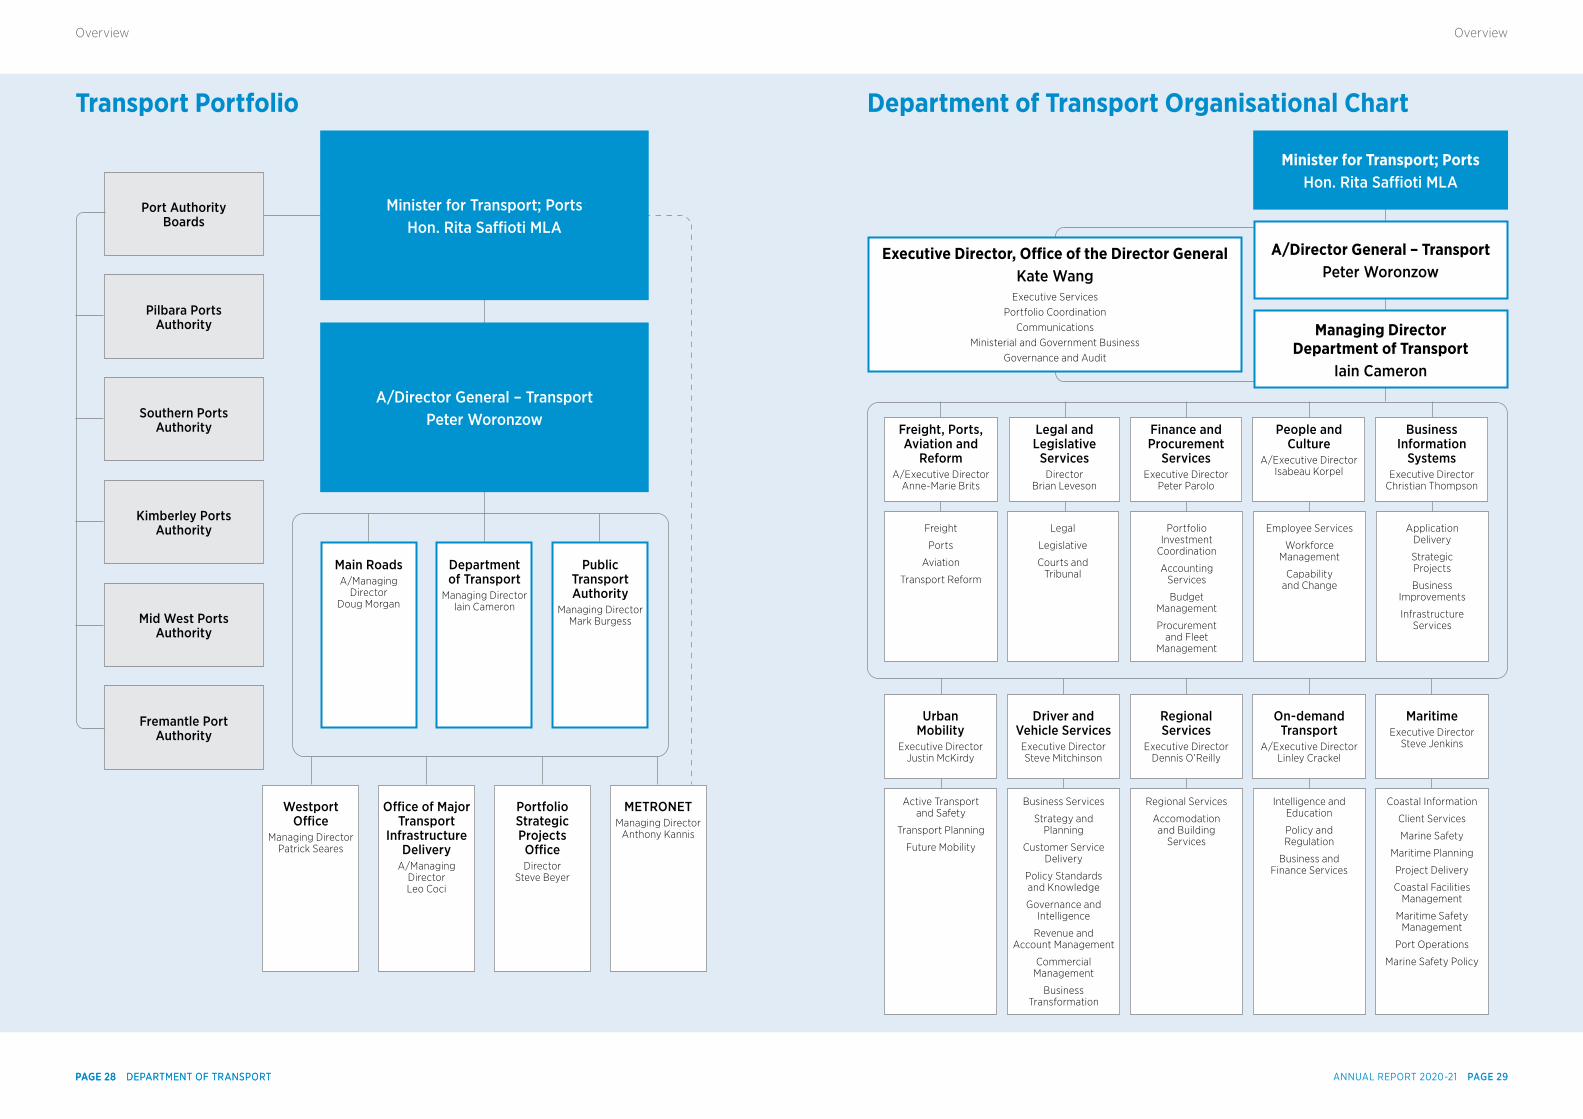
Transport Portfolio
Main RoadsA/Managing
Director Doug Morgan
Department of Transport
Managing Director Iain Cameron
Public Transport Authority
Managing Director Mark Burgess
Westport Ofce
Managing Director Patrick Seares
Ofce of Major Transport
Infrastructure Delivery
A/Managing Director Leo Coci
Portfolio Strategic Projects OfceDirector
Steve Beyer
METRONETManaging Director
Anthony Kannis
Minister for Transport; PortsHon. Rita Safoti MLA
A/Director General – TransportPeter Woronzow
Port Authority Boards
Pilbara Ports Authority
Southern Ports Authority
Kimberley Ports Authority
Mid West Ports Authority
Fremantle Port Authority
Department of Transport Organisational Chart
Executive Director, Office of the Director GeneralKate Wang
Executive ServicesPortfolio Coordination
CommunicationsMinisterial and Government Business
Governance and Audit
Minister for Transport; PortsHon. Rita Safoti MLA
A/Director General – TransportPeter Woronzow
Managing Director Department of Transport
Iain Cameron
Coastal Information
Client Services
Marine Safety
Maritime Planning
Project Delivery
Coastal Facilities Management
Maritime Safety Management
Port Operations
Marine Safety Policy
MaritimeExecutive Director
Steve Jenkins
On-demand Transport
A/Executive Director Linley Crackel
Intelligence and Education
Policy and Regulation
Business and Finance Services
Regional Services
Executive Director Dennis O’Reilly
Regional Services
Accomodation and Building
Services
Driver and Vehicle Services
Executive Director Steve Mitchinson
Business Services
Strategy and Planning
Customer Service Delivery
Policy Standards and Knowledge
Governance and Intelligence
Revenue and Account Management
Commercial Management
Business Transformation
Urban Mobility
Executive Director Justin McKirdy
Active Transport and Safety
Transport Planning
Future Mobility
Business Information
SystemsExecutive Director
Christian Thompson
Application Delivery
Strategic Projects
Business Improvements
Infrastructure Services
People and Culture
A/Executive Director Isabeau Korpel
Employee Services
Workforce Management
Capability and Change
Finance and Procurement
ServicesExecutive Director
Peter Parolo
Portfolio Investment
Coordination
Accounting Services
Budget Management
Procurement and Fleet
Management
Legal and Legislative
ServicesDirector
Brian Leveson
Legal
Legislative
Courts and Tribunal
Freight, Ports, Aviation and
ReformA/Executive Director
Anne-Marie Brits
Freight
Ports
Aviation
Transport Reform
ANNUAL REPORT 2020-21 PAGE 29PAGE 28 DEPARTMENT OF TRANSPORTPAGE 28 DEPARTMENT OF TRANSPORT
OverviewOverview
Corporate Executive
Peter WoronzowActing Director General – Transport
Joined the Corporate Executive Team in March 2020.
2020-21 has been a busy year for the Transport Portfolio. I’m proud of the integral role the Portfolio agencies have played in the State’s COVID-19 response and recovery efforts.
Iain Cameron Managing Director
Joined the Corporate Executive Team in November 2018.
This year, our community has been challenged by health, social, environmental and economic impacts from COVID-19, bushfires and cyclones. I am proud of the way our great people at DoT, in the finest traditions of public service, have supported our community through the pandemic and these challenging events by continuing to deliver essential customer services, infrastructure, regulatory and safety functions across our vast state.
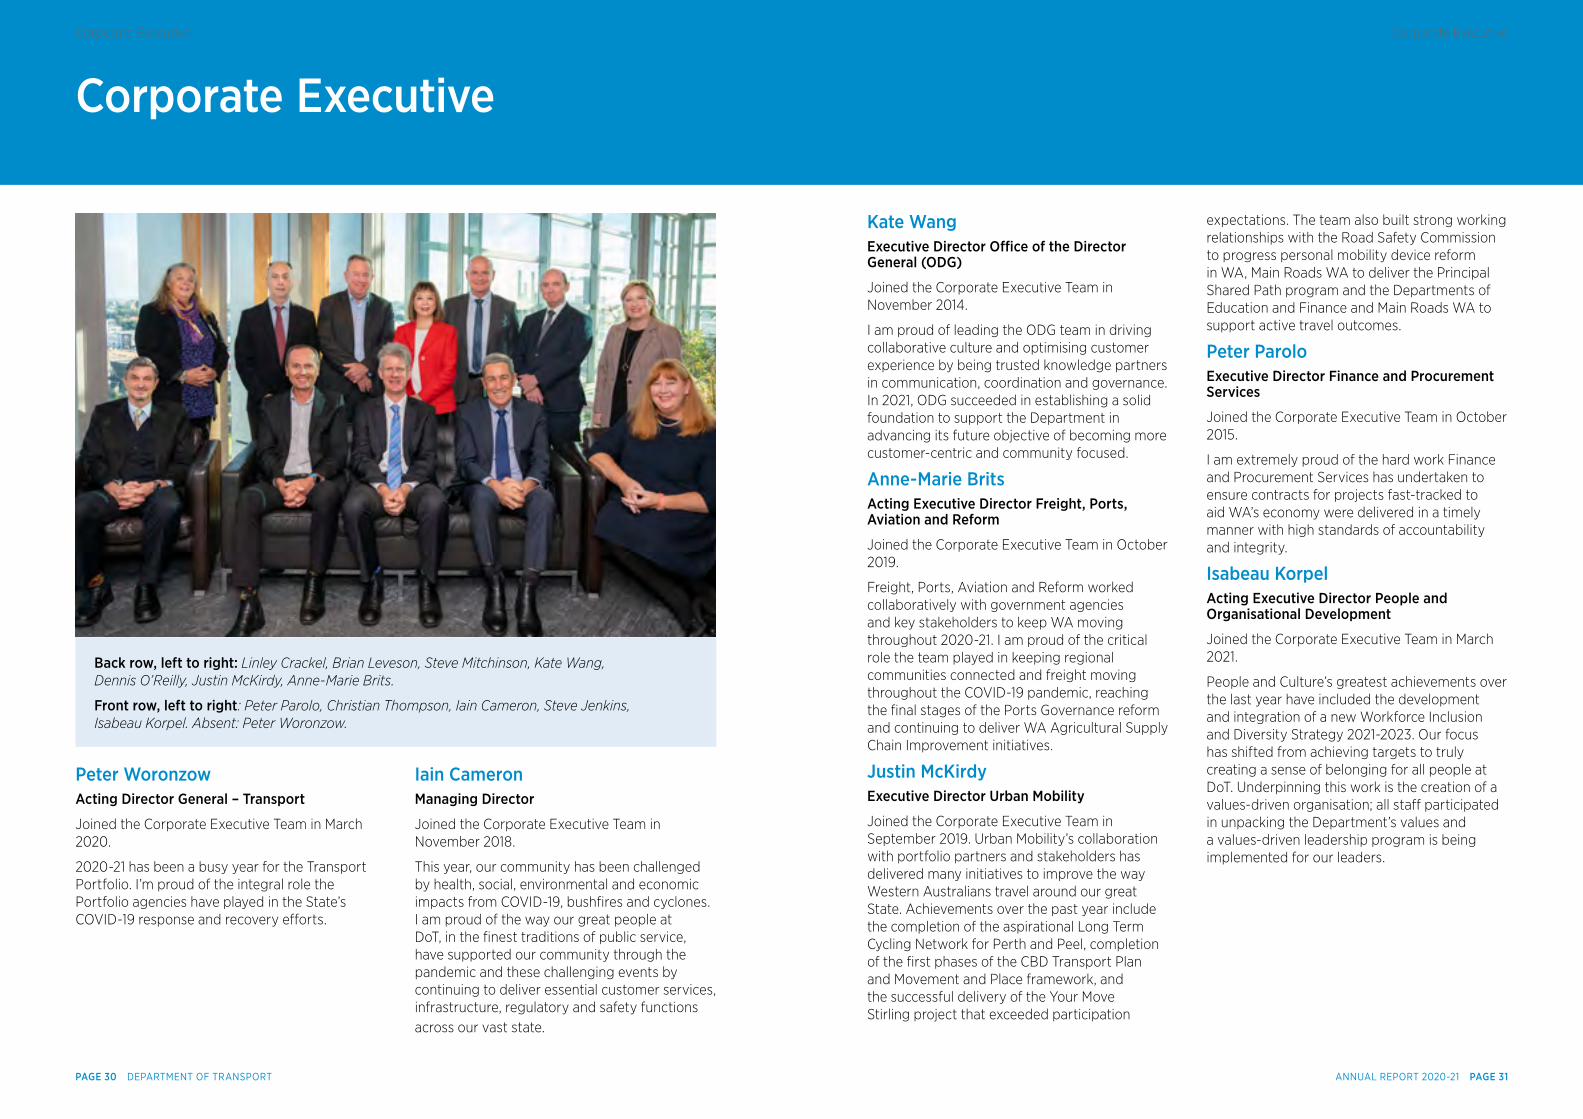
Back row, left to right: Linley Crackel, Brian Leveson, Steve Mitchinson, Kate Wang, Dennis O’Reilly, Justin McKirdy, Anne-Marie Brits.
Front row, left to right: Peter Parolo, Christian Thompson, Iain Cameron, Steve Jenkins, Isabeau Korpel. Absent: Peter Woronzow.
Kate Wang Executive Director Ofce of the Director General (ODG)
Joined the Corporate Executive Team in November 2014.
I am proud of leading the ODG team in driving collaborative culture and optimising customer experience by being trusted knowledge partners in communication, coordination and governance. In 2021, ODG succeeded in establishing a solid foundation to support the Department in advancing its future objective of becoming more customer-centric and community focused.
Anne-Marie BritsActing Executive Director Freight, Ports, Aviation and Reform
Joined the Corporate Executive Team in October 2019.
Freight, Ports, Aviation and Reform worked collaboratively with government agencies and key stakeholders to keep WA moving throughout 2020-21. I am proud of the critical role the team played in keeping regional communities connected and freight moving throughout the COVID-19 pandemic, reaching the final stages of the Ports Governance reform and continuing to deliver WA Agricultural Supply Chain Improvement initiatives.
Justin McKirdyExecutive Director Urban Mobility
Joined the Corporate Executive Team in September 2019. Urban Mobility’s collaboration with portfolio partners and stakeholders has delivered many initiatives to improve the way Western Australians travel around our great State. Achievements over the past year include the completion of the aspirational Long Term Cycling Network for Perth and Peel, completion of the first phases of the CBD Transport Plan and Movement and Place framework, and the successful delivery of the Your Move Stirling project that exceeded participation
expectations. The team also built strong working relationships with the Road Safety Commission to progress personal mobility device reform in WA, Main Roads WA to deliver the Principal Shared Path program and the Departments of Education and Finance and Main Roads WA to support active travel outcomes.
Peter Parolo Executive Director Finance and Procurement Services
Joined the Corporate Executive Team in October 2015.
I am extremely proud of the hard work Finance and Procurement Services has undertaken to ensure contracts for projects fast-tracked to aid WA’s economy were delivered in a timely manner with high standards of accountability and integrity.
Isabeau Korpel Acting Executive Director People and Organisational Development
Joined the Corporate Executive Team in March 2021.
People and Culture’s greatest achievements over the last year have included the development and integration of a new Workforce Inclusion and Diversity Strategy 2021-2023. Our focus has shifted from achieving targets to truly creating a sense of belonging for all people at DoT. Underpinning this work is the creation of a values-driven organisation; all staff participated in unpacking the Department’s values and a values-driven leadership program is being implemented for our leaders.
ANNUAL REPORT 2020-21 PAGE 31PAGE 30 DEPARTMENT OF TRANSPORT
Corporate ExecutiveCorporate Executive
Administered Legislation
Brian Leveson Legal and Legislative Services Director
Joined the Corporate Executive Team in November 2018.
The Legal and Legislative Services team delivered a number of key legislative projects over 2020-21, including legislation prohibiting wheel clamping. I am most proud of our team mentoring three Department officers, enabling them to gain much needed legal working experience before being admitted as solicitors and transitioning into our team.
Christian ThompsonExecutive Director Business Information Systems
Joined the Corporate Executive Team in March 2015.
I’m proud of how Business Information Systems played a key role in the successful rollout of the On-demand Transport (OdT) systems to solution to support the final phase of the OdT reform, and enabled the continued operation of the WA licensing system throughout the COVID-19 pandemic.
Steve Mitchinson Executive Director Driver and Vehicle Services
Joined the Corporate Executive Team in February 2017.
I am incredibly proud of the way the Driver and Vehicle Services team pulled together in 2020-21 to not only continue to deliver our core business through unprecedented times but to provide timely and accurate information to the WA community via the 13 COVID hotline. The agility and flexibility of our teams is an outstanding achievement within itself but through this time the team also continued to innovate and improve our services. Notably, Practical Driving Assessment availability was quickly restored to pre-COVID-19 levels, NDIS worker checks were added to our suite of services, Wheel Clamping legislation and the Concessions for Classics Scheme were successfully introduced.
Dennis O’ReillyExecutive Director Regional Services
Joined the Corporate Executive Team in July 2017.
It’s been a privilege to lead and support the Regional Services team through 2020-21. We’ve responded to the unprecedented growth in regional tourism and taken much needed transport and government services to remote Aboriginal communities throughout the COVID-19 pandemic. The first ServiceWA pilot site opened in October 2020, experiencing great success and high customer satisfaction ratings as the first one-stop shop for government services. Finally, after a number of years of planning, the Regional Services team assisted our Maritime colleagues with the move to agile based working at their new Fremantle office.
Linley CrackelActing Executive Director On-demand Transport
Joined the Corporate Executive Team in January 2021.
On-demand Transport’s greatest achievement by far over 2020-21 was the completion of the four-year on-demand transport industry reform, working closely with Driver and Vehicle Services to transition charter, bus and taxi drivers to the new Passenger Transport Driver authorisation as part of the final stage. The team also worked hard to develop and deliver a $9 million COVID-19 relief package to industry in record time.
Steve JenkinsExecutive Director Maritime
Joined the Corporate Executive Team in November 2018.
I am proud of leading a great team that has worked collaboratively to deliver government initiatives and business outcomes for our Maritime stakeholders.
On behalf of the Minister for Transport, DoT administers the following Acts:
Air Navigation Act 1937
Civil Aviation (Carriers’ Liability) Act 1961
Damage by Aircraft Act 1964
Harbours and Jetties Act 1928
Jetties Act 1926
Lights (Navigation Protection) Act 1938
Marine and Harbours Act 1981
Marine Navigational Aids Act 1973
Maritime Fees and Charges (Taxing) Act 1999
Motor Vehicle Drivers Instructors Act 1963
Owner-Drivers (Contracts and Disputes) Act 2007
Perth Parking Management Act 1999
Perth Parking Management (Consequential Provisions) Act 1999
Perth Parking Management (Taxing) Act 1999
Pilots’ Limitation of Liability Act 1962
Pollution of Waters by Oil and Noxious Substances Act 1987
Rail Safety National Law (WA) Act 2015
Road Traffic (Administration) Act 2008
Road Traffic (Authorisation to Drive) Act 2008
Road Traffic (Vehicles) Act 2012
Road Traffic (Vehicles) (Taxing) Act 2008
Sea-Carriage of Goods Act 1909
Shipping and Pilotage Act 1967
Trans-Continental Railway Act 1911
Transport Co-ordination Act 1966
Transport (Road Passenger Services) Act 2018
Western Australian Coastal Shipping Commission Act 1965
Western Australian Marine Act 1982
Western Australian Photo Card Act 2014
Wire and Wire Netting Act 1926
On behalf of the Minister for Ports, DoT administers the following Act:
Port Authorities Act 1999
Other legislation afecting the functions and operation of DoT include:
Criminal Code Act Compilation Act 1913
Disability Services Act 1993
Electronic Transactions Act 2011
Equal Opportunity Act 1984
Evidence Act 1906
Financial Management Act 2006
Freedom of Information Act 1992
Industrial Relations Act 1979
Interpretation Act 1984
Library Board of Western Australia Act 1951
Limitation Act 2005
Minimum Conditions of Employment Act 1993
Native Title Act 1993 (Commonwealth)
Occupational Safety and Health Act 1984
Public Sector Management Act 1994
Road Traffic Act 1974
Royal Commission (Custody of Records) Act 1992
State Records Act 2000
State Supply Commission Act 1991
State Trading Concerns Act 1916
Taxation Administration Act 2003
ANNUAL REPORT 2020-21 PAGE 33PAGE 32 DEPARTMENT OF TRANSPORT
Corporate Executive
Changes to the Outcome Based Management FrameworkDoT received approval for the following changes to be made to its outcome-based management framework for 2020-21:
Wording and key effectiveness indicators of Outcome 2: Vehicles and road users that meet established vehicle standards, driver competencies and identity requirements to deliver safe vehicles, safe drivers and secure identities.
• The wording of Outcome 2 was amended to include “identity requirements and secure identities”. Under this outcome, DoT:
• discontinued “Percentage of driver’s licence cards issued within 21 days of completed application”; and
• introduced a new effectiveness KPI “Percentage of identity credentials compliant with the required standard of biometric quality”.
Outcome 3: An accessible and safe transport system
• Introduced a new effectiveness KPI “Percentage of audited authorised on-demand booking services compliant with safety requirements”.
Service 1: Strategic Transport Policy and Integrated Planning
• Discontinued “Average Cost Per Policy Hour for Strategic Policy Development” and “Average Cost Per Planning Hour for Integrated Transport Planning Development”; and
• Introduced a new efficiency KPI “Average cost per hour for Strategic Policy Development and Integrated Transport Planning”.
Service 3 ‘Coastal Infrastructure’ and Service 4 ‘Marine Safety’ were amalgamated to form a new Service 4 titled, ‘Maritime’ to reflect the merge of the Coastal Infrastructure and Marine Safety business units to form a single Maritime business unit.
Outcome Based Management FrameworkDoT contributes to the State Government’s Goals through the Outcome Based Management Framework as detailed below.
State Government Goals DoT Outcomes DoT Services
Future Jobs and Skills:Grow and diversify the economy, create jobs and support skills development.
Outcome 1Integrated transport systems that facilitate economic development.
Service 1 Strategic Transport Policy and Integrated Planning
Strong Communities:Safe communities and supported families.
Outcome 2 Vehicles and road users that meet established vehicle standards, driver competencies and identity requirements to deliver safe vehicles, safe drivers and secure identities.
Service 2 Driver and Vehicle Services
Better Places:A quality environment with liveable and affordable communities and vibrant regions.
Outcome 3 An accessible and safe transport system.
Service 3 Maritime
Service 4 On-demand Transport
ANNUAL REPORT 2020-21 PAGE 35PAGE 34 DEPARTMENT OF TRANSPORT
Outcome Based Management FrameworkOutcome Based Management Framework
Shared ResponsibilitiesUnifying government service delivery
A digital identity exchange for Western Australia is required to connect with the national identity exchange developed by the Federal government, allowing individuals and local businesses to access state and federal government services using a single sign-on. By aligning with the TDIF, the WA Digital Identity Ecosystem will become a trusted digital identity platform in WA and across Australia.
The WA Digital Identity Exchange supports State Government reforms with a focus on delivering convenient, smart and secure services through central coordination and cross-sector collaboration.
ServiceWA pilot opensServiceWA is a State Government initiative to streamline the delivery of more than 80 face-to-face services provided across five agencies; DoT, Department of Communities, Department of Primary Industries and Regional Development, Department of Justice and WA Police; into one single shopfront. In May 2018, funding was agreed upon to establish the first ServiceWA pilot site in Bunbury using the existing DoT Service Centre.
Jointly managed by the Department of Finance, DoT and the Office of Digital Government, DoT has led the physical delivery mode, while the Office of Digital Government led the online components. The centre was officially opened in October 2020 after the initial opening was delayed by COVID-19.
DoT developed core systems and infrastructure for the centre, as well as delivering training and a change management program for employees working at the new centre. This involved a refurbishment in 2019-20 of the Bunbury office to accommodate the increased volume and range of customers and transactions.
Customer and stakeholder feedback has endorsed the success of bringing services from multiple agencies together under one roof as part of a customer-centric design that best addresses citizen needs. Having satisfied customer needs, achieved suitable staffing levels and achieving customer satisfaction, the ServiceWA pilot centre has helped ascertain the level of investment needed to improve service integration and efficiency and demonstrated the viability to expand the centres to other sites across the state.
Achieving extremely high customer feedback scores, the trial has been extended to the end of the 2021-22 financial year. Evaluation will be conducted prior to the completion of the trial to determine if the model will be rolled out across the State to deliver convenient and efficient government services for all Western Australians.
Supporting the WA Climate Policy and related strategiesTo improve the sustainability of Western Australia’s transport system, DoT is collaborating with other public sector agencies to develop and deliver on a number of policies and strategies to support decarbonisation and the State’s response to climate change, including actions identified in the WA Climate Policy, the Electric Vehicle Strategy and the Renewable Hydrogen Strategy.
In support of the WA Climate Strategy, planning is underway for DoT and its Transport portfolio counterparts to transition their operations to net zero emissions by 2050. Collaboration with stakeholders and other state government departments is ongoing as the portfolio continues to strive for emission reduction in the transport sector.
DoT is actively supporting the delivery of the government’s transport and hydrogen goals outlined in the WA Renewable Hydrogen Strategy as a member of the WA Renewable Hydrogen working group and steering groups. The Department has facilitated conditional licences to enable a public trial of hydrogen fuel cell passenger vehicles, in addition to supporting policy development led by the Department of Jobs, Tourism, Science and Innovation.
Launched in October 2020, the WA Electric Vehicle Strategy aims to prepare WA for this rapidly developing area of transport technology. DoT supported the Department of Water and Environmental Regulation to develop the strategy and will continue to support its implementation and further development of state electric vehicle policy.
In February 2021 DoT began accepting applications for the National Disability Insurance Scheme (NDIS) Worker Screening Checks via its DoTDirect online platform and Transport Service Centres around the State. This additional service offering came following six months of planning and preparation between DoT and the Department of Communities.
The nationally consistent Worker Screening Checks, also known as NDIS Checks, aim to protect people with disability from experiencing harm or inadequate support and services. More than 10,000 applications have been processed at DoT Service Centres to date.
The joint initiative is at the forefront of State Government online service delivery, showcasing how cross-agency partnerships can benefit both agencies and the wider WA community through common platforms and cost-effective solutions. The levels of trust and collaboration demonstrated in delivering the initiative will enable further collaboration on other programs of work in the future.
Boosting the heavy vehicle transport industryWorking closely with Central Regional TAFE, Main Roads WA and Department of Training and Workforce Development, DoT has supported the State Government’s objective to create more employment pathways into the heavy vehicle transport industry through the development of heavy vehicle driver training and practical driving assessments.
An expanded Heavy Haulage Driving Operations Skills Set program, delivered by Central Regional TAFE, commenced in April 2021. The training, aimed at addressing driver shortages within the WA Road Transport industry, would see 500 new drivers trained for the road industry in Heavy Rigid (HR) licences and another 500 existing drivers upskilled from HR licences to Heavy Combination (HC) or Multi-Combination licences.
Playing both an active educative and regulatory role, DoT has worked with industry to ensure the understanding of relevant legislative and technical requirements needed to obtain a heavy vehicle driver’s licence as well as attracting people into the heavy vehicle transport industry.
Equipped with heavy vehicle qualifications and experience, DoT’s compliance staff monitor industry-led training programs and conduct heavy vehicle practical driving assessments at the end of the training programs to maintain consistency. This has allowed industry to benchmark and fine-tune training programs with the aim to deliver successful licensing outcomes for participants.
WA Digital Identity Exchange progressesA key initiative of the State Government’s Digital Strategy for the Western Australian Government 2021-2025 is the creation of a whole-of-government trusted digital identity platform. The platform will create and manage digital identities for individuals, enabling safe and secure online access to government services.
DoT, in collaboration with other government agencies, is supporting the development of the State Government digital identity exchange system, which is closely aligned to the Australian Government’s Trusted Digital Identity Framework (TDIF). The Department is investigating the possibility for customers to opt-in to a digital identity platform by giving their consent for the exchange to use specified information from the driver and vehicle registry.
ANNUAL REPORT 2020-21 PAGE 37PAGE 36 DEPARTMENT OF TRANSPORT
Shared Responsibilities
Port Hedland Spoilbank Marina progressesDoT continued to progress components of the Port Hedland Spoilbank Marina project throughout 2020-21.
Working in collaboration with Pilbara Development Commission, Town of Port Hedland, Pilbara Ports Authority, DevelopmentWA and the Department of Treasury, the project will meet the recreational boating needs of the Port Hedland community and provide much-needed amenity for locals and tourists.
In October 2018, Cabinet endorsed a $94 million scope of works for the preferred concept design, which includes boat pens, boat launching facilities, two breakwaters and internal revetment walls, and an access channel separating the marina traffic from shipping activity. The concept also features new public open spaces and improved public access, parking, toilet facilities and areas for pop-up retail stalls.
In 2020-21 DoT obtained Commonwealth environmental approval for the project and Main Roads, on behalf of DoT, delivered Stage 1 works which included a haulage access route and other road improvements.
DoT will continue to provide advice to the Pilbara Ports Authority as it delivers the project.
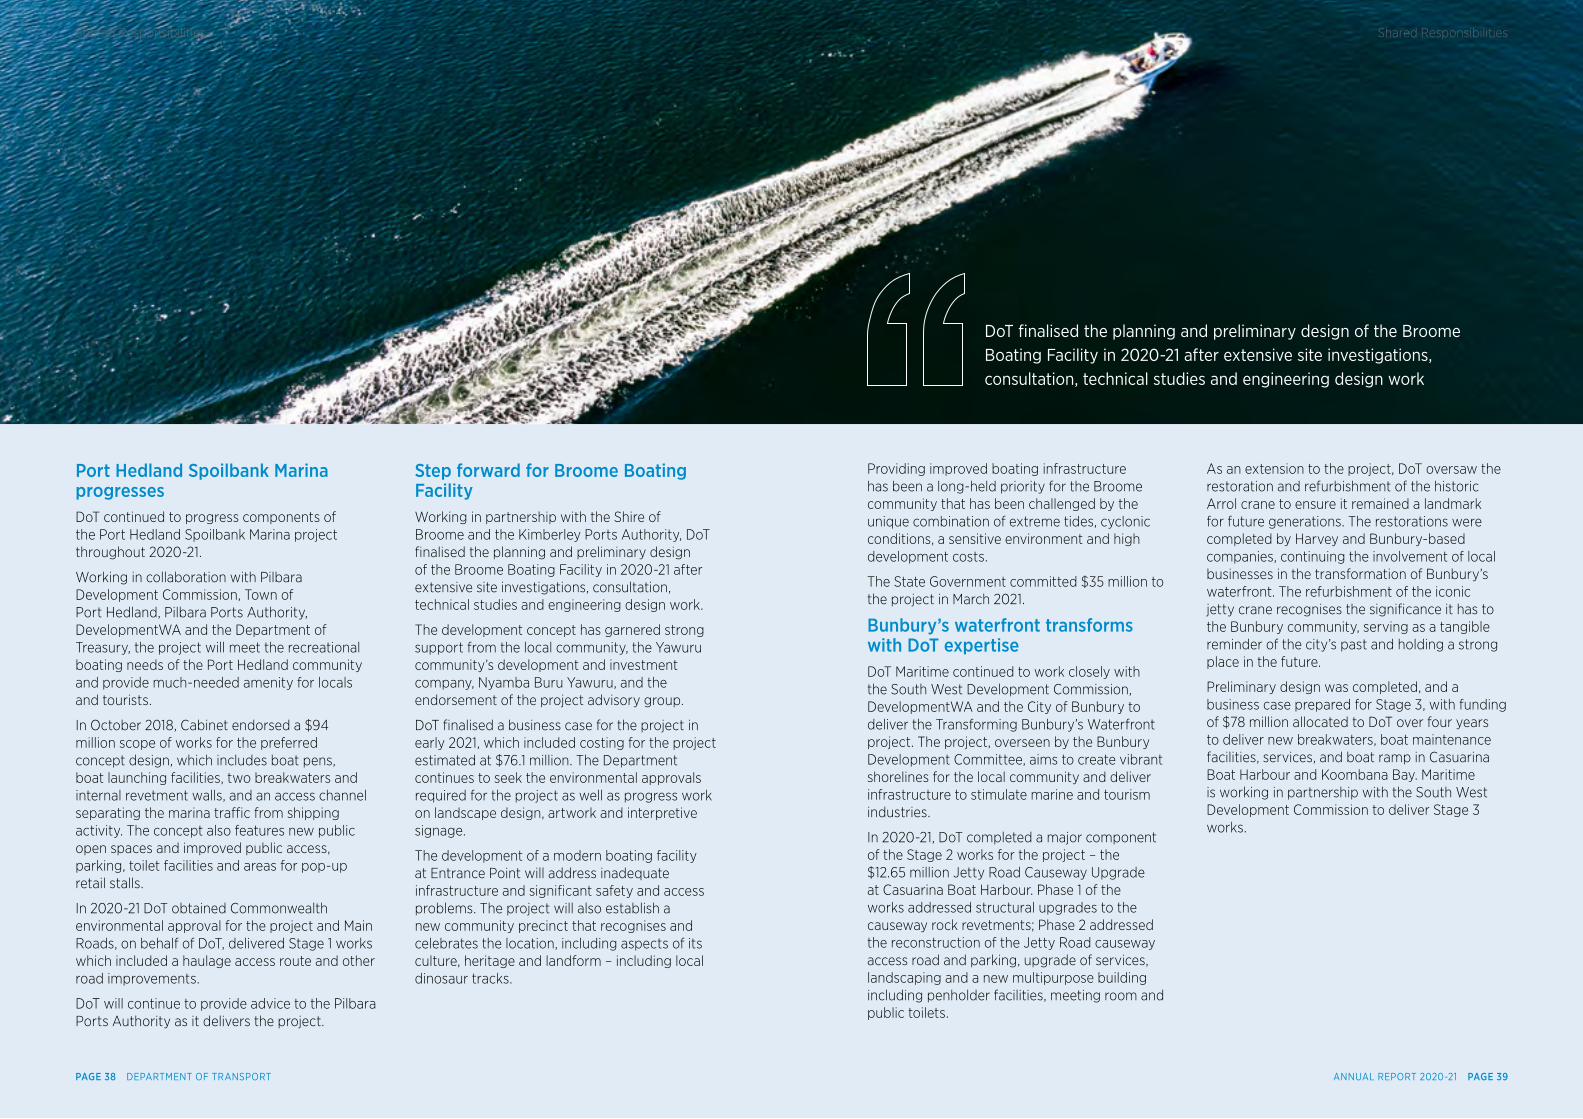
Step forward for Broome Boating FacilityWorking in partnership with the Shire of Broome and the Kimberley Ports Authority, DoT finalised the planning and preliminary design of the Broome Boating Facility in 2020-21 after extensive site investigations, consultation, technical studies and engineering design work.
The development concept has garnered strong support from the local community, the Yawuru community’s development and investment company, Nyamba Buru Yawuru, and the endorsement of the project advisory group.
DoT finalised a business case for the project in early 2021, which included costing for the project estimated at $76.1 million. The Department continues to seek the environmental approvals required for the project as well as progress work on landscape design, artwork and interpretive signage.
The development of a modern boating facility at Entrance Point will address inadequate infrastructure and significant safety and access problems. The project will also establish a new community precinct that recognises and celebrates the location, including aspects of its culture, heritage and landform – including local dinosaur tracks.
DoT finalised the planning and preliminary design of the Broome Boating Facility in 2020-21 after extensive site investigations, consultation, technical studies and engineering design work
Providing improved boating infrastructure has been a long-held priority for the Broome community that has been challenged by the unique combination of extreme tides, cyclonic conditions, a sensitive environment and high development costs.
The State Government committed $35 million to the project in March 2021.
Bunbury’s waterfront transforms with DoT expertiseDoT Maritime continued to work closely with the South West Development Commission, DevelopmentWA and the City of Bunbury to deliver the Transforming Bunbury’s Waterfront project. The project, overseen by the Bunbury Development Committee, aims to create vibrant shorelines for the local community and deliver infrastructure to stimulate marine and tourism industries.
In 2020-21, DoT completed a major component of the Stage 2 works for the project – the $12.65 million Jetty Road Causeway Upgrade at Casuarina Boat Harbour. Phase 1 of the works addressed structural upgrades to the causeway rock revetments; Phase 2 addressed the reconstruction of the Jetty Road causeway access road and parking, upgrade of services, landscaping and a new multipurpose building including penholder facilities, meeting room and public toilets.
As an extension to the project, DoT oversaw the restoration and refurbishment of the historic Arrol crane to ensure it remained a landmark for future generations. The restorations were completed by Harvey and Bunbury-based companies, continuing the involvement of local businesses in the transformation of Bunbury’s waterfront. The refurbishment of the iconic jetty crane recognises the significance it has to the Bunbury community, serving as a tangible reminder of the city’s past and holding a strong place in the future.
Preliminary design was completed, and a business case prepared for Stage 3, with funding of $78 million allocated to DoT over four years to deliver new breakwaters, boat maintenance facilities, services, and boat ramp in Casuarina Boat Harbour and Koombana Bay. Maritime is working in partnership with the South West Development Commission to deliver Stage 3 works.
ANNUAL REPORT 2020-21 PAGE 39PAGE 38 DEPARTMENT OF TRANSPORT
Shared ResponsibilitiesShared Responsibilities
Tantabiddi boating facilitiesPlanning for the development of the Tantabiddi Boat Ramp was expedited in 2020-21 with $1.3 million from the WA Recovery Plan.
The Tantabiddi Boat Ramp precinct is of regional significance as the gateway to tourism and recreational experiences at Ningaloo Reef. The ramp is on the west side of the North West Cape, at the mouth of Tantabiddi Creek, and is in high demand from commercial operators and recreational boat users.
High usage at peak times make operations at the facility unsafe, and the location can be impacted by rain and cyclones, which can result in a build-up of sand and restricted access for boat launching.
DoT chairs the Tantabiddi Boat Ramp Taskforce, which comprises representatives from the Shire of Exmouth and the Department of Biodiversity, Conservation and Attractions.
In 2020-21, DoT undertook the first phase of preliminary maritime planning, identifying a new location for the ramp and determining the necessary maritime infrastructure to address current issues. In addition, there has been consultation with the World Heritage Committee and the traditional owners regarding the potential relocation of the boat ramp and the type of facility to be developed.
Supporting a safe and efcient transport system in the Indian Ocean TerritoriesDoT continues to provide transport services to the Indian Ocean Territories (IOTs) under a service delivery arrangement between the Minister for Transport and the Commonwealth Government.
Through this agreement, effective until June 2024, the Department supports the delivery of a safe, efficient, effective and equitable transport system in the IOTs of Christmas Island and the Cocos (Keeling) Islands, with the costs of providing these services covered by the Commonwealth.
In 2020-21, DoT officers visited the IOTs to provide education and compliance training to Australian Federal Police. Officers also delivered and installed updated signage to reflect island specific safety equipment exemptions on Cocos Island as well as conducting education and compliance patrols.
DoT continues to meet regularly with Commonwealth Government officers to discuss operational matters and progress the delivery of an expanded range of transport services to the IOTs.
Positive steps towards Woodman Point Jetty replacementDuring 2020-21, DoT continued to lead a working group considering the future of Woodman Point Jetty.
Consisting of representatives from the Department of Biodiversity, Conservation and Attractions (DBCA), Fremantle Port Authority, City of Cockburn, and Recfishwest, the working group provides input towards the planning, approvals and stakeholder engagement components, while DoT delivers the project.
DoT was allocated $9.69 million to fund the replacement of the jetty as part of the State Government’s $5.5 billion WA Recovery Plan unveiled in August 2020. The project aims to preserve the popular Perth metropolitan swimming, snorkelling, scuba diving and fishing location as well as recognise the jetty’s significant heritage.
The site’s location is complex, with the land located within Woodman Point Regional Park; a Bush Forever site within the City of Cockburn; and the sea-side located on Crown Land. DoT has worked closely with DBCA and the Department of Planning, Lands and Heritage to obtain statutory approvals for the jetty replacement works.
DoT has engaged specialist marine and landscape planning consultants to progress the planning, consultation, and design phase of the project with key stakeholders to obtain their views on the jetty’s replacement. Development of concept options is underway with public consultation expected during the third quarter of 2021.
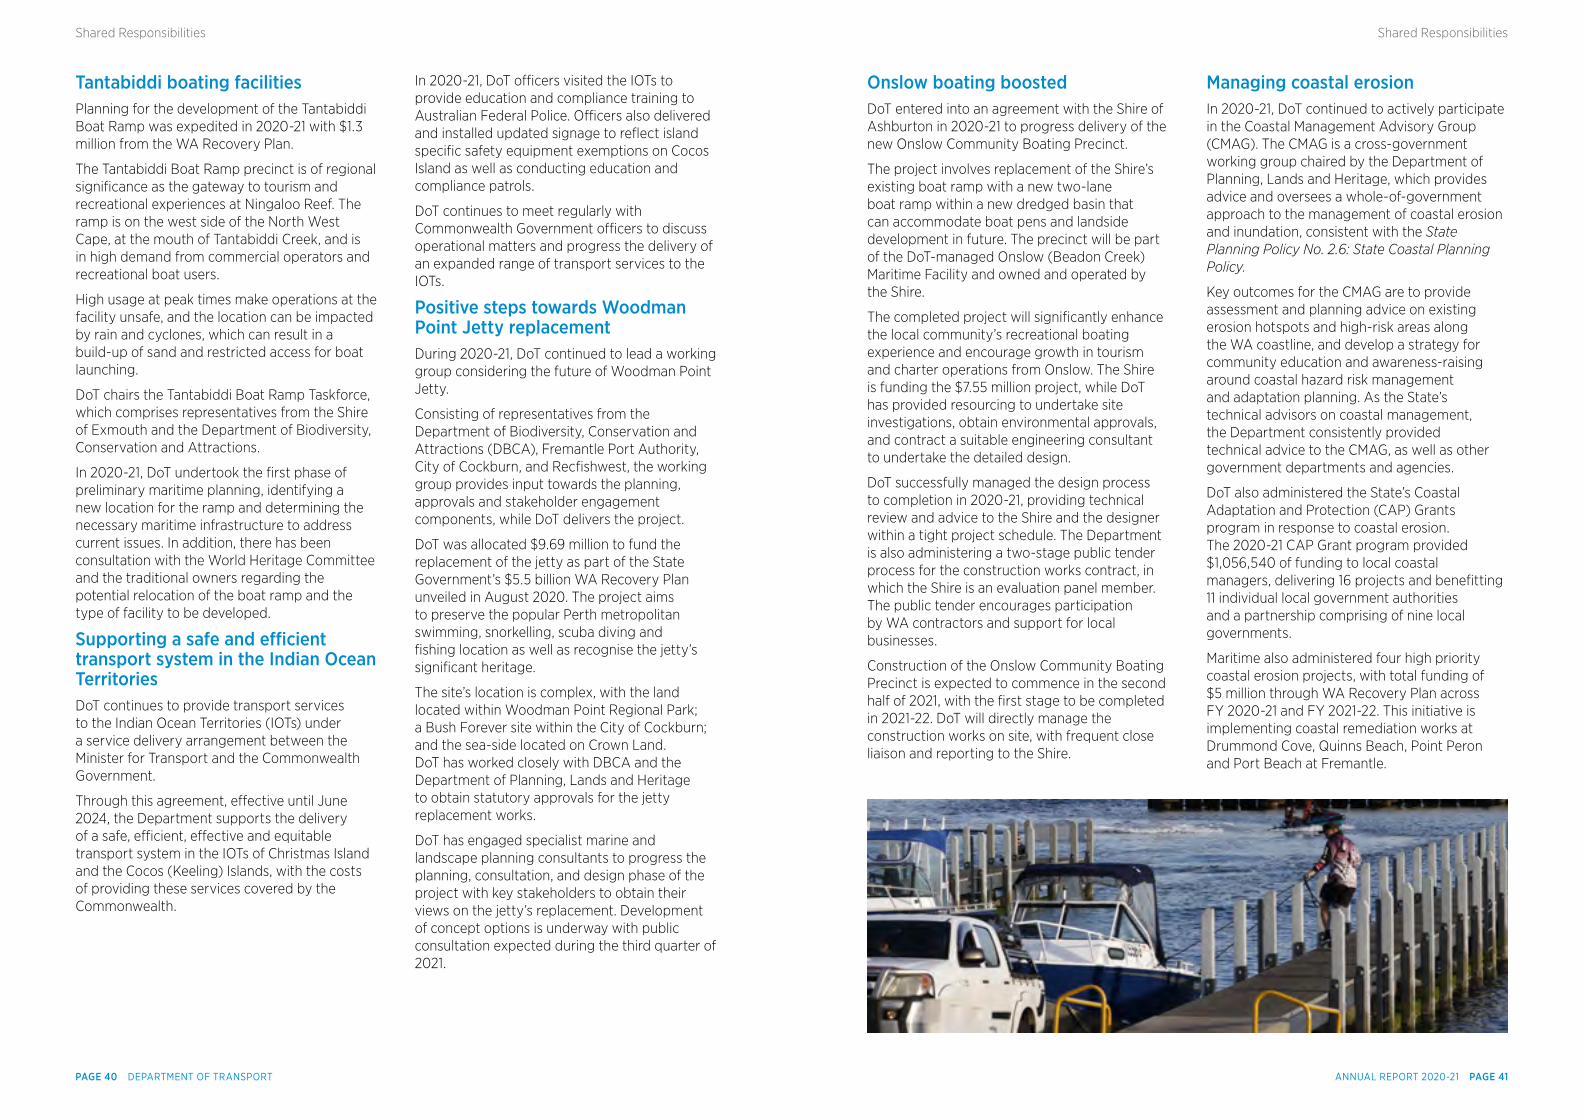
Onslow boating boostedDoT entered into an agreement with the Shire of Ashburton in 2020-21 to progress delivery of the new Onslow Community Boating Precinct.
The project involves replacement of the Shire’s existing boat ramp with a new two-lane boat ramp within a new dredged basin that can accommodate boat pens and landside development in future. The precinct will be part of the DoT-managed Onslow (Beadon Creek) Maritime Facility and owned and operated by the Shire.
The completed project will significantly enhance the local community’s recreational boating experience and encourage growth in tourism and charter operations from Onslow. The Shire is funding the $7.55 million project, while DoT has provided resourcing to undertake site investigations, obtain environmental approvals, and contract a suitable engineering consultant to undertake the detailed design.
DoT successfully managed the design process to completion in 2020-21, providing technical review and advice to the Shire and the designer within a tight project schedule. The Department is also administering a two-stage public tender process for the construction works contract, in which the Shire is an evaluation panel member. The public tender encourages participation by WA contractors and support for local businesses.
Construction of the Onslow Community Boating Precinct is expected to commence in the second half of 2021, with the first stage to be completed in 2021-22. DoT will directly manage the construction works on site, with frequent close liaison and reporting to the Shire.
Managing coastal erosionIn 2020-21, DoT continued to actively participate in the Coastal Management Advisory Group (CMAG). The CMAG is a cross-government working group chaired by the Department of Planning, Lands and Heritage, which provides advice and oversees a whole-of-government approach to the management of coastal erosion and inundation, consistent with the State Planning Policy No. 2.6: State Coastal Planning Policy.
Key outcomes for the CMAG are to provide assessment and planning advice on existing erosion hotspots and high-risk areas along the WA coastline, and develop a strategy for community education and awareness-raising around coastal hazard risk management and adaptation planning. As the State’s technical advisors on coastal management, the Department consistently provided technical advice to the CMAG, as well as other government departments and agencies.
DoT also administered the State’s Coastal Adaptation and Protection (CAP) Grants program in response to coastal erosion. The 2020-21 CAP Grant program provided $1,056,540 of funding to local coastal managers, delivering 16 projects and benefitting 11 individual local government authorities and a partnership comprising of nine local governments.
Maritime also administered four high priority coastal erosion projects, with total funding of $5 million through WA Recovery Plan across FY 2020-21 and FY 2021-22. This initiative is implementing coastal remediation works at Drummond Cove, Quinns Beach, Point Peron and Port Beach at Fremantle.
ANNUAL REPORT 2020-21 PAGE 41PAGE 40 DEPARTMENT OF TRANSPORT
Shared ResponsibilitiesShared Responsibilities
Efectively managing maritime environmental emergenciesDoT is the appointed Hazard Management Agency for maritime transport emergencies and marine oil pollution incidents (collectively referred to as maritime environmental emergencies) in WA under the State Emergency Management Act 2005.
In 2020-21, DoT continued to collaborate with many agencies to prepare responses to, and recover from, potential maritime environmental emergencies. Partner agencies included the Australian Maritime Safety Authority, local port authorities, the Department of Fire and Emergency Services, the Department of Biodiversity, Conservation and Attractions and petroleum titleholders.
DoT significantly progressed initiatives aimed at enhancing its readiness and capability to respond to a maritime environmental emergency. The Department acquired additional response equipment focused on monitoring and containing the movement of spilled oil in the marine environment, and further developed its capabilities to sustain and effectively coordinate larger scale responses to maritime environmental emergencies if and when they occur.
The Department also implemented new training contracts, stakeholder guidance notes, and interaction frameworks to ensure adequate and efficient preparedness for a maritime environmental emergency via consistent collaboration with key stakeholders.
Bridge clearance collaboration increases accessibilityWorking with Transport Portfolio partners, Main Roads WA and the Public Transport Authority, DoT’s Maritime and Urban Mobility business units delivered a guidance document on bridge clearances throughout the Swan Canning Riverpark. The document ensures all crossings are planned and developed to provide appropriate clearances into the future, increasing accessibility for recreational and commercial vessels while allowing for possible future expansion of the ferry network.
In February 2021, Maritime’s Asset Management team and Main Roads’ Bridge Structures team held the first of several workshops to collaborate on improving the maintenance practices of bridges and jetties.
A number of items from the first workshop have already been actioned, including DoT sharing details about pile inspection equipment that can sand/water blast the surface of the pile before undertaking an inspection, and an agreement to test the Department’s remote controlled underwater visual inspection unit on Main Roads’ sites.
West Pilbara PlanIn collaboration with the Ngarliyarndu Bindirri Aboriginal Corporation, Red Dirt Driving Academy and the Department of Justice – Sheriff’s office, DoT delivered its commitments to the West Pilbara plan by regularly taking its mobile services to the Roeburne community. As well as increasing access to licensing and registration services, by working collaboratively with the Department of Justice the mobile service offering has also helped address fines and enforcement issues in the community.
The purpose of the West Pilbara Plan was to:
• provide safe and suitable access to government services in the community, particularly as many residents are unable to travel to access government services;
• increase opportunities for drivers to be licensed and vehicles to be registered; and
• provide greater support to address outstanding fines and infringements.
With the project completed at 30 June 2020, DoT has committed to establishing an ongoing functional service for the Roebourne community and transitioned its project obligations to business as usual tasks for staff at the Karratha office. Visits will continue, based on community needs and demand.
DoT will transition to the soon-to-be-opened government services hub, along with other Pilbara government agencies.
ANNUAL REPORT 2020-21 PAGE 43PAGE 42 DEPARTMENT OF TRANSPORT
Shared ResponsibilitiesShared Responsibilities
Dampier Peninsula Working GroupThe Dampier Peninsula Working Group (DPWG) was established to address the challenges associated with sealing the Broome-Cape Leveque Road. In anticipation of increased traffic and recreational boating activity along the peninsula, DoT investigated ways to improve driver, vehicle and marine safety for communities located along the Dampier Peninsula.
With the upgrade now complete, DoT joined forces with the Road Safety Commission to take a one-stop transport safety shop to four remote communities along the peninsula. Between 23 to 25 March 2021, pop-up events were held at Ardyaloon (One Arm Point), Djarindjin, Lombadina and Beagle Bay.
In addition to the usual Transport vehicle and licensing services provided on a Remote Services community visit, the team delivered free vehicle checks, child car restraint fitting and checking, marine safety education and awareness sessions, lifejacket clinics, and information about on-demand transport and maritime commercial opportunities. The Road Safety Commission also donated several child car seats to each community to promote awareness and use.
Providing shared infrastructure services Following the split of the former Department of Planning and Infrastructure in 2009, the Department of Transport (DoT) and Department of Planning were formed and entered into a service level agreement (SLA) to support the service delivery models of both agencies.
The agreement was extended in December 2020 for a further twelve-month period, with a possible further six-month option. The extension enables the Department of Planning, now the Department of Planning, Lands and Heritage (DPLH), to maintain operations while they continue to explore options for their future service delivery model.
DoT has continued to maintain a shared Information Communications and Technology infrastructure service through the SLA, supporting economies of scale and cost neutrality for the wider State Government. Under the agreement, DoT has provided operational support and project delivery for DPLH’s systems, including maintenance of software, hardware, disaster recovery plans and system security.
The extension has allowed DPLH to progress their systems rationalisation, potentially reducing the number of services delivered by DoT and eventually separating the two departments in future.
Championing the GovNext initiativeIn order to deliver effective services to the Western Australian community as a cohesive, interconnected public sector, DoT’s Business Information Systems unit worked hard to align the Department’s Information and Communications Technology (ICT) Strategy with the State Government’s overarching Digital WA Strategy and integrate with the GovNext-ICT initiative.
As a whole-of-government approach to ICT Infrastructure, the purpose of GovNext-ICT was to consolidate the services and ownership of ICT infrastructure belonging to individual agencies into a modern, secure, flexible and cost-effective infrastructure-as-a-service platform over 2018-20.
DoT and eight of the largest state government agencies were selected to champion the initiative, integrating information technology structure and systems with the GovNext platform by:
• co-locating data centres and service rooms;
• migrating on-premise systems to cloud services; and
• creating a data and communications network that connects government workers across Western Australia.
Twenty projects were identified by DoT in 2018 to assist with the transition to the new platform. Fifteen projects were completed by the end of the 2019-20 period. Despite the impacts of COVID-19 on program resources and delaying progress, the remaining projects were successfully completed in November 2020.
The infrastructure component of the GovNext-ICT program formally closed in June 2021. A cloud transition program has been proposed to expand the use of cloud services of DoT infrastructure and applications over the next three to four years. A detailed infrastructure services roadmap, developed in 2019-20, will remain integral to the program’s development in its aim for DoT’s systems to become cloud-based by 2024.
A cloud transition program has been proposed to expand the use of cloud services of DoT infrastructure and applications over the next three to four years.
ANNUAL REPORT 2020-21 PAGE 45PAGE 44 DEPARTMENT OF TRANSPORT
Shared ResponsibilitiesShared Responsibilities
Agency Performance
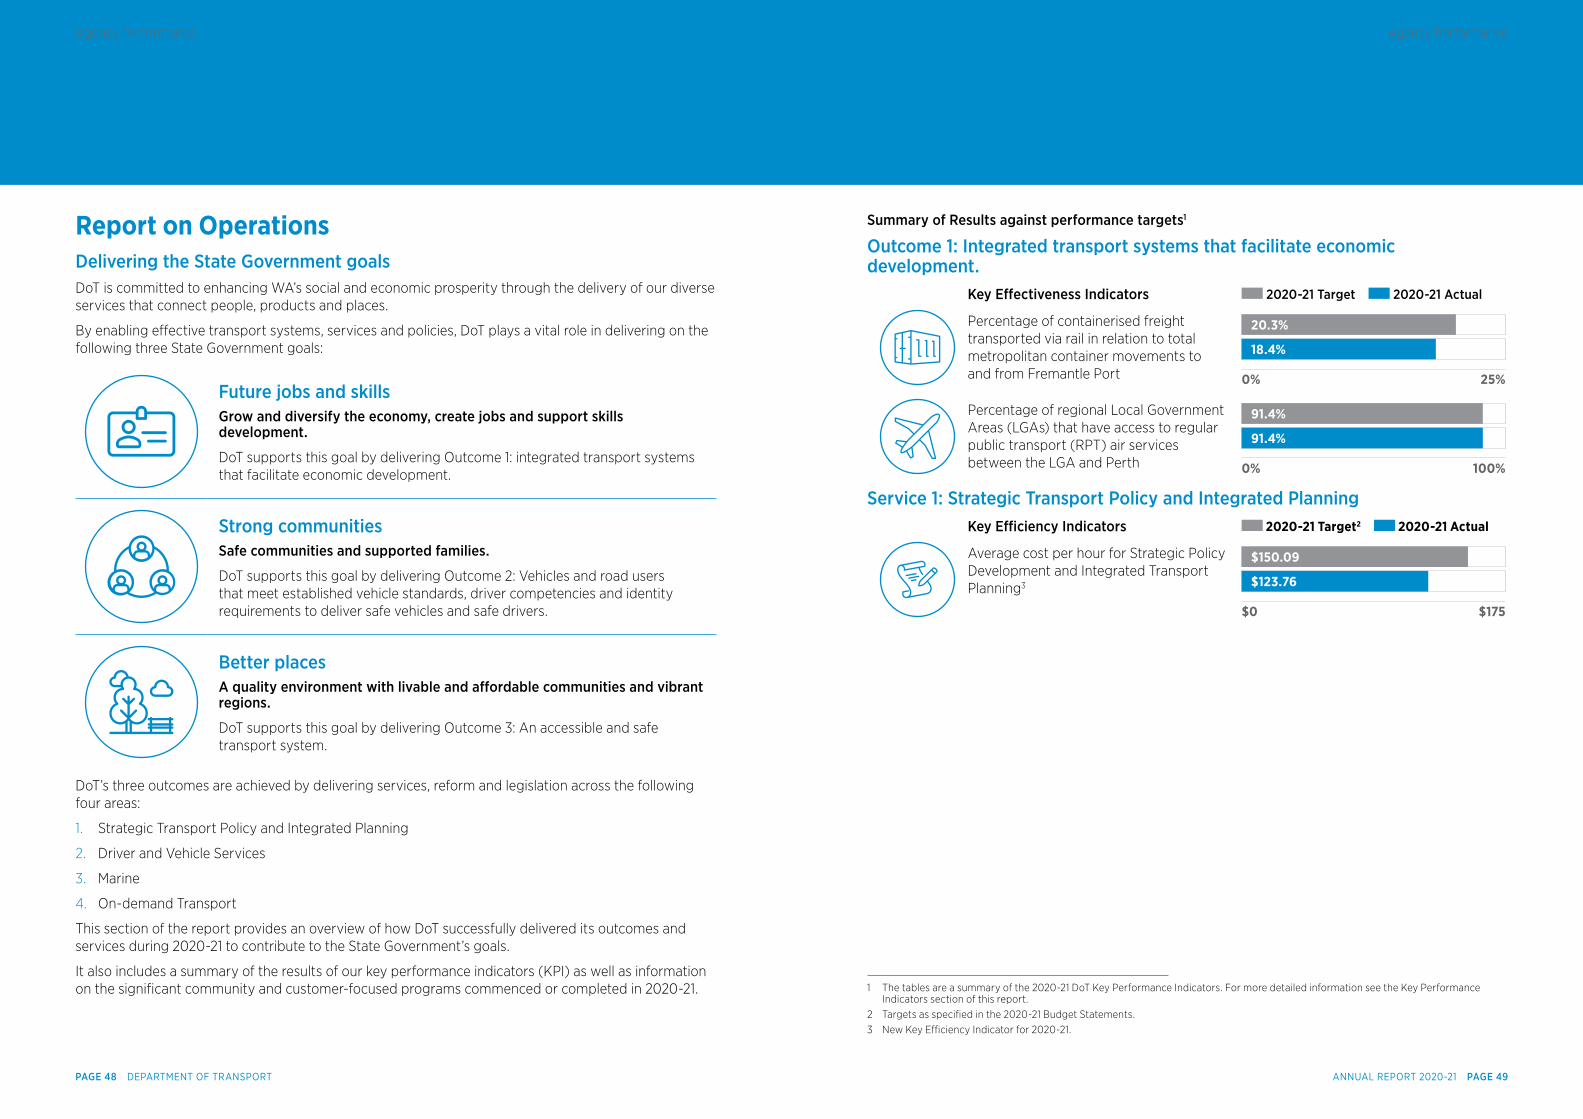
Summary of Results against performance targets1
Outcome 1: Integrated transport systems that facilitate economic development.
Key Efectiveness Indicators 2020-21 Target 2020-21 Actual
Percentage of containerised freight transported via rail in relation to total metropolitan container movements to and from Fremantle Port 25%0%
20.3%
18.4%
Percentage of regional Local Government Areas (LGAs) that have access to regular public transport (RPT) air services between the LGA and Perth 100%0%
91.4%
91.4%
Service 1: Strategic Transport Policy and Integrated PlanningKey Efciency Indicators 2020-21 Target2 2020-21 Actual
Average cost per hour for Strategic Policy Development and Integrated Transport Planning3
$175$0
$150.09
$123.76
1 The tables are a summary of the 2020-21 DoT Key Performance Indicators. For more detailed information see the Key Performance Indicators section of this report.
2 Targets as specified in the 2020-21 Budget Statements.3 New Key Efficiency Indicator for 2020-21.
Report on OperationsDelivering the State Government goalsDoT is committed to enhancing WA’s social and economic prosperity through the delivery of our diverse services that connect people, products and places.
By enabling effective transport systems, services and policies, DoT plays a vital role in delivering on the following three State Government goals:
Future jobs and skillsGrow and diversify the economy, create jobs and support skills development.
DoT supports this goal by delivering Outcome 1: integrated transport systems that facilitate economic development.
Strong communitiesSafe communities and supported families.
DoT supports this goal by delivering Outcome 2: Vehicles and road users that meet established vehicle standards, driver competencies and identity requirements to deliver safe vehicles and safe drivers.
Better placesA quality environment with livable and afordable communities and vibrant regions.
DoT supports this goal by delivering Outcome 3: An accessible and safe transport system.
DoT’s three outcomes are achieved by delivering services, reform and legislation across the following four areas:
1. Strategic Transport Policy and Integrated Planning
2. Driver and Vehicle Services
3. Marine
4. On-demand Transport
This section of the report provides an overview of how DoT successfully delivered its outcomes and services during 2020-21 to contribute to the State Government’s goals.
It also includes a summary of the results of our key performance indicators (KPI) as well as information on the significant community and customer-focused programs commenced or completed in 2020-21.
ANNUAL REPORT 2020-21 PAGE 49PAGE 48 DEPARTMENT OF TRANSPORT
Agency PerformanceAgency Performance
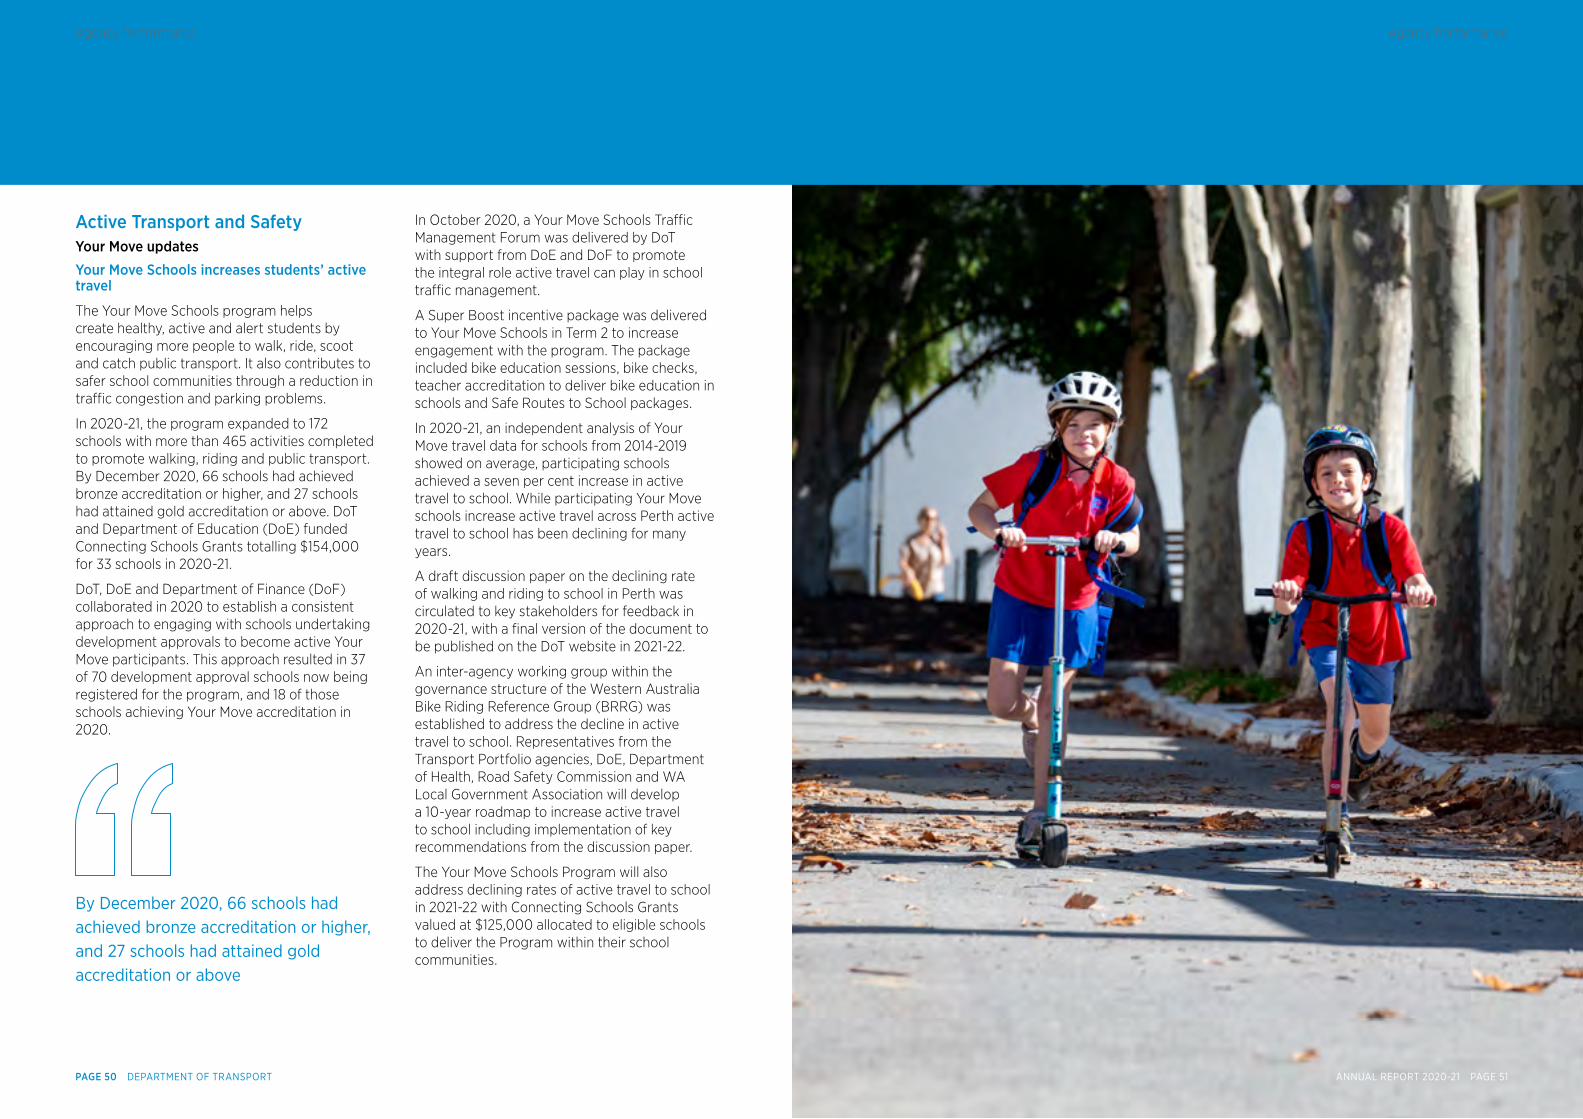
Active Transport and SafetyYour Move updates
Your Move Schools increases students’ active travel
The Your Move Schools program helps create healthy, active and alert students by encouraging more people to walk, ride, scoot and catch public transport. It also contributes to safer school communities through a reduction in traffic congestion and parking problems.
In 2020-21, the program expanded to 172 schools with more than 465 activities completed to promote walking, riding and public transport. By December 2020, 66 schools had achieved bronze accreditation or higher, and 27 schools had attained gold accreditation or above. DoT and Department of Education (DoE) funded Connecting Schools Grants totalling $154,000 for 33 schools in 2020-21.
DoT, DoE and Department of Finance (DoF) collaborated in 2020 to establish a consistent approach to engaging with schools undertaking development approvals to become active Your Move participants. This approach resulted in 37 of 70 development approval schools now being registered for the program, and 18 of those schools achieving Your Move accreditation in 2020.
In October 2020, a Your Move Schools Traffic Management Forum was delivered by DoT with support from DoE and DoF to promote the integral role active travel can play in school traffic management.
A Super Boost incentive package was delivered to Your Move Schools in Term 2 to increase engagement with the program. The package included bike education sessions, bike checks, teacher accreditation to deliver bike education in schools and Safe Routes to School packages.
In 2020-21, an independent analysis of Your Move travel data for schools from 2014-2019 showed on average, participating schools achieved a seven per cent increase in active travel to school. While participating Your Move schools increase active travel across Perth active travel to school has been declining for many years.
A draft discussion paper on the declining rate of walking and riding to school in Perth was circulated to key stakeholders for feedback in 2020-21, with a final version of the document to be published on the DoT website in 2021-22.
An inter-agency working group within the governance structure of the Western Australia Bike Riding Reference Group (BRRG) was established to address the decline in active travel to school. Representatives from the Transport Portfolio agencies, DoE, Department of Health, Road Safety Commission and WA Local Government Association will develop a 10-year roadmap to increase active travel to school including implementation of key recommendations from the discussion paper.
The Your Move Schools Program will also address declining rates of active travel to school in 2021-22 with Connecting Schools Grants valued at $125,000 allocated to eligible schools to deliver the Program within their school communities.
By December 2020, 66 schools had achieved bronze accreditation or higher, and 27 schools had attained gold accreditation or above
ANNUAL REPORT 2020-21 PAGE 51PAGE 50 DEPARTMENT OF TRANSPORT
Agency PerformanceAgency Performance
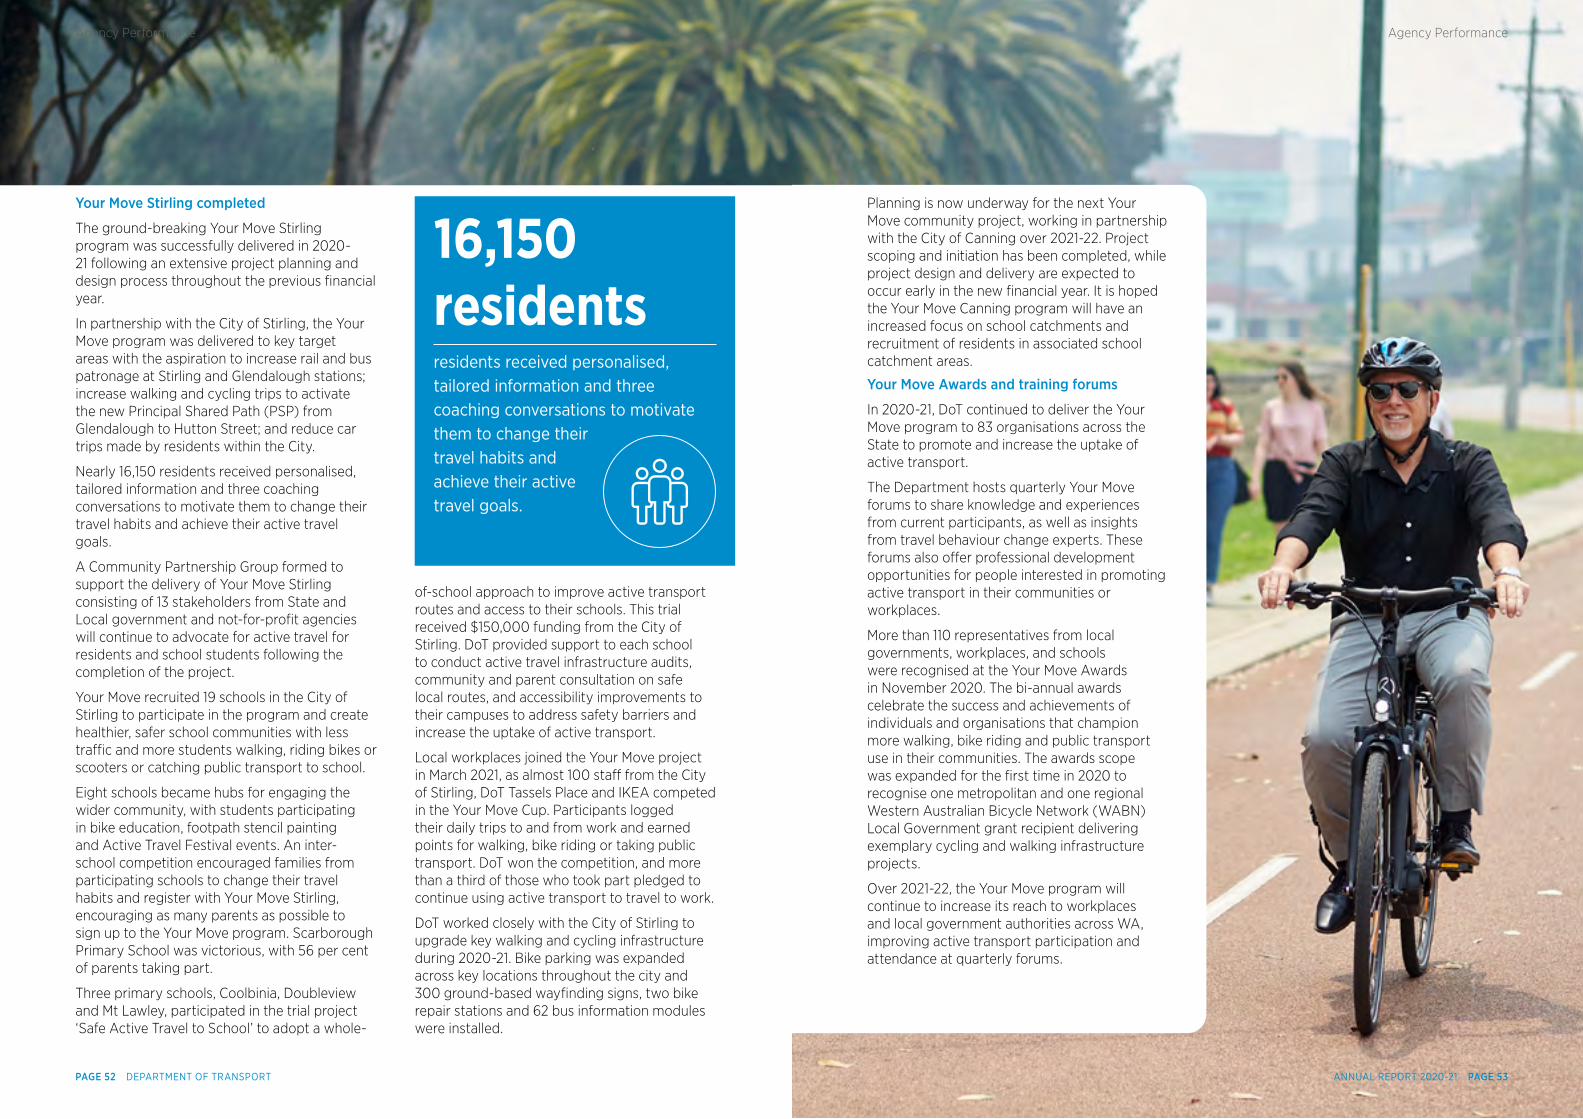
Your Move Stirling completed
The ground-breaking Your Move Stirling program was successfully delivered in 2020-21 following an extensive project planning and design process throughout the previous financial year.
In partnership with the City of Stirling, the Your Move program was delivered to key target areas with the aspiration to increase rail and bus patronage at Stirling and Glendalough stations; increase walking and cycling trips to activate the new Principal Shared Path (PSP) from Glendalough to Hutton Street; and reduce car trips made by residents within the City.
Nearly 16,150 residents received personalised, tailored information and three coaching conversations to motivate them to change their travel habits and achieve their active travel goals.
A Community Partnership Group formed to support the delivery of Your Move Stirling consisting of 13 stakeholders from State and Local government and not-for-profit agencies will continue to advocate for active travel for residents and school students following the completion of the project.
Your Move recruited 19 schools in the City of Stirling to participate in the program and create healthier, safer school communities with less traffic and more students walking, riding bikes or scooters or catching public transport to school.
Eight schools became hubs for engaging the wider community, with students participating in bike education, footpath stencil painting and Active Travel Festival events. An inter-school competition encouraged families from participating schools to change their travel habits and register with Your Move Stirling, encouraging as many parents as possible to sign up to the Your Move program. Scarborough Primary School was victorious, with 56 per cent of parents taking part.
Three primary schools, Coolbinia, Doubleview and Mt Lawley, participated in the trial project ‘Safe Active Travel to School’ to adopt a whole-
of-school approach to improve active transport routes and access to their schools. This trial received $150,000 funding from the City of Stirling. DoT provided support to each school to conduct active travel infrastructure audits, community and parent consultation on safe local routes, and accessibility improvements to their campuses to address safety barriers and increase the uptake of active transport.
Local workplaces joined the Your Move project in March 2021, as almost 100 staff from the City of Stirling, DoT Tassels Place and IKEA competed in the Your Move Cup. Participants logged their daily trips to and from work and earned points for walking, bike riding or taking public transport. DoT won the competition, and more than a third of those who took part pledged to continue using active transport to travel to work.
DoT worked closely with the City of Stirling to upgrade key walking and cycling infrastructure during 2020-21. Bike parking was expanded across key locations throughout the city and 300 ground-based wayfinding signs, two bike repair stations and 62 bus information modules were installed.
16,150 residentsresidents received personalised, tailored information and three coaching conversations to motivate them to change their travel habits and achieve their active travel goals.
Planning is now underway for the next Your Move community project, working in partnership with the City of Canning over 2021-22. Project scoping and initiation has been completed, while project design and delivery are expected to occur early in the new financial year. It is hoped the Your Move Canning program will have an increased focus on school catchments and recruitment of residents in associated school catchment areas.
Your Move Awards and training forums
In 2020-21, DoT continued to deliver the Your Move program to 83 organisations across the State to promote and increase the uptake of active transport.
The Department hosts quarterly Your Move forums to share knowledge and experiences from current participants, as well as insights from travel behaviour change experts. These forums also offer professional development opportunities for people interested in promoting active transport in their communities or workplaces.
More than 110 representatives from local governments, workplaces, and schools were recognised at the Your Move Awards in November 2020. The bi-annual awards celebrate the success and achievements of individuals and organisations that champion more walking, bike riding and public transport use in their communities. The awards scope was expanded for the first time in 2020 to recognise one metropolitan and one regional Western Australian Bicycle Network (WABN) Local Government grant recipient delivering exemplary cycling and walking infrastructure projects.
Over 2021-22, the Your Move program will continue to increase its reach to workplaces and local government authorities across WA, improving active transport participation and attendance at quarterly forums.
ANNUAL REPORT 2020-21 PAGE 53PAGE 52 DEPARTMENT OF TRANSPORT
Agency PerformanceAgency Performance
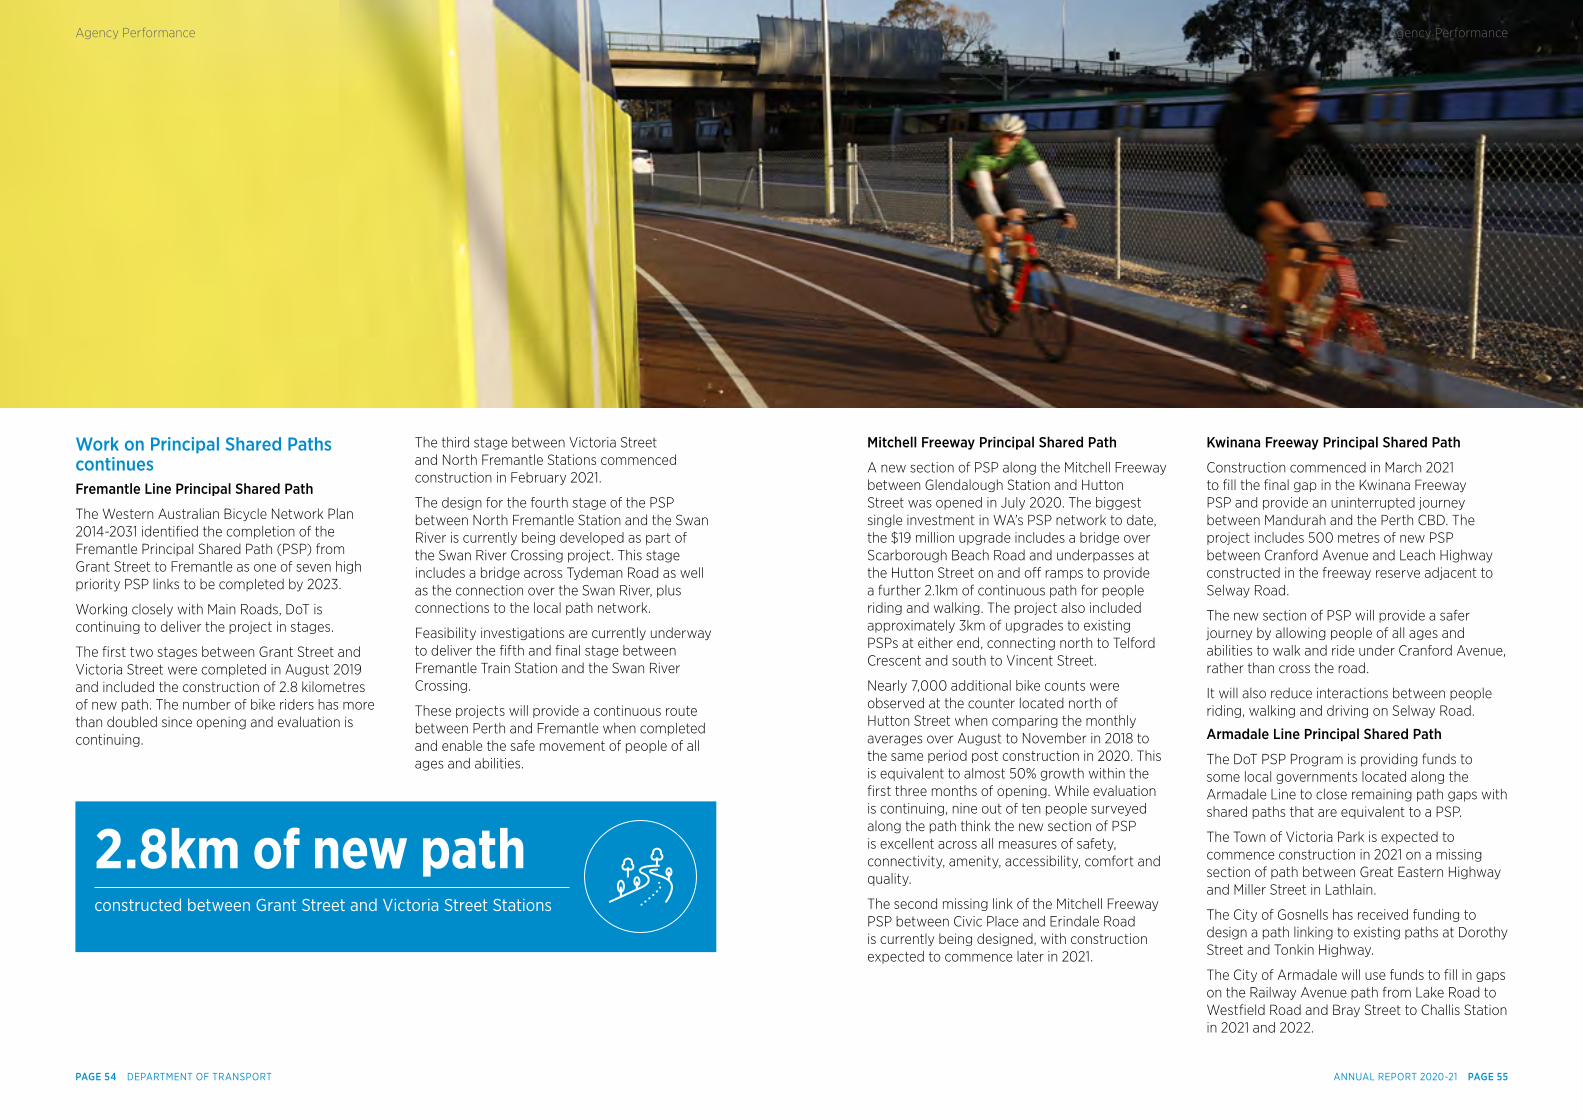
Work on Principal Shared Paths continuesFremantle Line Principal Shared Path
The Western Australian Bicycle Network Plan 2014-2031 identified the completion of the Fremantle Principal Shared Path (PSP) from Grant Street to Fremantle as one of seven high priority PSP links to be completed by 2023.
Working closely with Main Roads, DoT is continuing to deliver the project in stages.
The first two stages between Grant Street and Victoria Street were completed in August 2019 and included the construction of 2.8 kilometres of new path. The number of bike riders has more than doubled since opening and evaluation is continuing.
Mitchell Freeway Principal Shared Path
A new section of PSP along the Mitchell Freeway between Glendalough Station and Hutton Street was opened in July 2020. The biggest single investment in WA’s PSP network to date, the $19 million upgrade includes a bridge over Scarborough Beach Road and underpasses at the Hutton Street on and off ramps to provide a further 2.1km of continuous path for people riding and walking. The project also included approximately 3km of upgrades to existing PSPs at either end, connecting north to Telford Crescent and south to Vincent Street.
Nearly 7,000 additional bike counts were observed at the counter located north of Hutton Street when comparing the monthly averages over August to November in 2018 to the same period post construction in 2020. This is equivalent to almost 50% growth within the first three months of opening. While evaluation is continuing, nine out of ten people surveyed along the path think the new section of PSP is excellent across all measures of safety, connectivity, amenity, accessibility, comfort and quality.
The second missing link of the Mitchell Freeway PSP between Civic Place and Erindale Road is currently being designed, with construction expected to commence later in 2021.
2.8km of new pathconstructed between Grant Street and Victoria Street Stations
The third stage between Victoria Street and North Fremantle Stations commenced construction in February 2021.
The design for the fourth stage of the PSP between North Fremantle Station and the Swan River is currently being developed as part of the Swan River Crossing project. This stage includes a bridge across Tydeman Road as well as the connection over the Swan River, plus connections to the local path network.
Feasibility investigations are currently underway to deliver the fifth and final stage between Fremantle Train Station and the Swan River Crossing.
These projects will provide a continuous route between Perth and Fremantle when completed and enable the safe movement of people of all ages and abilities.
Kwinana Freeway Principal Shared Path
Construction commenced in March 2021 to fill the final gap in the Kwinana Freeway PSP and provide an uninterrupted journey between Mandurah and the Perth CBD. The project includes 500 metres of new PSP between Cranford Avenue and Leach Highway constructed in the freeway reserve adjacent to Selway Road.
The new section of PSP will provide a safer journey by allowing people of all ages and abilities to walk and ride under Cranford Avenue, rather than cross the road.
It will also reduce interactions between people riding, walking and driving on Selway Road.
Armadale Line Principal Shared Path
The DoT PSP Program is providing funds to some local governments located along the Armadale Line to close remaining path gaps with shared paths that are equivalent to a PSP.
The Town of Victoria Park is expected to commence construction in 2021 on a missing section of path between Great Eastern Highway and Miller Street in Lathlain.
The City of Gosnells has received funding to design a path linking to existing paths at Dorothy Street and Tonkin Highway.
The City of Armadale will use funds to fill in gaps on the Railway Avenue path from Lake Road to Westfield Road and Bray Street to Challis Station in 2021 and 2022.
ANNUAL REPORT 2020-21 PAGE 55PAGE 54 DEPARTMENT OF TRANSPORT
Agency PerformanceAgency Performance
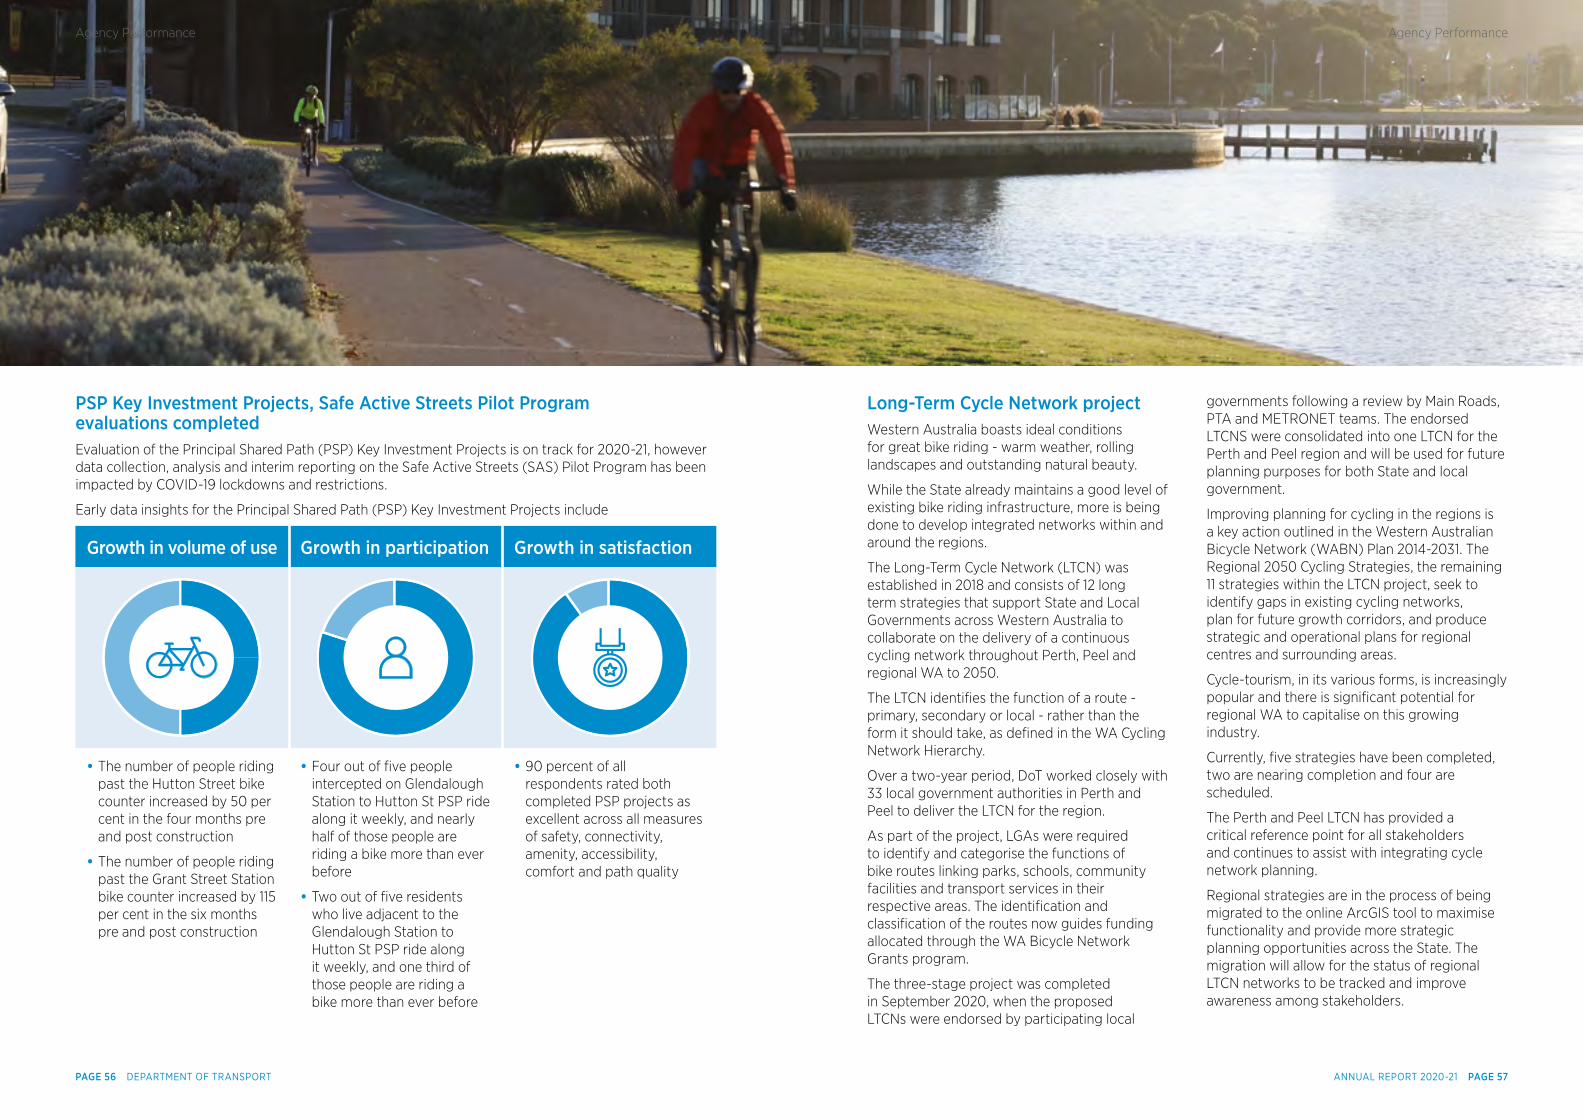
PSP Key Investment Projects, Safe Active Streets Pilot Program evaluations completedEvaluation of the Principal Shared Path (PSP) Key Investment Projects is on track for 2020-21, however data collection, analysis and interim reporting on the Safe Active Streets (SAS) Pilot Program has been impacted by COVID-19 lockdowns and restrictions.
Early data insights for the Principal Shared Path (PSP) Key Investment Projects include
Growth in volume of use Growth in participation Growth in satisfaction
• The number of people riding past the Hutton Street bike counter increased by 50 per cent in the four months pre and post construction
• The number of people riding past the Grant Street Station bike counter increased by 115 per cent in the six months pre and post construction
• Four out of five people intercepted on Glendalough Station to Hutton St PSP ride along it weekly, and nearly half of those people are riding a bike more than ever before
• Two out of five residents who live adjacent to the Glendalough Station to Hutton St PSP ride along it weekly, and one third of those people are riding a bike more than ever before
• 90 percent of all respondents rated both completed PSP projects as excellent across all measures of safety, connectivity, amenity, accessibility, comfort and path quality
Long-Term Cycle Network projectWestern Australia boasts ideal conditions for great bike riding - warm weather, rolling landscapes and outstanding natural beauty.
While the State already maintains a good level of existing bike riding infrastructure, more is being done to develop integrated networks within and around the regions.
The Long-Term Cycle Network (LTCN) was established in 2018 and consists of 12 long term strategies that support State and Local Governments across Western Australia to collaborate on the delivery of a continuous cycling network throughout Perth, Peel and regional WA to 2050.
The LTCN identifies the function of a route - primary, secondary or local - rather than the form it should take, as defined in the WA Cycling Network Hierarchy.
Over a two-year period, DoT worked closely with 33 local government authorities in Perth and Peel to deliver the LTCN for the region.
As part of the project, LGAs were required to identify and categorise the functions of bike routes linking parks, schools, community facilities and transport services in their respective areas. The identification and classification of the routes now guides funding allocated through the WA Bicycle Network Grants program.
The three-stage project was completed in September 2020, when the proposed LTCNs were endorsed by participating local
governments following a review by Main Roads, PTA and METRONET teams. The endorsed LTCNS were consolidated into one LTCN for the Perth and Peel region and will be used for future planning purposes for both State and local government.
Improving planning for cycling in the regions is a key action outlined in the Western Australian Bicycle Network (WABN) Plan 2014-2031. The Regional 2050 Cycling Strategies, the remaining 11 strategies within the LTCN project, seek to identify gaps in existing cycling networks, plan for future growth corridors, and produce strategic and operational plans for regional centres and surrounding areas.
Cycle-tourism, in its various forms, is increasingly popular and there is significant potential for regional WA to capitalise on this growing industry.
Currently, five strategies have been completed, two are nearing completion and four are scheduled.
The Perth and Peel LTCN has provided a critical reference point for all stakeholders and continues to assist with integrating cycle network planning.
Regional strategies are in the process of being migrated to the online ArcGIS tool to maximise functionality and provide more strategic planning opportunities across the State. The migration will allow for the status of regional LTCN networks to be tracked and improve awareness among stakeholders.
ANNUAL REPORT 2020-21 PAGE 57PAGE 56 DEPARTMENT OF TRANSPORT
Agency PerformanceAgency Performance
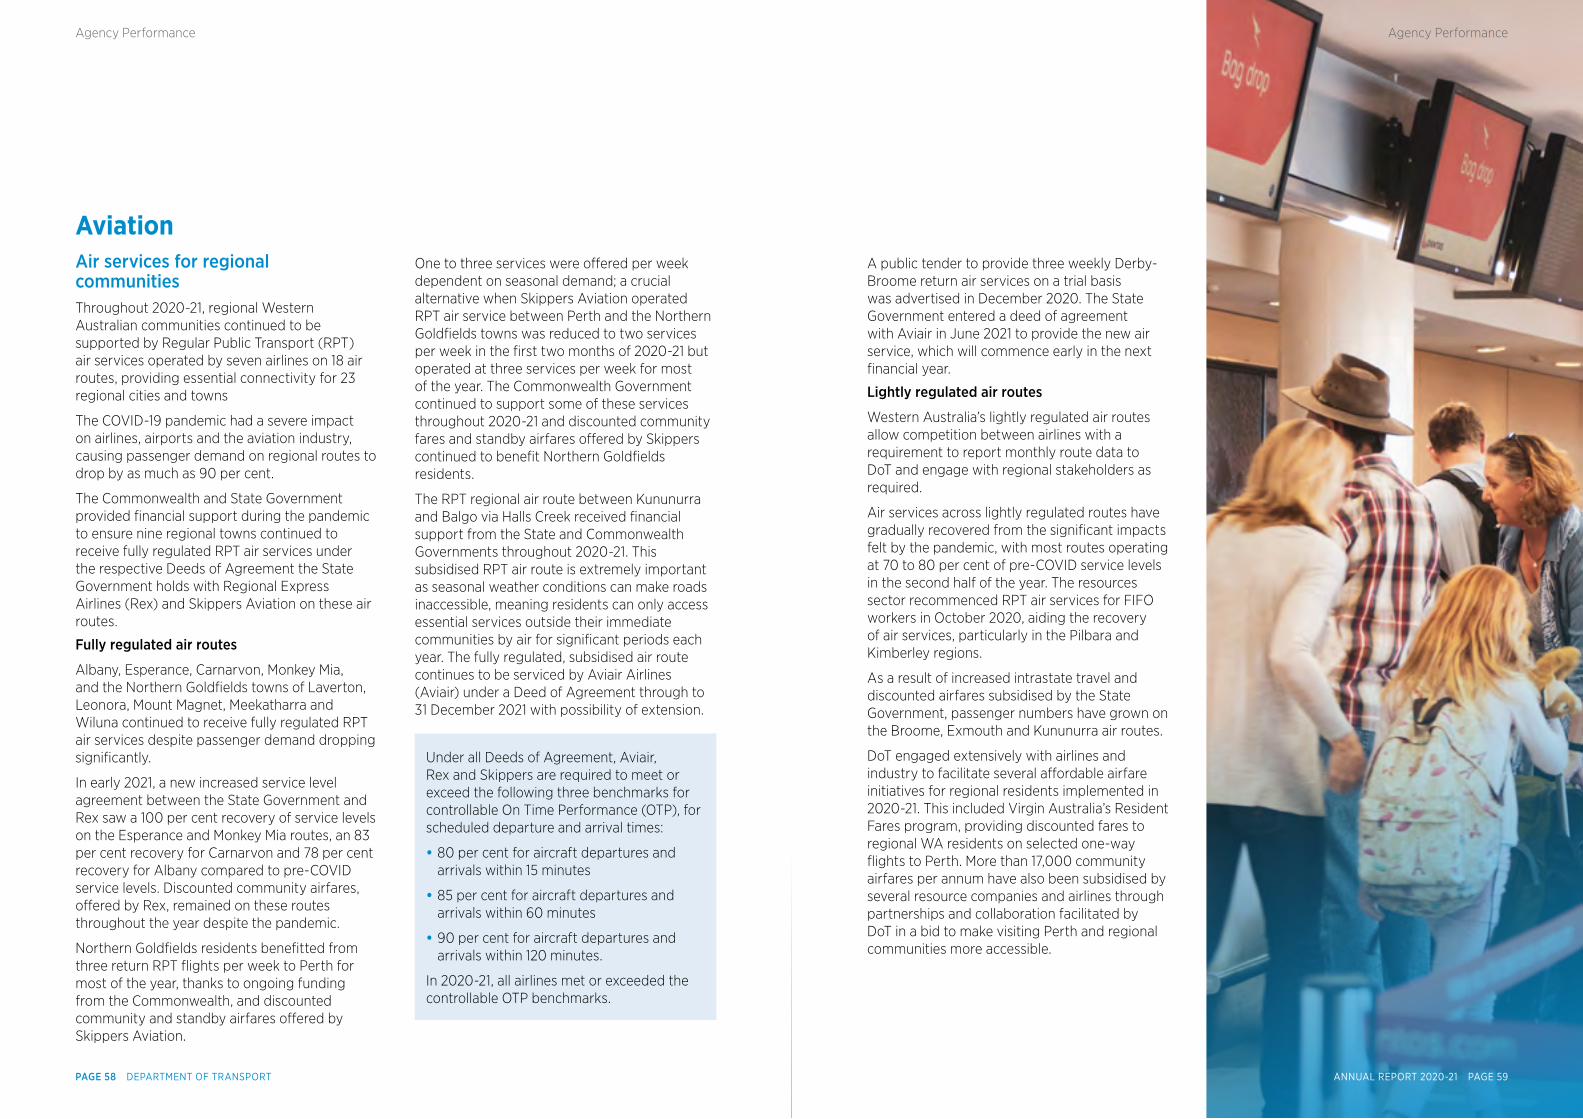
AviationAir services for regional communitiesThroughout 2020-21, regional Western Australian communities continued to be supported by Regular Public Transport (RPT) air services operated by seven airlines on 18 air routes, providing essential connectivity for 23 regional cities and towns
The COVID-19 pandemic had a severe impact on airlines, airports and the aviation industry, causing passenger demand on regional routes to drop by as much as 90 per cent.
The Commonwealth and State Government provided financial support during the pandemic to ensure nine regional towns continued to receive fully regulated RPT air services under the respective Deeds of Agreement the State Government holds with Regional Express Airlines (Rex) and Skippers Aviation on these air routes.
Fully regulated air routes
Albany, Esperance, Carnarvon, Monkey Mia, and the Northern Goldfields towns of Laverton, Leonora, Mount Magnet, Meekatharra and Wiluna continued to receive fully regulated RPT air services despite passenger demand dropping significantly.
In early 2021, a new increased service level agreement between the State Government and Rex saw a 100 per cent recovery of service levels on the Esperance and Monkey Mia routes, an 83 per cent recovery for Carnarvon and 78 per cent recovery for Albany compared to pre-COVID service levels. Discounted community airfares, offered by Rex, remained on these routes throughout the year despite the pandemic.
Northern Goldfields residents benefitted from three return RPT flights per week to Perth for most of the year, thanks to ongoing funding from the Commonwealth, and discounted community and standby airfares offered by Skippers Aviation.
One to three services were offered per week dependent on seasonal demand; a crucial alternative when Skippers Aviation operated RPT air service between Perth and the Northern Goldfields towns was reduced to two services per week in the first two months of 2020-21 but operated at three services per week for most of the year. The Commonwealth Government continued to support some of these services throughout 2020-21 and discounted community fares and standby airfares offered by Skippers continued to benefit Northern Goldfields residents.
The RPT regional air route between Kununurra and Balgo via Halls Creek received financial support from the State and Commonwealth Governments throughout 2020-21. This subsidised RPT air route is extremely important as seasonal weather conditions can make roads inaccessible, meaning residents can only access essential services outside their immediate communities by air for significant periods each year. The fully regulated, subsidised air route continues to be serviced by Aviair Airlines (Aviair) under a Deed of Agreement through to 31 December 2021 with possibility of extension.
Under all Deeds of Agreement, Aviair, Rex and Skippers are required to meet or exceed the following three benchmarks for controllable On Time Performance (OTP), for scheduled departure and arrival times:
• 80 per cent for aircraft departures and arrivals within 15 minutes
• 85 per cent for aircraft departures and arrivals within 60 minutes
• 90 per cent for aircraft departures and arrivals within 120 minutes.
In 2020-21, all airlines met or exceeded the controllable OTP benchmarks.
A public tender to provide three weekly Derby-Broome return air services on a trial basis was advertised in December 2020. The State Government entered a deed of agreement with Aviair in June 2021 to provide the new air service, which will commence early in the next financial year.
Lightly regulated air routes
Western Australia’s lightly regulated air routes allow competition between airlines with a requirement to report monthly route data to DoT and engage with regional stakeholders as required.
Air services across lightly regulated routes have gradually recovered from the significant impacts felt by the pandemic, with most routes operating at 70 to 80 per cent of pre-COVID service levels in the second half of the year. The resources sector recommenced RPT air services for FIFO workers in October 2020, aiding the recovery of air services, particularly in the Pilbara and Kimberley regions.
As a result of increased intrastate travel and discounted airfares subsidised by the State Government, passenger numbers have grown on the Broome, Exmouth and Kununurra air routes.
DoT engaged extensively with airlines and industry to facilitate several affordable airfare initiatives for regional residents implemented in 2020-21. This included Virgin Australia’s Resident Fares program, providing discounted fares to regional WA residents on selected one-way flights to Perth. More than 17,000 community airfares per annum have also been subsidised by several resource companies and airlines through partnerships and collaboration facilitated by DoT in a bid to make visiting Perth and regional communities more accessible.
ANNUAL REPORT 2020-21 PAGE 59PAGE 58 DEPARTMENT OF TRANSPORT
Agency PerformanceAgency Performance
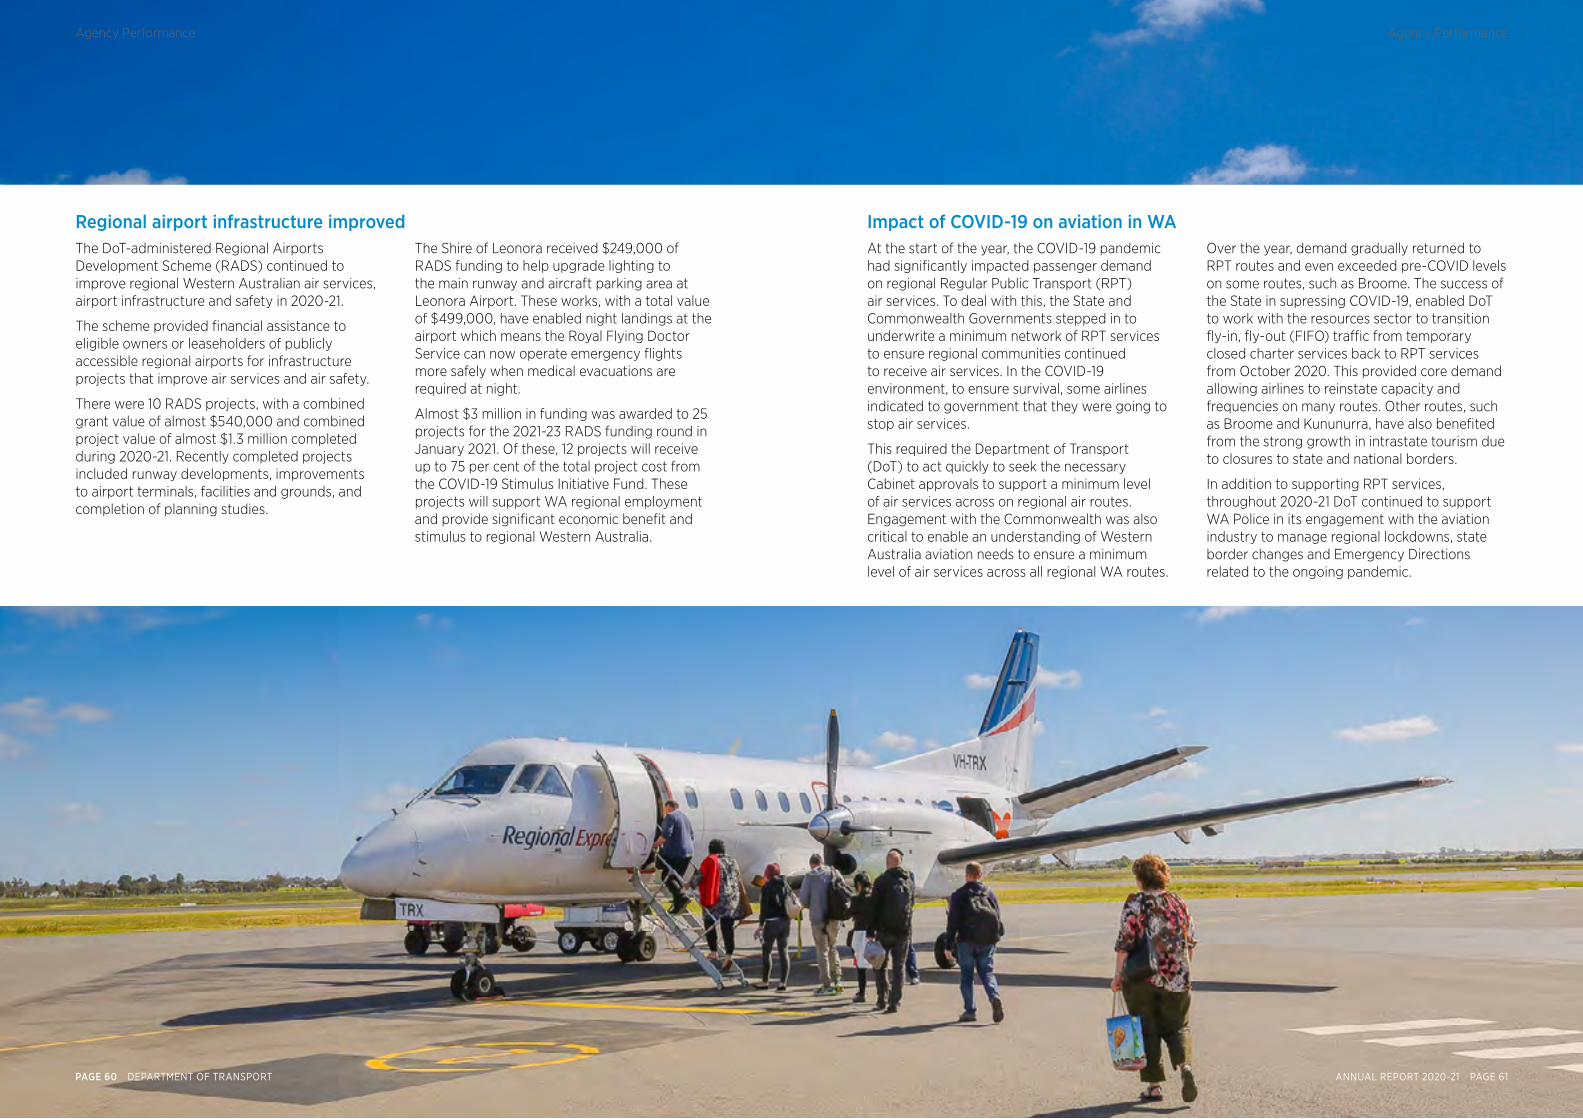
Regional airport infrastructure improvedThe DoT-administered Regional Airports Development Scheme (RADS) continued to improve regional Western Australian air services, airport infrastructure and safety in 2020-21.
The scheme provided financial assistance to eligible owners or leaseholders of publicly accessible regional airports for infrastructure projects that improve air services and air safety.
There were 10 RADS projects, with a combined grant value of almost $540,000 and combined project value of almost $1.3 million completed during 2020-21. Recently completed projects included runway developments, improvements to airport terminals, facilities and grounds, and completion of planning studies.
The Shire of Leonora received $249,000 of RADS funding to help upgrade lighting to the main runway and aircraft parking area at Leonora Airport. These works, with a total value of $499,000, have enabled night landings at the airport which means the Royal Flying Doctor Service can now operate emergency flights more safely when medical evacuations are required at night.
Almost $3 million in funding was awarded to 25 projects for the 2021-23 RADS funding round in January 2021. Of these, 12 projects will receive up to 75 per cent of the total project cost from the COVID-19 Stimulus Initiative Fund. These projects will support WA regional employment and provide significant economic benefit and stimulus to regional Western Australia.
Impact of COVID-19 on aviation in WAAt the start of the year, the COVID-19 pandemic had significantly impacted passenger demand on regional Regular Public Transport (RPT) air services. To deal with this, the State and Commonwealth Governments stepped in to underwrite a minimum network of RPT services to ensure regional communities continued to receive air services. In the COVID-19 environment, to ensure survival, some airlines indicated to government that they were going to stop air services.
This required the Department of Transport (DoT) to act quickly to seek the necessary Cabinet approvals to support a minimum level of air services across on regional air routes. Engagement with the Commonwealth was also critical to enable an understanding of Western Australia aviation needs to ensure a minimum level of air services across all regional WA routes.
Over the year, demand gradually returned to RPT routes and even exceeded pre-COVID levels on some routes, such as Broome. The success of the State in supressing COVID-19, enabled DoT to work with the resources sector to transition fly-in, fly-out (FIFO) traffic from temporary closed charter services back to RPT services from October 2020. This provided core demand allowing airlines to reinstate capacity and frequencies on many routes. Other routes, such as Broome and Kununurra, have also benefited from the strong growth in intrastate tourism due to closures to state and national borders.
In addition to supporting RPT services, throughout 2020-21 DoT continued to support WA Police in its engagement with the aviation industry to manage regional lockdowns, state border changes and Emergency Directions related to the ongoing pandemic.
ANNUAL REPORT 2020-21 PAGE 61PAGE 60 DEPARTMENT OF TRANSPORT
Agency PerformanceAgency Performance
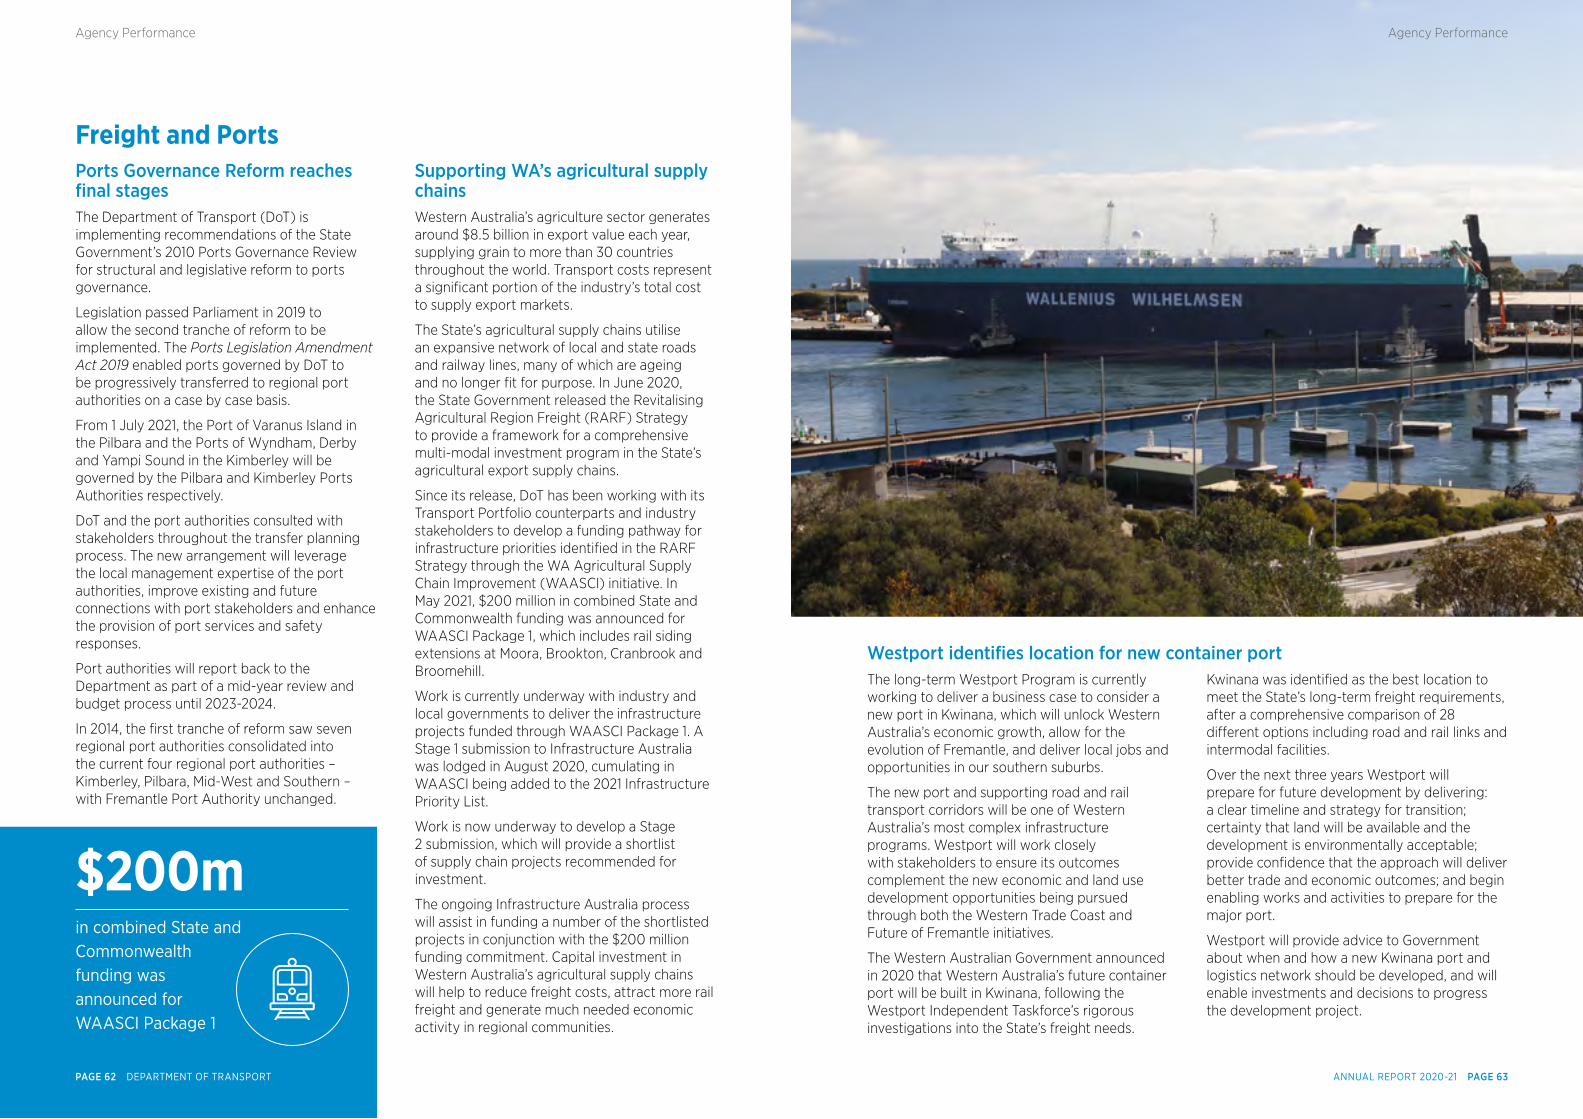
Freight and PortsPorts Governance Reform reaches fnal stagesThe Department of Transport (DoT) is implementing recommendations of the State Government’s 2010 Ports Governance Review for structural and legislative reform to ports governance.
Legislation passed Parliament in 2019 to allow the second tranche of reform to be implemented. The Ports Legislation Amendment Act 2019 enabled ports governed by DoT to be progressively transferred to regional port authorities on a case by case basis.
From 1 July 2021, the Port of Varanus Island in the Pilbara and the Ports of Wyndham, Derby and Yampi Sound in the Kimberley will be governed by the Pilbara and Kimberley Ports Authorities respectively.
DoT and the port authorities consulted with stakeholders throughout the transfer planning process. The new arrangement will leverage the local management expertise of the port authorities, improve existing and future connections with port stakeholders and enhance the provision of port services and safety responses.
Port authorities will report back to the Department as part of a mid-year review and budget process until 2023-2024.
In 2014, the first tranche of reform saw seven regional port authorities consolidated into the current four regional port authorities – Kimberley, Pilbara, Mid-West and Southern – with Fremantle Port Authority unchanged.
Supporting WA’s agricultural supply chainsWestern Australia’s agriculture sector generates around $8.5 billion in export value each year, supplying grain to more than 30 countries throughout the world. Transport costs represent a significant portion of the industry’s total cost to supply export markets.
The State’s agricultural supply chains utilise an expansive network of local and state roads and railway lines, many of which are ageing and no longer fit for purpose. In June 2020, the State Government released the Revitalising Agricultural Region Freight (RARF) Strategy to provide a framework for a comprehensive multi-modal investment program in the State’s agricultural export supply chains.
Since its release, DoT has been working with its Transport Portfolio counterparts and industry stakeholders to develop a funding pathway for infrastructure priorities identified in the RARF Strategy through the WA Agricultural Supply Chain Improvement (WAASCI) initiative. In May 2021, $200 million in combined State and Commonwealth funding was announced for WAASCI Package 1, which includes rail siding extensions at Moora, Brookton, Cranbrook and Broomehill.
Work is currently underway with industry and local governments to deliver the infrastructure projects funded through WAASCI Package 1. A Stage 1 submission to Infrastructure Australia was lodged in August 2020, cumulating in WAASCI being added to the 2021 Infrastructure Priority List.
Work is now underway to develop a Stage 2 submission, which will provide a shortlist of supply chain projects recommended for investment.
The ongoing Infrastructure Australia process will assist in funding a number of the shortlisted projects in conjunction with the $200 million funding commitment. Capital investment in Western Australia’s agricultural supply chains will help to reduce freight costs, attract more rail freight and generate much needed economic activity in regional communities.
Westport identifes location for new container portThe long-term Westport Program is currently working to deliver a business case to consider a new port in Kwinana, which will unlock Western Australia’s economic growth, allow for the evolution of Fremantle, and deliver local jobs and opportunities in our southern suburbs.
The new port and supporting road and rail transport corridors will be one of Western Australia’s most complex infrastructure programs. Westport will work closely with stakeholders to ensure its outcomes complement the new economic and land use development opportunities being pursued through both the Western Trade Coast and Future of Fremantle initiatives.
The Western Australian Government announced in 2020 that Western Australia’s future container port will be built in Kwinana, following the Westport Independent Taskforce’s rigorous investigations into the State’s freight needs.
Kwinana was identified as the best location to meet the State’s long-term freight requirements, after a comprehensive comparison of 28 different options including road and rail links and intermodal facilities.
Over the next three years Westport will prepare for future development by delivering: a clear timeline and strategy for transition; certainty that land will be available and the development is environmentally acceptable; provide confidence that the approach will deliver better trade and economic outcomes; and begin enabling works and activities to prepare for the major port.
Westport will provide advice to Government about when and how a new Kwinana port and logistics network should be developed, and will enable investments and decisions to progress the development project.
$200min combined State and Commonwealth funding was announced for WAASCI Package 1
ANNUAL REPORT 2020-21 PAGE 63PAGE 62 DEPARTMENT OF TRANSPORT
Agency PerformanceAgency Performance
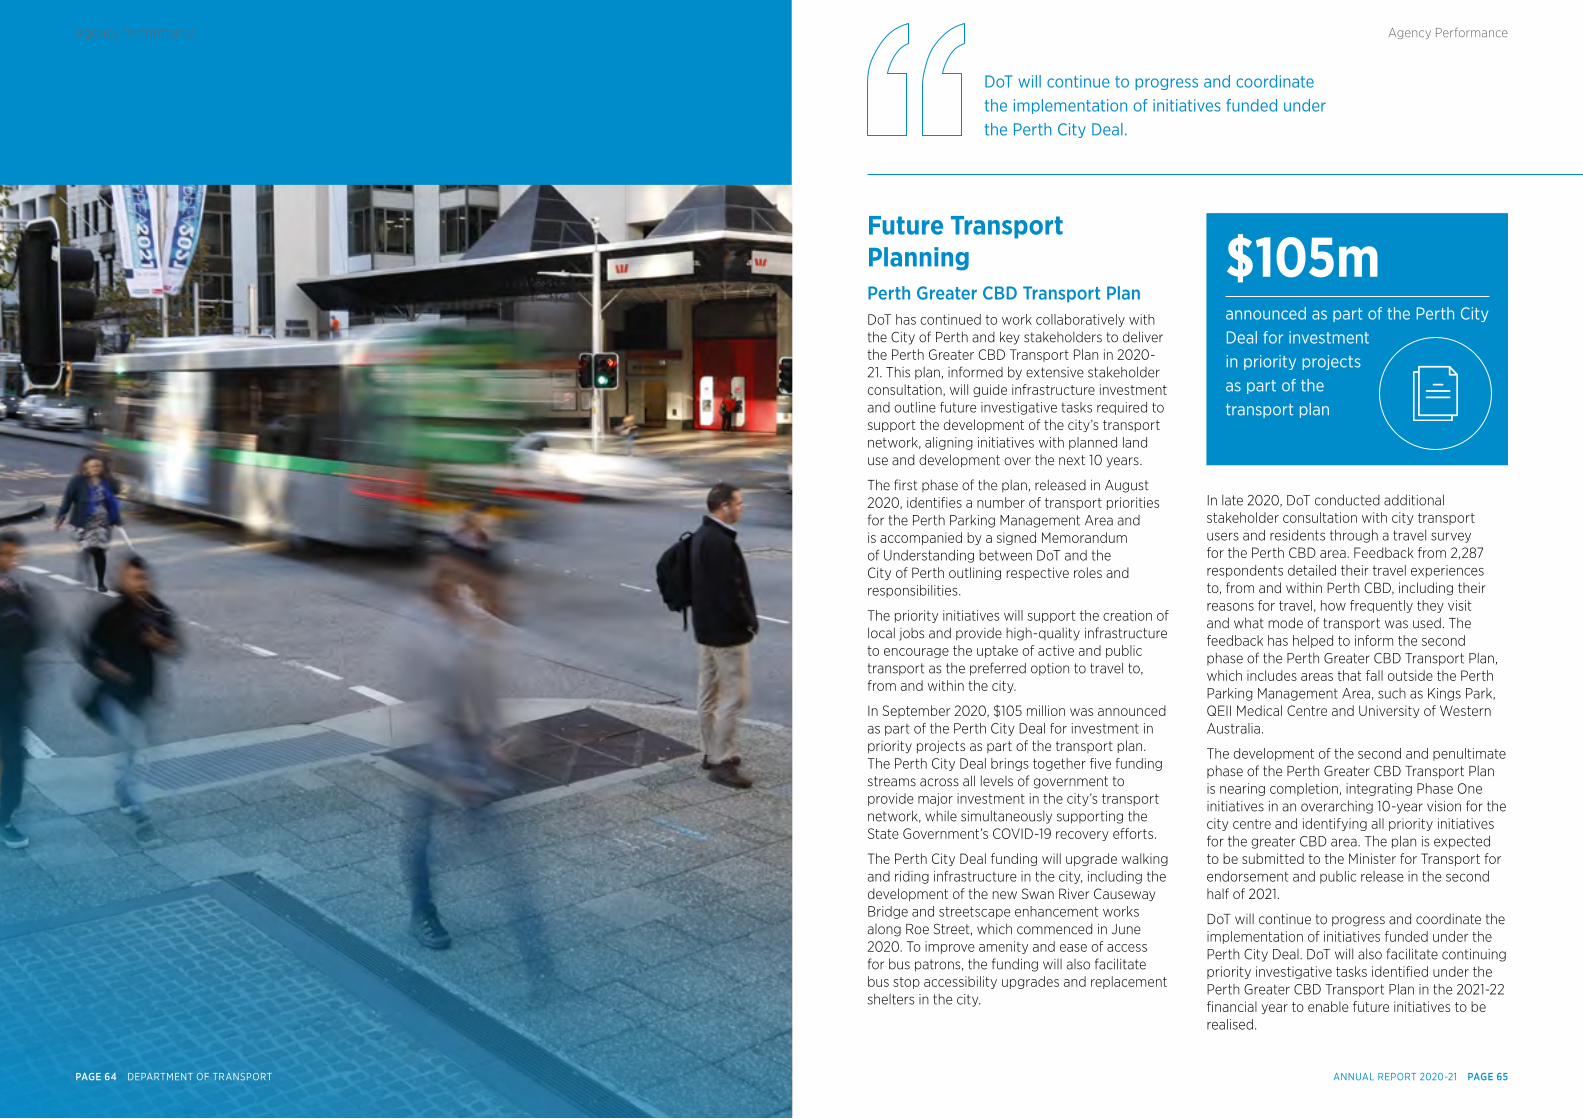
Future Transport PlanningPerth Greater CBD Transport Plan DoT has continued to work collaboratively with the City of Perth and key stakeholders to deliver the Perth Greater CBD Transport Plan in 2020-21. This plan, informed by extensive stakeholder consultation, will guide infrastructure investment and outline future investigative tasks required to support the development of the city’s transport network, aligning initiatives with planned land use and development over the next 10 years.
The first phase of the plan, released in August 2020, identifies a number of transport priorities for the Perth Parking Management Area and is accompanied by a signed Memorandum of Understanding between DoT and the City of Perth outlining respective roles and responsibilities.
The priority initiatives will support the creation of local jobs and provide high-quality infrastructure to encourage the uptake of active and public transport as the preferred option to travel to, from and within the city.
In September 2020, $105 million was announced as part of the Perth City Deal for investment in priority projects as part of the transport plan. The Perth City Deal brings together five funding streams across all levels of government to provide major investment in the city’s transport network, while simultaneously supporting the State Government’s COVID-19 recovery efforts.
The Perth City Deal funding will upgrade walking and riding infrastructure in the city, including the development of the new Swan River Causeway Bridge and streetscape enhancement works along Roe Street, which commenced in June 2020. To improve amenity and ease of access for bus patrons, the funding will also facilitate bus stop accessibility upgrades and replacement shelters in the city.
DoT will continue to progress and coordinate the implementation of initiatives funded under the Perth City Deal.
$105mannounced as part of the Perth City Deal for investment in priority projects as part of the transport plan
In late 2020, DoT conducted additional stakeholder consultation with city transport users and residents through a travel survey for the Perth CBD area. Feedback from 2,287 respondents detailed their travel experiences to, from and within Perth CBD, including their reasons for travel, how frequently they visit and what mode of transport was used. The feedback has helped to inform the second phase of the Perth Greater CBD Transport Plan, which includes areas that fall outside the Perth Parking Management Area, such as Kings Park, QEII Medical Centre and University of Western Australia.
The development of the second and penultimate phase of the Perth Greater CBD Transport Plan is nearing completion, integrating Phase One initiatives in an overarching 10-year vision for the city centre and identifying all priority initiatives for the greater CBD area. The plan is expected to be submitted to the Minister for Transport for endorsement and public release in the second half of 2021.
DoT will continue to progress and coordinate the implementation of initiatives funded under the Perth City Deal. DoT will also facilitate continuing priority investigative tasks identified under the Perth Greater CBD Transport Plan in the 2021-22 financial year to enable future initiatives to be realised.
ANNUAL REPORT 2020-21 PAGE 65PAGE 64 DEPARTMENT OF TRANSPORT
Agency PerformanceAgency Performance
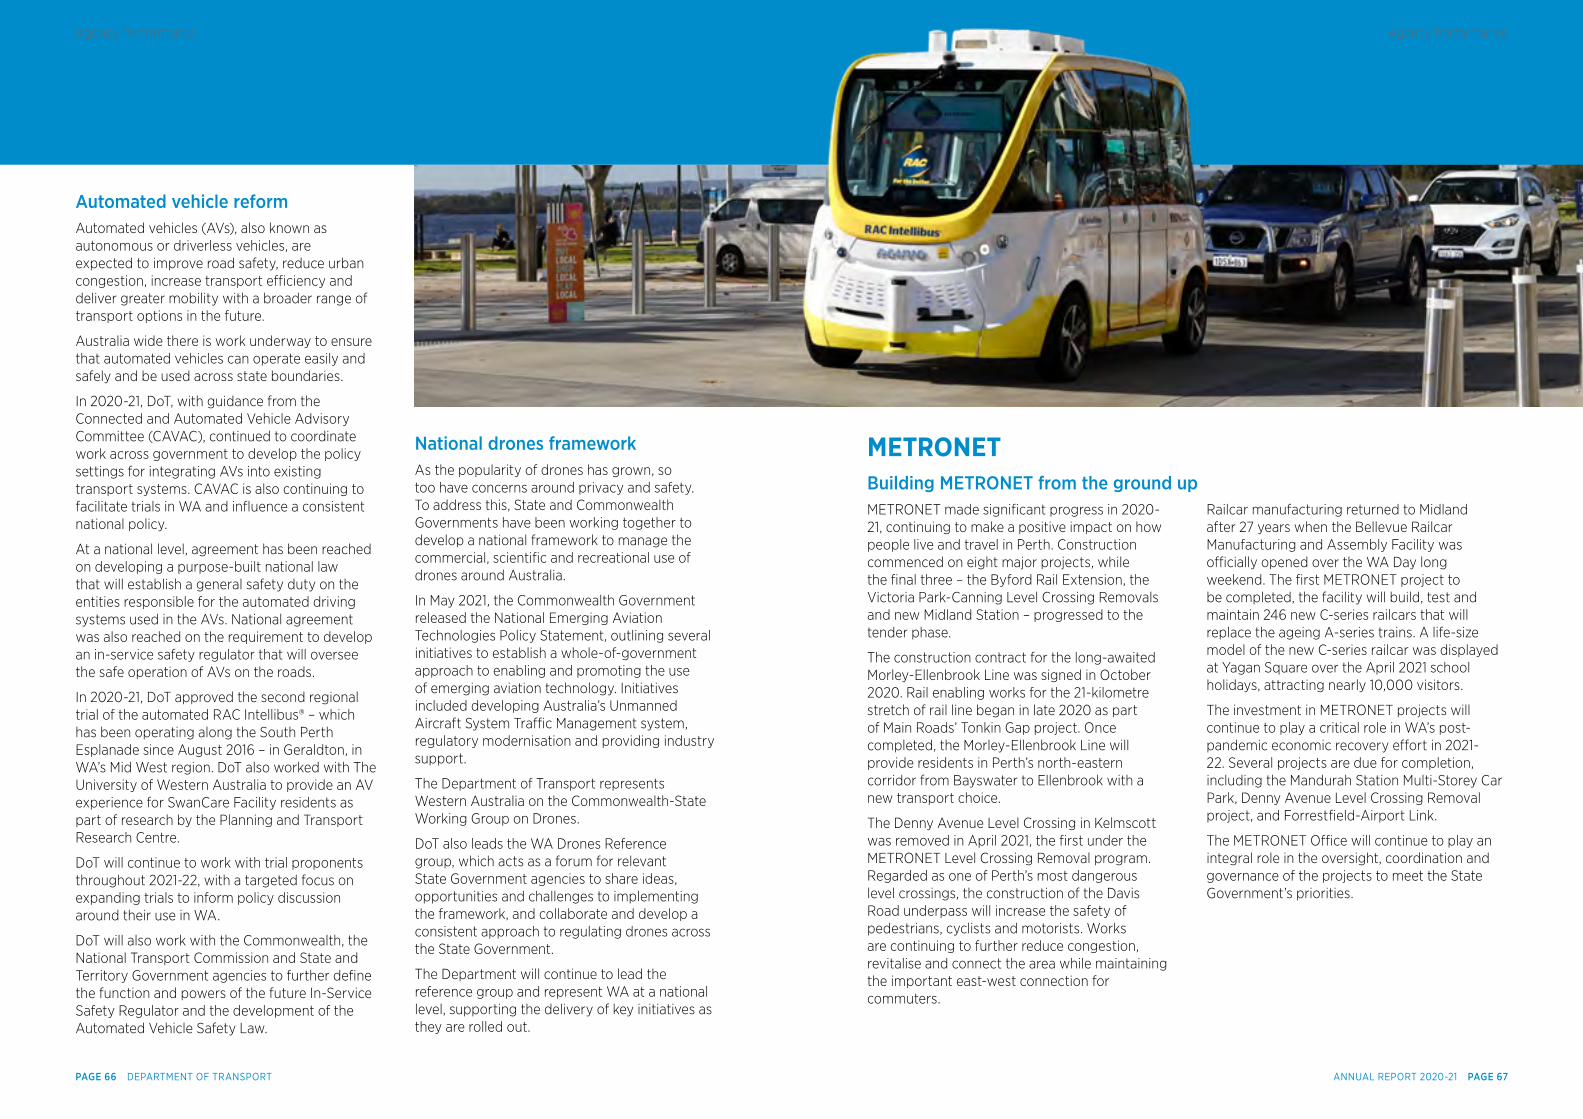
Automated vehicle reformAutomated vehicles (AVs), also known as autonomous or driverless vehicles, are expected to improve road safety, reduce urban congestion, increase transport efficiency and deliver greater mobility with a broader range of transport options in the future.
Australia wide there is work underway to ensure that automated vehicles can operate easily and safely and be used across state boundaries.
In 2020-21, DoT, with guidance from the Connected and Automated Vehicle Advisory Committee (CAVAC), continued to coordinate work across government to develop the policy settings for integrating AVs into existing transport systems. CAVAC is also continuing to facilitate trials in WA and influence a consistent national policy.
At a national level, agreement has been reached on developing a purpose-built national law that will establish a general safety duty on the entities responsible for the automated driving systems used in the AVs. National agreement was also reached on the requirement to develop an in-service safety regulator that will oversee the safe operation of AVs on the roads.
In 2020-21, DoT approved the second regional trial of the automated RAC Intellibus® – which has been operating along the South Perth Esplanade since August 2016 – in Geraldton, in WA’s Mid West region. DoT also worked with The University of Western Australia to provide an AV experience for SwanCare Facility residents as part of research by the Planning and Transport Research Centre.
DoT will continue to work with trial proponents throughout 2021-22, with a targeted focus on expanding trials to inform policy discussion around their use in WA.
DoT will also work with the Commonwealth, the National Transport Commission and State and Territory Government agencies to further define the function and powers of the future In-Service Safety Regulator and the development of the Automated Vehicle Safety Law.
METRONETBuilding METRONET from the ground upMETRONET made significant progress in 2020-21, continuing to make a positive impact on how people live and travel in Perth. Construction commenced on eight major projects, while the final three – the Byford Rail Extension, the Victoria Park-Canning Level Crossing Removals and new Midland Station – progressed to the tender phase.
The construction contract for the long-awaited Morley-Ellenbrook Line was signed in October 2020. Rail enabling works for the 21-kilometre stretch of rail line began in late 2020 as part of Main Roads’ Tonkin Gap project. Once completed, the Morley-Ellenbrook Line will provide residents in Perth’s north-eastern corridor from Bayswater to Ellenbrook with a new transport choice.
The Denny Avenue Level Crossing in Kelmscott was removed in April 2021, the first under the METRONET Level Crossing Removal program. Regarded as one of Perth’s most dangerous level crossings, the construction of the Davis Road underpass will increase the safety of pedestrians, cyclists and motorists. Works are continuing to further reduce congestion, revitalise and connect the area while maintaining the important east-west connection for commuters.
Railcar manufacturing returned to Midland after 27 years when the Bellevue Railcar Manufacturing and Assembly Facility was officially opened over the WA Day long weekend. The first METRONET project to be completed, the facility will build, test and maintain 246 new C-series railcars that will replace the ageing A-series trains. A life-size model of the new C-series railcar was displayed at Yagan Square over the April 2021 school holidays, attracting nearly 10,000 visitors.
The investment in METRONET projects will continue to play a critical role in WA’s post-pandemic economic recovery effort in 2021-22. Several projects are due for completion, including the Mandurah Station Multi-Storey Car Park, Denny Avenue Level Crossing Removal project, and Forrestfield-Airport Link.
The METRONET Office will continue to play an integral role in the oversight, coordination and governance of the projects to meet the State Government’s priorities.
National drones frameworkAs the popularity of drones has grown, so too have concerns around privacy and safety. To address this, State and Commonwealth Governments have been working together to develop a national framework to manage the commercial, scientific and recreational use of drones around Australia.
In May 2021, the Commonwealth Government released the National Emerging Aviation Technologies Policy Statement, outlining several initiatives to establish a whole-of-government approach to enabling and promoting the use of emerging aviation technology. Initiatives included developing Australia’s Unmanned Aircraft System Traffic Management system, regulatory modernisation and providing industry support.
The Department of Transport represents Western Australia on the Commonwealth-State Working Group on Drones.
DoT also leads the WA Drones Reference group, which acts as a forum for relevant State Government agencies to share ideas, opportunities and challenges to implementing the framework, and collaborate and develop a consistent approach to regulating drones across the State Government.
The Department will continue to lead the reference group and represent WA at a national level, supporting the delivery of key initiatives as they are rolled out.
ANNUAL REPORT 2020-21 PAGE 67PAGE 66 DEPARTMENT OF TRANSPORT
Agency PerformanceAgency Performance
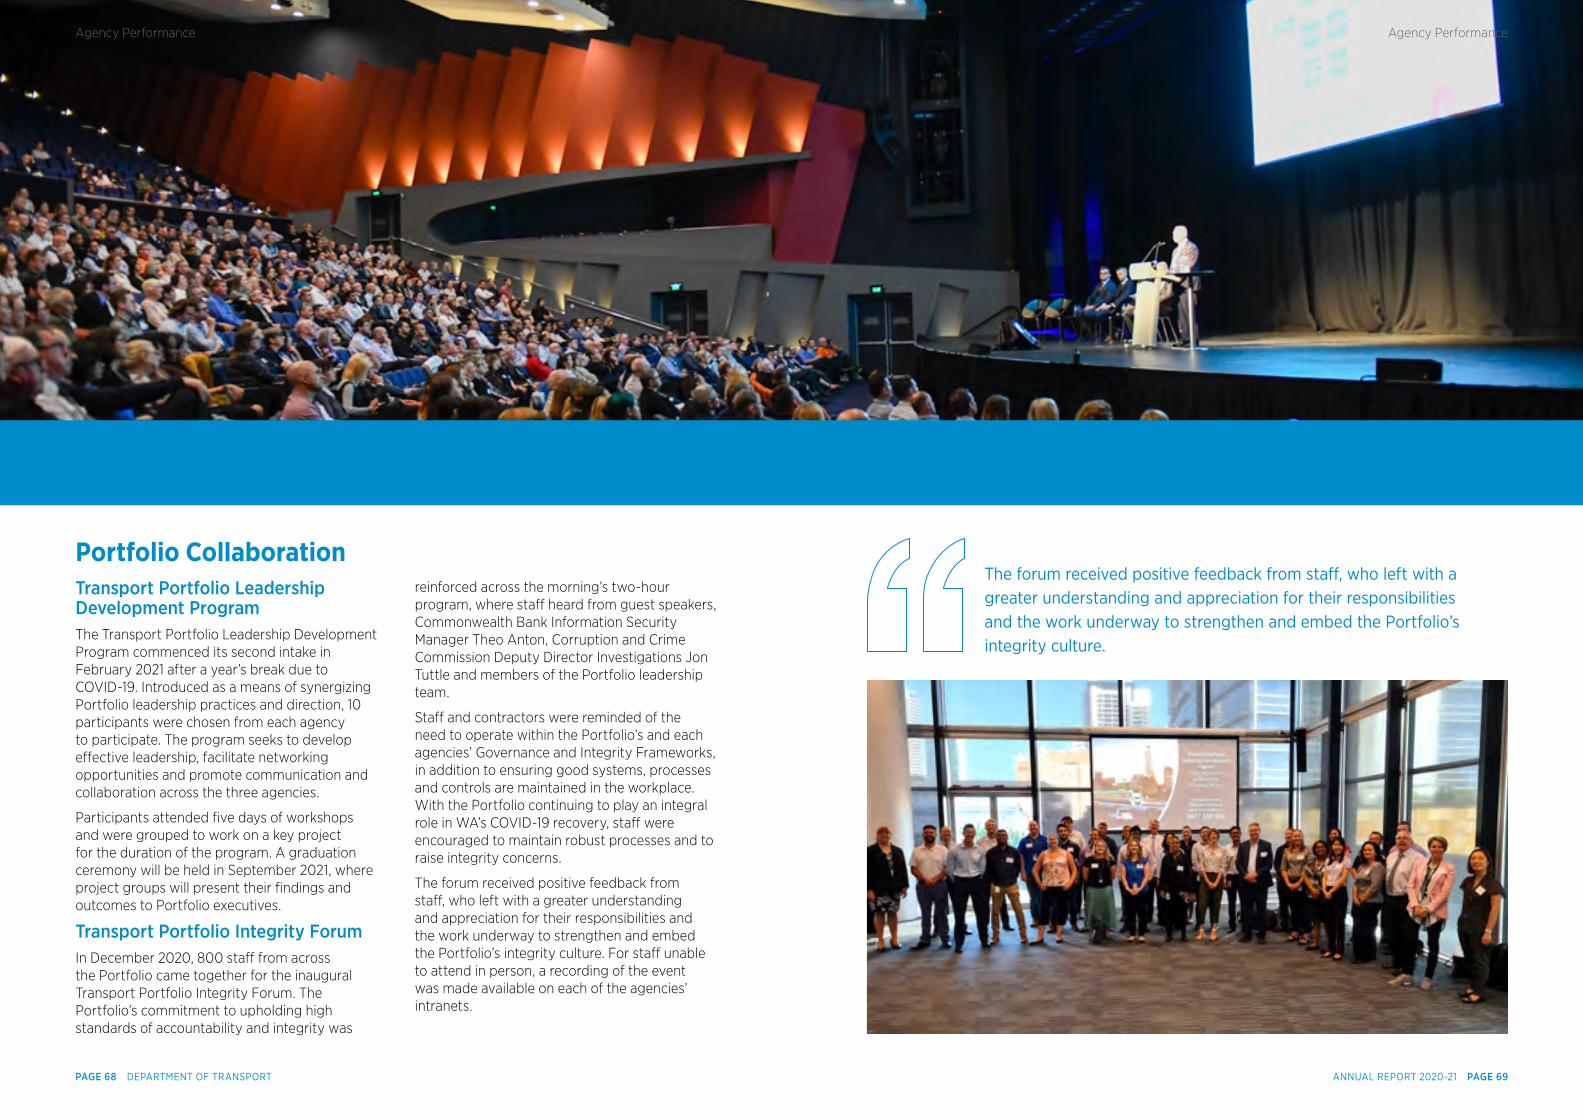
Portfolio CollaborationTransport Portfolio Leadership Development ProgramThe Transport Portfolio Leadership Development Program commenced its second intake in February 2021 after a year’s break due to COVID-19. Introduced as a means of synergizing Portfolio leadership practices and direction, 10 participants were chosen from each agency to participate. The program seeks to develop effective leadership, facilitate networking opportunities and promote communication and collaboration across the three agencies.
Participants attended five days of workshops and were grouped to work on a key project for the duration of the program. A graduation ceremony will be held in September 2021, where project groups will present their findings and outcomes to Portfolio executives.
Transport Portfolio Integrity ForumIn December 2020, 800 staff from across the Portfolio came together for the inaugural Transport Portfolio Integrity Forum. The Portfolio’s commitment to upholding high standards of accountability and integrity was
reinforced across the morning’s two-hour program, where staff heard from guest speakers, Commonwealth Bank Information Security Manager Theo Anton, Corruption and Crime Commission Deputy Director Investigations Jon Tuttle and members of the Portfolio leadership team.
Staff and contractors were reminded of the need to operate within the Portfolio’s and each agencies’ Governance and Integrity Frameworks, in addition to ensuring good systems, processes and controls are maintained in the workplace. With the Portfolio continuing to play an integral role in WA’s COVID-19 recovery, staff were encouraged to maintain robust processes and to raise integrity concerns.
The forum received positive feedback from staff, who left with a greater understanding and appreciation for their responsibilities and the work underway to strengthen and embed the Portfolio’s integrity culture. For staff unable to attend in person, a recording of the event was made available on each of the agencies’ intranets.
The forum received positive feedback from staff, who left with a greater understanding and appreciation for their responsibilities and the work underway to strengthen and embed the Portfolio’s integrity culture.
ANNUAL REPORT 2020-21 PAGE 69PAGE 68 DEPARTMENT OF TRANSPORT
Agency PerformanceAgency Performance
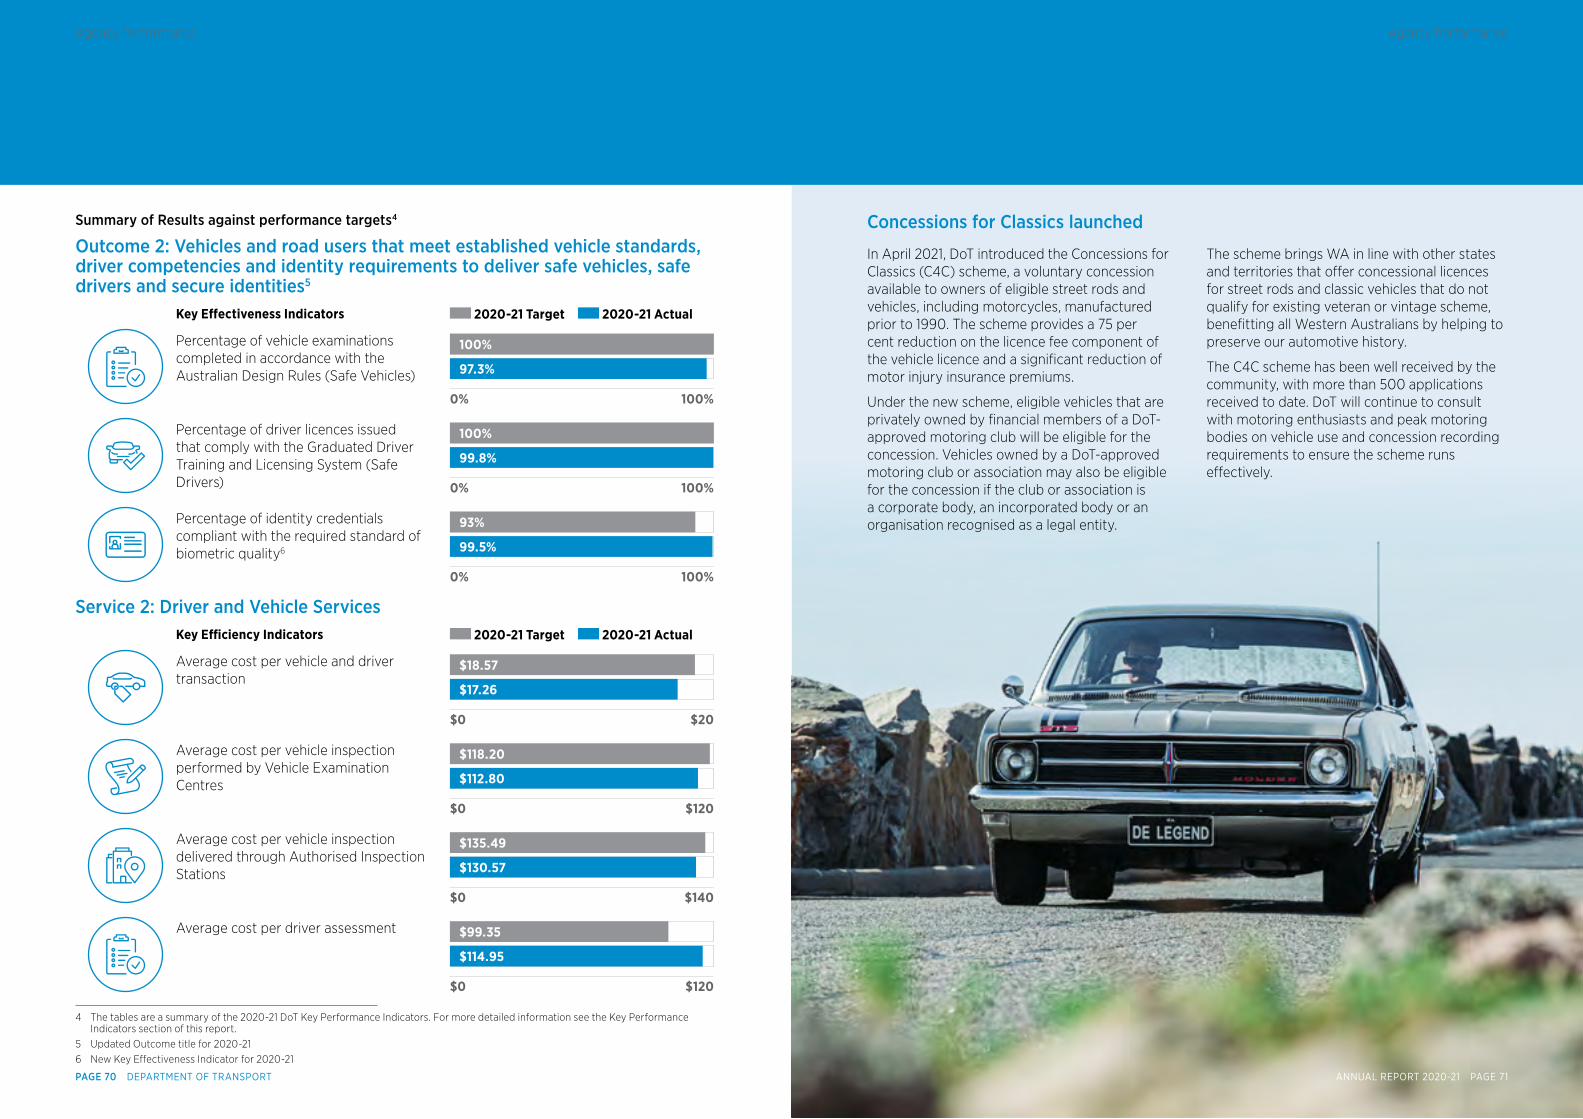
Summary of Results against performance targets4
Outcome 2: Vehicles and road users that meet established vehicle standards, driver competencies and identity requirements to deliver safe vehicles, safe drivers and secure identities5
Key Effectiveness Indicators 2020-21 Target 2020-21 Actual
Percentage of vehicle examinations completed in accordance with the Australian Design Rules (Safe Vehicles)
100%0%
100%
97.3%
Percentage of driver licences issued that comply with the Graduated Driver Training and Licensing System (Safe Drivers) 100%0%
100%
99.8%
Percentage of identity credentials compliant with the required standard of biometric quality6
100%0%
93%
99.5%
Service 2: Driver and Vehicle ServicesKey Efficiency Indicators 2020-21 Target 2020-21 Actual
Average cost per vehicle and driver transaction
$20$0
$18.57
$17.26
Average cost per vehicle inspection performed by Vehicle Examination Centres
$120$0
$118.20
$112.80
Average cost per vehicle inspection delivered through Authorised Inspection Stations
$140$0
$135.49
$130.57
Average cost per driver assessment
$120$0
$99.35
$114.95
4 The tables are a summary of the 2020-21 DoT Key Performance Indicators. For more detailed information see the Key Performance Indicators section of this report.
5 Updated Outcome title for 2020-216 New Key Effectiveness Indicator for 2020-21
Concessions for Classics launched
In April 2021, DoT introduced the Concessions for Classics (C4C) scheme, a voluntary concession available to owners of eligible street rods and vehicles, including motorcycles, manufactured prior to 1990. The scheme provides a 75 per cent reduction on the licence fee component of the vehicle licence and a significant reduction of motor injury insurance premiums.
Under the new scheme, eligible vehicles that are privately owned by financial members of a DoT-approved motoring club will be eligible for the concession. Vehicles owned by a DoT-approved motoring club or association may also be eligible for the concession if the club or association is a corporate body, an incorporated body or an organisation recognised as a legal entity.
The scheme brings WA in line with other states and territories that offer concessional licences for street rods and classic vehicles that do not qualify for existing veteran or vintage scheme, benefitting all Western Australians by helping to preserve our automotive history.
The C4C scheme has been well received by the community, with more than 500 applications received to date. DoT will continue to consult with motoring enthusiasts and peak motoring bodies on vehicle use and concession recording requirements to ensure the scheme runs effectively.
ANNUAL REPORT 2020-21 PAGE 71PAGE 70 DEPARTMENT OF TRANSPORT
Agency PerformanceAgency Performance
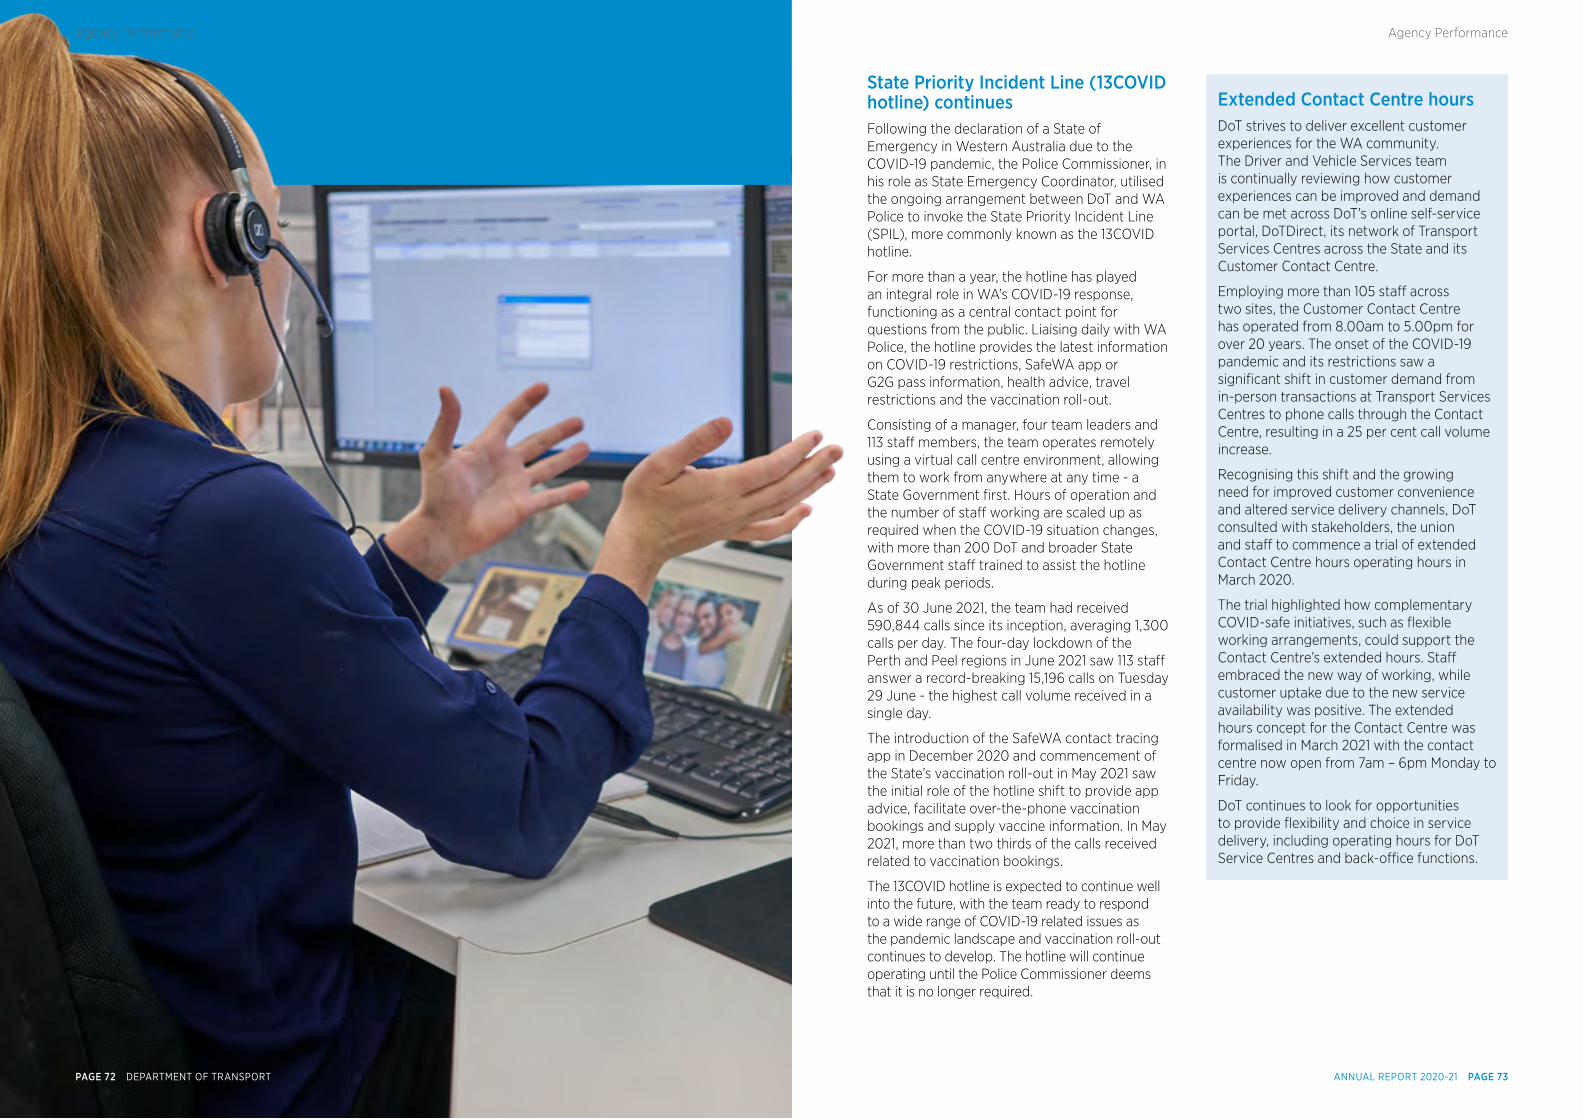
State Priority Incident Line (13COVID hotline) continues Following the declaration of a State of Emergency in Western Australia due to the COVID-19 pandemic, the Police Commissioner, in his role as State Emergency Coordinator, utilised the ongoing arrangement between DoT and WA Police to invoke the State Priority Incident Line (SPIL), more commonly known as the 13COVID hotline.
For more than a year, the hotline has played an integral role in WA’s COVID-19 response, functioning as a central contact point for questions from the public. Liaising daily with WA Police, the hotline provides the latest information on COVID-19 restrictions, SafeWA app or G2G pass information, health advice, travel restrictions and the vaccination roll-out.
Consisting of a manager, four team leaders and 113 staff members, the team operates remotely using a virtual call centre environment, allowing them to work from anywhere at any time - a State Government first. Hours of operation and the number of staff working are scaled up as required when the COVID-19 situation changes, with more than 200 DoT and broader State Government staff trained to assist the hotline during peak periods.
As of 30 June 2021, the team had received 590,844 calls since its inception, averaging 1,300 calls per day. The four-day lockdown of the Perth and Peel regions in June 2021 saw 113 staff answer a record-breaking 15,196 calls on Tuesday 29 June - the highest call volume received in a single day.
The introduction of the SafeWA contact tracing app in December 2020 and commencement of the State’s vaccination roll-out in May 2021 saw the initial role of the hotline shift to provide app advice, facilitate over-the-phone vaccination bookings and supply vaccine information. In May 2021, more than two thirds of the calls received related to vaccination bookings.
The 13COVID hotline is expected to continue well into the future, with the team ready to respond to a wide range of COVID-19 related issues as the pandemic landscape and vaccination roll-out continues to develop. The hotline will continue operating until the Police Commissioner deems that it is no longer required.
Extended Contact Centre hoursDoT strives to deliver excellent customer experiences for the WA community. The Driver and Vehicle Services team is continually reviewing how customer experiences can be improved and demand can be met across DoT’s online self-service portal, DoTDirect, its network of Transport Services Centres across the State and its Customer Contact Centre.
Employing more than 105 staff across two sites, the Customer Contact Centre has operated from 8.00am to 5.00pm for over 20 years. The onset of the COVID-19 pandemic and its restrictions saw a significant shift in customer demand from in-person transactions at Transport Services Centres to phone calls through the Contact Centre, resulting in a 25 per cent call volume increase.
Recognising this shift and the growing need for improved customer convenience and altered service delivery channels, DoT consulted with stakeholders, the union and staff to commence a trial of extended Contact Centre hours operating hours in March 2020.
The trial highlighted how complementary COVID-safe initiatives, such as flexible working arrangements, could support the Contact Centre’s extended hours. Staff embraced the new way of working, while customer uptake due to the new service availability was positive. The extended hours concept for the Contact Centre was formalised in March 2021 with the contact centre now open from 7am – 6pm Monday to Friday.
DoT continues to look for opportunities to provide flexibility and choice in service delivery, including operating hours for DoT Service Centres and back-office functions.
ANNUAL REPORT 2020-21 PAGE 73PAGE 72 DEPARTMENT OF TRANSPORT
Agency PerformanceAgency Performance
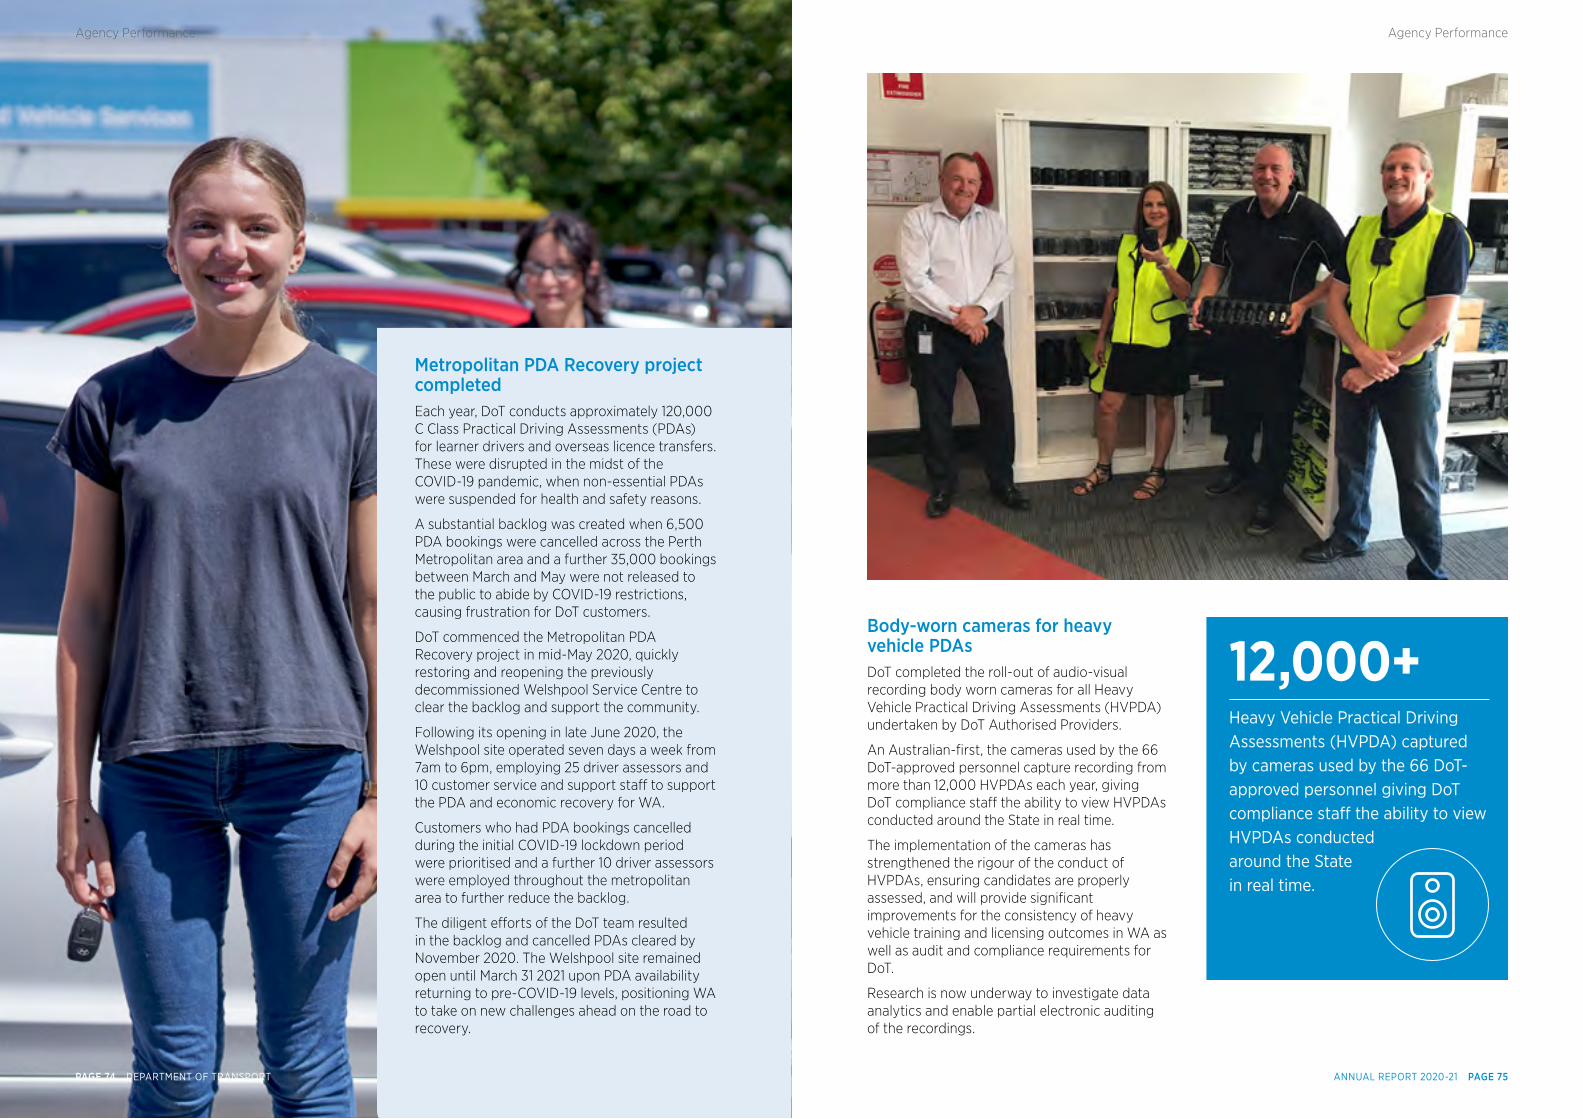
Metropolitan PDA Recovery project completedEach year, DoT conducts approximately 120,000 C Class Practical Driving Assessments (PDAs) for learner drivers and overseas licence transfers. These were disrupted in the midst of the COVID-19 pandemic, when non-essential PDAs were suspended for health and safety reasons.
A substantial backlog was created when 6,500 PDA bookings were cancelled across the Perth Metropolitan area and a further 35,000 bookings between March and May were not released to the public to abide by COVID-19 restrictions, causing frustration for DoT customers.
DoT commenced the Metropolitan PDA Recovery project in mid-May 2020, quickly restoring and reopening the previously decommissioned Welshpool Service Centre to clear the backlog and support the community.
Following its opening in late June 2020, the Welshpool site operated seven days a week from 7am to 6pm, employing 25 driver assessors and 10 customer service and support staff to support the PDA and economic recovery for WA.
Customers who had PDA bookings cancelled during the initial COVID-19 lockdown period were prioritised and a further 10 driver assessors were employed throughout the metropolitan area to further reduce the backlog.
The diligent efforts of the DoT team resulted in the backlog and cancelled PDAs cleared by November 2020. The Welshpool site remained open until March 31 2021 upon PDA availability returning to pre-COVID-19 levels, positioning WA to take on new challenges ahead on the road to recovery.
Body-worn cameras for heavy vehicle PDAsDoT completed the roll-out of audio-visual recording body worn cameras for all Heavy Vehicle Practical Driving Assessments (HVPDA) undertaken by DoT Authorised Providers.
An Australian-first, the cameras used by the 66 DoT-approved personnel capture recording from more than 12,000 HVPDAs each year, giving DoT compliance staff the ability to view HVPDAs conducted around the State in real time.
The implementation of the cameras has strengthened the rigour of the conduct of HVPDAs, ensuring candidates are properly assessed, and will provide significant improvements for the consistency of heavy vehicle training and licensing outcomes in WA as well as audit and compliance requirements for DoT.
Research is now underway to investigate data analytics and enable partial electronic auditing of the recordings.
12,000+Heavy Vehicle Practical Driving Assessments (HVPDA) captured by cameras used by the 66 DoT-approved personnel giving DoT compliance staff the ability to view HVPDAs conducted around the State in real time.
ANNUAL REPORT 2020-21 PAGE 75PAGE 74 DEPARTMENT OF TRANSPORT
Agency PerformanceAgency Performance
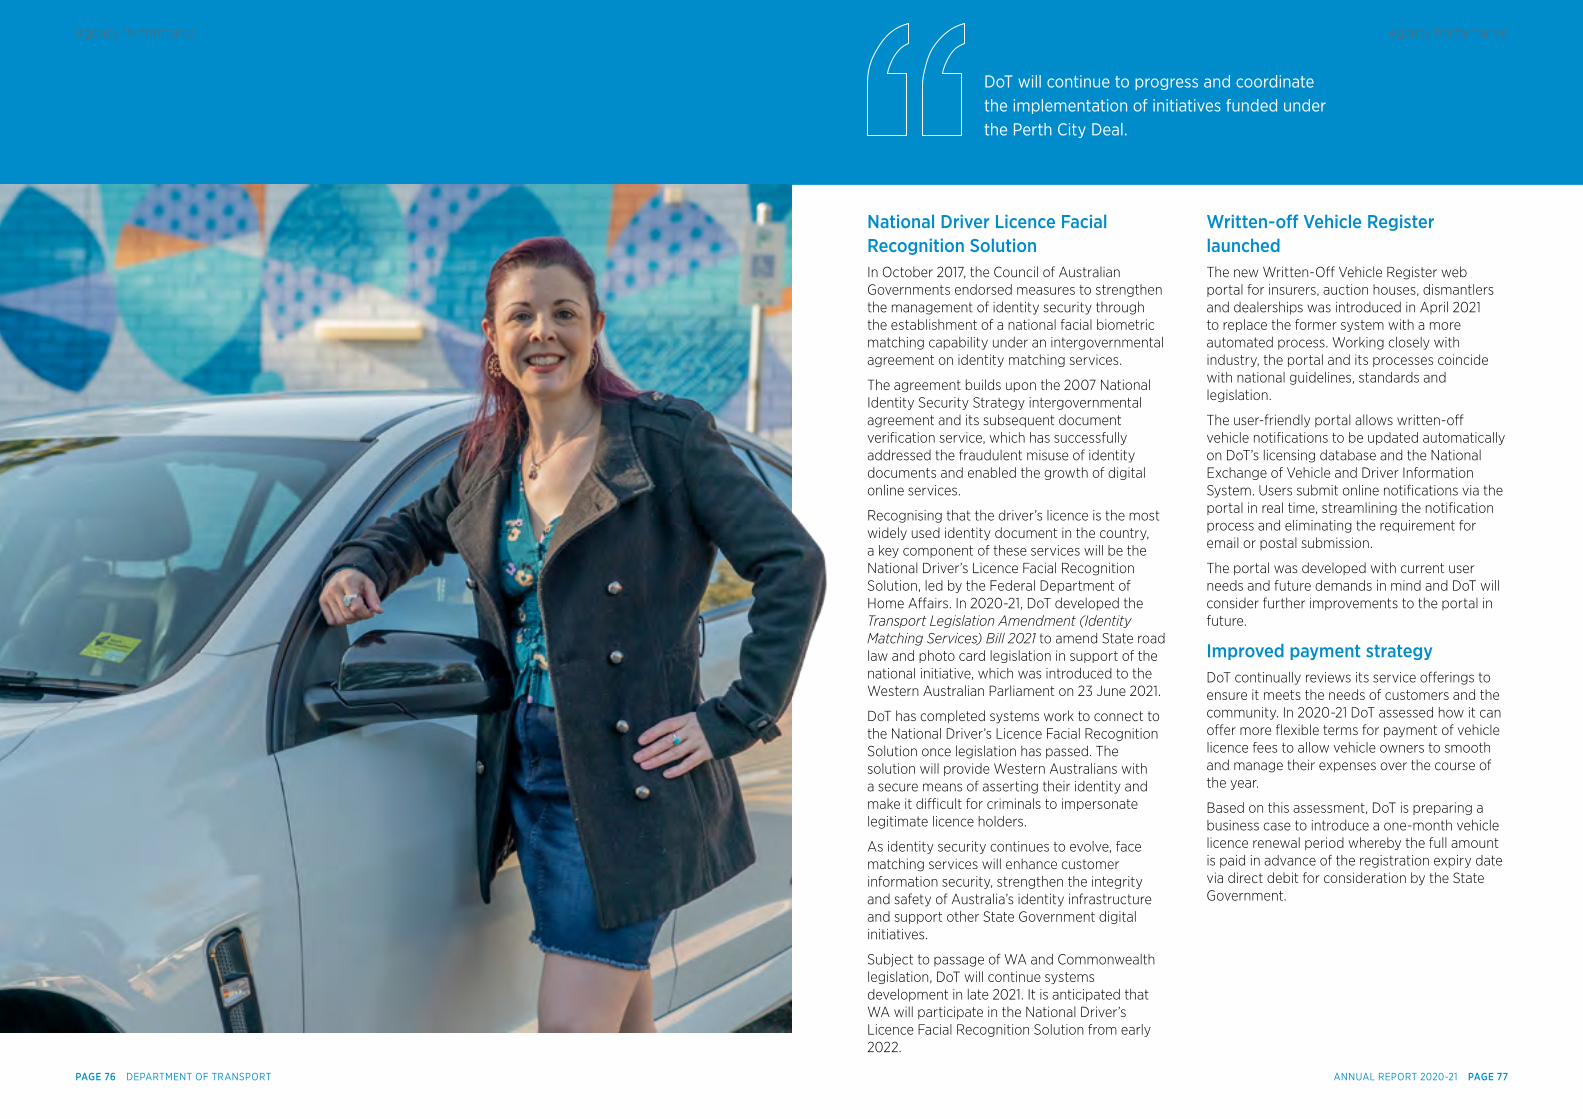
National Driver Licence Facial Recognition SolutionIn October 2017, the Council of Australian Governments endorsed measures to strengthen the management of identity security through the establishment of a national facial biometric matching capability under an intergovernmental agreement on identity matching services.
The agreement builds upon the 2007 National Identity Security Strategy intergovernmental agreement and its subsequent document verification service, which has successfully addressed the fraudulent misuse of identity documents and enabled the growth of digital online services.
Recognising that the driver’s licence is the most widely used identity document in the country, a key component of these services will be the National Driver’s Licence Facial Recognition Solution, led by the Federal Department of Home Affairs. In 2020-21, DoT developed the Transport Legislation Amendment (Identity Matching Services) Bill 2021 to amend State road law and photo card legislation in support of the national initiative, which was introduced to the Western Australian Parliament on 23 June 2021.
DoT has completed systems work to connect to the National Driver’s Licence Facial Recognition Solution once legislation has passed. The solution will provide Western Australians with a secure means of asserting their identity and make it difficult for criminals to impersonate legitimate licence holders.
As identity security continues to evolve, face matching services will enhance customer information security, strengthen the integrity and safety of Australia’s identity infrastructure and support other State Government digital initiatives.
Subject to passage of WA and Commonwealth legislation, DoT will continue systems development in late 2021. It is anticipated that WA will participate in the National Driver’s Licence Facial Recognition Solution from early 2022.
Written-of Vehicle Register launchedThe new Written-Off Vehicle Register web portal for insurers, auction houses, dismantlers and dealerships was introduced in April 2021 to replace the former system with a more automated process. Working closely with industry, the portal and its processes coincide with national guidelines, standards and legislation.
The user-friendly portal allows written-off vehicle notifications to be updated automatically on DoT’s licensing database and the National Exchange of Vehicle and Driver Information System. Users submit online notifications via the portal in real time, streamlining the notification process and eliminating the requirement for email or postal submission.
The portal was developed with current user needs and future demands in mind and DoT will consider further improvements to the portal in future.
Improved payment strategyDoT continually reviews its service offerings to ensure it meets the needs of customers and the community. In 2020-21 DoT assessed how it can offer more flexible terms for payment of vehicle licence fees to allow vehicle owners to smooth and manage their expenses over the course of the year.
Based on this assessment, DoT is preparing a business case to introduce a one-month vehicle licence renewal period whereby the full amount is paid in advance of the registration expiry date via direct debit for consideration by the State Government.
DoT will continue to progress and coordinate the implementation of initiatives funded under the Perth City Deal.
ANNUAL REPORT 2020-21 PAGE 77PAGE 76 DEPARTMENT OF TRANSPORT
Agency PerformanceAgency Performance
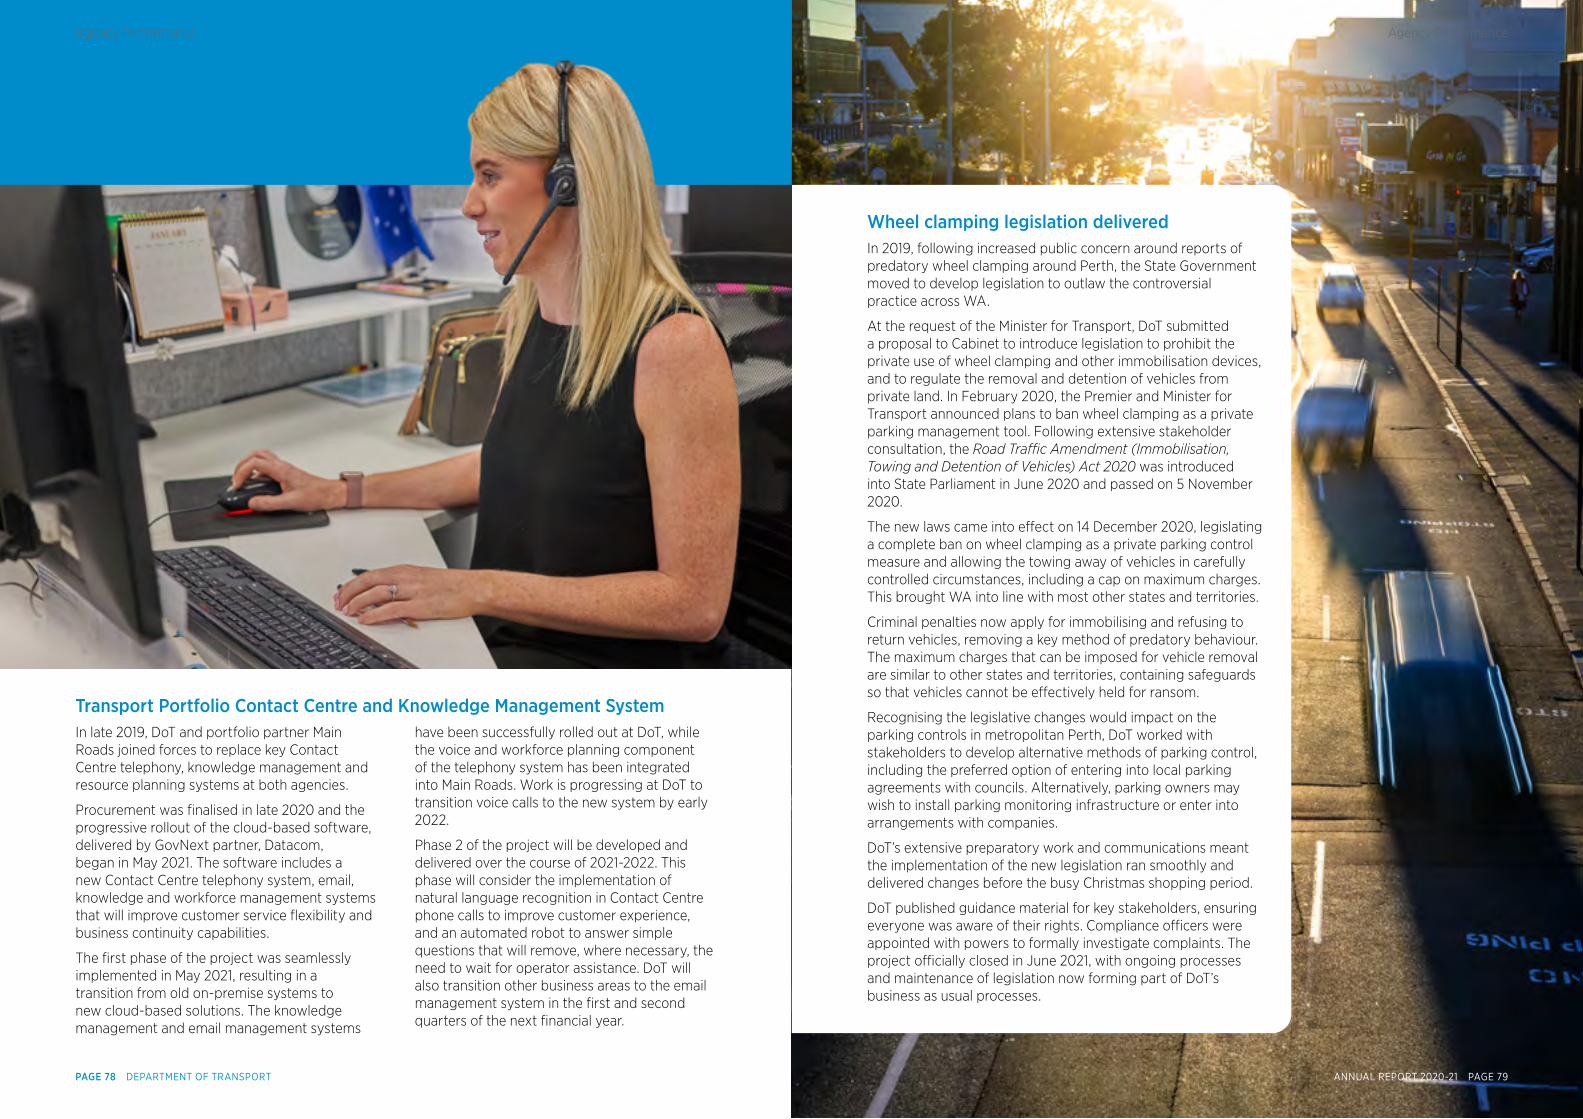
Transport Portfolio Contact Centre and Knowledge Management SystemIn late 2019, DoT and portfolio partner Main Roads joined forces to replace key Contact Centre telephony, knowledge management and resource planning systems at both agencies.
Procurement was finalised in late 2020 and the progressive rollout of the cloud-based software, delivered by GovNext partner, Datacom, began in May 2021. The software includes a new Contact Centre telephony system, email, knowledge and workforce management systems that will improve customer service flexibility and business continuity capabilities.
The first phase of the project was seamlessly implemented in May 2021, resulting in a transition from old on-premise systems to new cloud-based solutions. The knowledge management and email management systems
have been successfully rolled out at DoT, while the voice and workforce planning component of the telephony system has been integrated into Main Roads. Work is progressing at DoT to transition voice calls to the new system by early 2022.
Phase 2 of the project will be developed and delivered over the course of 2021-2022. This phase will consider the implementation of natural language recognition in Contact Centre phone calls to improve customer experience, and an automated robot to answer simple questions that will remove, where necessary, the need to wait for operator assistance. DoT will also transition other business areas to the email management system in the first and second quarters of the next financial year.
Wheel clamping legislation deliveredIn 2019, following increased public concern around reports of predatory wheel clamping around Perth, the State Government moved to develop legislation to outlaw the controversial practice across WA.
At the request of the Minister for Transport, DoT submitted a proposal to Cabinet to introduce legislation to prohibit the private use of wheel clamping and other immobilisation devices, and to regulate the removal and detention of vehicles from private land. In February 2020, the Premier and Minister for Transport announced plans to ban wheel clamping as a private parking management tool. Following extensive stakeholder consultation, the Road Traffic Amendment (Immobilisation, Towing and Detention of Vehicles) Act 2020 was introduced into State Parliament in June 2020 and passed on 5 November 2020.
The new laws came into effect on 14 December 2020, legislating a complete ban on wheel clamping as a private parking control measure and allowing the towing away of vehicles in carefully controlled circumstances, including a cap on maximum charges. This brought WA into line with most other states and territories.
Criminal penalties now apply for immobilising and refusing to return vehicles, removing a key method of predatory behaviour. The maximum charges that can be imposed for vehicle removal are similar to other states and territories, containing safeguards so that vehicles cannot be effectively held for ransom.
Recognising the legislative changes would impact on the parking controls in metropolitan Perth, DoT worked with stakeholders to develop alternative methods of parking control, including the preferred option of entering into local parking agreements with councils. Alternatively, parking owners may wish to install parking monitoring infrastructure or enter into arrangements with companies.
DoT’s extensive preparatory work and communications meant the implementation of the new legislation ran smoothly and delivered changes before the busy Christmas shopping period.
DoT published guidance material for key stakeholders, ensuring everyone was aware of their rights. Compliance officers were appointed with powers to formally investigate complaints. The project officially closed in June 2021, with ongoing processes and maintenance of legislation now forming part of DoT’s business as usual processes.
ANNUAL REPORT 2020-21 PAGE 79PAGE 78 DEPARTMENT OF TRANSPORT
Agency PerformanceAgency Performance
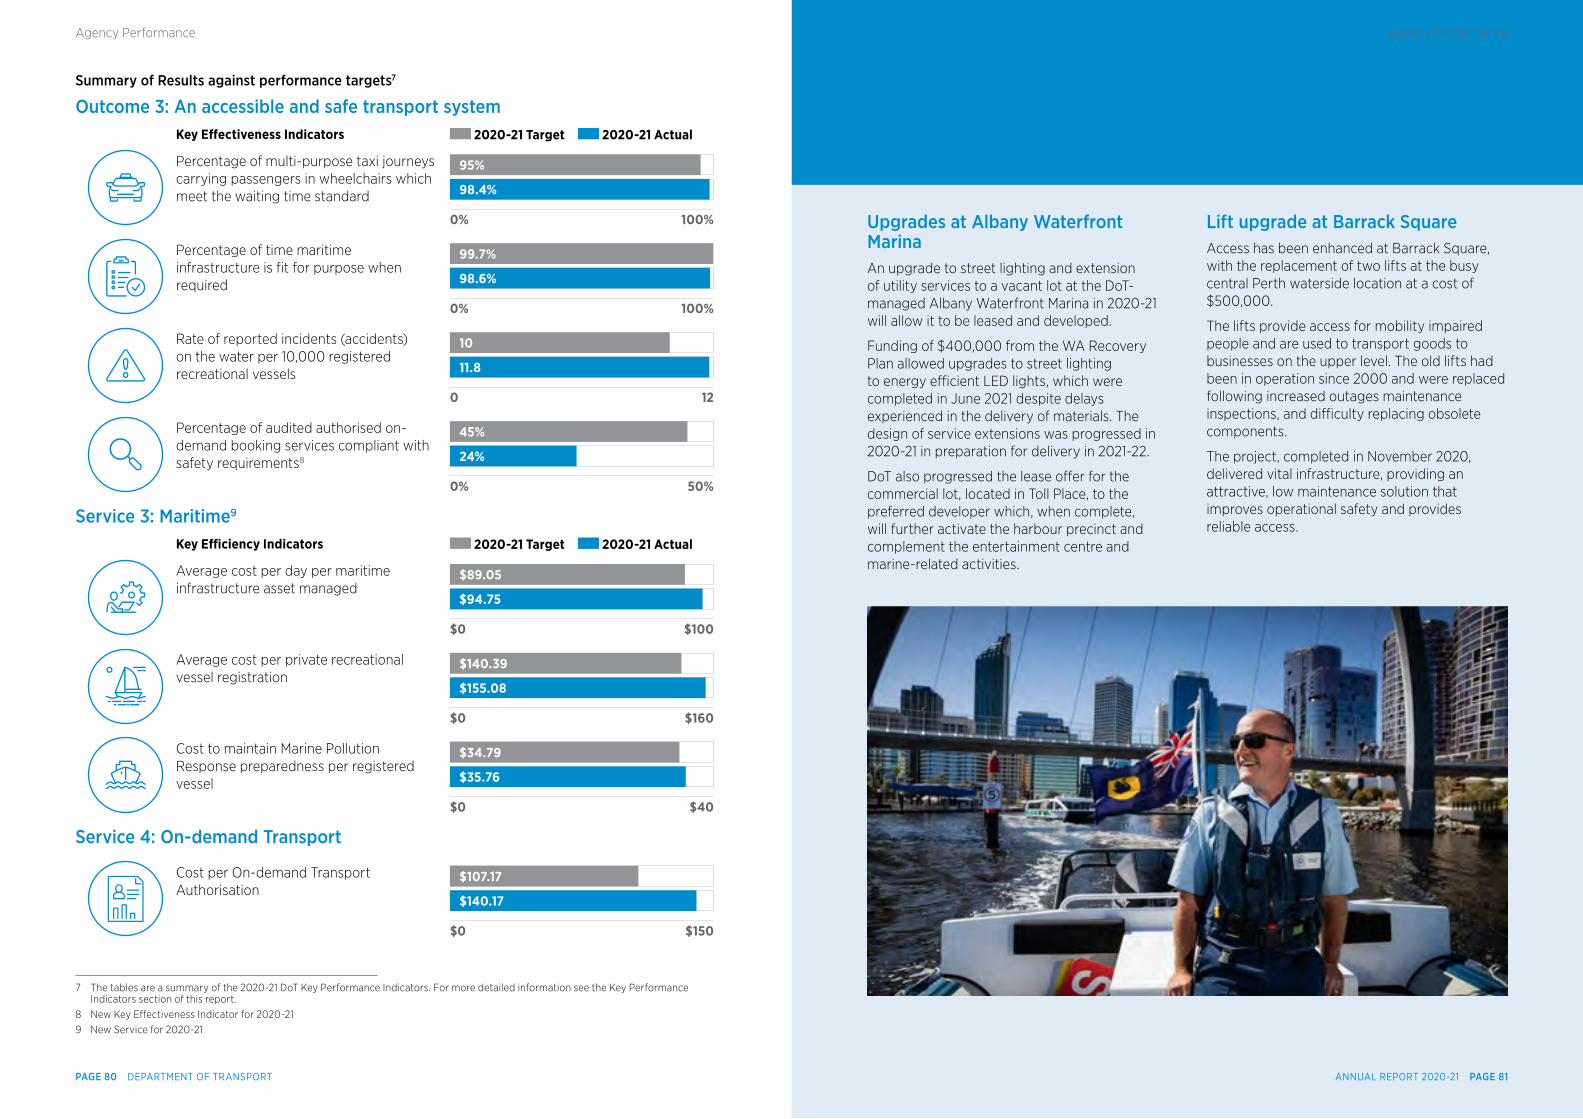
Summary of Results against performance targets7
Outcome 3: An accessible and safe transport systemKey Effectiveness Indicators 2020-21 Target 2020-21 Actual
Percentage of multi-purpose taxi journeys carrying passengers in wheelchairs which meet the waiting time standard
100%0%
95%
98.4%
Percentage of time maritime infrastructure is fit for purpose when required
100%0%
99.7%
98.6%
Rate of reported incidents (accidents) on the water per 10,000 registered recreational vessels
120
10
11.8
Percentage of audited authorised on-demand booking services compliant with safety requirements8
50%0%
45%
24%
Service 3: Maritime9
Key Efficiency Indicators 2020-21 Target 2020-21 Actual
Average cost per day per maritime infrastructure asset managed
$100$0
$89.05
$94.75
Average cost per private recreational vessel registration
$160$0
$140.39
$155.08
Cost to maintain Marine Pollution Response preparedness per registered vessel
$40$0
$34.79
$35.76
Service 4: On-demand Transport
Cost per On-demand Transport Authorisation
$150$0
$107.17
$140.17
7 The tables are a summary of the 2020-21 DoT Key Performance Indicators. For more detailed information see the Key Performance Indicators section of this report.
8 New Key Effectiveness Indicator for 2020-219 New Service for 2020-21
Upgrades at Albany Waterfront MarinaAn upgrade to street lighting and extension of utility services to a vacant lot at the DoT-managed Albany Waterfront Marina in 2020-21 will allow it to be leased and developed.
Funding of $400,000 from the WA Recovery Plan allowed upgrades to street lighting to energy efficient LED lights, which were completed in June 2021 despite delays experienced in the delivery of materials. The design of service extensions was progressed in 2020-21 in preparation for delivery in 2021-22.
DoT also progressed the lease offer for the commercial lot, located in Toll Place, to the preferred developer which, when complete, will further activate the harbour precinct and complement the entertainment centre and marine-related activities.
Lift upgrade at Barrack Square Access has been enhanced at Barrack Square, with the replacement of two lifts at the busy central Perth waterside location at a cost of $500,000.
The lifts provide access for mobility impaired people and are used to transport goods to businesses on the upper level. The old lifts had been in operation since 2000 and were replaced following increased outages maintenance inspections, and difficulty replacing obsolete components.
The project, completed in November 2020, delivered vital infrastructure, providing an attractive, low maintenance solution that improves operational safety and provides reliable access.
ANNUAL REPORT 2020-21 PAGE 81PAGE 80 DEPARTMENT OF TRANSPORT
Agency PerformanceAgency Performance
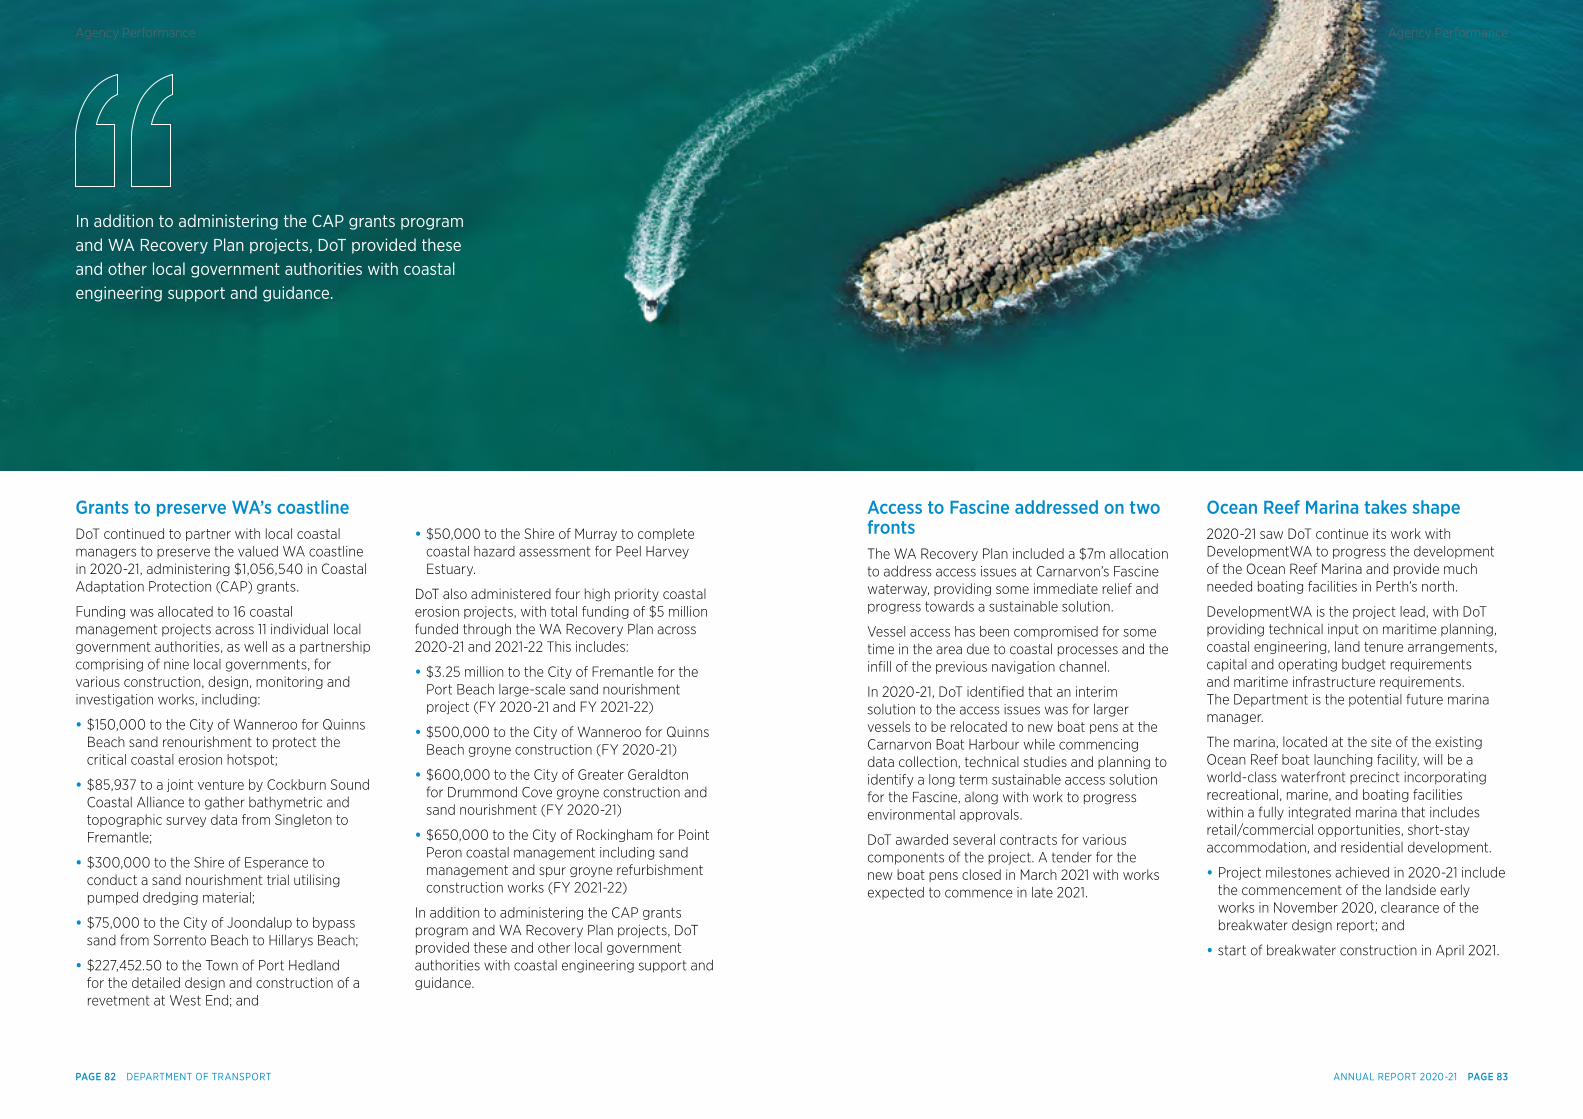
Grants to preserve WA’s coastlineDoT continued to partner with local coastal managers to preserve the valued WA coastline in 2020-21, administering $1,056,540 in Coastal Adaptation Protection (CAP) grants.
Funding was allocated to 16 coastal management projects across 11 individual local government authorities, as well as a partnership comprising of nine local governments, for various construction, design, monitoring and investigation works, including:
• $150,000 to the City of Wanneroo for Quinns Beach sand renourishment to protect the critical coastal erosion hotspot;
• $85,937 to a joint venture by Cockburn Sound Coastal Alliance to gather bathymetric and topographic survey data from Singleton to Fremantle;
• $300,000 to the Shire of Esperance to conduct a sand nourishment trial utilising pumped dredging material;
• $75,000 to the City of Joondalup to bypass sand from Sorrento Beach to Hillarys Beach;
• $227,452.50 to the Town of Port Hedland for the detailed design and construction of a revetment at West End; and
• $50,000 to the Shire of Murray to complete coastal hazard assessment for Peel Harvey Estuary.
DoT also administered four high priority coastal erosion projects, with total funding of $5 million funded through the WA Recovery Plan across 2020-21 and 2021-22 This includes:
• $3.25 million to the City of Fremantle for the Port Beach large-scale sand nourishment project (FY 2020-21 and FY 2021-22)
• $500,000 to the City of Wanneroo for Quinns Beach groyne construction (FY 2020-21)
• $600,000 to the City of Greater Geraldton for Drummond Cove groyne construction and sand nourishment (FY 2020-21)
• $650,000 to the City of Rockingham for Point Peron coastal management including sand management and spur groyne refurbishment construction works (FY 2021-22)
In addition to administering the CAP grants program and WA Recovery Plan projects, DoT provided these and other local government authorities with coastal engineering support and guidance.
Access to Fascine addressed on two frontsThe WA Recovery Plan included a $7m allocation to address access issues at Carnarvon’s Fascine waterway, providing some immediate relief and progress towards a sustainable solution.
Vessel access has been compromised for some time in the area due to coastal processes and the infill of the previous navigation channel.
In 2020-21, DoT identified that an interim solution to the access issues was for larger vessels to be relocated to new boat pens at the Carnarvon Boat Harbour while commencing data collection, technical studies and planning to identify a long term sustainable access solution for the Fascine, along with work to progress environmental approvals.
DoT awarded several contracts for various components of the project. A tender for the new boat pens closed in March 2021 with works expected to commence in late 2021.
Ocean Reef Marina takes shape2020-21 saw DoT continue its work with DevelopmentWA to progress the development of the Ocean Reef Marina and provide much needed boating facilities in Perth’s north.
DevelopmentWA is the project lead, with DoT providing technical input on maritime planning, coastal engineering, land tenure arrangements, capital and operating budget requirements and maritime infrastructure requirements. The Department is the potential future marina manager.
The marina, located at the site of the existing Ocean Reef boat launching facility, will be a world-class waterfront precinct incorporating recreational, marine, and boating facilities within a fully integrated marina that includes retail/commercial opportunities, short-stay accommodation, and residential development.
• Project milestones achieved in 2020-21 include the commencement of the landside early works in November 2020, clearance of the breakwater design report; and
• start of breakwater construction in April 2021.
In addition to administering the CAP grants program and WA Recovery Plan projects, DoT provided these and other local government authorities with coastal engineering support and guidance.
ANNUAL REPORT 2020-21 PAGE 83PAGE 82 DEPARTMENT OF TRANSPORT
Agency PerformanceAgency Performance
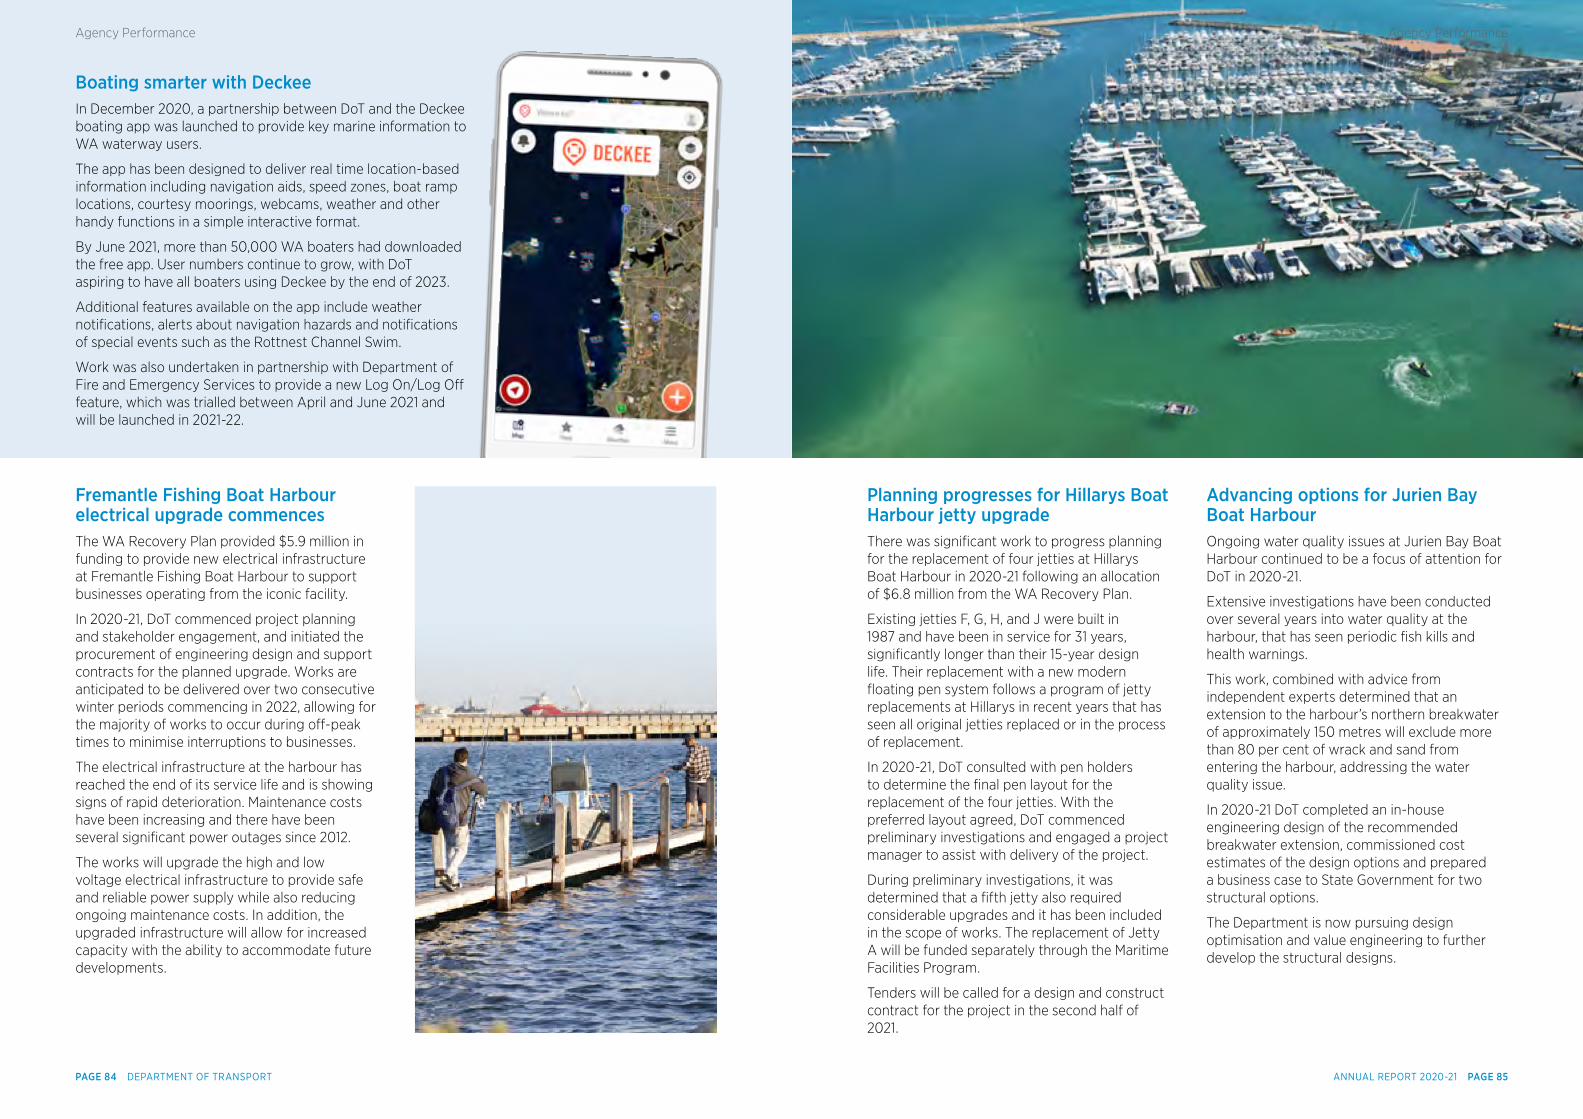
Boating smarter with DeckeeIn December 2020, a partnership between DoT and the Deckee boating app was launched to provide key marine information to WA waterway users.
The app has been designed to deliver real time location-based information including navigation aids, speed zones, boat ramp locations, courtesy moorings, webcams, weather and other handy functions in a simple interactive format.
By June 2021, more than 50,000 WA boaters had downloaded the free app. User numbers continue to grow, with DoT aspiring to have all boaters using Deckee by the end of 2023.
Additional features available on the app include weather notifications, alerts about navigation hazards and notifications of special events such as the Rottnest Channel Swim.
Work was also undertaken in partnership with Department of Fire and Emergency Services to provide a new Log On/Log Off feature, which was trialled between April and June 2021 and will be launched in 2021-22.
Planning progresses for Hillarys Boat Harbour jetty upgradeThere was significant work to progress planning for the replacement of four jetties at Hillarys Boat Harbour in 2020-21 following an allocation of $6.8 million from the WA Recovery Plan.
Existing jetties F, G, H, and J were built in 1987 and have been in service for 31 years, significantly longer than their 15-year design life. Their replacement with a new modern floating pen system follows a program of jetty replacements at Hillarys in recent years that has seen all original jetties replaced or in the process of replacement.
In 2020-21, DoT consulted with pen holders to determine the final pen layout for the replacement of the four jetties. With the preferred layout agreed, DoT commenced preliminary investigations and engaged a project manager to assist with delivery of the project.
During preliminary investigations, it was determined that a fifth jetty also required considerable upgrades and it has been included in the scope of works. The replacement of Jetty A will be funded separately through the Maritime Facilities Program.
Tenders will be called for a design and construct contract for the project in the second half of 2021.
Advancing options for Jurien Bay Boat HarbourOngoing water quality issues at Jurien Bay Boat Harbour continued to be a focus of attention for DoT in 2020-21.
Extensive investigations have been conducted over several years into water quality at the harbour, that has seen periodic fish kills and health warnings.
This work, combined with advice from independent experts determined that an extension to the harbour’s northern breakwater of approximately 150 metres will exclude more than 80 per cent of wrack and sand from entering the harbour, addressing the water quality issue.
In 2020-21 DoT completed an in-house engineering design of the recommended breakwater extension, commissioned cost estimates of the design options and prepared a business case to State Government for two structural options.
The Department is now pursuing design optimisation and value engineering to further develop the structural designs.
Fremantle Fishing Boat Harbour electrical upgrade commencesThe WA Recovery Plan provided $5.9 million in funding to provide new electrical infrastructure at Fremantle Fishing Boat Harbour to support businesses operating from the iconic facility.
In 2020-21, DoT commenced project planning and stakeholder engagement, and initiated the procurement of engineering design and support contracts for the planned upgrade. Works are anticipated to be delivered over two consecutive winter periods commencing in 2022, allowing for the majority of works to occur during off-peak times to minimise interruptions to businesses.
The electrical infrastructure at the harbour has reached the end of its service life and is showing signs of rapid deterioration. Maintenance costs have been increasing and there have been several significant power outages since 2012.
The works will upgrade the high and low voltage electrical infrastructure to provide safe and reliable power supply while also reducing ongoing maintenance costs. In addition, the upgraded infrastructure will allow for increased capacity with the ability to accommodate future developments.
ANNUAL REPORT 2020-21 PAGE 85PAGE 84 DEPARTMENT OF TRANSPORT
Agency PerformanceAgency Performance
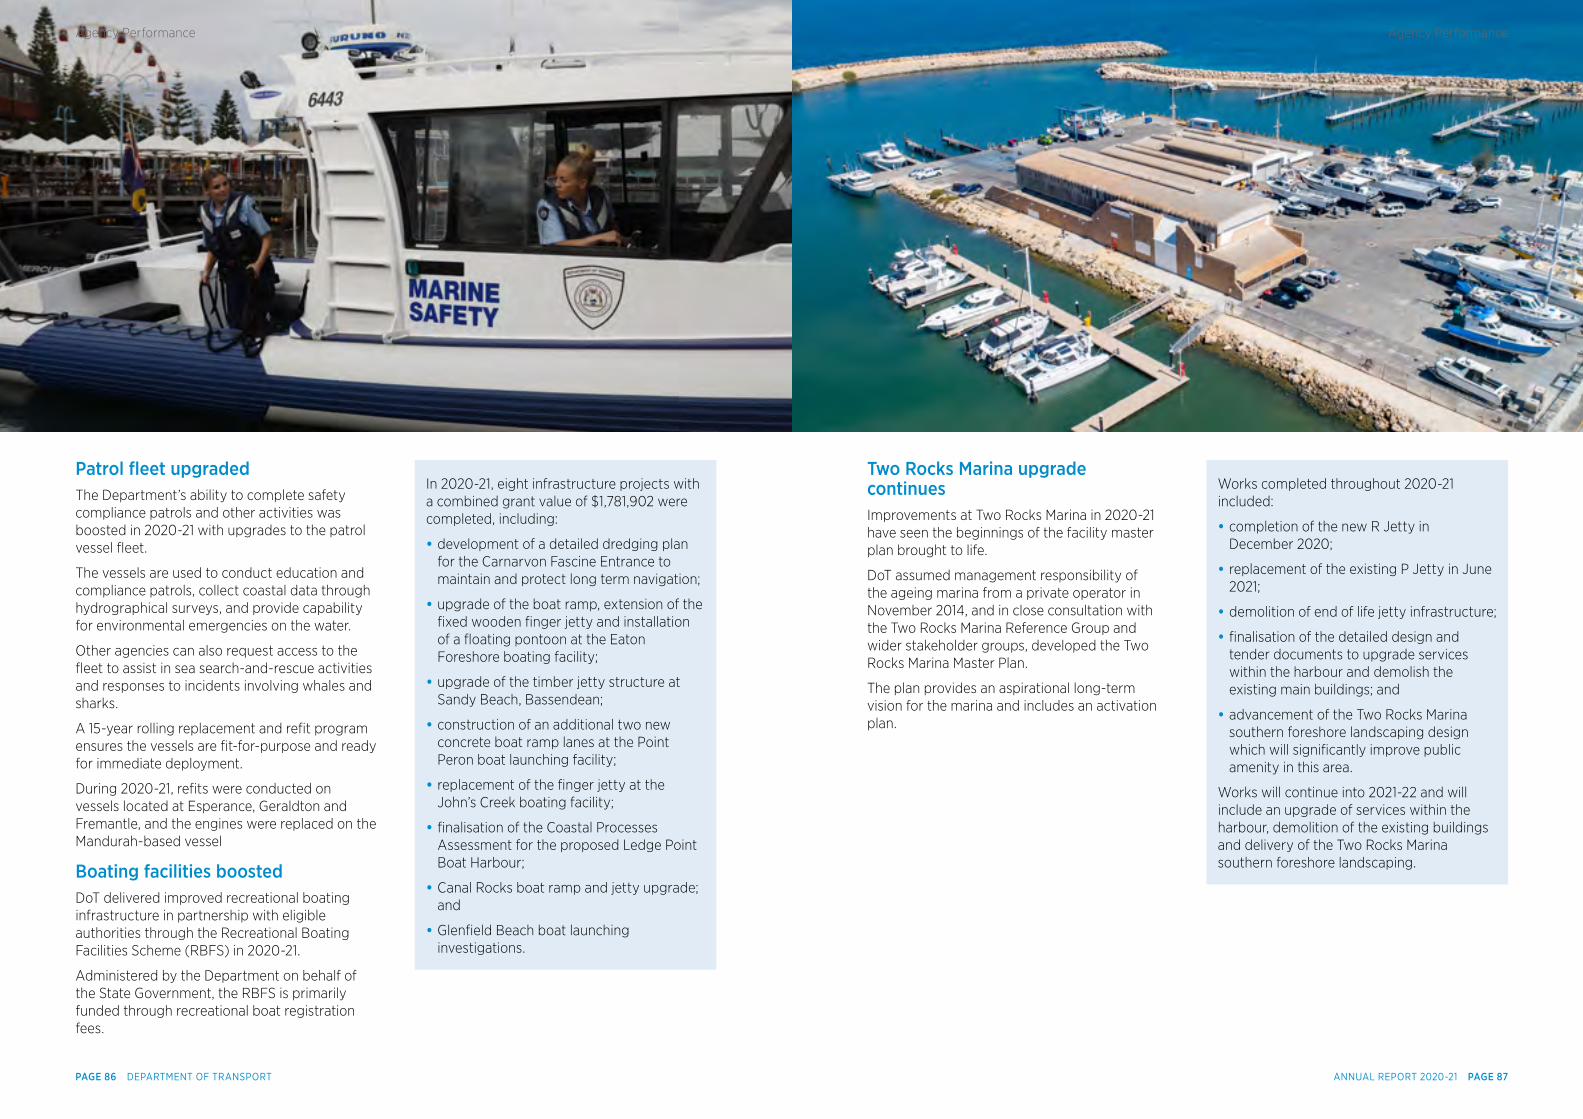
Patrol feet upgradedThe Department’s ability to complete safety compliance patrols and other activities was boosted in 2020-21 with upgrades to the patrol vessel fleet.
The vessels are used to conduct education and compliance patrols, collect coastal data through hydrographical surveys, and provide capability for environmental emergencies on the water.
Other agencies can also request access to the fleet to assist in sea search-and-rescue activities and responses to incidents involving whales and sharks.
A 15-year rolling replacement and refit program ensures the vessels are fit-for-purpose and ready for immediate deployment.
During 2020-21, refits were conducted on vessels located at Esperance, Geraldton and Fremantle, and the engines were replaced on the Mandurah-based vessel
Boating facilities boostedDoT delivered improved recreational boating infrastructure in partnership with eligible authorities through the Recreational Boating Facilities Scheme (RBFS) in 2020-21.
Administered by the Department on behalf of the State Government, the RBFS is primarily funded through recreational boat registration fees.
Two Rocks Marina upgrade continuesImprovements at Two Rocks Marina in 2020-21 have seen the beginnings of the facility master plan brought to life.
DoT assumed management responsibility of the ageing marina from a private operator in November 2014, and in close consultation with the Two Rocks Marina Reference Group and wider stakeholder groups, developed the Two Rocks Marina Master Plan.
The plan provides an aspirational long-term vision for the marina and includes an activation plan.
In 2020-21, eight infrastructure projects with a combined grant value of $1,781,902 were completed, including:
• development of a detailed dredging plan for the Carnarvon Fascine Entrance to maintain and protect long term navigation;
• upgrade of the boat ramp, extension of the fixed wooden finger jetty and installation of a floating pontoon at the Eaton Foreshore boating facility;
• upgrade of the timber jetty structure at Sandy Beach, Bassendean;
• construction of an additional two new concrete boat ramp lanes at the Point Peron boat launching facility;
• replacement of the finger jetty at the John’s Creek boating facility;
• finalisation of the Coastal Processes Assessment for the proposed Ledge Point Boat Harbour;
• Canal Rocks boat ramp and jetty upgrade; and
• Glenfield Beach boat launching investigations.
Works completed throughout 2020-21 included:
• completion of the new R Jetty in December 2020;
• replacement of the existing P Jetty in June 2021;
• demolition of end of life jetty infrastructure;
• finalisation of the detailed design and tender documents to upgrade services within the harbour and demolish the existing main buildings; and
• advancement of the Two Rocks Marina southern foreshore landscaping design which will significantly improve public amenity in this area.
Works will continue into 2021-22 and will include an upgrade of services within the harbour, demolition of the existing buildings and delivery of the Two Rocks Marina southern foreshore landscaping.
ANNUAL REPORT 2020-21 PAGE 87PAGE 86 DEPARTMENT OF TRANSPORT
Agency PerformanceAgency Performance
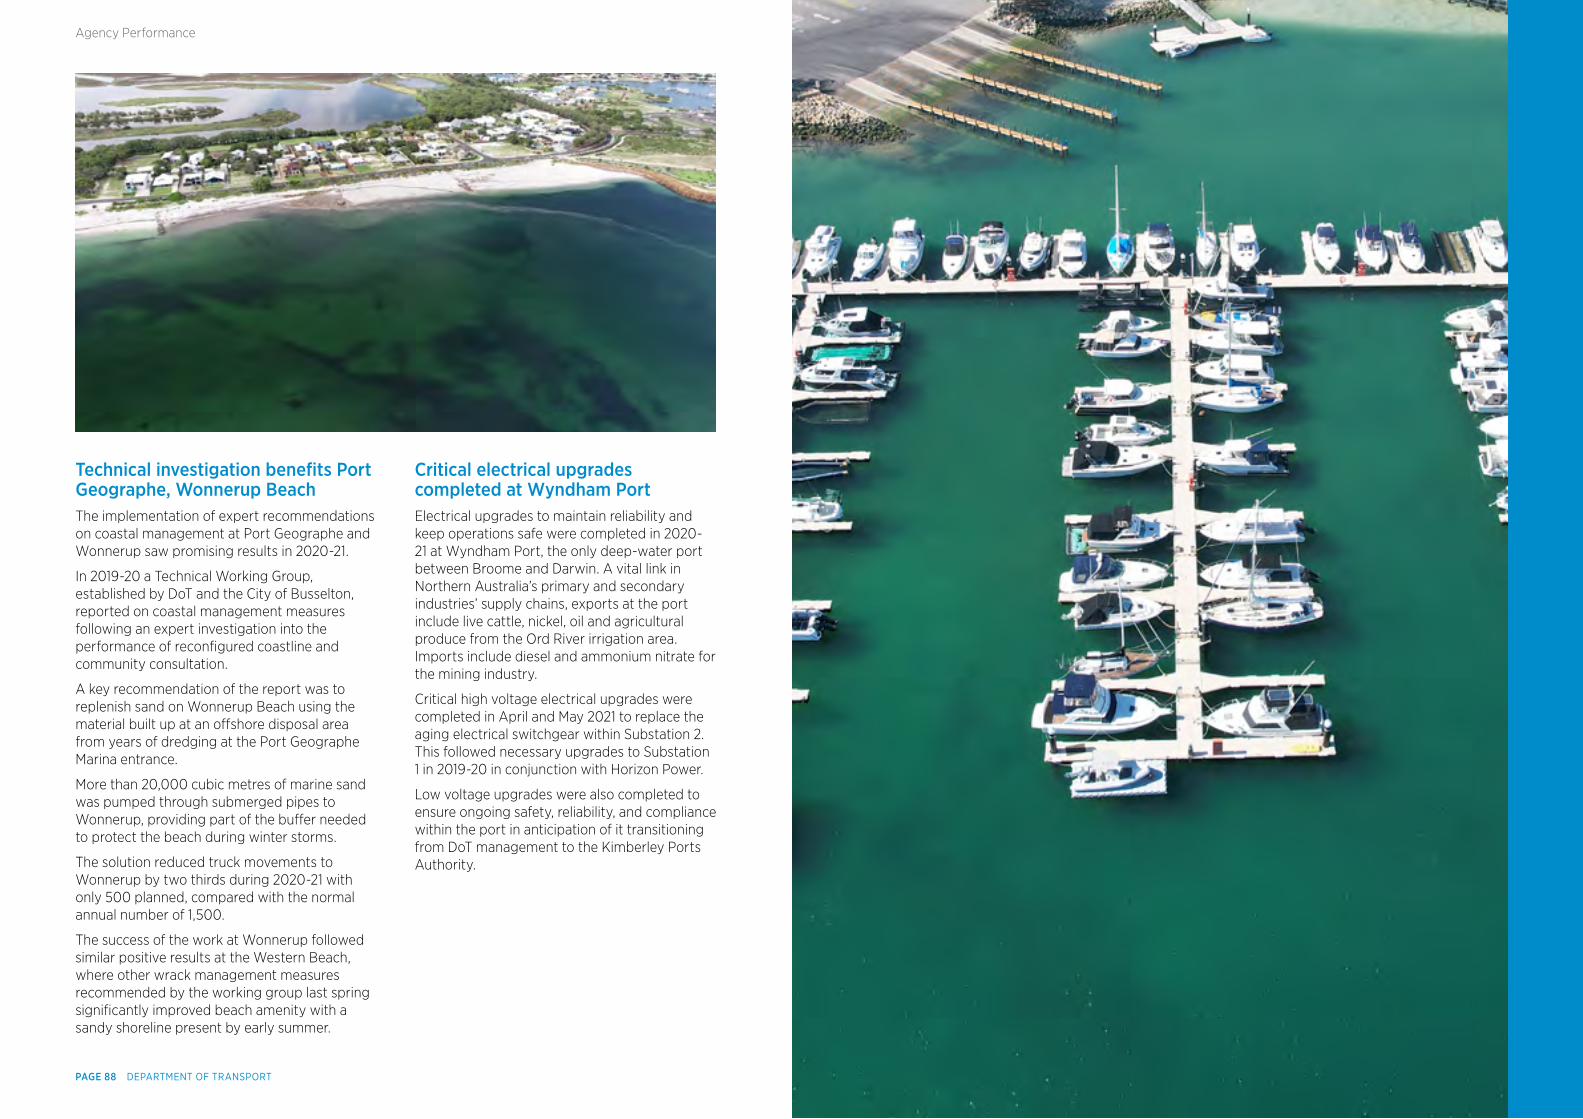
Technical investigation benefts Port Geographe, Wonnerup BeachThe implementation of expert recommendations on coastal management at Port Geographe and Wonnerup saw promising results in 2020-21.
In 2019-20 a Technical Working Group, established by DoT and the City of Busselton, reported on coastal management measures following an expert investigation into the performance of reconfigured coastline and community consultation.
A key recommendation of the report was to replenish sand on Wonnerup Beach using the material built up at an offshore disposal area from years of dredging at the Port Geographe Marina entrance.
More than 20,000 cubic metres of marine sand was pumped through submerged pipes to Wonnerup, providing part of the buffer needed to protect the beach during winter storms.
The solution reduced truck movements to Wonnerup by two thirds during 2020-21 with only 500 planned, compared with the normal annual number of 1,500.
The success of the work at Wonnerup followed similar positive results at the Western Beach, where other wrack management measures recommended by the working group last spring significantly improved beach amenity with a sandy shoreline present by early summer.
Critical electrical upgrades completed at Wyndham PortElectrical upgrades to maintain reliability and keep operations safe were completed in 2020-21 at Wyndham Port, the only deep-water port between Broome and Darwin. A vital link in Northern Australia’s primary and secondary industries’ supply chains, exports at the port include live cattle, nickel, oil and agricultural produce from the Ord River irrigation area. Imports include diesel and ammonium nitrate for the mining industry.
Critical high voltage electrical upgrades were completed in April and May 2021 to replace the aging electrical switchgear within Substation 2. This followed necessary upgrades to Substation 1 in 2019-20 in conjunction with Horizon Power.
Low voltage upgrades were also completed to ensure ongoing safety, reliability, and compliance within the port in anticipation of it transitioning from DoT management to the Kimberley Ports Authority.
PAGE 88 DEPARTMENT OF TRANSPORT
Agency Performance
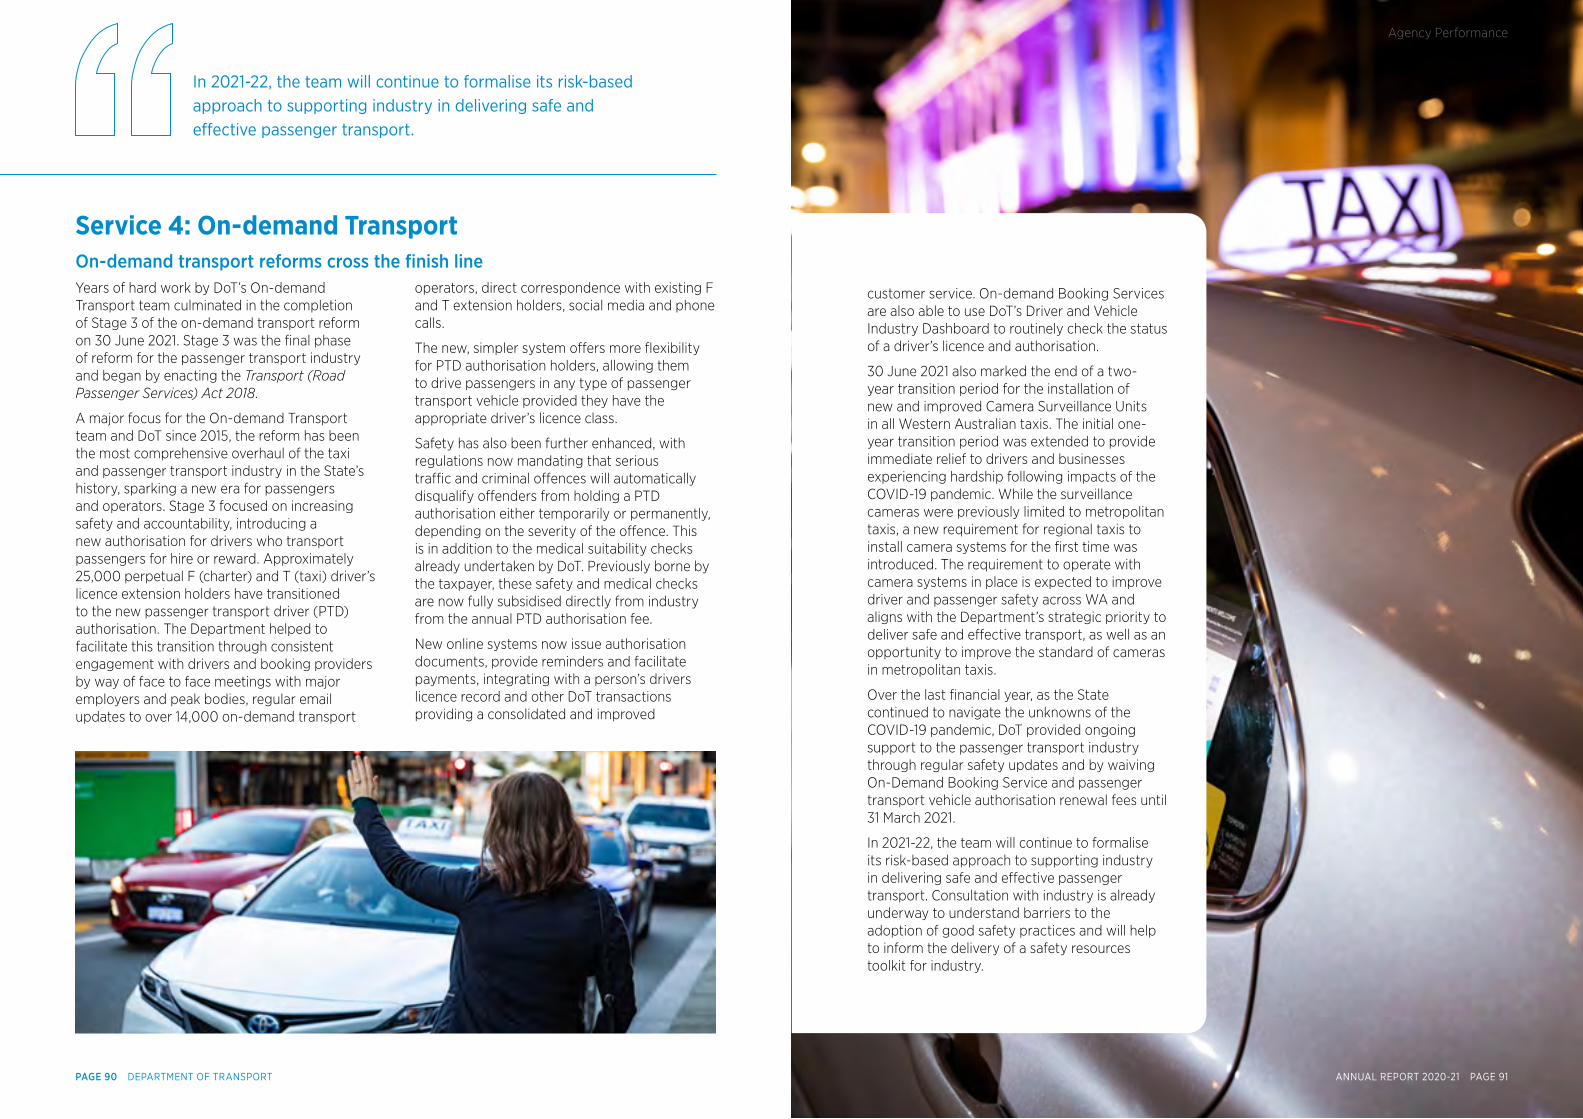
Service 4: On-demand TransportOn-demand transport reforms cross the fnish lineYears of hard work by DoT’s On-demand Transport team culminated in the completion of Stage 3 of the on-demand transport reform on 30 June 2021. Stage 3 was the final phase of reform for the passenger transport industry and began by enacting the Transport (Road Passenger Services) Act 2018.
A major focus for the On-demand Transport team and DoT since 2015, the reform has been the most comprehensive overhaul of the taxi and passenger transport industry in the State’s history, sparking a new era for passengers and operators. Stage 3 focused on increasing safety and accountability, introducing a new authorisation for drivers who transport passengers for hire or reward. Approximately 25,000 perpetual F (charter) and T (taxi) driver’s licence extension holders have transitioned to the new passenger transport driver (PTD) authorisation. The Department helped to facilitate this transition through consistent engagement with drivers and booking providers by way of face to face meetings with major employers and peak bodies, regular email updates to over 14,000 on-demand transport
operators, direct correspondence with existing F and T extension holders, social media and phone calls.
The new, simpler system offers more flexibility for PTD authorisation holders, allowing them to drive passengers in any type of passenger transport vehicle provided they have the appropriate driver’s licence class.
Safety has also been further enhanced, with regulations now mandating that serious traffic and criminal offences will automatically disqualify offenders from holding a PTD authorisation either temporarily or permanently, depending on the severity of the offence. This is in addition to the medical suitability checks already undertaken by DoT. Previously borne by the taxpayer, these safety and medical checks are now fully subsidised directly from industry from the annual PTD authorisation fee.
New online systems now issue authorisation documents, provide reminders and facilitate payments, integrating with a person’s drivers licence record and other DoT transactions providing a consolidated and improved
customer service. On-demand Booking Services are also able to use DoT’s Driver and Vehicle Industry Dashboard to routinely check the status of a driver’s licence and authorisation.
30 June 2021 also marked the end of a two-year transition period for the installation of new and improved Camera Surveillance Units in all Western Australian taxis. The initial one-year transition period was extended to provide immediate relief to drivers and businesses experiencing hardship following impacts of the COVID-19 pandemic. While the surveillance cameras were previously limited to metropolitan taxis, a new requirement for regional taxis to install camera systems for the first time was introduced. The requirement to operate with camera systems in place is expected to improve driver and passenger safety across WA and aligns with the Department’s strategic priority to deliver safe and effective transport, as well as an opportunity to improve the standard of cameras in metropolitan taxis.
Over the last financial year, as the State continued to navigate the unknowns of the COVID-19 pandemic, DoT provided ongoing support to the passenger transport industry through regular safety updates and by waiving On-Demand Booking Service and passenger transport vehicle authorisation renewal fees until 31 March 2021.
In 2021-22, the team will continue to formalise its risk-based approach to supporting industry in delivering safe and effective passenger transport. Consultation with industry is already underway to understand barriers to the adoption of good safety practices and will help to inform the delivery of a safety resources toolkit for industry.
In 2021-22, the team will continue to formalise its risk-based approach to supporting industry in delivering safe and effective passenger transport.
ANNUAL REPORT 2020-21 PAGE 91PAGE 90 DEPARTMENT OF TRANSPORT
Agency Performance
Actual Financial Results Versus Budget TargetsThe following table provides a comparison of the financial targets and outcomes against criteria included in the Resource Agreement between the Director General – Transport, the Minister for Transport and the State Treasurer.
2020-21 Actual Results versus Budget Targets2020-21
Target2020-21
Actual Variation
Total cost of services ($’000) 477,568 439,984 -37,584 Note 1
Net cost of services ($’000) 187,233 123,486 -63,747 Note 2
Total equity ($’000) 987,764 1,037,972 50,208 Note 3
Net increase/(decrease) in cash held ($’000) 14,780 72,001 57,221 Note 4
Approved full time equivalent (FTE) 1,413 1,461 48 Note 5
Notes
These notes should be read in conjunction with the Explanatory Statement to the Financial Statements on page 106.
Note 1: Total cost of services
The total cost of services actual was lower than the budget target mainly due to reduced operating activities and delay in various projects arising from COVID-19. The Department has carried over some costs to next financial year.
Note 2: Net cost of services
Decrease to net cost of services resulted from reduced operating activities, delay in various projects and increase in fees and charges mainly from the sale of optional plates and driver licence applications.
Note 3: Total equity
The increase is attributed to a combination of the increase in net cost of services ($63.4 million) and increased service appropriations received (10.3 million).
Note 4: Net increase/(decrease) in cash held
The net increase is attributed to a combination of reduced costs ($37.0 million) and higher than anticipated user fees ($20.5 million). The reduced costs (explained in detail within the income statement narratives) are largely associated with project delays from COVID-19. The increased user fees collected relate to motor driver licence fees and optional plate sales.
Note 5: Approved full-time equivalents (FTE)
The actual paid FTE is higher than the target, mainly due to operating the COVID-19 Information Call Centre.
Disclosures and Legal Compliance
PAGE 92 DEPARTMENT OF TRANSPORT
Agency Performance
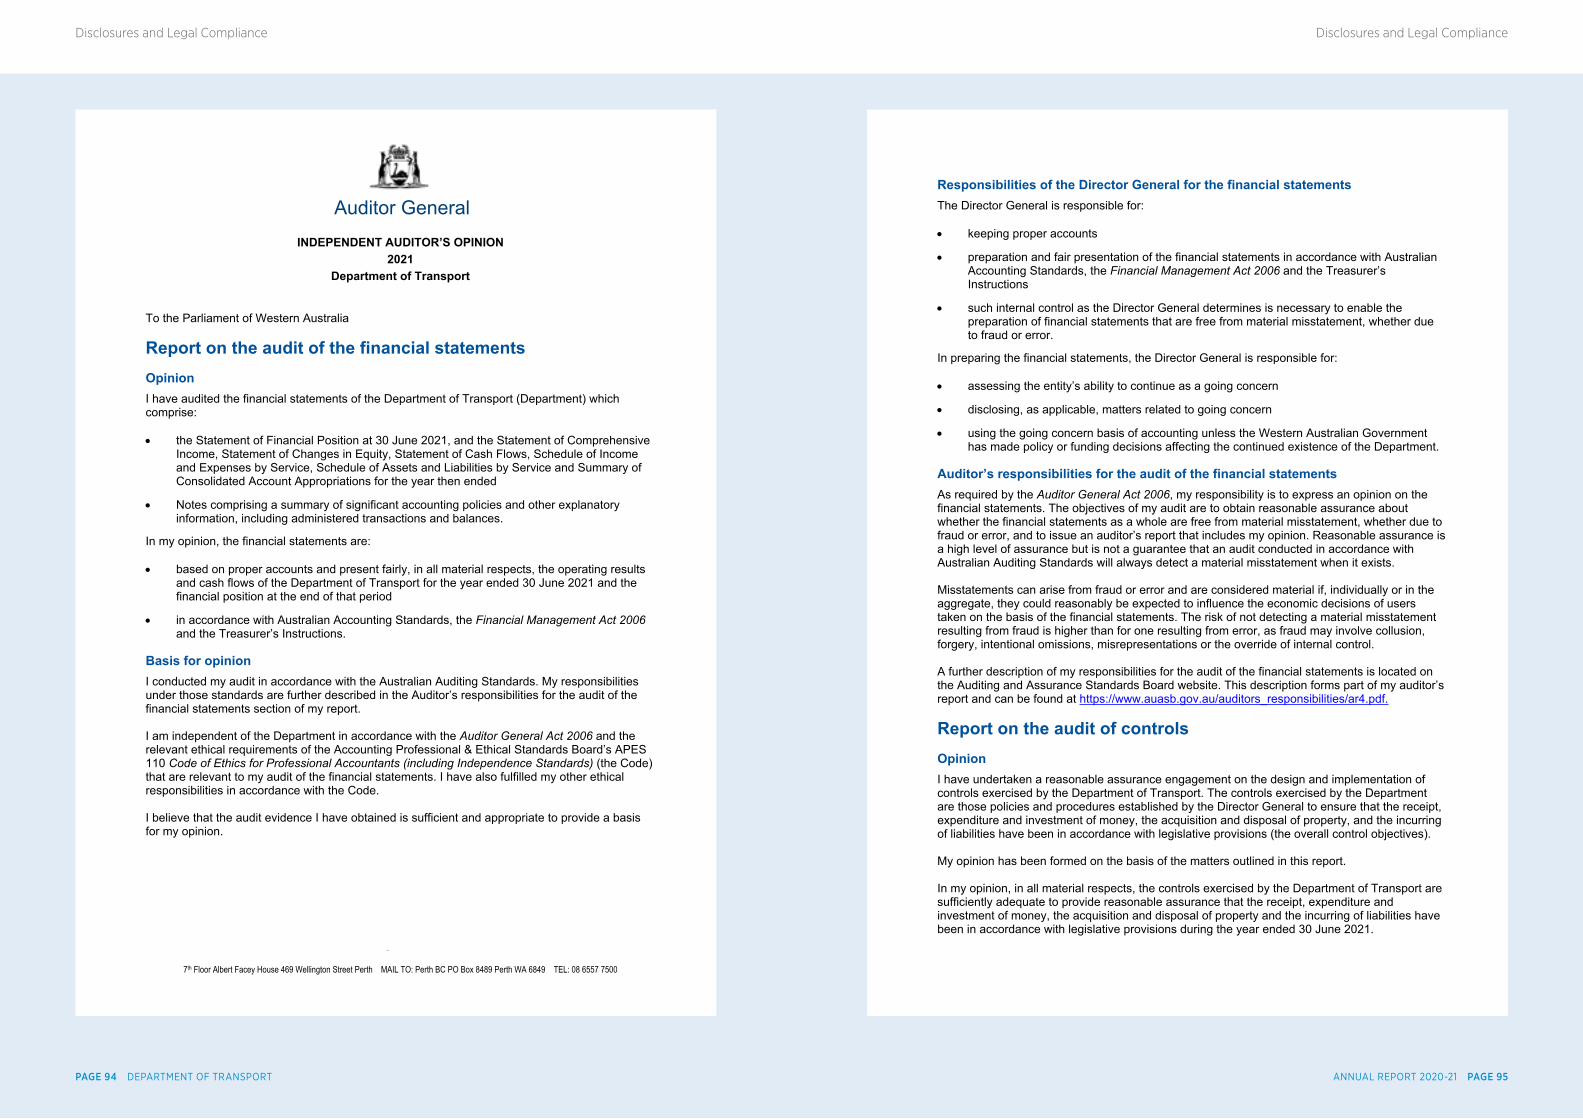
Auditor General
Page 1 of 5
7th Floor Albert Facey House 469 Wellington Street Perth MAIL TO: Perth BC PO Box 8489 Perth WA 6849 TEL: 08 6557 7500
INDEPENDENT AUDITOR’S OPINION2021
Department of Transport
To the Parliament of Western Australia
Report on the audit of the financial statementsOpinionI have audited the financial statements of the Department of Transport (Department) which comprise:
the Statement of Financial Position at 30 June 2021, and the Statement of Comprehensive Income, Statement of Changes in Equity, Statement of Cash Flows, Schedule of Income and Expenses by Service, Schedule of Assets and Liabilities by Service and Summary of Consolidated Account Appropriations for the year then ended
Notes comprising a summary of significant accounting policies and other explanatory information, including administered transactions and balances.
In my opinion, the financial statements are:
based on proper accounts and present fairly, in all material respects, the operating results and cash flows of the Department of Transport for the year ended 30 June 2021 and the financial position at the end of that period
in accordance with Australian Accounting Standards, the Financial Management Act 2006 and the Treasurer’s Instructions.
Basis for opinionI conducted my audit in accordance with the Australian Auditing Standards. My responsibilities under those standards are further described in the Auditor’s responsibilities for the audit of the financial statements section of my report.
I am independent of the Department in accordance with the Auditor General Act 2006 and the relevant ethical requirements of the Accounting Professional & Ethical Standards Board’s APES 110 Code of Ethics for Professional Accountants (including Independence Standards) (the Code) that are relevant to my audit of the financial statements. I have also fulfilled my other ethical responsibilities in accordance with the Code.
I believe that the audit evidence I have obtained is sufficient and appropriate to provide a basis for my opinion.
Page 1 of 5
Responsibilities of the Director General for the financial statementsThe Director General is responsible for:
keeping proper accounts
preparation and fair presentation of the financial statements in accordance with Australian Accounting Standards, the Financial Management Act 2006 and the Treasurer’s Instructions
such internal control as the Director General determines is necessary to enable the preparation of financial statements that are free from material misstatement, whether due to fraud or error.
In preparing the financial statements, the Director General is responsible for:
assessing the entity’s ability to continue as a going concern
disclosing, as applicable, matters related to going concern
using the going concern basis of accounting unless the Western Australian Government has made policy or funding decisions affecting the continued existence of the Department.
Auditor’s responsibilities for the audit of the financial statementsAs required by the Auditor General Act 2006, my responsibility is to express an opinion on the financial statements. The objectives of my audit are to obtain reasonable assurance about whether the financial statements as a whole are free from material misstatement, whether due to fraud or error, and to issue an auditor’s report that includes my opinion. Reasonable assurance is a high level of assurance but is not a guarantee that an audit conducted in accordance with Australian Auditing Standards will always detect a material misstatement when it exists.
Misstatements can arise from fraud or error and are considered material if, individually or in the aggregate, they could reasonably be expected to influence the economic decisions of users taken on the basis of the financial statements. The risk of not detecting a material misstatement resulting from fraud is higher than for one resulting from error, as fraud may involve collusion, forgery, intentional omissions, misrepresentations or the override of internal control.
A further description of my responsibilities for the audit of the financial statements is located on the Auditing and Assurance Standards Board website. This description forms part of my auditor’s report and can be found at https://www.auasb.gov.au/auditors_responsibilities/ar4.pdf.
Report on the audit of controls OpinionI have undertaken a reasonable assurance engagement on the design and implementation of controls exercised by the Department of Transport. The controls exercised by the Department are those policies and procedures established by the Director General to ensure that the receipt, expenditure and investment of money, the acquisition and disposal of property, and the incurring of liabilities have been in accordance with legislative provisions (the overall control objectives).
My opinion has been formed on the basis of the matters outlined in this report.
In my opinion, in all material respects, the controls exercised by the Department of Transport are sufficiently adequate to provide reasonable assurance that the receipt, expenditure and investment of money, the acquisition and disposal of property and the incurring of liabilities have been in accordance with legislative provisions during the year ended 30 June 2021.
ANNUAL REPORT 2020-21 PAGE 95PAGE 94 DEPARTMENT OF TRANSPORT
Disclosures and Legal ComplianceDisclosures and Legal Compliance
Page 1 of 5
The Director General’s responsibilitiesThe Director General is responsible for designing, implementing and maintaining controls to ensure that the receipt, expenditure and investment of money, the acquisition and disposal of property and the incurring of liabilities are in accordance with the Financial Management Act 2006, the Treasurer’s Instructions and other relevant written law.
Auditor General’s responsibilities As required by the Auditor General Act 2006, my responsibility as an assurance practitioner is to express an opinion on the suitability of the design of the controls to achieve the overall control objectives and the implementation of the controls as designed. I conducted my engagement in accordance with Standard on Assurance Engagements ASAE 3150 Assurance Engagements on Controls issued by the Australian Auditing and Assurance Standards Board. That standard requires that I comply with relevant ethical requirements and plan and perform my procedures to obtain reasonable assurance about whether, in all material respects, the controls are suitably designed to achieve the overall control objectives and were implemented as designed.
An assurance engagement involves performing procedures to obtain evidence about the suitability of the controls design to achieve the overall control objectives and the implementation of those controls. The procedures selected depend on my judgement, including an assessment of the risks that controls are not suitably designed or implemented as designed. My procedures included testing the implementation of those controls that I consider necessary to achieve the overall control objectives.
I believe that the evidence I have obtained is sufficient and appropriate to provide a basis for my opinion.
Limitations of controlsBecause of the inherent limitations of any internal control structure, it is possible that, even if the controls are suitably designed and implemented as designed, once in operation, the overall control objectives may not be achieved so that fraud, error or non-compliance with laws and regulations may occur and not be detected. Any projection of the outcome of the evaluation of the suitability of the design of controls to future periods is subject to the risk that the controls may become unsuitable because of changes in conditions.
Report on the audit of the key performance indicators
OpinionI have undertaken a reasonable assurance engagement on the key performance indicators of the Department of Transport for the year ended 30 June 2021. The key performance indicators are the Under Treasurer-approved key effectiveness indicators and key efficiency indicators that provide performance information about achieving outcomes and delivering services.
In my opinion, in all material respects, the key performance indicators of the Department of Transport are relevant and appropriate to assist users to assess the Department’s performance and fairly represent indicated performance for the year ended 30 June 2021.
Page 1 of 5
The Director General’s responsibilities for the key performance indicatorsThe Director General is responsible for the preparation and fair presentation of the key performance indicators in accordance with the Financial Management Act 2006 and the Treasurer’s Instructions and for such internal control as the Director General determines necessary to enable the preparation of key performance indicators that are free from material misstatement, whether due to fraud or error.
In preparing the key performance indicators, the Director General is responsible for identifying key performance indicators that are relevant and appropriate, having regard to their purpose in accordance with Treasurer’s Instruction 904 Key Performance Indicators.
Auditor General’s responsibilities As required by the Auditor General Act 2006, my responsibility as an assurance practitioner is to express an opinion on the key performance indicators. The objectives of my engagement are to obtain reasonable assurance about whether the key performance indicators are relevant and appropriate to assist users to assess the entity’s performance and whether the key performance indicators are free from material misstatement, whether due to fraud or error, and to issue an auditor’s report that includes my opinion. I conducted my engagement in accordance with Standard on Assurance Engagements ASAE 3000 Assurance Engagements Other than Audits or Reviews of Historical Financial Information issued by the Australian Auditing and Assurance Standards Board. That standard requires that I comply with relevant ethical requirements relating to assurance engagements.
An assurance engagement involves performing procedures to obtain evidence about the amounts and disclosures in the key performance indicators. It also involves evaluating the relevance and appropriateness of the key performance indicators against the criteria and guidance in Treasurer’s Instruction 904 for measuring the extent of outcome achievement and the efficiency of service delivery. The procedures selected depend on my judgement, including the assessment of the risks of material misstatement of the key performance indicators. In making these risk assessments I obtain an understanding of internal control relevant to the engagement in order to design procedures that are appropriate in the circumstances.
I believe that the evidence I have obtained is sufficient and appropriate to provide a basis for my opinion.
My independence and quality control relating to the reports on controls and key performance indicatorsI have complied with the independence requirements of the Auditor General Act 2006 and the relevant ethical requirements relating to assurance engagements. In accordance with ASQC 1 Quality Control for Firms that Perform Audits and Reviews of Financial Reports and Other Financial Information, and Other Assurance Engagements, the Office of the Auditor General maintains a comprehensive system of quality control including documented policies and procedures regarding compliance with ethical requirements, professional standards and applicable legal and regulatory requirements.
Other informationThe Director General is responsible for the other information. The other information is the information in the entity’s annual report for the year ended 30 June 2021, but not the financial statements, key performance indicators and my auditor’s report.
My opinions do not cover the other information and, accordingly, I do not express any form of assurance conclusion thereon.
ANNUAL REPORT 2020-21 PAGE 97PAGE 96 DEPARTMENT OF TRANSPORT
Disclosures and Legal ComplianceDisclosures and Legal Compliance
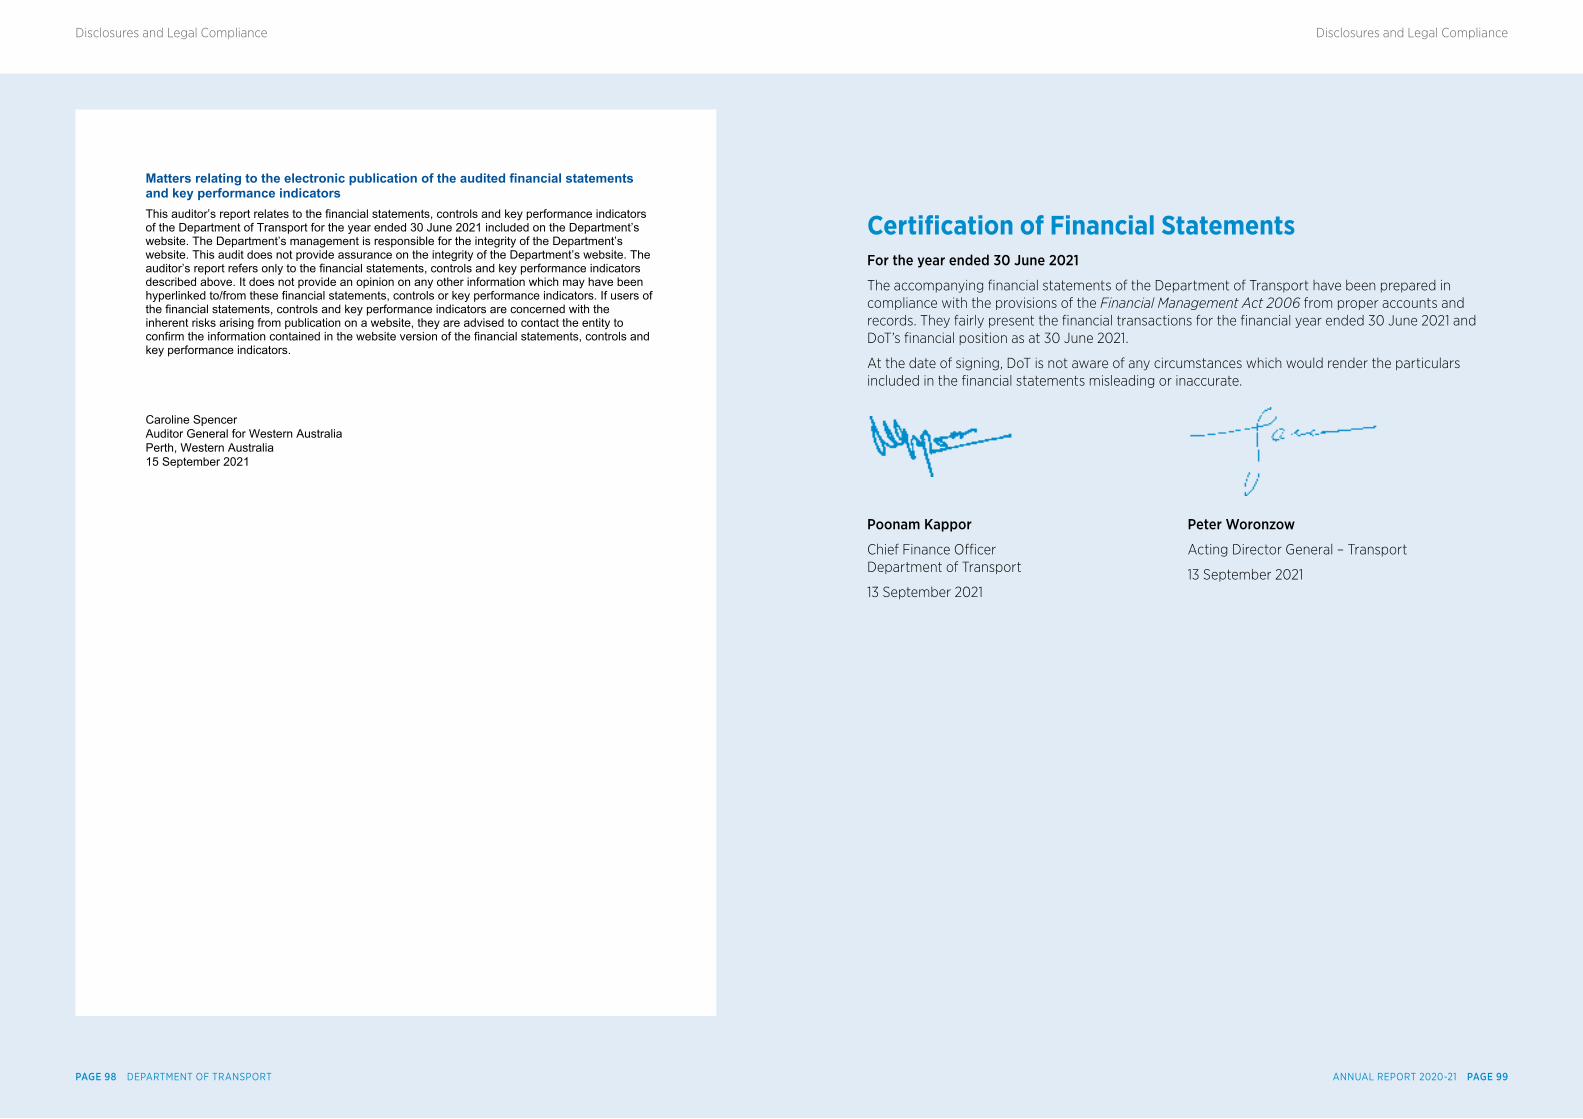
Page 2 of 5
Matters relating to the electronic publication of the audited financial statements and key performance indicatorsThis auditor’s report relates to the financial statements, controls and key performance indicators of the Department of Transport for the year ended 30 June 2021 included on the Department’s website. The Department’s management is responsible for the integrity of the Department’s website. This audit does not provide assurance on the integrity of the Department’s website. The auditor’s report refers only to the financial statements, controls and key performance indicators described above. It does not provide an opinion on any other information which may have been hyperlinked to/from these financial statements, controls or key performance indicators. If users of the financial statements, controls and key performance indicators are concerned with the inherent risks arising from publication on a website, they are advised to contact the entity to confirm the information contained in the website version of the financial statements, controls and key performance indicators.
Caroline Spencer Auditor General for Western Australia Perth, Western Australia15 September 2021
Certification of Financial StatementsFor the year ended 30 June 2021
The accompanying financial statements of the Department of Transport have been prepared in compliance with the provisions of the Financial Management Act 2006 from proper accounts and records. They fairly present the financial transactions for the financial year ended 30 June 2021 and DoT’s financial position as at 30 June 2021.
At the date of signing, DoT is not aware of any circumstances which would render the particulars included in the financial statements misleading or inaccurate.
Poonam Kappor
Chief Finance Officer Department of Transport
13 September 2021
Peter Woronzow
Acting Director General – Transport
13 September 2021
ANNUAL REPORT 2020-21 PAGE 99PAGE 98 DEPARTMENT OF TRANSPORT
Disclosures and Legal ComplianceDisclosures and Legal Compliance
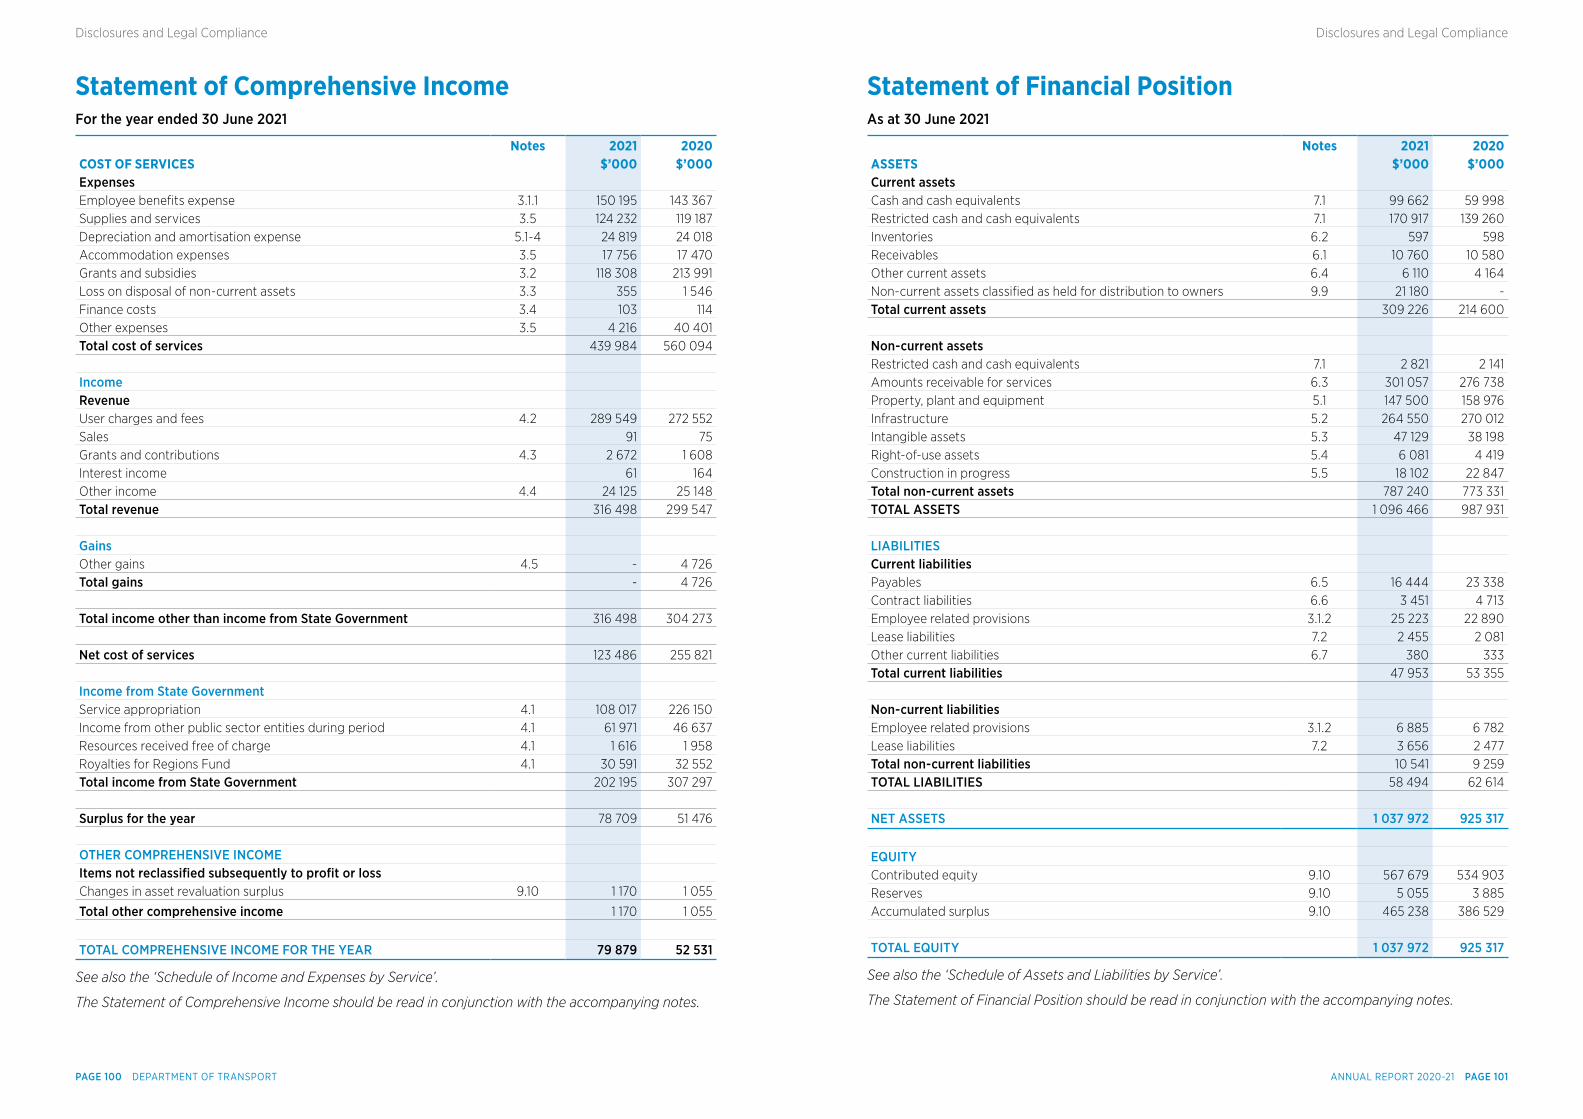
Statement of Comprehensive IncomeFor the year ended 30 June 2021
Notes 2021 2020COST OF SERVICES $’000 $’000Expenses Employee benefits expense 3.1.1 150 195 143 367Supplies and services 3.5 124 232 119 187Depreciation and amortisation expense 5.1-4 24 819 24 018Accommodation expenses 3.5 17 756 17 470Grants and subsidies 3.2 118 308 213 991Loss on disposal of non-current assets 3.3 355 1 546Finance costs 3.4 103 114Other expenses 3.5 4 216 40 401Total cost of services 439 984 560 094 Income Revenue User charges and fees 4.2 289 549 272 552Sales 91 75Grants and contributions 4.3 2 672 1 608Interest income 61 164Other income 4.4 24 125 25 148Total revenue 316 498 299 547 Gains Other gains 4.5 - 4 726Total gains - 4 726 Total income other than income from State Government 316 498 304 273
Net cost of services 123 486 255 821 Income from State Government Service appropriation 4.1 108 017 226 150Income from other public sector entities during period 4.1 61 971 46 637Resources received free of charge 4.1 1 616 1 958Royalties for Regions Fund 4.1 30 591 32 552Total income from State Government 202 195 307 297 Surplus for the year 78 709 51 476 OTHER COMPREHENSIVE INCOME Items not reclassifed subsequently to proft or loss Changes in asset revaluation surplus 9.10 1 170 1 055
Total other comprehensive income 1 170 1 055
TOTAL COMPREHENSIVE INCOME FOR THE YEAR 79 879 52 531
See also the ‘Schedule of Income and Expenses by Service’.
The Statement of Comprehensive Income should be read in conjunction with the accompanying notes.
Statement of Financial PositionAs at 30 June 2021
Notes 2021 2020ASSETS $’000 $’000Current assets Cash and cash equivalents 7.1 99 662 59 998Restricted cash and cash equivalents 7.1 170 917 139 260Inventories 6.2 597 598Receivables 6.1 10 760 10 580Other current assets 6.4 6 110 4 164Non-current assets classified as held for distribution to owners 9.9 21 180 -Total current assets 309 226 214 600 Non-current assets Restricted cash and cash equivalents 7.1 2 821 2 141Amounts receivable for services 6.3 301 057 276 738Property, plant and equipment 5.1 147 500 158 976Infrastructure 5.2 264 550 270 012Intangible assets 5.3 47 129 38 198Right-of-use assets 5.4 6 081 4 419Construction in progress 5.5 18 102 22 847Total non-current assets 787 240 773 331TOTAL ASSETS 1 096 466 987 931 LIABILITIES Current liabilities Payables 6.5 16 444 23 338Contract liabilities 6.6 3 451 4 713Employee related provisions 3.1.2 25 223 22 890Lease liabilities 7.2 2 455 2 081Other current liabilities 6.7 380 333Total current liabilities 47 953 53 355 Non-current liabilities Employee related provisions 3.1.2 6 885 6 782Lease liabilities 7.2 3 656 2 477Total non-current liabilities 10 541 9 259TOTAL LIABILITIES 58 494 62 614 NET ASSETS 1 037 972 925 317 EQUITY Contributed equity 9.10 567 679 534 903Reserves 9.10 5 055 3 885Accumulated surplus 9.10 465 238 386 529
TOTAL EQUITY 1 037 972 925 317
See also the ‘Schedule of Assets and Liabilities by Service’.
The Statement of Financial Position should be read in conjunction with the accompanying notes.
ANNUAL REPORT 2020-21 PAGE 101PAGE 100 DEPARTMENT OF TRANSPORT
Disclosures and Legal ComplianceDisclosures and Legal Compliance
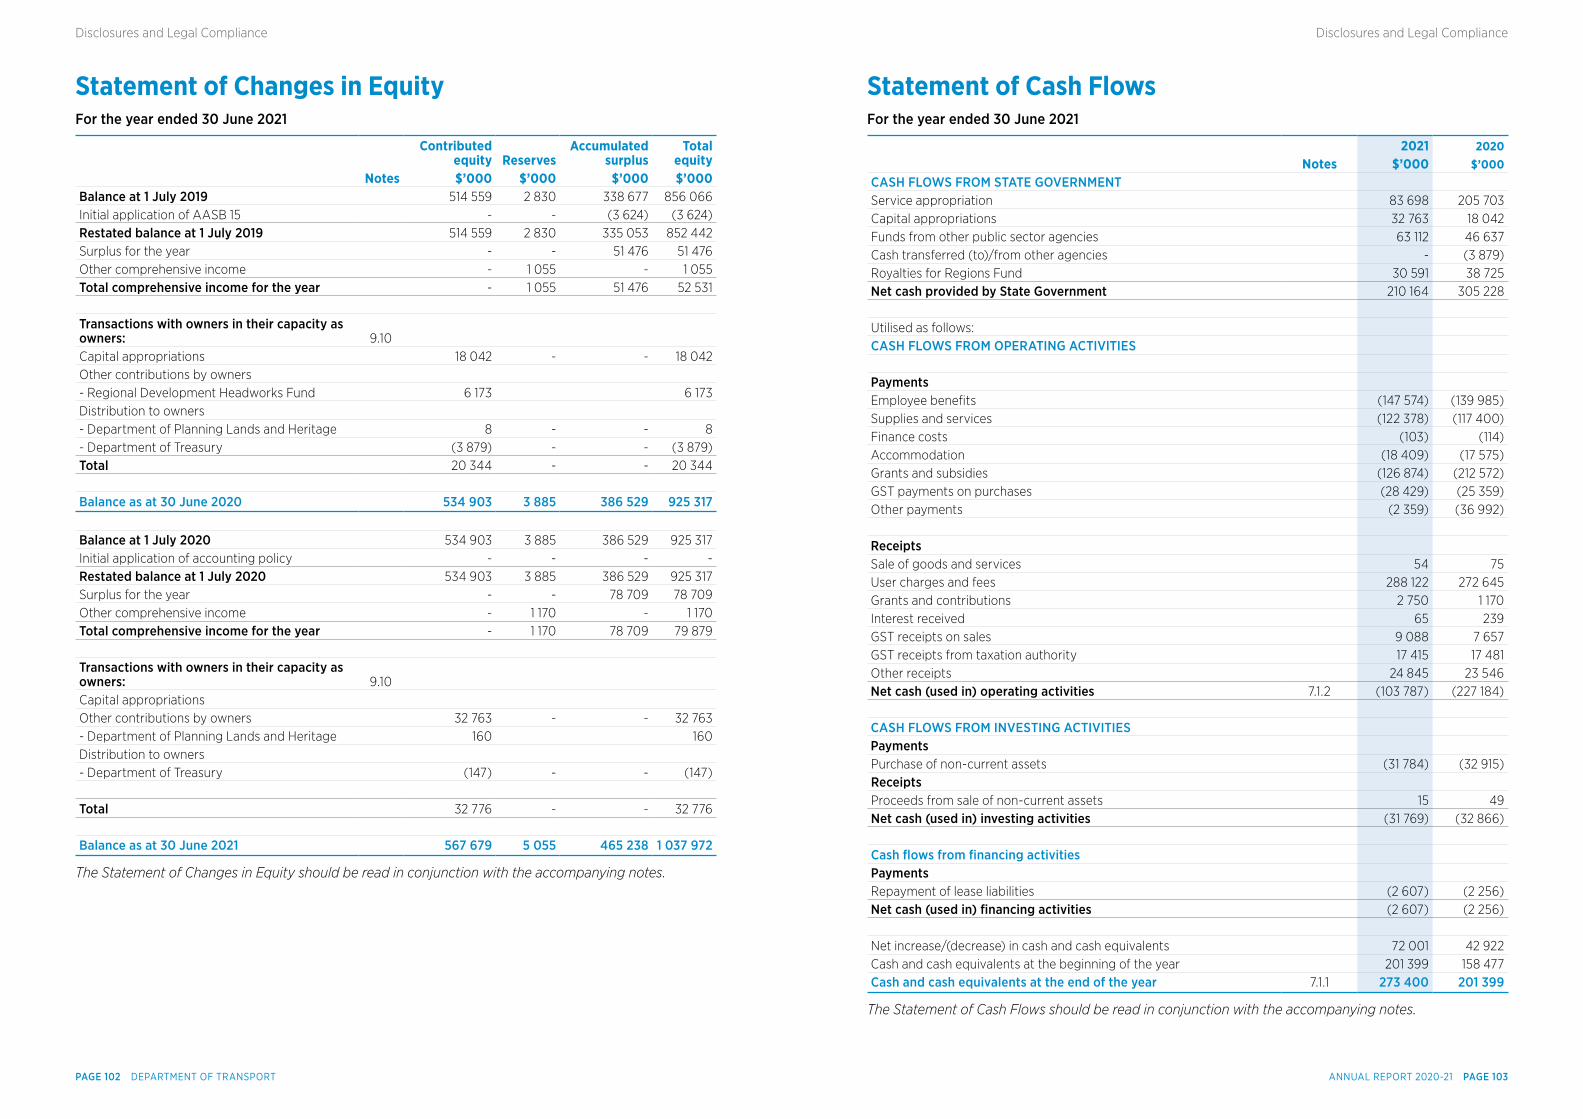
Statement of Changes in EquityFor the year ended 30 June 2021
Contributed
equity ReservesAccumulated
surplusTotal
equity Notes $’000 $’000 $’000 $’000
Balance at 1 July 2019 514 559 2 830 338 677 856 066Initial application of AASB 15 - - (3 624) (3 624)Restated balance at 1 July 2019 514 559 2 830 335 053 852 442Surplus for the year - - 51 476 51 476Other comprehensive income - 1 055 - 1 055Total comprehensive income for the year - 1 055 51 476 52 531 Transactions with owners in their capacity as owners: 9.10 Capital appropriations 18 042 - - 18 042Other contributions by owners - Regional Development Headworks Fund 6 173 6 173Distribution to owners - Department of Planning Lands and Heritage 8 - - 8- Department of Treasury (3 879) - - (3 879)Total 20 344 - - 20 344 Balance as at 30 June 2020 534 903 3 885 386 529 925 317 Balance at 1 July 2020 534 903 3 885 386 529 925 317Initial application of accounting policy - - - -Restated balance at 1 July 2020 534 903 3 885 386 529 925 317Surplus for the year - - 78 709 78 709Other comprehensive income - 1 170 - 1 170Total comprehensive income for the year - 1 170 78 709 79 879 Transactions with owners in their capacity as owners: 9.10 Capital appropriations Other contributions by owners 32 763 - - 32 763- Department of Planning Lands and Heritage 160 160Distribution to owners - Department of Treasury (147) - - (147)
Total 32 776 - - 32 776 Balance as at 30 June 2021 567 679 5 055 465 238 1 037 972
The Statement of Changes in Equity should be read in conjunction with the accompanying notes.
Statement of Cash FlowsFor the year ended 30 June 2021
2021 2020 Notes $’000 $’000
CASH FLOWS FROM STATE GOVERNMENT Service appropriation 83 698 205 703Capital appropriations 32 763 18 042Funds from other public sector agencies 63 112 46 637Cash transferred (to)/from other agencies - (3 879)Royalties for Regions Fund 30 591 38 725Net cash provided by State Government 210 164 305 228 Utilised as follows: CASH FLOWS FROM OPERATING ACTIVITIES Payments Employee benefits (147 574) (139 985)Supplies and services (122 378) (117 400)Finance costs (103) (114)Accommodation (18 409) (17 575)Grants and subsidies (126 874) (212 572)GST payments on purchases (28 429) (25 359)Other payments (2 359) (36 992) Receipts Sale of goods and services 54 75User charges and fees 288 122 272 645Grants and contributions 2 750 1 170Interest received 65 239GST receipts on sales 9 088 7 657GST receipts from taxation authority 17 415 17 481Other receipts 24 845 23 546Net cash (used in) operating activities 7.1.2 (103 787) (227 184) CASH FLOWS FROM INVESTING ACTIVITIES Payments Purchase of non-current assets (31 784) (32 915)Receipts Proceeds from sale of non-current assets 15 49Net cash (used in) investing activities (31 769) (32 866) Cash fows from fnancing activities Payments Repayment of lease liabilities (2 607) (2 256)Net cash (used in) fnancing activities (2 607) (2 256) Net increase/(decrease) in cash and cash equivalents 72 001 42 922Cash and cash equivalents at the beginning of the year 201 399 158 477Cash and cash equivalents at the end of the year 7.1.1 273 400 201 399
The Statement of Cash Flows should be read in conjunction with the accompanying notes.
ANNUAL REPORT 2020-21 PAGE 103PAGE 102 DEPARTMENT OF TRANSPORT
Disclosures and Legal ComplianceDisclosures and Legal Compliance
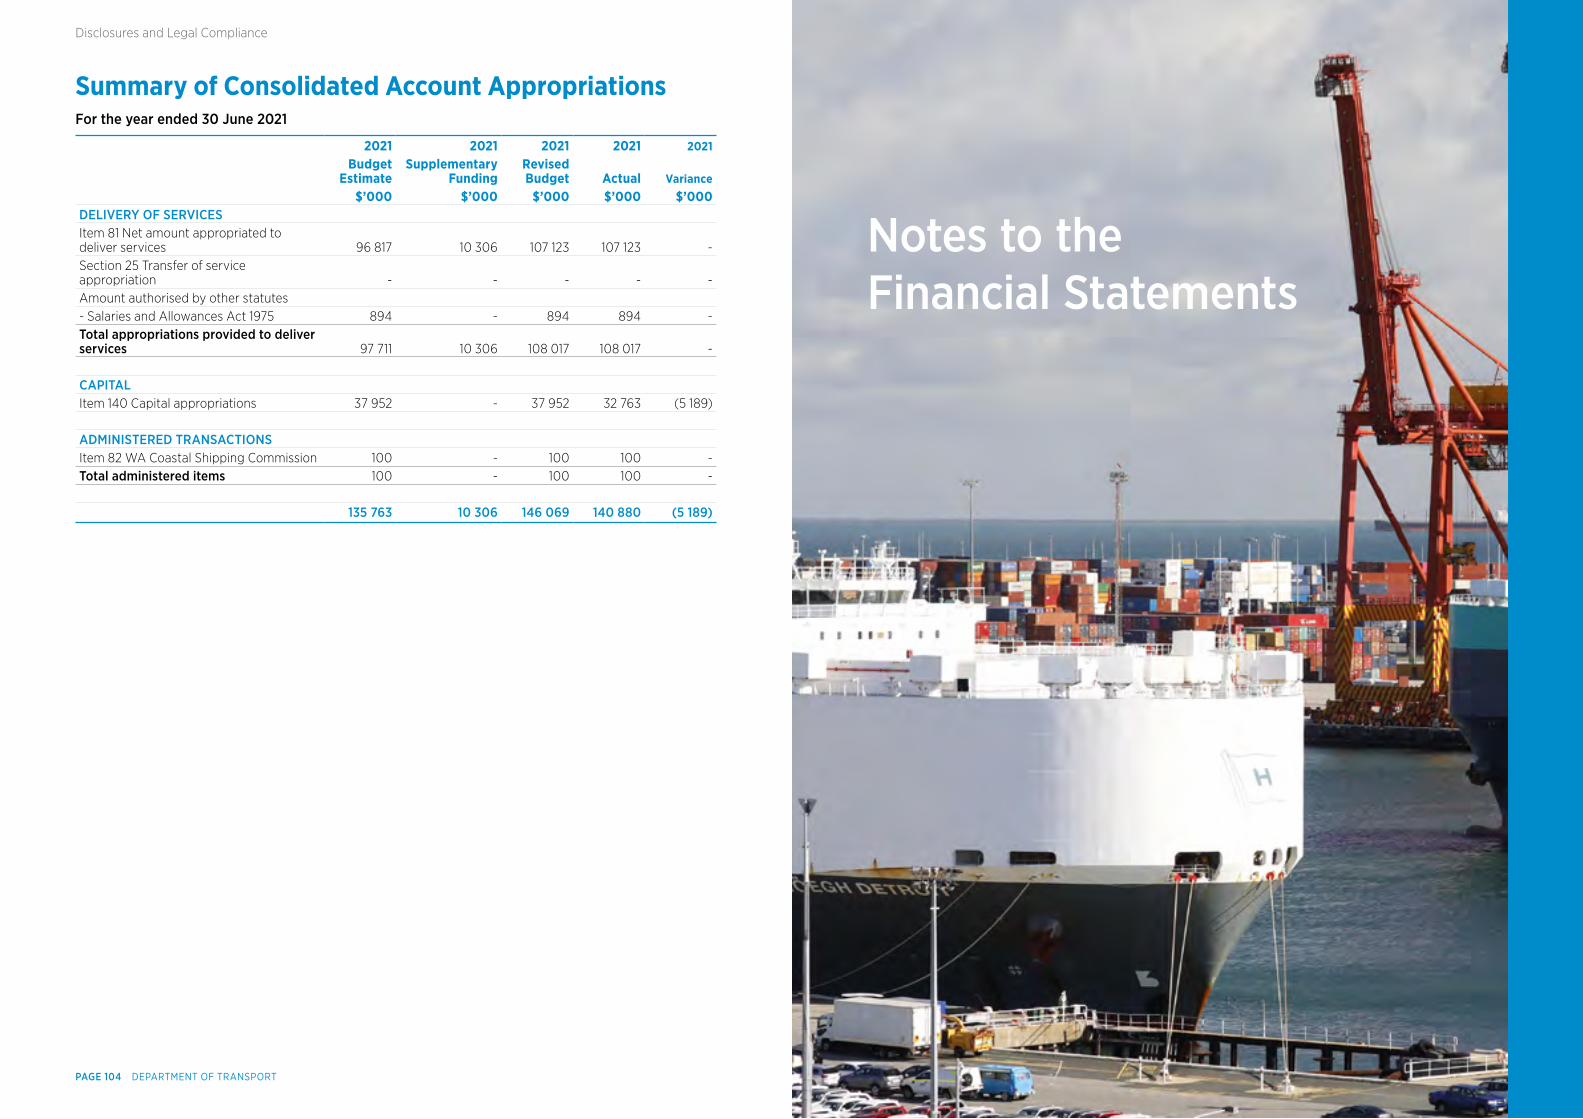
Summary of Consolidated Account AppropriationsFor the year ended 30 June 2021
2021 2021 2021 2021 2021
Budget
EstimateSupplementary
FundingRevised Budget Actual Variance
$’000 $’000 $’000 $’000 $’000DELIVERY OF SERVICES Item 81 Net amount appropriated to deliver services 96 817 10 306 107 123 107 123 -Section 25 Transfer of service appropriation - - - - -Amount authorised by other statutes - Salaries and Allowances Act 1975 894 - 894 894 -Total appropriations provided to deliver services 97 711 10 306 108 017 108 017 - CAPITAL Item 140 Capital appropriations 37 952 - 37 952 32 763 (5 189) ADMINISTERED TRANSACTIONS Item 82 WA Coastal Shipping Commission 100 - 100 100 -Total administered items 100 - 100 100 -
135 763 10 306 146 069 140 880 (5 189)
Notes to the Financial Statements
PAGE 104 DEPARTMENT OF TRANSPORT
Disclosures and Legal Compliance
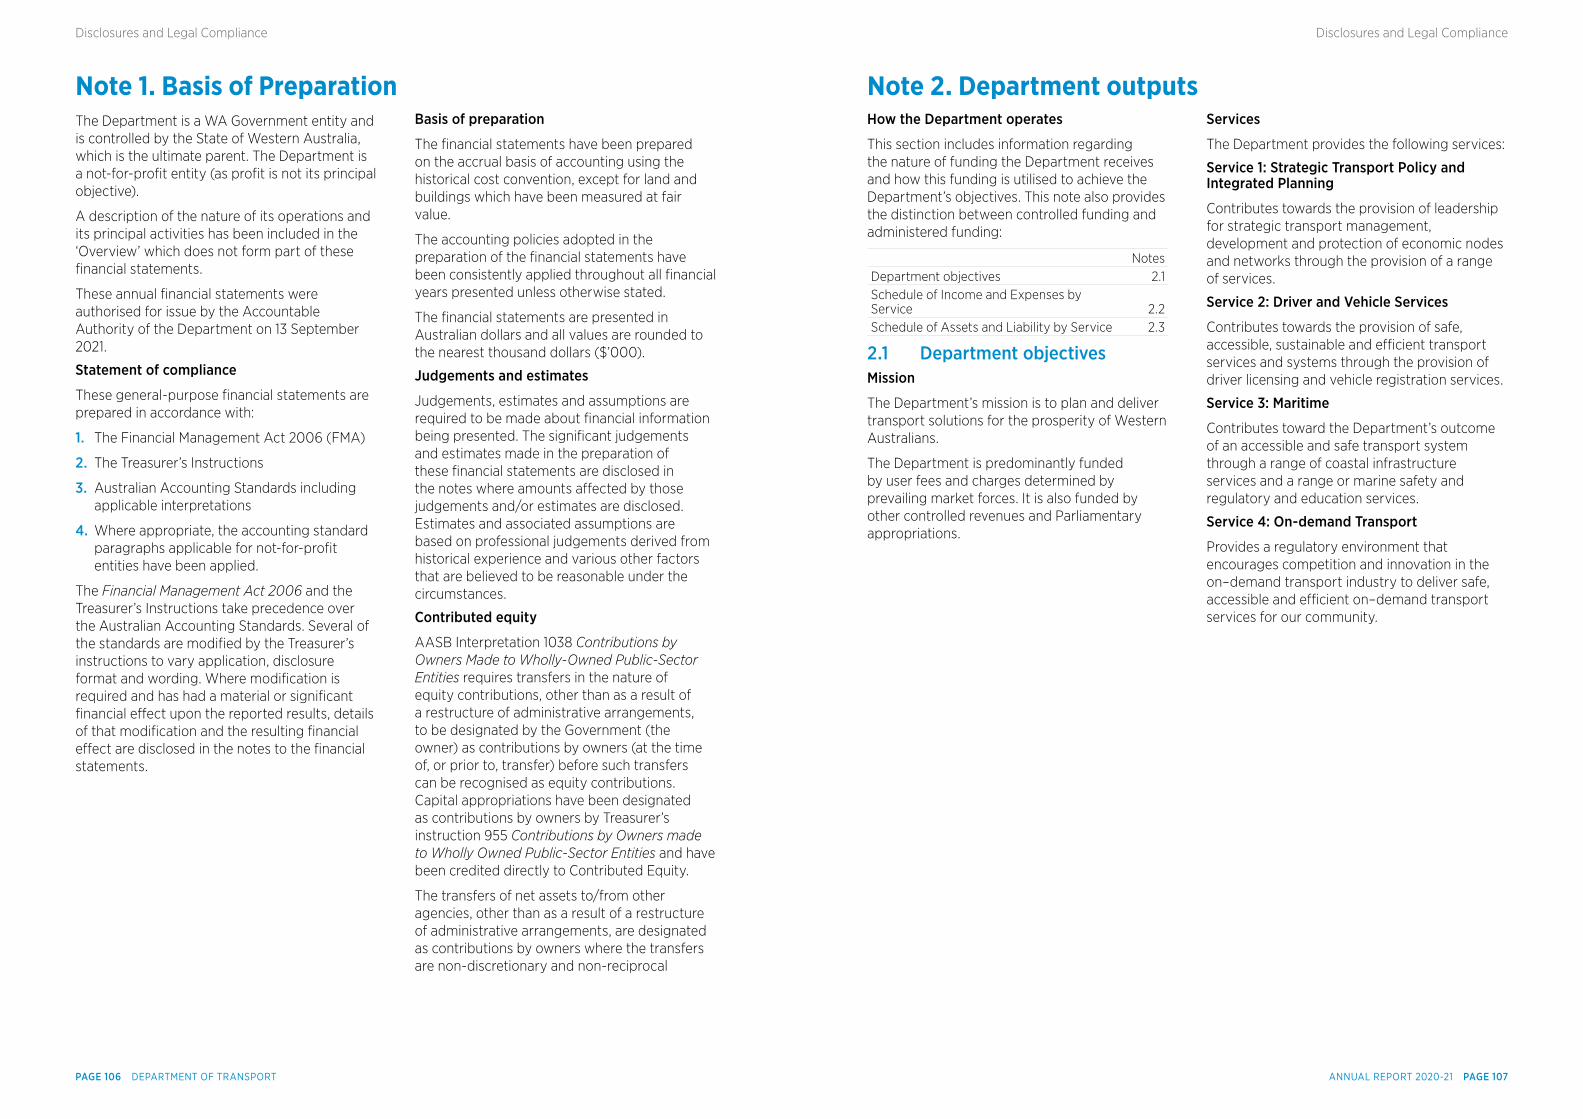
Note 1. Basis of Preparation The Department is a WA Government entity and is controlled by the State of Western Australia, which is the ultimate parent. The Department is a not-for-profit entity (as profit is not its principal objective).
A description of the nature of its operations and its principal activities has been included in the ‘Overview’ which does not form part of these financial statements.
These annual financial statements were authorised for issue by the Accountable Authority of the Department on 13 September 2021.
Statement of compliance
These general-purpose financial statements are prepared in accordance with:
1. The Financial Management Act 2006 (FMA)
2. The Treasurer’s Instructions
3. Australian Accounting Standards including applicable interpretations
4. Where appropriate, the accounting standard paragraphs applicable for not-for-profit entities have been applied.
The Financial Management Act 2006 and the Treasurer’s Instructions take precedence over the Australian Accounting Standards. Several of the standards are modified by the Treasurer’s instructions to vary application, disclosure format and wording. Where modification is required and has had a material or significant financial effect upon the reported results, details of that modification and the resulting financial effect are disclosed in the notes to the financial statements.
Basis of preparation
The financial statements have been prepared on the accrual basis of accounting using the historical cost convention, except for land and buildings which have been measured at fair value.
The accounting policies adopted in the preparation of the financial statements have been consistently applied throughout all financial years presented unless otherwise stated.
The financial statements are presented in Australian dollars and all values are rounded to the nearest thousand dollars ($’000).
Judgements and estimates
Judgements, estimates and assumptions are required to be made about financial information being presented. The significant judgements and estimates made in the preparation of these financial statements are disclosed in the notes where amounts affected by those judgements and/or estimates are disclosed. Estimates and associated assumptions are based on professional judgements derived from historical experience and various other factors that are believed to be reasonable under the circumstances.
Contributed equity
AASB Interpretation 1038 Contributions by Owners Made to Wholly-Owned Public-Sector Entities requires transfers in the nature of equity contributions, other than as a result of a restructure of administrative arrangements, to be designated by the Government (the owner) as contributions by owners (at the time of, or prior to, transfer) before such transfers can be recognised as equity contributions. Capital appropriations have been designated as contributions by owners by Treasurer’s instruction 955 Contributions by Owners made to Wholly Owned Public-Sector Entities and have been credited directly to Contributed Equity.
The transfers of net assets to/from other agencies, other than as a result of a restructure of administrative arrangements, are designated as contributions by owners where the transfers are non-discretionary and non-reciprocal
Note 2. Department outputs How the Department operates
This section includes information regarding the nature of funding the Department receives and how this funding is utilised to achieve the Department’s objectives. This note also provides the distinction between controlled funding and administered funding:
NotesDepartment objectives 2.1Schedule of Income and Expenses by Service 2.2Schedule of Assets and Liability by Service 2.3
2.1 Department objectivesMission
The Department’s mission is to plan and deliver transport solutions for the prosperity of Western Australians.
The Department is predominantly funded by user fees and charges determined by prevailing market forces. It is also funded by other controlled revenues and Parliamentary appropriations.
Services
The Department provides the following services:
Service 1: Strategic Transport Policy and Integrated Planning
Contributes towards the provision of leadership for strategic transport management, development and protection of economic nodes and networks through the provision of a range of services.
Service 2: Driver and Vehicle Services
Contributes towards the provision of safe, accessible, sustainable and efficient transport services and systems through the provision of driver licensing and vehicle registration services.
Service 3: Maritime
Contributes toward the Department’s outcome of an accessible and safe transport system through a range of coastal infrastructure services and a range or marine safety and regulatory and education services.
Service 4: On-demand Transport
Provides a regulatory environment that encourages competition and innovation in the on–demand transport industry to deliver safe, accessible and efficient on–demand transport services for our community.
ANNUAL REPORT 2020-21 PAGE 107PAGE 106 DEPARTMENT OF TRANSPORT
Disclosures and Legal ComplianceDisclosures and Legal Compliance
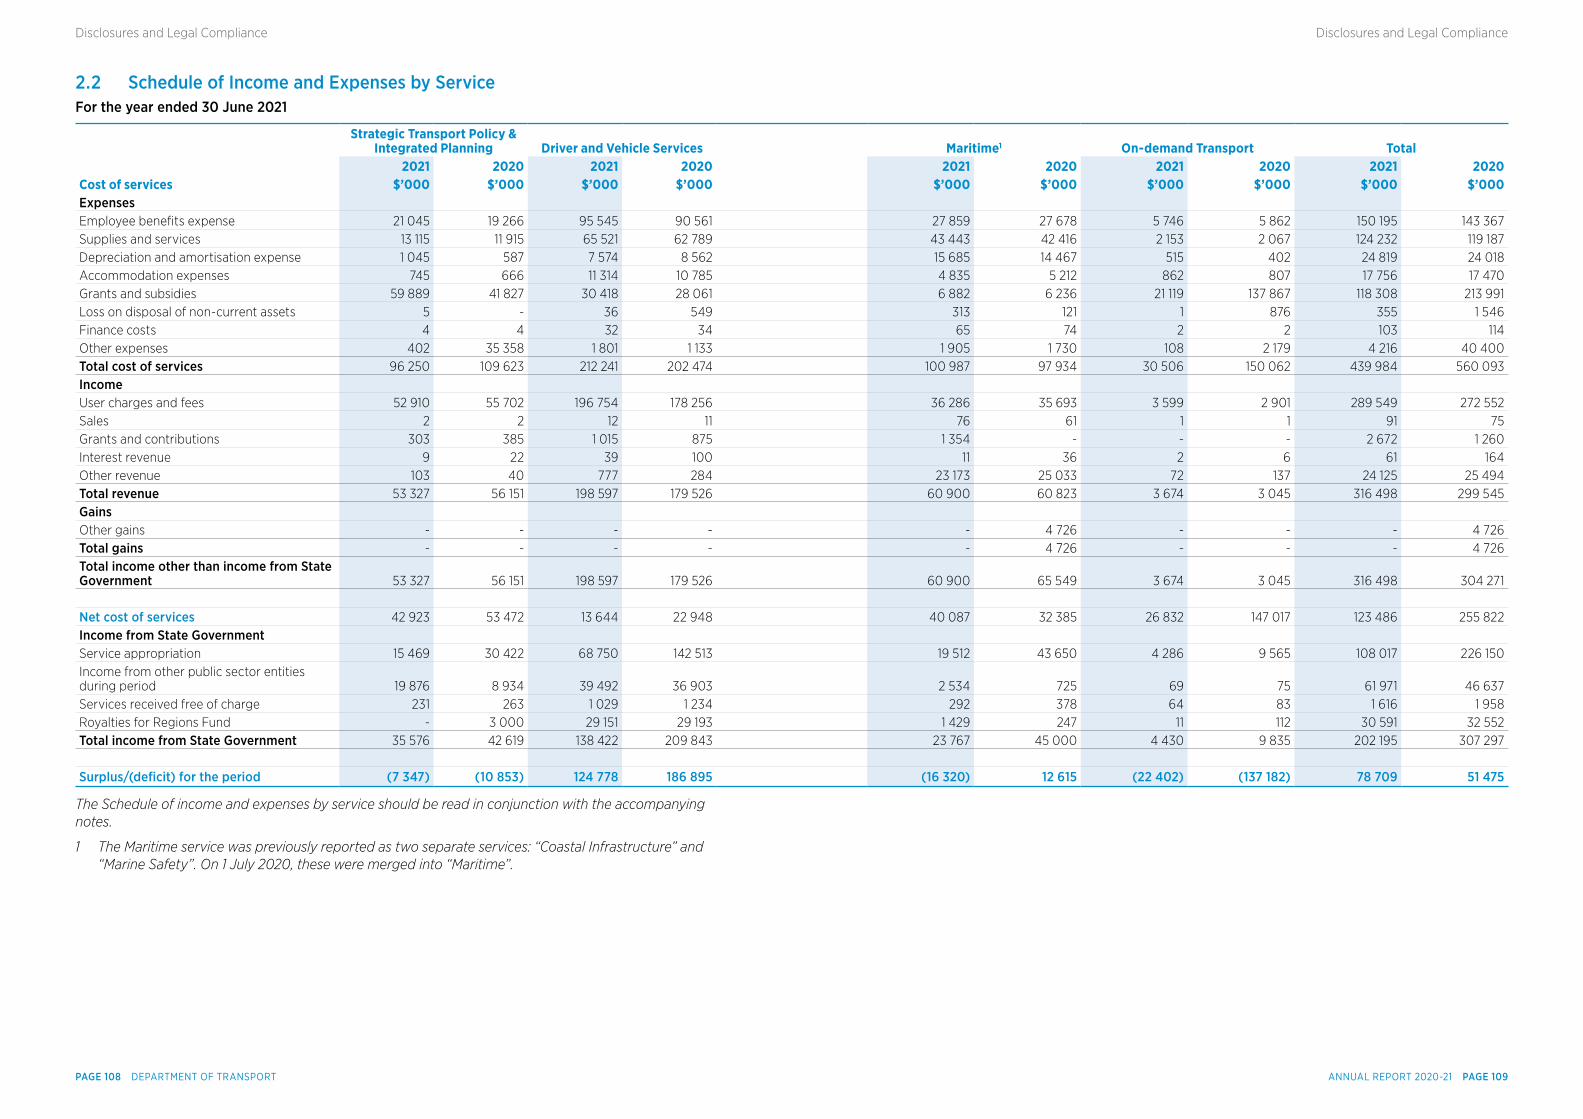
2.2 Schedule of Income and Expenses by ServiceFor the year ended 30 June 2021
Strategic Transport Policy &
Integrated Planning Driver and Vehicle Services Maritime1 On-demand Transport Total 2021 2020 2021 2020 2021 2020 2021 2020 2021 2020
Cost of services $’000 $’000 $’000 $’000 $’000 $’000 $’000 $’000 $’000 $’000Expenses Employee benefits expense 21 045 19 266 95 545 90 561 27 859 27 678 5 746 5 862 150 195 143 367Supplies and services 13 115 11 915 65 521 62 789 43 443 42 416 2 153 2 067 124 232 119 187Depreciation and amortisation expense 1 045 587 7 574 8 562 15 685 14 467 515 402 24 819 24 018Accommodation expenses 745 666 11 314 10 785 4 835 5 212 862 807 17 756 17 470Grants and subsidies 59 889 41 827 30 418 28 061 6 882 6 236 21 119 137 867 118 308 213 991Loss on disposal of non-current assets 5 - 36 549 313 121 1 876 355 1 546Finance costs 4 4 32 34 65 74 2 2 103 114Other expenses 402 35 358 1 801 1 133 1 905 1 730 108 2 179 4 216 40 400Total cost of services 96 250 109 623 212 241 202 474 100 987 97 934 30 506 150 062 439 984 560 093Income User charges and fees 52 910 55 702 196 754 178 256 36 286 35 693 3 599 2 901 289 549 272 552Sales 2 2 12 11 76 61 1 1 91 75Grants and contributions 303 385 1 015 875 1 354 - - - 2 672 1 260Interest revenue 9 22 39 100 11 36 2 6 61 164Other revenue 103 40 777 284 23 173 25 033 72 137 24 125 25 494Total revenue 53 327 56 151 198 597 179 526 60 900 60 823 3 674 3 045 316 498 299 545Gains Other gains - - - - - 4 726 - - - 4 726Total gains - - - - - 4 726 - - - 4 726Total income other than income from State Government 53 327 56 151 198 597 179 526 60 900 65 549 3 674 3 045 316 498 304 271
Net cost of services 42 923 53 472 13 644 22 948 40 087 32 385 26 832 147 017 123 486 255 822Income from State GovernmentService appropriation 15 469 30 422 68 750 142 513 19 512 43 650 4 286 9 565 108 017 226 150Income from other public sector entities during period 19 876 8 934 39 492 36 903 2 534 725 69 75 61 971 46 637Services received free of charge 231 263 1 029 1 234 292 378 64 83 1 616 1 958Royalties for Regions Fund - 3 000 29 151 29 193 1 429 247 11 112 30 591 32 552Total income from State Government 35 576 42 619 138 422 209 843 23 767 45 000 4 430 9 835 202 195 307 297
Surplus/(defcit) for the period (7 347) (10 853) 124 778 186 895 (16 320) 12 615 (22 402) (137 182) 78 709 51 475
The Schedule of income and expenses by service should be read in conjunction with the accompanying notes.
1 The Maritime service was previously reported as two separate services: “Coastal Infrastructure” and “Marine Safety”. On 1 July 2020, these were merged into “Maritime”.
ANNUAL REPORT 2020-21 PAGE 109PAGE 108 DEPARTMENT OF TRANSPORT
Disclosures and Legal ComplianceDisclosures and Legal Compliance
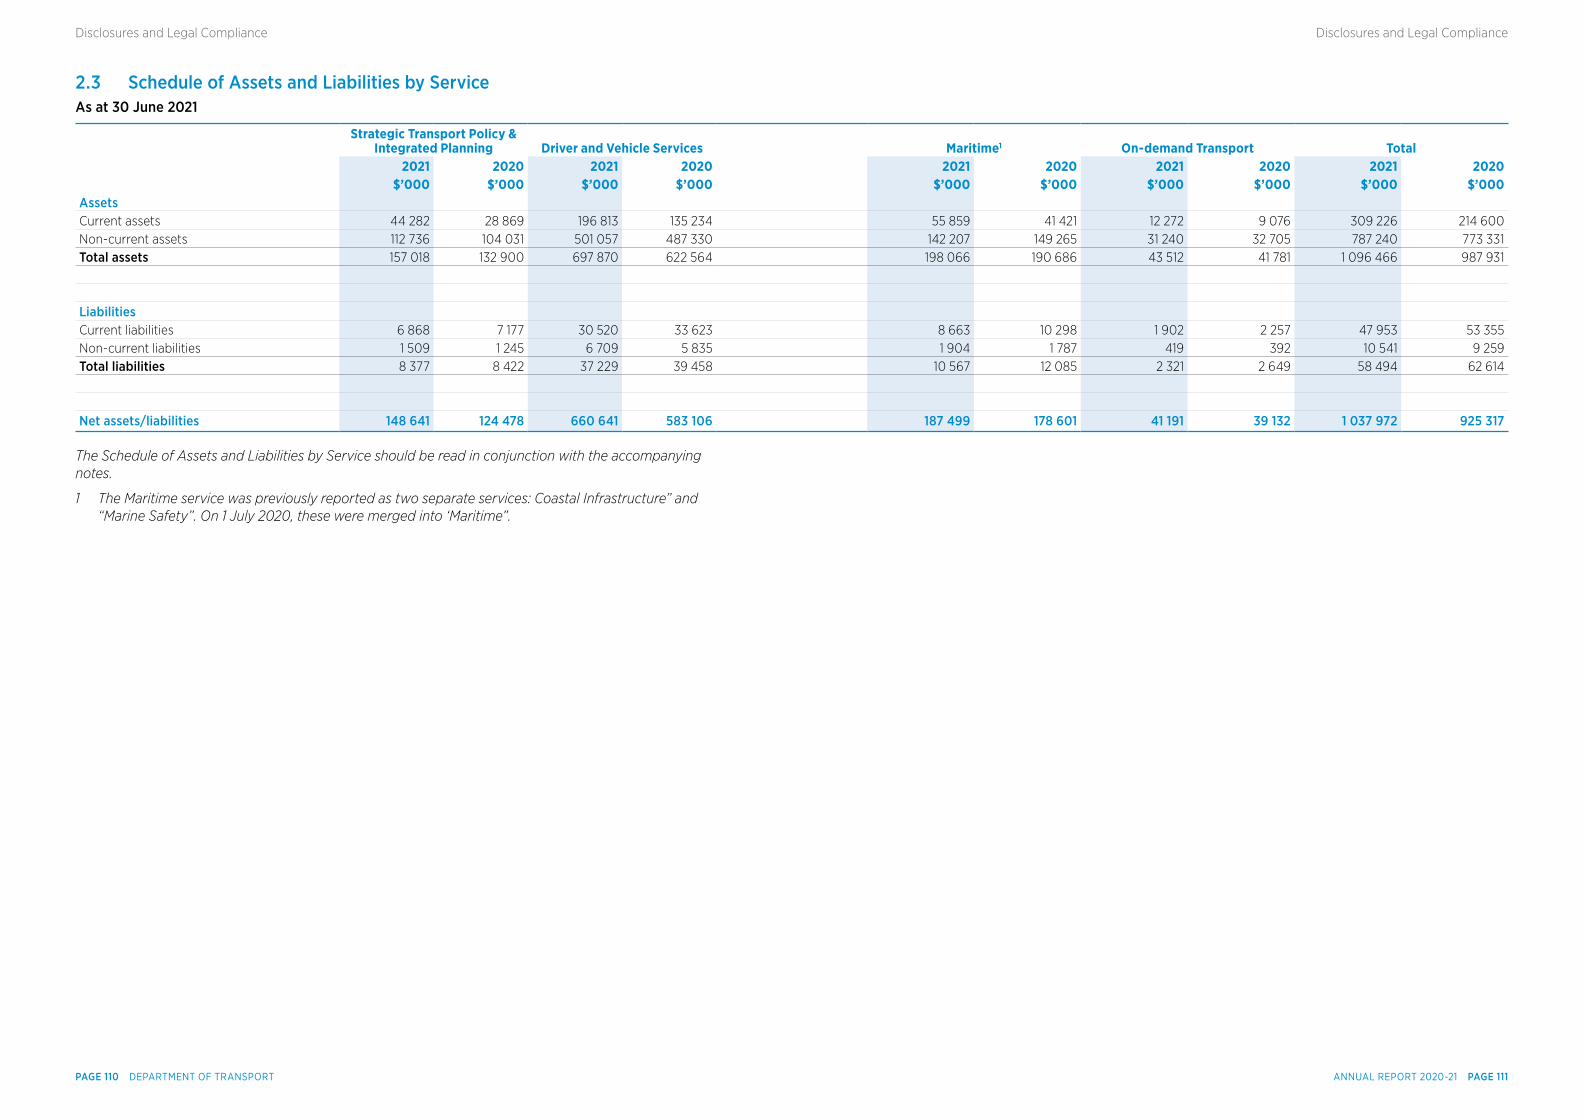
2.3 Schedule of Assets and Liabilities by ServiceAs at 30 June 2021
Strategic Transport Policy &
Integrated Planning Driver and Vehicle Services Maritime1 On-demand Transport Total 2021 2020 2021 2020 2021 2020 2021 2020 2021 2020 $’000 $’000 $’000 $’000 $’000 $’000 $’000 $’000 $’000 $’000
Assets Current assets 44 282 28 869 196 813 135 234 55 859 41 421 12 272 9 076 309 226 214 600Non-current assets 112 736 104 031 501 057 487 330 142 207 149 265 31 240 32 705 787 240 773 331Total assets 157 018 132 900 697 870 622 564 198 066 190 686 43 512 41 781 1 096 466 987 931
Liabilities Current liabilities 6 868 7 177 30 520 33 623 8 663 10 298 1 902 2 257 47 953 53 355Non-current liabilities 1 509 1 245 6 709 5 835 1 904 1 787 419 392 10 541 9 259Total liabilities 8 377 8 422 37 229 39 458 10 567 12 085 2 321 2 649 58 494 62 614
Net assets/liabilities 148 641 124 478 660 641 583 106 187 499 178 601 41 191 39 132 1 037 972 925 317
The Schedule of Assets and Liabilities by Service should be read in conjunction with the accompanying notes.
1 The Maritime service was previously reported as two separate services: Coastal Infrastructure” and “Marine Safety”. On 1 July 2020, these were merged into ‘Maritime”.
ANNUAL REPORT 2020-21 PAGE 111PAGE 110 DEPARTMENT OF TRANSPORT
Disclosures and Legal ComplianceDisclosures and Legal Compliance
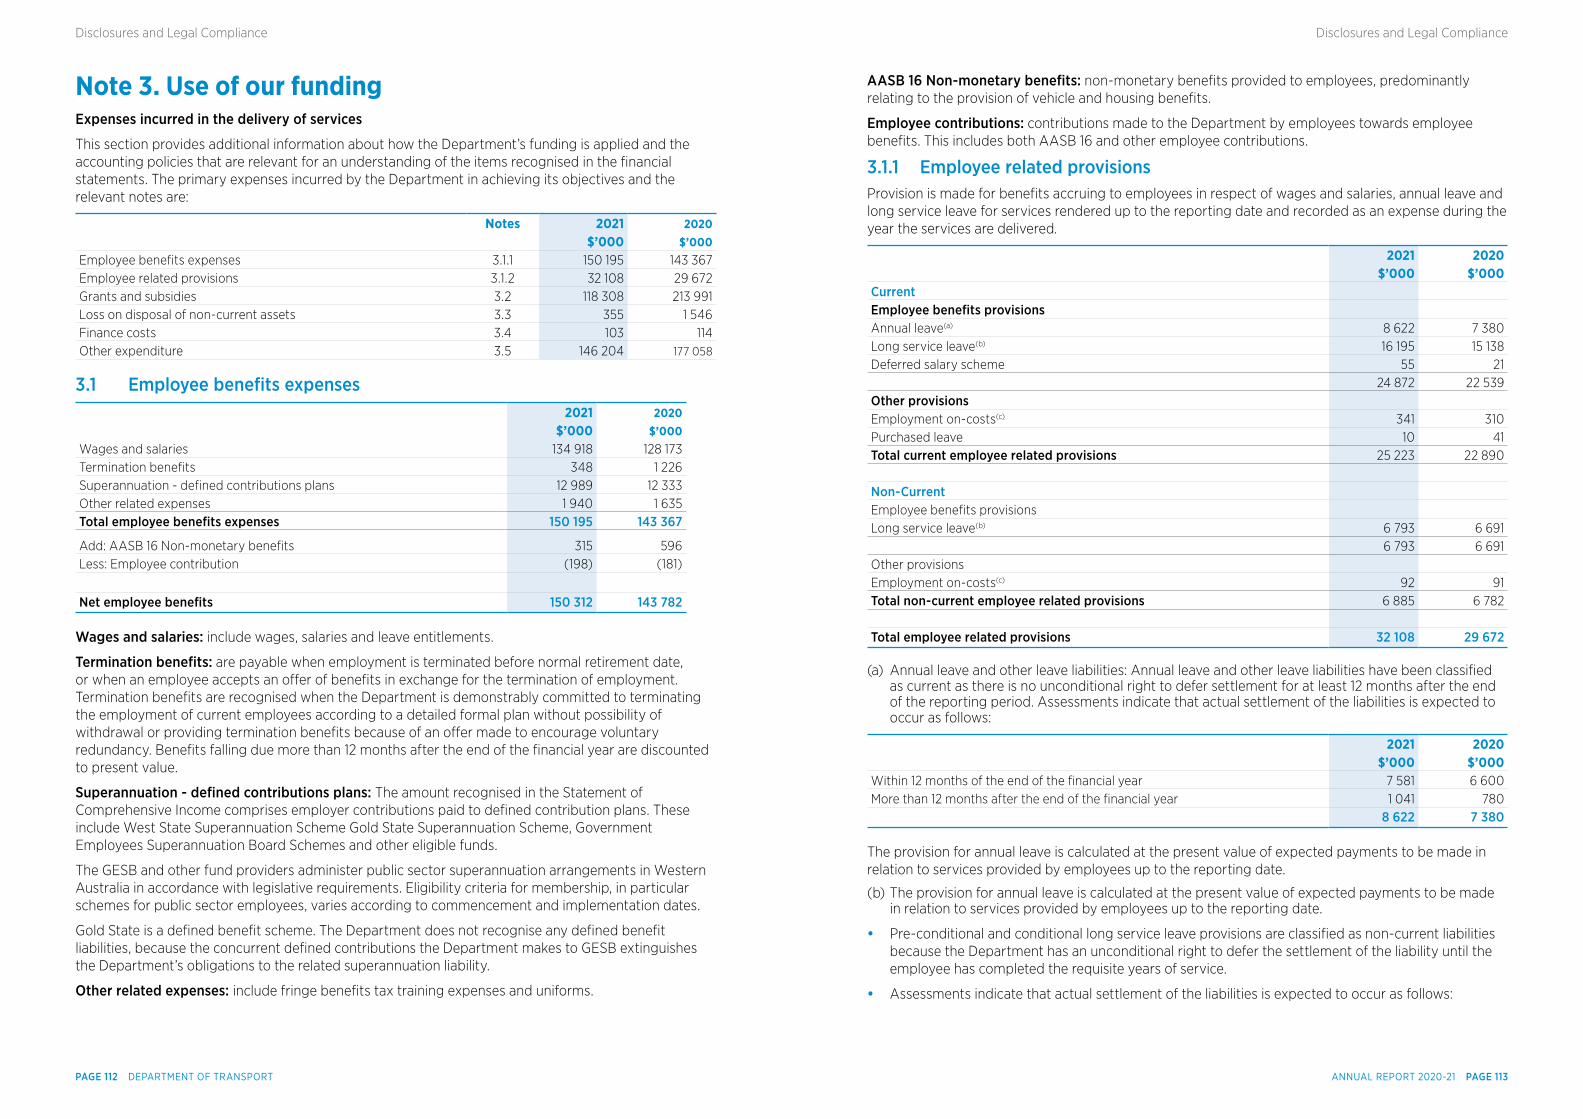
Note 3. Use of our fundingExpenses incurred in the delivery of services
This section provides additional information about how the Department’s funding is applied and the accounting policies that are relevant for an understanding of the items recognised in the financial statements. The primary expenses incurred by the Department in achieving its objectives and the relevant notes are:
Notes 2021 2020 $’000 $’000
Employee benefits expenses 3.1.1 150 195 143 367Employee related provisions 3.1.2 32 108 29 672Grants and subsidies 3.2 118 308 213 991Loss on disposal of non-current assets 3.3 355 1 546Finance costs 3.4 103 114Other expenditure 3.5 146 204 177 058
3.1 Employee benefts expenses 2021 2020 $’000 $’000
Wages and salaries 134 918 128 173Termination benefits 348 1 226Superannuation - defined contributions plans 12 989 12 333Other related expenses 1 940 1 635Total employee benefts expenses 150 195 143 367
Add: AASB 16 Non-monetary benefits 315 596Less: Employee contribution (198) (181)
Net employee benefts 150 312 143 782
Wages and salaries: include wages, salaries and leave entitlements.
Termination benefts: are payable when employment is terminated before normal retirement date, or when an employee accepts an offer of benefits in exchange for the termination of employment. Termination benefits are recognised when the Department is demonstrably committed to terminating the employment of current employees according to a detailed formal plan without possibility of withdrawal or providing termination benefits because of an offer made to encourage voluntary redundancy. Benefits falling due more than 12 months after the end of the financial year are discounted to present value.
Superannuation - defned contributions plans: The amount recognised in the Statement of Comprehensive Income comprises employer contributions paid to defined contribution plans. These include West State Superannuation Scheme Gold State Superannuation Scheme, Government Employees Superannuation Board Schemes and other eligible funds.
The GESB and other fund providers administer public sector superannuation arrangements in Western Australia in accordance with legislative requirements. Eligibility criteria for membership, in particular schemes for public sector employees, varies according to commencement and implementation dates.
Gold State is a defined benefit scheme. The Department does not recognise any defined benefit liabilities, because the concurrent defined contributions the Department makes to GESB extinguishes the Department’s obligations to the related superannuation liability.
Other related expenses: include fringe benefits tax training expenses and uniforms.
AASB 16 Non-monetary benefts: non-monetary benefits provided to employees, predominantly relating to the provision of vehicle and housing benefits.
Employee contributions: contributions made to the Department by employees towards employee benefits. This includes both AASB 16 and other employee contributions.
3.1.1 Employee related provisionsProvision is made for benefits accruing to employees in respect of wages and salaries, annual leave and long service leave for services rendered up to the reporting date and recorded as an expense during the year the services are delivered.
2021 2020 $’000 $’000
Current Employee benefts provisions Annual leave(a) 8 622 7 380Long service leave(b) 16 195 15 138Deferred salary scheme 55 21 24 872 22 539Other provisions Employment on-costs(c) 341 310Purchased leave 10 41Total current employee related provisions 25 223 22 890 Non-Current Employee benefits provisions Long service leave(b) 6 793 6 691 6 793 6 691Other provisions Employment on-costs(c) 92 91Total non-current employee related provisions 6 885 6 782 Total employee related provisions 32 108 29 672
(a) Annual leave and other leave liabilities: Annual leave and other leave liabilities have been classified as current as there is no unconditional right to defer settlement for at least 12 months after the end of the reporting period. Assessments indicate that actual settlement of the liabilities is expected to occur as follows:
2021 2020 $’000 $’000Within 12 months of the end of the financial year 7 581 6 600More than 12 months after the end of the financial year 1 041 780 8 622 7 380
The provision for annual leave is calculated at the present value of expected payments to be made in relation to services provided by employees up to the reporting date.
(b) The provision for annual leave is calculated at the present value of expected payments to be made in relation to services provided by employees up to the reporting date.
• Pre-conditional and conditional long service leave provisions are classified as non-current liabilities because the Department has an unconditional right to defer the settlement of the liability until the employee has completed the requisite years of service.
• Assessments indicate that actual settlement of the liabilities is expected to occur as follows:
ANNUAL REPORT 2020-21 PAGE 113PAGE 112 DEPARTMENT OF TRANSPORT
Disclosures and Legal ComplianceDisclosures and Legal Compliance
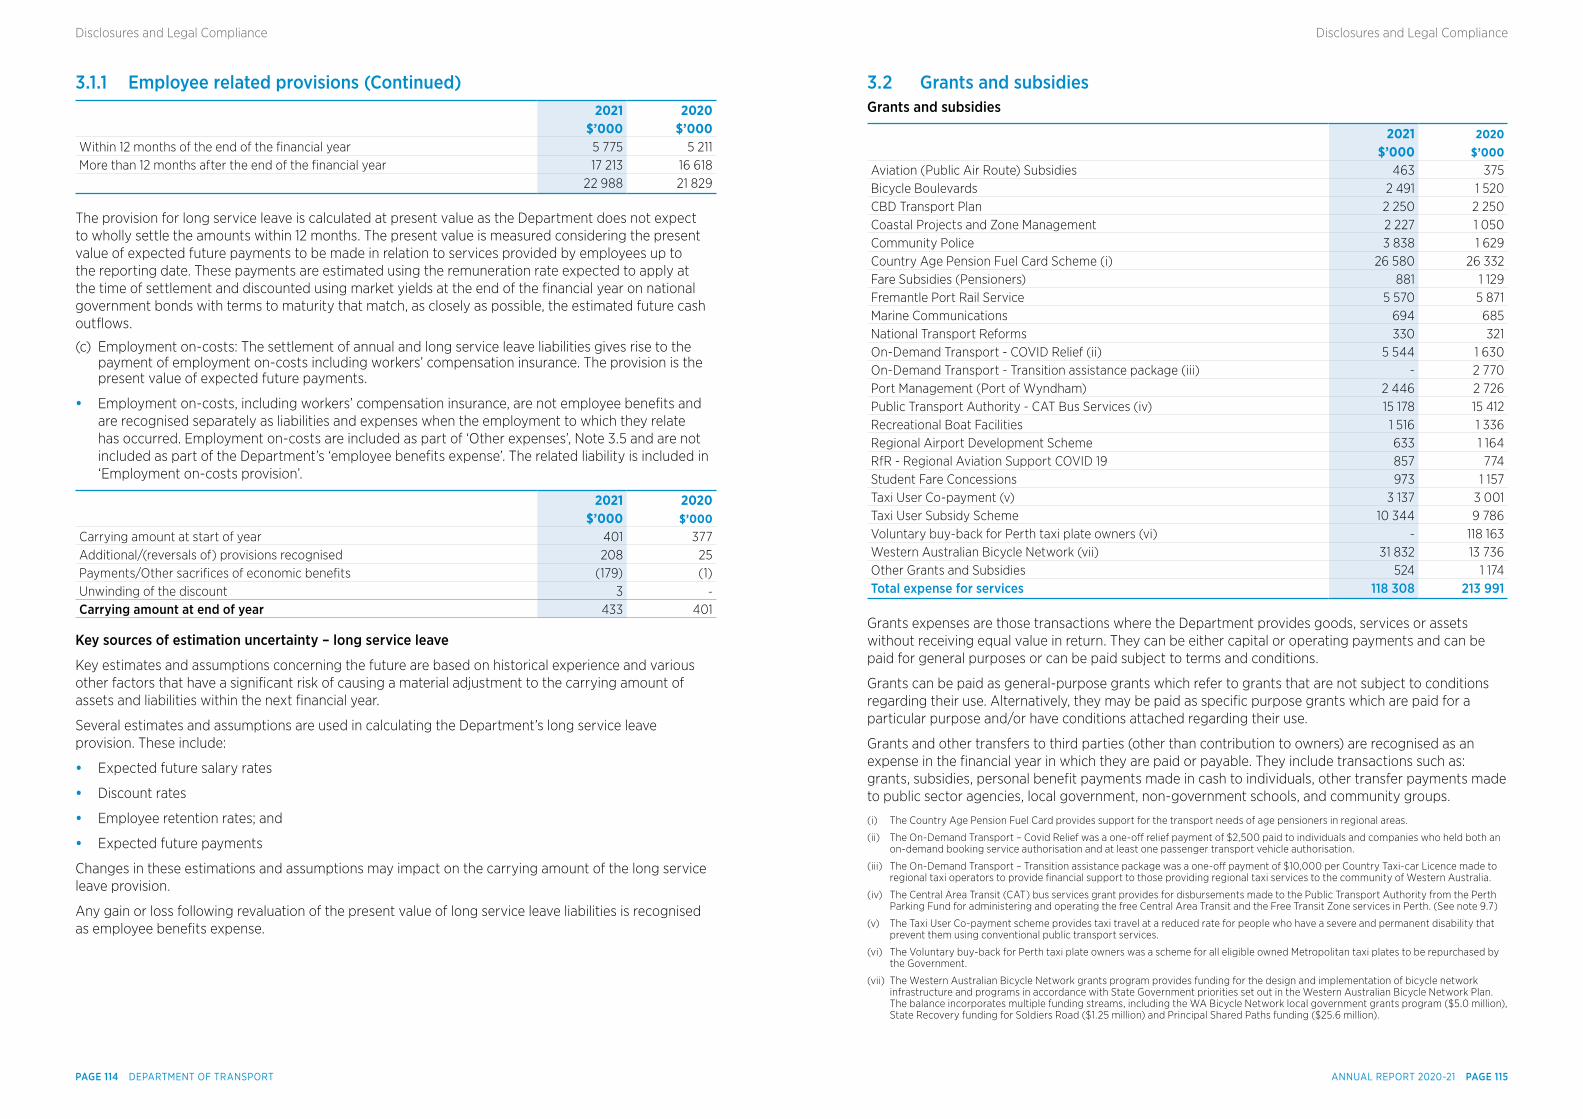
3.1.1 Employee related provisions (Continued) 2021 2020 $’000 $’000
Within 12 months of the end of the financial year 5 775 5 211More than 12 months after the end of the financial year 17 213 16 618 22 988 21 829
The provision for long service leave is calculated at present value as the Department does not expect to wholly settle the amounts within 12 months. The present value is measured considering the present value of expected future payments to be made in relation to services provided by employees up to the reporting date. These payments are estimated using the remuneration rate expected to apply at the time of settlement and discounted using market yields at the end of the financial year on national government bonds with terms to maturity that match, as closely as possible, the estimated future cash outflows.
(c) Employment on-costs: The settlement of annual and long service leave liabilities gives rise to the payment of employment on-costs including workers’ compensation insurance. The provision is the present value of expected future payments.
• Employment on-costs, including workers’ compensation insurance, are not employee benefits and are recognised separately as liabilities and expenses when the employment to which they relate has occurred. Employment on-costs are included as part of ‘Other expenses’, Note 3.5 and are not included as part of the Department’s ‘employee benefits expense’. The related liability is included in ‘Employment on-costs provision’.
2021 2020 $’000 $’000
Carrying amount at start of year 401 377Additional/(reversals of) provisions recognised 208 25Payments/Other sacrifices of economic benefits (179) (1)Unwinding of the discount 3 -
Carrying amount at end of year 433 401
Key sources of estimation uncertainty – long service leave
Key estimates and assumptions concerning the future are based on historical experience and various other factors that have a significant risk of causing a material adjustment to the carrying amount of assets and liabilities within the next financial year.
Several estimates and assumptions are used in calculating the Department’s long service leave provision. These include:
• Expected future salary rates
• Discount rates
• Employee retention rates; and
• Expected future payments
Changes in these estimations and assumptions may impact on the carrying amount of the long service leave provision.
Any gain or loss following revaluation of the present value of long service leave liabilities is recognised as employee benefits expense.
3.2 Grants and subsidiesGrants and subsidies
2021 2020 $’000 $’000
Aviation (Public Air Route) Subsidies 463 375Bicycle Boulevards 2 491 1 520CBD Transport Plan 2 250 2 250Coastal Projects and Zone Management 2 227 1 050Community Police 3 838 1 629Country Age Pension Fuel Card Scheme (i) 26 580 26 332Fare Subsidies (Pensioners) 881 1 129Fremantle Port Rail Service 5 570 5 871Marine Communications 694 685National Transport Reforms 330 321On-Demand Transport - COVID Relief (ii) 5 544 1 630On-Demand Transport - Transition assistance package (iii) - 2 770Port Management (Port of Wyndham) 2 446 2 726Public Transport Authority - CAT Bus Services (iv) 15 178 15 412Recreational Boat Facilities 1 516 1 336Regional Airport Development Scheme 633 1 164RfR - Regional Aviation Support COVID 19 857 774Student Fare Concessions 973 1 157Taxi User Co-payment (v) 3 137 3 001Taxi User Subsidy Scheme 10 344 9 786Voluntary buy-back for Perth taxi plate owners (vi) - 118 163Western Australian Bicycle Network (vii) 31 832 13 736Other Grants and Subsidies 524 1 174Total expense for services 118 308 213 991
Grants expenses are those transactions where the Department provides goods, services or assets without receiving equal value in return. They can be either capital or operating payments and can be paid for general purposes or can be paid subject to terms and conditions.
Grants can be paid as general-purpose grants which refer to grants that are not subject to conditions regarding their use. Alternatively, they may be paid as specific purpose grants which are paid for a particular purpose and/or have conditions attached regarding their use.
Grants and other transfers to third parties (other than contribution to owners) are recognised as an expense in the financial year in which they are paid or payable. They include transactions such as: grants, subsidies, personal benefit payments made in cash to individuals, other transfer payments made to public sector agencies, local government, non-government schools, and community groups.
(i) The Country Age Pension Fuel Card provides support for the transport needs of age pensioners in regional areas.
(ii) The On-Demand Transport – Covid Relief was a one-off relief payment of $2,500 paid to individuals and companies who held both an on-demand booking service authorisation and at least one passenger transport vehicle authorisation.
(iii) The On-Demand Transport – Transition assistance package was a one-off payment of $10,000 per Country Taxi-car Licence made to regional taxi operators to provide financial support to those providing regional taxi services to the community of Western Australia.
(iv) The Central Area Transit (CAT) bus services grant provides for disbursements made to the Public Transport Authority from the Perth Parking Fund for administering and operating the free Central Area Transit and the Free Transit Zone services in Perth. (See note 9.7)
(v) The Taxi User Co-payment scheme provides taxi travel at a reduced rate for people who have a severe and permanent disability that prevent them using conventional public transport services.
(vi) The Voluntary buy-back for Perth taxi plate owners was a scheme for all eligible owned Metropolitan taxi plates to be repurchased by the Government.
(vii) The Western Australian Bicycle Network grants program provides funding for the design and implementation of bicycle network infrastructure and programs in accordance with State Government priorities set out in the Western Australian Bicycle Network Plan. The balance incorporates multiple funding streams, including the WA Bicycle Network local government grants program ($5.0 million), State Recovery funding for Soldiers Road ($1.25 million) and Principal Shared Paths funding ($25.6 million).
ANNUAL REPORT 2020-21 PAGE 115PAGE 114 DEPARTMENT OF TRANSPORT
Disclosures and Legal ComplianceDisclosures and Legal Compliance
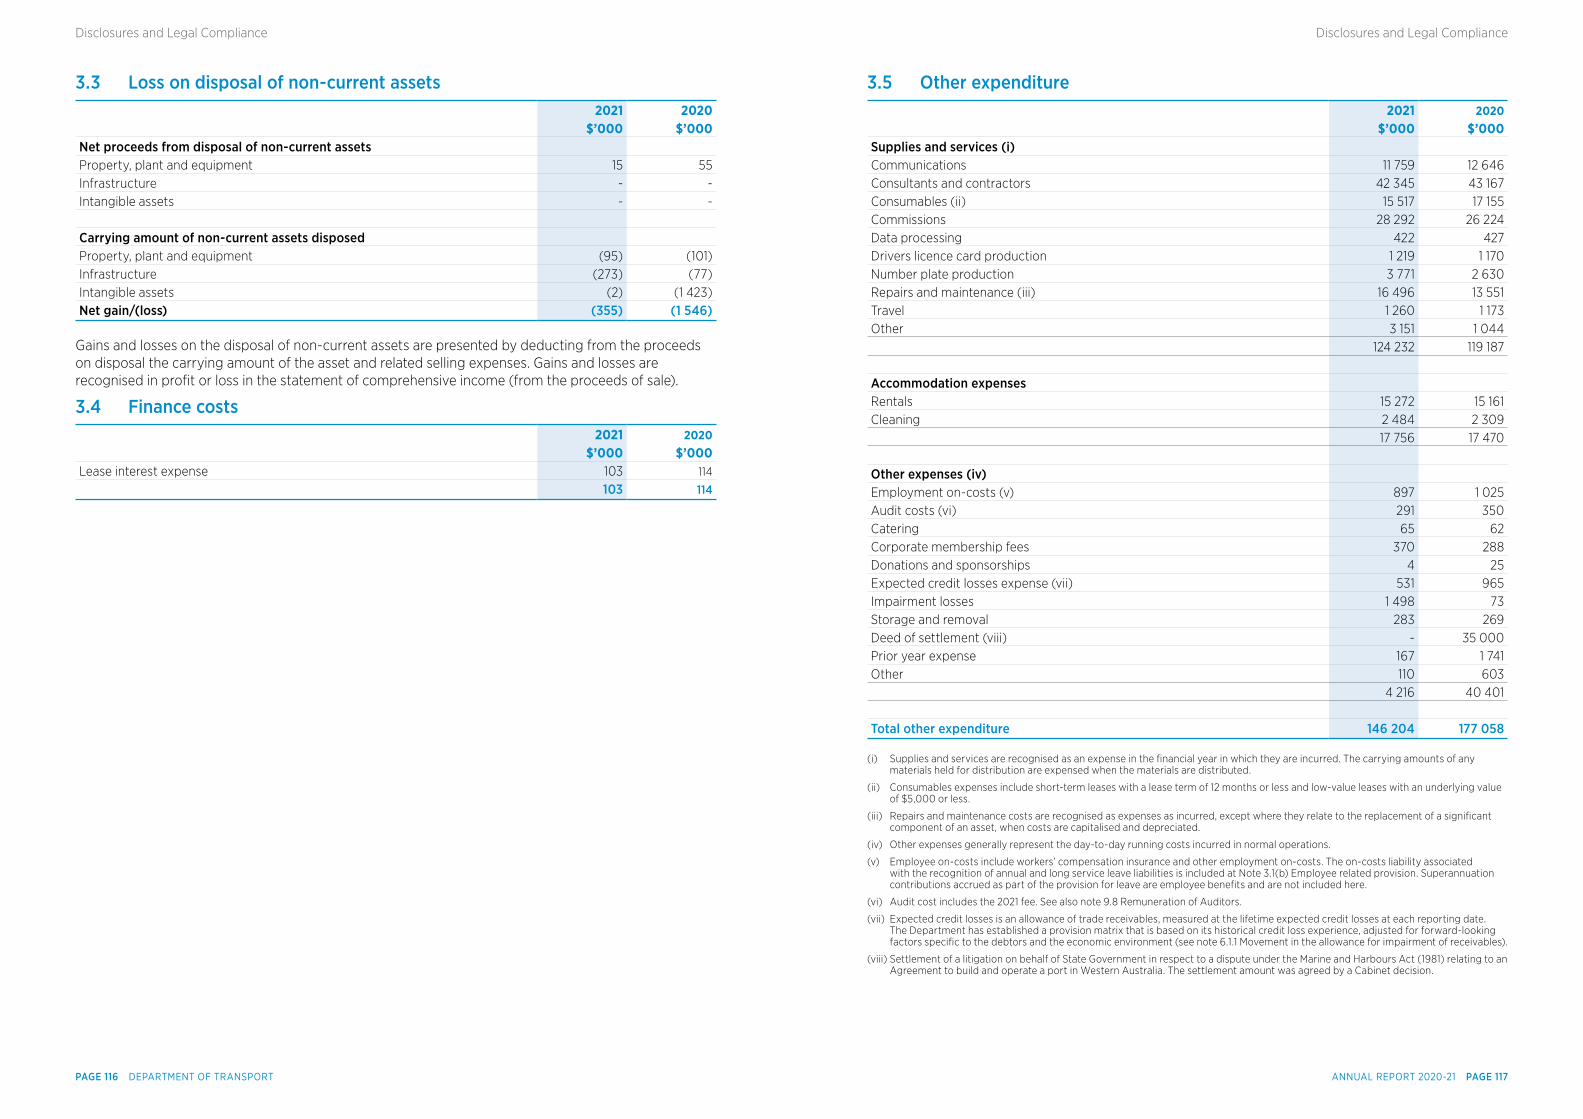
3.3 Loss on disposal of non-current assets 2021 2020 $’000 $’000
Net proceeds from disposal of non-current assets Property, plant and equipment 15 55Infrastructure - -Intangible assets - - Carrying amount of non-current assets disposed Property, plant and equipment (95) (101)Infrastructure (273) (77)Intangible assets (2) (1 423)Net gain/(loss) (355) (1 546)
Gains and losses on the disposal of non-current assets are presented by deducting from the proceeds on disposal the carrying amount of the asset and related selling expenses. Gains and losses are recognised in profit or loss in the statement of comprehensive income (from the proceeds of sale).
3.4 Finance costs 2021 2020 $’000 $’000Lease interest expense 103 114
103 114
3.5 Other expenditure 2021 2020 $’000 $’000
Supplies and services (i) Communications 11 759 12 646Consultants and contractors 42 345 43 167Consumables (ii) 15 517 17 155Commissions 28 292 26 224Data processing 422 427Drivers licence card production 1 219 1 170Number plate production 3 771 2 630Repairs and maintenance (iii) 16 496 13 551Travel 1 260 1 173Other 3 151 1 044 124 232 119 187 Accommodation expenses Rentals 15 272 15 161Cleaning 2 484 2 309 17 756 17 470
Other expenses (iv) Employment on-costs (v) 897 1 025Audit costs (vi) 291 350Catering 65 62Corporate membership fees 370 288Donations and sponsorships 4 25Expected credit losses expense (vii) 531 965Impairment losses 1 498 73Storage and removal 283 269Deed of settlement (viii) - 35 000Prior year expense 167 1 741Other 110 603 4 216 40 401 Total other expenditure 146 204 177 058
(i) Supplies and services are recognised as an expense in the financial year in which they are incurred. The carrying amounts of any materials held for distribution are expensed when the materials are distributed.
(ii) Consumables expenses include short-term leases with a lease term of 12 months or less and low-value leases with an underlying value of $5,000 or less.
(iii) Repairs and maintenance costs are recognised as expenses as incurred, except where they relate to the replacement of a significant component of an asset, when costs are capitalised and depreciated.
(iv) Other expenses generally represent the day-to-day running costs incurred in normal operations.
(v) Employee on-costs include workers’ compensation insurance and other employment on-costs. The on-costs liability associated with the recognition of annual and long service leave liabilities is included at Note 3.1(b) Employee related provision. Superannuation contributions accrued as part of the provision for leave are employee benefits and are not included here.
(vi) Audit cost includes the 2021 fee. See also note 9.8 Remuneration of Auditors.
(vii) Expected credit losses is an allowance of trade receivables, measured at the lifetime expected credit losses at each reporting date. The Department has established a provision matrix that is based on its historical credit loss experience, adjusted for forward-looking factors specific to the debtors and the economic environment (see note 6.1.1 Movement in the allowance for impairment of receivables).
(viii) Settlement of a litigation on behalf of State Government in respect to a dispute under the Marine and Harbours Act (1981) relating to an Agreement to build and operate a port in Western Australia. The settlement amount was agreed by a Cabinet decision.
ANNUAL REPORT 2020-21 PAGE 117PAGE 116 DEPARTMENT OF TRANSPORT
Disclosures and Legal ComplianceDisclosures and Legal Compliance
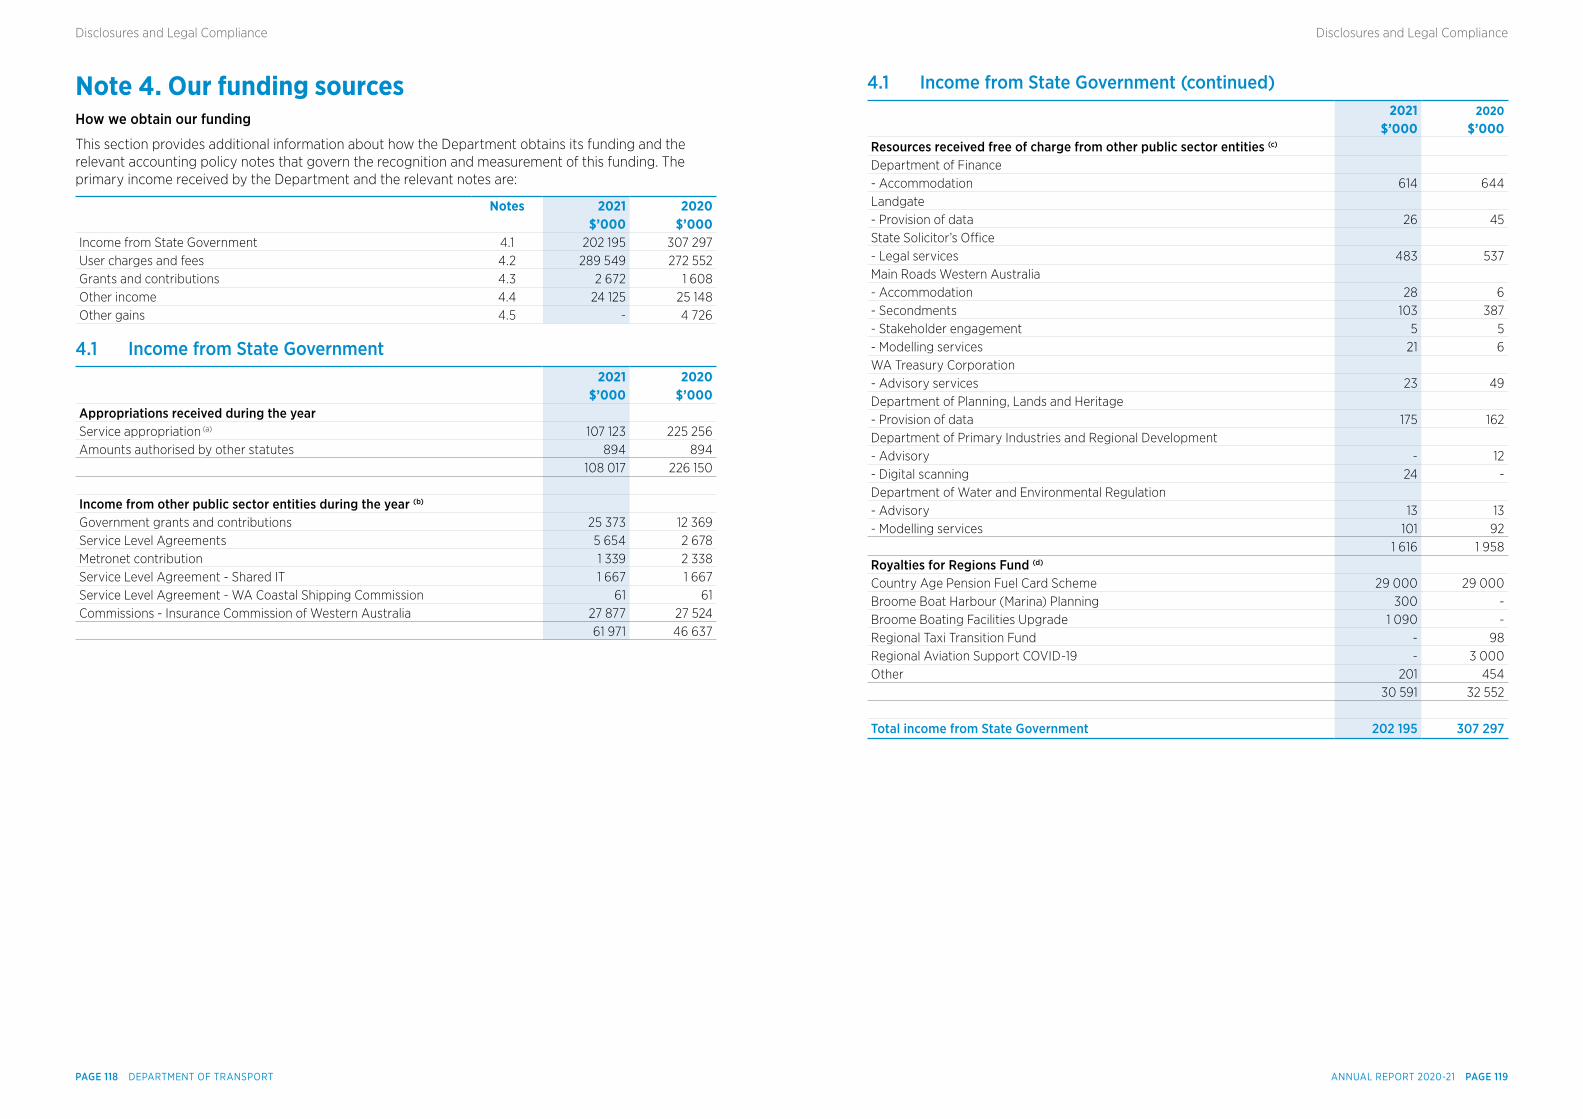
Note 4. Our funding sources How we obtain our funding
This section provides additional information about how the Department obtains its funding and the relevant accounting policy notes that govern the recognition and measurement of this funding. The primary income received by the Department and the relevant notes are:
Notes 2021 2020 $’000 $’000
Income from State Government 4.1 202 195 307 297User charges and fees 4.2 289 549 272 552Grants and contributions 4.3 2 672 1 608Other income 4.4 24 125 25 148Other gains 4.5 - 4 726
4.1 Income from State Government 2021 2020 $’000 $’000
Appropriations received during the year Service appropriation (a) 107 123 225 256Amounts authorised by other statutes 894 894 108 017 226 150 Income from other public sector entities during the year (b) Government grants and contributions 25 373 12 369Service Level Agreements 5 654 2 678Metronet contribution 1 339 2 338Service Level Agreement - Shared IT 1 667 1 667Service Level Agreement - WA Coastal Shipping Commission 61 61Commissions - Insurance Commission of Western Australia 27 877 27 524 61 971 46 637
4.1 Income from State Government (continued) 2021 2020 $’000 $’000
Resources received free of charge from other public sector entities (c) Department of Finance - Accommodation 614 644Landgate - Provision of data 26 45State Solicitor’s Office - Legal services 483 537Main Roads Western Australia - Accommodation 28 6- Secondments 103 387- Stakeholder engagement 5 5- Modelling services 21 6WA Treasury Corporation - Advisory services 23 49Department of Planning, Lands and Heritage - Provision of data 175 162Department of Primary Industries and Regional Development - Advisory - 12- Digital scanning 24 -Department of Water and Environmental Regulation - Advisory 13 13- Modelling services 101 92 1 616 1 958Royalties for Regions Fund (d) Country Age Pension Fuel Card Scheme 29 000 29 000Broome Boat Harbour (Marina) Planning 300 -Broome Boating Facilities Upgrade 1 090 -Regional Taxi Transition Fund - 98Regional Aviation Support COVID-19 - 3 000Other 201 454 30 591 32 552 Total income from State Government 202 195 307 297
ANNUAL REPORT 2020-21 PAGE 119PAGE 118 DEPARTMENT OF TRANSPORT
Disclosures and Legal ComplianceDisclosures and Legal Compliance
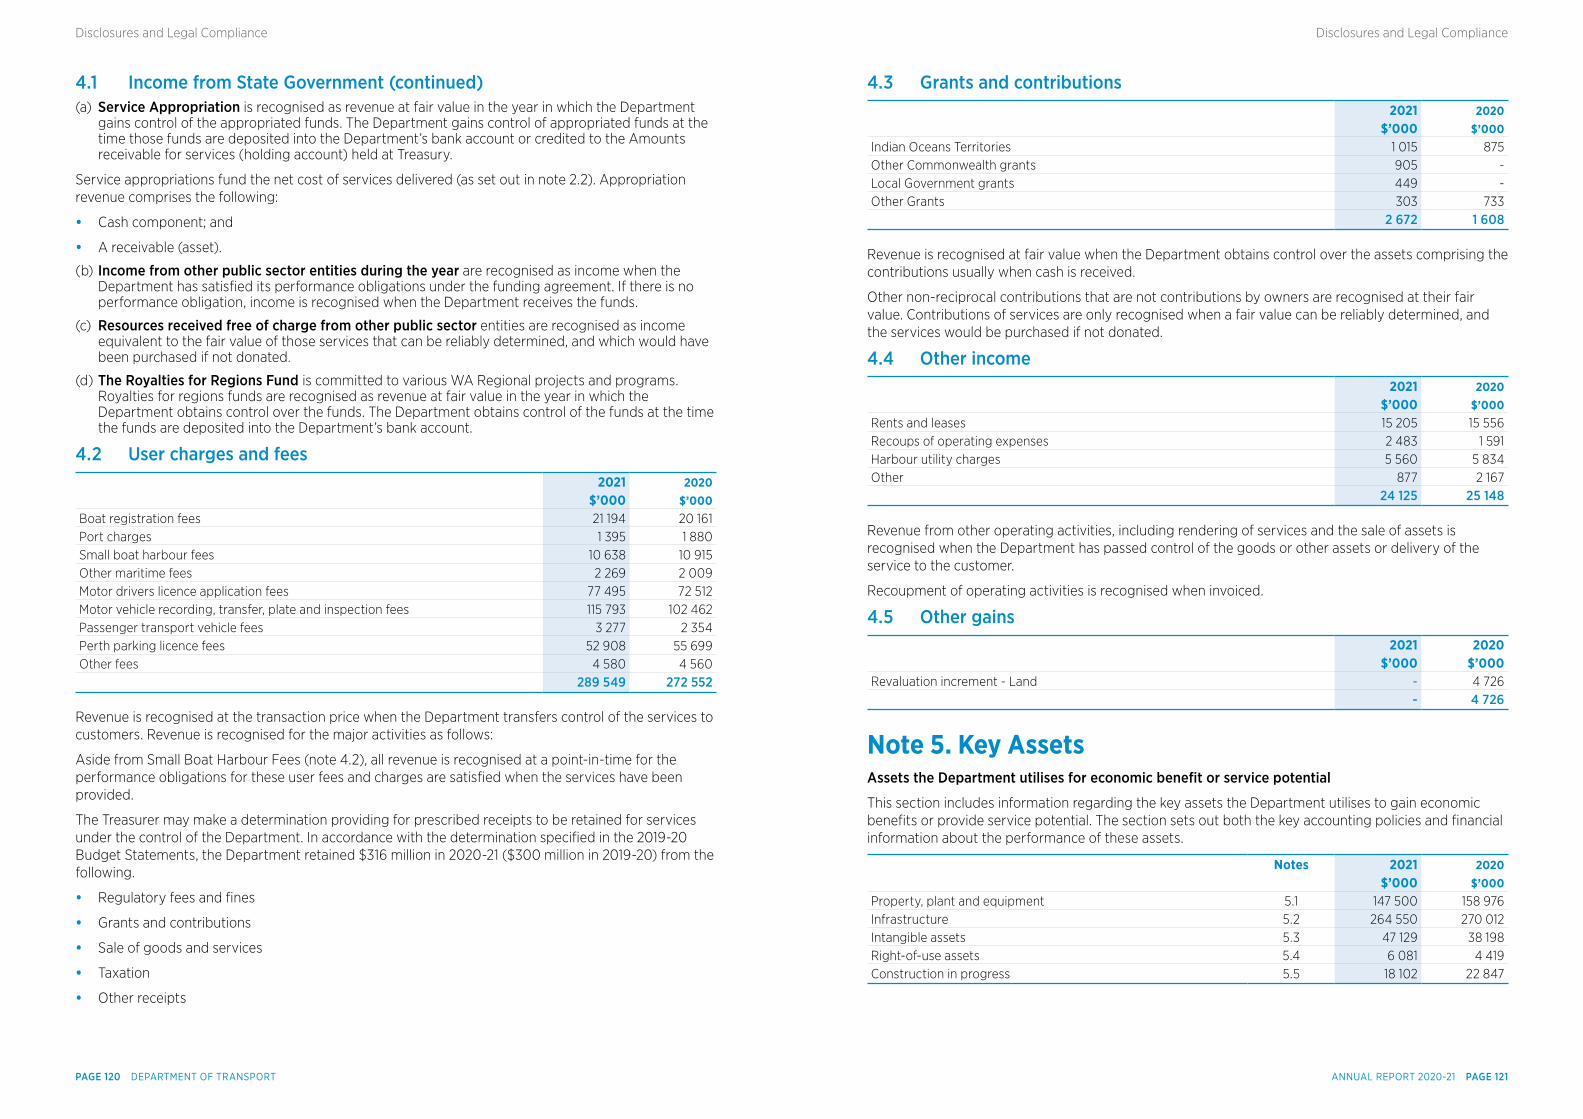
4.1 Income from State Government (continued)(a) Service Appropriation is recognised as revenue at fair value in the year in which the Department
gains control of the appropriated funds. The Department gains control of appropriated funds at the time those funds are deposited into the Department’s bank account or credited to the Amounts receivable for services (holding account) held at Treasury.
Service appropriations fund the net cost of services delivered (as set out in note 2.2). Appropriation revenue comprises the following:
• Cash component; and
• A receivable (asset).
(b) Income from other public sector entities during the year are recognised as income when the Department has satisfied its performance obligations under the funding agreement. If there is no performance obligation, income is recognised when the Department receives the funds.
(c) Resources received free of charge from other public sector entities are recognised as income equivalent to the fair value of those services that can be reliably determined, and which would have been purchased if not donated.
(d) The Royalties for Regions Fund is committed to various WA Regional projects and programs. Royalties for regions funds are recognised as revenue at fair value in the year in which the Department obtains control over the funds. The Department obtains control of the funds at the time the funds are deposited into the Department’s bank account.
4.2 User charges and fees 2021 2020 $’000 $’000
Boat registration fees 21 194 20 161Port charges 1 395 1 880Small boat harbour fees 10 638 10 915Other maritime fees 2 269 2 009Motor drivers licence application fees 77 495 72 512Motor vehicle recording, transfer, plate and inspection fees 115 793 102 462Passenger transport vehicle fees 3 277 2 354Perth parking licence fees 52 908 55 699Other fees 4 580 4 560 289 549 272 552
Revenue is recognised at the transaction price when the Department transfers control of the services to customers. Revenue is recognised for the major activities as follows:
Aside from Small Boat Harbour Fees (note 4.2), all revenue is recognised at a point-in-time for the performance obligations for these user fees and charges are satisfied when the services have been provided.
The Treasurer may make a determination providing for prescribed receipts to be retained for services under the control of the Department. In accordance with the determination specified in the 2019-20 Budget Statements, the Department retained $316 million in 2020-21 ($300 million in 2019-20) from the following.
• Regulatory fees and fines
• Grants and contributions
• Sale of goods and services
• Taxation
• Other receipts
4.3 Grants and contributions 2021 2020 $’000 $’000
Indian Oceans Territories 1 015 875Other Commonwealth grants 905 -Local Government grants 449 -Other Grants 303 733 2 672 1 608
Revenue is recognised at fair value when the Department obtains control over the assets comprising the contributions usually when cash is received.
Other non-reciprocal contributions that are not contributions by owners are recognised at their fair value. Contributions of services are only recognised when a fair value can be reliably determined, and the services would be purchased if not donated.
4.4 Other income 2021 2020 $’000 $’000Rents and leases 15 205 15 556Recoups of operating expenses 2 483 1 591Harbour utility charges 5 560 5 834Other 877 2 167 24 125 25 148
Revenue from other operating activities, including rendering of services and the sale of assets is recognised when the Department has passed control of the goods or other assets or delivery of the service to the customer.
Recoupment of operating activities is recognised when invoiced.
4.5 Other gains 2021 2020 $’000 $’000Revaluation increment - Land - 4 726 - 4 726
Note 5. Key Assets Assets the Department utilises for economic beneft or service potential
This section includes information regarding the key assets the Department utilises to gain economic benefits or provide service potential. The section sets out both the key accounting policies and financial information about the performance of these assets.
Notes 2021 2020 $’000 $’000
Property, plant and equipment 5.1 147 500 158 976Infrastructure 5.2 264 550 270 012Intangible assets 5.3 47 129 38 198Right-of-use assets 5.4 6 081 4 419Construction in progress 5.5 18 102 22 847
ANNUAL REPORT 2020-21 PAGE 121PAGE 120 DEPARTMENT OF TRANSPORT
Disclosures and Legal ComplianceDisclosures and Legal Compliance
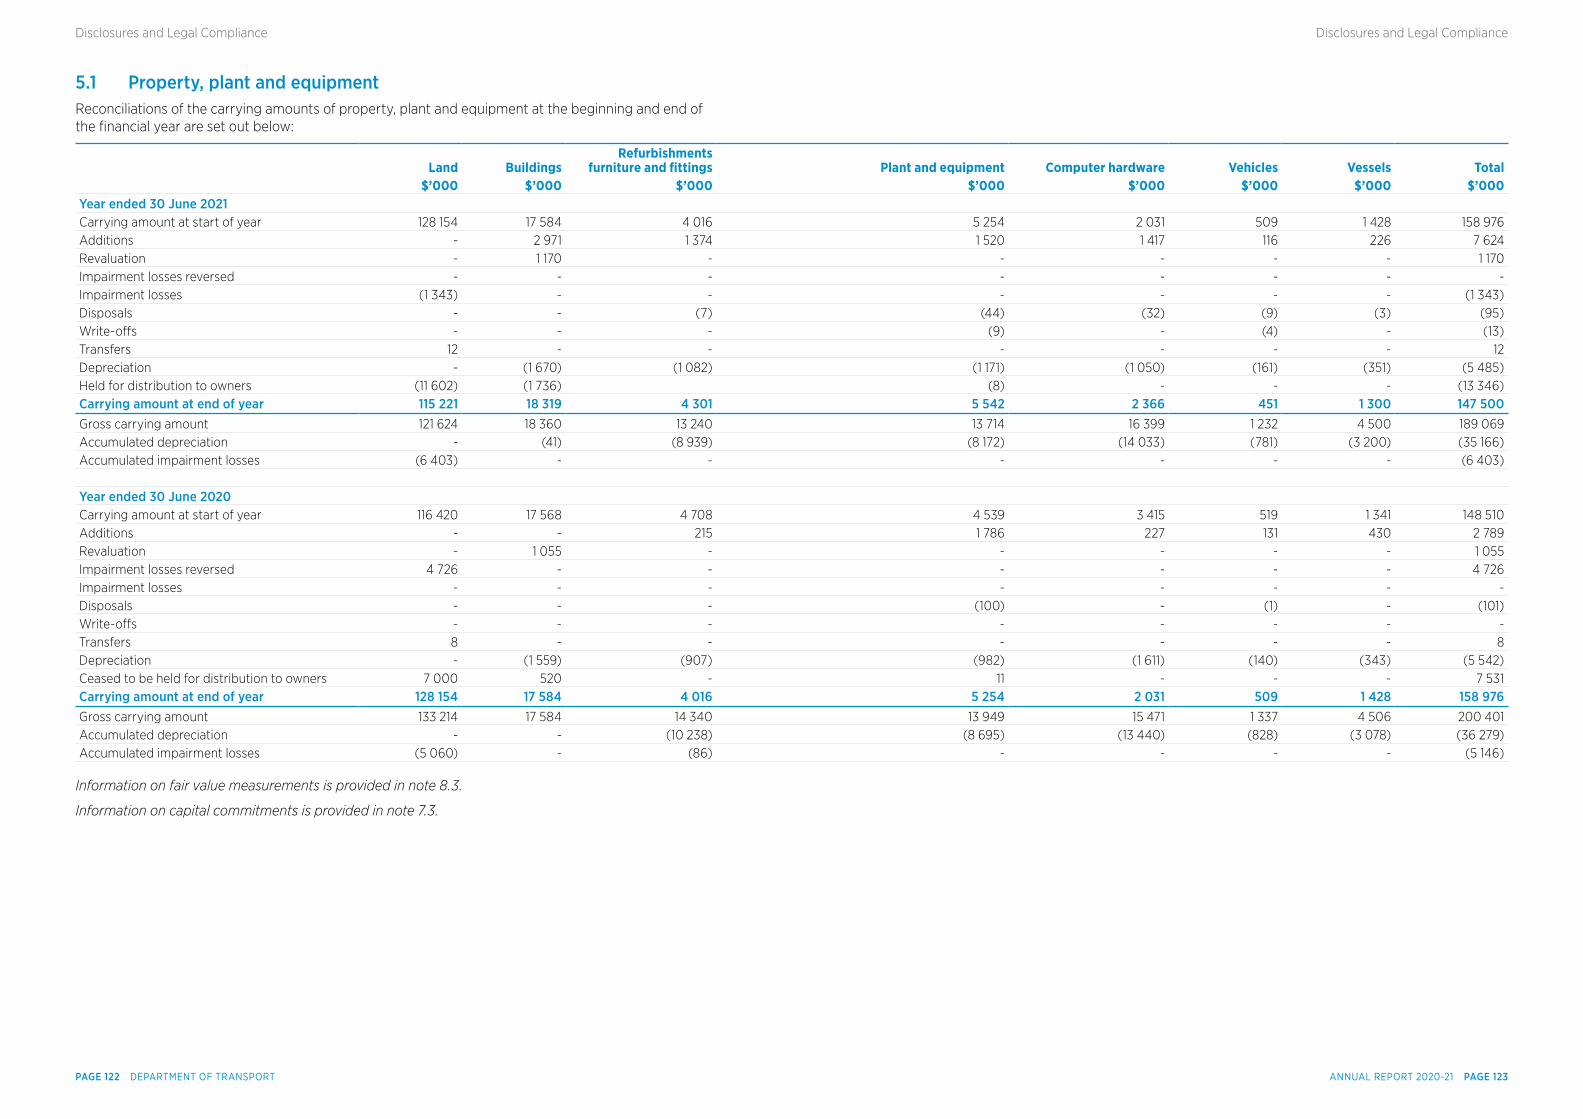
5.1 Property, plant and equipmentReconciliations of the carrying amounts of property, plant and equipment at the beginning and end of the financial year are set out below:
Land BuildingsRefurbishments
furniture and fittings Plant and equipment Computer hardware Vehicles Vessels Total $’000 $’000 $’000 $’000 $’000 $’000 $’000 $’000
Year ended 30 June 2021 Carrying amount at start of year 128 154 17 584 4 016 5 254 2 031 509 1 428 158 976Additions - 2 971 1 374 1 520 1 417 116 226 7 624Revaluation - 1 170 - - - - - 1 170Impairment losses reversed - - - - - - - -Impairment losses (1 343) - - - - - - (1 343)Disposals - - (7) (44) (32) (9) (3) (95)Write-offs - - - (9) - (4) - (13)Transfers 12 - - - - - - 12Depreciation - (1 670) (1 082) (1 171) (1 050) (161) (351) (5 485)Held for distribution to owners (11 602) (1 736) (8) - - - (13 346)Carrying amount at end of year 115 221 18 319 4 301 5 542 2 366 451 1 300 147 500Gross carrying amount 121 624 18 360 13 240 13 714 16 399 1 232 4 500 189 069Accumulated depreciation - (41) (8 939) (8 172) (14 033) (781) (3 200) (35 166)Accumulated impairment losses (6 403) - - - - - - (6 403)
Year ended 30 June 2020 Carrying amount at start of year 116 420 17 568 4 708 4 539 3 415 519 1 341 148 510Additions - - 215 1 786 227 131 430 2 789Revaluation - 1 055 - - - - - 1 055Impairment losses reversed 4 726 - - - - - - 4 726Impairment losses - - - - - - - -Disposals - - - (100) - (1) - (101)Write-offs - - - - - - - -Transfers 8 - - - - - - 8Depreciation - (1 559) (907) (982) (1 611) (140) (343) (5 542)Ceased to be held for distribution to owners 7 000 520 - 11 - - - 7 531Carrying amount at end of year 128 154 17 584 4 016 5 254 2 031 509 1 428 158 976Gross carrying amount 133 214 17 584 14 340 13 949 15 471 1 337 4 506 200 401Accumulated depreciation - - (10 238) (8 695) (13 440) (828) (3 078) (36 279)Accumulated impairment losses (5 060) - (86) - - - - (5 146)
Information on fair value measurements is provided in note 8.3.
Information on capital commitments is provided in note 7.3.
ANNUAL REPORT 2020-21 PAGE 123PAGE 122 DEPARTMENT OF TRANSPORT
Disclosures and Legal ComplianceDisclosures and Legal Compliance
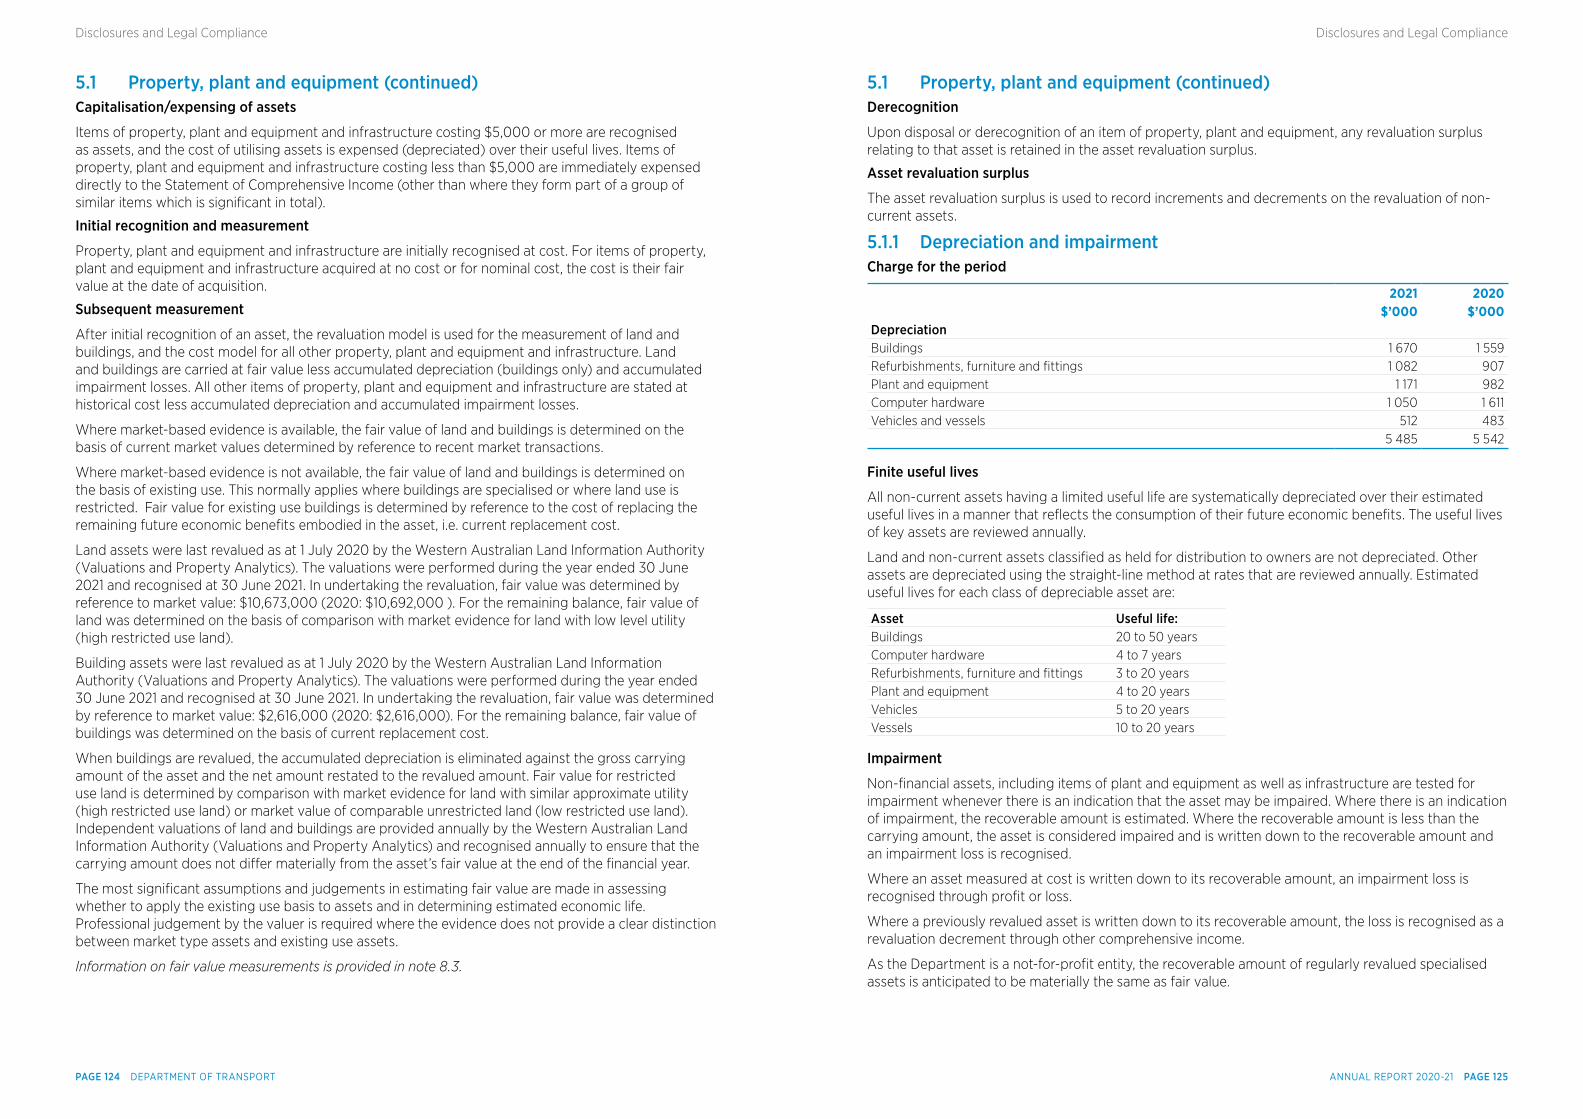
5.1 Property, plant and equipment (continued)Capitalisation/expensing of assets
Items of property, plant and equipment and infrastructure costing $5,000 or more are recognised as assets, and the cost of utilising assets is expensed (depreciated) over their useful lives. Items of property, plant and equipment and infrastructure costing less than $5,000 are immediately expensed directly to the Statement of Comprehensive Income (other than where they form part of a group of similar items which is significant in total).
Initial recognition and measurement
Property, plant and equipment and infrastructure are initially recognised at cost. For items of property, plant and equipment and infrastructure acquired at no cost or for nominal cost, the cost is their fair value at the date of acquisition.
Subsequent measurement
After initial recognition of an asset, the revaluation model is used for the measurement of land and buildings, and the cost model for all other property, plant and equipment and infrastructure. Land and buildings are carried at fair value less accumulated depreciation (buildings only) and accumulated impairment losses. All other items of property, plant and equipment and infrastructure are stated at historical cost less accumulated depreciation and accumulated impairment losses.
Where market-based evidence is available, the fair value of land and buildings is determined on the basis of current market values determined by reference to recent market transactions.
Where market-based evidence is not available, the fair value of land and buildings is determined on the basis of existing use. This normally applies where buildings are specialised or where land use is restricted. Fair value for existing use buildings is determined by reference to the cost of replacing the remaining future economic benefits embodied in the asset, i.e. current replacement cost.
Land assets were last revalued as at 1 July 2020 by the Western Australian Land Information Authority (Valuations and Property Analytics). The valuations were performed during the year ended 30 June 2021 and recognised at 30 June 2021. In undertaking the revaluation, fair value was determined by reference to market value: $10,673,000 (2020: $10,692,000 ). For the remaining balance, fair value of land was determined on the basis of comparison with market evidence for land with low level utility (high restricted use land).
Building assets were last revalued as at 1 July 2020 by the Western Australian Land Information Authority (Valuations and Property Analytics). The valuations were performed during the year ended 30 June 2021 and recognised at 30 June 2021. In undertaking the revaluation, fair value was determined by reference to market value: $2,616,000 (2020: $2,616,000). For the remaining balance, fair value of buildings was determined on the basis of current replacement cost.
When buildings are revalued, the accumulated depreciation is eliminated against the gross carrying amount of the asset and the net amount restated to the revalued amount. Fair value for restricted use land is determined by comparison with market evidence for land with similar approximate utility (high restricted use land) or market value of comparable unrestricted land (low restricted use land). Independent valuations of land and buildings are provided annually by the Western Australian Land Information Authority (Valuations and Property Analytics) and recognised annually to ensure that the carrying amount does not differ materially from the asset’s fair value at the end of the financial year.
The most significant assumptions and judgements in estimating fair value are made in assessing whether to apply the existing use basis to assets and in determining estimated economic life. Professional judgement by the valuer is required where the evidence does not provide a clear distinction between market type assets and existing use assets.
Information on fair value measurements is provided in note 8.3.
5.1 Property, plant and equipment (continued)Derecognition
Upon disposal or derecognition of an item of property, plant and equipment, any revaluation surplus relating to that asset is retained in the asset revaluation surplus.
Asset revaluation surplus
The asset revaluation surplus is used to record increments and decrements on the revaluation of non-current assets.
5.1.1 Depreciation and impairmentCharge for the period
2021 2020 $’000 $’000
Depreciation Buildings 1 670 1 559Refurbishments, furniture and fittings 1 082 907Plant and equipment 1 171 982Computer hardware 1 050 1 611Vehicles and vessels 512 483 5 485 5 542
Finite useful lives
All non-current assets having a limited useful life are systematically depreciated over their estimated useful lives in a manner that reflects the consumption of their future economic benefits. The useful lives of key assets are reviewed annually.
Land and non-current assets classified as held for distribution to owners are not depreciated. Other assets are depreciated using the straight-line method at rates that are reviewed annually. Estimated useful lives for each class of depreciable asset are:
Asset Useful life:Buildings 20 to 50 yearsComputer hardware 4 to 7 yearsRefurbishments, furniture and fittings 3 to 20 yearsPlant and equipment 4 to 20 yearsVehicles 5 to 20 yearsVessels 10 to 20 years
Impairment
Non-financial assets, including items of plant and equipment as well as infrastructure are tested for impairment whenever there is an indication that the asset may be impaired. Where there is an indication of impairment, the recoverable amount is estimated. Where the recoverable amount is less than the carrying amount, the asset is considered impaired and is written down to the recoverable amount and an impairment loss is recognised.
Where an asset measured at cost is written down to its recoverable amount, an impairment loss is recognised through profit or loss.
Where a previously revalued asset is written down to its recoverable amount, the loss is recognised as a revaluation decrement through other comprehensive income.
As the Department is a not-for-profit entity, the recoverable amount of regularly revalued specialised assets is anticipated to be materially the same as fair value.
ANNUAL REPORT 2020-21 PAGE 125PAGE 124 DEPARTMENT OF TRANSPORT
Disclosures and Legal ComplianceDisclosures and Legal Compliance
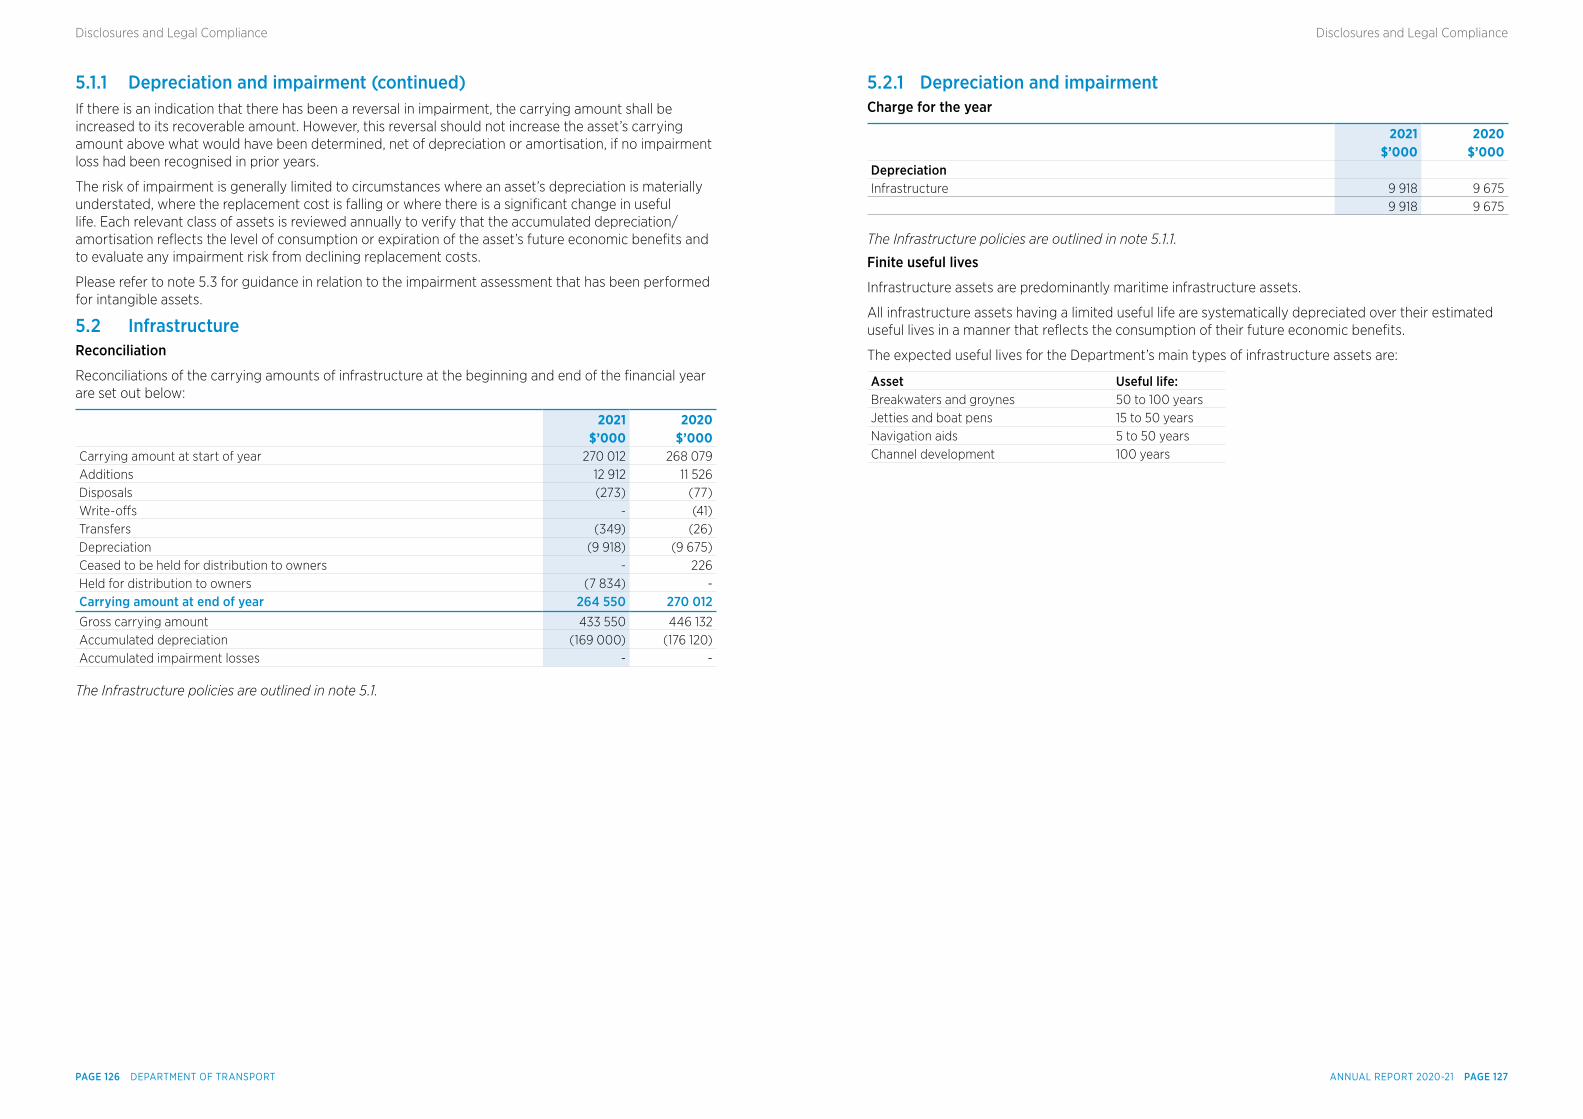
5.1.1 Depreciation and impairment (continued)If there is an indication that there has been a reversal in impairment, the carrying amount shall be increased to its recoverable amount. However, this reversal should not increase the asset’s carrying amount above what would have been determined, net of depreciation or amortisation, if no impairment loss had been recognised in prior years.
The risk of impairment is generally limited to circumstances where an asset’s depreciation is materially understated, where the replacement cost is falling or where there is a significant change in useful life. Each relevant class of assets is reviewed annually to verify that the accumulated depreciation/amortisation reflects the level of consumption or expiration of the asset’s future economic benefits and to evaluate any impairment risk from declining replacement costs.
Please refer to note 5.3 for guidance in relation to the impairment assessment that has been performed for intangible assets.
5.2 InfrastructureReconciliation
Reconciliations of the carrying amounts of infrastructure at the beginning and end of the financial year are set out below:
2021 2020 $’000 $’000Carrying amount at start of year 270 012 268 079Additions 12 912 11 526Disposals (273) (77)Write-offs - (41)Transfers (349) (26)Depreciation (9 918) (9 675)Ceased to be held for distribution to owners - 226Held for distribution to owners (7 834) -Carrying amount at end of year 264 550 270 012Gross carrying amount 433 550 446 132Accumulated depreciation (169 000) (176 120)Accumulated impairment losses - -
The Infrastructure policies are outlined in note 5.1.
5.2.1 Depreciation and impairmentCharge for the year
2021 2020 $’000 $’000Depreciation Infrastructure 9 918 9 675 9 918 9 675
The Infrastructure policies are outlined in note 5.1.1.
Finite useful lives
Infrastructure assets are predominantly maritime infrastructure assets.
All infrastructure assets having a limited useful life are systematically depreciated over their estimated useful lives in a manner that reflects the consumption of their future economic benefits.
The expected useful lives for the Department’s main types of infrastructure assets are:
Asset Useful life:Breakwaters and groynes 50 to 100 yearsJetties and boat pens 15 to 50 yearsNavigation aids 5 to 50 yearsChannel development 100 years
ANNUAL REPORT 2020-21 PAGE 127PAGE 126 DEPARTMENT OF TRANSPORT
Disclosures and Legal ComplianceDisclosures and Legal Compliance
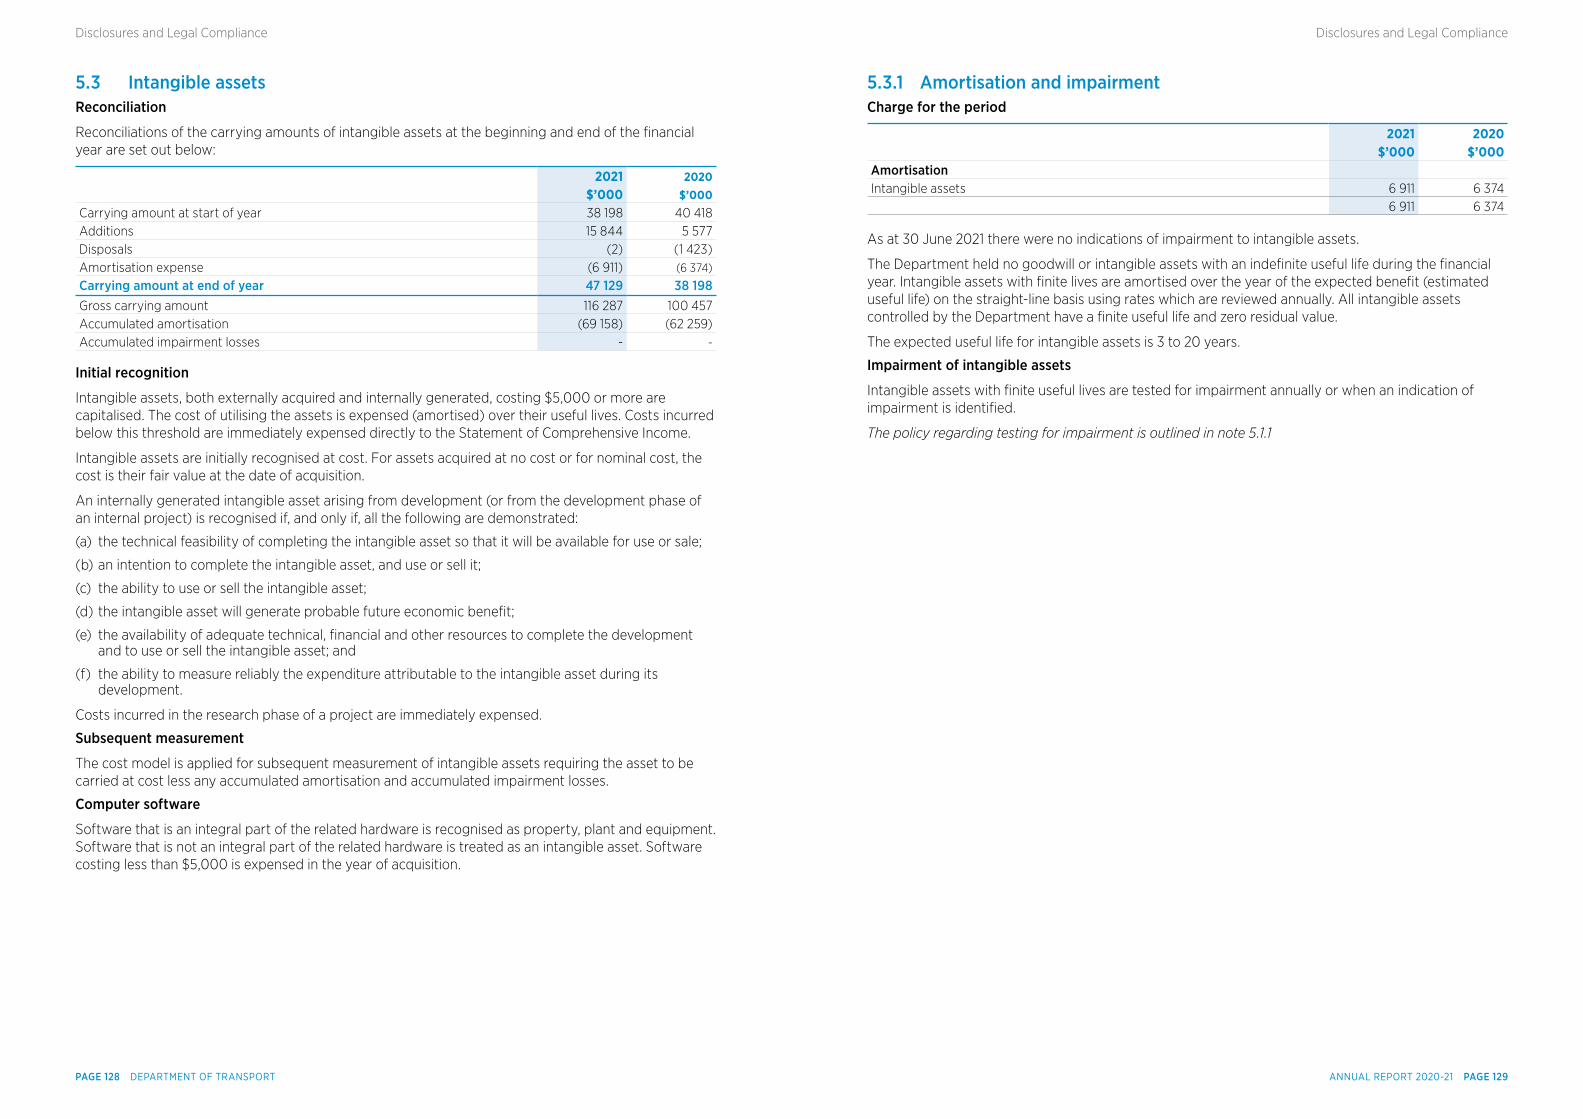
5.3 Intangible assetsReconciliation
Reconciliations of the carrying amounts of intangible assets at the beginning and end of the financial year are set out below:
2021 2020 $’000 $’000
Carrying amount at start of year 38 198 40 418Additions 15 844 5 577Disposals (2) (1 423)Amortisation expense (6 911) (6 374)
Carrying amount at end of year 47 129 38 198Gross carrying amount 116 287 100 457Accumulated amortisation (69 158) (62 259)Accumulated impairment losses - -
Initial recognition
Intangible assets, both externally acquired and internally generated, costing $5,000 or more are capitalised. The cost of utilising the assets is expensed (amortised) over their useful lives. Costs incurred below this threshold are immediately expensed directly to the Statement of Comprehensive Income.
Intangible assets are initially recognised at cost. For assets acquired at no cost or for nominal cost, the cost is their fair value at the date of acquisition.
An internally generated intangible asset arising from development (or from the development phase of an internal project) is recognised if, and only if, all the following are demonstrated:
(a) the technical feasibility of completing the intangible asset so that it will be available for use or sale;
(b) an intention to complete the intangible asset, and use or sell it;
(c) the ability to use or sell the intangible asset;
(d) the intangible asset will generate probable future economic benefit;
(e) the availability of adequate technical, financial and other resources to complete the development and to use or sell the intangible asset; and
(f) the ability to measure reliably the expenditure attributable to the intangible asset during its development.
Costs incurred in the research phase of a project are immediately expensed.
Subsequent measurement
The cost model is applied for subsequent measurement of intangible assets requiring the asset to be carried at cost less any accumulated amortisation and accumulated impairment losses.
Computer software
Software that is an integral part of the related hardware is recognised as property, plant and equipment. Software that is not an integral part of the related hardware is treated as an intangible asset. Software costing less than $5,000 is expensed in the year of acquisition.
5.3.1 Amortisation and impairmentCharge for the period
2021 2020 $’000 $’000
Amortisation Intangible assets 6 911 6 374 6 911 6 374
As at 30 June 2021 there were no indications of impairment to intangible assets.
The Department held no goodwill or intangible assets with an indefinite useful life during the financial year. Intangible assets with finite lives are amortised over the year of the expected benefit (estimated useful life) on the straight-line basis using rates which are reviewed annually. All intangible assets controlled by the Department have a finite useful life and zero residual value.
The expected useful life for intangible assets is 3 to 20 years.
Impairment of intangible assets
Intangible assets with finite useful lives are tested for impairment annually or when an indication of impairment is identified.
The policy regarding testing for impairment is outlined in note 5.1.1
ANNUAL REPORT 2020-21 PAGE 129PAGE 128 DEPARTMENT OF TRANSPORT
Disclosures and Legal ComplianceDisclosures and Legal Compliance
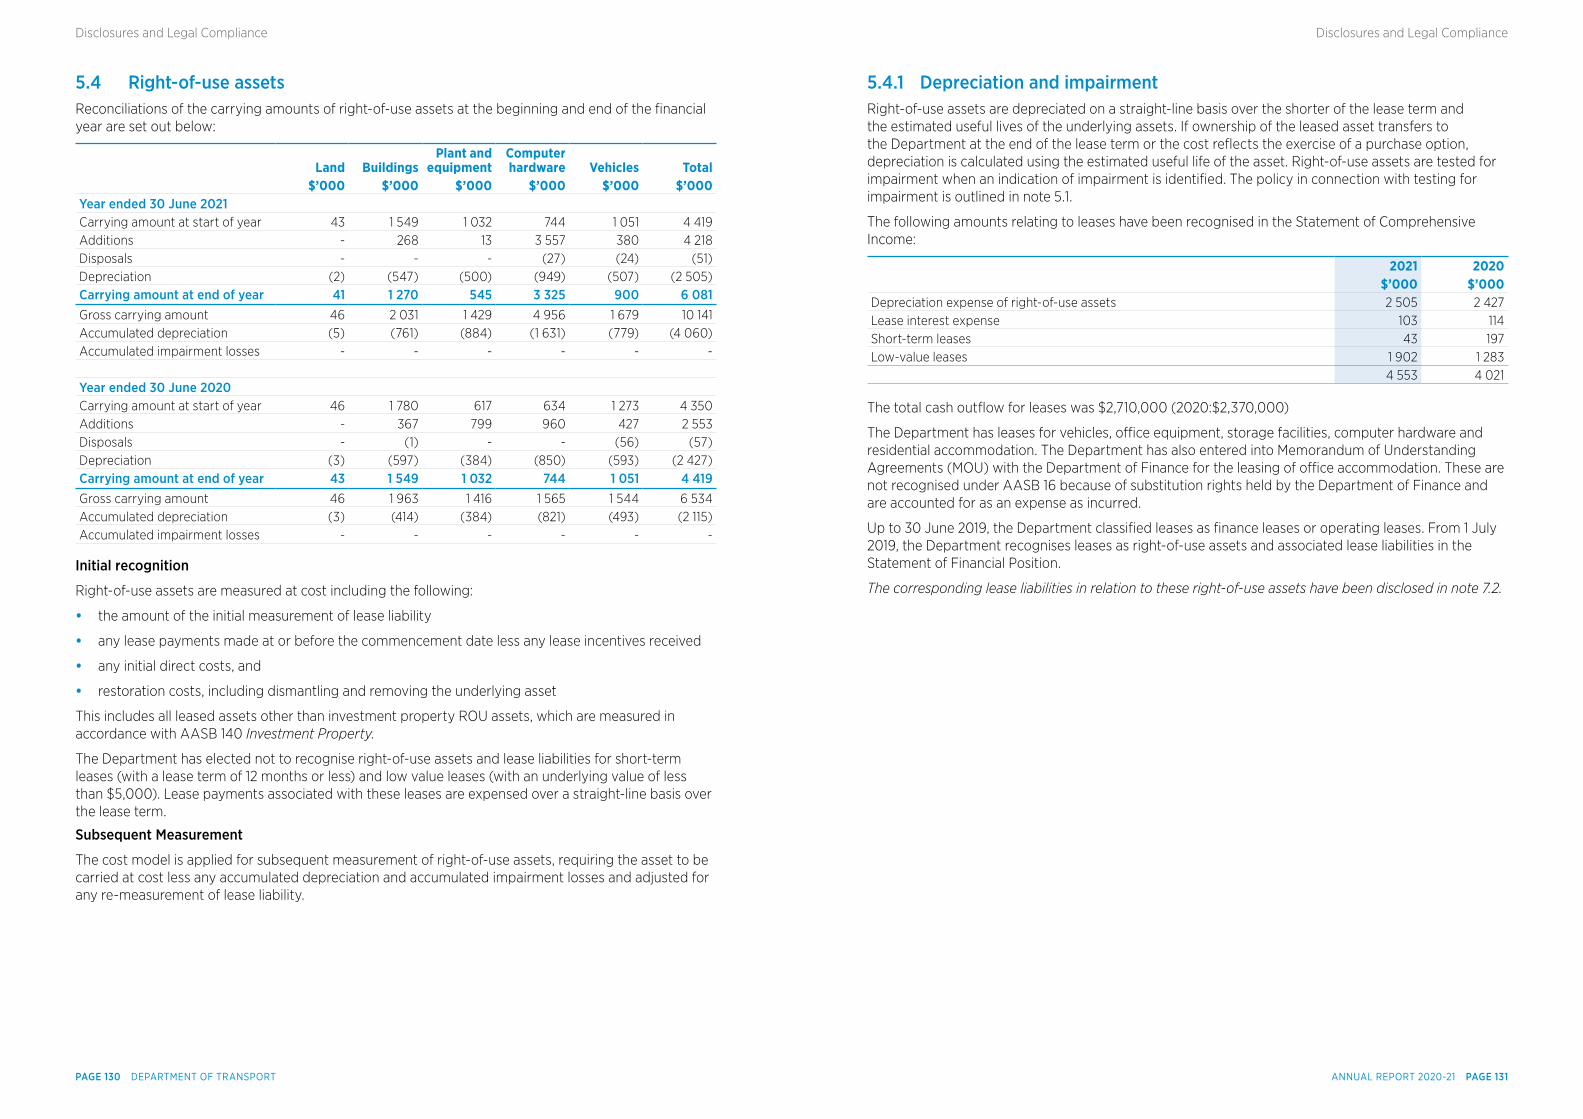
5.4 Right-of-use assetsReconciliations of the carrying amounts of right-of-use assets at the beginning and end of the financial year are set out below:
Land BuildingsPlant and
equipmentComputer hardware Vehicles Total
$’000 $’000 $’000 $’000 $’000 $’000Year ended 30 June 2021 Carrying amount at start of year 43 1 549 1 032 744 1 051 4 419 Additions - 268 13 3 557 380 4 218 Disposals - - - (27) (24) (51)Depreciation (2) (547) (500) (949) (507) (2 505)Carrying amount at end of year 41 1 270 545 3 325 900 6 081 Gross carrying amount 46 2 031 1 429 4 956 1 679 10 141 Accumulated depreciation (5) (761) (884) (1 631) (779) (4 060)Accumulated impairment losses - - - - - -
Year ended 30 June 2020 Carrying amount at start of year 46 1 780 617 634 1 273 4 350 Additions - 367 799 960 427 2 553 Disposals - (1) - - (56) (57)Depreciation (3) (597) (384) (850) (593) (2 427)Carrying amount at end of year 43 1 549 1 032 744 1 051 4 419 Gross carrying amount 46 1 963 1 416 1 565 1 544 6 534 Accumulated depreciation (3) (414) (384) (821) (493) (2 115)Accumulated impairment losses - - - - - -
Initial recognition
Right-of-use assets are measured at cost including the following:
• the amount of the initial measurement of lease liability
• any lease payments made at or before the commencement date less any lease incentives received
• any initial direct costs, and
• restoration costs, including dismantling and removing the underlying asset
This includes all leased assets other than investment property ROU assets, which are measured in accordance with AASB 140 Investment Property.
The Department has elected not to recognise right-of-use assets and lease liabilities for short-term leases (with a lease term of 12 months or less) and low value leases (with an underlying value of less than $5,000). Lease payments associated with these leases are expensed over a straight-line basis over the lease term.
Subsequent Measurement
The cost model is applied for subsequent measurement of right-of-use assets, requiring the asset to be carried at cost less any accumulated depreciation and accumulated impairment losses and adjusted for any re-measurement of lease liability.
5.4.1 Depreciation and impairmentRight-of-use assets are depreciated on a straight-line basis over the shorter of the lease term and the estimated useful lives of the underlying assets. If ownership of the leased asset transfers to the Department at the end of the lease term or the cost reflects the exercise of a purchase option, depreciation is calculated using the estimated useful life of the asset. Right-of-use assets are tested for impairment when an indication of impairment is identified. The policy in connection with testing for impairment is outlined in note 5.1.
The following amounts relating to leases have been recognised in the Statement of Comprehensive Income:
2021 2020 $’000 $’000
Depreciation expense of right-of-use assets 2 505 2 427 Lease interest expense 103 114 Short-term leases 43 197 Low-value leases 1 902 1 283 4 553 4 021
The total cash outflow for leases was $2,710,000 (2020:$2,370,000)
The Department has leases for vehicles, office equipment, storage facilities, computer hardware and residential accommodation. The Department has also entered into Memorandum of Understanding Agreements (MOU) with the Department of Finance for the leasing of office accommodation. These are not recognised under AASB 16 because of substitution rights held by the Department of Finance and are accounted for as an expense as incurred.
Up to 30 June 2019, the Department classified leases as finance leases or operating leases. From 1 July 2019, the Department recognises leases as right-of-use assets and associated lease liabilities in the Statement of Financial Position.
The corresponding lease liabilities in relation to these right-of-use assets have been disclosed in note 7.2.
ANNUAL REPORT 2020-21 PAGE 131PAGE 130 DEPARTMENT OF TRANSPORT
Disclosures and Legal ComplianceDisclosures and Legal Compliance
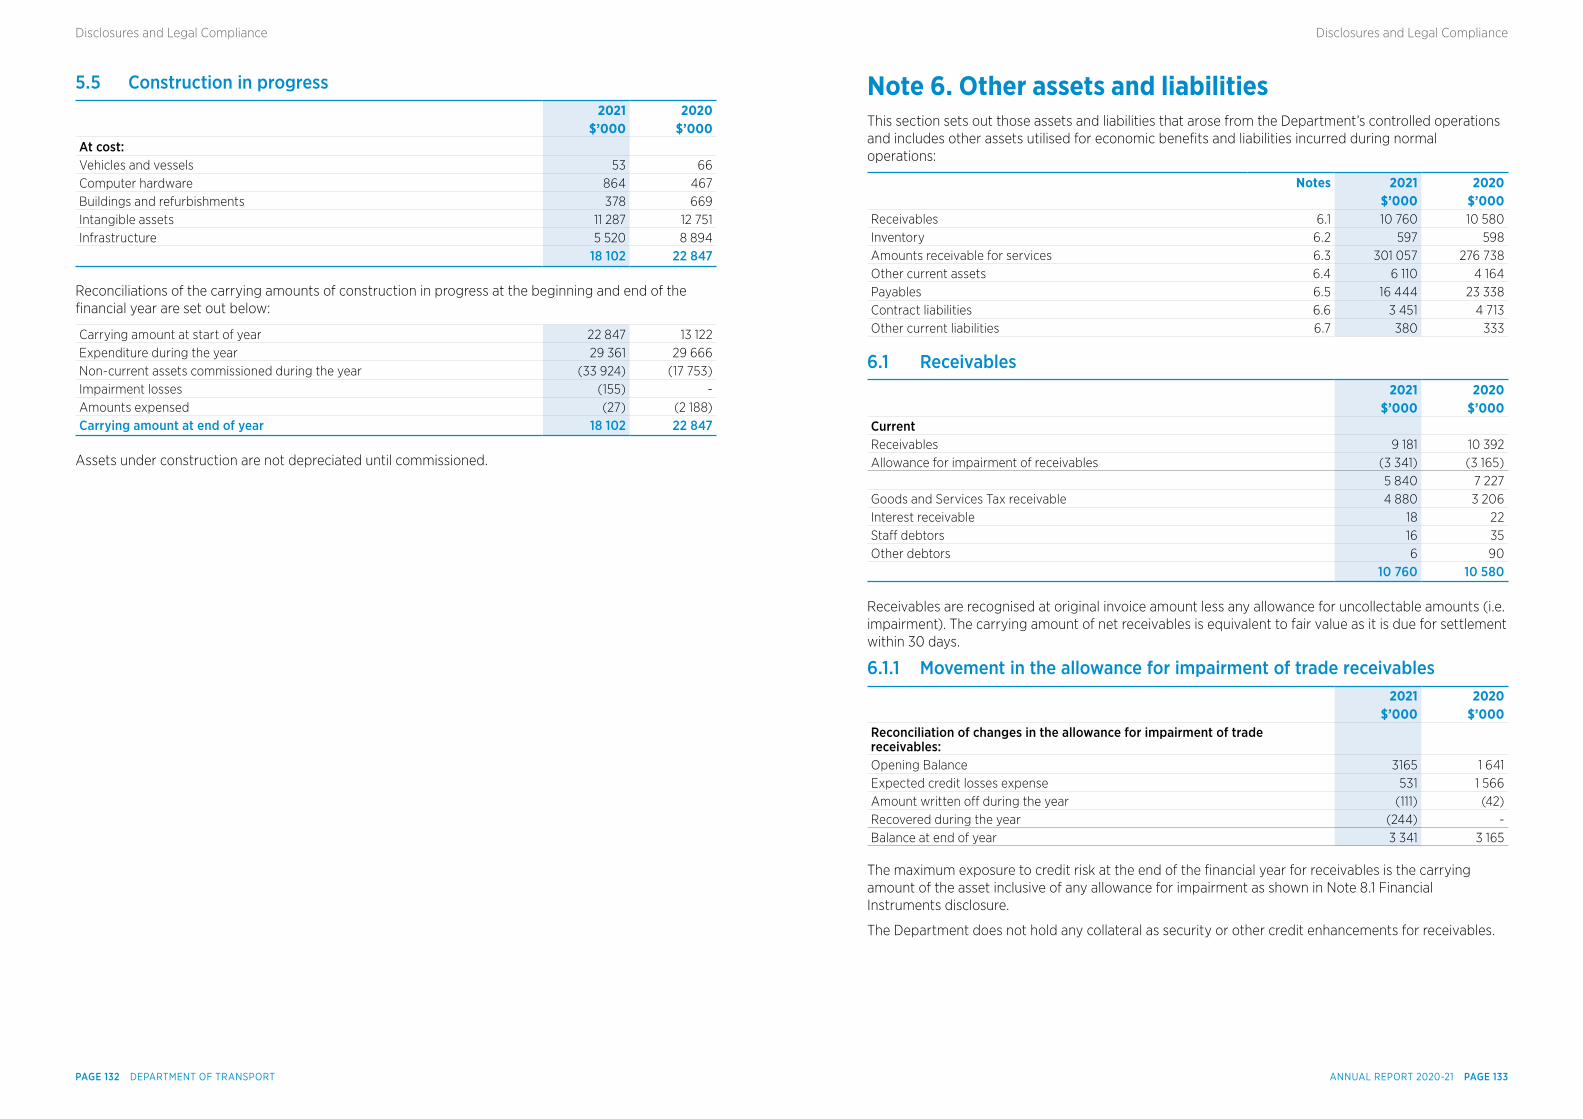
5.5 Construction in progress 2021 2020 $’000 $’000
At cost: Vehicles and vessels 53 66Computer hardware 864 467Buildings and refurbishments 378 669Intangible assets 11 287 12 751Infrastructure 5 520 8 894 18 102 22 847
Reconciliations of the carrying amounts of construction in progress at the beginning and end of the financial year are set out below:
Carrying amount at start of year 22 847 13 122Expenditure during the year 29 361 29 666Non-current assets commissioned during the year (33 924) (17 753)Impairment losses (155) -Amounts expensed (27) (2 188)Carrying amount at end of year 18 102 22 847
Assets under construction are not depreciated until commissioned.
Note 6. Other assets and liabilities This section sets out those assets and liabilities that arose from the Department’s controlled operations and includes other assets utilised for economic benefits and liabilities incurred during normal operations:
Notes 2021 2020 $’000 $’000
Receivables 6.1 10 760 10 580Inventory 6.2 597 598Amounts receivable for services 6.3 301 057 276 738Other current assets 6.4 6 110 4 164Payables 6.5 16 444 23 338Contract liabilities 6.6 3 451 4 713Other current liabilities 6.7 380 333
6.1 Receivables 2021 2020 $’000 $’000
Current Receivables 9 181 10 392Allowance for impairment of receivables (3 341) (3 165) 5 840 7 227Goods and Services Tax receivable 4 880 3 206Interest receivable 18 22Staff debtors 16 35Other debtors 6 90 10 760 10 580
Receivables are recognised at original invoice amount less any allowance for uncollectable amounts (i.e. impairment). The carrying amount of net receivables is equivalent to fair value as it is due for settlement within 30 days.
6.1.1 Movement in the allowance for impairment of trade receivables 2021 2020 $’000 $’000
Reconciliation of changes in the allowance for impairment of trade receivables: Opening Balance 3165 1 641Expected credit losses expense 531 1 566Amount written off during the year (111) (42)Recovered during the year (244) -Balance at end of year 3 341 3 165
The maximum exposure to credit risk at the end of the financial year for receivables is the carrying amount of the asset inclusive of any allowance for impairment as shown in Note 8.1 Financial Instruments disclosure.
The Department does not hold any collateral as security or other credit enhancements for receivables.
ANNUAL REPORT 2020-21 PAGE 133PAGE 132 DEPARTMENT OF TRANSPORT
Disclosures and Legal ComplianceDisclosures and Legal Compliance
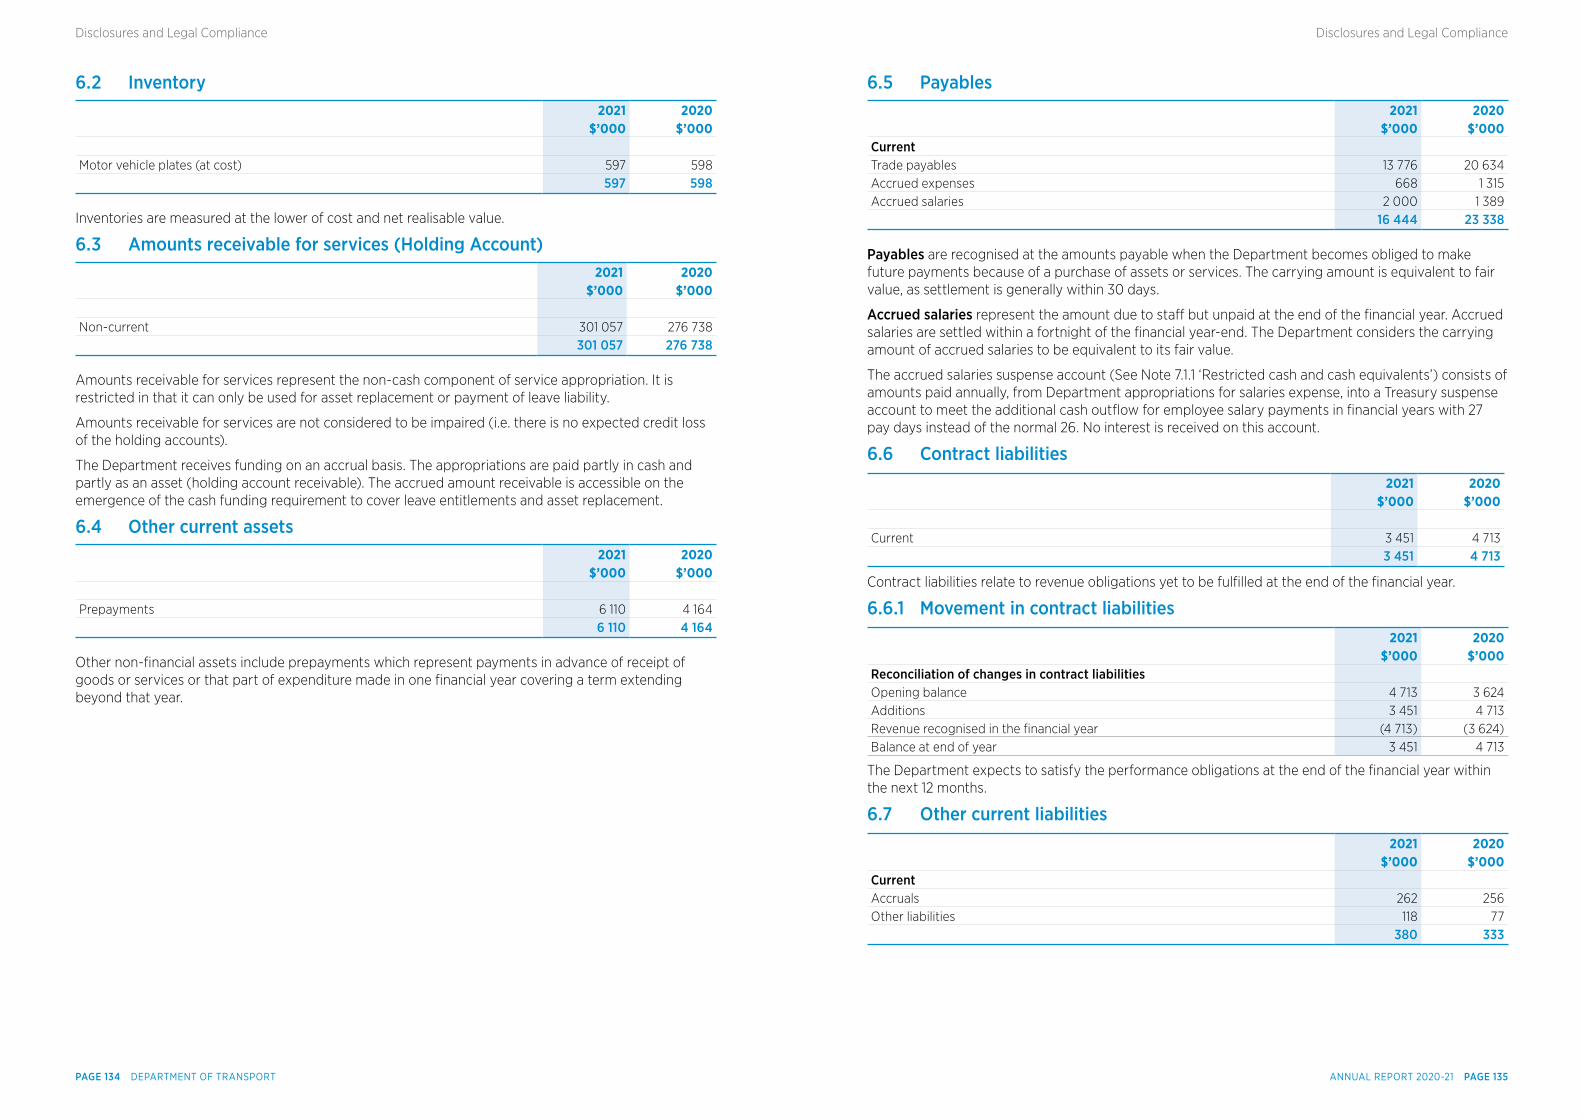
6.2 Inventory 2021 2020 $’000 $’000 Motor vehicle plates (at cost) 597 598 597 598
Inventories are measured at the lower of cost and net realisable value.
6.3 Amounts receivable for services (Holding Account) 2021 2020 $’000 $’000
Non-current 301 057 276 738 301 057 276 738
Amounts receivable for services represent the non-cash component of service appropriation. It is restricted in that it can only be used for asset replacement or payment of leave liability.
Amounts receivable for services are not considered to be impaired (i.e. there is no expected credit loss of the holding accounts).
The Department receives funding on an accrual basis. The appropriations are paid partly in cash and partly as an asset (holding account receivable). The accrued amount receivable is accessible on the emergence of the cash funding requirement to cover leave entitlements and asset replacement.
6.4 Other current assets 2021 2020 $’000 $’000
Prepayments 6 110 4 164 6 110 4 164
Other non-financial assets include prepayments which represent payments in advance of receipt of goods or services or that part of expenditure made in one financial year covering a term extending beyond that year.
6.5 Payables 2021 2020 $’000 $’000Current Trade payables 13 776 20 634Accrued expenses 668 1 315Accrued salaries 2 000 1 389 16 444 23 338
Payables are recognised at the amounts payable when the Department becomes obliged to make future payments because of a purchase of assets or services. The carrying amount is equivalent to fair value, as settlement is generally within 30 days.
Accrued salaries represent the amount due to staff but unpaid at the end of the financial year. Accrued salaries are settled within a fortnight of the financial year-end. The Department considers the carrying amount of accrued salaries to be equivalent to its fair value.
The accrued salaries suspense account (See Note 7.1.1 ‘Restricted cash and cash equivalents’) consists of amounts paid annually, from Department appropriations for salaries expense, into a Treasury suspense account to meet the additional cash outflow for employee salary payments in financial years with 27 pay days instead of the normal 26. No interest is received on this account.
6.6 Contract liabilities 2021 2020 $’000 $’000
Current 3 451 4 713 3 451 4 713
Contract liabilities relate to revenue obligations yet to be fulfilled at the end of the financial year.
6.6.1 Movement in contract liabilities 2021 2020 $’000 $’000
Reconciliation of changes in contract liabilities Opening balance 4 713 3 624Additions 3 451 4 713Revenue recognised in the financial year (4 713) (3 624)Balance at end of year 3 451 4 713
The Department expects to satisfy the performance obligations at the end of the financial year within the next 12 months.
6.7 Other current liabilities 2021 2020 $’000 $’000
Current Accruals 262 256Other liabilities 118 77 380 333
ANNUAL REPORT 2020-21 PAGE 135PAGE 134 DEPARTMENT OF TRANSPORT
Disclosures and Legal ComplianceDisclosures and Legal Compliance
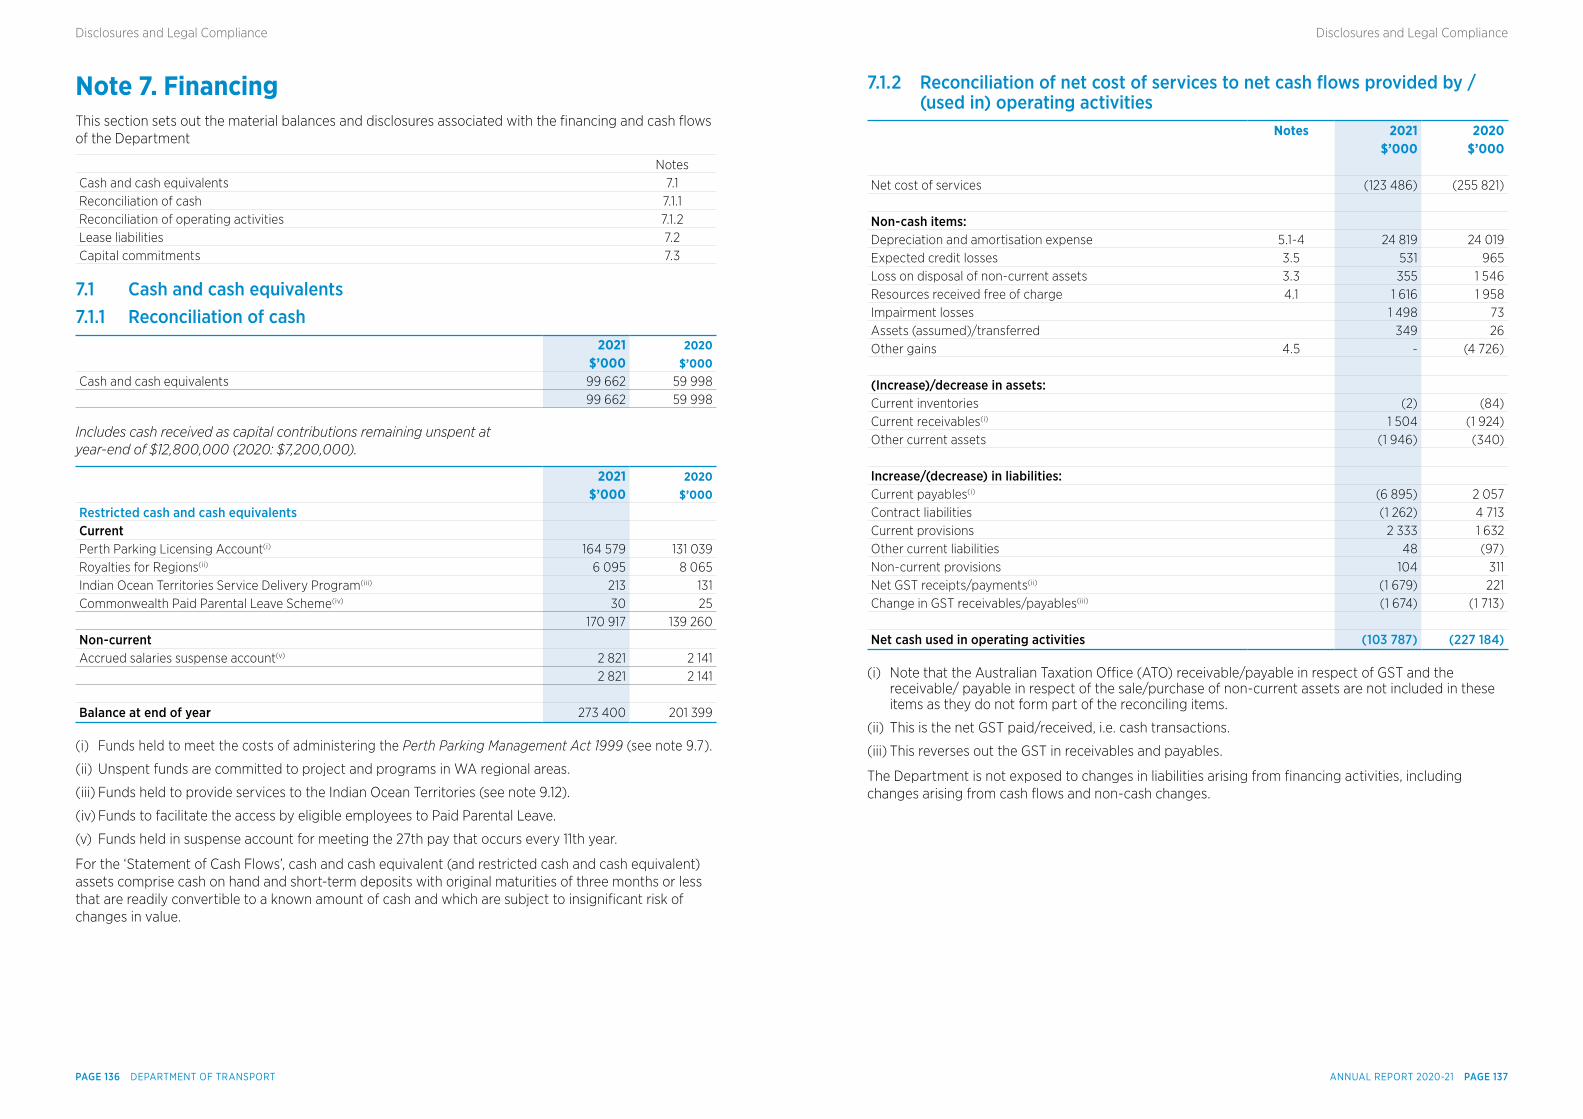
Note 7. Financing This section sets out the material balances and disclosures associated with the financing and cash flows of the Department
NotesCash and cash equivalents 7.1Reconciliation of cash 7.1.1Reconciliation of operating activities 7.1.2Lease liabilities 7.2Capital commitments 7.3
7.1 Cash and cash equivalents7.1.1 Reconciliation of cash
2021 2020 $’000 $’000
Cash and cash equivalents 99 662 59 998 99 662 59 998
Includes cash received as capital contributions remaining unspent at year-end of $12,800,000 (2020: $7,200,000).
2021 2020 $’000 $’000
Restricted cash and cash equivalents Current Perth Parking Licensing Account(i) 164 579 131 039Royalties for Regions(ii) 6 095 8 065Indian Ocean Territories Service Delivery Program(iii) 213 131Commonwealth Paid Parental Leave Scheme(iv) 30 25 170 917 139 260Non-current Accrued salaries suspense account(v) 2 821 2 141 2 821 2 141
Balance at end of year 273 400 201 399
(i) Funds held to meet the costs of administering the Perth Parking Management Act 1999 (see note 9.7).
(ii) Unspent funds are committed to project and programs in WA regional areas.
(iii) Funds held to provide services to the Indian Ocean Territories (see note 9.12).
(iv) Funds to facilitate the access by eligible employees to Paid Parental Leave.
(v) Funds held in suspense account for meeting the 27th pay that occurs every 11th year.
For the ‘Statement of Cash Flows’, cash and cash equivalent (and restricted cash and cash equivalent) assets comprise cash on hand and short-term deposits with original maturities of three months or less that are readily convertible to a known amount of cash and which are subject to insignificant risk of changes in value.
7.1.2 Reconciliation of net cost of services to net cash fows provided by / (used in) operating activities
Notes 2021 2020 $’000 $’000
Net cost of services (123 486) (255 821) Non-cash items: Depreciation and amortisation expense 5.1-4 24 819 24 019Expected credit losses 3.5 531 965Loss on disposal of non-current assets 3.3 355 1 546Resources received free of charge 4.1 1 616 1 958Impairment losses 1 498 73Assets (assumed)/transferred 349 26Other gains 4.5 - (4 726) (Increase)/decrease in assets: Current inventories (2) (84)Current receivables(i) 1 504 (1 924)Other current assets (1 946) (340) Increase/(decrease) in liabilities: Current payables(i) (6 895) 2 057Contract liabilities (1 262) 4 713Current provisions 2 333 1 632Other current liabilities 48 (97)Non-current provisions 104 311Net GST receipts/payments(ii) (1 679) 221Change in GST receivables/payables(iii) (1 674) (1 713) Net cash used in operating activities (103 787) (227 184)
(i) Note that the Australian Taxation Office (ATO) receivable/payable in respect of GST and the receivable/ payable in respect of the sale/purchase of non-current assets are not included in these items as they do not form part of the reconciling items.
(ii) This is the net GST paid/received, i.e. cash transactions.
(iii) This reverses out the GST in receivables and payables.
The Department is not exposed to changes in liabilities arising from financing activities, including changes arising from cash flows and non-cash changes.
ANNUAL REPORT 2020-21 PAGE 137PAGE 136 DEPARTMENT OF TRANSPORT
Disclosures and Legal ComplianceDisclosures and Legal Compliance
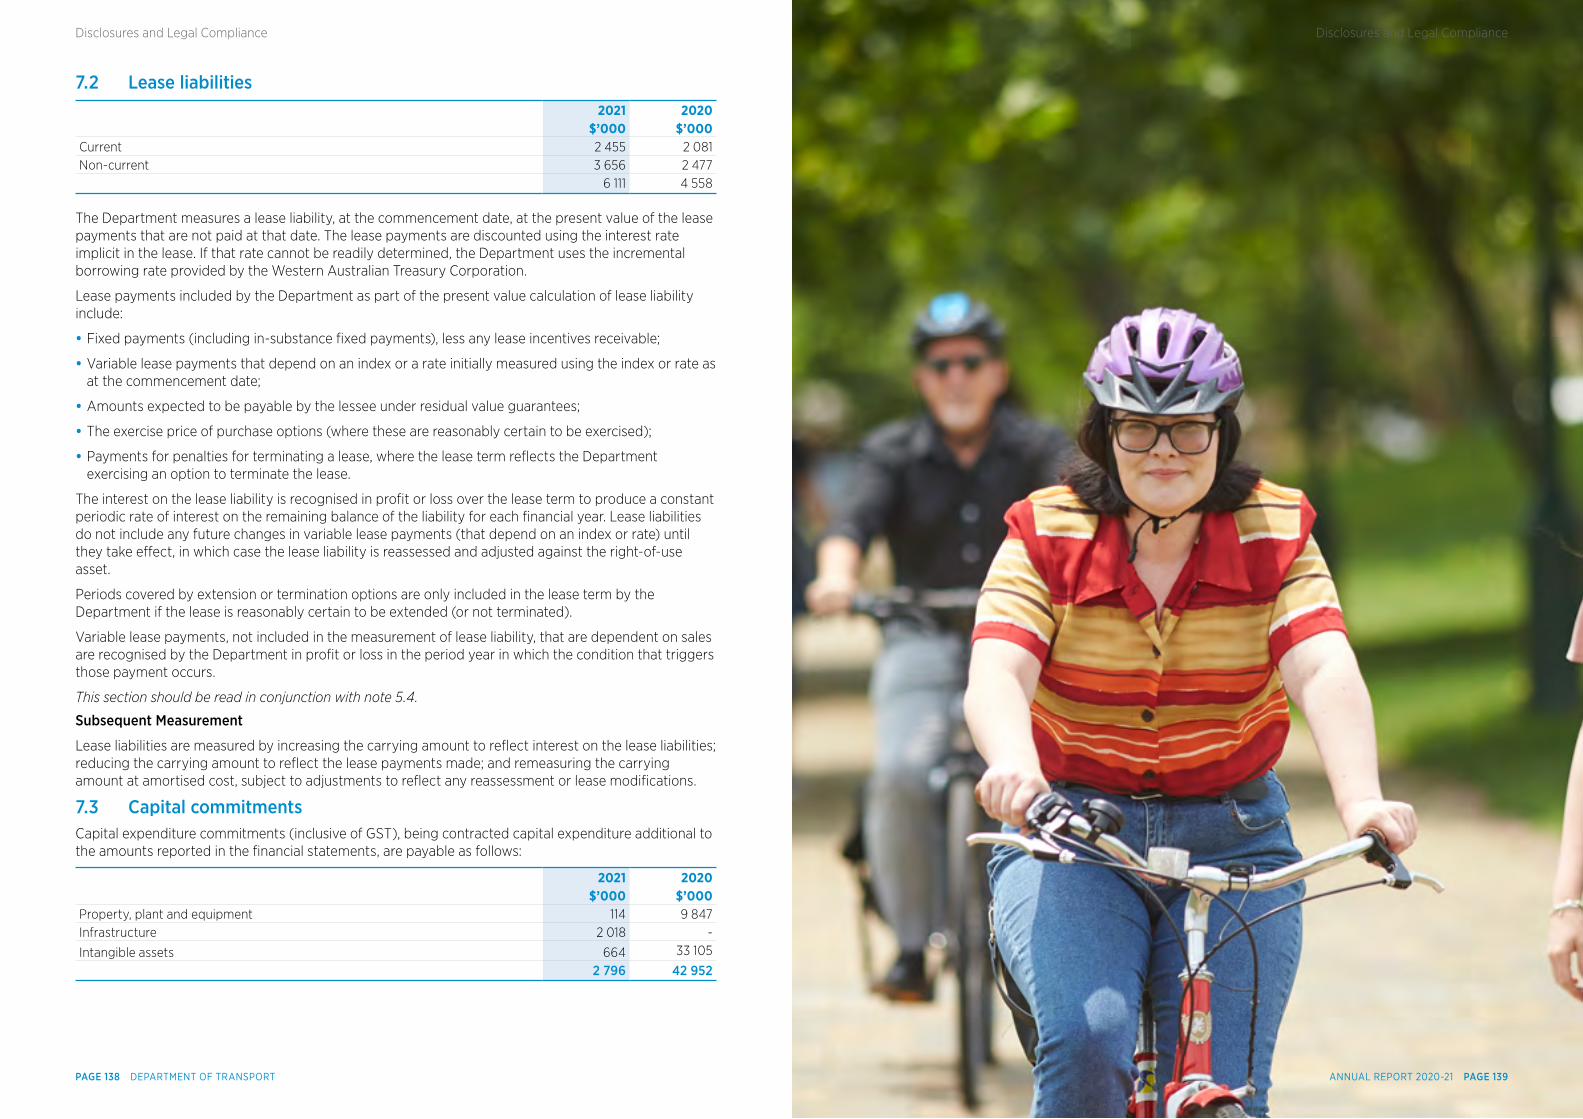
7.2 Lease liabilities 2021 2020 $’000 $’000
Current 2 455 2 081Non-current 3 656 2 477 6 111 4 558
The Department measures a lease liability, at the commencement date, at the present value of the lease payments that are not paid at that date. The lease payments are discounted using the interest rate implicit in the lease. If that rate cannot be readily determined, the Department uses the incremental borrowing rate provided by the Western Australian Treasury Corporation.
Lease payments included by the Department as part of the present value calculation of lease liability include:
• Fixed payments (including in-substance fixed payments), less any lease incentives receivable;
• Variable lease payments that depend on an index or a rate initially measured using the index or rate as at the commencement date;
• Amounts expected to be payable by the lessee under residual value guarantees;
• The exercise price of purchase options (where these are reasonably certain to be exercised);
• Payments for penalties for terminating a lease, where the lease term reflects the Department exercising an option to terminate the lease.
The interest on the lease liability is recognised in profit or loss over the lease term to produce a constant periodic rate of interest on the remaining balance of the liability for each financial year. Lease liabilities do not include any future changes in variable lease payments (that depend on an index or rate) until they take effect, in which case the lease liability is reassessed and adjusted against the right-of-use asset.
Periods covered by extension or termination options are only included in the lease term by the Department if the lease is reasonably certain to be extended (or not terminated).
Variable lease payments, not included in the measurement of lease liability, that are dependent on sales are recognised by the Department in profit or loss in the period year in which the condition that triggers those payment occurs.
This section should be read in conjunction with note 5.4.
Subsequent Measurement
Lease liabilities are measured by increasing the carrying amount to reflect interest on the lease liabilities; reducing the carrying amount to reflect the lease payments made; and remeasuring the carrying amount at amortised cost, subject to adjustments to reflect any reassessment or lease modifications.
7.3 Capital commitmentsCapital expenditure commitments (inclusive of GST), being contracted capital expenditure additional to the amounts reported in the financial statements, are payable as follows:
2021 2020 $’000 $’000
Property, plant and equipment 114 9 847Infrastructure 2 018 -
Intangible assets 664 33 105
2 796 42 952
ANNUAL REPORT 2020-21 PAGE 139PAGE 138 DEPARTMENT OF TRANSPORT
Disclosures and Legal ComplianceDisclosures and Legal Compliance
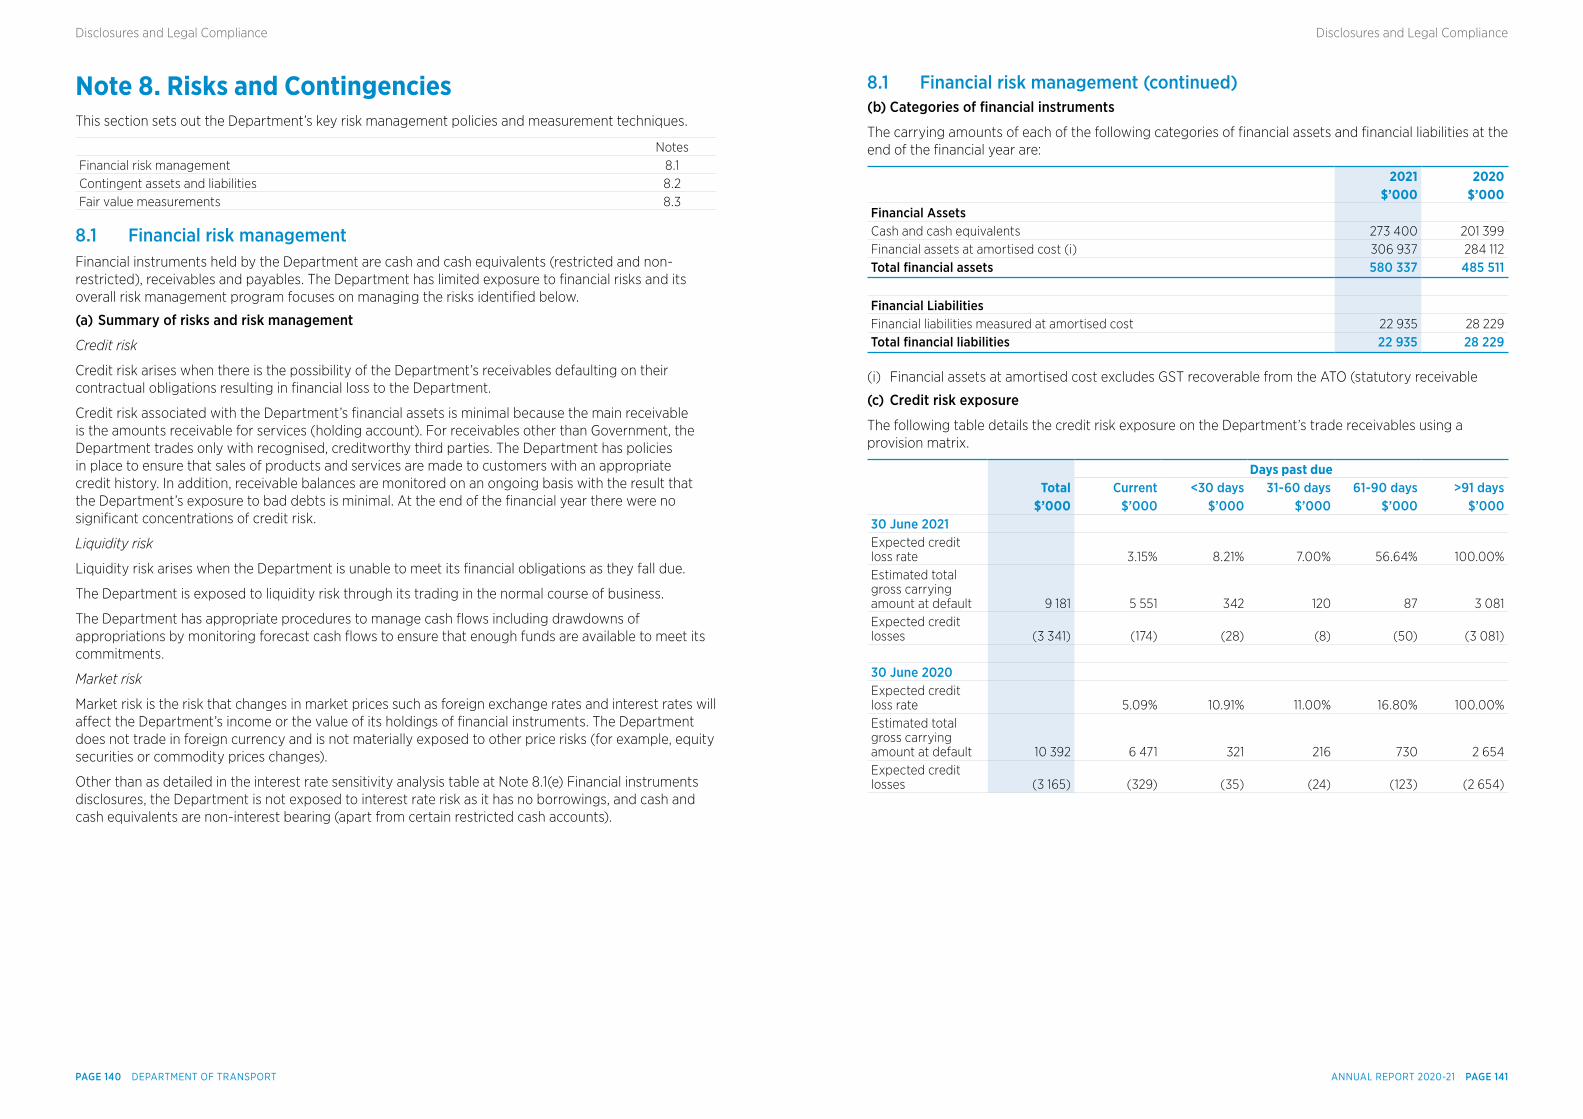
Note 8. Risks and Contingencies This section sets out the Department’s key risk management policies and measurement techniques.
NotesFinancial risk management 8.1Contingent assets and liabilities 8.2Fair value measurements 8.3
8.1 Financial risk managementFinancial instruments held by the Department are cash and cash equivalents (restricted and non-restricted), receivables and payables. The Department has limited exposure to financial risks and its overall risk management program focuses on managing the risks identified below.
(a) Summary of risks and risk management
Credit risk
Credit risk arises when there is the possibility of the Department’s receivables defaulting on their contractual obligations resulting in financial loss to the Department.
Credit risk associated with the Department’s financial assets is minimal because the main receivable is the amounts receivable for services (holding account). For receivables other than Government, the Department trades only with recognised, creditworthy third parties. The Department has policies in place to ensure that sales of products and services are made to customers with an appropriate credit history. In addition, receivable balances are monitored on an ongoing basis with the result that the Department’s exposure to bad debts is minimal. At the end of the financial year there were no significant concentrations of credit risk.
Liquidity risk
Liquidity risk arises when the Department is unable to meet its financial obligations as they fall due.
The Department is exposed to liquidity risk through its trading in the normal course of business.
The Department has appropriate procedures to manage cash flows including drawdowns of appropriations by monitoring forecast cash flows to ensure that enough funds are available to meet its commitments.
Market risk
Market risk is the risk that changes in market prices such as foreign exchange rates and interest rates will affect the Department’s income or the value of its holdings of financial instruments. The Department does not trade in foreign currency and is not materially exposed to other price risks (for example, equity securities or commodity prices changes).
Other than as detailed in the interest rate sensitivity analysis table at Note 8.1(e) Financial instruments disclosures, the Department is not exposed to interest rate risk as it has no borrowings, and cash and cash equivalents are non-interest bearing (apart from certain restricted cash accounts).
8.1 Financial risk management (continued)(b) Categories of fnancial instruments
The carrying amounts of each of the following categories of financial assets and financial liabilities at the end of the financial year are:
2021 2020 $’000 $’000
Financial Assets Cash and cash equivalents 273 400 201 399Financial assets at amortised cost (i) 306 937 284 112Total fnancial assets 580 337 485 511 Financial Liabilities Financial liabilities measured at amortised cost 22 935 28 229Total fnancial liabilities 22 935 28 229
(i) Financial assets at amortised cost excludes GST recoverable from the ATO (statutory receivable
(c) Credit risk exposure
The following table details the credit risk exposure on the Department’s trade receivables using a provision matrix.
Days past due Total Current <30 days 31-60 days 61-90 days >91 days $’000 $’000 $’000 $’000 $’000 $’000
30 June 2021 Expected credit loss rate 3.15% 8.21% 7.00% 56.64% 100.00%Estimated total gross carrying amount at default 9 181 5 551 342 120 87 3 081Expected credit losses (3 341) (174) (28) (8) (50) (3 081) 30 June 2020 Expected credit loss rate 5.09% 10.91% 11.00% 16.80% 100.00%Estimated total gross carrying amount at default 10 392 6 471 321 216 730 2 654Expected credit losses (3 165) (329) (35) (24) (123) (2 654)
ANNUAL REPORT 2020-21 PAGE 141PAGE 140 DEPARTMENT OF TRANSPORT
Disclosures and Legal ComplianceDisclosures and Legal Compliance
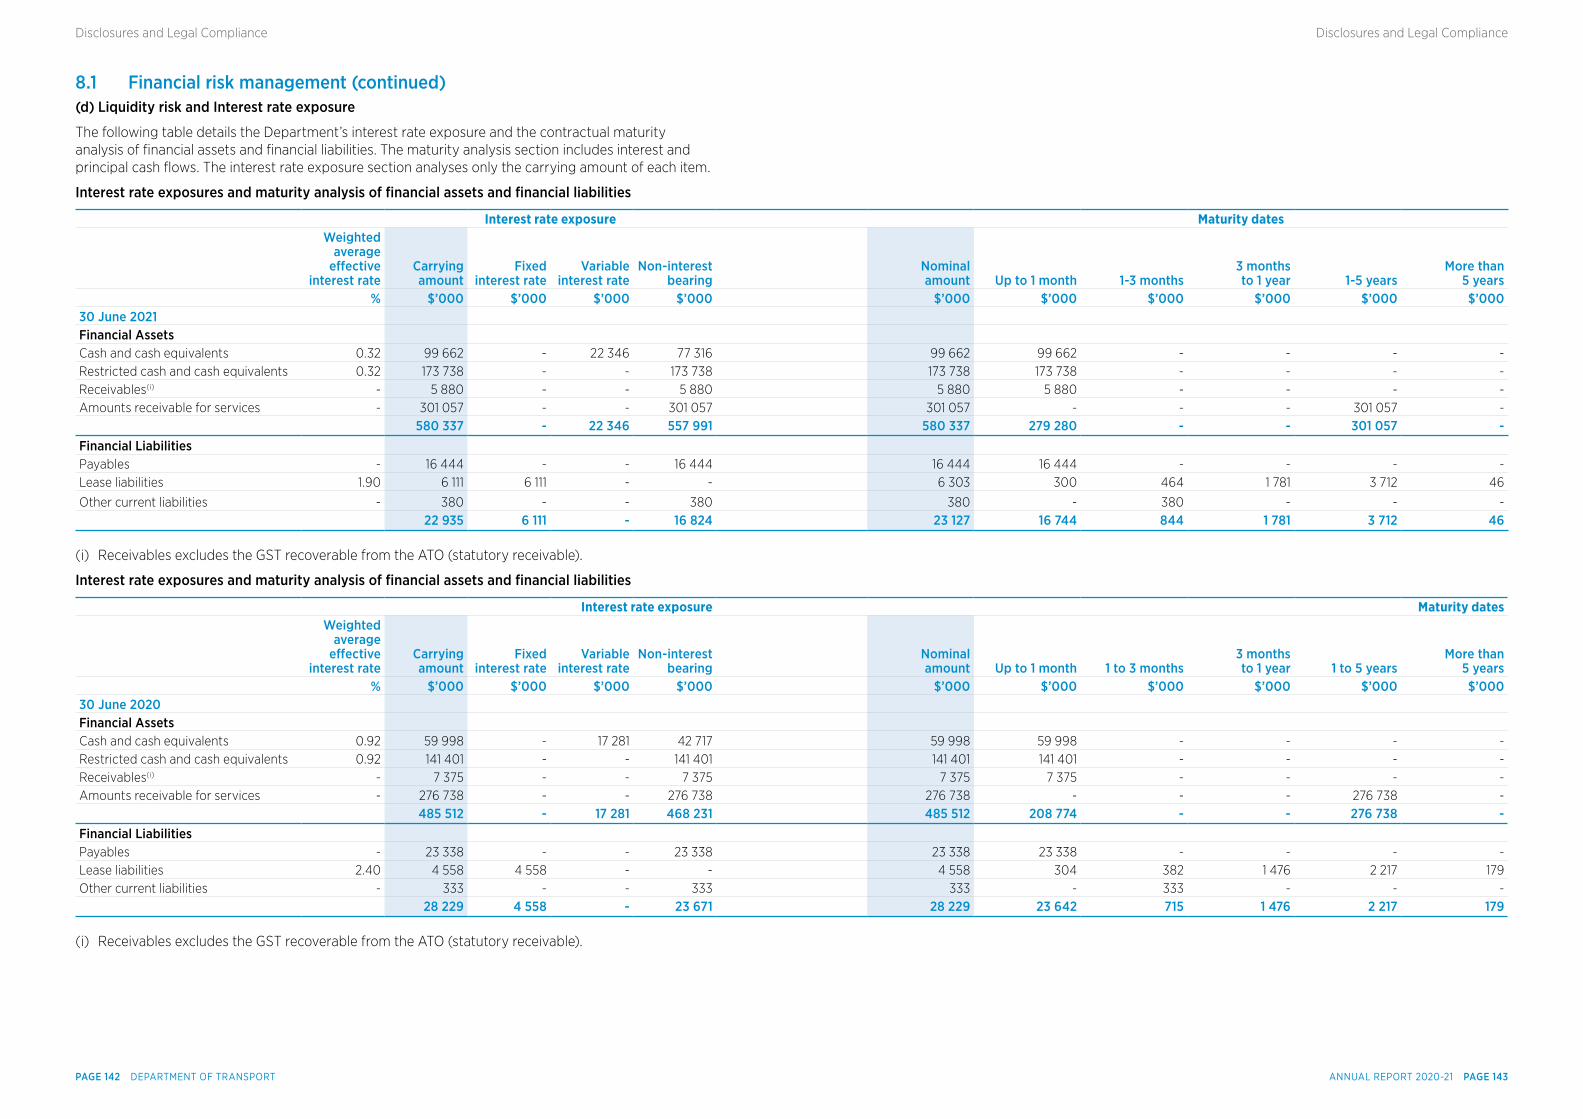
8.1 Financial risk management (continued)(d) Liquidity risk and Interest rate exposure
The following table details the Department’s interest rate exposure and the contractual maturity analysis of financial assets and financial liabilities. The maturity analysis section includes interest and principal cash flows. The interest rate exposure section analyses only the carrying amount of each item.
Interest rate exposures and maturity analysis of fnancial assets and fnancial liabilities
Interest rate exposure Maturity dates
Weighted average
efective interest rate
Carrying amount
Fixed interest rate
Variable interest rate
Non-interest bearing
Nominal amount Up to 1 month 1-3 months
3 months to 1 year 1-5 years
More than 5 years
% $’000 $’000 $’000 $’000 $’000 $’000 $’000 $’000 $’000 $’00030 June 2021 Financial Assets Cash and cash equivalents 0.32 99 662 - 22 346 77 316 99 662 99 662 - - - -Restricted cash and cash equivalents 0.32 173 738 - - 173 738 173 738 173 738 - - - -Receivables(i) - 5 880 - - 5 880 5 880 5 880 - - - -Amounts receivable for services - 301 057 - - 301 057 301 057 - - - 301 057 - 580 337 - 22 346 557 991 580 337 279 280 - - 301 057 -Financial Liabilities Payables - 16 444 - - 16 444 16 444 16 444 - - - -Lease liabilities 1.90 6 111 6 111 - - 6 303 300 464 1 781 3 712 46
Other current liabilities - 380 - - 380 380 - 380 - - - 22 935 6 111 - 16 824 23 127 16 744 844 1 781 3 712 46
(i) Receivables excludes the GST recoverable from the ATO (statutory receivable).
Interest rate exposures and maturity analysis of fnancial assets and fnancial liabilities
Interest rate exposure Maturity dates
Weighted average
efective interest rate
Carrying amount
Fixed interest rate
Variable interest rate
Non-interest bearing
Nominal amount Up to 1 month 1 to 3 months
3 months to 1 year 1 to 5 years
More than 5 years
% $’000 $’000 $’000 $’000 $’000 $’000 $’000 $’000 $’000 $’00030 June 2020 Financial Assets Cash and cash equivalents 0.92 59 998 - 17 281 42 717 59 998 59 998 - - - -Restricted cash and cash equivalents 0.92 141 401 - - 141 401 141 401 141 401 - - - -Receivables(i) - 7 375 - - 7 375 7 375 7 375 - - - -Amounts receivable for services - 276 738 - - 276 738 276 738 - - - 276 738 - 485 512 - 17 281 468 231 485 512 208 774 - - 276 738 -Financial Liabilities Payables - 23 338 - - 23 338 23 338 23 338 - - - -Lease liabilities 2.40 4 558 4 558 - - 4 558 304 382 1 476 2 217 179Other current liabilities - 333 - - 333 333 - 333 - - - 28 229 4 558 - 23 671 28 229 23 642 715 1 476 2 217 179
(i) Receivables excludes the GST recoverable from the ATO (statutory receivable).
ANNUAL REPORT 2020-21 PAGE 143PAGE 142 DEPARTMENT OF TRANSPORT
Disclosures and Legal ComplianceDisclosures and Legal Compliance
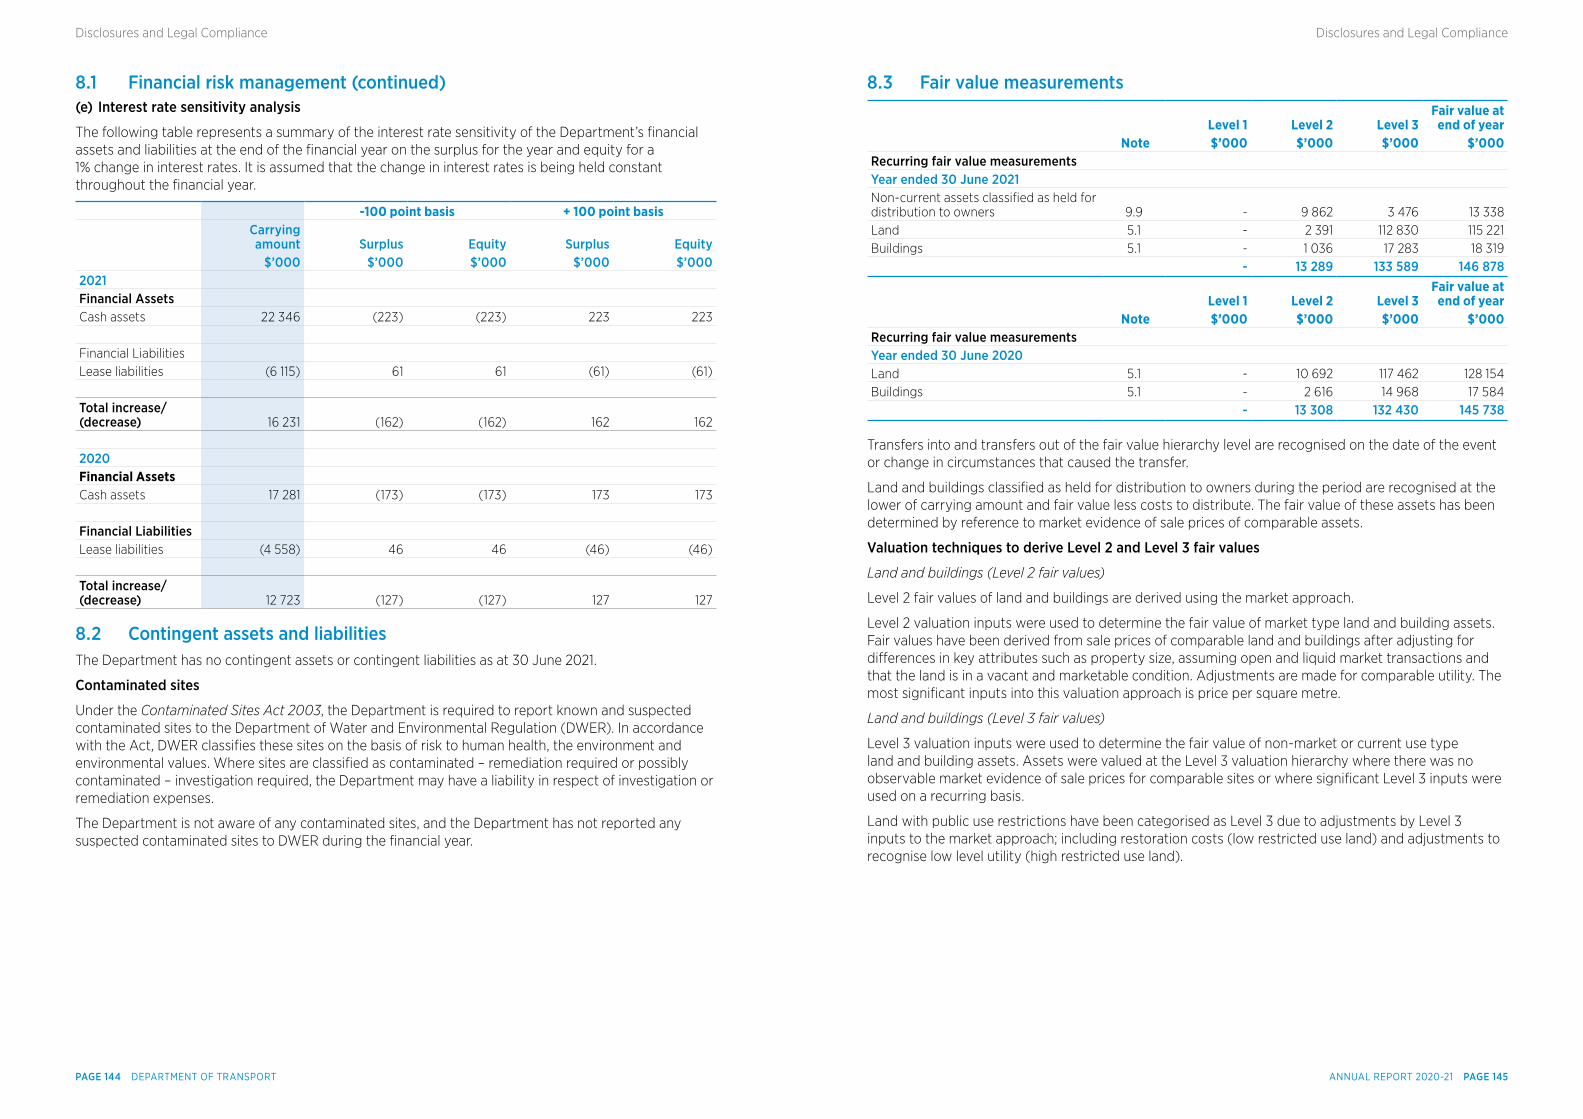
8.1 Financial risk management (continued)(e) Interest rate sensitivity analysis
The following table represents a summary of the interest rate sensitivity of the Department’s financial assets and liabilities at the end of the financial year on the surplus for the year and equity for a 1% change in interest rates. It is assumed that the change in interest rates is being held constant throughout the financial year.
-100 point basis + 100 point basis
Carrying amount Surplus Equity Surplus Equity
$’000 $’000 $’000 $’000 $’0002021 Financial Assets Cash assets 22 346 (223) (223) 223 223 Financial Liabilities Lease liabilities (6 115) 61 61 (61) (61) Total increase/(decrease) 16 231 (162) (162) 162 162 2020 Financial Assets Cash assets 17 281 (173) (173) 173 173 Financial Liabilities Lease liabilities (4 558) 46 46 (46) (46) Total increase/(decrease) 12 723 (127) (127) 127 127
8.2 Contingent assets and liabilitiesThe Department has no contingent assets or contingent liabilities as at 30 June 2021.
Contaminated sites
Under the Contaminated Sites Act 2003, the Department is required to report known and suspected contaminated sites to the Department of Water and Environmental Regulation (DWER). In accordance with the Act, DWER classifies these sites on the basis of risk to human health, the environment and environmental values. Where sites are classified as contaminated – remediation required or possibly contaminated – investigation required, the Department may have a liability in respect of investigation or remediation expenses.
The Department is not aware of any contaminated sites, and the Department has not reported any suspected contaminated sites to DWER during the financial year.
8.3 Fair value measurements
Level 1 Level 2 Level 3Fair value at
end of year Note $’000 $’000 $’000 $’000Recurring fair value measurements Year ended 30 June 2021 Non-current assets classified as held for distribution to owners 9.9 - 9 862 3 476 13 338Land 5.1 - 2 391 112 830 115 221Buildings 5.1 - 1 036 17 283 18 319 - 13 289 133 589 146 878
Level 1 Level 2 Level 3Fair value at
end of year Note $’000 $’000 $’000 $’000Recurring fair value measurements Year ended 30 June 2020 Land 5.1 - 10 692 117 462 128 154Buildings 5.1 - 2 616 14 968 17 584 - 13 308 132 430 145 738
Transfers into and transfers out of the fair value hierarchy level are recognised on the date of the event or change in circumstances that caused the transfer.
Land and buildings classified as held for distribution to owners during the period are recognised at the lower of carrying amount and fair value less costs to distribute. The fair value of these assets has been determined by reference to market evidence of sale prices of comparable assets.
Valuation techniques to derive Level 2 and Level 3 fair values
Land and buildings (Level 2 fair values)
Level 2 fair values of land and buildings are derived using the market approach.
Level 2 valuation inputs were used to determine the fair value of market type land and building assets. Fair values have been derived from sale prices of comparable land and buildings after adjusting for differences in key attributes such as property size, assuming open and liquid market transactions and that the land is in a vacant and marketable condition. Adjustments are made for comparable utility. The most significant inputs into this valuation approach is price per square metre.
Land and buildings (Level 3 fair values)
Level 3 valuation inputs were used to determine the fair value of non-market or current use type land and building assets. Assets were valued at the Level 3 valuation hierarchy where there was no observable market evidence of sale prices for comparable sites or where significant Level 3 inputs were used on a recurring basis.
Land with public use restrictions have been categorised as Level 3 due to adjustments by Level 3 inputs to the market approach; including restoration costs (low restricted use land) and adjustments to recognise low level utility (high restricted use land).
ANNUAL REPORT 2020-21 PAGE 145PAGE 144 DEPARTMENT OF TRANSPORT
Disclosures and Legal ComplianceDisclosures and Legal Compliance
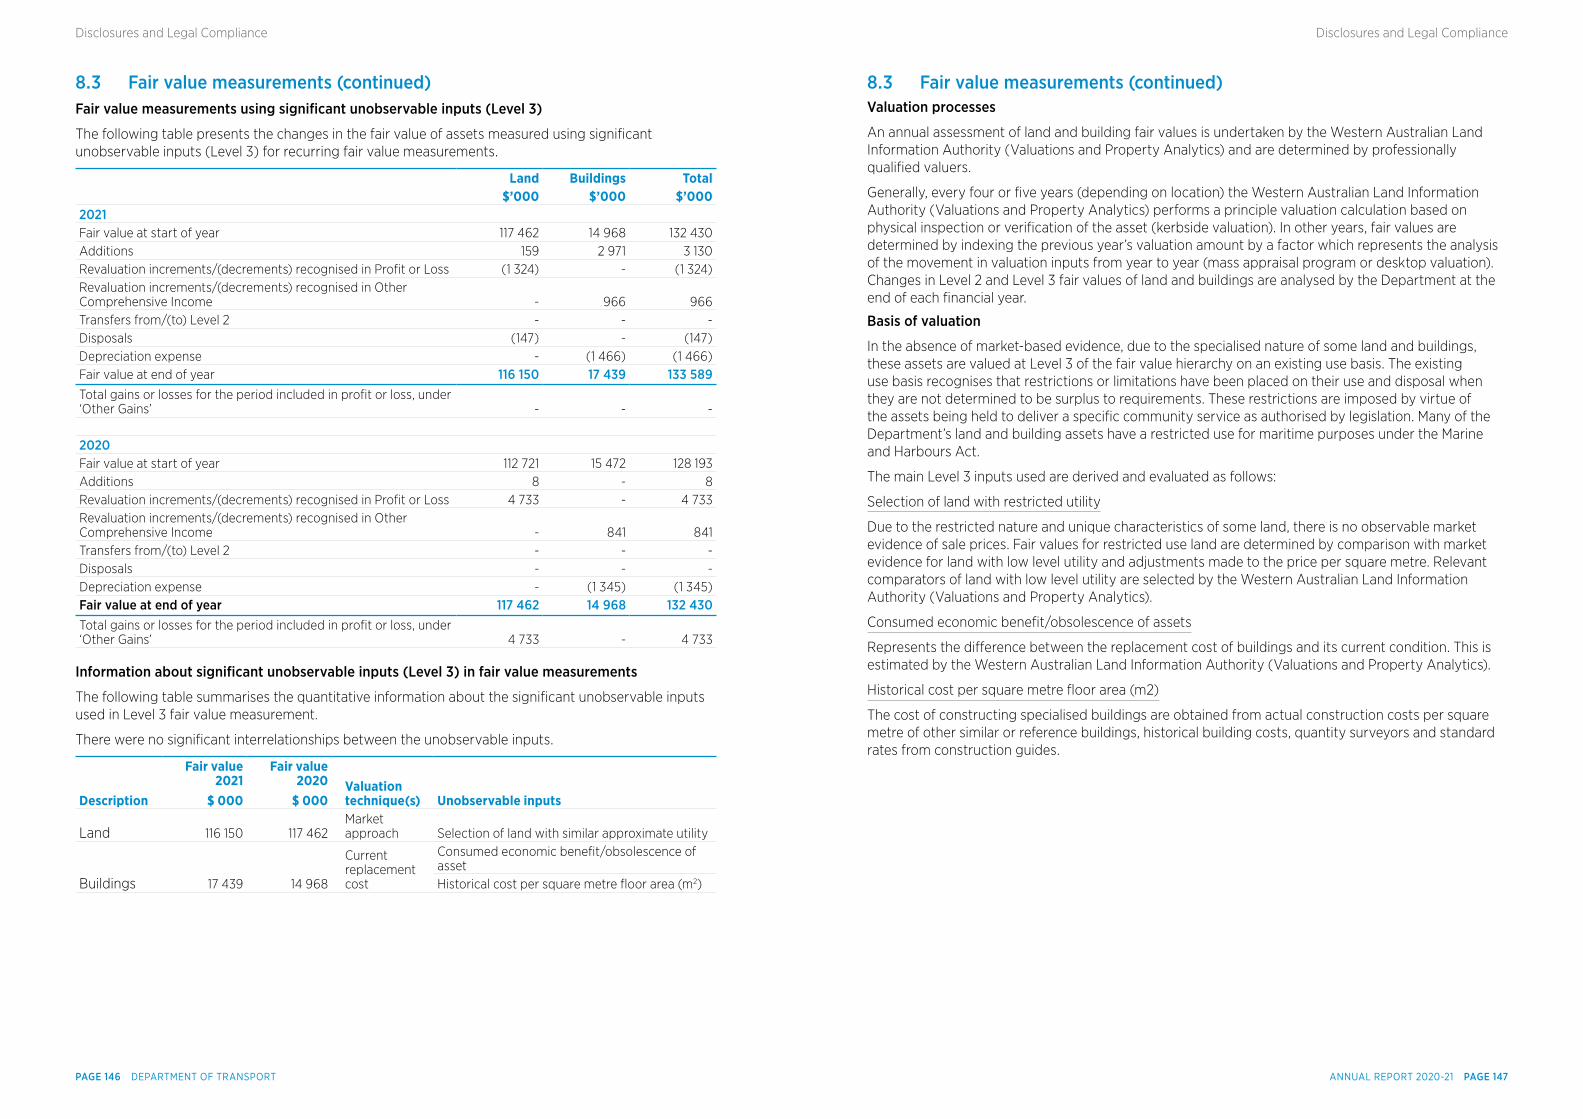
8.3 Fair value measurements (continued)Fair value measurements using signifcant unobservable inputs (Level 3)
The following table presents the changes in the fair value of assets measured using significant unobservable inputs (Level 3) for recurring fair value measurements.
Land Buildings Total $’000 $’000 $’000
2021 Fair value at start of year 117 462 14 968 132 430Additions 159 2 971 3 130Revaluation increments/(decrements) recognised in Profit or Loss (1 324) - (1 324)Revaluation increments/(decrements) recognised in Other Comprehensive Income - 966 966Transfers from/(to) Level 2 - - -Disposals (147) - (147)Depreciation expense - (1 466) (1 466)Fair value at end of year 116 150 17 439 133 589Total gains or losses for the period included in profit or loss, under ‘Other Gains’ - - - 2020 Fair value at start of year 112 721 15 472 128 193Additions 8 - 8Revaluation increments/(decrements) recognised in Profit or Loss 4 733 - 4 733Revaluation increments/(decrements) recognised in Other Comprehensive Income - 841 841Transfers from/(to) Level 2 - - -Disposals - - -Depreciation expense - (1 345) (1 345)Fair value at end of year 117 462 14 968 132 430Total gains or losses for the period included in profit or loss, under ‘Other Gains’ 4 733 - 4 733
Information about signifcant unobservable inputs (Level 3) in fair value measurements
The following table summarises the quantitative information about the significant unobservable inputs used in Level 3 fair value measurement.
There were no significant interrelationships between the unobservable inputs.
Description
Fair value 2021
$ 000
Fair value 2020
$ 000Valuation technique(s) Unobservable inputs
Land 116 150 117 462Market approach Selection of land with similar approximate utility
Buildings 17 439 14 968
Current replacement cost
Consumed economic benefit/obsolescence of assetHistorical cost per square metre floor area (m2)
8.3 Fair value measurements (continued)Valuation processes
An annual assessment of land and building fair values is undertaken by the Western Australian Land Information Authority (Valuations and Property Analytics) and are determined by professionally qualified valuers.
Generally, every four or five years (depending on location) the Western Australian Land Information Authority (Valuations and Property Analytics) performs a principle valuation calculation based on physical inspection or verification of the asset (kerbside valuation). In other years, fair values are determined by indexing the previous year’s valuation amount by a factor which represents the analysis of the movement in valuation inputs from year to year (mass appraisal program or desktop valuation). Changes in Level 2 and Level 3 fair values of land and buildings are analysed by the Department at the end of each financial year.
Basis of valuation
In the absence of market-based evidence, due to the specialised nature of some land and buildings, these assets are valued at Level 3 of the fair value hierarchy on an existing use basis. The existing use basis recognises that restrictions or limitations have been placed on their use and disposal when they are not determined to be surplus to requirements. These restrictions are imposed by virtue of the assets being held to deliver a specific community service as authorised by legislation. Many of the Department’s land and building assets have a restricted use for maritime purposes under the Marine and Harbours Act.
The main Level 3 inputs used are derived and evaluated as follows:
Selection of land with restricted utility
Due to the restricted nature and unique characteristics of some land, there is no observable market evidence of sale prices. Fair values for restricted use land are determined by comparison with market evidence for land with low level utility and adjustments made to the price per square metre. Relevant comparators of land with low level utility are selected by the Western Australian Land Information Authority (Valuations and Property Analytics).
Consumed economic benefit/obsolescence of assets
Represents the difference between the replacement cost of buildings and its current condition. This is estimated by the Western Australian Land Information Authority (Valuations and Property Analytics).
Historical cost per square metre floor area (m2)
The cost of constructing specialised buildings are obtained from actual construction costs per square metre of other similar or reference buildings, historical building costs, quantity surveyors and standard rates from construction guides.
ANNUAL REPORT 2020-21 PAGE 147PAGE 146 DEPARTMENT OF TRANSPORT
Disclosures and Legal ComplianceDisclosures and Legal Compliance
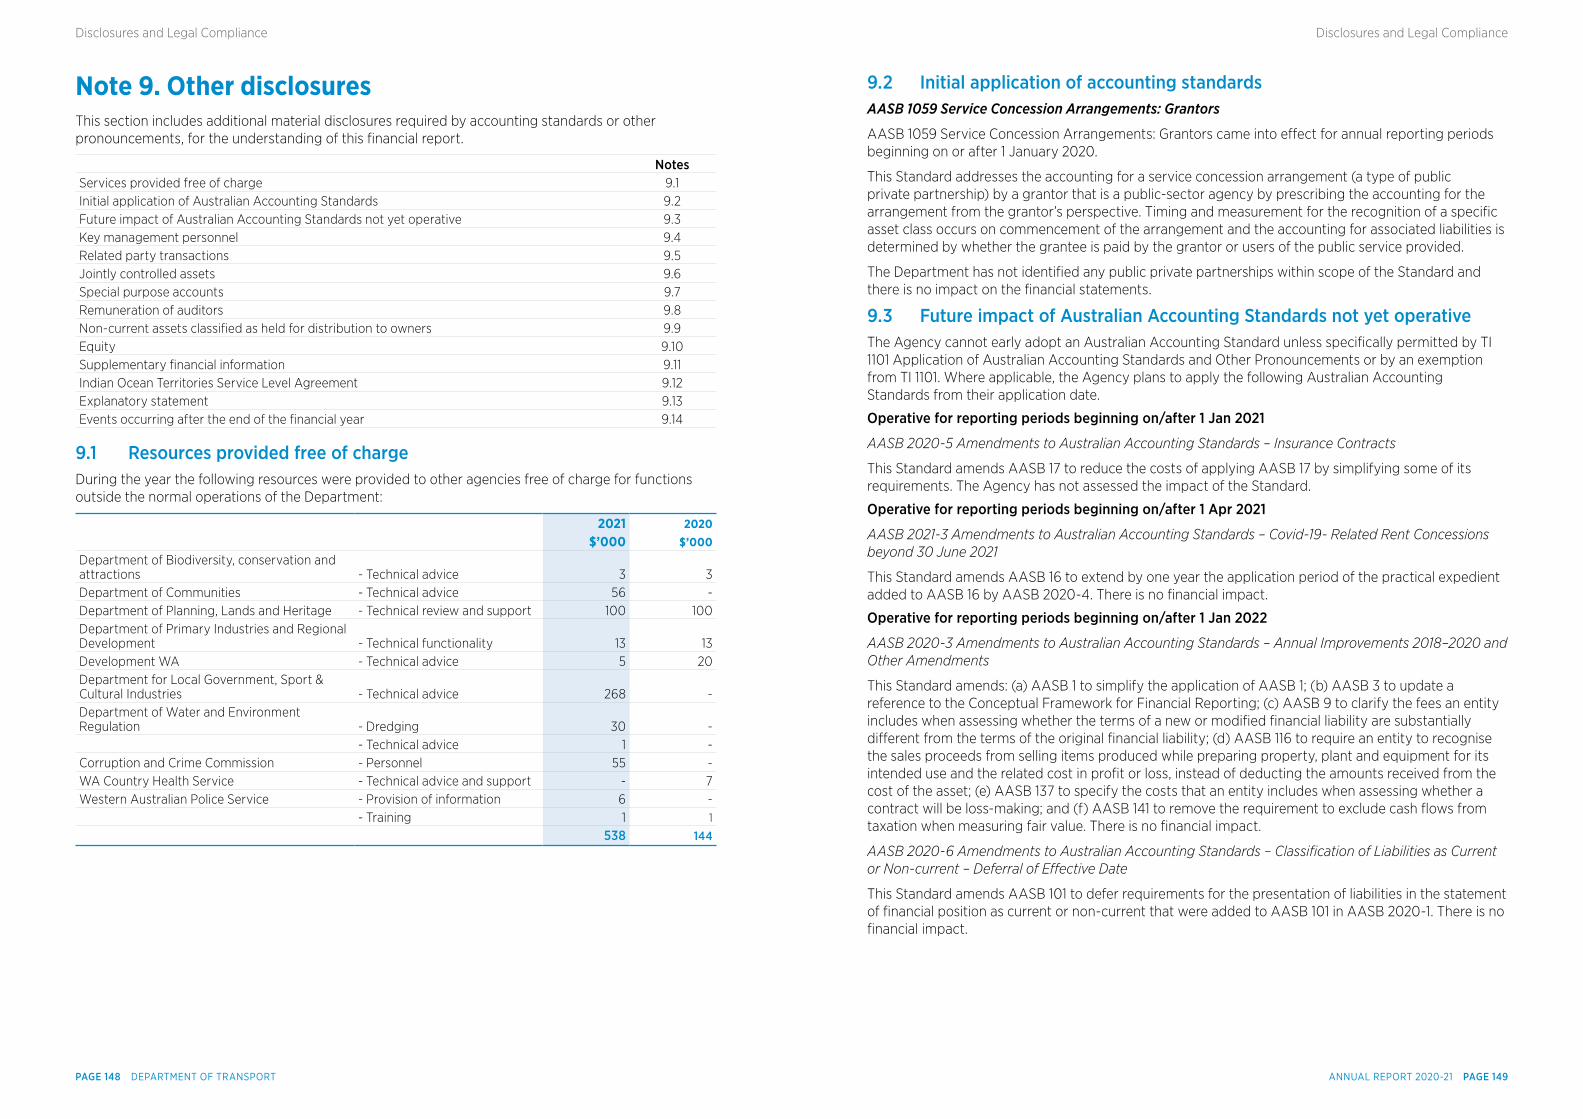
Note 9. Other disclosuresThis section includes additional material disclosures required by accounting standards or other pronouncements, for the understanding of this financial report.
NotesServices provided free of charge 9.1Initial application of Australian Accounting Standards 9.2Future impact of Australian Accounting Standards not yet operative 9.3Key management personnel 9.4Related party transactions 9.5Jointly controlled assets 9.6Special purpose accounts 9.7Remuneration of auditors 9.8Non-current assets classified as held for distribution to owners 9.9Equity 9.10Supplementary financial information 9.11Indian Ocean Territories Service Level Agreement 9.12Explanatory statement 9.13Events occurring after the end of the financial year 9.14
9.1 Resources provided free of chargeDuring the year the following resources were provided to other agencies free of charge for functions outside the normal operations of the Department:
2021 2020 $’000 $’000
Department of Biodiversity, conservation and attractions - Technical advice 3 3Department of Communities - Technical advice 56 -Department of Planning, Lands and Heritage - Technical review and support 100 100Department of Primary Industries and Regional Development - Technical functionality 13 13Development WA - Technical advice 5 20Department for Local Government, Sport & Cultural Industries - Technical advice 268 -Department of Water and Environment Regulation - Dredging 30 - - Technical advice 1 -Corruption and Crime Commission - Personnel 55 -WA Country Health Service - Technical advice and support - 7Western Australian Police Service - Provision of information 6 - - Training 1 1
538 144
9.2 Initial application of accounting standardsAASB 1059 Service Concession Arrangements: Grantors
AASB 1059 Service Concession Arrangements: Grantors came into effect for annual reporting periods beginning on or after 1 January 2020.
This Standard addresses the accounting for a service concession arrangement (a type of public private partnership) by a grantor that is a public-sector agency by prescribing the accounting for the arrangement from the grantor’s perspective. Timing and measurement for the recognition of a specific asset class occurs on commencement of the arrangement and the accounting for associated liabilities is determined by whether the grantee is paid by the grantor or users of the public service provided.
The Department has not identified any public private partnerships within scope of the Standard and there is no impact on the financial statements.
9.3 Future impact of Australian Accounting Standards not yet operativeThe Agency cannot early adopt an Australian Accounting Standard unless specifically permitted by TI 1101 Application of Australian Accounting Standards and Other Pronouncements or by an exemption from TI 1101. Where applicable, the Agency plans to apply the following Australian Accounting Standards from their application date.
Operative for reporting periods beginning on/after 1 Jan 2021
AASB 2020-5 Amendments to Australian Accounting Standards – Insurance Contracts
This Standard amends AASB 17 to reduce the costs of applying AASB 17 by simplifying some of its requirements. The Agency has not assessed the impact of the Standard.
Operative for reporting periods beginning on/after 1 Apr 2021
AASB 2021-3 Amendments to Australian Accounting Standards – Covid-19- Related Rent Concessions beyond 30 June 2021
This Standard amends AASB 16 to extend by one year the application period of the practical expedient added to AASB 16 by AASB 2020-4. There is no financial impact.
Operative for reporting periods beginning on/after 1 Jan 2022
AASB 2020-3 Amendments to Australian Accounting Standards – Annual Improvements 2018–2020 and Other Amendments
This Standard amends: (a) AASB 1 to simplify the application of AASB 1; (b) AASB 3 to update a reference to the Conceptual Framework for Financial Reporting; (c) AASB 9 to clarify the fees an entity includes when assessing whether the terms of a new or modified financial liability are substantially different from the terms of the original financial liability; (d) AASB 116 to require an entity to recognise the sales proceeds from selling items produced while preparing property, plant and equipment for its intended use and the related cost in profit or loss, instead of deducting the amounts received from the cost of the asset; (e) AASB 137 to specify the costs that an entity includes when assessing whether a contract will be loss-making; and (f) AASB 141 to remove the requirement to exclude cash flows from taxation when measuring fair value. There is no financial impact.
AASB 2020-6 Amendments to Australian Accounting Standards – Classification of Liabilities as Current or Non-current – Deferral of Effective Date
This Standard amends AASB 101 to defer requirements for the presentation of liabilities in the statement of financial position as current or non-current that were added to AASB 101 in AASB 2020-1. There is no financial impact.
ANNUAL REPORT 2020-21 PAGE 149PAGE 148 DEPARTMENT OF TRANSPORT
Disclosures and Legal ComplianceDisclosures and Legal Compliance
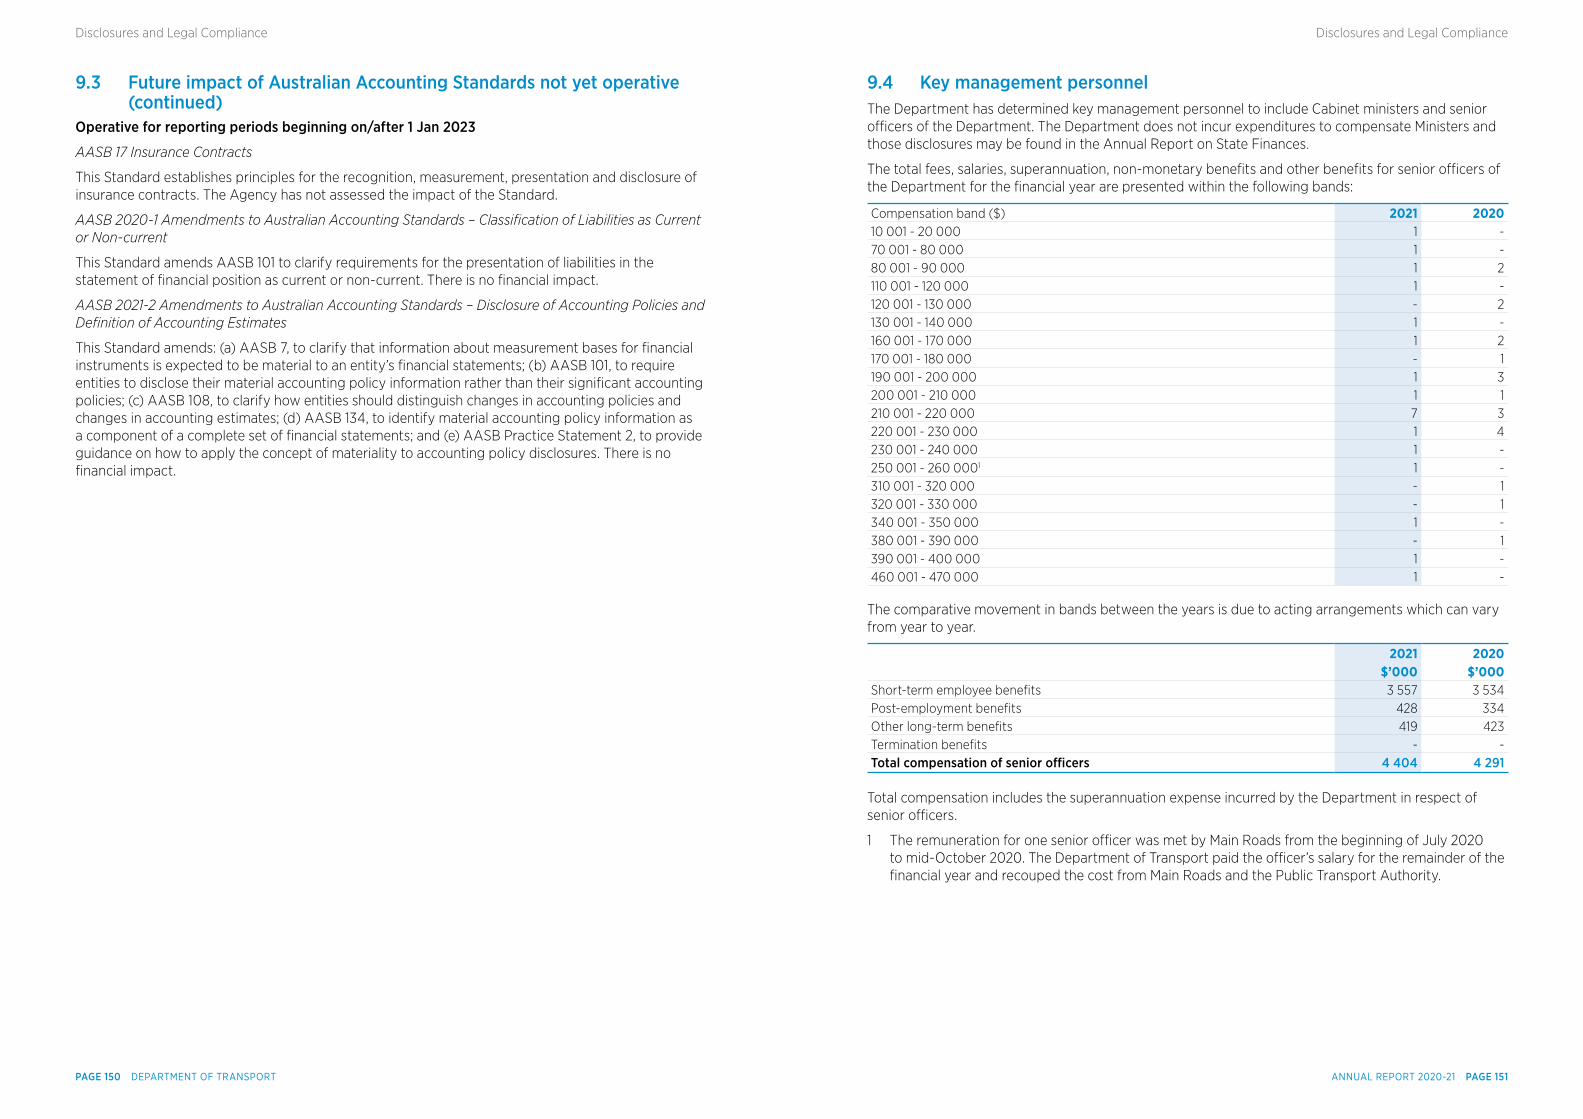
9.3 Future impact of Australian Accounting Standards not yet operative (continued)Operative for reporting periods beginning on/after 1 Jan 2023
AASB 17 Insurance Contracts
This Standard establishes principles for the recognition, measurement, presentation and disclosure of insurance contracts. The Agency has not assessed the impact of the Standard.
AASB 2020-1 Amendments to Australian Accounting Standards – Classification of Liabilities as Current or Non-current
This Standard amends AASB 101 to clarify requirements for the presentation of liabilities in the statement of financial position as current or non-current. There is no financial impact.
AASB 2021-2 Amendments to Australian Accounting Standards – Disclosure of Accounting Policies and Definition of Accounting Estimates
This Standard amends: (a) AASB 7, to clarify that information about measurement bases for financial instruments is expected to be material to an entity’s financial statements; (b) AASB 101, to require entities to disclose their material accounting policy information rather than their significant accounting policies; (c) AASB 108, to clarify how entities should distinguish changes in accounting policies and changes in accounting estimates; (d) AASB 134, to identify material accounting policy information as a component of a complete set of financial statements; and (e) AASB Practice Statement 2, to provide guidance on how to apply the concept of materiality to accounting policy disclosures. There is no financial impact.
9.4 Key management personnelThe Department has determined key management personnel to include Cabinet ministers and senior officers of the Department. The Department does not incur expenditures to compensate Ministers and those disclosures may be found in the Annual Report on State Finances.
The total fees, salaries, superannuation, non-monetary benefits and other benefits for senior officers of the Department for the financial year are presented within the following bands:
Compensation band ($) 2021 202010 001 - 20 000 1 -70 001 - 80 000 1 -80 001 - 90 000 1 2110 001 - 120 000 1 -120 001 - 130 000 - 2130 001 - 140 000 1 -160 001 - 170 000 1 2170 001 - 180 000 - 1190 001 - 200 000 1 3200 001 - 210 000 1 1210 001 - 220 000 7 3220 001 - 230 000 1 4230 001 - 240 000 1 -250 001 - 260 0001 1 -310 001 - 320 000 - 1320 001 - 330 000 - 1340 001 - 350 000 1 -380 001 - 390 000 - 1390 001 - 400 000 1 -460 001 - 470 000 1 -
The comparative movement in bands between the years is due to acting arrangements which can vary from year to year.
2021 2020 $’000 $’000Short-term employee benefits 3 557 3 534Post-employment benefits 428 334Other long-term benefits 419 423Termination benefits - -Total compensation of senior ofcers 4 404 4 291
Total compensation includes the superannuation expense incurred by the Department in respect of senior officers.
1 The remuneration for one senior officer was met by Main Roads from the beginning of July 2020 to mid-October 2020. The Department of Transport paid the officer’s salary for the remainder of the financial year and recouped the cost from Main Roads and the Public Transport Authority.
ANNUAL REPORT 2020-21 PAGE 151PAGE 150 DEPARTMENT OF TRANSPORT
Disclosures and Legal ComplianceDisclosures and Legal Compliance
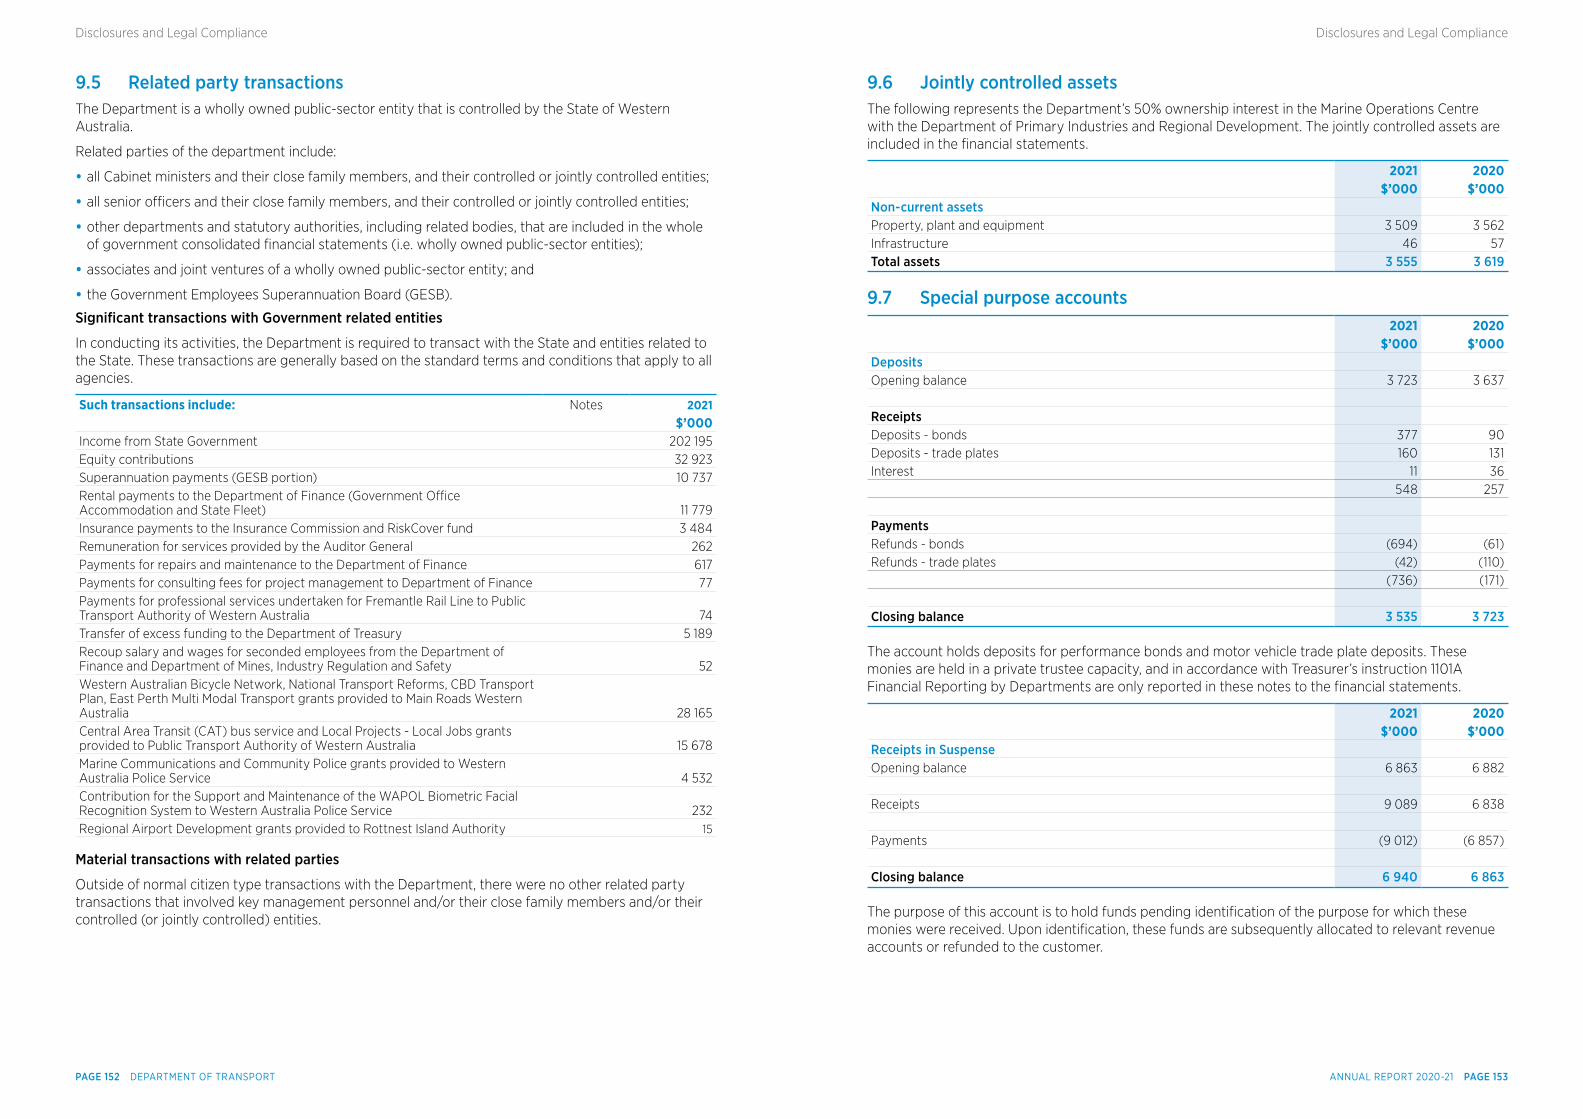
9.5 Related party transactionsThe Department is a wholly owned public-sector entity that is controlled by the State of Western Australia.
Related parties of the department include:
• all Cabinet ministers and their close family members, and their controlled or jointly controlled entities;
• all senior officers and their close family members, and their controlled or jointly controlled entities;
• other departments and statutory authorities, including related bodies, that are included in the whole of government consolidated financial statements (i.e. wholly owned public-sector entities);
• associates and joint ventures of a wholly owned public-sector entity; and
• the Government Employees Superannuation Board (GESB).
Signifcant transactions with Government related entities
In conducting its activities, the Department is required to transact with the State and entities related to the State. These transactions are generally based on the standard terms and conditions that apply to all agencies.
Such transactions include: Notes 2021 $’000
Income from State Government 202 195Equity contributions 32 923Superannuation payments (GESB portion) 10 737Rental payments to the Department of Finance (Government Office Accommodation and State Fleet) 11 779Insurance payments to the Insurance Commission and RiskCover fund 3 484Remuneration for services provided by the Auditor General 262Payments for repairs and maintenance to the Department of Finance 617Payments for consulting fees for project management to Department of Finance 77Payments for professional services undertaken for Fremantle Rail Line to Public Transport Authority of Western Australia 74Transfer of excess funding to the Department of Treasury 5 189Recoup salary and wages for seconded employees from the Department of Finance and Department of Mines, Industry Regulation and Safety 52Western Australian Bicycle Network, National Transport Reforms, CBD Transport Plan, East Perth Multi Modal Transport grants provided to Main Roads Western Australia 28 165Central Area Transit (CAT) bus service and Local Projects - Local Jobs grants provided to Public Transport Authority of Western Australia 15 678Marine Communications and Community Police grants provided to Western Australia Police Service 4 532Contribution for the Support and Maintenance of the WAPOL Biometric Facial Recognition System to Western Australia Police Service 232Regional Airport Development grants provided to Rottnest Island Authority 15
Material transactions with related parties
Outside of normal citizen type transactions with the Department, there were no other related party transactions that involved key management personnel and/or their close family members and/or their controlled (or jointly controlled) entities.
9.6 Jointly controlled assetsThe following represents the Department’s 50% ownership interest in the Marine Operations Centre with the Department of Primary Industries and Regional Development. The jointly controlled assets are included in the financial statements.
2021 2020 $’000 $’000Non-current assets Property, plant and equipment 3 509 3 562Infrastructure 46 57Total assets 3 555 3 619
9.7 Special purpose accounts 2021 2020 $’000 $’000Deposits Opening balance 3 723 3 637 Receipts Deposits - bonds 377 90Deposits - trade plates 160 131Interest 11 36 548 257
Payments Refunds - bonds (694) (61)Refunds - trade plates (42) (110) (736) (171) Closing balance 3 535 3 723
The account holds deposits for performance bonds and motor vehicle trade plate deposits. These monies are held in a private trustee capacity, and in accordance with Treasurer’s instruction 1101A Financial Reporting by Departments are only reported in these notes to the financial statements.
2021 2020 $’000 $’000Receipts in Suspense Opening balance 6 863 6 882 Receipts 9 089 6 838 Payments (9 012) (6 857) Closing balance 6 940 6 863
The purpose of this account is to hold funds pending identification of the purpose for which these monies were received. Upon identification, these funds are subsequently allocated to relevant revenue accounts or refunded to the customer.
ANNUAL REPORT 2020-21 PAGE 153PAGE 152 DEPARTMENT OF TRANSPORT
Disclosures and Legal ComplianceDisclosures and Legal Compliance
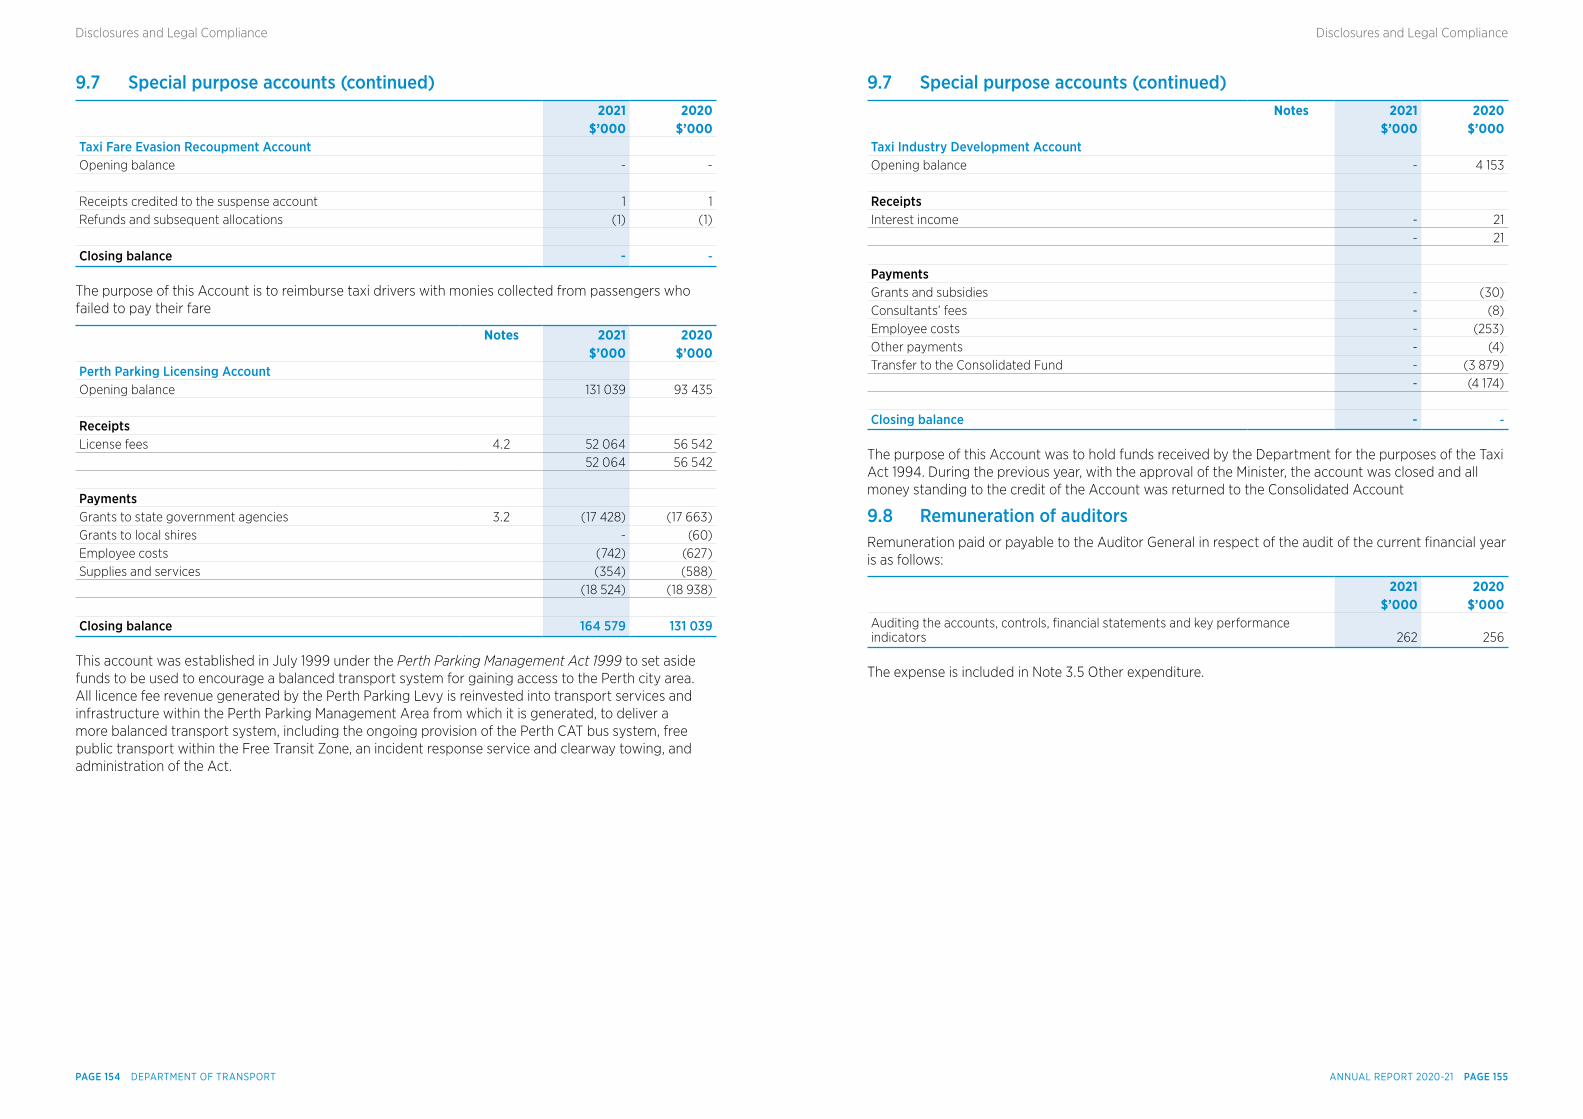
9.7 Special purpose accounts (continued) 2021 2020 $’000 $’000
Taxi Fare Evasion Recoupment Account Opening balance - - Receipts credited to the suspense account 1 1Refunds and subsequent allocations (1) (1) Closing balance - -
The purpose of this Account is to reimburse taxi drivers with monies collected from passengers who failed to pay their fare
Notes 2021 2020 $’000 $’000
Perth Parking Licensing Account Opening balance 131 039 93 435 Receipts License fees 4.2 52 064 56 542 52 064 56 542
Payments Grants to state government agencies 3.2 (17 428) (17 663)Grants to local shires - (60)Employee costs (742) (627)Supplies and services (354) (588) (18 524) (18 938) Closing balance 164 579 131 039
This account was established in July 1999 under the Perth Parking Management Act 1999 to set aside funds to be used to encourage a balanced transport system for gaining access to the Perth city area. All licence fee revenue generated by the Perth Parking Levy is reinvested into transport services and infrastructure within the Perth Parking Management Area from which it is generated, to deliver a more balanced transport system, including the ongoing provision of the Perth CAT bus system, free public transport within the Free Transit Zone, an incident response service and clearway towing, and administration of the Act.
9.7 Special purpose accounts (continued) Notes 2021 2020 $’000 $’000
Taxi Industry Development Account Opening balance - 4 153
Receipts Interest income - 21 - 21
Payments Grants and subsidies - (30)Consultants’ fees - (8)Employee costs - (253)Other payments - (4)Transfer to the Consolidated Fund - (3 879) - (4 174) Closing balance - -
The purpose of this Account was to hold funds received by the Department for the purposes of the Taxi Act 1994. During the previous year, with the approval of the Minister, the account was closed and all money standing to the credit of the Account was returned to the Consolidated Account
9.8 Remuneration of auditorsRemuneration paid or payable to the Auditor General in respect of the audit of the current financial year is as follows:
2021 2020 $’000 $’000Auditing the accounts, controls, financial statements and key performance indicators 262 256
The expense is included in Note 3.5 Other expenditure.
ANNUAL REPORT 2020-21 PAGE 155PAGE 154 DEPARTMENT OF TRANSPORT
Disclosures and Legal ComplianceDisclosures and Legal Compliance
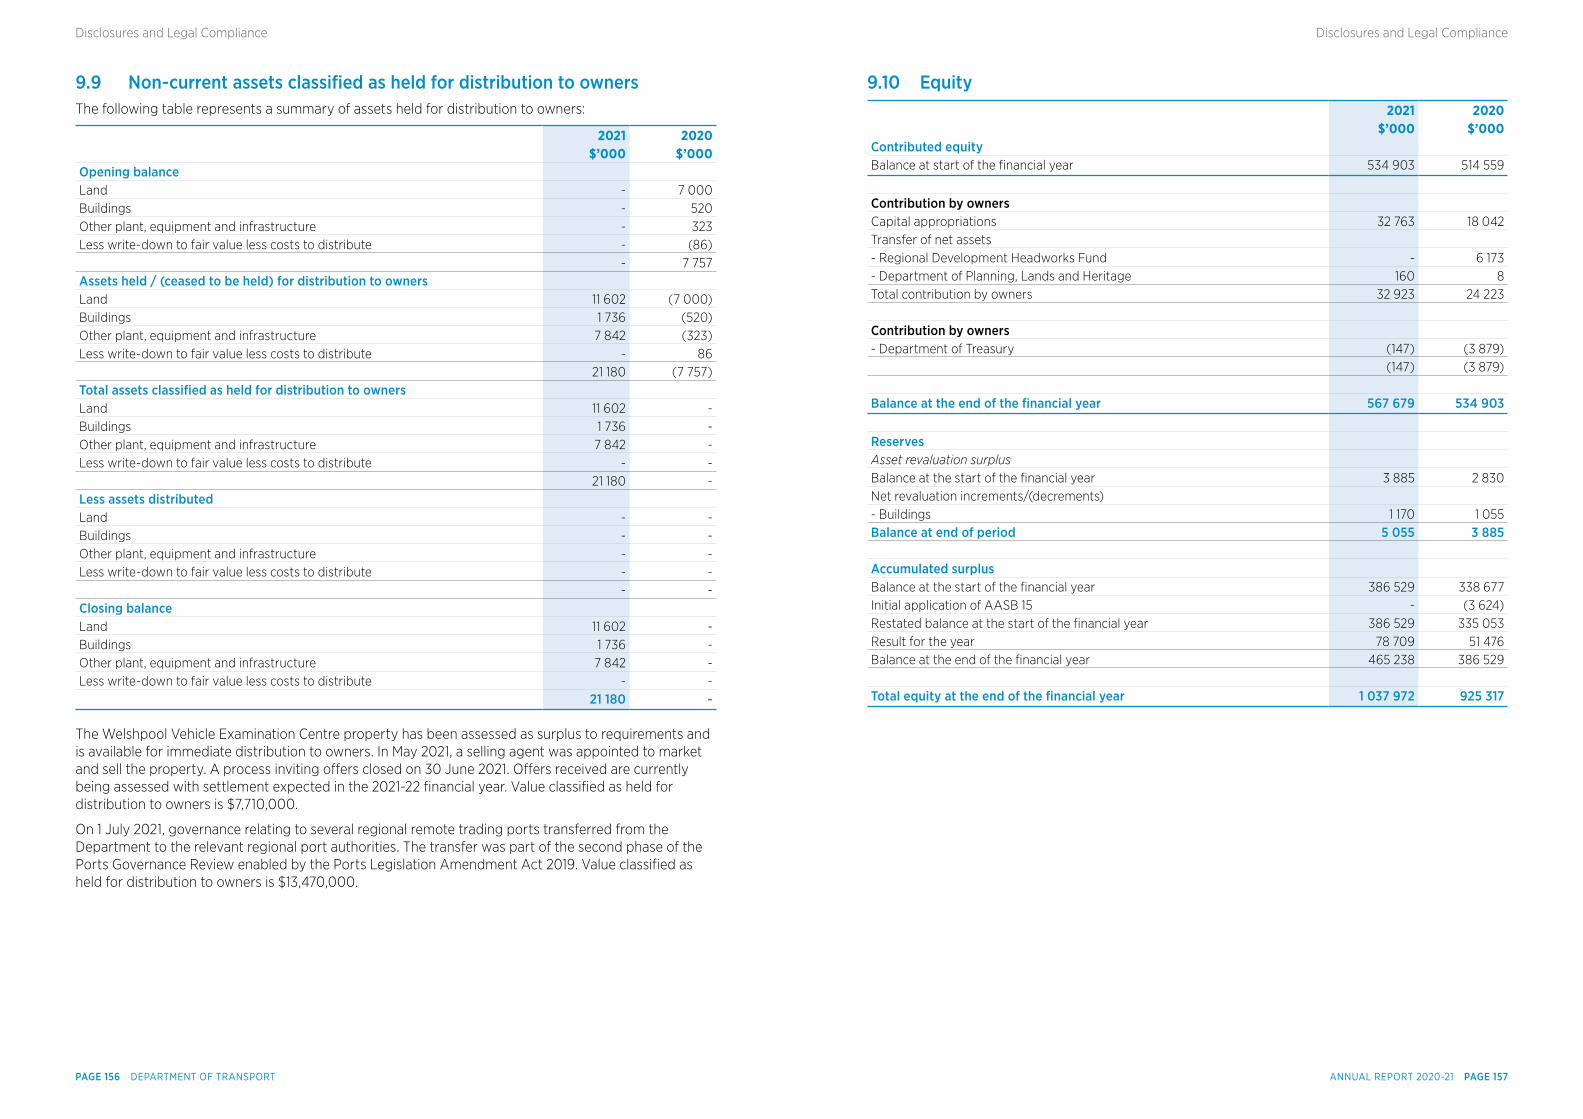
9.9 Non-current assets classifed as held for distribution to ownersThe following table represents a summary of assets held for distribution to owners:
2021 2020 $’000 $’000
Opening balance Land - 7 000Buildings - 520Other plant, equipment and infrastructure - 323Less write-down to fair value less costs to distribute - (86) - 7 757Assets held / (ceased to be held) for distribution to owners Land 11 602 (7 000)Buildings 1 736 (520)Other plant, equipment and infrastructure 7 842 (323)Less write-down to fair value less costs to distribute - 86 21 180 (7 757)Total assets classifed as held for distribution to owners Land 11 602 -Buildings 1 736 -Other plant, equipment and infrastructure 7 842 -Less write-down to fair value less costs to distribute - - 21 180 -Less assets distributed Land - -Buildings - -Other plant, equipment and infrastructure - -Less write-down to fair value less costs to distribute - - - -Closing balance Land 11 602 -Buildings 1 736 -Other plant, equipment and infrastructure 7 842 -Less write-down to fair value less costs to distribute - - 21 180 -
The Welshpool Vehicle Examination Centre property has been assessed as surplus to requirements and is available for immediate distribution to owners. In May 2021, a selling agent was appointed to market and sell the property. A process inviting offers closed on 30 June 2021. Offers received are currently being assessed with settlement expected in the 2021-22 financial year. Value classified as held for distribution to owners is $7,710,000.
On 1 July 2021, governance relating to several regional remote trading ports transferred from the Department to the relevant regional port authorities. The transfer was part of the second phase of the Ports Governance Review enabled by the Ports Legislation Amendment Act 2019. Value classified as held for distribution to owners is $13,470,000.
9.10 Equity 2021 2020 $’000 $’000Contributed equity Balance at start of the financial year 534 903 514 559
Contribution by owners Capital appropriations 32 763 18 042Transfer of net assets - Regional Development Headworks Fund - 6 173- Department of Planning, Lands and Heritage 160 8Total contribution by owners 32 923 24 223 Contribution by owners - Department of Treasury (147) (3 879) (147) (3 879) Balance at the end of the fnancial year 567 679 534 903 Reserves Asset revaluation surplus Balance at the start of the financial year 3 885 2 830Net revaluation increments/(decrements) - Buildings 1 170 1 055Balance at end of period 5 055 3 885 Accumulated surplus Balance at the start of the financial year 386 529 338 677Initial application of AASB 15 - (3 624)Restated balance at the start of the financial year 386 529 335 053Result for the year 78 709 51 476Balance at the end of the financial year 465 238 386 529 Total equity at the end of the fnancial year 1 037 972 925 317
ANNUAL REPORT 2020-21 PAGE 157PAGE 156 DEPARTMENT OF TRANSPORT
Disclosures and Legal ComplianceDisclosures and Legal Compliance
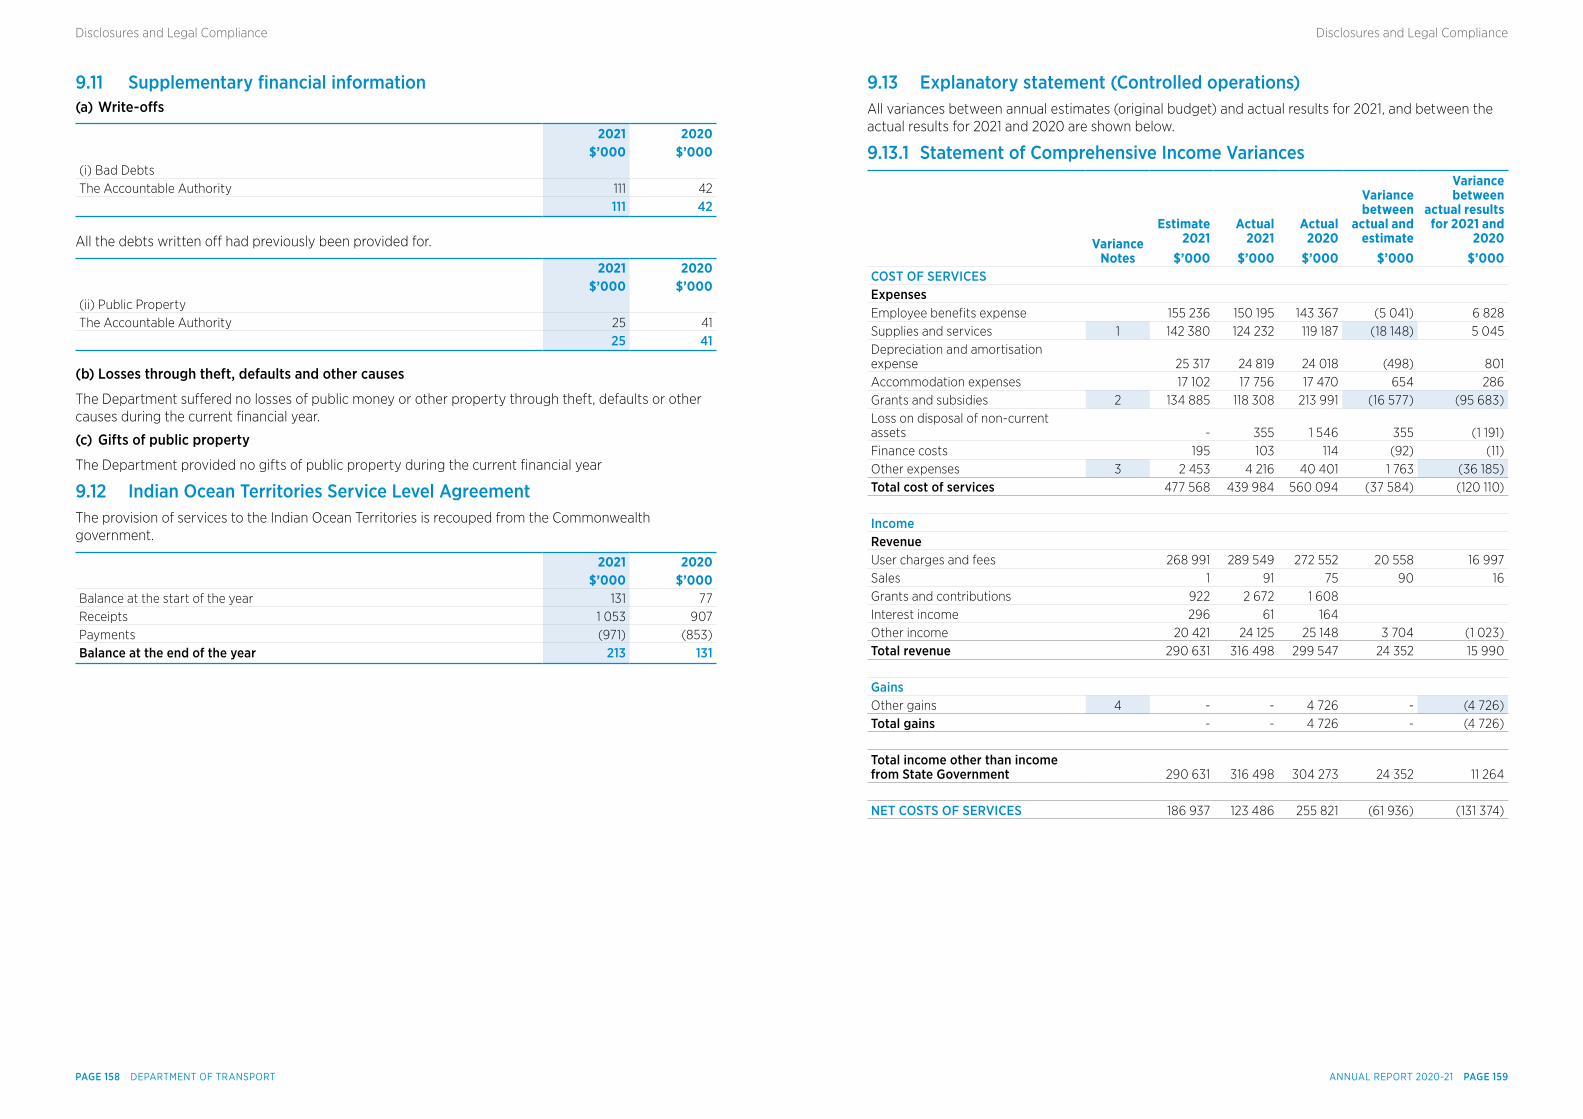
9.11 Supplementary fnancial information(a) Write-ofs
2021 2020 $’000 $’000
(i) Bad Debts The Accountable Authority 111 42 111 42
All the debts written off had previously been provided for.
2021 2020 $’000 $’000
(ii) Public Property The Accountable Authority 25 41 25 41
(b) Losses through theft, defaults and other causes
The Department suffered no losses of public money or other property through theft, defaults or other causes during the current financial year.
(c) Gifts of public property
The Department provided no gifts of public property during the current financial year
9.12 Indian Ocean Territories Service Level AgreementThe provision of services to the Indian Ocean Territories is recouped from the Commonwealth government.
2021 2020 $’000 $’000
Balance at the start of the year 131 77Receipts 1 053 907Payments (971) (853)Balance at the end of the year 213 131
9.13 Explanatory statement (Controlled operations)All variances between annual estimates (original budget) and actual results for 2021, and between the actual results for 2021 and 2020 are shown below.
9.13.1 Statement of Comprehensive Income Variances
Variance Notes
Estimate 2021
$’000
Actual 2021
$’000
Actual 2020
$’000
Variance between
actual and estimate
$’000
Variance between
actual results for 2021 and
2020$’000
COST OF SERVICES Expenses Employee benefits expense 155 236 150 195 143 367 (5 041) 6 828Supplies and services 1 142 380 124 232 119 187 (18 148) 5 045Depreciation and amortisation expense 25 317 24 819 24 018 (498) 801Accommodation expenses 17 102 17 756 17 470 654 286Grants and subsidies 2 134 885 118 308 213 991 (16 577) (95 683)Loss on disposal of non-current assets - 355 1 546 355 (1 191)Finance costs 195 103 114 (92) (11)Other expenses 3 2 453 4 216 40 401 1 763 (36 185)Total cost of services 477 568 439 984 560 094 (37 584) (120 110) Income Revenue User charges and fees 268 991 289 549 272 552 20 558 16 997Sales 1 91 75 90 16Grants and contributions 922 2 672 1 608 Interest income 296 61 164 Other income 20 421 24 125 25 148 3 704 (1 023)Total revenue 290 631 316 498 299 547 24 352 15 990 Gains Other gains 4 - - 4 726 - (4 726)Total gains - - 4 726 - (4 726)
Total income other than income from State Government 290 631 316 498 304 273 24 352 11 264 NET COSTS OF SERVICES 186 937 123 486 255 821 (61 936) (131 374)
ANNUAL REPORT 2020-21 PAGE 159PAGE 158 DEPARTMENT OF TRANSPORT
Disclosures and Legal ComplianceDisclosures and Legal Compliance
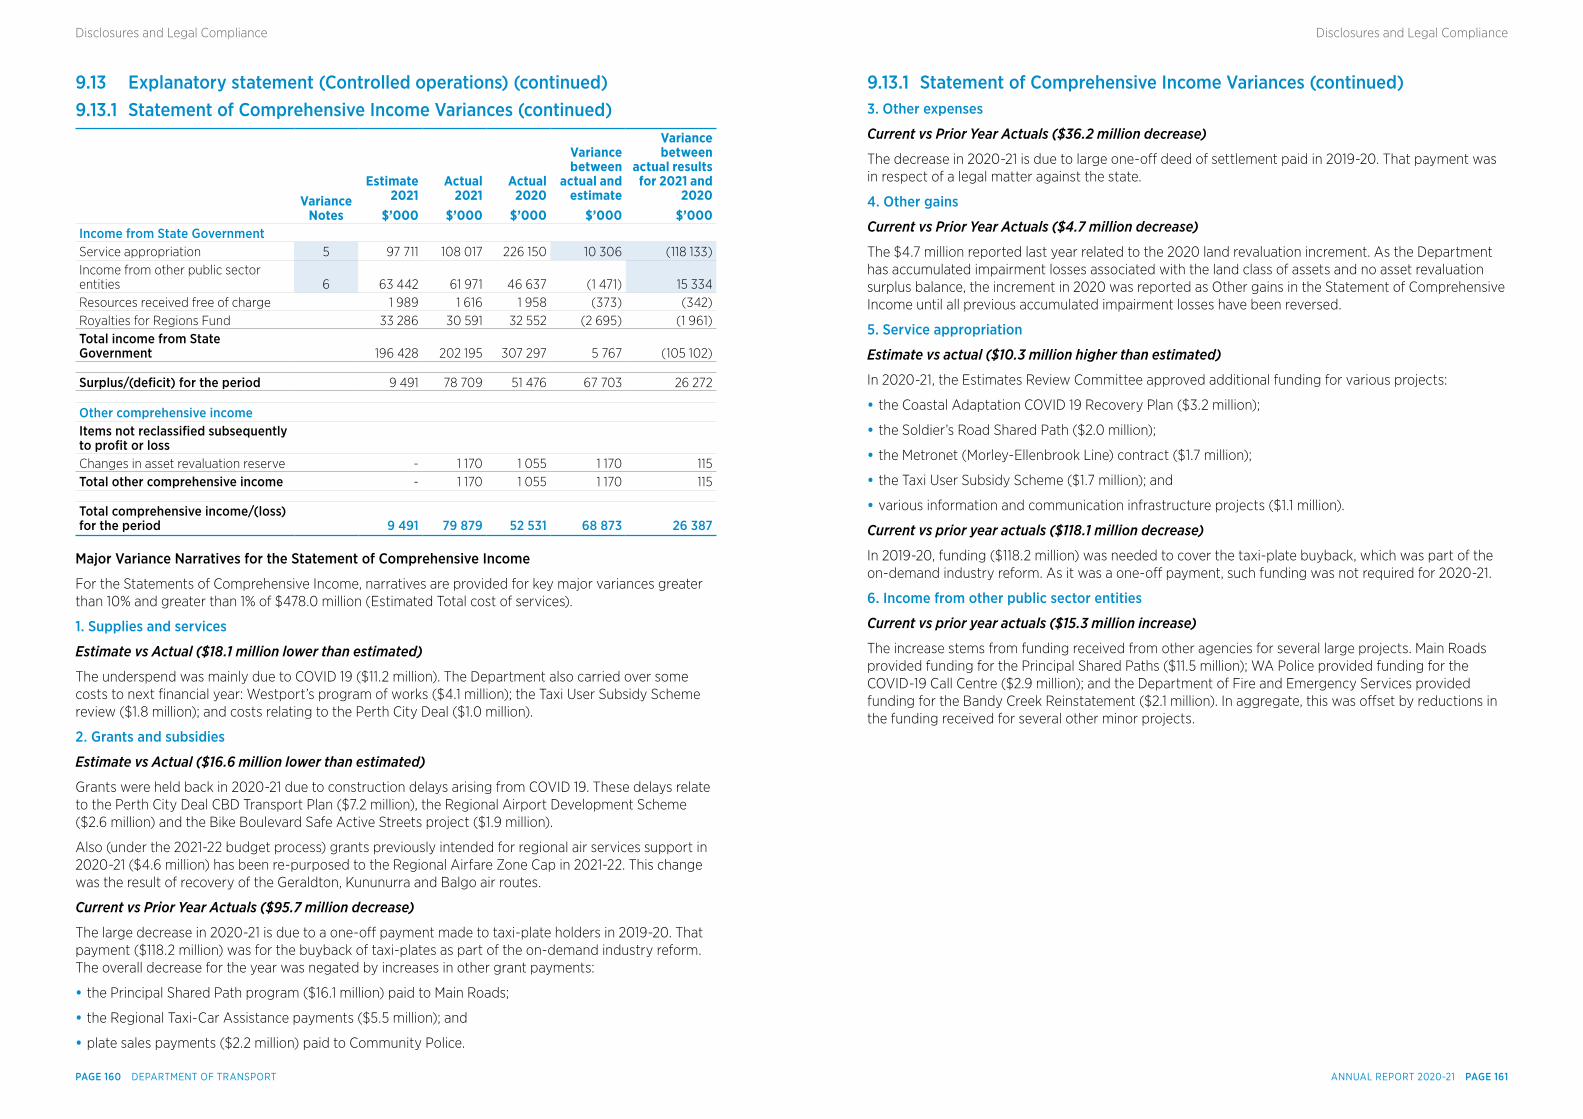
9.13 Explanatory statement (Controlled operations) (continued)9.13.1 Statement of Comprehensive Income Variances (continued)
Variance Notes
Estimate 2021
$’000
Actual 2021
$’000
Actual 2020
$’000
Variance between
actual and estimate
$’000
Variance between
actual results for 2021 and
2020$’000
Income from State Government Service appropriation 5 97 711 108 017 226 150 10 306 (118 133)Income from other public sector entities 6 63 442 61 971 46 637 (1 471) 15 334Resources received free of charge 1 989 1 616 1 958 (373) (342)Royalties for Regions Fund 33 286 30 591 32 552 (2 695) (1 961)Total income from State Government 196 428 202 195 307 297 5 767 (105 102)
Surplus/(defcit) for the period 9 491 78 709 51 476 67 703 26 272
Other comprehensive income Items not reclassifed subsequently to proft or loss Changes in asset revaluation reserve - 1 170 1 055 1 170 115Total other comprehensive income - 1 170 1 055 1 170 115
Total comprehensive income/(loss) for the period 9 491 79 879 52 531 68 873 26 387
Major Variance Narratives for the Statement of Comprehensive Income
For the Statements of Comprehensive Income, narratives are provided for key major variances greater than 10% and greater than 1% of $478.0 million (Estimated Total cost of services).
1. Supplies and services
Estimate vs Actual ($18.1 million lower than estimated)
The underspend was mainly due to COVID 19 ($11.2 million). The Department also carried over some costs to next financial year: Westport’s program of works ($4.1 million); the Taxi User Subsidy Scheme review ($1.8 million); and costs relating to the Perth City Deal ($1.0 million).
2. Grants and subsidies
Estimate vs Actual ($16.6 million lower than estimated)
Grants were held back in 2020-21 due to construction delays arising from COVID 19. These delays relate to the Perth City Deal CBD Transport Plan ($7.2 million), the Regional Airport Development Scheme ($2.6 million) and the Bike Boulevard Safe Active Streets project ($1.9 million).
Also (under the 2021-22 budget process) grants previously intended for regional air services support in 2020-21 ($4.6 million) has been re-purposed to the Regional Airfare Zone Cap in 2021-22. This change was the result of recovery of the Geraldton, Kununurra and Balgo air routes.
Current vs Prior Year Actuals ($95.7 million decrease)
The large decrease in 2020-21 is due to a one-off payment made to taxi-plate holders in 2019-20. That payment ($118.2 million) was for the buyback of taxi-plates as part of the on-demand industry reform. The overall decrease for the year was negated by increases in other grant payments:
• the Principal Shared Path program ($16.1 million) paid to Main Roads;
• the Regional Taxi-Car Assistance payments ($5.5 million); and
• plate sales payments ($2.2 million) paid to Community Police.
9.13.1 Statement of Comprehensive Income Variances (continued)3. Other expenses
Current vs Prior Year Actuals ($36.2 million decrease)
The decrease in 2020-21 is due to large one-off deed of settlement paid in 2019-20. That payment was in respect of a legal matter against the state.
4. Other gains
Current vs Prior Year Actuals ($4.7 million decrease)
The $4.7 million reported last year related to the 2020 land revaluation increment. As the Department has accumulated impairment losses associated with the land class of assets and no asset revaluation surplus balance, the increment in 2020 was reported as Other gains in the Statement of Comprehensive Income until all previous accumulated impairment losses have been reversed.
5. Service appropriation
Estimate vs actual ($10.3 million higher than estimated)
In 2020-21, the Estimates Review Committee approved additional funding for various projects:
• the Coastal Adaptation COVID 19 Recovery Plan ($3.2 million);
• the Soldier’s Road Shared Path ($2.0 million);
• the Metronet (Morley-Ellenbrook Line) contract ($1.7 million);
• the Taxi User Subsidy Scheme ($1.7 million); and
• various information and communication infrastructure projects ($1.1 million).
Current vs prior year actuals ($118.1 million decrease)
In 2019-20, funding ($118.2 million) was needed to cover the taxi-plate buyback, which was part of the on-demand industry reform. As it was a one-off payment, such funding was not required for 2020-21.
6. Income from other public sector entities
Current vs prior year actuals ($15.3 million increase)
The increase stems from funding received from other agencies for several large projects. Main Roads provided funding for the Principal Shared Paths ($11.5 million); WA Police provided funding for the COVID-19 Call Centre ($2.9 million); and the Department of Fire and Emergency Services provided funding for the Bandy Creek Reinstatement ($2.1 million). In aggregate, this was offset by reductions in the funding received for several other minor projects.
ANNUAL REPORT 2020-21 PAGE 161PAGE 160 DEPARTMENT OF TRANSPORT
Disclosures and Legal ComplianceDisclosures and Legal Compliance
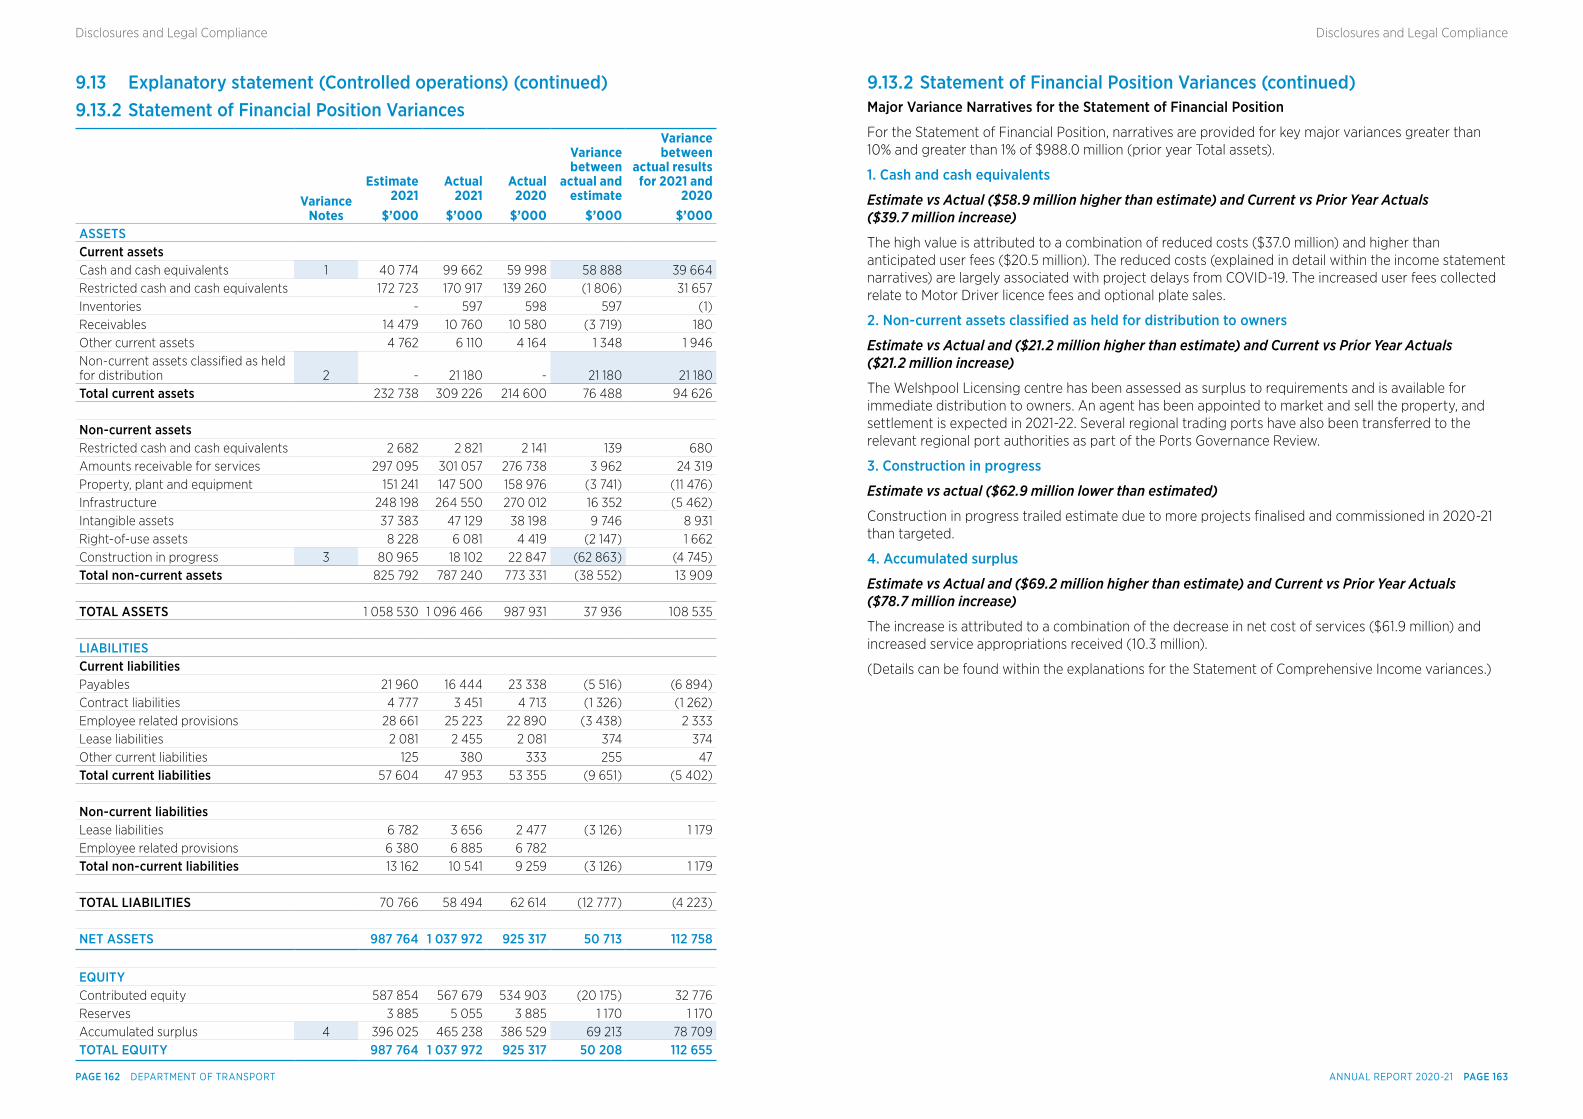
9.13 Explanatory statement (Controlled operations) (continued)9.13.2 Statement of Financial Position Variances
Variance
Notes
Estimate 2021
$’000
Actual 2021
$’000
Actual 2020
$’000
Variance between
actual and estimate
$’000
Variance between
actual results for 2021 and
2020 $’000
ASSETS Current assets Cash and cash equivalents 1 40 774 99 662 59 998 58 888 39 664Restricted cash and cash equivalents 172 723 170 917 139 260 (1 806) 31 657Inventories - 597 598 597 (1)Receivables 14 479 10 760 10 580 (3 719) 180Other current assets 4 762 6 110 4 164 1 348 1 946Non-current assets classified as held for distribution 2 - 21 180 - 21 180 21 180Total current assets 232 738 309 226 214 600 76 488 94 626 Non-current assets Restricted cash and cash equivalents 2 682 2 821 2 141 139 680Amounts receivable for services 297 095 301 057 276 738 3 962 24 319Property, plant and equipment 151 241 147 500 158 976 (3 741) (11 476)Infrastructure 248 198 264 550 270 012 16 352 (5 462)Intangible assets 37 383 47 129 38 198 9 746 8 931Right-of-use assets 8 228 6 081 4 419 (2 147) 1 662Construction in progress 3 80 965 18 102 22 847 (62 863) (4 745)Total non-current assets 825 792 787 240 773 331 (38 552) 13 909 TOTAL ASSETS 1 058 530 1 096 466 987 931 37 936 108 535
LIABILITIES Current liabilities Payables 21 960 16 444 23 338 (5 516) (6 894)Contract liabilities 4 777 3 451 4 713 (1 326) (1 262)Employee related provisions 28 661 25 223 22 890 (3 438) 2 333Lease liabilities 2 081 2 455 2 081 374 374Other current liabilities 125 380 333 255 47Total current liabilities 57 604 47 953 53 355 (9 651) (5 402) Non-current liabilities Lease liabilities 6 782 3 656 2 477 (3 126) 1 179Employee related provisions 6 380 6 885 6 782 Total non-current liabilities 13 162 10 541 9 259 (3 126) 1 179 TOTAL LIABILITIES 70 766 58 494 62 614 (12 777) (4 223) NET ASSETS 987 764 1 037 972 925 317 50 713 112 758 EQUITY Contributed equity 587 854 567 679 534 903 (20 175) 32 776Reserves 3 885 5 055 3 885 1 170 1 170Accumulated surplus 4 396 025 465 238 386 529 69 213 78 709TOTAL EQUITY 987 764 1 037 972 925 317 50 208 112 655
9.13.2 Statement of Financial Position Variances (continued)Major Variance Narratives for the Statement of Financial Position
For the Statement of Financial Position, narratives are provided for key major variances greater than 10% and greater than 1% of $988.0 million (prior year Total assets).
1. Cash and cash equivalents
Estimate vs Actual ($58.9 million higher than estimate) and Current vs Prior Year Actuals ($39.7 million increase)
The high value is attributed to a combination of reduced costs ($37.0 million) and higher than anticipated user fees ($20.5 million). The reduced costs (explained in detail within the income statement narratives) are largely associated with project delays from COVID-19. The increased user fees collected relate to Motor Driver licence fees and optional plate sales.
2. Non-current assets classifed as held for distribution to owners
Estimate vs Actual and ($21.2 million higher than estimate) and Current vs Prior Year Actuals ($21.2 million increase)
The Welshpool Licensing centre has been assessed as surplus to requirements and is available for immediate distribution to owners. An agent has been appointed to market and sell the property, and settlement is expected in 2021-22. Several regional trading ports have also been transferred to the relevant regional port authorities as part of the Ports Governance Review.
3. Construction in progress
Estimate vs actual ($62.9 million lower than estimated)
Construction in progress trailed estimate due to more projects finalised and commissioned in 2020-21 than targeted.
4. Accumulated surplus
Estimate vs Actual and ($69.2 million higher than estimate) and Current vs Prior Year Actuals ($78.7 million increase)
The increase is attributed to a combination of the decrease in net cost of services ($61.9 million) and increased service appropriations received (10.3 million).
(Details can be found within the explanations for the Statement of Comprehensive Income variances.)
ANNUAL REPORT 2020-21 PAGE 163PAGE 162 DEPARTMENT OF TRANSPORT
Disclosures and Legal ComplianceDisclosures and Legal Compliance
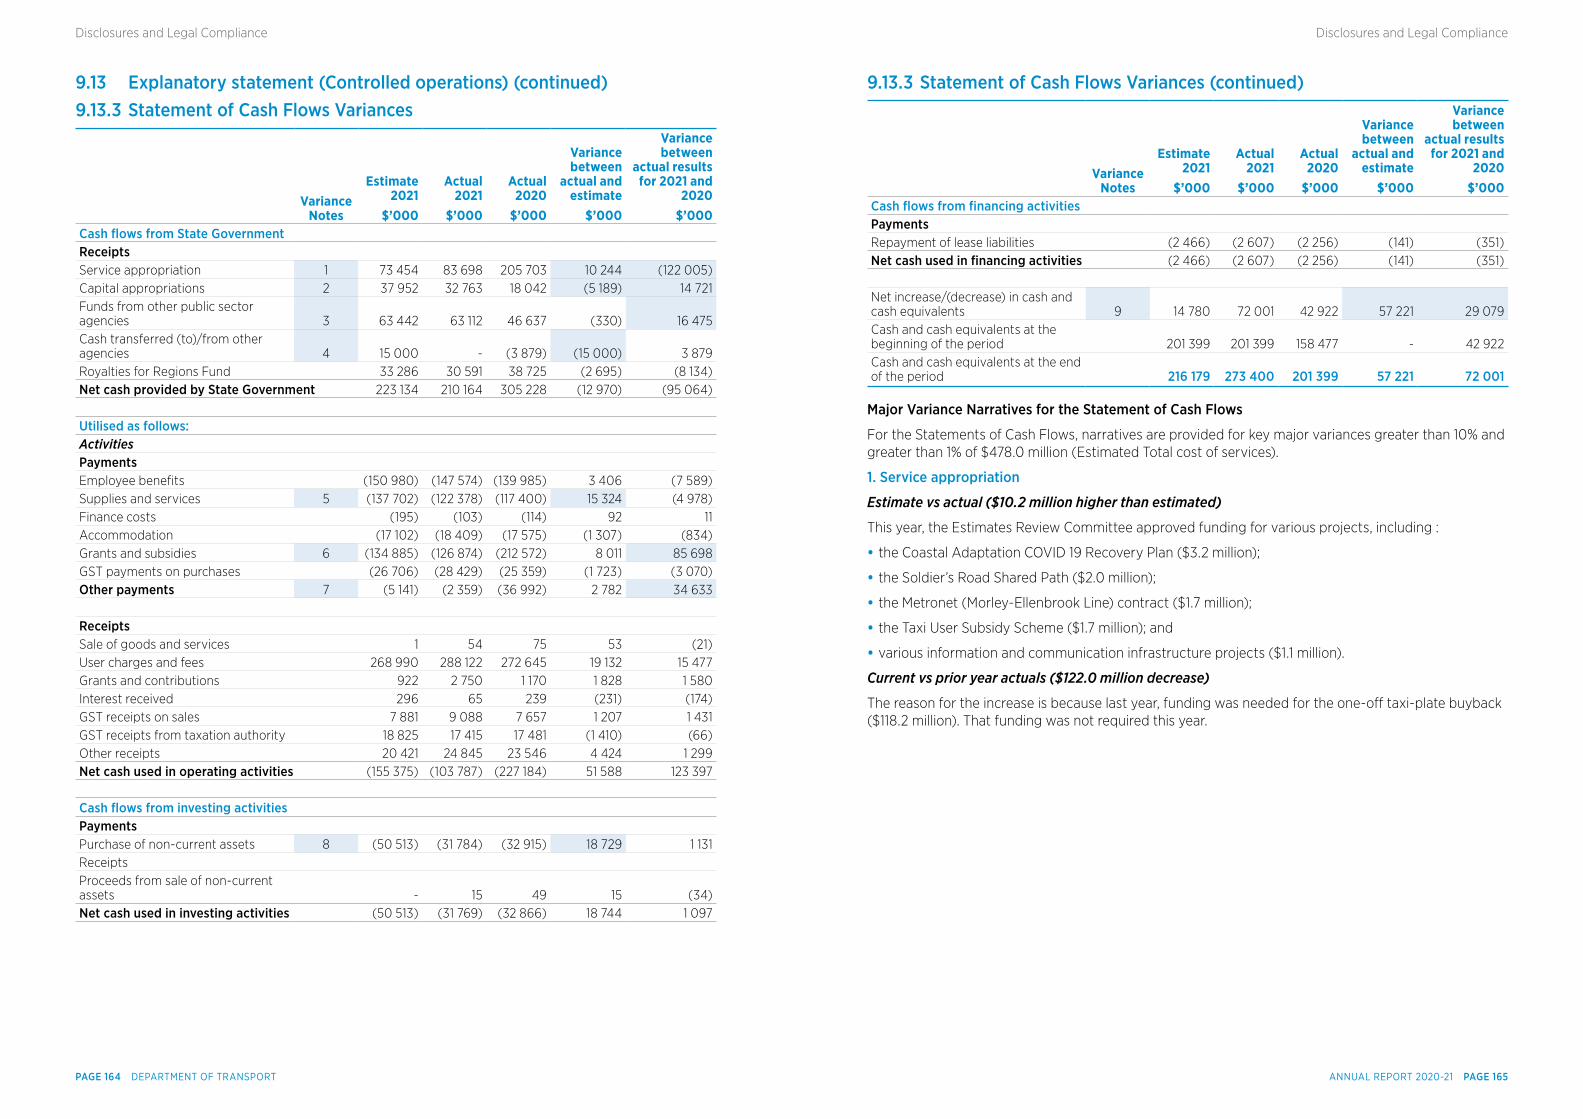
9.13 Explanatory statement (Controlled operations) (continued)9.13.3 Statement of Cash Flows Variances
Variance
Notes
Estimate 2021
$’000
Actual 2021
$’000
Actual 2020
$’000
Variance between
actual and estimate
$’000
Variance between
actual results for 2021 and
2020 $’000
Cash fows from State Government Receipts Service appropriation 1 73 454 83 698 205 703 10 244 (122 005)Capital appropriations 2 37 952 32 763 18 042 (5 189) 14 721Funds from other public sector agencies 3 63 442 63 112 46 637 (330) 16 475Cash transferred (to)/from other agencies 4 15 000 - (3 879) (15 000) 3 879Royalties for Regions Fund 33 286 30 591 38 725 (2 695) (8 134)Net cash provided by State Government 223 134 210 164 305 228 (12 970) (95 064) Utilised as follows: Activities Payments Employee benefits (150 980) (147 574) (139 985) 3 406 (7 589)Supplies and services 5 (137 702) (122 378) (117 400) 15 324 (4 978)Finance costs (195) (103) (114) 92 11Accommodation (17 102) (18 409) (17 575) (1 307) (834)Grants and subsidies 6 (134 885) (126 874) (212 572) 8 011 85 698GST payments on purchases (26 706) (28 429) (25 359) (1 723) (3 070)Other payments 7 (5 141) (2 359) (36 992) 2 782 34 633 Receipts Sale of goods and services 1 54 75 53 (21)User charges and fees 268 990 288 122 272 645 19 132 15 477Grants and contributions 922 2 750 1 170 1 828 1 580Interest received 296 65 239 (231) (174)GST receipts on sales 7 881 9 088 7 657 1 207 1 431GST receipts from taxation authority 18 825 17 415 17 481 (1 410) (66)Other receipts 20 421 24 845 23 546 4 424 1 299Net cash used in operating activities (155 375) (103 787) (227 184) 51 588 123 397 Cash fows from investing activities Payments Purchase of non-current assets 8 (50 513) (31 784) (32 915) 18 729 1 131Receipts Proceeds from sale of non-current assets - 15 49 15 (34)Net cash used in investing activities (50 513) (31 769) (32 866) 18 744 1 097
9.13.3 Statement of Cash Flows Variances (continued)
Variance
Notes
Estimate 2021
$’000
Actual 2021
$’000
Actual 2020
$’000
Variance between
actual and estimate
$’000
Variance between
actual results for 2021 and
2020 $’000
Cash fows from fnancing activities Payments Repayment of lease liabilities (2 466) (2 607) (2 256) (141) (351)Net cash used in fnancing activities (2 466) (2 607) (2 256) (141) (351) Net increase/(decrease) in cash and cash equivalents 9 14 780 72 001 42 922 57 221 29 079Cash and cash equivalents at the beginning of the period 201 399 201 399 158 477 - 42 922Cash and cash equivalents at the end of the period 216 179 273 400 201 399 57 221 72 001
Major Variance Narratives for the Statement of Cash Flows
For the Statements of Cash Flows, narratives are provided for key major variances greater than 10% and greater than 1% of $478.0 million (Estimated Total cost of services).
1. Service appropriation
Estimate vs actual ($10.2 million higher than estimated)
This year, the Estimates Review Committee approved funding for various projects, including :
• the Coastal Adaptation COVID 19 Recovery Plan ($3.2 million);
• the Soldier’s Road Shared Path ($2.0 million);
• the Metronet (Morley-Ellenbrook Line) contract ($1.7 million);
• the Taxi User Subsidy Scheme ($1.7 million); and
• various information and communication infrastructure projects ($1.1 million).
Current vs prior year actuals ($122.0 million decrease)
The reason for the increase is because last year, funding was needed for the one-off taxi-plate buyback ($118.2 million). That funding was not required this year.
ANNUAL REPORT 2020-21 PAGE 165PAGE 164 DEPARTMENT OF TRANSPORT
Disclosures and Legal ComplianceDisclosures and Legal Compliance
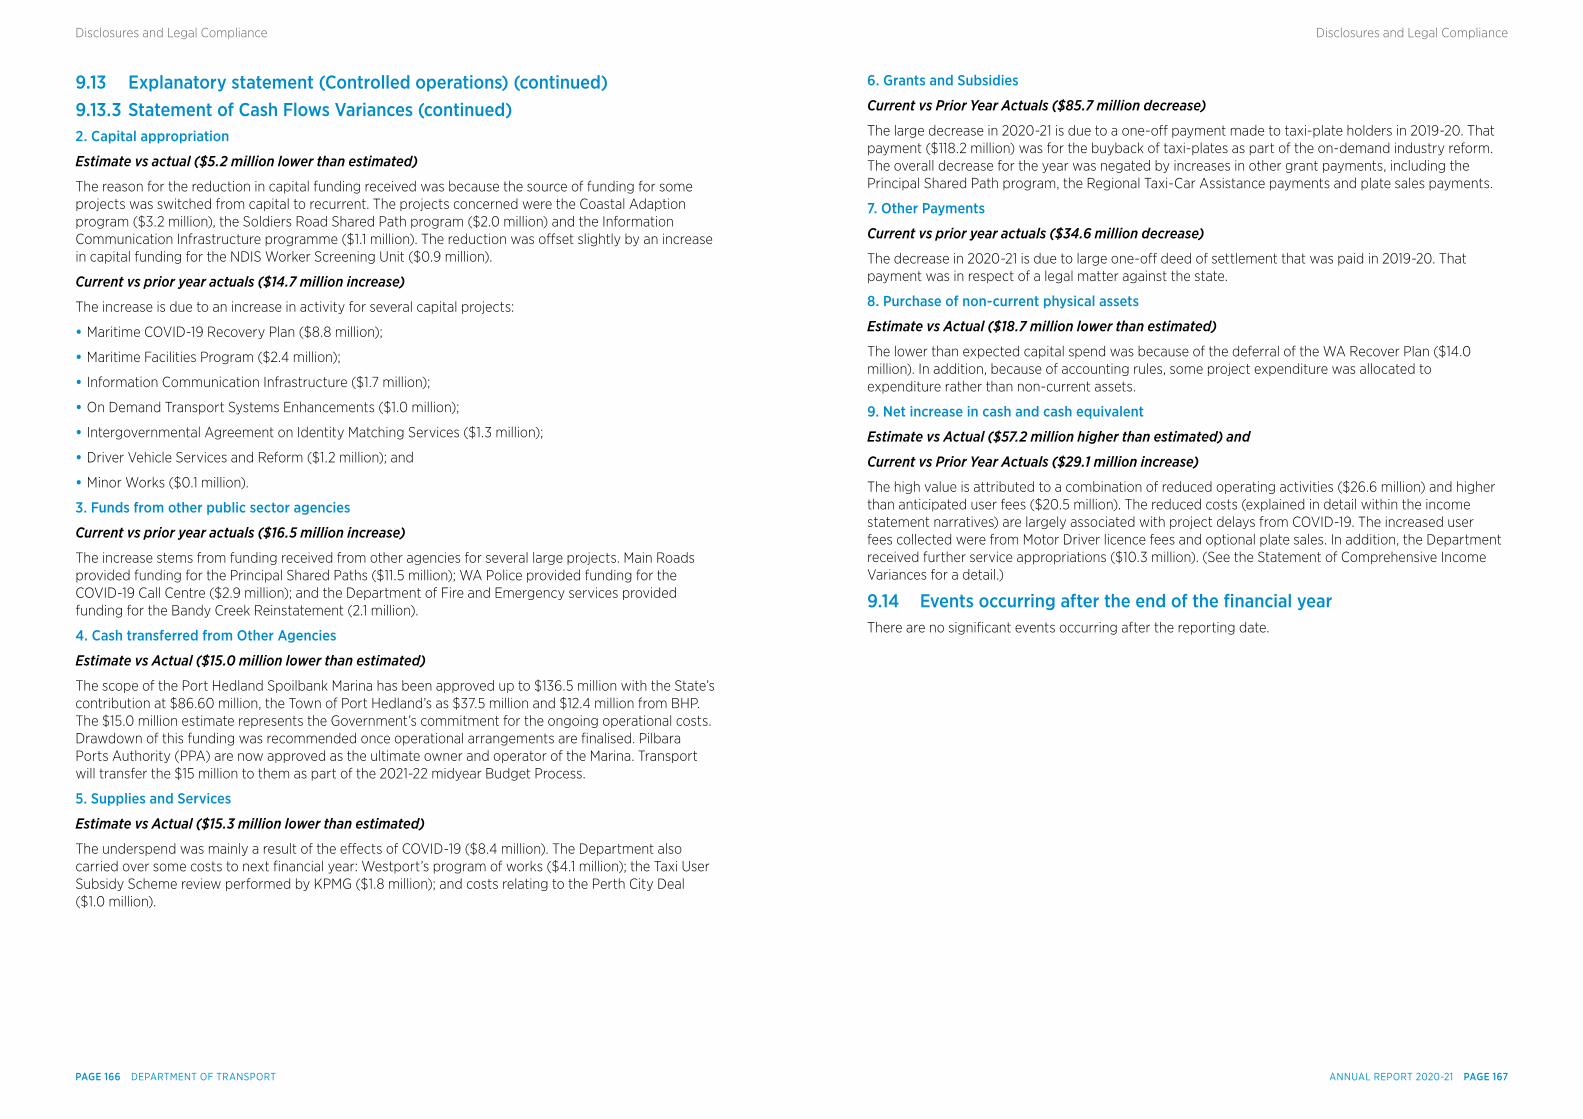
9.13 Explanatory statement (Controlled operations) (continued)9.13.3 Statement of Cash Flows Variances (continued)2. Capital appropriation
Estimate vs actual ($5.2 million lower than estimated)
The reason for the reduction in capital funding received was because the source of funding for some projects was switched from capital to recurrent. The projects concerned were the Coastal Adaption program ($3.2 million), the Soldiers Road Shared Path program ($2.0 million) and the Information Communication Infrastructure programme ($1.1 million). The reduction was offset slightly by an increase in capital funding for the NDIS Worker Screening Unit ($0.9 million).
Current vs prior year actuals ($14.7 million increase)
The increase is due to an increase in activity for several capital projects:
• Maritime COVID-19 Recovery Plan ($8.8 million);
• Maritime Facilities Program ($2.4 million);
• Information Communication Infrastructure ($1.7 million);
• On Demand Transport Systems Enhancements ($1.0 million);
• Intergovernmental Agreement on Identity Matching Services ($1.3 million);
• Driver Vehicle Services and Reform ($1.2 million); and
• Minor Works ($0.1 million).
3. Funds from other public sector agencies
Current vs prior year actuals ($16.5 million increase)
The increase stems from funding received from other agencies for several large projects. Main Roads provided funding for the Principal Shared Paths ($11.5 million); WA Police provided funding for the COVID-19 Call Centre ($2.9 million); and the Department of Fire and Emergency services provided funding for the Bandy Creek Reinstatement (2.1 million).
4. Cash transferred from Other Agencies
Estimate vs Actual ($15.0 million lower than estimated)
The scope of the Port Hedland Spoilbank Marina has been approved up to $136.5 million with the State’s contribution at $86.60 million, the Town of Port Hedland’s as $37.5 million and $12.4 million from BHP. The $15.0 million estimate represents the Government’s commitment for the ongoing operational costs. Drawdown of this funding was recommended once operational arrangements are finalised. Pilbara Ports Authority (PPA) are now approved as the ultimate owner and operator of the Marina. Transport will transfer the $15 million to them as part of the 2021-22 midyear Budget Process.
5. Supplies and Services
Estimate vs Actual ($15.3 million lower than estimated)
The underspend was mainly a result of the effects of COVID-19 ($8.4 million). The Department also carried over some costs to next financial year: Westport’s program of works ($4.1 million); the Taxi User Subsidy Scheme review performed by KPMG ($1.8 million); and costs relating to the Perth City Deal ($1.0 million).
6. Grants and Subsidies
Current vs Prior Year Actuals ($85.7 million decrease)
The large decrease in 2020-21 is due to a one-off payment made to taxi-plate holders in 2019-20. That payment ($118.2 million) was for the buyback of taxi-plates as part of the on-demand industry reform. The overall decrease for the year was negated by increases in other grant payments, including the Principal Shared Path program, the Regional Taxi-Car Assistance payments and plate sales payments.
7. Other Payments
Current vs prior year actuals ($34.6 million decrease)
The decrease in 2020-21 is due to large one-off deed of settlement that was paid in 2019-20. That payment was in respect of a legal matter against the state.
8. Purchase of non-current physical assets
Estimate vs Actual ($18.7 million lower than estimated)
The lower than expected capital spend was because of the deferral of the WA Recover Plan ($14.0 million). In addition, because of accounting rules, some project expenditure was allocated to expenditure rather than non-current assets.
9. Net increase in cash and cash equivalent
Estimate vs Actual ($57.2 million higher than estimated) and
Current vs Prior Year Actuals ($29.1 million increase)
The high value is attributed to a combination of reduced operating activities ($26.6 million) and higher than anticipated user fees ($20.5 million). The reduced costs (explained in detail within the income statement narratives) are largely associated with project delays from COVID-19. The increased user fees collected were from Motor Driver licence fees and optional plate sales. In addition, the Department received further service appropriations ($10.3 million). (See the Statement of Comprehensive Income Variances for a detail.)
9.14 Events occurring after the end of the fnancial yearThere are no significant events occurring after the reporting date.
ANNUAL REPORT 2020-21 PAGE 167PAGE 166 DEPARTMENT OF TRANSPORT
Disclosures and Legal ComplianceDisclosures and Legal Compliance
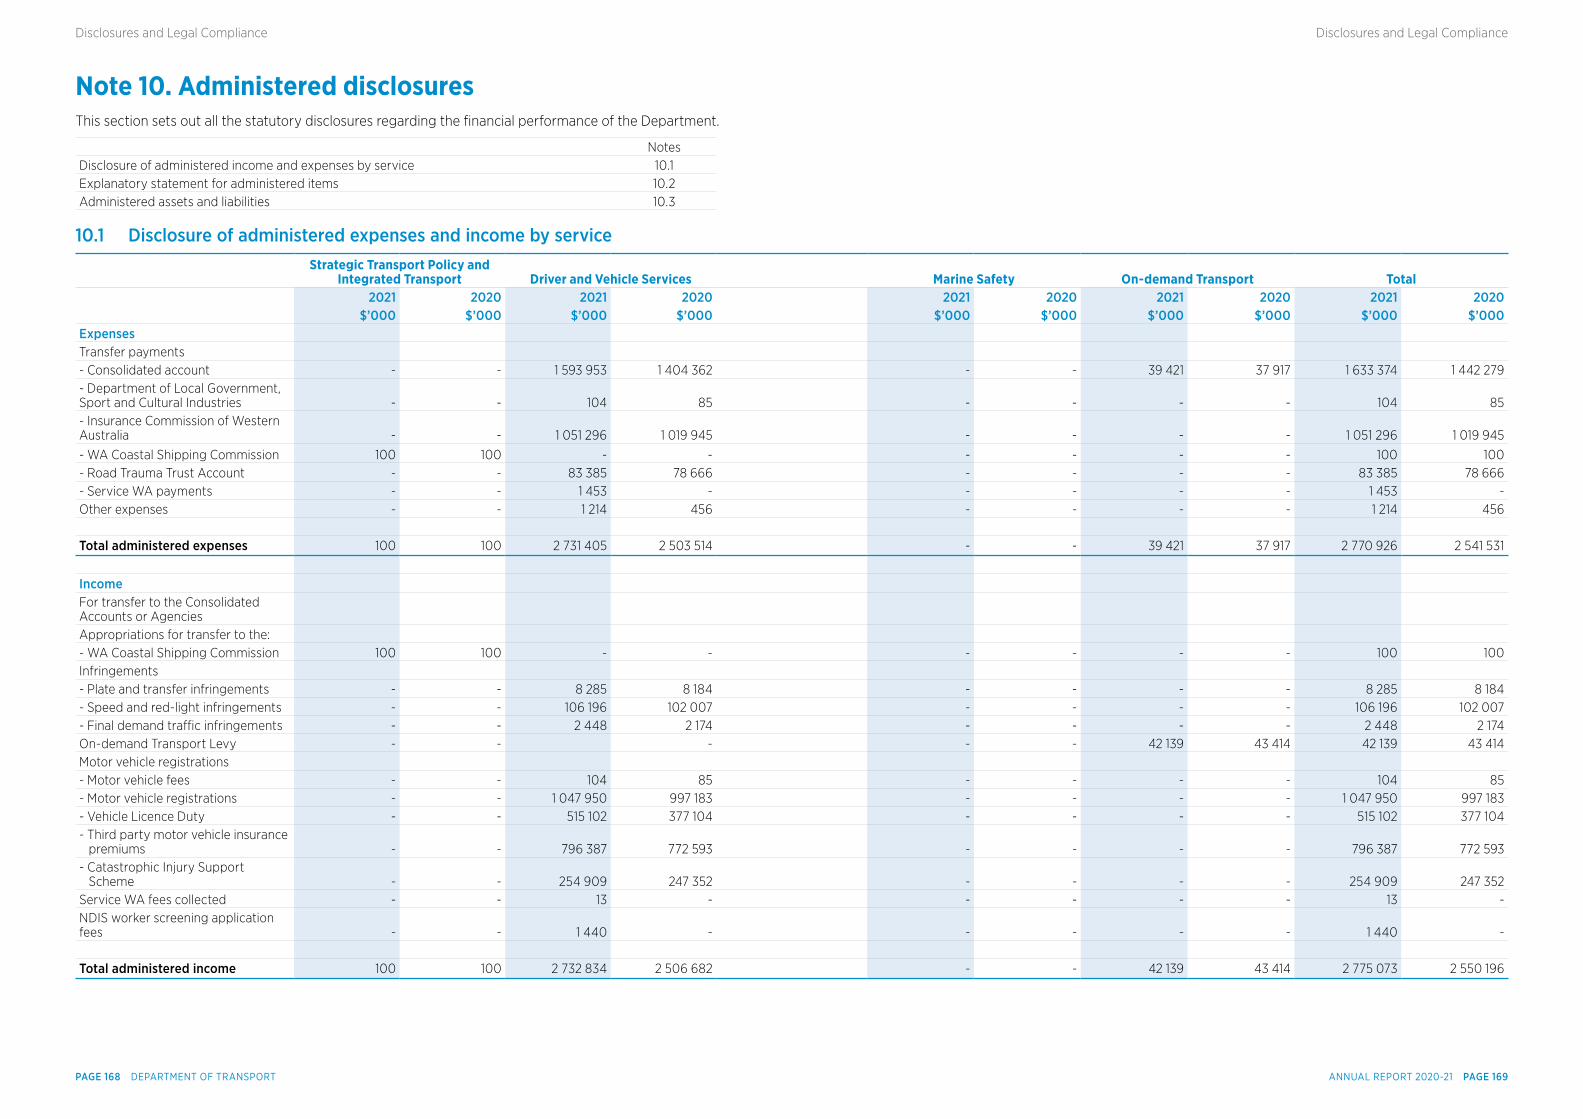
Note 10. Administered disclosuresThis section sets out all the statutory disclosures regarding the financial performance of the Department.
NotesDisclosure of administered income and expenses by service 10.1Explanatory statement for administered items 10.2Administered assets and liabilities 10.3
10.1 Disclosure of administered expenses and income by service
Strategic Transport Policy and
Integrated Transport Driver and Vehicle Services Marine Safety On-demand Transport Total 2021 2020 2021 2020 2021 2020 2021 2020 2021 2020 $’000 $’000 $’000 $’000 $’000 $’000 $’000 $’000 $’000 $’000
Expenses Transfer payments - Consolidated account - - 1 593 953 1 404 362 - - 39 421 37 917 1 633 374 1 442 279- Department of Local Government, Sport and Cultural Industries - - 104 85 - - - - 104 85- Insurance Commission of Western Australia - - 1 051 296 1 019 945 - - - - 1 051 296 1 019 945
- WA Coastal Shipping Commission 100 100 - - - - - - 100 100- Road Trauma Trust Account - - 83 385 78 666 - - - - 83 385 78 666- Service WA payments - - 1 453 - - - - - 1 453 -Other expenses - - 1 214 456 - - - - 1 214 456
Total administered expenses 100 100 2 731 405 2 503 514 - - 39 421 37 917 2 770 926 2 541 531
Income For transfer to the Consolidated Accounts or Agencies Appropriations for transfer to the: - WA Coastal Shipping Commission 100 100 - - - - - - 100 100Infringements - Plate and transfer infringements - - 8 285 8 184 - - - - 8 285 8 184- Speed and red-light infringements - - 106 196 102 007 - - - - 106 196 102 007- Final demand traffic infringements - - 2 448 2 174 - - - - 2 448 2 174On-demand Transport Levy - - - - - 42 139 43 414 42 139 43 414Motor vehicle registrations - Motor vehicle fees - - 104 85 - - - - 104 85- Motor vehicle registrations - - 1 047 950 997 183 - - - - 1 047 950 997 183- Vehicle Licence Duty - - 515 102 377 104 - - - - 515 102 377 104- Third party motor vehicle insurance
premiums - - 796 387 772 593 - - - - 796 387 772 593- Catastrophic Injury Support
Scheme - - 254 909 247 352 - - - - 254 909 247 352Service WA fees collected - - 13 - - - - - 13 -NDIS worker screening application fees - - 1 440 - - - - - 1 440 -
Total administered income 100 100 2 732 834 2 506 682 - - 42 139 43 414 2 775 073 2 550 196
ANNUAL REPORT 2020-21 PAGE 169PAGE 168 DEPARTMENT OF TRANSPORT
Disclosures and Legal ComplianceDisclosures and Legal Compliance
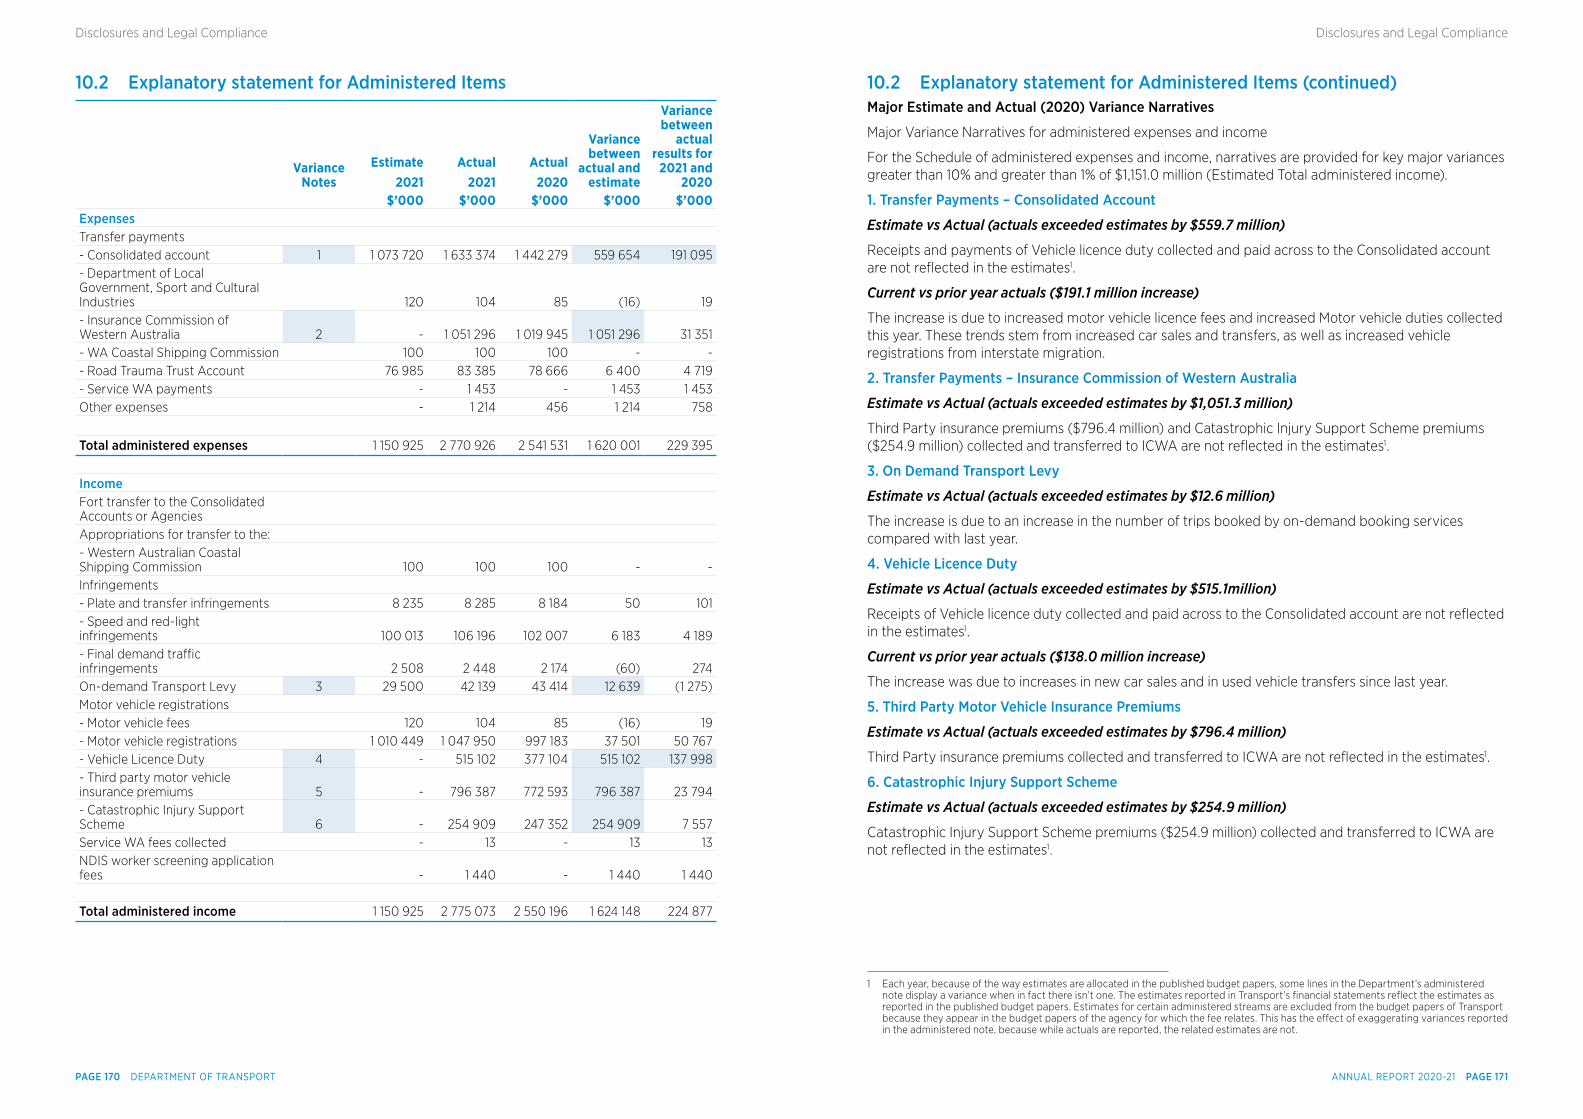
10.2 Explanatory statement for Administered Items
Variance
NotesEstimate
2021Actual
2021Actual
2020
Variance between
actual and estimate
Variance between
actual results for
2021 and 2020
$’000 $’000 $’000 $’000 $’000Expenses Transfer payments - Consolidated account 1 1 073 720 1 633 374 1 442 279 559 654 191 095- Department of Local Government, Sport and Cultural Industries 120 104 85 (16) 19- Insurance Commission of Western Australia 2 - 1 051 296 1 019 945 1 051 296 31 351- WA Coastal Shipping Commission 100 100 100 - -- Road Trauma Trust Account 76 985 83 385 78 666 6 400 4 719- Service WA payments - 1 453 - 1 453 1 453Other expenses - 1 214 456 1 214 758
Total administered expenses 1 150 925 2 770 926 2 541 531 1 620 001 229 395
Income Fort transfer to the Consolidated Accounts or Agencies Appropriations for transfer to the: - Western Australian Coastal Shipping Commission 100 100 100 - -Infringements - Plate and transfer infringements 8 235 8 285 8 184 50 101- Speed and red-light infringements 100 013 106 196 102 007 6 183 4 189- Final demand traffic infringements 2 508 2 448 2 174 (60) 274On-demand Transport Levy 3 29 500 42 139 43 414 12 639 (1 275)Motor vehicle registrations - Motor vehicle fees 120 104 85 (16) 19- Motor vehicle registrations 1 010 449 1 047 950 997 183 37 501 50 767- Vehicle Licence Duty 4 - 515 102 377 104 515 102 137 998- Third party motor vehicle insurance premiums 5 - 796 387 772 593 796 387 23 794- Catastrophic Injury Support Scheme 6 - 254 909 247 352 254 909 7 557Service WA fees collected - 13 - 13 13NDIS worker screening application fees - 1 440 - 1 440 1 440
Total administered income 1 150 925 2 775 073 2 550 196 1 624 148 224 877
10.2 Explanatory statement for Administered Items (continued)Major Estimate and Actual (2020) Variance Narratives
Major Variance Narratives for administered expenses and income
For the Schedule of administered expenses and income, narratives are provided for key major variances greater than 10% and greater than 1% of $1,151.0 million (Estimated Total administered income).
1. Transfer Payments – Consolidated Account
Estimate vs Actual (actuals exceeded estimates by $559.7 million)
Receipts and payments of Vehicle licence duty collected and paid across to the Consolidated account are not reflected in the estimates1.
Current vs prior year actuals ($191.1 million increase)
The increase is due to increased motor vehicle licence fees and increased Motor vehicle duties collected this year. These trends stem from increased car sales and transfers, as well as increased vehicle registrations from interstate migration.
2. Transfer Payments – Insurance Commission of Western Australia
Estimate vs Actual (actuals exceeded estimates by $1,051.3 million)
Third Party insurance premiums ($796.4 million) and Catastrophic Injury Support Scheme premiums ($254.9 million) collected and transferred to ICWA are not reflected in the estimates1.
3. On Demand Transport Levy
Estimate vs Actual (actuals exceeded estimates by $12.6 million)
The increase is due to an increase in the number of trips booked by on-demand booking services compared with last year.
4. Vehicle Licence Duty
Estimate vs Actual (actuals exceeded estimates by $515.1million)
Receipts of Vehicle licence duty collected and paid across to the Consolidated account are not reflected in the estimates1.
Current vs prior year actuals ($138.0 million increase)
The increase was due to increases in new car sales and in used vehicle transfers since last year.
5. Third Party Motor Vehicle Insurance Premiums
Estimate vs Actual (actuals exceeded estimates by $796.4 million)
Third Party insurance premiums collected and transferred to ICWA are not reflected in the estimates1.
6. Catastrophic Injury Support Scheme
Estimate vs Actual (actuals exceeded estimates by $254.9 million)
Catastrophic Injury Support Scheme premiums ($254.9 million) collected and transferred to ICWA are not reflected in the estimates1.
1 Each year, because of the way estimates are allocated in the published budget papers, some lines in the Department’s administered note display a variance when in fact there isn’t one. The estimates reported in Transport’s financial statements reflect the estimates as reported in the published budget papers. Estimates for certain administered streams are excluded from the budget papers of Transport because they appear in the budget papers of the agency for which the fee relates. This has the effect of exaggerating variances reported in the administered note, because while actuals are reported, the related estimates are not.
ANNUAL REPORT 2020-21 PAGE 171PAGE 170 DEPARTMENT OF TRANSPORT
Disclosures and Legal ComplianceDisclosures and Legal Compliance
10.3 Administered assets and liabilities 2021 2020 $’000 $’000Current assets Cash 20 457 20 975Accounts receivable (i) 15 305 11 142Total current assets 35 762 32 117 Total administered assets 35 762 32 117 Current liabilities Payables 5 082 5 597Accruals and interest payable 6 467 6 454Total current liabilities 11 549 12 051 Total administered liabilities 11 549 12 051
(i) Notes to the Schedule of Administered Items – Accounts Receivable
Current receivables 26 896 21 517Allowance for impairment of receivables (11 591) (10 375) 15 305 11 142
PAGE 172 DEPARTMENT OF TRANSPORT
Disclosures and Legal Compliance
Certification of Key Performance IndicatorsFor the year ended 30 June 2021
I hereby certify that the Key Performance Indicators are based on proper records, are relevant and appropriate assessors for the Department of Transport’s performance, and fairly represent the performance of the Department of Transport for the financial year ended 30 June 2021.
Peter Woronzow Accountable Authority
13 September 2021
ANNUAL REPORT 2020-21 PAGE 175PAGE 174 DEPARTMENT OF TRANSPORT
Disclosures and Legal ComplianceDisclosures and Legal Compliance
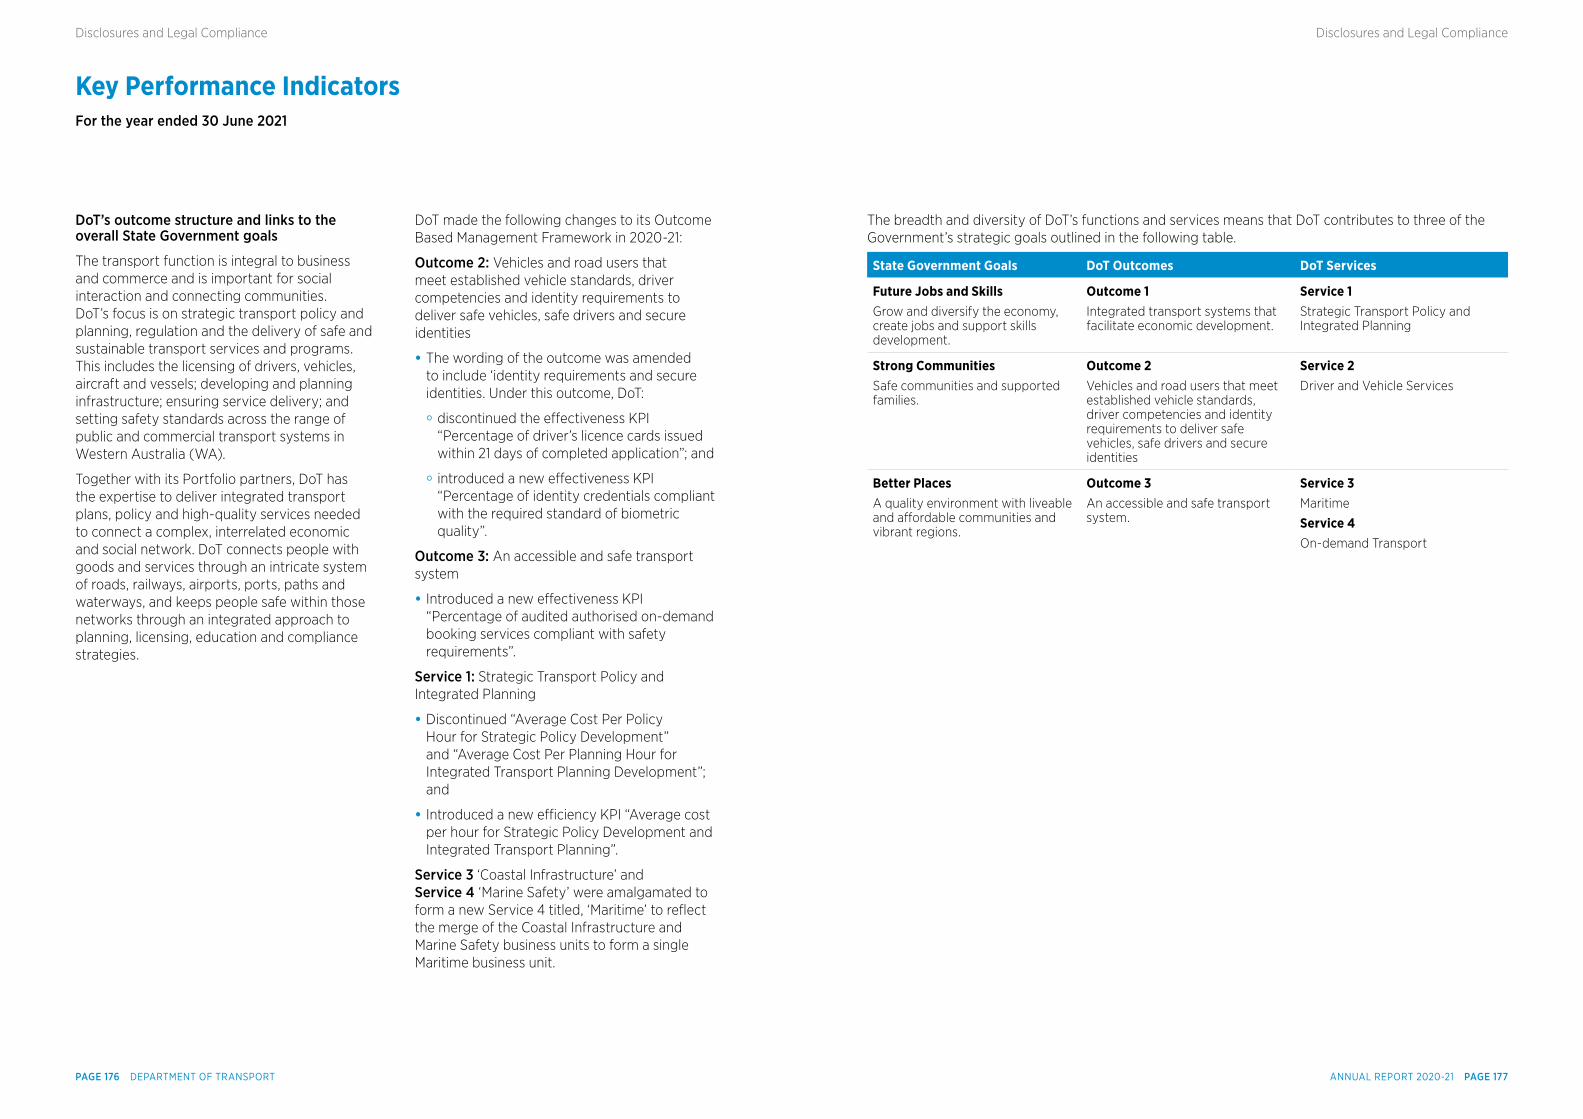
DoT’s outcome structure and links to the overall State Government goals
The transport function is integral to business and commerce and is important for social interaction and connecting communities. DoT’s focus is on strategic transport policy and planning, regulation and the delivery of safe and sustainable transport services and programs. This includes the licensing of drivers, vehicles, aircraft and vessels; developing and planning infrastructure; ensuring service delivery; and setting safety standards across the range of public and commercial transport systems in Western Australia (WA).
Together with its Portfolio partners, DoT has the expertise to deliver integrated transport plans, policy and high-quality services needed to connect a complex, interrelated economic and social network. DoT connects people with goods and services through an intricate system of roads, railways, airports, ports, paths and waterways, and keeps people safe within those networks through an integrated approach to planning, licensing, education and compliance strategies.
DoT made the following changes to its Outcome Based Management Framework in 2020-21:
Outcome 2: Vehicles and road users that meet established vehicle standards, driver competencies and identity requirements to deliver safe vehicles, safe drivers and secure identities
• The wording of the outcome was amended to include ‘identity requirements and secure identities. Under this outcome, DoT:
• discontinued the effectiveness KPI “Percentage of driver’s licence cards issued within 21 days of completed application”; and
• introduced a new effectiveness KPI “Percentage of identity credentials compliant with the required standard of biometric quality”.
Outcome 3: An accessible and safe transport system
• Introduced a new effectiveness KPI “Percentage of audited authorised on-demand booking services compliant with safety requirements”.
Service 1: Strategic Transport Policy and Integrated Planning
• Discontinued “Average Cost Per Policy Hour for Strategic Policy Development” and “Average Cost Per Planning Hour for Integrated Transport Planning Development”; and
• Introduced a new efficiency KPI “Average cost per hour for Strategic Policy Development and Integrated Transport Planning”.
Service 3 ‘Coastal Infrastructure’ and Service 4 ‘Marine Safety’ were amalgamated to form a new Service 4 titled, ‘Maritime’ to reflect the merge of the Coastal Infrastructure and Marine Safety business units to form a single Maritime business unit.
The breadth and diversity of DoT’s functions and services means that DoT contributes to three of the Government’s strategic goals outlined in the following table.
State Government Goals DoT Outcomes DoT Services
Future Jobs and SkillsGrow and diversify the economy, create jobs and support skills development.
Outcome 1Integrated transport systems that facilitate economic development.
Service 1Strategic Transport Policy and Integrated Planning
Strong CommunitiesSafe communities and supported families.
Outcome 2Vehicles and road users that meet established vehicle standards, driver competencies and identity requirements to deliver safe vehicles, safe drivers and secure identities
Service 2Driver and Vehicle Services
Better PlacesA quality environment with liveable and affordable communities and vibrant regions.
Outcome 3An accessible and safe transport system.
Service 3Maritime
Service 4On-demand Transport
Key Performance IndicatorsFor the year ended 30 June 2021
ANNUAL REPORT 2020-21 PAGE 177PAGE 176 DEPARTMENT OF TRANSPORT
Disclosures and Legal ComplianceDisclosures and Legal Compliance
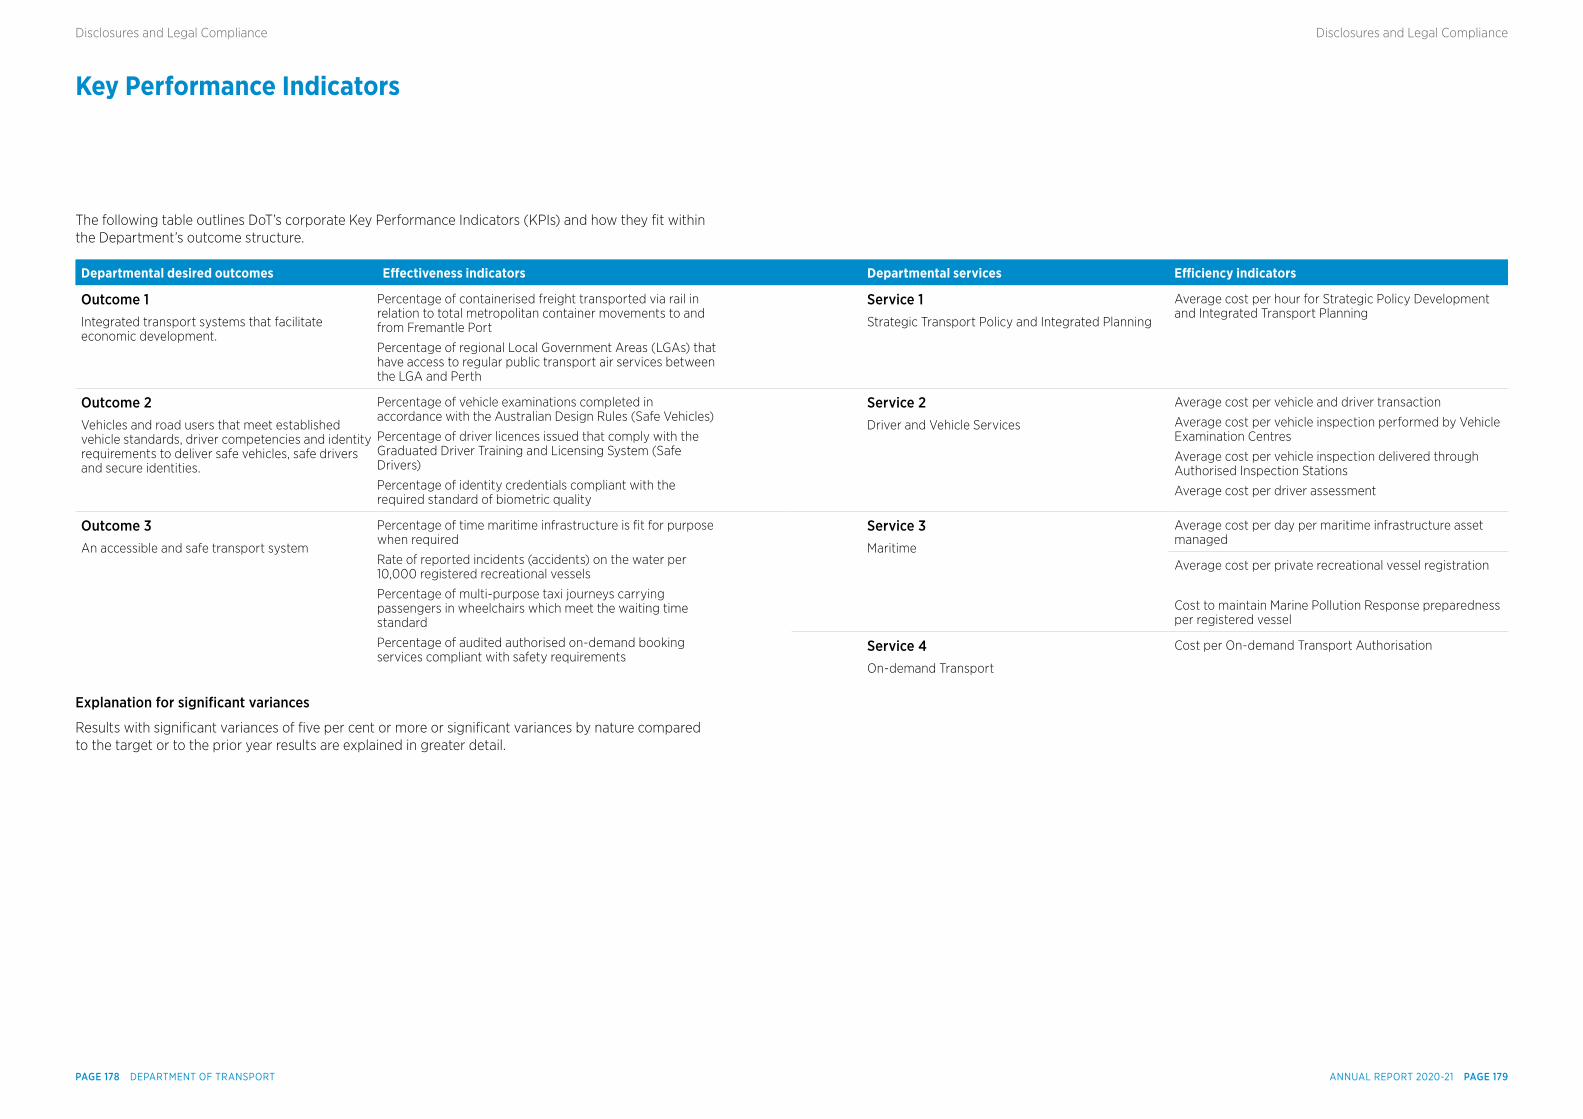
Key Performance Indicators
The following table outlines DoT’s corporate Key Performance Indicators (KPIs) and how they fit within the Department’s outcome structure.
Departmental desired outcomes Effectiveness indicators Departmental services Efficiency indicators
Outcome 1Integrated transport systems that facilitate economic development.
Percentage of containerised freight transported via rail in relation to total metropolitan container movements to and from Fremantle Port
Percentage of regional Local Government Areas (LGAs) that have access to regular public transport air services between the LGA and Perth
Service 1Strategic Transport Policy and Integrated Planning
Average cost per hour for Strategic Policy Development and Integrated Transport Planning
Outcome 2Vehicles and road users that meet established vehicle standards, driver competencies and identity requirements to deliver safe vehicles, safe drivers and secure identities.
Percentage of vehicle examinations completed in accordance with the Australian Design Rules (Safe Vehicles)
Percentage of driver licences issued that comply with the Graduated Driver Training and Licensing System (Safe Drivers)
Percentage of identity credentials compliant with the required standard of biometric quality
Service 2Driver and Vehicle Services
Average cost per vehicle and driver transaction
Average cost per vehicle inspection performed by Vehicle Examination Centres
Average cost per vehicle inspection delivered through Authorised Inspection Stations
Average cost per driver assessment
Outcome 3An accessible and safe transport system
Percentage of time maritime infrastructure is fit for purpose when required
Rate of reported incidents (accidents) on the water per 10,000 registered recreational vessels
Percentage of multi-purpose taxi journeys carrying passengers in wheelchairs which meet the waiting time standard
Percentage of audited authorised on-demand booking services compliant with safety requirements
Service 3Maritime
Average cost per day per maritime infrastructure asset managed
Average cost per private recreational vessel registration
Cost to maintain Marine Pollution Response preparedness per registered vessel
Service 4On-demand Transport
Cost per On-demand Transport Authorisation
Explanation for signifcant variances
Results with significant variances of five per cent or more or significant variances by nature compared to the target or to the prior year results are explained in greater detail.
ANNUAL REPORT 2020-21 PAGE 179PAGE 178 DEPARTMENT OF TRANSPORT
Disclosures and Legal ComplianceDisclosures and Legal Compliance
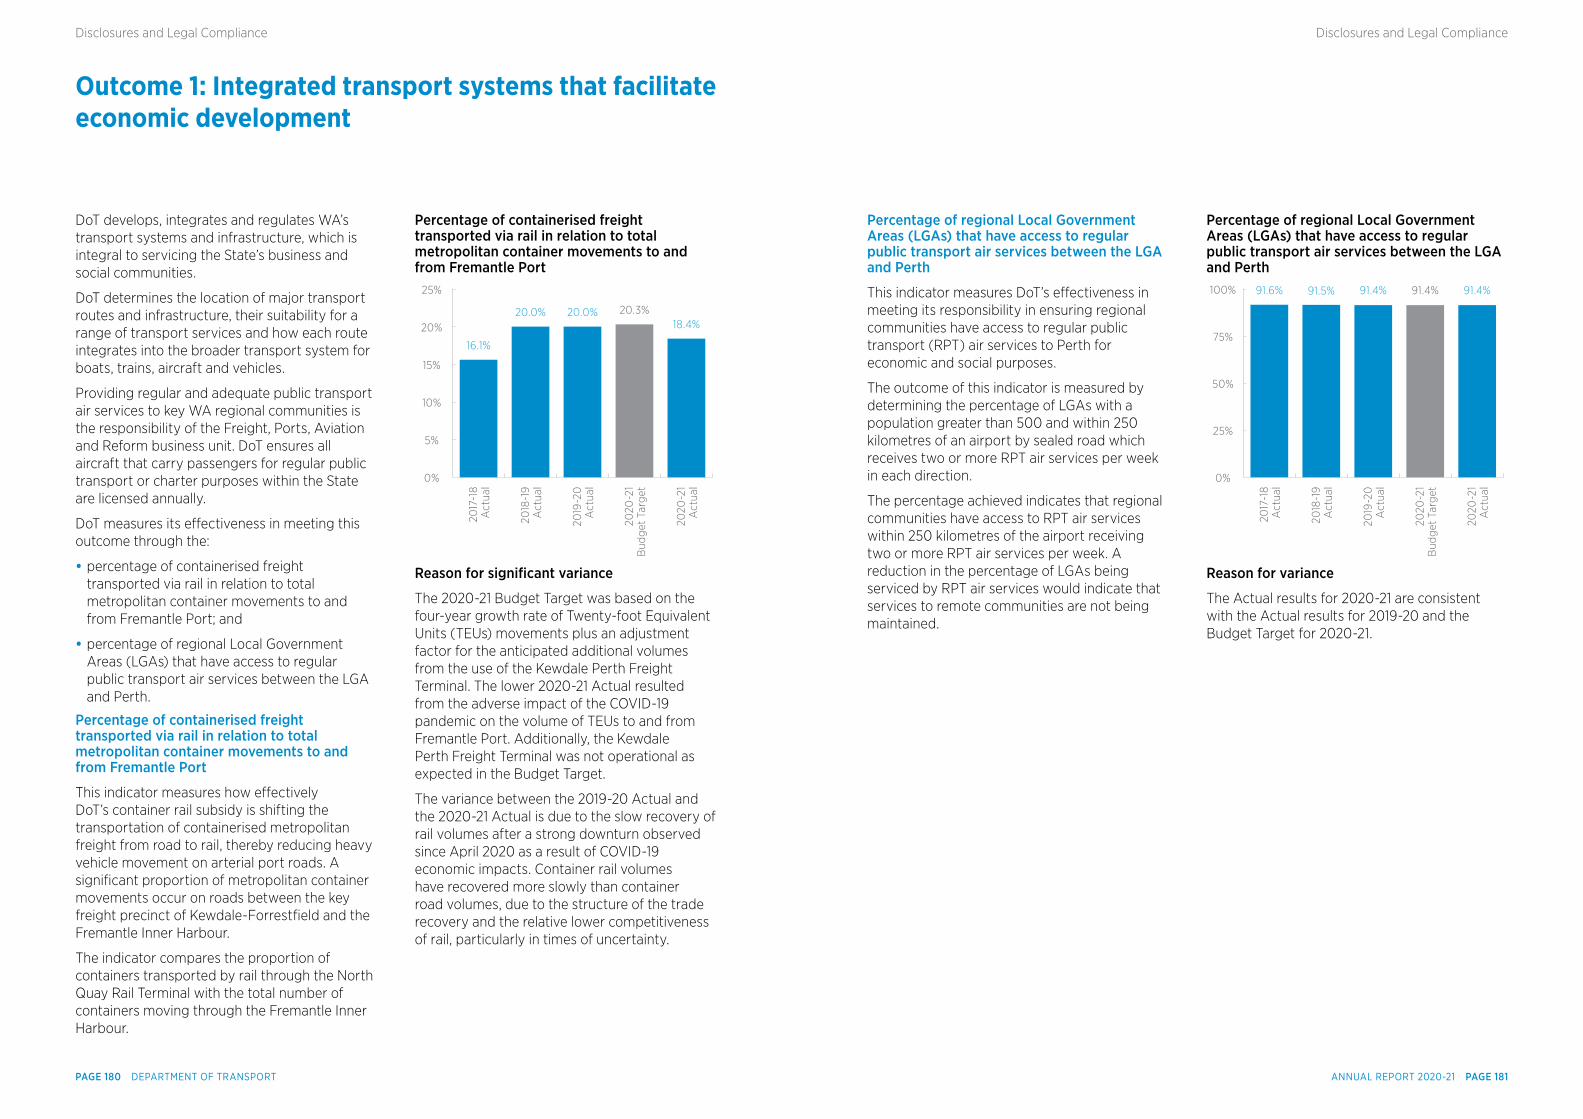
Outcome 1: Integrated transport systems that facilitate economic development
Percentage of regional Local Government Areas (LGAs) that have access to regular public transport air services between the LGA and Perth
This indicator measures DoT’s effectiveness in meeting its responsibility in ensuring regional communities have access to regular public transport (RPT) air services to Perth for economic and social purposes.
The outcome of this indicator is measured by determining the percentage of LGAs with a population greater than 500 and within 250 kilometres of an airport by sealed road which receives two or more RPT air services per week in each direction.
The percentage achieved indicates that regional communities have access to RPT air services within 250 kilometres of the airport receiving two or more RPT air services per week. A reduction in the percentage of LGAs being serviced by RPT air services would indicate that services to remote communities are not being maintained.
Percentage of regional Local Government Areas (LGAs) that have access to regular public transport air services between the LGA and Perth100%
0%
50%
75%
25%
2017
-18
Act
ual
2018
-19
Act
ual
2019
-20
A
ctua
l
2020
-21
Bud
get T
arge
t
2020
-21
Act
ual
91.6% 91.5% 91.4% 91.4% 91.4%
Reason for variance
The Actual results for 2020-21 are consistent with the Actual results for 2019-20 and the Budget Target for 2020-21.
DoT develops, integrates and regulates WA’s transport systems and infrastructure, which is integral to servicing the State’s business and social communities.
DoT determines the location of major transport routes and infrastructure, their suitability for a range of transport services and how each route integrates into the broader transport system for boats, trains, aircraft and vehicles.
Providing regular and adequate public transport air services to key WA regional communities is the responsibility of the Freight, Ports, Aviation and Reform business unit. DoT ensures all aircraft that carry passengers for regular public transport or charter purposes within the State are licensed annually.
DoT measures its effectiveness in meeting this outcome through the:
• percentage of containerised freight transported via rail in relation to total metropolitan container movements to and from Fremantle Port; and
• percentage of regional Local Government Areas (LGAs) that have access to regular public transport air services between the LGA and Perth.
Percentage of containerised freight transported via rail in relation to total metropolitan container movements to and from Fremantle Port
This indicator measures how effectively DoT’s container rail subsidy is shifting the transportation of containerised metropolitan freight from road to rail, thereby reducing heavy vehicle movement on arterial port roads. A significant proportion of metropolitan container movements occur on roads between the key freight precinct of Kewdale-Forrestfield and the Fremantle Inner Harbour.
The indicator compares the proportion of containers transported by rail through the North Quay Rail Terminal with the total number of containers moving through the Fremantle Inner Harbour.
Percentage of containerised freight transported via rail in relation to total metropolitan container movements to and from Fremantle Port
25%
0%
10%
15%
20%
5%
2017
-18
Act
ual
2018
-19
Act
ual
2019
-20
A
ctua
l
2020
-21
Bud
get T
arge
t
2020
-21
Act
ual
16.1%
20.0% 20.0% 20.3%18.4%
Reason for signifcant variance
The 2020-21 Budget Target was based on the four-year growth rate of Twenty-foot Equivalent Units (TEUs) movements plus an adjustment factor for the anticipated additional volumes from the use of the Kewdale Perth Freight Terminal. The lower 2020-21 Actual resulted from the adverse impact of the COVID-19 pandemic on the volume of TEUs to and from Fremantle Port. Additionally, the Kewdale Perth Freight Terminal was not operational as expected in the Budget Target.
The variance between the 2019-20 Actual and the 2020-21 Actual is due to the slow recovery of rail volumes after a strong downturn observed since April 2020 as a result of COVID-19 economic impacts. Container rail volumes have recovered more slowly than container road volumes, due to the structure of the trade recovery and the relative lower competitiveness of rail, particularly in times of uncertainty.
ANNUAL REPORT 2020-21 PAGE 181PAGE 180 DEPARTMENT OF TRANSPORT
Disclosures and Legal ComplianceDisclosures and Legal Compliance
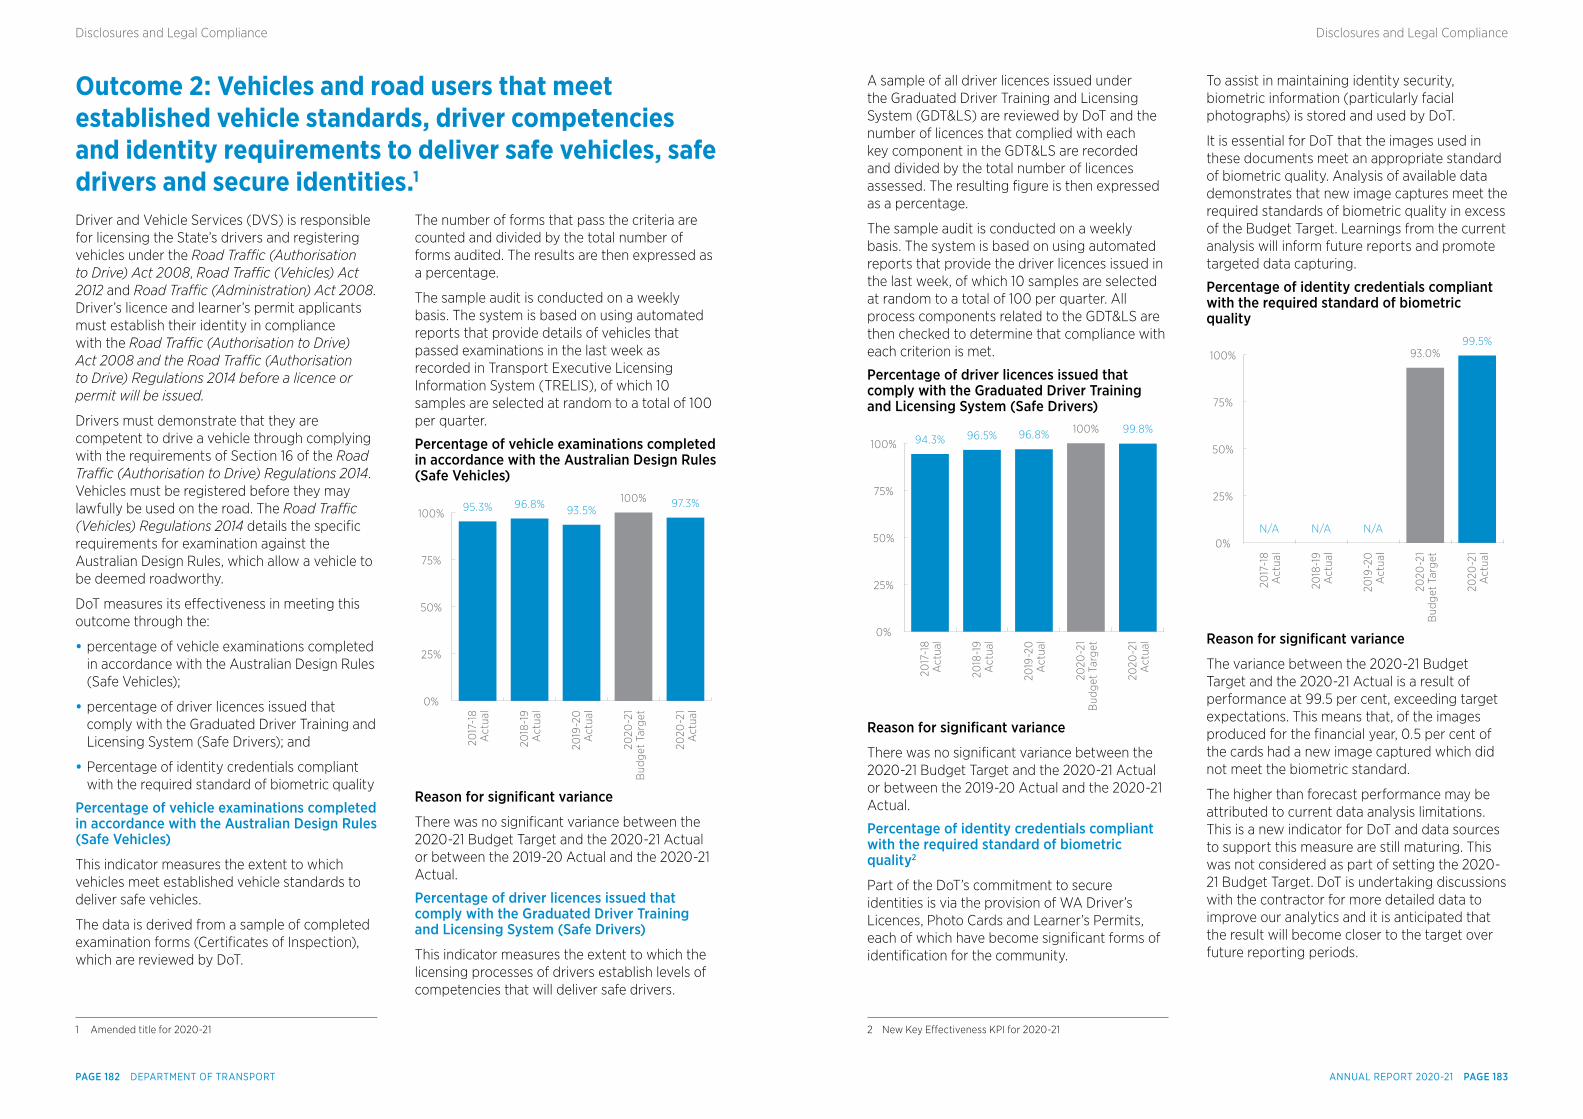
Outcome 2: Vehicles and road users that meet established vehicle standards, driver competencies and identity requirements to deliver safe vehicles, safe drivers and secure identities.1
1 Amended title for 2020-21
Driver and Vehicle Services (DVS) is responsible for licensing the State’s drivers and registering vehicles under the Road Traffic (Authorisation to Drive) Act 2008, Road Traffic (Vehicles) Act 2012 and Road Traffic (Administration) Act 2008. Driver’s licence and learner’s permit applicants must establish their identity in compliance with the Road Traffic (Authorisation to Drive) Act 2008 and the Road Traffic (Authorisation to Drive) Regulations 2014 before a licence or permit will be issued.
Drivers must demonstrate that they are competent to drive a vehicle through complying with the requirements of Section 16 of the Road Traffic (Authorisation to Drive) Regulations 2014. Vehicles must be registered before they may lawfully be used on the road. The Road Traffic (Vehicles) Regulations 2014 details the specific requirements for examination against the Australian Design Rules, which allow a vehicle to be deemed roadworthy.
DoT measures its effectiveness in meeting this outcome through the:
• percentage of vehicle examinations completed in accordance with the Australian Design Rules (Safe Vehicles);
• percentage of driver licences issued that comply with the Graduated Driver Training and Licensing System (Safe Drivers); and
• Percentage of identity credentials compliant with the required standard of biometric quality
Percentage of vehicle examinations completed in accordance with the Australian Design Rules (Safe Vehicles)
This indicator measures the extent to which vehicles meet established vehicle standards to deliver safe vehicles.
The data is derived from a sample of completed examination forms (Certificates of Inspection), which are reviewed by DoT.
The number of forms that pass the criteria are counted and divided by the total number of forms audited. The results are then expressed as a percentage.
The sample audit is conducted on a weekly basis. The system is based on using automated reports that provide details of vehicles that passed examinations in the last week as recorded in Transport Executive Licensing Information System (TRELIS), of which 10 samples are selected at random to a total of 100 per quarter.
Percentage of vehicle examinations completed in accordance with the Australian Design Rules (Safe Vehicles)
100%
0%
50%
75%
25%
2017
-18
Act
ual
2018
-19
Act
ual
2019
-20
A
ctua
l
2020
-21
Bud
get T
arge
t
2020
-21
Act
ual
95.3% 96.8% 93.5%100% 97.3%
Reason for signifcant variance
There was no significant variance between the 2020-21 Budget Target and the 2020-21 Actual or between the 2019-20 Actual and the 2020-21 Actual.
Percentage of driver licences issued that comply with the Graduated Driver Training and Licensing System (Safe Drivers)
This indicator measures the extent to which the licensing processes of drivers establish levels of competencies that will deliver safe drivers.
A sample of all driver licences issued under the Graduated Driver Training and Licensing System (GDT&LS) are reviewed by DoT and the number of licences that complied with each key component in the GDT&LS are recorded and divided by the total number of licences assessed. The resulting figure is then expressed as a percentage.
The sample audit is conducted on a weekly basis. The system is based on using automated reports that provide the driver licences issued in the last week, of which 10 samples are selected at random to a total of 100 per quarter. All process components related to the GDT&LS are then checked to determine that compliance with each criterion is met.
Percentage of driver licences issued that comply with the Graduated Driver Training and Licensing System (Safe Drivers)
100%
0%
50%
75%
25%
2017
-18
Act
ual
2018
-19
Act
ual
2019
-20
A
ctua
l
2020
-21
Bud
get T
arge
t
2020
-21
Act
ual
94.3% 96.5% 96.8% 100% 99.8%
Reason for signifcant variance
There was no significant variance between the 2020-21 Budget Target and the 2020-21 Actual or between the 2019-20 Actual and the 2020-21 Actual.
Percentage of identity credentials compliant with the required standard of biometric quality2
Part of the DoT’s commitment to secure identities is via the provision of WA Driver’s Licences, Photo Cards and Learner’s Permits, each of which have become significant forms of identification for the community.
2 New Key Effectiveness KPI for 2020-21
To assist in maintaining identity security, biometric information (particularly facial photographs) is stored and used by DoT.
It is essential for DoT that the images used in these documents meet an appropriate standard of biometric quality. Analysis of available data demonstrates that new image captures meet the required standards of biometric quality in excess of the Budget Target. Learnings from the current analysis will inform future reports and promote targeted data capturing.
Percentage of identity credentials compliant with the required standard of biometric quality
100%
0%
50%
75%
25%
2017
-18
Act
ual
2018
-19
Act
ual
2019
-20
A
ctua
l
2020
-21
Bud
get T
arge
t
2020
-21
Act
ual
N/A N/A N/A
93.0%99.5%
Reason for signifcant variance
The variance between the 2020-21 Budget Target and the 2020-21 Actual is a result of performance at 99.5 per cent, exceeding target expectations. This means that, of the images produced for the financial year, 0.5 per cent of the cards had a new image captured which did not meet the biometric standard.
The higher than forecast performance may be attributed to current data analysis limitations. This is a new indicator for DoT and data sources to support this measure are still maturing. This was not considered as part of setting the 2020-21 Budget Target. DoT is undertaking discussions with the contractor for more detailed data to improve our analytics and it is anticipated that the result will become closer to the target over future reporting periods.
ANNUAL REPORT 2020-21 PAGE 183PAGE 182 DEPARTMENT OF TRANSPORT
Disclosures and Legal ComplianceDisclosures and Legal Compliance
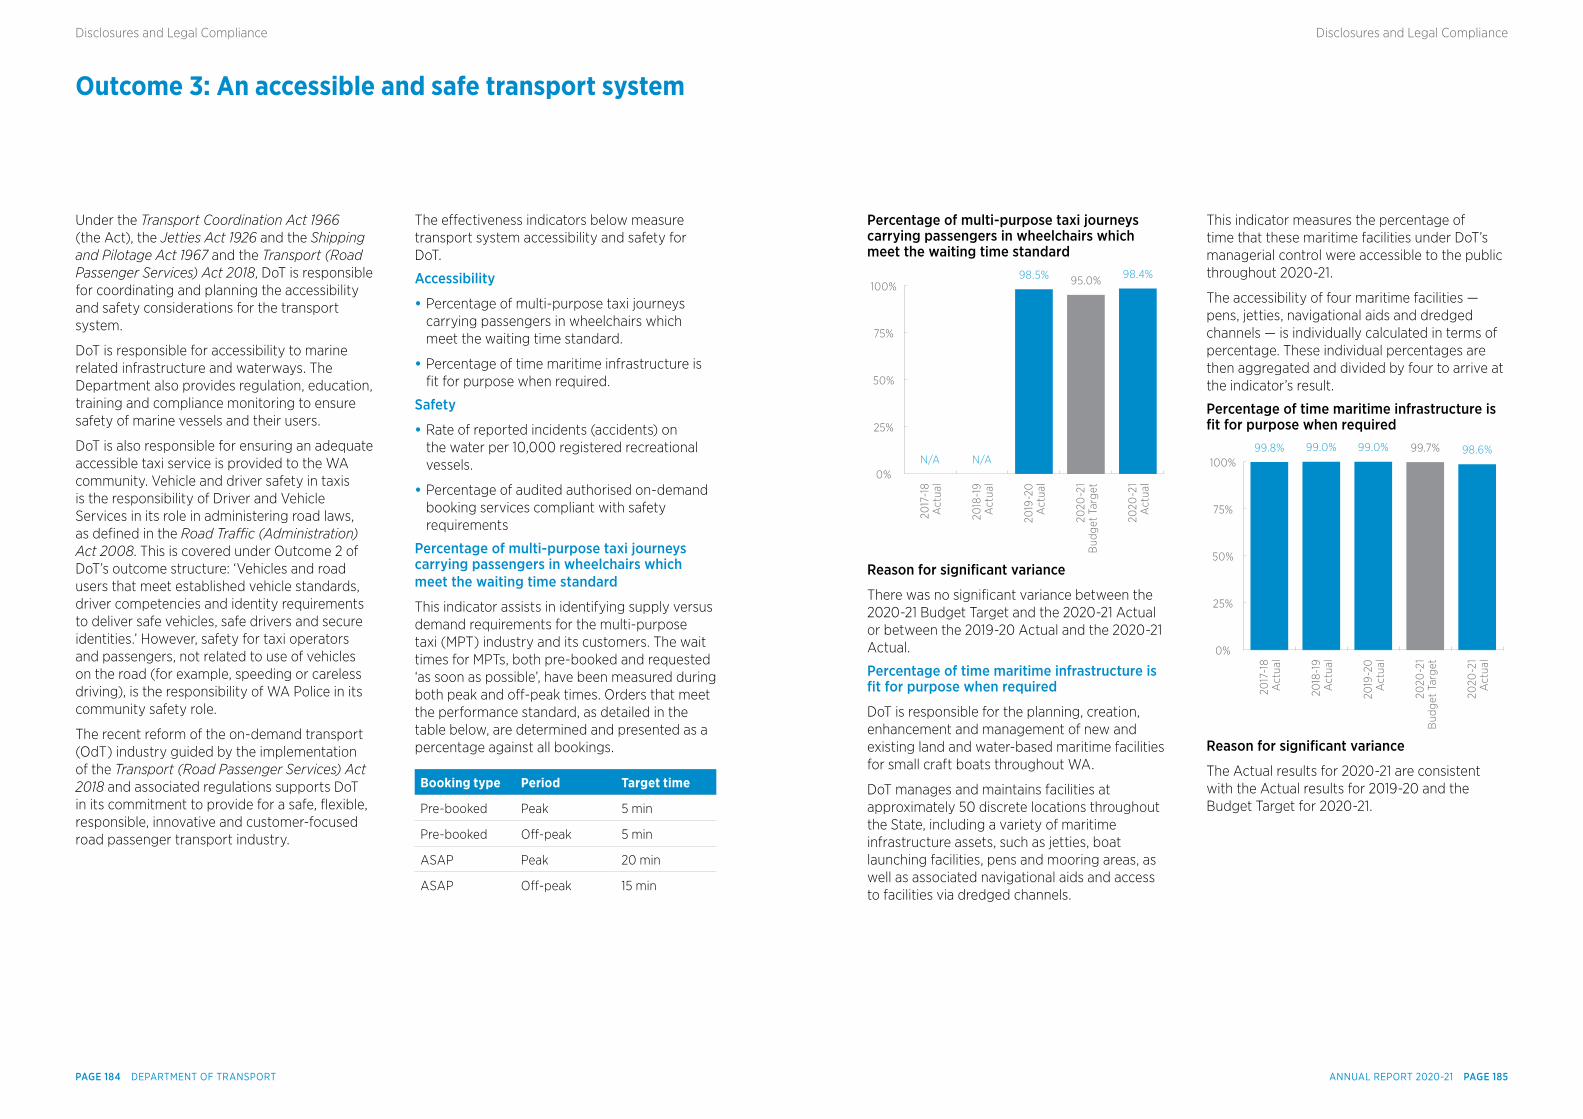
Outcome 3: An accessible and safe transport system
Percentage of multi-purpose taxi journeys carrying passengers in wheelchairs which meet the waiting time standard
100%
0%
50%
75%
25%
2017
-18
Act
ual
2018
-19
Act
ual
2019
-20
A
ctua
l
2020
-21
Bud
get T
arge
t
2020
-21
Act
ual
N/A N/A
98.5% 95.0% 98.4%
Reason for signifcant variance
There was no significant variance between the 2020-21 Budget Target and the 2020-21 Actual or between the 2019-20 Actual and the 2020-21 Actual.
Percentage of time maritime infrastructure is ft for purpose when required
DoT is responsible for the planning, creation, enhancement and management of new and existing land and water-based maritime facilities for small craft boats throughout WA.
DoT manages and maintains facilities at approximately 50 discrete locations throughout the State, including a variety of maritime infrastructure assets, such as jetties, boat launching facilities, pens and mooring areas, as well as associated navigational aids and access to facilities via dredged channels.
This indicator measures the percentage of time that these maritime facilities under DoT’s managerial control were accessible to the public throughout 2020-21.
The accessibility of four maritime facilities — pens, jetties, navigational aids and dredged channels — is individually calculated in terms of percentage. These individual percentages are then aggregated and divided by four to arrive at the indicator’s result.
Percentage of time maritime infrastructure is ft for purpose when required
100%
0%
50%
75%
25%
2017
-18
Act
ual
2018
-19
Act
ual
2019
-20
A
ctua
l
2020
-21
Bud
get T
arge
t
2020
-21
Act
ual
99.0%99.0%99.8% 99.7% 98.6%
Reason for signifcant variance
The Actual results for 2020-21 are consistent with the Actual results for 2019-20 and the Budget Target for 2020-21.
Under the Transport Coordination Act 1966 (the Act), the Jetties Act 1926 and the Shipping and Pilotage Act 1967 and the Transport (Road Passenger Services) Act 2018, DoT is responsible for coordinating and planning the accessibility and safety considerations for the transport system.
DoT is responsible for accessibility to marine related infrastructure and waterways. The Department also provides regulation, education, training and compliance monitoring to ensure safety of marine vessels and their users.
DoT is also responsible for ensuring an adequate accessible taxi service is provided to the WA community. Vehicle and driver safety in taxis is the responsibility of Driver and Vehicle Services in its role in administering road laws, as defined in the Road Traffic (Administration) Act 2008. This is covered under Outcome 2 of DoT’s outcome structure: ‘Vehicles and road users that meet established vehicle standards, driver competencies and identity requirements to deliver safe vehicles, safe drivers and secure identities.’ However, safety for taxi operators and passengers, not related to use of vehicles on the road (for example, speeding or careless driving), is the responsibility of WA Police in its community safety role.
The recent reform of the on-demand transport (OdT) industry guided by the implementation of the Transport (Road Passenger Services) Act 2018 and associated regulations supports DoT in its commitment to provide for a safe, flexible, responsible, innovative and customer-focused road passenger transport industry.
The effectiveness indicators below measure transport system accessibility and safety for DoT.
Accessibility
• Percentage of multi-purpose taxi journeys carrying passengers in wheelchairs which meet the waiting time standard.
• Percentage of time maritime infrastructure is fit for purpose when required.
Safety
• Rate of reported incidents (accidents) on the water per 10,000 registered recreational vessels.
• Percentage of audited authorised on-demand booking services compliant with safety requirements
Percentage of multi-purpose taxi journeys carrying passengers in wheelchairs which meet the waiting time standard
This indicator assists in identifying supply versus demand requirements for the multi-purpose taxi (MPT) industry and its customers. The wait times for MPTs, both pre-booked and requested ‘as soon as possible’, have been measured during both peak and off-peak times. Orders that meet the performance standard, as detailed in the table below, are determined and presented as a percentage against all bookings.
Booking type Period Target time
Pre-booked Peak 5 min
Pre-booked Off-peak 5 min
ASAP Peak 20 min
ASAP Off-peak 15 min
ANNUAL REPORT 2020-21 PAGE 185PAGE 184 DEPARTMENT OF TRANSPORT
Disclosures and Legal ComplianceDisclosures and Legal Compliance
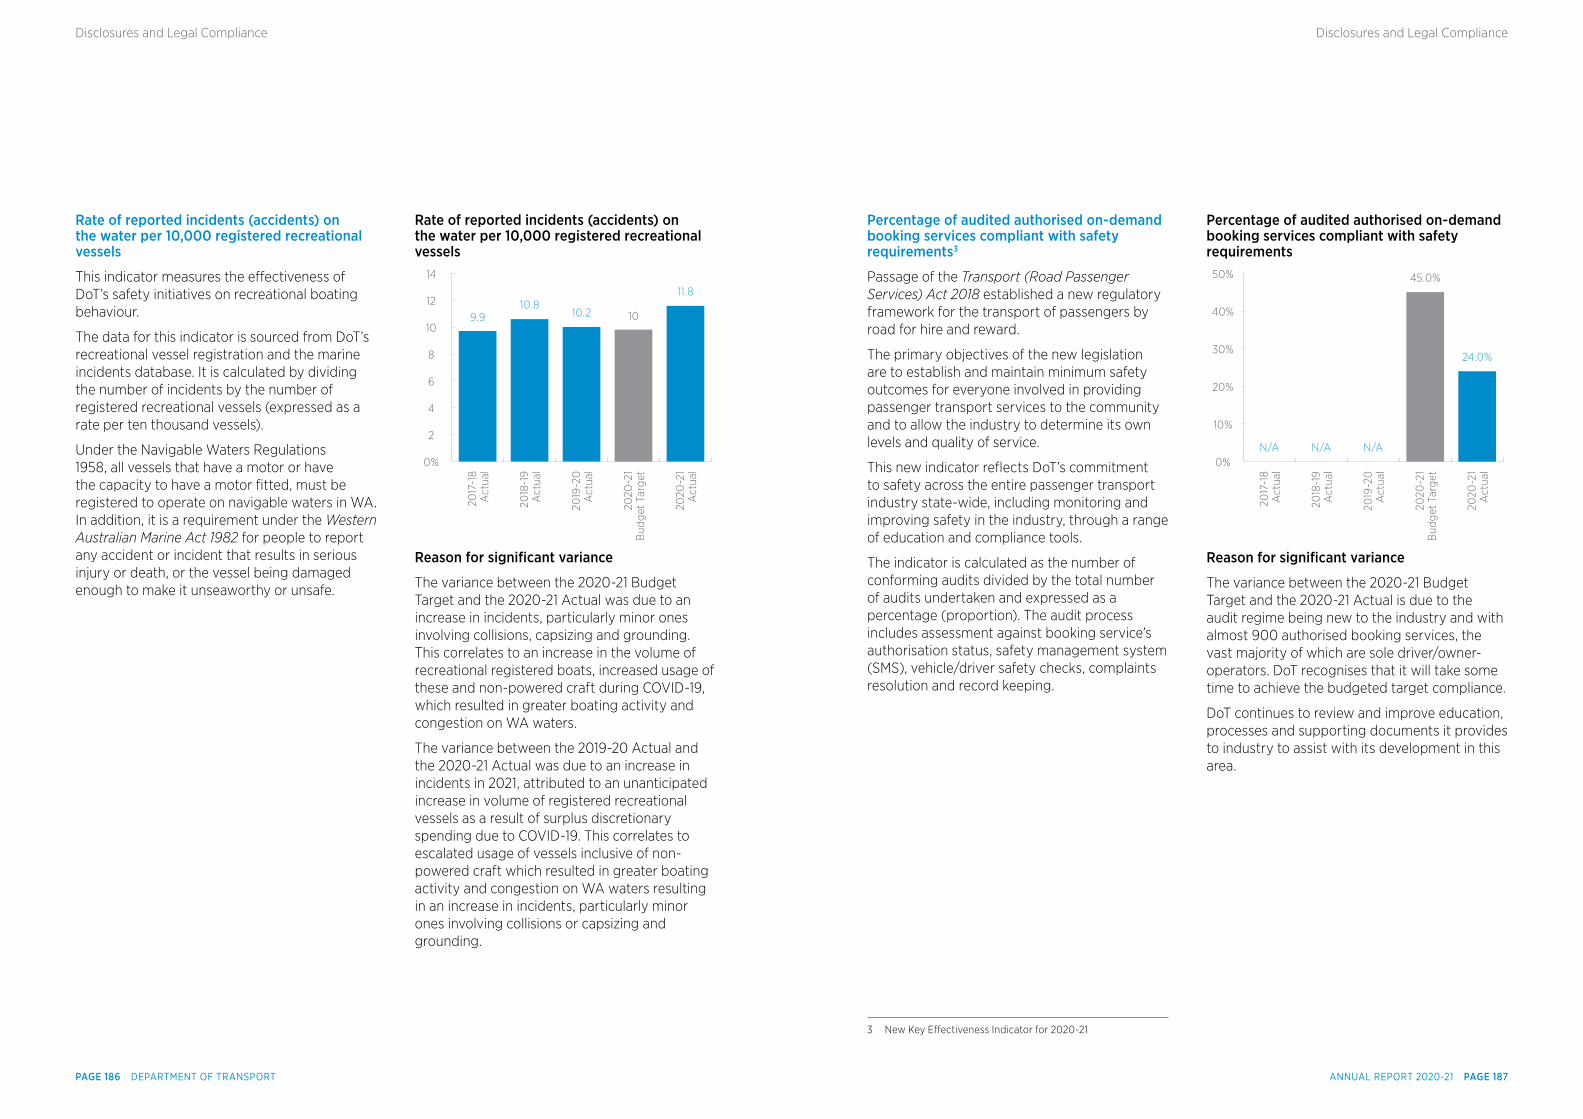
Rate of reported incidents (accidents) on the water per 10,000 registered recreational vessels
This indicator measures the effectiveness of DoT’s safety initiatives on recreational boating behaviour.
The data for this indicator is sourced from DoT’s recreational vessel registration and the marine incidents database. It is calculated by dividing the number of incidents by the number of registered recreational vessels (expressed as a rate per ten thousand vessels).
Under the Navigable Waters Regulations 1958, all vessels that have a motor or have the capacity to have a motor fitted, must be registered to operate on navigable waters in WA. In addition, it is a requirement under the Western Australian Marine Act 1982 for people to report any accident or incident that results in serious injury or death, or the vessel being damaged enough to make it unseaworthy or unsafe.
Rate of reported incidents (accidents) on the water per 10,000 registered recreational vessels
14
0%
6
8
10
12
2
4
2017
-18
Act
ual
2018
-19
Act
ual
2019
-20
A
ctua
l
2020
-21
Bud
get T
arge
t
2020
-21
Act
ual
10.210.8
9.9 10
11.8
Reason for signifcant variance
The variance between the 2020-21 Budget Target and the 2020-21 Actual was due to an increase in incidents, particularly minor ones involving collisions, capsizing and grounding. This correlates to an increase in the volume of recreational registered boats, increased usage of these and non-powered craft during COVID-19, which resulted in greater boating activity and congestion on WA waters.
The variance between the 2019-20 Actual and the 2020-21 Actual was due to an increase in incidents in 2021, attributed to an unanticipated increase in volume of registered recreational vessels as a result of surplus discretionary spending due to COVID-19. This correlates to escalated usage of vessels inclusive of non-powered craft which resulted in greater boating activity and congestion on WA waters resulting in an increase in incidents, particularly minor ones involving collisions or capsizing and grounding.
Percentage of audited authorised on-demand booking services compliant with safety requirements3
Passage of the Transport (Road Passenger Services) Act 2018 established a new regulatory framework for the transport of passengers by road for hire and reward.
The primary objectives of the new legislation are to establish and maintain minimum safety outcomes for everyone involved in providing passenger transport services to the community and to allow the industry to determine its own levels and quality of service.
This new indicator reflects DoT’s commitment to safety across the entire passenger transport industry state-wide, including monitoring and improving safety in the industry, through a range of education and compliance tools.
The indicator is calculated as the number of conforming audits divided by the total number of audits undertaken and expressed as a percentage (proportion). The audit process includes assessment against booking service’s authorisation status, safety management system (SMS), vehicle/driver safety checks, complaints resolution and record keeping.
3 New Key Effectiveness Indicator for 2020-21
Percentage of audited authorised on-demand booking services compliant with safety requirements
0%
50%
10%
20%
30%
40%
2017
-18
Act
ual
2018
-19
Act
ual
2019
-20
A
ctua
l
2020
-21
Bud
get T
arge
t
2020
-21
Act
ual
N/A N/A N/A
45.0%
24.0%
Reason for signifcant variance
The variance between the 2020-21 Budget Target and the 2020-21 Actual is due to the audit regime being new to the industry and with almost 900 authorised booking services, the vast majority of which are sole driver/owner-operators. DoT recognises that it will take some time to achieve the budgeted target compliance.
DoT continues to review and improve education, processes and supporting documents it provides to industry to assist with its development in this area.
ANNUAL REPORT 2020-21 PAGE 187PAGE 186 DEPARTMENT OF TRANSPORT
Disclosures and Legal ComplianceDisclosures and Legal Compliance
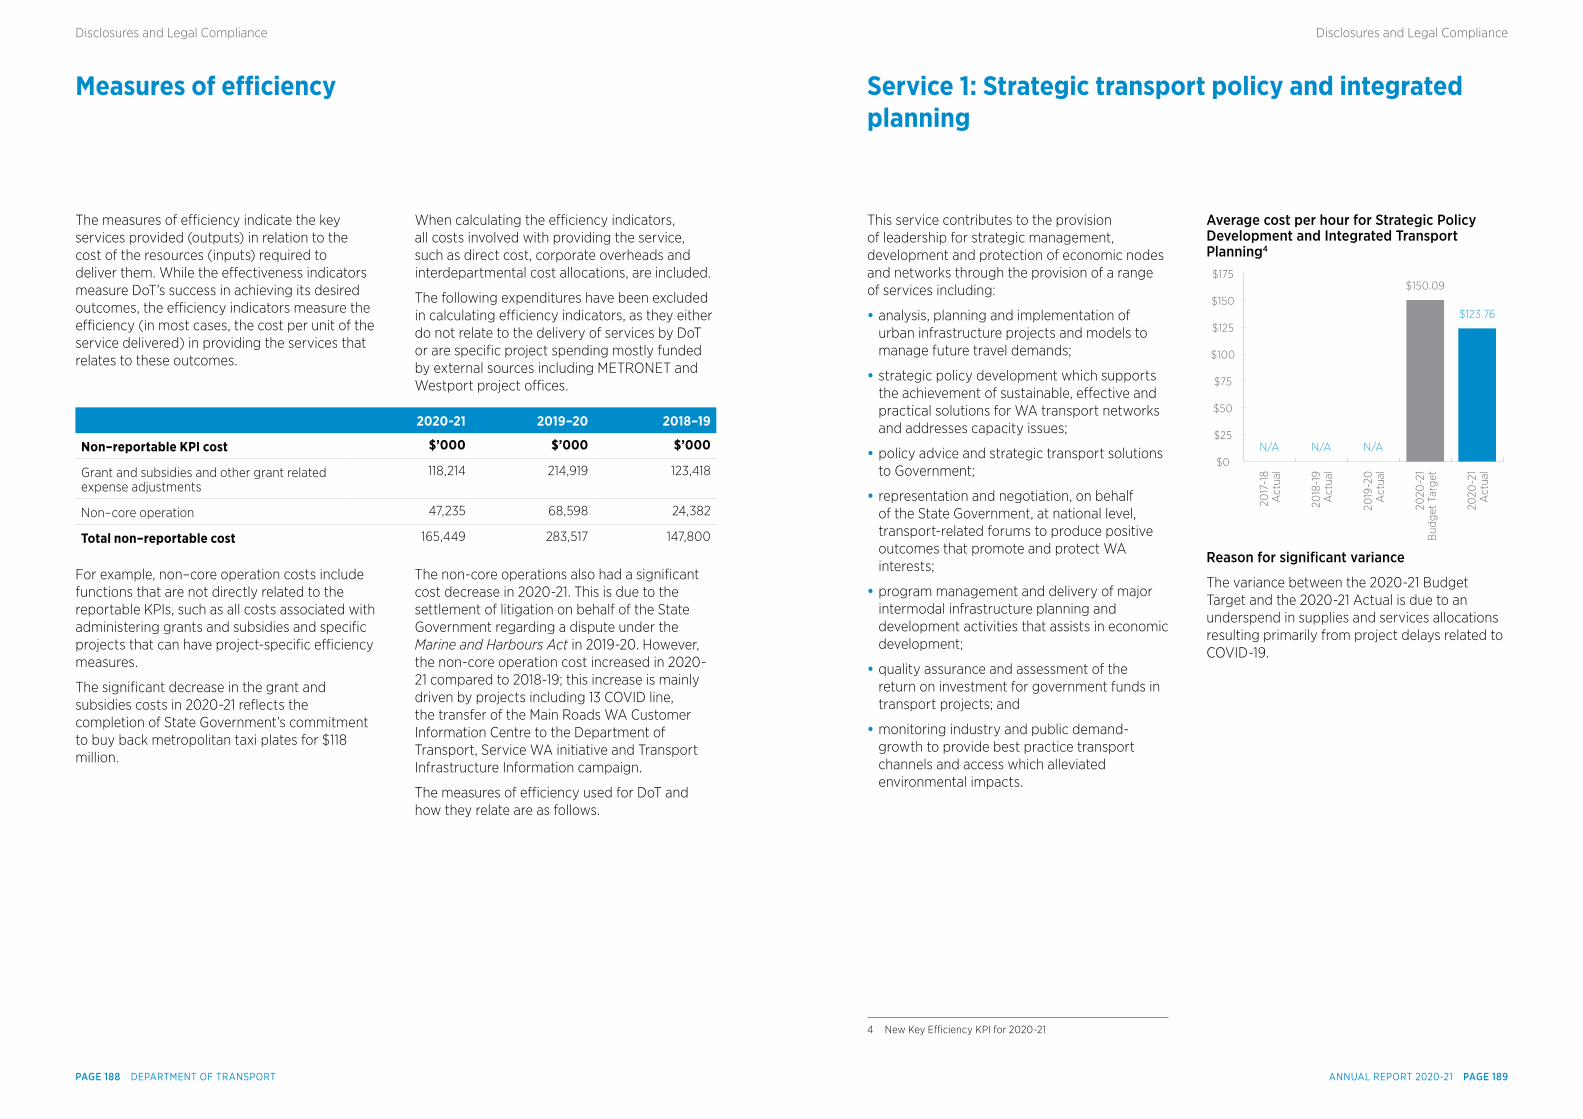
Measures of efficiency Service 1: Strategic transport policy and integrated planning
The measures of efficiency indicate the key services provided (outputs) in relation to the cost of the resources (inputs) required to deliver them. While the effectiveness indicators measure DoT’s success in achieving its desired outcomes, the efficiency indicators measure the efficiency (in most cases, the cost per unit of the service delivered) in providing the services that relates to these outcomes.
When calculating the efficiency indicators, all costs involved with providing the service, such as direct cost, corporate overheads and interdepartmental cost allocations, are included.
The following expenditures have been excluded in calculating efficiency indicators, as they either do not relate to the delivery of services by DoT or are specific project spending mostly funded by external sources including METRONET and Westport project offices.
2020-21 2019–20 2018–19
Non–reportable KPI cost $’000 $’000 $’000
Grant and subsidies and other grant related expense adjustments
118,214 214,919 123,418
Non–core operation 47,235 68,598 24,382
Total non–reportable cost 165,449 283,517 147,800
For example, non–core operation costs include functions that are not directly related to the reportable KPIs, such as all costs associated with administering grants and subsidies and specific projects that can have project-specific efficiency measures.
The significant decrease in the grant and subsidies costs in 2020-21 reflects the completion of State Government’s commitment to buy back metropolitan taxi plates for $118 million.
The non-core operations also had a significant cost decrease in 2020-21. This is due to the settlement of litigation on behalf of the State Government regarding a dispute under the Marine and Harbours Act in 2019-20. However, the non-core operation cost increased in 2020-21 compared to 2018-19; this increase is mainly driven by projects including 13 COVID line, the transfer of the Main Roads WA Customer Information Centre to the Department of Transport, Service WA initiative and Transport Infrastructure Information campaign.
The measures of efficiency used for DoT and how they relate are as follows.
This service contributes to the provision of leadership for strategic management, development and protection of economic nodes and networks through the provision of a range of services including:
• analysis, planning and implementation of urban infrastructure projects and models to manage future travel demands;
• strategic policy development which supports the achievement of sustainable, effective and practical solutions for WA transport networks and addresses capacity issues;
• policy advice and strategic transport solutions to Government;
• representation and negotiation, on behalf of the State Government, at national level, transport-related forums to produce positive outcomes that promote and protect WA interests;
• program management and delivery of major intermodal infrastructure planning and development activities that assists in economic development;
• quality assurance and assessment of the return on investment for government funds in transport projects; and
• monitoring industry and public demand-growth to provide best practice transport channels and access which alleviated environmental impacts.
4 New Key Efficiency KPI for 2020-21
Average cost per hour for Strategic Policy Development and Integrated Transport Planning4
$175
$0
$25
$50
$75
$100
$125
$150
2017
-18
Act
ual
2018
-19
Act
ual
2019
-20
A
ctua
l
2020
-21
Bud
get T
arge
t
2020
-21
Act
ual
N/AN/AN/A
$150.09
$123.76
Reason for signifcant variance
The variance between the 2020-21 Budget Target and the 2020-21 Actual is due to an underspend in supplies and services allocations resulting primarily from project delays related to COVID-19.
ANNUAL REPORT 2020-21 PAGE 189PAGE 188 DEPARTMENT OF TRANSPORT
Disclosures and Legal ComplianceDisclosures and Legal Compliance
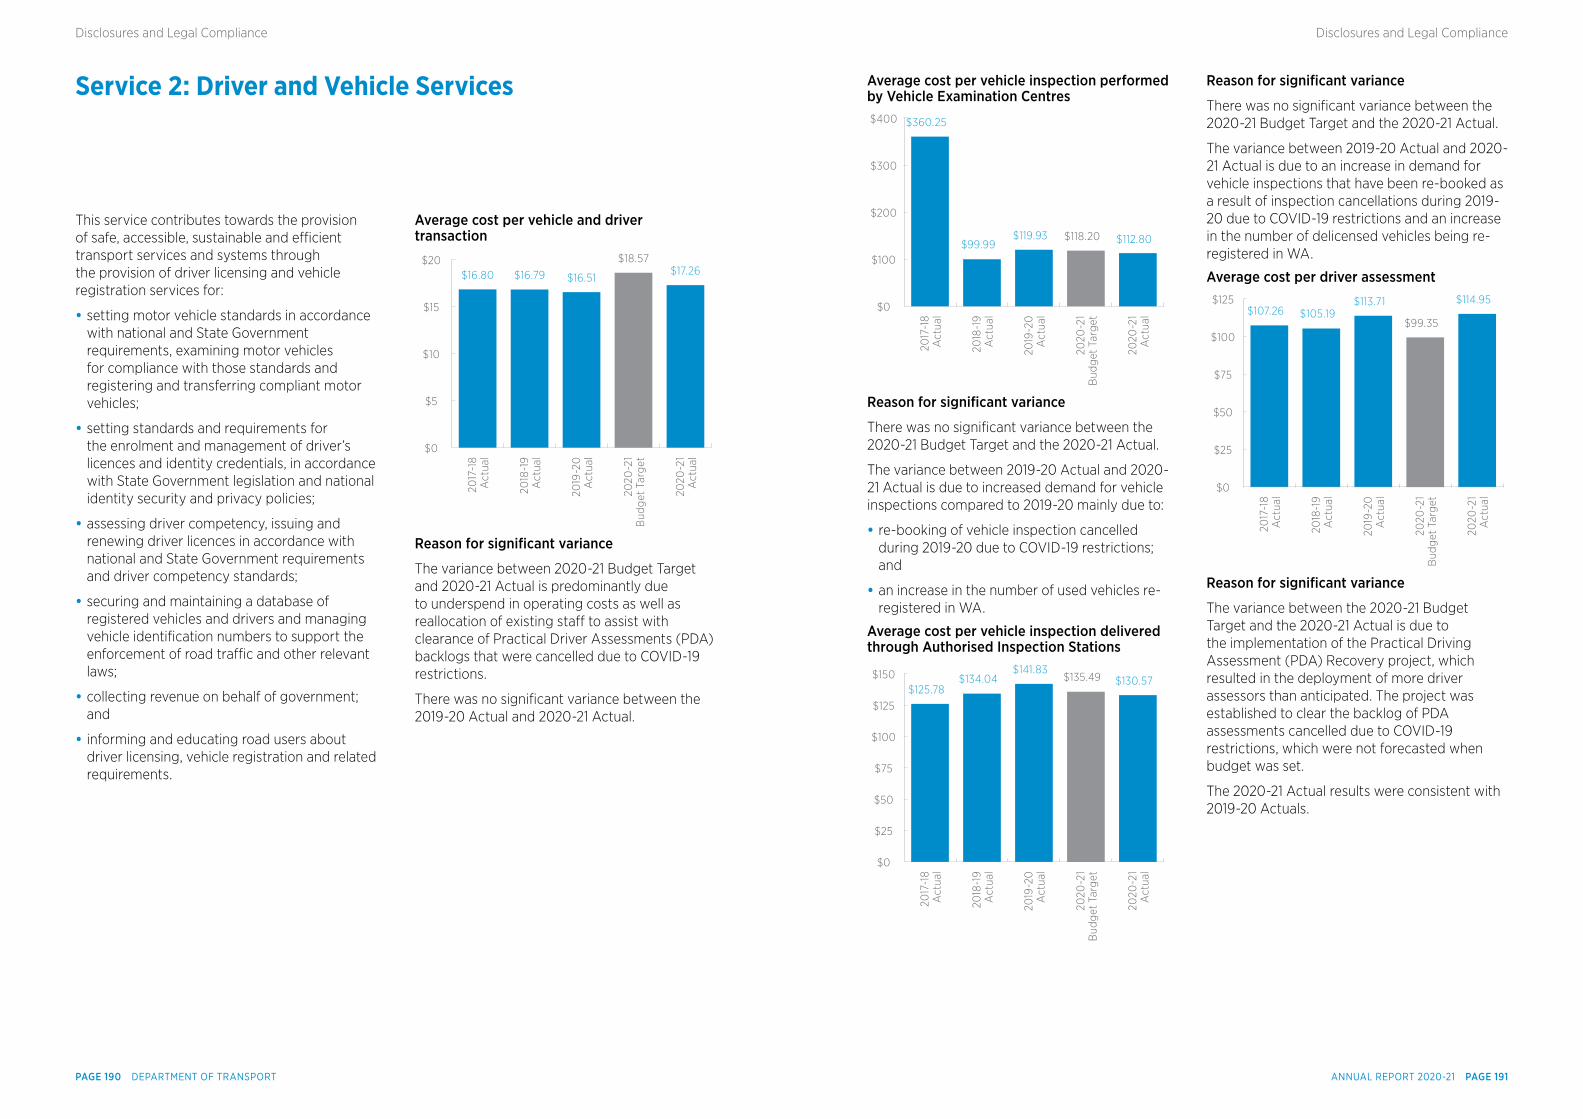
Service 2: Driver and Vehicle Services
This service contributes towards the provision of safe, accessible, sustainable and efficient transport services and systems through the provision of driver licensing and vehicle registration services for:
• setting motor vehicle standards in accordance with national and State Government requirements, examining motor vehicles for compliance with those standards and registering and transferring compliant motor vehicles;
• setting standards and requirements for the enrolment and management of driver’s licences and identity credentials, in accordance with State Government legislation and national identity security and privacy policies;
• assessing driver competency, issuing and renewing driver licences in accordance with national and State Government requirements and driver competency standards;
• securing and maintaining a database of registered vehicles and drivers and managing vehicle identification numbers to support the enforcement of road traffic and other relevant laws;
• collecting revenue on behalf of government; and
• informing and educating road users about driver licensing, vehicle registration and related requirements.
Average cost per vehicle and driver transaction
$20
$0
$10
$15
$5
2017
-18
Act
ual
2018
-19
Act
ual
2019
-20
A
ctua
l
2020
-21
Bud
get T
arge
t
2020
-21
Act
ual
$16.51$16.79$16.80
$18.57$17.26
Reason for signifcant variance
The variance between 2020-21 Budget Target and 2020-21 Actual is predominantly due to underspend in operating costs as well as reallocation of existing staff to assist with clearance of Practical Driver Assessments (PDA) backlogs that were cancelled due to COVID-19 restrictions.
There was no significant variance between the 2019-20 Actual and 2020-21 Actual.
Average cost per vehicle inspection performed by Vehicle Examination Centres$400
$0
$200
$300
$100
2017
-18
Act
ual
2018
-19
Act
ual
2019
-20
A
ctua
l
2020
-21
Bud
get T
arge
t
2020
-21
Act
ual
$119.93$99.99
$360.25
$118.20 $112.80
Reason for signifcant variance
There was no significant variance between the 2020-21 Budget Target and the 2020-21 Actual.
The variance between 2019-20 Actual and 2020-21 Actual is due to increased demand for vehicle inspections compared to 2019-20 mainly due to:
• re-booking of vehicle inspection cancelled during 2019-20 due to COVID-19 restrictions; and
• an increase in the number of used vehicles re-registered in WA.
Average cost per vehicle inspection delivered through Authorised Inspection Stations
$150
$0
$50
$25
$100
$125
$75
2017
-18
Act
ual
2018
-19
Act
ual
2019
-20
A
ctua
l
2020
-21
Bud
get T
arge
t
2020
-21
Act
ual
$141.83$134.04
$125.78$135.49 $130.57
Reason for signifcant variance
There was no significant variance between the 2020-21 Budget Target and the 2020-21 Actual.
The variance between 2019-20 Actual and 2020-21 Actual is due to an increase in demand for vehicle inspections that have been re-booked as a result of inspection cancellations during 2019-20 due to COVID-19 restrictions and an increase in the number of delicensed vehicles being re-registered in WA.
Average cost per driver assessment$125
$0
$25
$50
$75
$100
2017
-18
Act
ual
2018
-19
Act
ual
2019
-20
A
ctua
l
2020
-21
Bud
get T
arge
t
2020
-21
Act
ual
$113.71$105.19$107.26
$99.35
$114.95
Reason for signifcant variance
The variance between the 2020-21 Budget Target and the 2020-21 Actual is due to the implementation of the Practical Driving Assessment (PDA) Recovery project, which resulted in the deployment of more driver assessors than anticipated. The project was established to clear the backlog of PDA assessments cancelled due to COVID-19 restrictions, which were not forecasted when budget was set.
The 2020-21 Actual results were consistent with 2019-20 Actuals.
ANNUAL REPORT 2020-21 PAGE 191PAGE 190 DEPARTMENT OF TRANSPORT
Disclosures and Legal ComplianceDisclosures and Legal Compliance
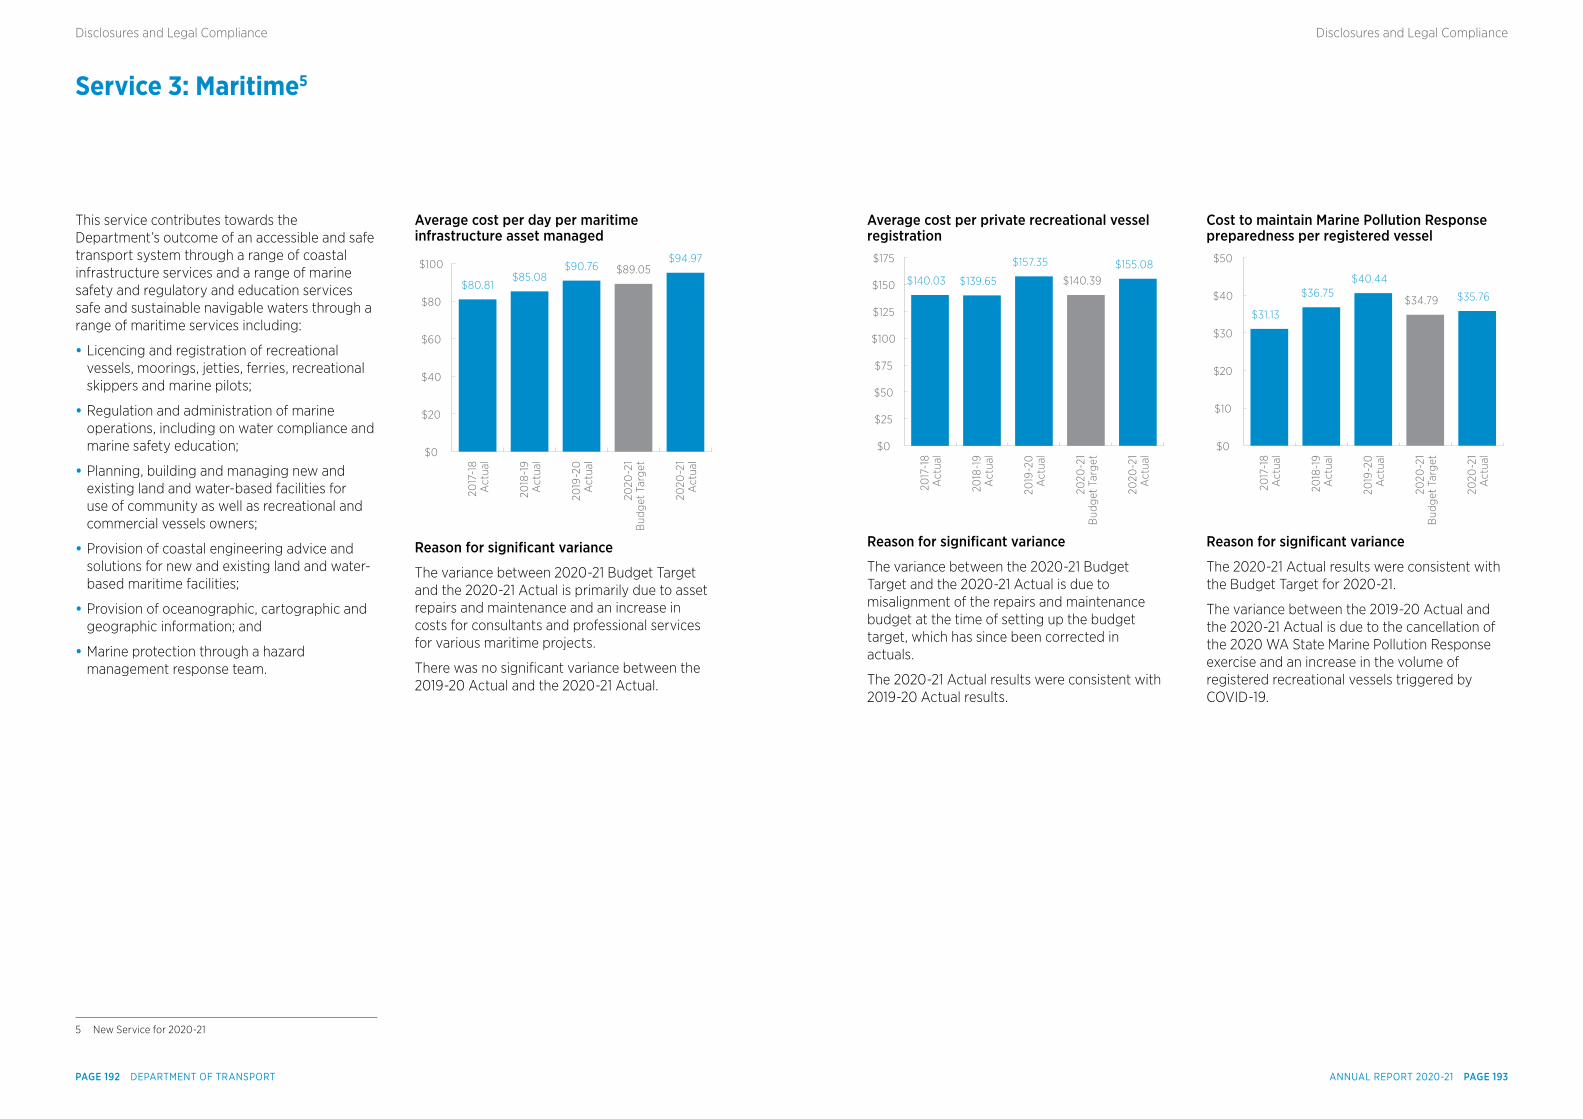
Service 3: Maritime5
5 New Service for 2020-21
This service contributes towards the Department’s outcome of an accessible and safe transport system through a range of coastal infrastructure services and a range of marine safety and regulatory and education services safe and sustainable navigable waters through a range of maritime services including:
• Licencing and registration of recreational vessels, moorings, jetties, ferries, recreational skippers and marine pilots;
• Regulation and administration of marine operations, including on water compliance and marine safety education;
• Planning, building and managing new and existing land and water-based facilities for use of community as well as recreational and commercial vessels owners;
• Provision of coastal engineering advice and solutions for new and existing land and water-based maritime facilities;
• Provision of oceanographic, cartographic and geographic information; and
• Marine protection through a hazard management response team.
Average cost per day per maritime infrastructure asset managed
$100
$0
$20
$40
$60
$80
2017
-18
Act
ual
2018
-19
Act
ual
2019
-20
A
ctua
l
2020
-21
Bud
get T
arge
t
2020
-21
Act
ual
$90.76$85.08
$80.81$89.05
$94.97
Reason for signifcant variance
The variance between 2020-21 Budget Target and the 2020-21 Actual is primarily due to asset repairs and maintenance and an increase in costs for consultants and professional services for various maritime projects.
There was no significant variance between the 2019-20 Actual and the 2020-21 Actual.
Average cost per private recreational vessel registration
$175
$0
$25
$50
$75
$100
$125
$150
2017
-18
Act
ual
2018
-19
Act
ual
2019
-20
A
ctua
l
2020
-21
Bud
get T
arge
t
2020
-21
Act
ual
$157.35
$139.65$140.03 $140.39$155.08
Reason for signifcant variance
The variance between the 2020-21 Budget Target and the 2020-21 Actual is due to misalignment of the repairs and maintenance budget at the time of setting up the budget target, which has since been corrected in actuals.
The 2020-21 Actual results were consistent with 2019-20 Actual results.
Cost to maintain Marine Pollution Response preparedness per registered vessel
$50
$0
$10
$20
$30
$40
2017
-18
Act
ual
2018
-19
Act
ual
2019
-20
A
ctua
l
2020
-21
Bud
get T
arge
t
2020
-21
Act
ual
$40.44$36.75
$31.13$34.79 $35.76
Reason for signifcant variance
The 2020-21 Actual results were consistent with the Budget Target for 2020-21.
The variance between the 2019-20 Actual and the 2020-21 Actual is due to the cancellation of the 2020 WA State Marine Pollution Response exercise and an increase in the volume of registered recreational vessels triggered by COVID-19.
ANNUAL REPORT 2020-21 PAGE 193PAGE 192 DEPARTMENT OF TRANSPORT
Disclosures and Legal ComplianceDisclosures and Legal Compliance
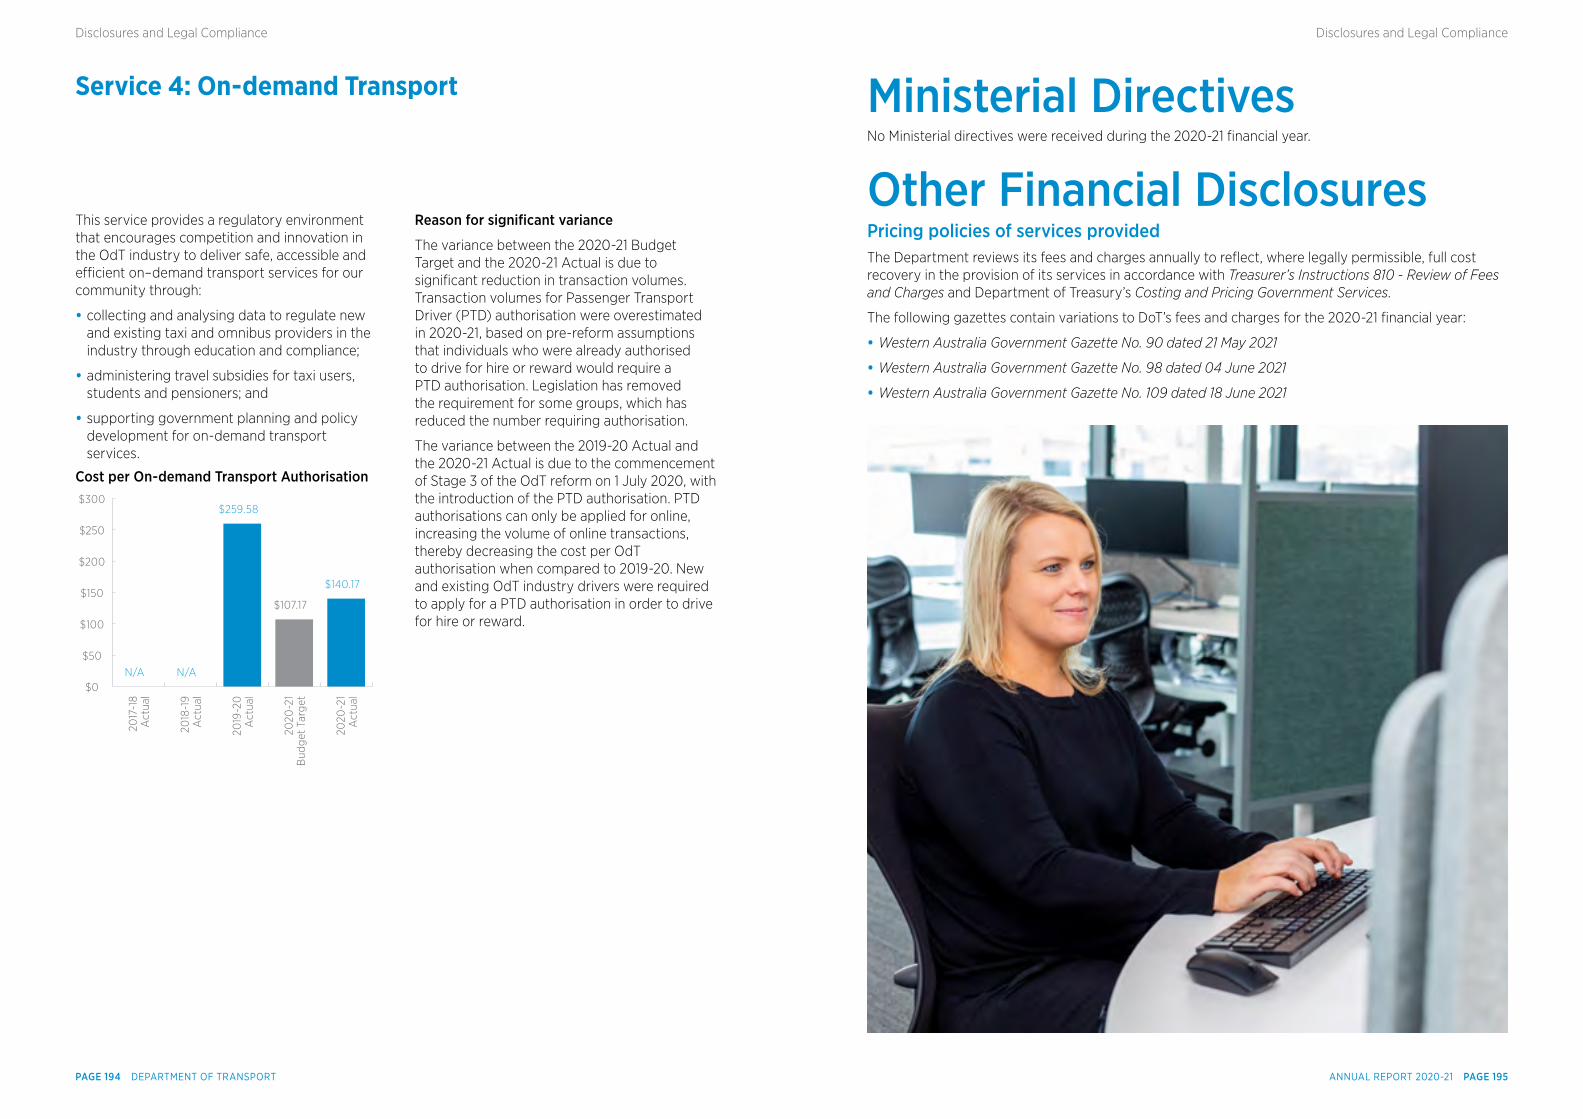
Service 4: On-demand Transport Ministerial DirectivesNo Ministerial directives were received during the 2020-21 financial year.
Other Financial DisclosuresPricing policies of services providedThe Department reviews its fees and charges annually to reflect, where legally permissible, full cost recovery in the provision of its services in accordance with Treasurer’s Instructions 810 - Review of Fees and Charges and Department of Treasury’s Costing and Pricing Government Services.
The following gazettes contain variations to DoT’s fees and charges for the 2020-21 financial year:
• Western Australia Government Gazette No. 90 dated 21 May 2021
• Western Australia Government Gazette No. 98 dated 04 June 2021
• Western Australia Government Gazette No. 109 dated 18 June 2021
This service provides a regulatory environment that encourages competition and innovation in the OdT industry to deliver safe, accessible and efficient on–demand transport services for our community through:
• collecting and analysing data to regulate new and existing taxi and omnibus providers in the industry through education and compliance;
• administering travel subsidies for taxi users, students and pensioners; and
• supporting government planning and policy development for on-demand transport services.
Cost per On-demand Transport Authorisation$300
$0
$50
$100
$150
$200
$250
2017
-18
Act
ual
2018
-19
Act
ual
2019
-20
A
ctua
l
2020
-21
Bud
get T
arge
t
2020
-21
Act
ual
$259.58
N/AN/A
$107.17
$140.17
Reason for signifcant variance
The variance between the 2020-21 Budget Target and the 2020-21 Actual is due to significant reduction in transaction volumes. Transaction volumes for Passenger Transport Driver (PTD) authorisation were overestimated in 2020-21, based on pre-reform assumptions that individuals who were already authorised to drive for hire or reward would require a PTD authorisation. Legislation has removed the requirement for some groups, which has reduced the number requiring authorisation.
The variance between the 2019-20 Actual and the 2020-21 Actual is due to the commencement of Stage 3 of the OdT reform on 1 July 2020, with the introduction of the PTD authorisation. PTD authorisations can only be applied for online, increasing the volume of online transactions, thereby decreasing the cost per OdT authorisation when compared to 2019-20. New and existing OdT industry drivers were required to apply for a PTD authorisation in order to drive for hire or reward.
ANNUAL REPORT 2020-21 PAGE 195PAGE 194 DEPARTMENT OF TRANSPORT
Disclosures and Legal ComplianceDisclosures and Legal Compliance
Major capital projectsDoT’s major capital projects, those valued at $5 million, for 2020-21 are detailed in the table below.
Incomplete capital projects
Project Name
Expected Year of
Completion
Capital Expenditure
up to 30/06/2021
$’000
Estimated Capital Cost to Complete
$’000
Estimated Total Capital
Cost of Project
$’000
Two Rocks Marina - Redevelopment (Stage 1 - Phase 1)
2021-22 8,730 3,273 12,003
Fremantle FBH - Amenities Building & Services Upgrade
2023-24 123 5,197 5,320
Onslow Community Precinct Boating Upgrade
2021-22 304 8,501 8,805
Redevelopment of Woodman Point Jetty 2023-24 181 9,509 9,690
Hillarys Boat Harbour - Jetties A, F, G, H, and J
2022-23 7 9,457 9,464
Fremantle Fishing Boat Harbour and Commercial Precinct - Replacement of Electrical Infrastructure
2023-24 30 5,870 5,900
Broome Boating Facility 2024-25 0 36,306 36,306
Completed capital projects
Project Name Year of Completion
Estimated Total Capital Cost of
Project Reported in 2020-21
$’000
Total Capital Cost of Project as at
30/06/2021$’000
Explanation for Significant
Variances
OdT Reform Business System
2020-21 14,300 14,227 No Significant Variance
Transforming Bunbury's Waterfront - Stage 2 (Jetty Road)
2020-21 12,650 12,517 No Significant Variance
Employment statisticsDoT’s staff headcount and full-time equivalent (FTE) statistics at 30 June 2021 are detailed in the table below.
Status Headcount FTE
Permanent Full Time 1,083 1,083
Permanent Part Time 226 154
Senior Executive Service 13 13
Temporary Full Time 235 235
Temporary Part Time 34 21
DoT Staf 1,591 1,506
Freedom of informationThe Department’s Freedom of Information (FOI) Coordinator is the initial contact point for all FOI-related matters.
In accordance with the Freedom of Information Act 1992 (the Act), DoT is required to deal with FOI access applications within 45 days of receipt, unless an extension of time is negotiated. The average time to process applications in 2020-21 was 14.28 days.
FOI fees and charges
Fees and charges are set under the Act. Apart from the application fee for non-personal information, all charges are discretionary. Details of fees and charges are listed below.
Application Amount
Personal information about applicant
No fee
Application fee (for non-personal information)
$30.00
Charge for time taken dealing with the application
$30.00 per hour
Charge for access time supervised by staff
$30.00 per hour
Charges for photocopying
$30.00 per hour for staff time and 20 cents
per copy
Preparing a copy of a tape, film or computerised information, or arranging delivery, packaging and postage of documents
Actual cost
Rights of reviewThe Act allows dissatisfied applicants to request an internal review of the initial decision made by DoT. In accordance with Section 40 of the Act, a request for an internal review must be received in writing within 30 days of the date of the initial decision.
Following an internal review, if the applicant still disagrees with the Department’s decision, they may lodge a complaint with the Office of the Information Commissioner for an external review. Such applications must be submitted within 60 days from the date of internal review decision.
No fees or charges apply to internal or external reviews.
ANNUAL REPORT 2020-21 PAGE 197PAGE 196 DEPARTMENT OF TRANSPORT
Disclosures and Legal ComplianceDisclosures and Legal Compliance
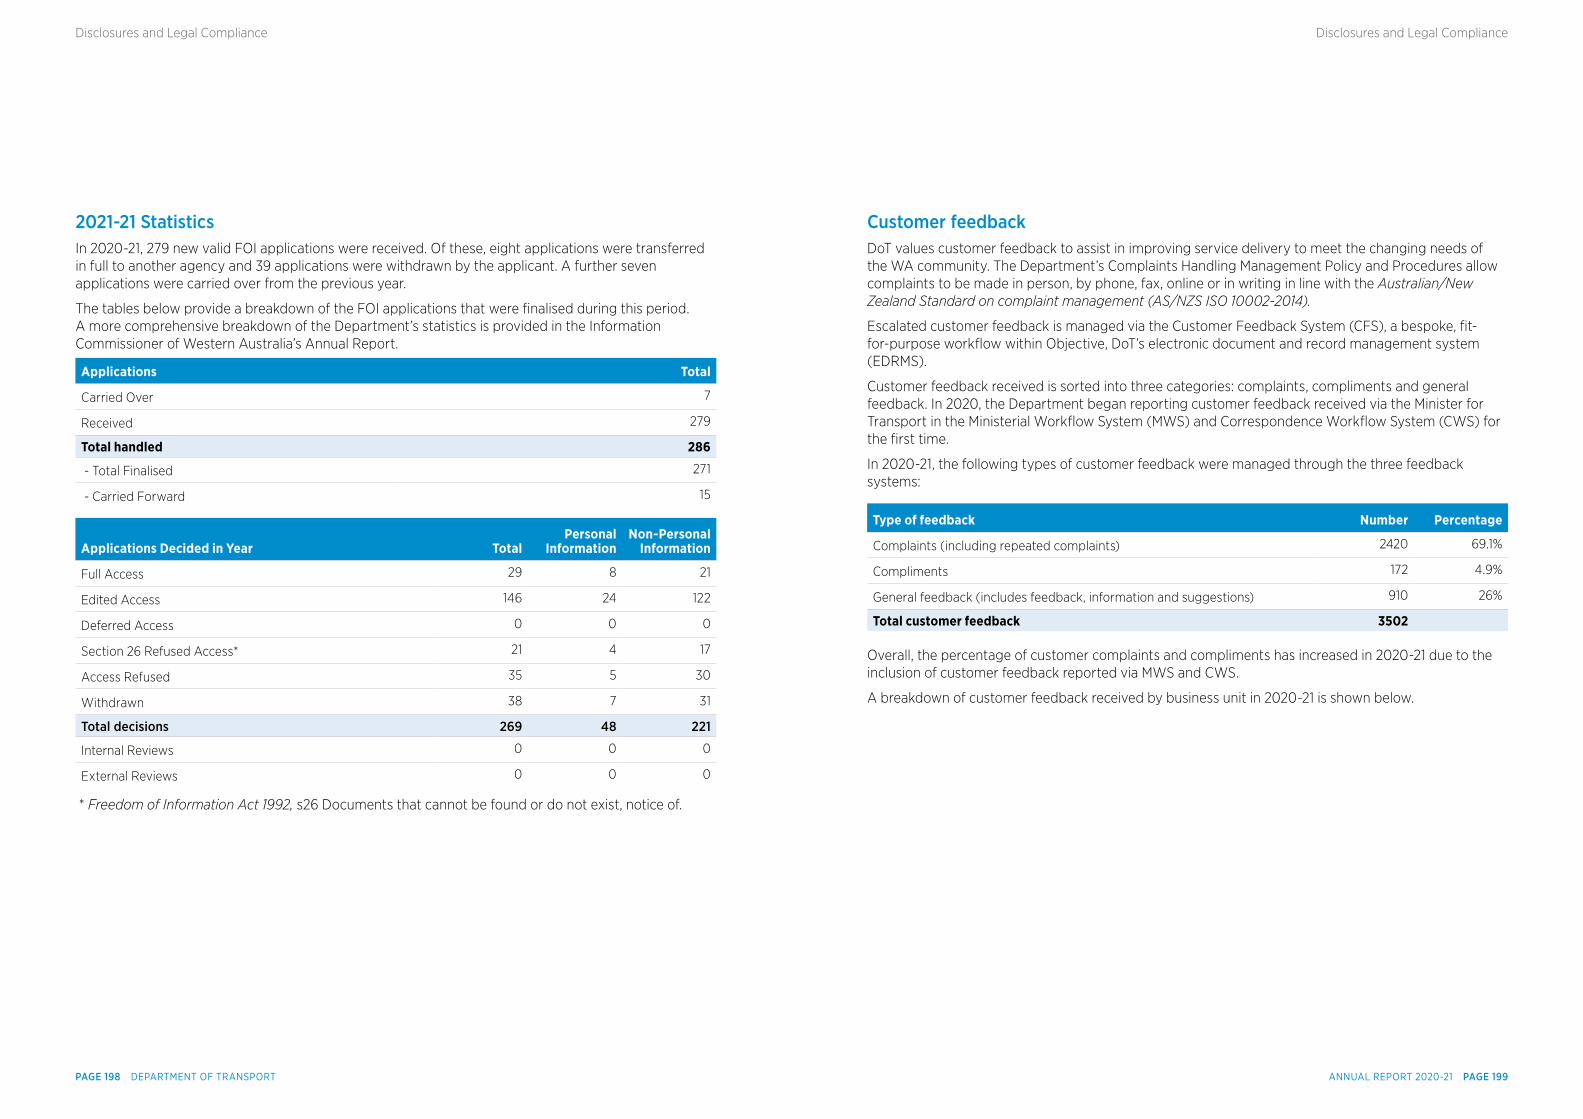
2021-21 StatisticsIn 2020-21, 279 new valid FOI applications were received. Of these, eight applications were transferred in full to another agency and 39 applications were withdrawn by the applicant. A further seven applications were carried over from the previous year.
The tables below provide a breakdown of the FOI applications that were finalised during this period. A more comprehensive breakdown of the Department’s statistics is provided in the Information Commissioner of Western Australia’s Annual Report.
Applications Total
Carried Over 7
Received 279
Total handled 286
- Total Finalised 271
- Carried Forward 15
Applications Decided in Year TotalPersonal
InformationNon-Personal
Information
Full Access 29 8 21
Edited Access 146 24 122
Deferred Access 0 0 0
Section 26 Refused Access* 21 4 17
Access Refused 35 5 30
Withdrawn 38 7 31
Total decisions 269 48 221
Internal Reviews 0 0 0
External Reviews 0 0 0
* Freedom of Information Act 1992, s26 Documents that cannot be found or do not exist, notice of.
Customer feedbackDoT values customer feedback to assist in improving service delivery to meet the changing needs of the WA community. The Department’s Complaints Handling Management Policy and Procedures allow complaints to be made in person, by phone, fax, online or in writing in line with the Australian/New Zealand Standard on complaint management (AS/NZS ISO 10002-2014).
Escalated customer feedback is managed via the Customer Feedback System (CFS), a bespoke, fit-for-purpose workflow within Objective, DoT’s electronic document and record management system (EDRMS).
Customer feedback received is sorted into three categories: complaints, compliments and general feedback. In 2020, the Department began reporting customer feedback received via the Minister for Transport in the Ministerial Workflow System (MWS) and Correspondence Workflow System (CWS) for the first time.
In 2020-21, the following types of customer feedback were managed through the three feedback systems:
Type of feedback Number Percentage
Complaints (including repeated complaints) 2420 69.1%
Compliments 172 4.9%
General feedback (includes feedback, information and suggestions) 910 26%
Total customer feedback 3502
Overall, the percentage of customer complaints and compliments has increased in 2020-21 due to the inclusion of customer feedback reported via MWS and CWS.
A breakdown of customer feedback received by business unit in 2020-21 is shown below.
ANNUAL REPORT 2020-21 PAGE 199PAGE 198 DEPARTMENT OF TRANSPORT
Disclosures and Legal ComplianceDisclosures and Legal Compliance
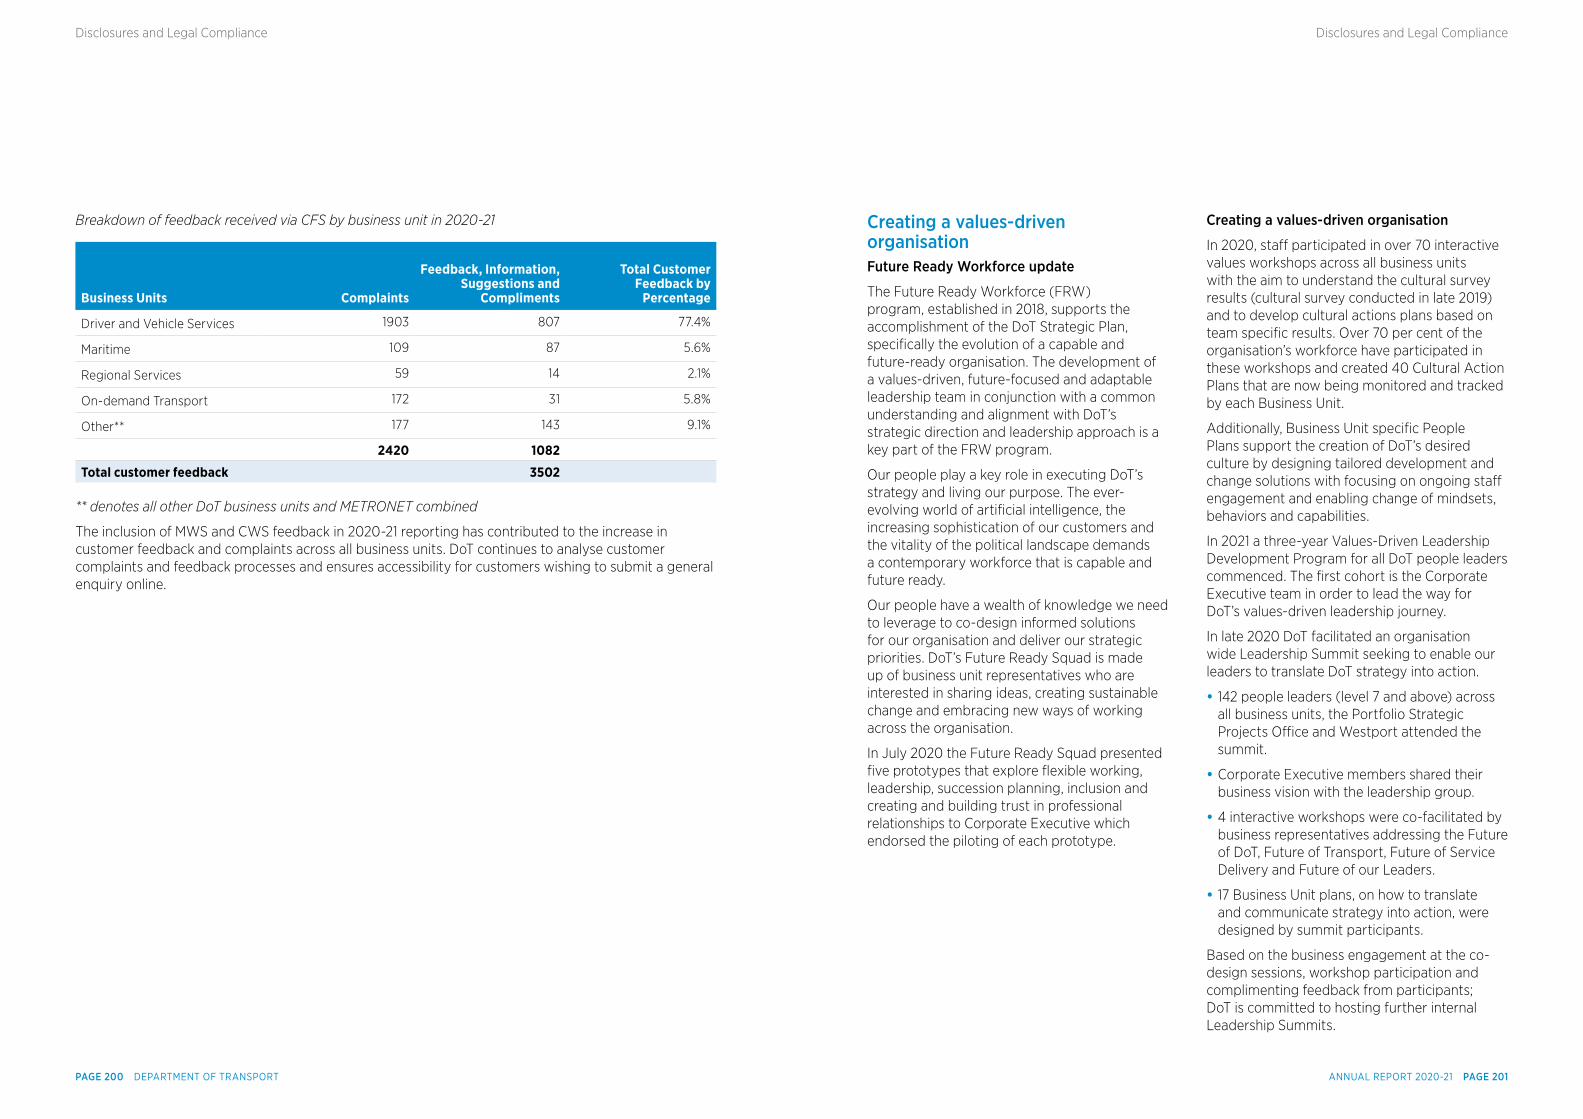
Breakdown of feedback received via CFS by business unit in 2020-21
Business Units Complaints
Feedback, Information, Suggestions and
Compliments
Total Customer Feedback by
Percentage
Driver and Vehicle Services 1903 807 77.4%
Maritime 109 87 5.6%
Regional Services 59 14 2.1%
On-demand Transport 172 31 5.8%
Other** 177 143 9.1%
2420 1082
Total customer feedback 3502
** denotes all other DoT business units and METRONET combined
The inclusion of MWS and CWS feedback in 2020-21 reporting has contributed to the increase in customer feedback and complaints across all business units. DoT continues to analyse customer complaints and feedback processes and ensures accessibility for customers wishing to submit a general enquiry online.
Creating a values-driven organisationFuture Ready Workforce update
The Future Ready Workforce (FRW) program, established in 2018, supports the accomplishment of the DoT Strategic Plan, specifically the evolution of a capable and future-ready organisation. The development of a values-driven, future-focused and adaptable leadership team in conjunction with a common understanding and alignment with DoT’s strategic direction and leadership approach is a key part of the FRW program.
Our people play a key role in executing DoT’s strategy and living our purpose. The ever-evolving world of artificial intelligence, the increasing sophistication of our customers and the vitality of the political landscape demands a contemporary workforce that is capable and future ready.
Our people have a wealth of knowledge we need to leverage to co-design informed solutions for our organisation and deliver our strategic priorities. DoT’s Future Ready Squad is made up of business unit representatives who are interested in sharing ideas, creating sustainable change and embracing new ways of working across the organisation.
In July 2020 the Future Ready Squad presented five prototypes that explore flexible working, leadership, succession planning, inclusion and creating and building trust in professional relationships to Corporate Executive which endorsed the piloting of each prototype.
Creating a values-driven organisation
In 2020, staff participated in over 70 interactive values workshops across all business units with the aim to understand the cultural survey results (cultural survey conducted in late 2019) and to develop cultural actions plans based on team specific results. Over 70 per cent of the organisation’s workforce have participated in these workshops and created 40 Cultural Action Plans that are now being monitored and tracked by each Business Unit.
Additionally, Business Unit specific People Plans support the creation of DoT’s desired culture by designing tailored development and change solutions with focusing on ongoing staff engagement and enabling change of mindsets, behaviors and capabilities.
In 2021 a three-year Values-Driven Leadership Development Program for all DoT people leaders commenced. The first cohort is the Corporate Executive team in order to lead the way for DoT’s values-driven leadership journey.
In late 2020 DoT facilitated an organisation wide Leadership Summit seeking to enable our leaders to translate DoT strategy into action.
• 142 people leaders (level 7 and above) across all business units, the Portfolio Strategic Projects Office and Westport attended the summit.
• Corporate Executive members shared their business vision with the leadership group.
• 4 interactive workshops were co-facilitated by business representatives addressing the Future of DoT, Future of Transport, Future of Service Delivery and Future of our Leaders.
• 17 Business Unit plans, on how to translate and communicate strategy into action, were designed by summit participants.
Based on the business engagement at the co-design sessions, workshop participation and complimenting feedback from participants; DoT is committed to hosting further internal Leadership Summits.
ANNUAL REPORT 2020-21 PAGE 201PAGE 200 DEPARTMENT OF TRANSPORT
Disclosures and Legal ComplianceDisclosures and Legal Compliance
Workforce Diversity and Inclusion PlanIn late 2020, DoT commenced a comprehensive internal consultation process and consolidation of data and research to co-design a new three-year Workforce Inclusion and Diversity Plan. The plan incorporates existing initiatives, aligns with DoT’s current focus on moving towards a values-driven organisation and builds on results from staff surveys (such as a Diversity & Inclusion survey in October 2020 and Barrett Values Survey in November 2019) and a Fresh Think Tank challenge on Inclusion (November 2020).
DoT’s Workforce Inclusion and Diversity Plan 2021-23 first prioritises creating a culture of inclusion within DoT, a safe space where everyone belongs and can bring their best self to work. The associated Action Plan outlines specific initiatives to improve awareness, development, recruitment and celebration of employees within the identified diversity groups.
The plan aims to develop a future-ready workforce that is reflective of our community and ready and responsive to our evolving business needs. It also promotes two significant new programs; a Youth Program (focused on bringing people under 25 years of age into the organisation) and a Talent Management Program (to support women into leadership position).
DoT’s revised Workforce Inclusion and Diversity Plan ensures that:
• DoT is complying with the requirements of the Public Sector Commission;
• there is a recognition of DoT’s focus on inclusion;
• our inclusion and diversity journey works hand-in-hand with DoT’s commitment to be a values-driven organisation; and DoT continues to focus on critical areas of our workforce composition to improve innovation, productivity, employee performance, and delivery of strategic priorities.
Achievements in 2020-21 include:
• DoT’s high proportion of culturally and linguistically diverse employees, with representation 7 per cent higher than the average across the public sector;
• the implementation of a Cultural Awareness Training program for all employees, involving workshops held on Country with an Aboriginal service provider about “Connecting People with Culture and Country”. More than 800 staff have particpated in over 25 sessions;
• offering Disability Awareness training to all staff to raise awareness and build disability confidence across the organisation;
• facilitating “Choose to Challenge” workshops in response to the 2021 International Women’s Day theme;
• running Introduction to Sexuality and Gender workshops as part of celebrating Pride Month;
• celebrating special events and occasions for diverse groups such as Harmony Day, and NAIDOC Week;
• introduced People Plans that brought the planning for inclusion and diversity to the fore; and
• the culmination of DoT’s first ‘Future Ready Squad’, established with employees nominated from each business area, pitching potential initiatives around succession planning, flexible working and inclusion, several of which were adopted across DoT.
Employee development • DoT’s Organisational Capability team was created in January following a restructure of the People and Culture business unit. Working closely with the Organisational Change team, Organisational Capability works to deliver a range of development programs, targeted learning and training sessions to meet current and future capabilities that achieve business unit and organisational outcomes.
• A comprehensive induction and onboarding process is conducted for new DoT employees. Beginning prior to commencement, the process includes a suite of regulatory essentials conducted via e-learning and local induction which includes any required on the job training. The final component of Transport’s induction is a Welcome to DoT Day, an opportunity for participants to hear directly from members of Corporate Executive on the Department and wider Portfolio’s vision and strategic overview.
• A Learning Calendar provides programs delivered by both internal staff and external providers that are customised to meet DoT needs and delivered via e-learning, webinars or face to face.
• Almost 100 employees have attended training to assist them in having difficult conversations or provision of feedback. By the end of June 2021, over 900 employees participated in workplace training including Disability Awareness, Indigenous Cultural Awareness training, training to challenge sexual discrimination and harassment as well as training to raise awareness and improve feelings of inclusion for LGBTQIA+ employees and customers.
• The Workplace Health and Safety team provided training for 38 employees on Injury Management and Injury Management for managers. 15 employees have undertaken Mental Health First Aid training.
• The Everyday People Manager Program which was created to focus on common people management matters. The program pilot conducted at the end of 2020 was attended by 20 participants. The revised program will be launched in 2021-22.
• Following a tender process, a new provider was sourced for DoT’s People Managers Program, which offers participants a highly customised Certificate IV in Leadership and Management. This program supports DoT’s commitment to upskilling new and emerging managers with the skills they need to successfully manage and lead their teams. The first intake of 20 participants will begin the 12-month program with the new provider in August 2021.
ANNUAL REPORT 2020-21 PAGE 203PAGE 202 DEPARTMENT OF TRANSPORT
Disclosures and Legal ComplianceDisclosures and Legal Compliance
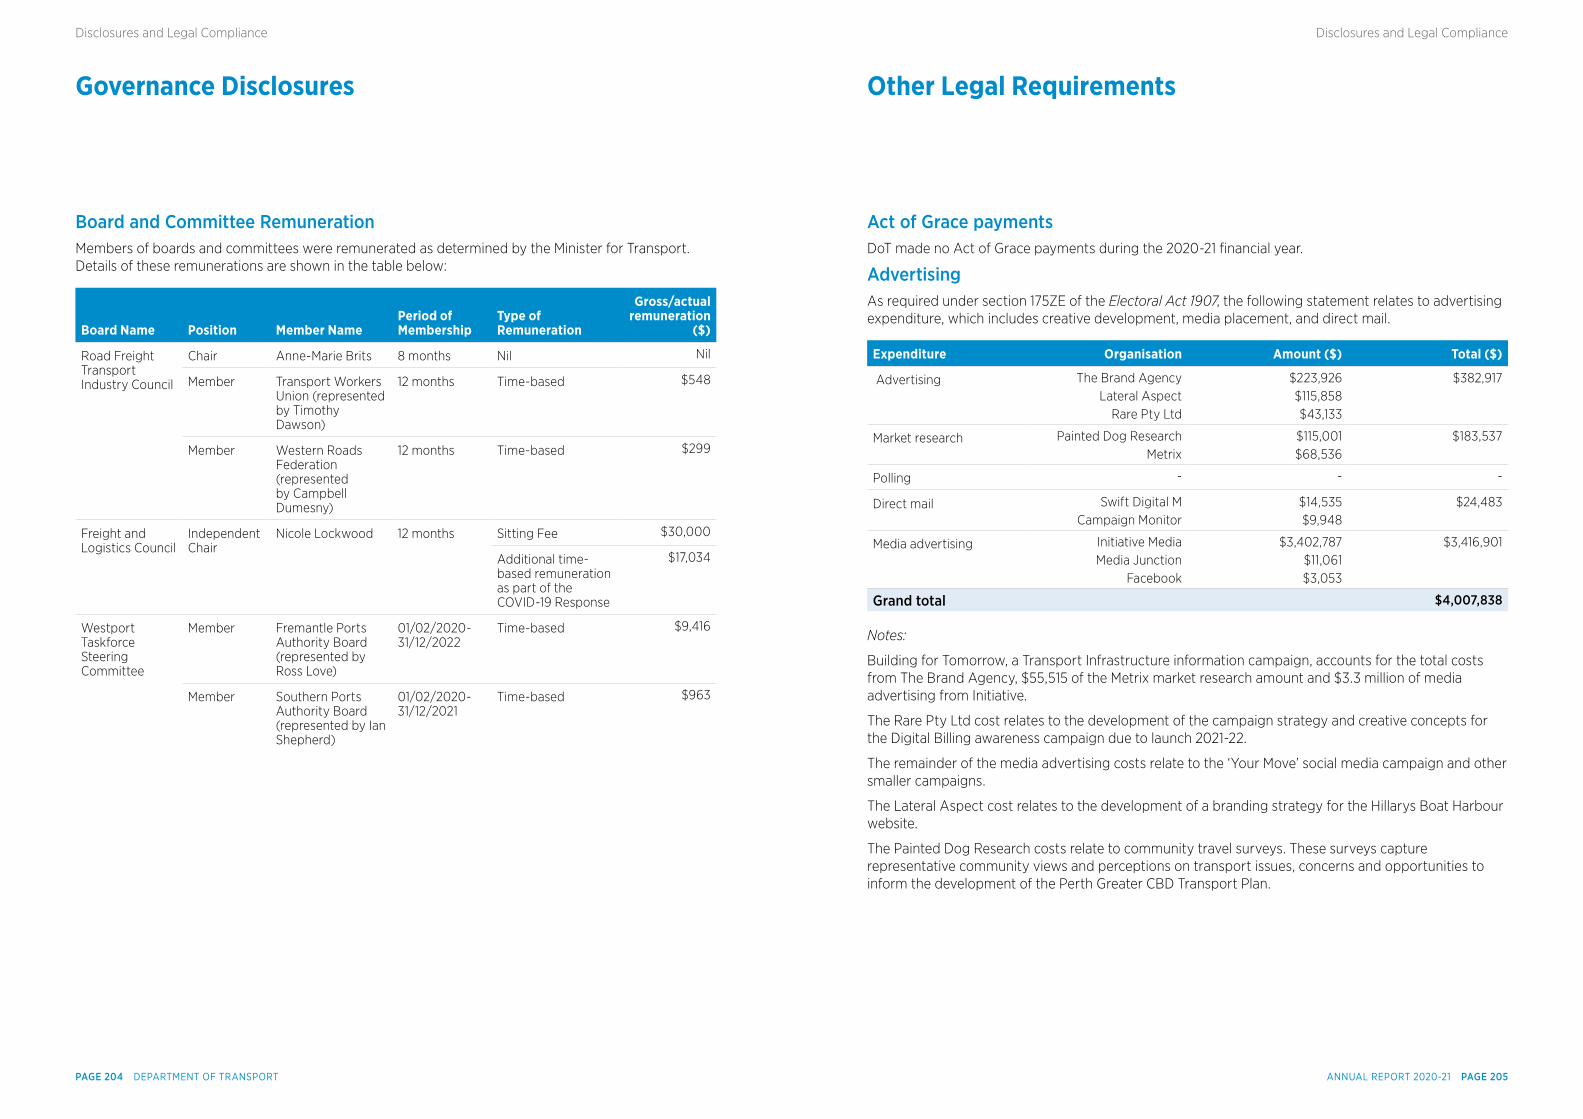
Governance Disclosures Other Legal Requirements
Board and Committee RemunerationMembers of boards and committees were remunerated as determined by the Minister for Transport. Details of these remunerations are shown in the table below:
Board Name Position Member NamePeriod of Membership
Type of Remuneration
Gross/actual remuneration
($)
Road Freight Transport Industry Council
Chair Anne-Marie Brits 8 months Nil Nil
Member Transport Workers Union (represented by Timothy Dawson)
12 months Time-based $548
Member Western Roads Federation (represented by Campbell Dumesny)
12 months Time-based $299
Freight and Logistics Council
Independent Chair
Nicole Lockwood 12 months Sitting Fee $30,000
Additional time-based remuneration as part of the COVID-19 Response
$17,034
Westport Taskforce Steering Committee
Member Fremantle Ports Authority Board (represented by Ross Love)
01/02/2020-31/12/2022
Time-based $9,416
Member Southern Ports Authority Board (represented by Ian Shepherd)
01/02/2020-31/12/2021
Time-based $963
Act of Grace paymentsDoT made no Act of Grace payments during the 2020-21 financial year.
AdvertisingAs required under section 175ZE of the Electoral Act 1907, the following statement relates to advertising expenditure, which includes creative development, media placement, and direct mail.
Expenditure Organisation Amount ($) Total ($)
Advertising The Brand Agency Lateral Aspect
Rare Pty Ltd
$223,926$115,858$43,133
$382,917
Market research Painted Dog Research Metrix
$115,001$68,536
$183,537
Polling - - -
Direct mail Swift Digital M Campaign Monitor
$14,535$9,948
$24,483
Media advertising Initiative Media Media Junction
$3,402,787$11,061$3,053
$3,416,901
Grand total $4,007,838
Notes:
Building for Tomorrow, a Transport Infrastructure information campaign, accounts for the total costs from The Brand Agency, $55,515 of the Metrix market research amount and $3.3 million of media advertising from Initiative.
The Rare Pty Ltd cost relates to the development of the campaign strategy and creative concepts for the Digital Billing awareness campaign due to launch 2021-22.
The remainder of the media advertising costs relate to the ‘Your Move’ social media campaign and other smaller campaigns.
The Lateral Aspect cost relates to the development of a branding strategy for the Hillarys Boat Harbour website.
The Painted Dog Research costs relate to community travel surveys. These surveys capture representative community views and perceptions on transport issues, concerns and opportunities to inform the development of the Perth Greater CBD Transport Plan.
ANNUAL REPORT 2020-21 PAGE 205PAGE 204 DEPARTMENT OF TRANSPORT
Disclosures and Legal ComplianceDisclosures and Legal Compliance
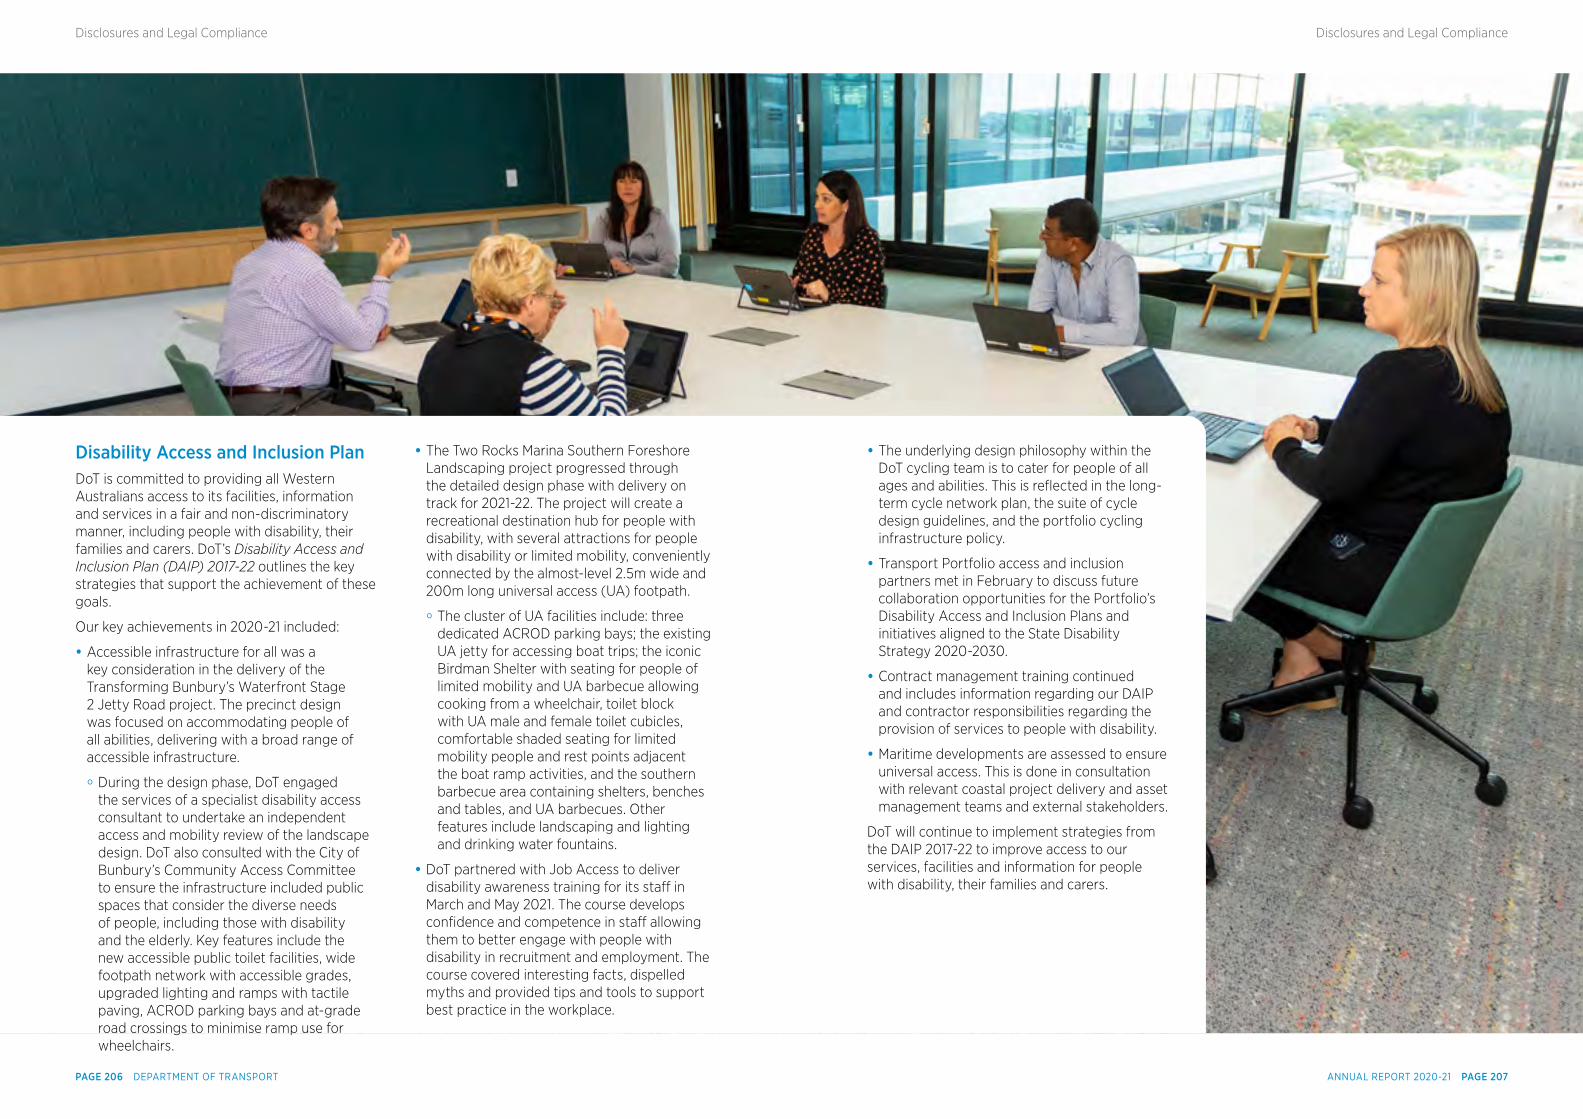
Disability Access and Inclusion PlanDoT is committed to providing all Western Australians access to its facilities, information and services in a fair and non-discriminatory manner, including people with disability, their families and carers. DoT’s Disability Access and Inclusion Plan (DAIP) 2017-22 outlines the key strategies that support the achievement of these goals.
Our key achievements in 2020-21 included:
• Accessible infrastructure for all was a key consideration in the delivery of the Transforming Bunbury’s Waterfront Stage 2 Jetty Road project. The precinct design was focused on accommodating people of all abilities, delivering with a broad range of accessible infrastructure.
• During the design phase, DoT engaged the services of a specialist disability access consultant to undertake an independent access and mobility review of the landscape design. DoT also consulted with the City of Bunbury’s Community Access Committee to ensure the infrastructure included public spaces that consider the diverse needs of people, including those with disability and the elderly. Key features include the new accessible public toilet facilities, wide footpath network with accessible grades, upgraded lighting and ramps with tactile paving, ACROD parking bays and at-grade road crossings to minimise ramp use for wheelchairs.
• The Two Rocks Marina Southern Foreshore Landscaping project progressed through the detailed design phase with delivery on track for 2021-22. The project will create a recreational destination hub for people with disability, with several attractions for people with disability or limited mobility, conveniently connected by the almost-level 2.5m wide and 200m long universal access (UA) footpath.
• The cluster of UA facilities include: three dedicated ACROD parking bays; the existing UA jetty for accessing boat trips; the iconic Birdman Shelter with seating for people of limited mobility and UA barbecue allowing cooking from a wheelchair, toilet block with UA male and female toilet cubicles, comfortable shaded seating for limited mobility people and rest points adjacent the boat ramp activities, and the southern barbecue area containing shelters, benches and tables, and UA barbecues. Other features include landscaping and lighting and drinking water fountains.
• DoT partnered with Job Access to deliver disability awareness training for its staff in March and May 2021. The course develops confidence and competence in staff allowing them to better engage with people with disability in recruitment and employment. The course covered interesting facts, dispelled myths and provided tips and tools to support best practice in the workplace.
• The underlying design philosophy within the DoT cycling team is to cater for people of all ages and abilities. This is reflected in the long-term cycle network plan, the suite of cycle design guidelines, and the portfolio cycling infrastructure policy.
• Transport Portfolio access and inclusion partners met in February to discuss future collaboration opportunities for the Portfolio’s Disability Access and Inclusion Plans and initiatives aligned to the State Disability Strategy 2020-2030.
• Contract management training continued and includes information regarding our DAIP and contractor responsibilities regarding the provision of services to people with disability.
• Maritime developments are assessed to ensure universal access. This is done in consultation with relevant coastal project delivery and asset management teams and external stakeholders.
DoT will continue to implement strategies from the DAIP 2017-22 to improve access to our services, facilities and information for people with disability, their families and carers.
ANNUAL REPORT 2020-21 PAGE 207PAGE 206 DEPARTMENT OF TRANSPORT
Disclosures and Legal ComplianceDisclosures and Legal Compliance
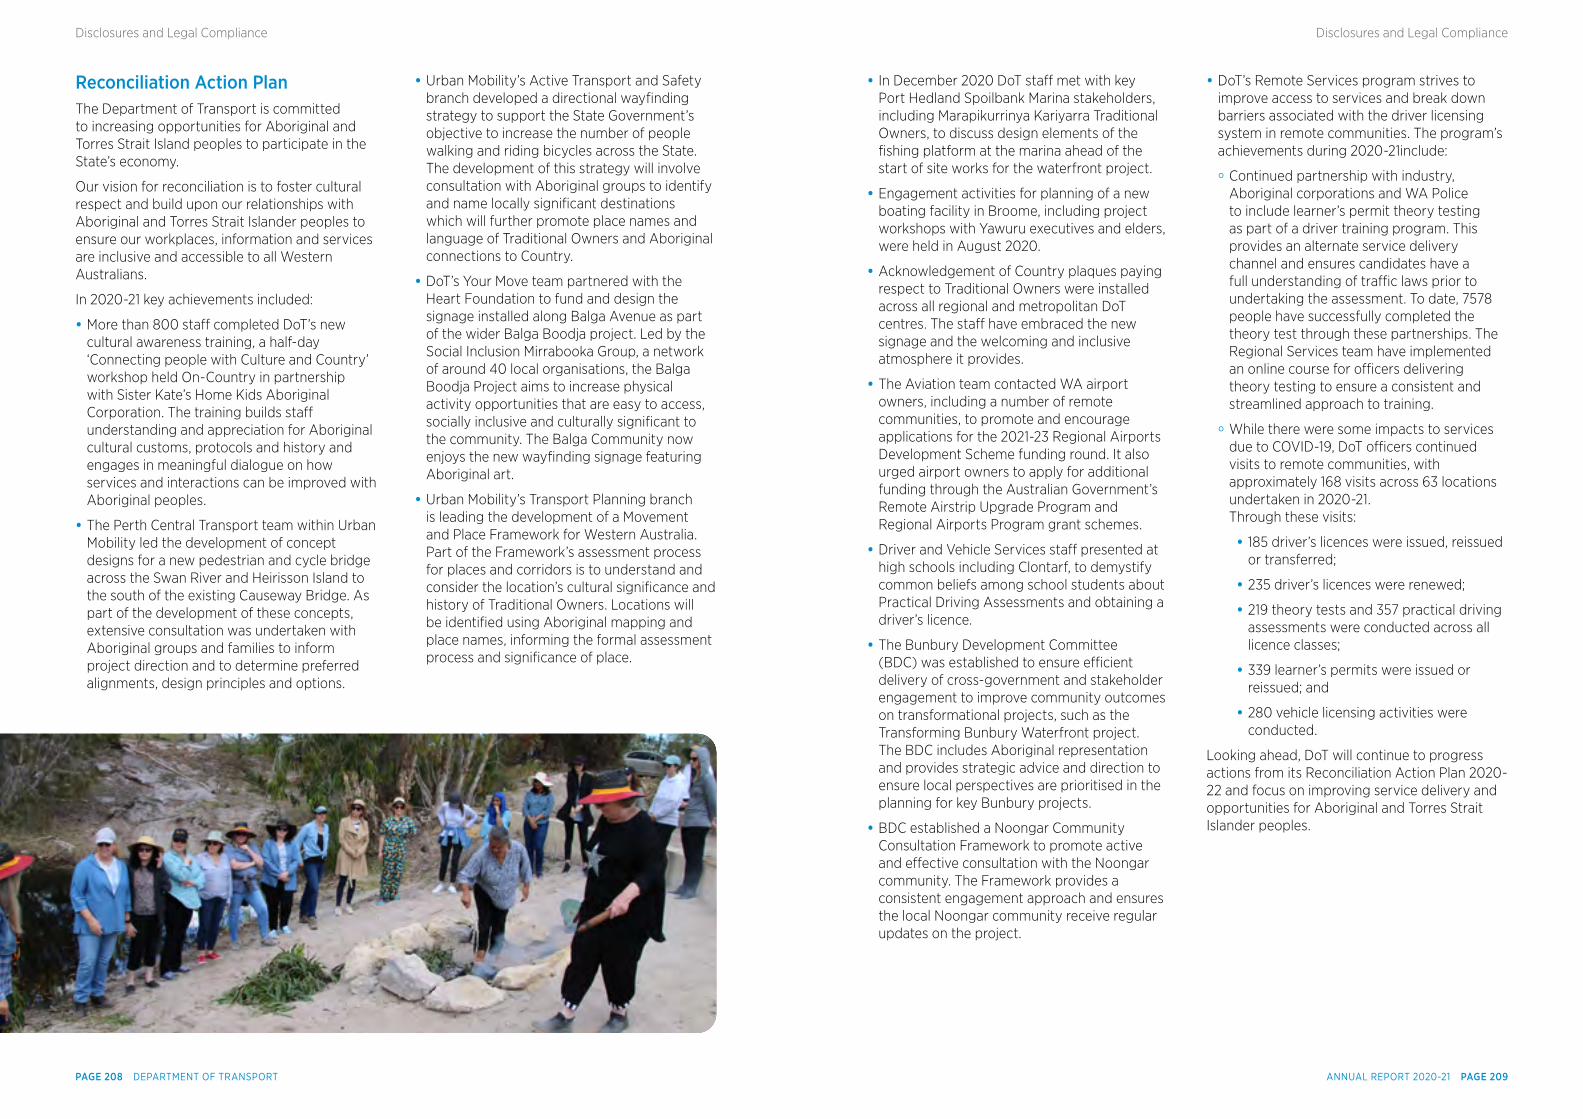
Reconciliation Action PlanThe Department of Transport is committed to increasing opportunities for Aboriginal and Torres Strait Island peoples to participate in the State’s economy.
Our vision for reconciliation is to foster cultural respect and build upon our relationships with Aboriginal and Torres Strait Islander peoples to ensure our workplaces, information and services are inclusive and accessible to all Western Australians.
In 2020-21 key achievements included:
• More than 800 staff completed DoT’s new cultural awareness training, a half-day ‘Connecting people with Culture and Country’ workshop held On-Country in partnership with Sister Kate’s Home Kids Aboriginal Corporation. The training builds staff understanding and appreciation for Aboriginal cultural customs, protocols and history and engages in meaningful dialogue on how services and interactions can be improved with Aboriginal peoples.
• The Perth Central Transport team within Urban Mobility led the development of concept designs for a new pedestrian and cycle bridge across the Swan River and Heirisson Island to the south of the existing Causeway Bridge. As part of the development of these concepts, extensive consultation was undertaken with Aboriginal groups and families to inform project direction and to determine preferred alignments, design principles and options.
• Urban Mobility’s Active Transport and Safety branch developed a directional wayfinding strategy to support the State Government’s objective to increase the number of people walking and riding bicycles across the State. The development of this strategy will involve consultation with Aboriginal groups to identify and name locally significant destinations which will further promote place names and language of Traditional Owners and Aboriginal connections to Country.
• DoT’s Your Move team partnered with the Heart Foundation to fund and design the signage installed along Balga Avenue as part of the wider Balga Boodja project. Led by the Social Inclusion Mirrabooka Group, a network of around 40 local organisations, the Balga Boodja Project aims to increase physical activity opportunities that are easy to access, socially inclusive and culturally significant to the community. The Balga Community now enjoys the new wayfinding signage featuring Aboriginal art.
• Urban Mobility’s Transport Planning branch is leading the development of a Movement and Place Framework for Western Australia. Part of the Framework’s assessment process for places and corridors is to understand and consider the location’s cultural significance and history of Traditional Owners. Locations will be identified using Aboriginal mapping and place names, informing the formal assessment process and significance of place.
• In December 2020 DoT staff met with key Port Hedland Spoilbank Marina stakeholders, including Marapikurrinya Kariyarra Traditional Owners, to discuss design elements of the fishing platform at the marina ahead of the start of site works for the waterfront project.
• Engagement activities for planning of a new boating facility in Broome, including project workshops with Yawuru executives and elders, were held in August 2020.
• Acknowledgement of Country plaques paying respect to Traditional Owners were installed across all regional and metropolitan DoT centres. The staff have embraced the new signage and the welcoming and inclusive atmosphere it provides.
• The Aviation team contacted WA airport owners, including a number of remote communities, to promote and encourage applications for the 2021-23 Regional Airports Development Scheme funding round. It also urged airport owners to apply for additional funding through the Australian Government’s Remote Airstrip Upgrade Program and Regional Airports Program grant schemes.
• Driver and Vehicle Services staff presented at high schools including Clontarf, to demystify common beliefs among school students about Practical Driving Assessments and obtaining a driver’s licence.
• The Bunbury Development Committee (BDC) was established to ensure efficient delivery of cross-government and stakeholder engagement to improve community outcomes on transformational projects, such as the Transforming Bunbury Waterfront project. The BDC includes Aboriginal representation and provides strategic advice and direction to ensure local perspectives are prioritised in the planning for key Bunbury projects.
• BDC established a Noongar Community Consultation Framework to promote active and effective consultation with the Noongar community. The Framework provides a consistent engagement approach and ensures the local Noongar community receive regular updates on the project.
• DoT’s Remote Services program strives to improve access to services and break down barriers associated with the driver licensing system in remote communities. The program’s achievements during 2020-21include:
• Continued partnership with industry, Aboriginal corporations and WA Police to include learner’s permit theory testing as part of a driver training program. This provides an alternate service delivery channel and ensures candidates have a full understanding of traffic laws prior to undertaking the assessment. To date, 7578 people have successfully completed the theory test through these partnerships. The Regional Services team have implemented an online course for officers delivering theory testing to ensure a consistent and streamlined approach to training.
• While there were some impacts to services due to COVID-19, DoT officers continued visits to remote communities, with approximately 168 visits across 63 locations undertaken in 2020-21. Through these visits:
• 185 driver’s licences were issued, reissued or transferred;
• 235 driver’s licences were renewed;
• 219 theory tests and 357 practical driving assessments were conducted across all licence classes;
• 339 learner’s permits were issued or reissued; and
• 280 vehicle licensing activities were conducted.
Looking ahead, DoT will continue to progress actions from its Reconciliation Action Plan 2020-22 and focus on improving service delivery and opportunities for Aboriginal and Torres Strait Islander peoples.
ANNUAL REPORT 2020-21 PAGE 209PAGE 208 DEPARTMENT OF TRANSPORT
Disclosures and Legal ComplianceDisclosures and Legal Compliance
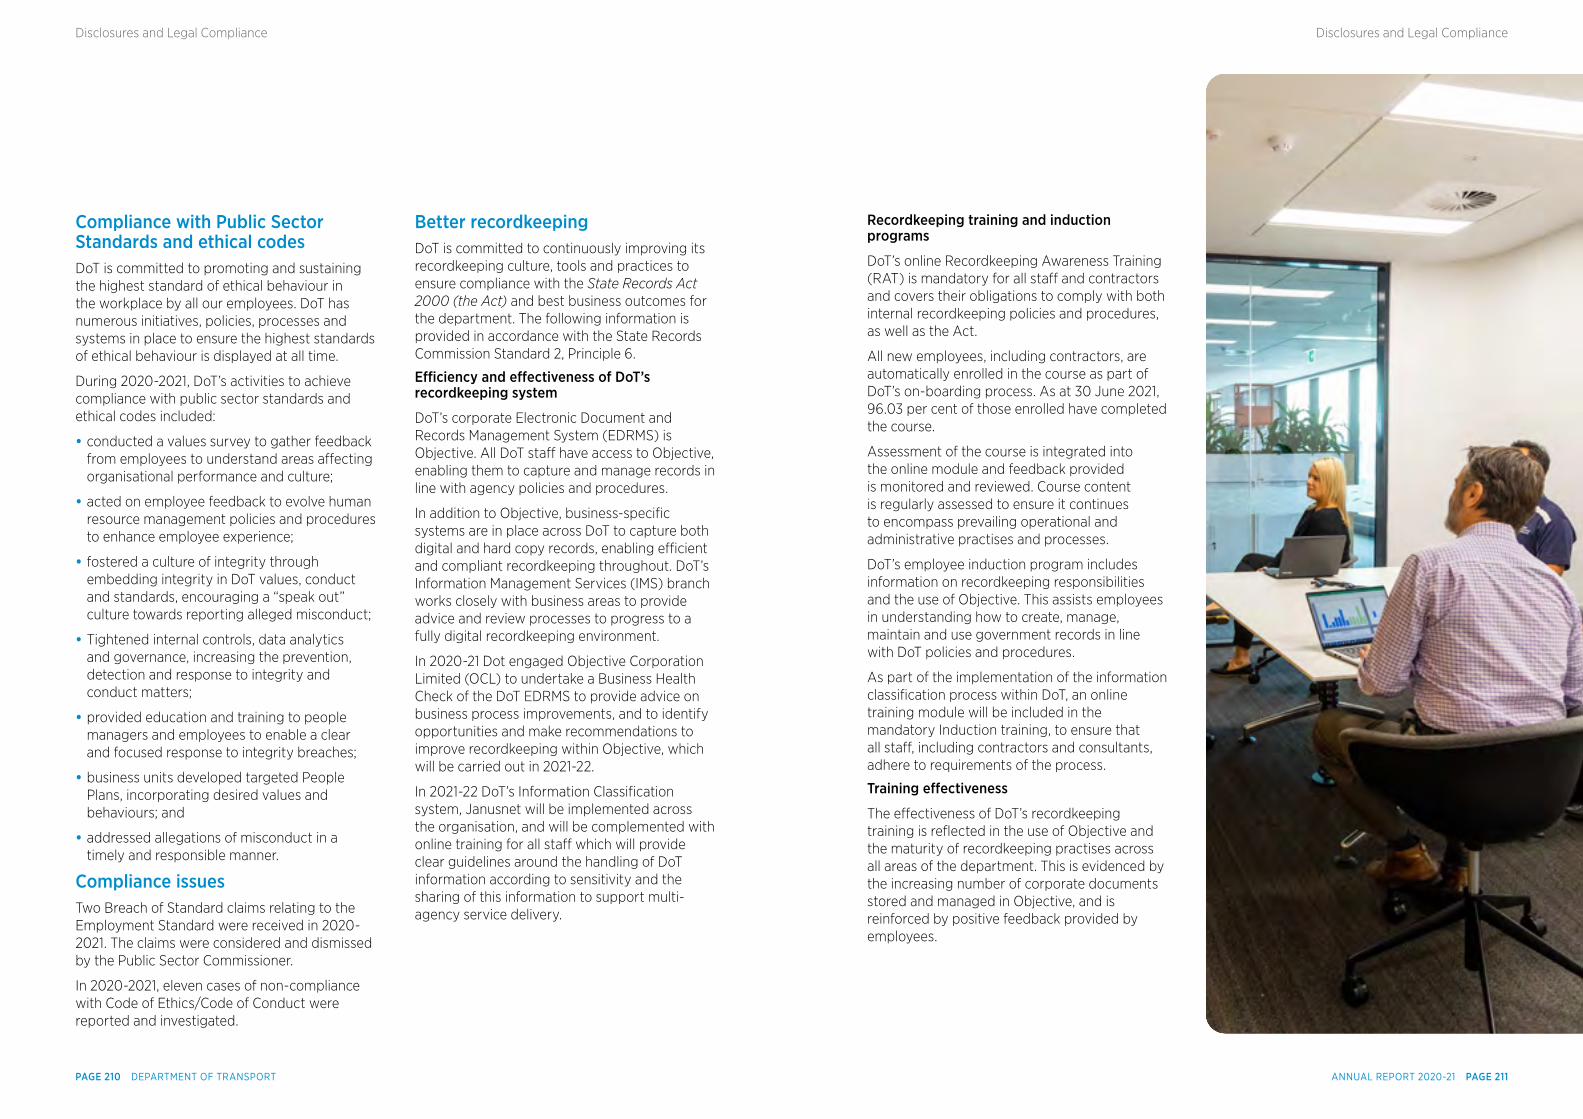
Compliance with Public Sector Standards and ethical codesDoT is committed to promoting and sustaining the highest standard of ethical behaviour in the workplace by all our employees. DoT has numerous initiatives, policies, processes and systems in place to ensure the highest standards of ethical behaviour is displayed at all time.
During 2020-2021, DoT’s activities to achieve compliance with public sector standards and ethical codes included:
• conducted a values survey to gather feedback from employees to understand areas affecting organisational performance and culture;
• acted on employee feedback to evolve human resource management policies and procedures to enhance employee experience;
• fostered a culture of integrity through embedding integrity in DoT values, conduct and standards, encouraging a “speak out” culture towards reporting alleged misconduct;
• Tightened internal controls, data analytics and governance, increasing the prevention, detection and response to integrity and conduct matters;
• provided education and training to people managers and employees to enable a clear and focused response to integrity breaches;
• business units developed targeted People Plans, incorporating desired values and behaviours; and
• addressed allegations of misconduct in a timely and responsible manner.
Compliance issuesTwo Breach of Standard claims relating to the Employment Standard were received in 2020- 2021. The claims were considered and dismissed by the Public Sector Commissioner.
In 2020-2021, eleven cases of non-compliance with Code of Ethics/Code of Conduct were reported and investigated.
Better recordkeepingDoT is committed to continuously improving its recordkeeping culture, tools and practices to ensure compliance with the State Records Act 2000 (the Act) and best business outcomes for the department. The following information is provided in accordance with the State Records Commission Standard 2, Principle 6.
Efciency and efectiveness of DoT’s recordkeeping system
DoT’s corporate Electronic Document and Records Management System (EDRMS) is Objective. All DoT staff have access to Objective, enabling them to capture and manage records in line with agency policies and procedures.
In addition to Objective, business-specific systems are in place across DoT to capture both digital and hard copy records, enabling efficient and compliant recordkeeping throughout. DoT’s Information Management Services (IMS) branch works closely with business areas to provide advice and review processes to progress to a fully digital recordkeeping environment.
In 2020-21 Dot engaged Objective Corporation Limited (OCL) to undertake a Business Health Check of the DoT EDRMS to provide advice on business process improvements, and to identify opportunities and make recommendations to improve recordkeeping within Objective, which will be carried out in 2021-22.
In 2021-22 DoT’s Information Classification system, Janusnet will be implemented across the organisation, and will be complemented with online training for all staff which will provide clear guidelines around the handling of DoT information according to sensitivity and the sharing of this information to support multi-agency service delivery.
Recordkeeping training and induction programs
DoT’s online Recordkeeping Awareness Training (RAT) is mandatory for all staff and contractors and covers their obligations to comply with both internal recordkeeping policies and procedures, as well as the Act.
All new employees, including contractors, are automatically enrolled in the course as part of DoT’s on-boarding process. As at 30 June 2021, 96.03 per cent of those enrolled have completed the course.
Assessment of the course is integrated into the online module and feedback provided is monitored and reviewed. Course content is regularly assessed to ensure it continues to encompass prevailing operational and administrative practises and processes.
DoT’s employee induction program includes information on recordkeeping responsibilities and the use of Objective. This assists employees in understanding how to create, manage, maintain and use government records in line with DoT policies and procedures.
As part of the implementation of the information classification process within DoT, an online training module will be included in the mandatory Induction training, to ensure that all staff, including contractors and consultants, adhere to requirements of the process.
Training efectiveness
The effectiveness of DoT’s recordkeeping training is reflected in the use of Objective and the maturity of recordkeeping practises across all areas of the department. This is evidenced by the increasing number of corporate documents stored and managed in Objective, and is reinforced by positive feedback provided by employees.
ANNUAL REPORT 2020-21 PAGE 211PAGE 210 DEPARTMENT OF TRANSPORT
Disclosures and Legal ComplianceDisclosures and Legal Compliance
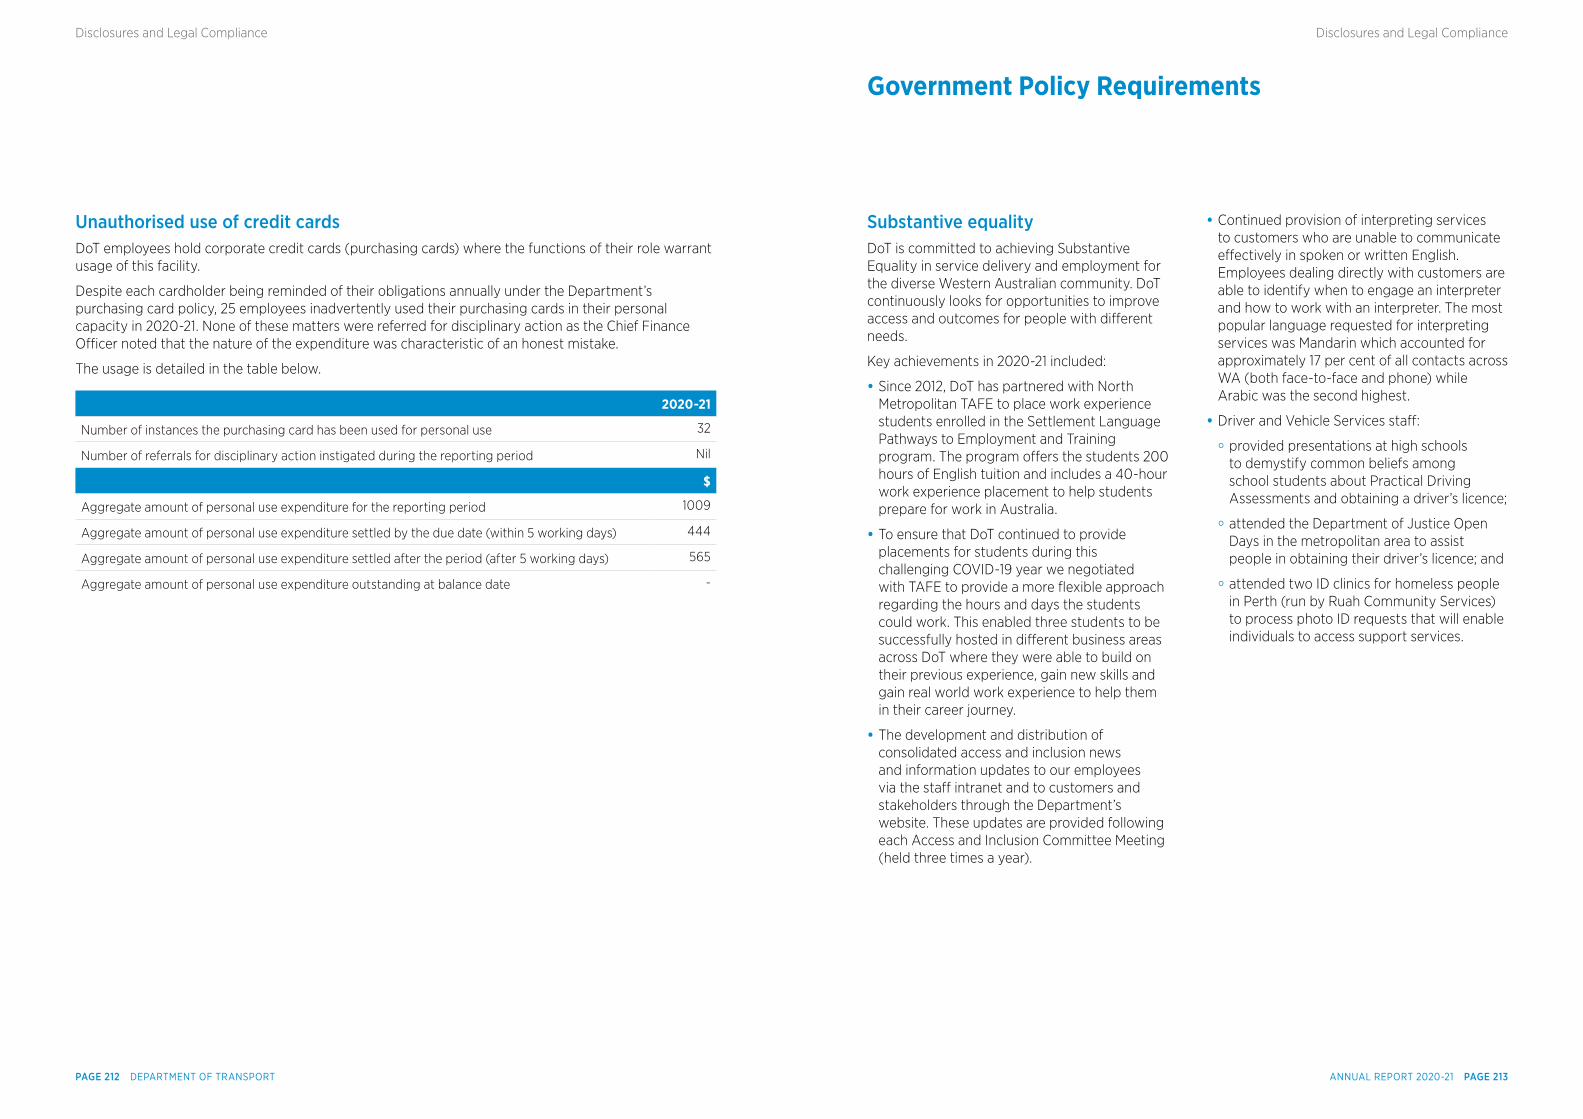
Unauthorised use of credit cardsDoT employees hold corporate credit cards (purchasing cards) where the functions of their role warrant usage of this facility.
Despite each cardholder being reminded of their obligations annually under the Department’s purchasing card policy, 25 employees inadvertently used their purchasing cards in their personal capacity in 2020-21. None of these matters were referred for disciplinary action as the Chief Finance Officer noted that the nature of the expenditure was characteristic of an honest mistake.
The usage is detailed in the table below.
2020-21
Number of instances the purchasing card has been used for personal use 32
Number of referrals for disciplinary action instigated during the reporting period Nil
$
Aggregate amount of personal use expenditure for the reporting period 1009
Aggregate amount of personal use expenditure settled by the due date (within 5 working days) 444
Aggregate amount of personal use expenditure settled after the period (after 5 working days) 565
Aggregate amount of personal use expenditure outstanding at balance date -
Government Policy Requirements
Substantive equalityDoT is committed to achieving Substantive Equality in service delivery and employment for the diverse Western Australian community. DoT continuously looks for opportunities to improve access and outcomes for people with different needs.
Key achievements in 2020-21 included:
• Since 2012, DoT has partnered with North Metropolitan TAFE to place work experience students enrolled in the Settlement Language Pathways to Employment and Training program. The program offers the students 200 hours of English tuition and includes a 40-hour work experience placement to help students prepare for work in Australia.
• To ensure that DoT continued to provide placements for students during this challenging COVID-19 year we negotiated with TAFE to provide a more flexible approach regarding the hours and days the students could work. This enabled three students to be successfully hosted in different business areas across DoT where they were able to build on their previous experience, gain new skills and gain real world work experience to help them in their career journey.
• The development and distribution of consolidated access and inclusion news and information updates to our employees via the staff intranet and to customers and stakeholders through the Department’s website. These updates are provided following each Access and Inclusion Committee Meeting (held three times a year).
• Continued provision of interpreting services to customers who are unable to communicate effectively in spoken or written English. Employees dealing directly with customers are able to identify when to engage an interpreter and how to work with an interpreter. The most popular language requested for interpreting services was Mandarin which accounted for approximately 17 per cent of all contacts across WA (both face-to-face and phone) while Arabic was the second highest.
• Driver and Vehicle Services staff:
• provided presentations at high schools to demystify common beliefs among school students about Practical Driving Assessments and obtaining a driver’s licence;
• attended the Department of Justice Open Days in the metropolitan area to assist people in obtaining their driver’s licence; and
• attended two ID clinics for homeless people in Perth (run by Ruah Community Services) to process photo ID requests that will enable individuals to access support services.
ANNUAL REPORT 2020-21 PAGE 213PAGE 212 DEPARTMENT OF TRANSPORT
Disclosures and Legal ComplianceDisclosures and Legal Compliance
Audit and Risk Management CommitteeThe Audit and Risk Management Committee (ARMC) provides oversight and advice on the effectiveness of DoT’s corporate governance, including risk management, control processes and internal audit.
The ARMC was established by the Director General – Transport as the accountable authority under Treasurer’s Instructions 1201 Structure of the Internal Audit Function, which requires accountable authorities to develop and maintain an effective internal audit function. The ARMC is an independent committee, reporting directly to the Director General.
The committee includes the following members:
• Chief Financial Officer – Department of Planning, Lands and Heritage (Chair)
• Executive Director, Finance and Contracts – PTA
• Executive Director Regional Services - DoT
• Appointed independent external member
• Executive Director, Office of the Director General - DoT (ex-officio)
The ARMC met three times in 2020-21, with additional meetings held for Committee members to consider the draft Internal Audit Plan, Internal Audit Charter and ARMC Terms of Reference.
Internal auditThe Internal Audit function operates under the approved Internal Audit Charter, providing an independent and objective assurance as well as consulting activity designed to add value and improve the operations of DoT. The Charter is aligned with the Treasurer’s Instructions and the latest advice from the Institute of Internal Auditors. The function enables DoT to accomplish its objectives by bringing a systematic and disciplined approach to evaluate and improve the effectiveness of risk management, controls, compliance and governance processes.
DoT’s internal audits were conducted by PwC and DoT’s Senior Internal Auditor, in accordance with the Financial Management Act 2006 and Institute of Internal Auditors International Standards for the Professional Practice of Internal Auditing.
The annual Internal Audit Plan is aligned with DoT’s strategic objectives and risks and with a focus on core functions and controls.
Internal audits conducted by DoT in 2020–21 included:
• Driver and Vehicle Services Agent Network Management
• Freight Industry Grant
• Maritime Property Lease Management
• On-demand COVID-19 Relief Payment for Eligible On-demand Booking Service
• Project Management
• Conflict of Interest Framework
• Crisis Management, Business Continuity Management and IT Disaster Recovery
• Delegations of Authority
• On-demand Transport Booking Services Safety Assurance
• Payroll Processing
• Penetration Testing (Internal)
• Pilot Exemption Application Assessment Process
• Westport Project Governance Follow-up
• Work Health and Safety Management
• Working from Home Governance Process in Response to COVID-19 Pandemic
Recommendations arising from internal audits are managed and monitored through DoT’s Audit Recommendation Management System. The implementation status of these recommendations is reported on a quarterly basis to the ARMC.
Risk managementDoT is committed to ensuring a comprehensive risk management process that meets the requirements of Treasurer’s Instruction 825 Risk Management and Security and is aligned to the international standard AS/NZS ISO 31000 Risk Management.
The Department’s structured risk management approach is integrated into management, planning and operational processes. This approach assists DoT in achieving its desired outcomes by providing a transparent process that identifies what is essential to success and demonstrates the decision–making process regarding the acceptance of risks.
DoT’s business continuity management program is an integral part of risk management, enabling the Department to effectively manage and respond to disruption risks that could impact its ability to deliver critical services.
Integrity frameworkDoT is strongly committed to upholding the highest standards of accountability and integrity with work underway to further strengthen and embed the Department’s integrity culture. In 2019-20, DoT established its inaugural Integrity Framework based on the Australian Standard Fraud and Corruption Control (AS 8001-2008).
Key achievements in 2020-21 included:
• The Portfolio Integrity Policy was updated in July 2020 to reflect our commitment to implementing the State Integrity Strategy for Public Authorities 2020-23. The Policy complements existing activities that embed our integrity culture.
• More than 800 employees from across the Transport Portfolio attended the inaugural Transport Portfolio Integrity Forum in November 2020. The Forum reminded employees of the importance of always operating within the Portfolio’s and each agency’s Governance and Integrity Frameworks, remaining vigilant and ensuring
maintenance of good systems, processes, and controls. The Forum included guest speakers from the Commonwealth Bank and the Corruption and Crime Commission.
• DoT’s Integrity Strategy Implementation Plan 2020-2023 was endorsed in November 2020. The Plan is aligned to the State Integrity Strategy 2020-2023 and includes proposed actions identified in DoT’s self-assessment using the PSC Integrity Snapshot tool. Implementation of the plan will be reported six-monthly to Corporate Executive.
• DoT’s Integrity Committee was established in March 2021 to further strengthen and embed the Department’s integrity culture, oversee the implementation of the Integrity Strategy Implementation Plan 2020-2023, and develop new strategies to enhance integrity. The committee meets quarterly and ensures oversight mechanisms are established for integrity initiatives.
• DoT’s Integrity Framework was updated in May 2021 to include new initiatives. The Framework aims to promote integrity and minimise the potential for incidents of fraud and corruption related to the Department’s business processes, programs and systems.
A new Integrity online training module has been developed for all staff, expected to launch in July 2021. Compulsory for all DoT employees, the training is designed to raise awareness of employees’ responsibility to always act in the best interests of the WA community and our State and how they can contribute to strengthening and embedding the integrity culture at DoT.
ANNUAL REPORT 2020-21 PAGE 215PAGE 214 DEPARTMENT OF TRANSPORT
Disclosures and Legal ComplianceDisclosures and Legal Compliance
WA Multicultural Policy FrameworkDoT is committed to continuing to improve access and opportunities, including employment, for people from culturally and linguistically diverse backgrounds.
Following the launch of the WA Multicultural Policy Framework in early 2020, DoT developed its inaugural Multicultural Plan 2021-23. The Plan aims to improve services, opportunities and outcomes for people from culturally and linguistically diverse backgrounds. Actions have been developed in consultation with customers, stakeholders and employees for each of the WA Multicultural Policy Framework priority areas:
• Harmonious and inclusive communities;
• Culturally responsive polices, programs and services; and
• Economic, social cultural, civic, and political participation.
The Plan is supported by a detailed implementation plan that will be monitored by DoT’s Access and Inclusion Committee. Progress against the Plan will be reported through our annual report, and achievements will be highlighted three times a year in the Access and Inclusion Communiqué published on DoT’s website and intranet.
The plan has been submitted to the Minister for Citizenship and Multicultural Interests while positive feedback has been received from the Office of Multicultural Interests. DoT will continue to implement strategies to improve access to information, services and facilities for people with different needs.
Occupational safety, health and injury managementCommitment to workplace health, safety and injury management
DoT is committed to achieving a standard of excellence in occupational safety, health and injury management, adhering to its corporate legislative responsibility to provide a safe and healthy work environment for all staff, contractors, customers and visitors. The Department’s dedication to building a values-driven culture aims to empower all employees to place a high level of importance on safety beliefs, values and attitudes to enable a culture where safety practices are considered business as usual.
DoT’s Corporate Workplace Health and Safety (WHS) Management Committee recommends WHS initiatives, policies and strategies to the Corporate Executive team (CorpEx). The Corporate WHS Management Committee is comprised of members from CorpEx and People and Culture’s WHS team.
In readiness for the new WHS legislation, DoT audited its safety management system to ensure alignment with relevant health and safety management system specifications (including the AS/NZS ISO 45001:2018), its core principles of relevant WHS legislation and Department’s risk profile. The WHS Team partners with DoT business units to promote safety and build the capability of line managers to actively manage safety for their teams.
DoT has an established injury management (IM) program, detailing the steps taken to assist injured employees to return to work as soon as medically appropriate. DoT’s IM procedure complies with the Workers’ Compensation and Injury Management Act 1981 and the Code of Practice (Injury Management) 2005.
Formal mechanism for consultation with employees on workplace health, safety and injury management matters
Employees can access WHS and IM information through DoT’s WHS Management System. WHS and IM information is widely communicated to employees and people managers during their induction. WHS information is also provided through DoT’s three WHS Subcommittees below, each chaired by an Executive Director of the relevant business unit/s:
• Maritime and Regional Services WHS Subcommittee;
• Driver and Vehicles Services WHS Subcommittee; and
• 140 William Street, Business Information Systems and On-demand Transport WHS Subcommittee.
The three WHS Subcommittees meet quarterly to discuss matters relating to workplace issues that affect the health and welfare of employees. The agenda and minutes for each WHS Subcommittee and Corporate WHS Management Committee meetings are displayed on dedicated WHS noticeboards and via the DoT WHS virtual noticeboard on the intranet.
The safety and health representatives, in consultation with management, are responsible for updating the noticeboards. The effectiveness of the WHS Committee meetings is measured by member attendance rates and other KPIs reported to CorpEx.
At these various committee meetings, DoT discussed and resolved issues raised by employees, reviewed accident and incident forms to ensure that hazards were addressed to eliminate or reduce future issues, discussed injury trends and identified preventative measures that promote a safe working environment.
Compliance with the injury management requirements of the Workers’ Compensation and Injury Management Act 1981, including the development of return-to-work plans
DoT has a strong focus on early intervention and return to work. People Managers are trained in the importance of good injury management and return to work procedures, with the purpose of promoting a supportive, productive and positive workplace.
DoT has a dedicated Workforce Advisory Team, comprising of three Workforce Management Advisors who manage workers’ compensation claims and support the management of non-work-related injury management issues.
As of 30 June 2021, DoT has nine open workers’ compensation claims, of which all claimants (100%) were back at work.
Assessment of Workplace health and safety management system
The DoT WHS Management System was audited in December 2020 by Price Waterhouse Coopers (PWC), utilising both the AS 4801 and ISO 45001 Audit Tools. PWC identified the following recommendations for improvement:
• Implementation of efficient contractor management practices.
• Review WHS resources to enable the new WHS legislation and compliance with the new ISO 450001 standard.
• Development of a transition plan to implement the new WHS legislation.
• Align safety management system from AS 4801 to the new ISO 450001 standard.
ANNUAL REPORT 2020-21 PAGE 217PAGE 216 DEPARTMENT OF TRANSPORT
Disclosures and Legal ComplianceDisclosures and Legal Compliance
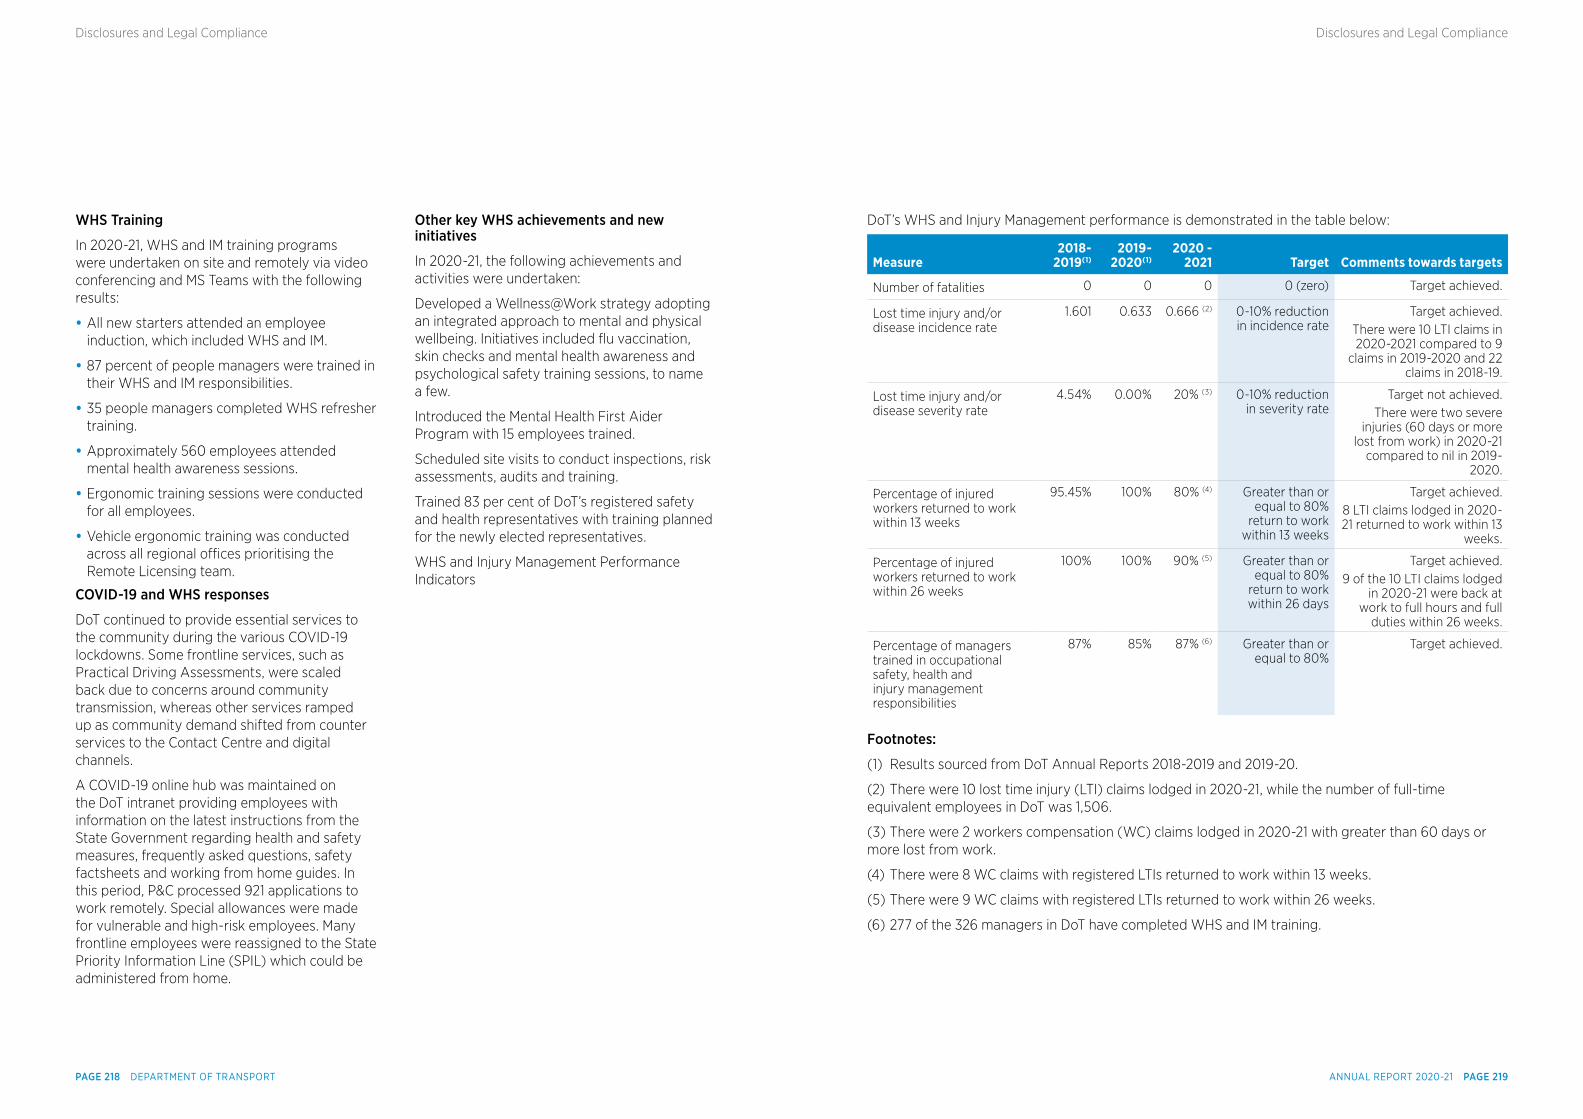
WHS Training
In 2020-21, WHS and IM training programs were undertaken on site and remotely via video conferencing and MS Teams with the following results:
• All new starters attended an employee induction, which included WHS and IM.
• 87 percent of people managers were trained in their WHS and IM responsibilities.
• 35 people managers completed WHS refresher training.
• Approximately 560 employees attended mental health awareness sessions.
• Ergonomic training sessions were conducted for all employees.
• Vehicle ergonomic training was conducted across all regional offices prioritising the Remote Licensing team.
COVID-19 and WHS responses
DoT continued to provide essential services to the community during the various COVID-19 lockdowns. Some frontline services, such as Practical Driving Assessments, were scaled back due to concerns around community transmission, whereas other services ramped up as community demand shifted from counter services to the Contact Centre and digital channels.
A COVID-19 online hub was maintained on the DoT intranet providing employees with information on the latest instructions from the State Government regarding health and safety measures, frequently asked questions, safety factsheets and working from home guides. In this period, P&C processed 921 applications to work remotely. Special allowances were made for vulnerable and high-risk employees. Many frontline employees were reassigned to the State Priority Information Line (SPIL) which could be administered from home.
Other key WHS achievements and new initiatives
In 2020-21, the following achievements and activities were undertaken:
Developed a Wellness@Work strategy adopting an integrated approach to mental and physical wellbeing. Initiatives included flu vaccination, skin checks and mental health awareness and psychological safety training sessions, to name a few.
Introduced the Mental Health First Aider Program with 15 employees trained.
Scheduled site visits to conduct inspections, risk assessments, audits and training.
Trained 83 per cent of DoT’s registered safety and health representatives with training planned for the newly elected representatives.
WHS and Injury Management Performance Indicators
DoT’s WHS and Injury Management performance is demonstrated in the table below:
Measure2018-
2019(1)2019-
2020(1)2020 -
2021 Target Comments towards targets
Number of fatalities 0 0 0 0 (zero) Target achieved.
Lost time injury and/or disease incidence rate
1.601 0.633 0.666 (2) 0-10% reduction in incidence rate
Target achieved.There were 10 LTI claims in 2020-2021 compared to 9
claims in 2019-2020 and 22 claims in 2018-19.
Lost time injury and/or disease severity rate
4.54% 0.00% 20% (3) 0-10% reduction in severity rate
Target not achieved.There were two severe
injuries (60 days or more lost from work) in 2020-21
compared to nil in 2019-2020.
Percentage of injured workers returned to work within 13 weeks
95.45% 100% 80% (4) Greater than or equal to 80%
return to work within 13 weeks
Target achieved.8 LTI claims lodged in 2020-21 returned to work within 13
weeks.
Percentage of injured workers returned to work within 26 weeks
100% 100% 90% (5) Greater than or equal to 80%
return to work within 26 days
Target achieved.9 of the 10 LTI claims lodged
in 2020-21 were back at work to full hours and full
duties within 26 weeks.
Percentage of managers trained in occupational safety, health and injury management responsibilities
87% 85% 87% (6) Greater than or equal to 80%
Target achieved.
Footnotes:
(1) Results sourced from DoT Annual Reports 2018-2019 and 2019-20.
(2) There were 10 lost time injury (LTI) claims lodged in 2020-21, while the number of full-time equivalent employees in DoT was 1,506.
(3) There were 2 workers compensation (WC) claims lodged in 2020-21 with greater than 60 days or more lost from work.
(4) There were 8 WC claims with registered LTIs returned to work within 13 weeks.
(5) There were 9 WC claims with registered LTIs returned to work within 26 weeks.
(6) 277 of the 326 managers in DoT have completed WHS and IM training.
ANNUAL REPORT 2020-21 PAGE 219PAGE 218 DEPARTMENT OF TRANSPORT
Disclosures and Legal ComplianceDisclosures and Legal Compliance
© State Government of Western Australia
PUBLISHED BY
Department of Transport
140 William Street Perth Western Australia 6000
October 2021
www.transport.wa.gov.au
Phone: (08) 6551 6000
Fax: (08) 6551 6001Disclaimer: The information contained in this publication is provided in good faith and believed to be accurate at time of publication. The State shall in no way be liable for any loss sustained or incurred by anyone relying on the information.