Embed Size (px)
Citation preview
DEPARTMENT OF THE INTERIOR
U.S. GEOLOGICAL SURVEY
Stability of Slopes Below the Sherwood Uranium Mine, Spokane Indian Reservation, Northeastern Washington
by
Alan F. Chleborad and Robert L. Schuster
Open File Report 84-627
This report is preliminary and has not been reviewed for conformity with U.S Geological Survey editorial standards and stratigraphic nomenclature.
1984
CONTENTS
Page
Introduction*......................................................... 1Acknowledgments....................................................... 1Previous studies of slope failures along the shore of
Franklin D. Roosevelt Lake.......................................... 5Physiographic and geologic settings................................... 10Site conditions....................................................... 13
Results of surface investigations................................ 13Slopes areas distinguished on the basis of bedrockmapping................................................... 13
Outcrop studies of surficial deposits....................... 13Landslide deposits, terraces, and alluvial fans............. 18
Results of subsurface investigations............................. 20Seismic-refraction survey................................... 20Drilling results............................................ 25
Cross sections of slope areas II, IV, VI......................... 25Laboratory test data.................................................. 28
Sand deposits.................................................... 28Clay deposits.................................................... 28
Slope stability analyses.............................................. 34Methods.......................................................... 34Results.......................................................... 40
Slope area II............................................... 40Slope area IV............................................... 40Slope area VI............................................... 47
Discussion and Recommendations........................................ 47Slope stability.................................................. 47Surface run-off and erosion...................................... 50
References............................................................ 51
ILLUSTRATIONS
PLATE 1. Geologic map of the study area............................In pocketFIGURE 1. Index map showing the location of the Sherwood Uranium
Mine and landslide areas along the banks of the SpokaneRiver Arm of Franklin D. Roosevelt Lake.................. 2
2. Photograph of Sherwood Mine................................ 33. Photograph of part of Spokane River Arm below Sherwood
Mine..................................................... 44. Cross section of lake bank below Sherwood Mine............. 75. Photograph of Jackson Springs slide........................ 96v Map of Cordllleran ice sheet and glacial lakes in
northeast Washington and adjacent areas.................. 117. Air photo showing locations of slope areas III, IV, V,
and VI................................................... 147a. Air photo showing locations of slope areas I and II........ 158. Air photo showing locations of linear zones of vegetation*. 179. Photograph of recently formed alluvial fan................. 19
10. Air photo showing locations of seismic lines and drillholes in slope areas I and II............................ 21
ILLUSTRATIONS Continued
Page
FIGURE lOa. Air photo showing locations of seismic lines and drillholes in slope areas III, IV, V, and VI................... 22
11. Sample seismic-survey time-distance graphs................ 2312. Subsurface profiles for slopes below the-Sherwood Mine.... 2413. Auger-hole logs........................................... 2614. Cross sections of selected slope areas.................... 2715. Typical particle-size curve for sand samples.............. 3016. Plasticity chart comparing light and dark varve layers.... 3317. Typical direct-shear test plots........................... 3618. Typical ring-shear test plots............................. 3719. Consolidation test results for varved clay sample......... 3820. Idealized cross section of slope area II showing
locations of trial failure surfaces....................... 4121. Idealized cross section of slope area IV showing
locations of trial failure surfaces....................... 4222. Idealized cross section of slope area VI showing
locations of trial failure surfaces....................... 43
Tables
Page
Table 1. Laboratory test results on cohesionless samples............. 292. Physical properties and clay mineralogy of cohesive
samples................................................... 313. Laboratory shear-strength test results...................... 354. Material properties used in stability analyses.............. 445. Results of stability analyses for slope area II............. 456. Results of stability analyses for slope area IV............. 467. Results of stability analyses for slope area VI............. 48
ii
STABILITY OF SLOPES BELOW THE SHERWOOD URANIUM MINE, SPOKANE INDIAN RESERVATION, NORTHEASTERN WASHINGTON
By Alan F. Chleborad and Robert L. Schuster
INTRODUCTION
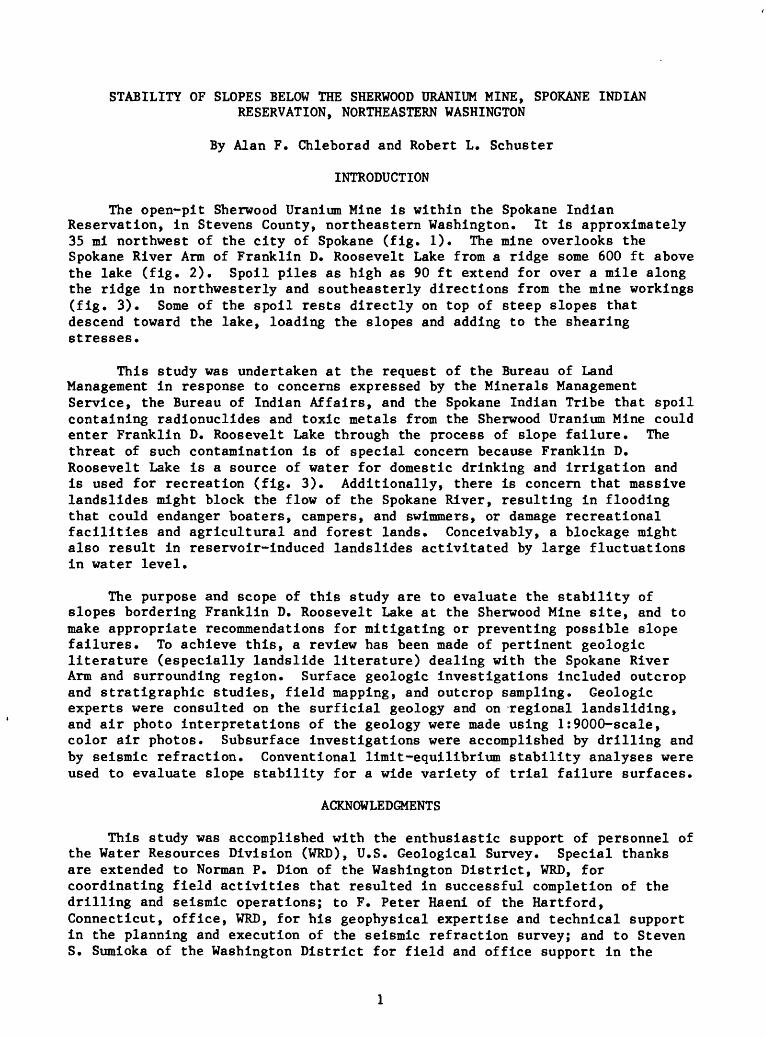
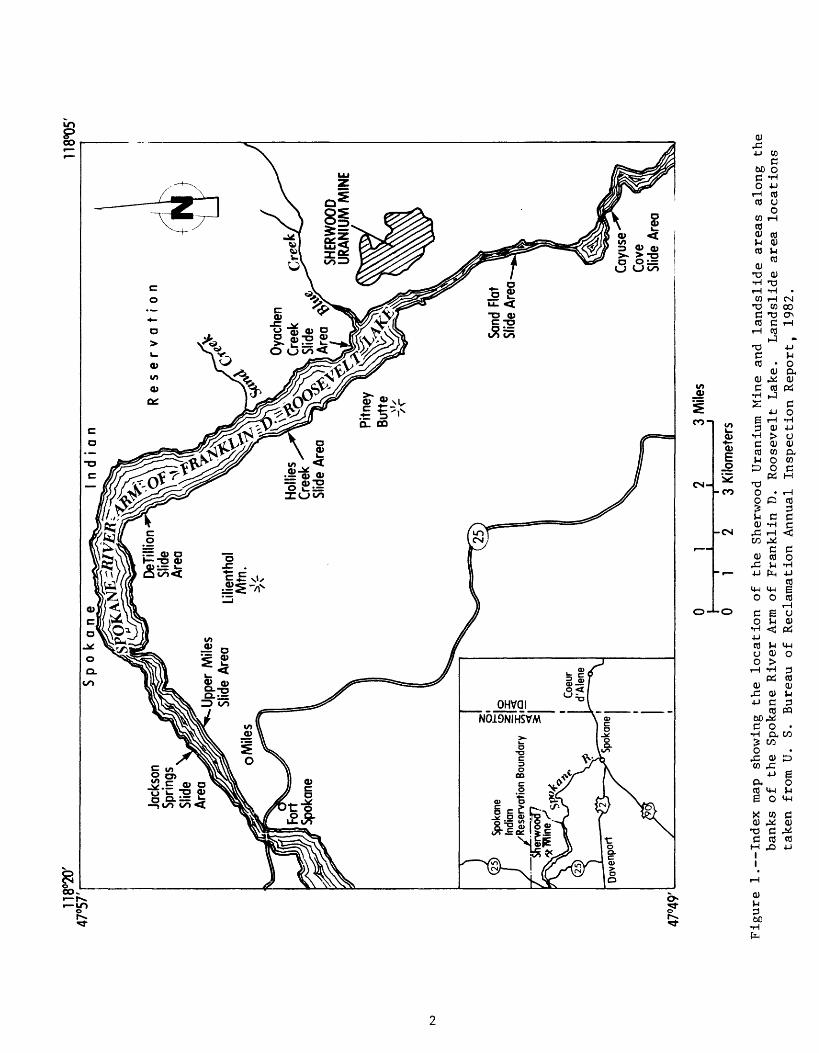
The open-pit Sherwood Uranium Mine is within the Spokane Indian Reservation, in Stevens County, northeastern Washington. It is approximately 35 mi northwest of the city of Spokane (fig. 1). The mine overlooks the Spokane River Arm of Franklin D. Roosevelt Lake from a ridge some 600 ft above the lake (fig. 2). Spoil piles as high as 90 ft extend for over a mile along the ridge in northwesterly and southeasterly directions from the mine workings (fig. 3). Some of the spoil rests directly on top of steep slopes that descend toward the lake, loading the slopes and adding to the shearing stresses.
This study was undertaken at the request of the Bureau of Land Management in response to concerns expressed by the Minerals Management Service, the Bureau of Indian Affairs, and the Spokane Indian Tribe that spoil containing radionuclides and toxic metals from the Sherwood Uranium Mine could enter Franklin D. Roosevelt Lake through the process of slope failure. The threat of such contamination is of special concern because Franklin D. Roosevelt Lake is a source of water for domestic drinking and irrigation and is used for recreation (fig. 3). Additionally, there is concern that massive landslides might block the flow of the Spokane River, resulting in flooding that could endanger boaters, campers, and swimmers, or damage recreational facilities and agricultural and forest lands. Conceivably, a blockage might also result in reservoir-induced landslides activitated by large fluctuations in water level.
The purpose and scope of this study are to evaluate the stability of slopes bordering Franklin D. Roosevelt Lake at the Sherwood Mine site, and to make appropriate recommendations for mitigating or preventing possible slope failures. To achieve this, a review has been made of pertinent geologic literature (especially landslide literature) dealing with the Spokane River Arm and surrounding region. Surface geologic investigations included outcrop and stratigraphic studies, field mapping, and outcrop sampling. Geologic experts were consulted on the surficial geology and on regional landsliding, and air photo interpretations of the geology were made using l:9000-scale, color air photos. Subsurface investigations were accomplished by drilling and by seismic refraction. Conventional limit-equilibrium stability analyses were used to evaluate slope stability for a wide variety of trial failure surfaces.
ACKNOWLEDGMENTS
This study was accomplished with the enthusiastic support of personnel of the Water Resources Division (WRD), U.S. Geological Survey. Special thanks are extended to Norman P. Dion of the Washington District, WRD, for coordinating field activities that resulted in successful completion of the drilling and seismic operations; to F. Peter Haeni of the Hartford, Connecticut, office, WRD, for his geophysical expertise and technical support in the planning and execution of the seismic refraction survey; and to Steven S. Sumioka of the Washington District for field and office support in the
118°
20'
47°5
7'11
8°05
'
47°4
9'
S p
o k
a n
e
Reserv
ation
Jack
son
Sprin
gsSl
ide
Are
aU
pper
Mile
sSl
ide
Are
a Li
lient
hal
Oya
chen
Cree
k C
reek
Slid
eAr
ea
Hol
lies
Cre
ek
Slid
e Ar
eaSH
ERW
OO
D U
RAN
IUM
MIN
E
Pitn
ey
i^S
?
5)
Spok
ane
§L
Indi
an
\<
.1
yR
eser
vatio
n Bo
unda
ry
I5i9
Sand
Fla
t Sl
ide
Area
Cay
use
Cov
e Sl
ide
Area
3 M
iles
01
3 K
ilom
eter
s
Fig
ure
1
. In
dex m
ap
show
ing
the lo
cati
on
of
the
She
rwoo
d U
rani
um
Min
e an
d la
ndsl
ide are
as
alo
ng
th
e b
ank
s of
the
Spo
kane
R
iver
A
rm of
Fra
nk
lin
D
. R
oose
vel
t L
ake.
L
andsl
ide
are
a lo
cati
on
s ta
ken
fr
om U
. S
. B
urea
u o
f R
ecla
mat
ion
A
nnua
l In
specti
on R
eport
, 19
82.
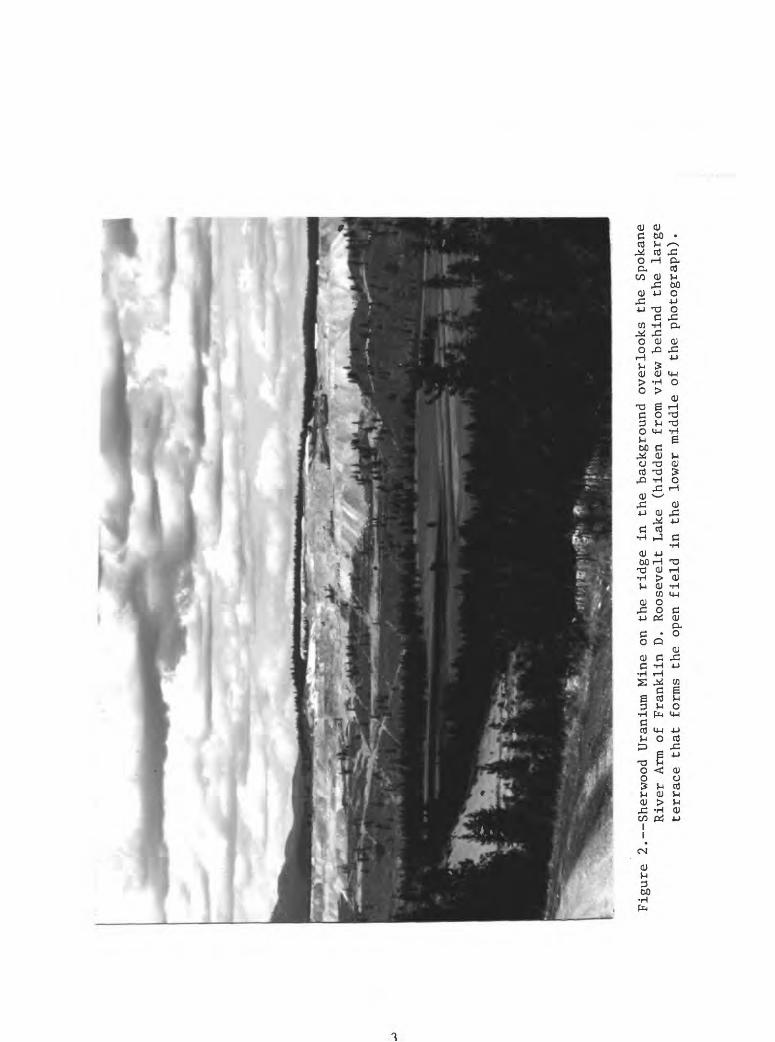
Figure 2. Sherwood Uranium
Mine on the
ridge
in th
e background overlooks
the
Spokane
Rive
r Arm
of Franklin D. Roosevelt
Lake (hidden
from view behind the
large
terrace
that
fo
rms
the
open
field
in the
lowe
r middle of the
phot
ogra
ph).
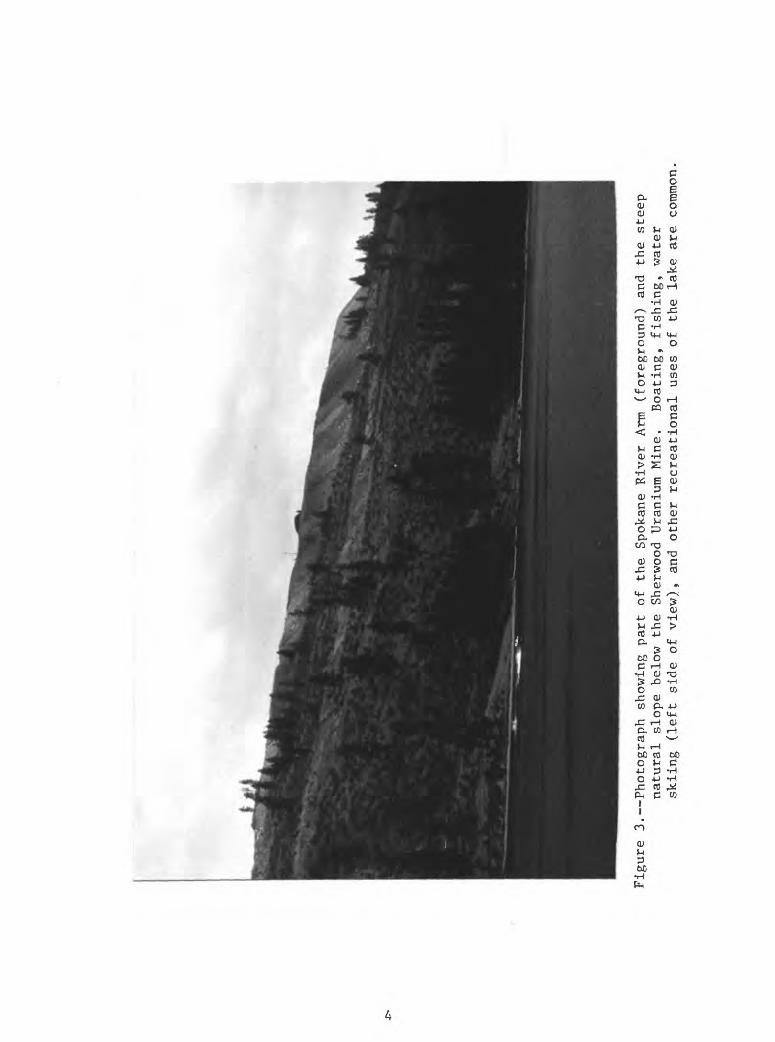
Figu
re 3. Photograph showing
part of th
e Spokane
River
Arm
(for
eground) and
the
steep
natural
slop
e below
the
Sherwood Uranium Mine.
Boating, fishing, water
skii
ng (l
eft
side
of vi
ew),
and
othe
r re
crea
tion
al us
es of
th
e lake are
comm
on
compilation and reduction of seismic data, and the acquisition of computer solutions to refraction survey problems. Personnel from the Washington District's Spokane office generously supplied equipment and field and administrative support. Raymond R. Smith of that office was particularly helpful in various phases of the field geologic investigations.
We thank the Spokane Indian Tribe and Western Nuclear Corporation for granting access to the mine area. Their willing cooperation was essential for the safe and timely performance of project field work. James V. LeBret, geologist with the Bureau of Indian Affairs, brought attention to the need for the study and was especially helpful in providing maps, air photos, and other information needed for the planning and initiation of various project activities. Useful information on recent landslides along the shore of the Spokane River Arm was obtained from annual inspection reports provided by the U.S. Bureau of Reclamation (1966-82), and by a reconnaissance boat trip on the Spokane River Arm conducted by Kayti Didricksen, geologist for the U.S. Bureau of Reclamation (U.S.B.R.). Professors Eugene P. Kiver and Dale F. Stradling of Eastern Washington University, who are presently engaged in a geologic study of the Franklin D. Roosevelt Lake region for the U.S.B.R., were consulted at the field site on the surficial geology of the area. William K. Smith of the U.S.G.S, Branch of Engineering Geology and Tectonics, patiently provided computer applications support for selected slope stability problems involving the Morgenstern-Price method of analysis. We are grateful to all of the above for their contribution to the study.
PREVIOUS STUDIES OF SLOPE FAILURES ALONG THE SHORE OF FRANKLIN D. ROOSEVELT LAKE
Full reservoir level of Franklin D. Roosevelt Lake was attained in 1942 with the completion of Grand Coulee Dam in north central Washington. Numerous slope failures in Pleistocene surficial deposits were activated by overburden excavation for the dam and by the filling of the reservoir. Walker and Irwin (1954) describe severe engineering problems encountered during the construction of the dam and related reservoir structures. Landslide-prone lacustrine varved clays were identified as a primary cause of many of the problems. Laboratory strength tests on the clays revealed an approximate three-fold reduction in strength from the undisturbed to the disturbed or reworked condition, and samples from areas loaded by glacial ice or near the valley wall often contained shear surfaces that resulted in low-strength test results. Also, examination of exposures in excavations and recent slides revealed distortion of varves (laminated clay layers), old slip surfaces, and other evidence of ancient landsliding. Recent slides exhibiting translational movements were observed to have slip surfaces with thin zones (5-15 in. thick) of sheared clay and silt. Sand and gravel deposits, it was found, acted chiefly as sources of weight or "dead load", and as conveyors of water to the silt and clay beds. Based on experience, Walker and Irwin developed the following "rule-of-thumb" for stability of cuts, 40-50 ft high or higher, in varved clays: limit slope steepness to not greater than 4:1, if dry, and not steeper than 5:1, if the ground-water level is high or a portion of the base of the cut is below reservoir level. Where disturbed materials are involved, reductions in steepness to 5:1 and 6:1, respectively, were indicated for stability.
A comprehensive study of landslldlng along the upper 200 miles of the Columbia River valley, including the shores of Franklin D. Roosevelt Lake, was conducted by Jones and others (1961). Their report describes the many slope failures in Pleistocene surflcial deposits bordering the lake. These failures primarily involve terrace landforms underlain by sand, siltr, clay, and gravel. Four principal types of landslides are identified:
(1) Slump-earthflow landslides that combine the processes of sliding and flow. These constitute the most frequent type of slope failure in the area. In fine-grained, almost horizontally bedded, materials, the surface of rupture Is described as cutting steeply from the surface to a bedding plane which it then follows back to the ground surface.
(2) Multiple-alcove landslides which, in general, form in fine-grained materials, and create large basin-like features by the repeated processes of sliding, flow, and fall.
(3) Slip-off slope landslides that most commonly occur in sand and gravel and combine the processes of sliding, fall, and flow.
(4) Mudflows, which are described as rapid failures in which the mass of material moves as a thick fluid. Mudflows are the least common of the four types.
According to the report, many of the recent landslides occurred as the reservoir was filled or as a result of drawdowns necessitated by power demands at Grand Coulee Dam. Along the Spokane River Arm, Jones and others (1961) identified 17 recent (post-reservoir) slump-earthflows, 9 slip-off slope failures, 5 ancient slump-earthflows, 2 ancient multiple-alcove slides, and 3 off-bedrock landslides (those with a surface of rupture that follows the contact between surficial deposits and bedrock).
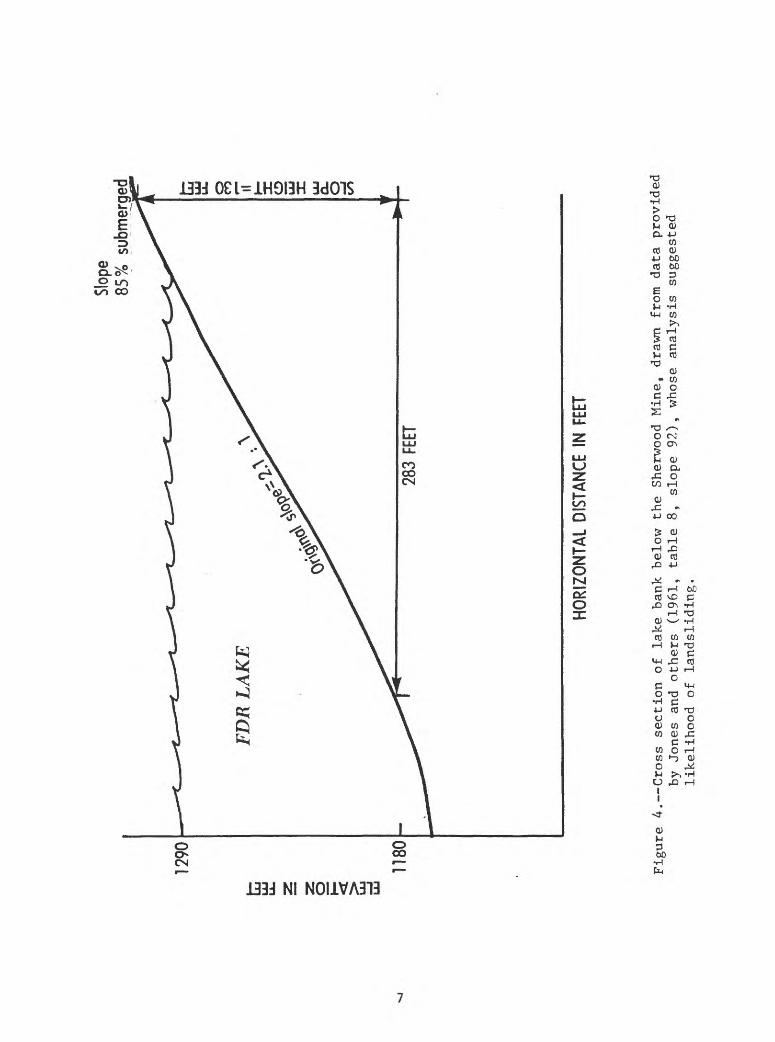
During their investigation, Jones and others collected data on more than 300 landslides from the total study area. The landslides were classified into type groups and data were collected on the classification factors: material, ground-water conditions, terrace height, drainage, original slope, percentage slope submergence, culture, and material removed. Statistical methods, chi- square tests, multiple regression, and discriminant-function analyses were then used to develop a formula for predicting the stability of natural slopes using the following classification factors: original slope, submergence percentage, terrace height, and ground-water conditions. The predictions thus derived were meant to assist geologists and engineers in evaluating slope stability and in estimating the probable extent of landsliding. The authors combined the data of 160 recent slump-earthflow landslides with data for 160 slopes in which there were no landslides, and used the discriminant-function method to develop an equation predicting which slopes are likely to fall and which are not. A section of lake bank in a slope area below the Sherwood Mine was among those analyzed for stability. A cross section of the slope developed from Information given by Jones and others (1961, p. 90) is shown in figure 4. The analysis indicates that the slope, which is 85 percent submerged in Franklin D. Roosevelt Lake at its highest level, is likely to be affected by landsliding.
1290
< 2:
1180
Slop
e85
%
subm
erge
d
HO
RIZ
ON
TAL
DIST
ANCE
IN
FEET
Figure A. Cross se
ction
of la
ke bank below
the
Sher
wood
Mi
ne,
drawn
from
data pr
ovid
ed
by Jo
nes
and
othe
rs (1961, ta
ble
8, sl
ope
92),
whose
anal
ysis
suggested
like
liho
od of landsliding.
Since 1966, personnel of the U.S.B.R. have maintained surveillance of landslide areas located along the shores of Franklin D. Roosevelt Lake, and have prepared annual inspection reports providing information on landslide sizes, locations, types of activity, dates of occurrence and related geologic and hydrologic data. Their 1982 annual inspection report identifies 30 landslide areas along the Spokane River Arm, 23 of which have been active within the last 10 years. A notable recent landslide, in terms of size, is the Jackson Springs landslide, 8 mi northwest of the Sherwood Mine (figs. 1 and 5). This massive failure in March 1969 blocked the Spokane River channel for 36 hrs, and had an estimated volume of over 14 million yds (U.S. Bureau of Reclamation, 1969). The slope consisted of alternating beds of clay, silt, and sand, capped by as much as 150-ft of sand and gravel. The landslide occurred during a period of extreme drawdown necessitated by excavation for a forebay dam preliminary to the construction of the Third Powerplant at Grand Coulee Dam. Two landslide areas, which have shown activity within the last 10 years and are much closer to the mine, are the Oyachen Creek and the Sand Flats slide areas (fig. 1). The following descriptions are adapted excerpts from p. 31 and 32 of the 1982 USER Annual Inspection Report:
Oyachen Creek Area: Banks composed of lacustrine sand, silt, and clay. Crest of slump scarp varies from elevation 1260 to 1320 along 0.3 mi of lake bank. Ground water present in slope at elevation 1225 to 1250. Renewed slumping occurred during 1982. One slump approximately 250 ft wide had 8 ft vertical displacement and top scarp at about elevation 1285. It appears to have slumped when reservoir level was about elevation 1230 according to shoreline (wave-cut) continuity. Three smaller slumps (15 to 30 ft wide with 1.5 ft displacement) occurred upstream 60 to 150 ft from the larger slump.
Sand Flats Area: Banks approximately 100 ft high composed of alternating beds of lacustrine clay, silt, and, sand disturbed by landsliding. Glacial till noted along northwestern end of slide area. Ground water below midpoint in banks. Reservoir depth 80 ft at a distance of 150 ft from shore. Five small slumps occurred in 1982 at elevation 1212 to 1255. The slumps are 10 to 20 ft long and had about 1 ft of vertical displacement. Minor sand runs above elevation 1290.
The U.S.B.R. has also collected field data in selected areas along Franklin D. Roosevelt Lake for use in slope stability studies using the statistical methods of Jones and others previously described (U.S. Bureau of Reclamation Annual, 1982).
The record of landslide activity along the shore of Franklin D. Roosevelt Lake has been summarized by Schuster (1979) in a report on reservoir-induced landslides. That report pointed out that damages due to individual slides have not been economically serious, and that slides have not attained sufficient velocities to produce large and far-reaching surges in the reservoir. It also pointed out that even though landslide activity began to taper off in the years 1976-1977, tlie slopes have not reached equilibrium, and that wet seasons combined with a continuing annual drawdown on the order of 60 ft undoubtedly will result in continued landslide activity.
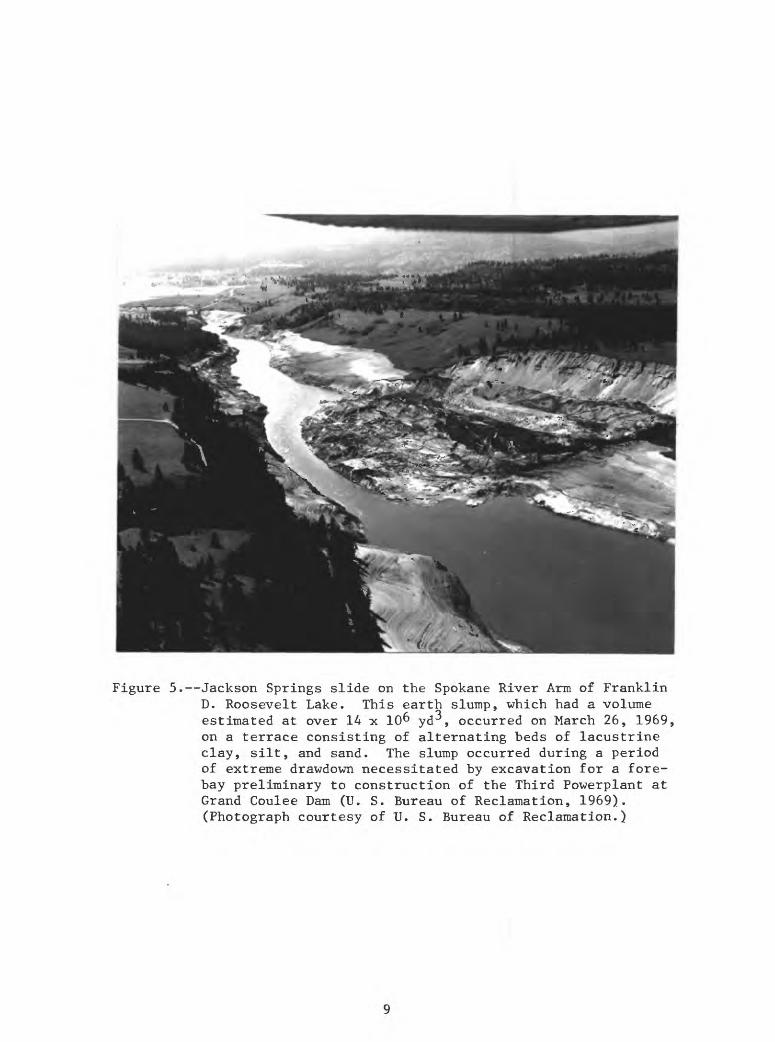
Figure 5. Jackson Springs slide on the Spokane River Arm of Franklin D. Roosevelt Lake. This earth slump, which had a volume estimated at over 14 x 10^ yd , occurred on March 26, 1969, on a terrace consisting of alternating beds of lacustrine clay, silt, and sand. The slump occurred during a period of extreme drawdown necessitated by excavation for a fore- bay preliminary to construction of the Third Powerplant at Grand Coulee Dam (U. S. Bureau of Reclamation, 1969). (Photograph courtesy of U. S. Bureau of Reclamation.)
PHYSIOGRAPHIC AND GEOLOGIC SETTINGS
The Sherwood Mine is located at the southern margin of an extensive region of mountainous highlands that lie north of the Columbia Plateau. The Spokane River valley, which can be considered the northeastern boundary between the highlands and the plateau, follows the northwest-trending Spokane River valley-Enterprise valley structural lineament across most of the Turtle Lake quadrangle. The valley then turns west to the confluence of the pre- reservoir Spokane and Columbia Rivers. Streams emanating from nearby mountains, north and northeast of the mine, flow in northeast-southwest trending valleys to their eventual destination in the Spokane River Arm. Blue Creek, a small stream which bounds the area of this study on the northwest (fig. 1), has continuous flow throughout the year. Elevations range from 1290 ft above sea level at the lake to over 3000 ft in the mountainous areas a few miles north of the mine. The mine elevation is approximately 2000 ft above sea level.
The climate of the region is semi-arid. Snow is the common form of precipitation in the winter, rain in late spring and early fall, and occasional thunderstorms in the summer. Precipitation records for the Wellpinit weather station, a few miles from the mine site, indicate a precipitation norm of 17 in. per year for the period 1924 to 1948 (U. S. Department of Commerce, 1949 (the latest available for that station)).
The geology of the Sherwood Mine and the surrounding area has been described by Becraft and Weis (1963), in a detailed report on the geology and mineral deposits of the Turtle Lake quadrangle. The following information is taken largely from that report.
Bedrock in the area consists of Cretaceous quartz monzonite and overlying, gently dipping, pyroclastic and sedimentary rocks of Tertiary age. The quartz monzonite is part of the Loon Lake Granite group, which intrudes Precambrian and Paleozoic rocks. The Tertiary rocks, excluding the Columbia River basalt, are part of the Sanpoil Volcanics (called "the Gerome Andesite and equivalent rocks" by Weaver (1920) and Becraft and Weis (1963)) which are widely distributed throughout northeastern Washington (Pearson and Obradovich, 1977). In the area of the mine, these rocks consist of tuff, tuffaceous sandstone, arkose, carbonaceous shale, and conglomerate.
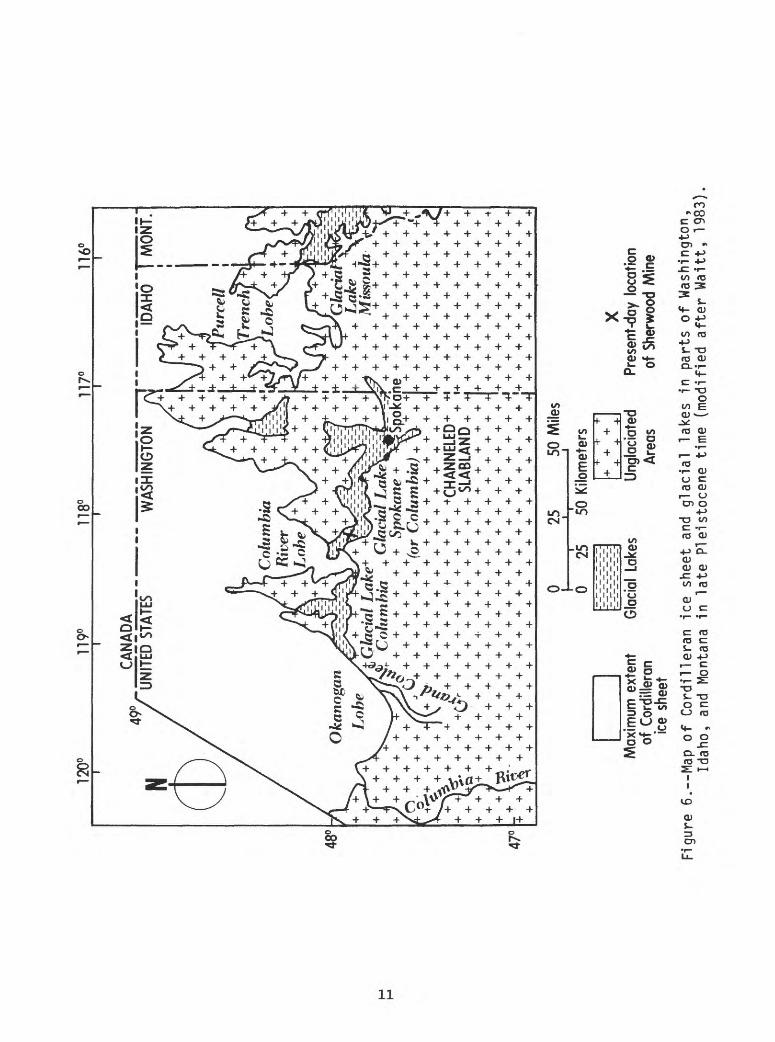
Thick deposits of glacio-lacustrine and glacio-fluvial sand, silt, gravel, and clay cover much of the bedrock along the Spokane River valley. These deposits are best described in terms of the glacial history of the region. During the Pleistocene, ice lobes of the Cordilleran continental glacier, following north-south trending valleys, pushed far into eastern Washington, Idaho, and western Montana (Richmond and others, 1965). In late Pleistocene time, several of the lobes are believed to have blocked the flow of major rivers, creating huge glacial lakes (fig. 6). Glacial Lake Missoula in western Montana, the largest of these lakes, resulted from the damming of the Clark Fork River, and is believed to have contained as much as 500 cubic miles of water (Pardee, 1942). Similarly, glacial Lake Columbia in eastern Washington was created when the Okanogan ice lobe blocked the flow of the Columbia River at Grand Coulee, impounding water in the Columbia River valley, and possibly in the Spokane River valley as well. Also, a glacial lake may have formed more than once in the Spokane River valley due to blockage of the
10
120°
48C
47
+ r +
%lP
nrr
e//
\
+ +
Mks
oula
V
one
+ *?
Spok
ahe
+ +
+ +
+ +
+ +)
C
olum
bia)
^
+
+l +
+ +
+ +
+ +
+.+
\^ +
+ +
+ +
+& +
+ +
+ +
\ +
+ \ +
+ +
+ +
+ +
+SL
WLW
D+
+ ^
+ +
+ +
+ *
+ +
+ +
+ +
+ +
+ +
+
o _
Max
imum
ext
ent
of C
ordi
llera
nice
she
et
Gla
cial
Lak
esU
ngla
ciat
ed
Area
sPr
esen
t-day
loc
atio
n of
She
rwoo
d M
ine
Figu
re 6
.--M
ap of
Co
rdill
era
n
ice
sh
eet
and
gla
cia
l la
kes
in
pa
rts
of
Was
hing
ton,
Id
aho,
and
Mon
tana
in
la
te
Ple
isto
cene
time
(m
odifi
ed a
fte
r W
aitt,
1983
)
river at its mouth by the Columbia River glacier lobe, which advanced down the Columbia River valley from the north (Flint, 1936). A maximum lake level of 2480 ft, near the mouth of the Spokane River, is indicated by ice-rafted boulders, cobbles, and pebbles (Becraft and Weis, 1963). A later episode of ice damming resulted in another glacial lake that occupied the Spokane River valley but at a much lower level, possibly due to blockage by the Okanogan ice lobe at Grand Coulee.
Late in the Wisconsin glaciation, repeated sudden failures of the Lake Missoula ice dam released enormous volumes of water (Fardee, 1942; Baker, 1973), which are believed to include the flood waters hypothesized by Bretz (1923,1928) and Bretz and others (1956) to have swept southwestward across parts of eastern Washington forming the channeled scablands. Recent investigations by Waitt (1980a, 1980b, 1983) and Waitt and Thorson (1983) indicate that several tens of these catastrophic glacial lake outbursts (Jokulhlaups) occurred, and, as a result, several ice-dammed Pleistocene lakes in northern Idaho and northeastern Washington became periodically engorged by sediment from the floods. Typically, these deposits consist of flood-laid beds of sand, gravel, silt, and clay alternating with varved layers of lacustrine silt and clay deposited during periods between floods. This alternation of sediments of flood and non-flood origins, which apparently provide a record of at least 70 glacial-Lake-Columbia-engulfing Jokulhlaups, are documented by Atwater (1983). Glacial lakes that occupied the Spokane River valley during these floods were also inundated. At one point, floodwaters are believed to have raised the level of glacial Lake Columbia by 500 ft (Richmond and others, 1965). According to Flint (1936) a gradation of outwash valley fill from coarse to fine down the Spokane and Columbia River canyons is interrupted in a 15-mi segment that appears to include the slopes below the Sherwood Mine. He attributed the interruption to the influence of the Columbia River ice lobe. The segment is described as consisting of two stratigraphic zones: a lower zone consisting of laminated silt with interbedded zones of till and other glacial materials and an upper zone of sand and gravel. Flint also noted structural features such as "silt crumpled as by ice thrust" and interpreted these and other features as "a clear record of a deep lake whose silt bed was repeatedly overridden by the margin of an active glacier." He did not subscribe to the catastrophic flood hypothesis of Bretz, however, and much of the valley fill in the Spokane and Columbia River valleys interpreted by him as glacial outwash is now considered to be of flood origin (Atwater, 1983; Waitt, 1983). Erosion since the retreat of the glaciers has removed much of the valley fill and cut broad terraces at several levels, some of which have been modified by alluvial fans, eolian deposits, and landsliding. Deposits similar to the alternating flood-laid and varved lacustrine sediments described by Atwater (1983) are exposed in the slopes below the Sherwood Mine; these are described later in this report.
The major geologic structure in the study area is represented by the Spokane river valley-Enterprise valley lineament that extends across the Turtle Lake quadrangle in a northwesterly direction. The lineament is a 2-4 mi wide trough that may be the result of a major fault or fault zone. The Sanpoil Volcanics of the area are confined to this trough. Tn the Sherwood Uranium Mine, a north-trending, near-vertical fault displaces Sanpoil Volcanics about 300 ft, indicating that faulting continued after deposition of the pyroclastic rocks in Oligocene time. However, faulting of Pleistocene sediments was not observed during the present study, and to the knowledge of the authors has not been reported by others. Joints in the intrusive igneous rocks are generally widely spaced and random. Those in the Sanpoil Volcanics are irregular, closely spaced cooling joints.
12
SITE CONDITIONS
Results of surface investigations
The geology of the site was originally mapped by Becraft (Becraft and Weis, 1963), and presented at a scale of 1:62,500 in their study of the geology of the Turtle Lake quadrangle. To meet the needs of the present study, the site geology was re-mapped on airphotos at a scale of 1:9000 using information gathered from outcrop and topographic studies, as well as airphoto interpretation. This information was then transferred to a l:12,000-scale topographic base (see pi. 1).
Slope areas distinguished on the basis of bedrock mapping
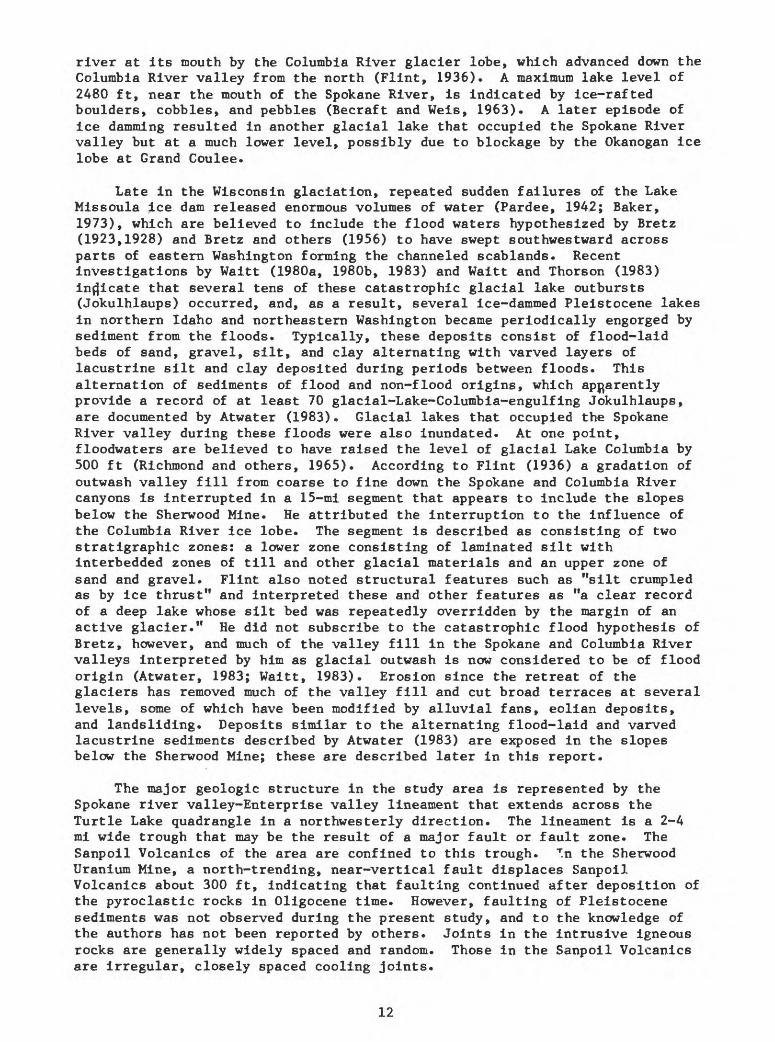
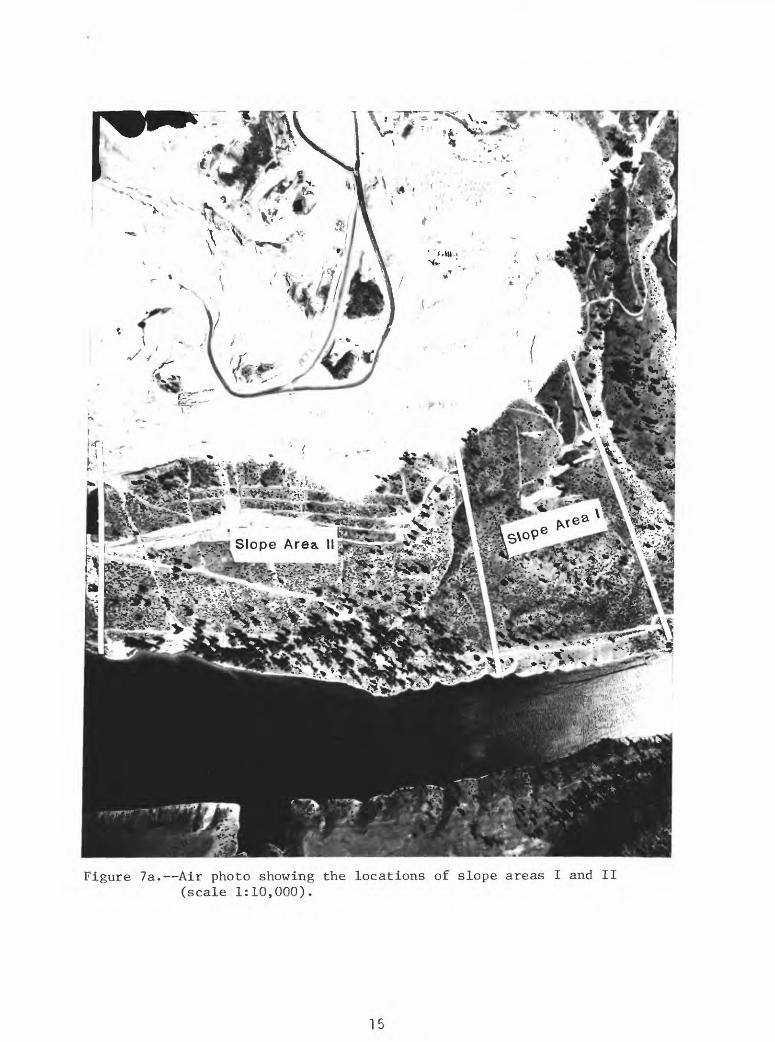
For the purpose of discussion and analysis, and on the basis of bedrock mapping, the stability of slopes below the mine has been categorized as either (1) bedrock-controlled, due to the existence of significant areas of bedrock at or near the surface, or (2) dependent on the strength properties of existing surficial deposits, where significant areas of bedrock are not present. Slope areas I, III, and V (figs. 7, and 7a) are predominantly bedrock areas (pi. 1) where slope stability is likely to be controlled by the relatively high strength properties of massive quartz monzonite and (or) volcanic tuffs, and where spoil-pile loading is least likely to trigger a slope failure. Consequently, the following discussion and analysis will be concerned primarily with slope areas II, IV, and VI, where bedrock control appears negligible or non-existent.
Outcrop studies of surficial deposits
Outcrops of surficial deposits are limited to roadcuts, gullies, and a few erosion scarps. Most of the slope areas are mantled with slope wash, colluvium, and wind-blown material (generally less than 5 ft thick) composed of sand and silt occasionally mixed with gravel or bedrock debris. Because of this cover, the extent of individual beds or units is, in many places, uncertain.
Surfical deposits of gravel, sand, silt, and clay in the slopes are divided into two zones based on the occurrence of clay strata (pi. 1). Deposits below 1650-ft elevation consist mostly of normally graded sequences of gravel, sand, silt, and silty clay alternating with varved clay beds. A few of the coarser-grained sand beds are locally cemented with calcium carbonate. The clay units (varved clay and underlying silty clay) are as much as 3.5 ft thick. By contrast, the deposits above 1650 ft elevation consist almost entirely of sand and subordinate gravel. Cross-bedded sands and gravels with foreset beds indicating a northerly or northwesterly current flow are present in both zones.
Clay-exposure locations and selected detailed partial sections are shown on plate 1. The only exposure of clay beds in slope area VI is that at locality no. 1, partial section no. 1. As shown on plate 1, 10 of the varved clay-silty clay units at that locality are 2 to 3.5 ft thick, and two of those lie below the 1290-ft elevation high water level of the lake. Strike and dip measurements indicate the beds are nearly horizontal. To the northeast, the slope is largely covered by slope wash and colluvium. Continuity to the southeast is evidenced by the exposure of correlative clay beds in slope area
13
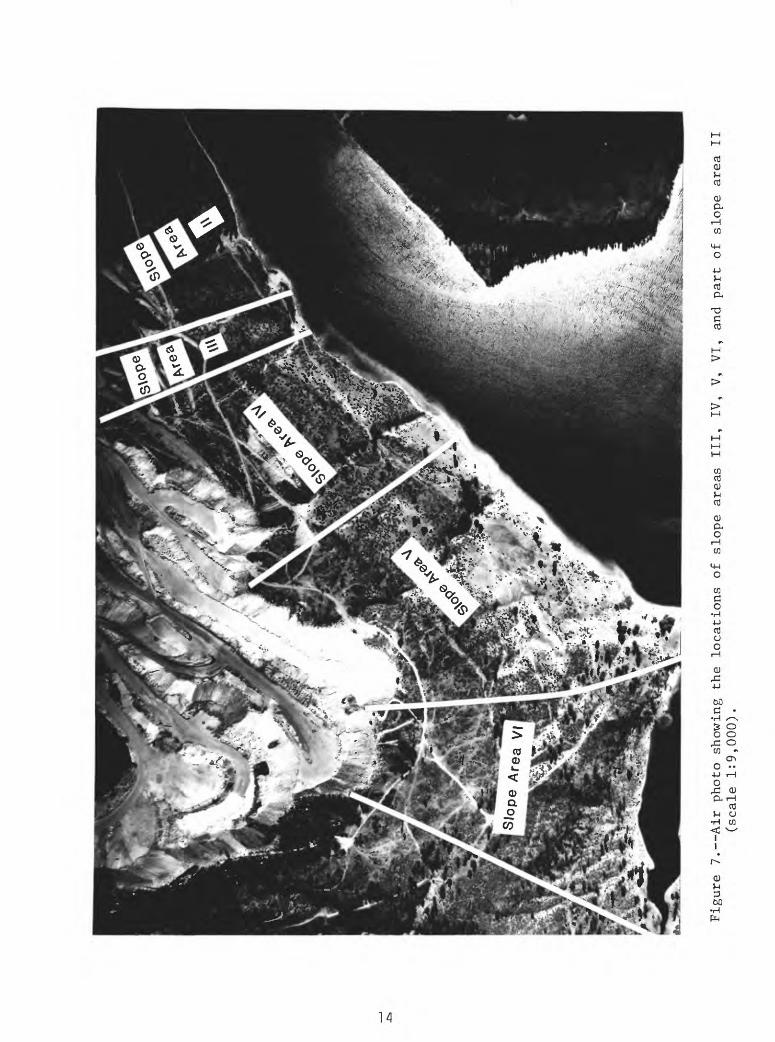
Figu
re 7. Air ph
oto
show
ing
the
loca
tion
s of slope
area
s III, IV,
V, VI
, and
part
of slope
area II
(sca
le 1:
9,00
0).
^ipl±;>^»;«£$% P <$4SV -i-xaf^Sai^s
Figure 7a. Air photo showing the locations of slope areas I and II (scale 1:10,000).
15
V (pi. 1 and fig. 7); however, surface investigations did not reveal their extent in slope areas II and IV due to surficial cover and the lack of good exposures below the 1450-ft level. Locality no. 7, in slope area IV, revealed three thin clay beds less than 5 in. thick, interbedded with medium to coarse grained sand and silt layers. Two clay beds were also exposed at locality no. 8 in slope area IV. Details of the stratigraphy at that location can be found on plate 1. The two clay-exposure localities in slope area IV lie along a linear zone of vegetation descending approximately 6-7° to the northwest that is apparent in air photos of the slope (fig. 8). The line of vegetation may represent a northwesterly-dipping clay zone which functions as an aquiclude, causing infiltrating ground-water flow above the clay to move laterally, in overlying sand and gravel, to the surface. Dip measurements on bedding surfaces of the exposed clay beds along the zone varied between horizontal and 3° to the northwest, and thus did not provide conclusive support for the idea of a 6-7° northwesterly dipping depositional surface or the notion of rotation related to mass movement or faulting. Another, less apparent, zone of vegetation in slope area IV extends horizontally across the slope at about the 1625-ft level. Although no clay exposures were discovered there, clay may be present. The southwestern end of the line of vegetation in slope area VI coincides with the upper part of the clay exposure there, and a similar vertical lithologic change may occur along this line to the northeast. Clay beds crop out at six locations in slope area II between the 1530-ft and 1650- ft levels (localities 9-14 in pi. 1). The beds at localities 9 and 10 are less than 8 in. thick and are partly varved. Those at localities 12 and 14 are clayey silts to silty clays, also less than 8 in. thick. The silty clay exposure at locality 13 is approximately 3 ft thick and lacks stratification. The contact with coarse sand below is sharp but very irregular, suggesting possible disturbance. Hand augering on either side of the exposure also indicated the bed or block is discontinuous or disturbed at that location. The stratigraphy of clay location 11 is detailed on plate 1. The extent of this relatively thick clay layer is uncertain because of the surficial cover; however, the upper zone of vegetation in slope area IV, at approximately the same elevation, may indicate its continuation to the northwest. Likewise, a similar zone of vegetation may indicate its extension to the southeast in slope area II (fig. 8).
Discontinuities in the near-surface clay beds are of two basic types: (1) fissures that are vertical or near vertical (< 30° from vertical), and (2) planes of weakness parallel to bedding (usually related to lithologic change). Using a fissure classification scheme proposed by Fookes and Denness (1969), fissures in the varved clay can be characterized as small to normal (1 cm (0.15 in ) to 1 m (10.76 ft ) in area)), planar to semi-curved, having smooth to slightly rough surface textures, and low intensity (average size of intact blocks 0.27 m3 (9.5 ft3 ) to 1.0 m3 (35.3 ft3)). Most of the observed fissures were closed, though some nearest the surface were open and filled with root growth. The fissures commonly terminate, in the vertical direction, at planar partings parallel to bedding, although some were continuous through the entire thickness of the bed. Lithologic discontinuities that are commonly associated with planes of weakness parallel to bedding include discontinuous stringers of fine sand, only a few millimeters thick, and mica concentrations on some bedding-plane surfaces. Dark lamina (olive gray to dark olive gray when wet) in the varved clays range from a few millimeters to several tens of millimeters in thickness. The light colored lamina (olive to olive gray when wet) are usually no thicker than 1 cm (0.39 in.). As many as 15 couplets
16
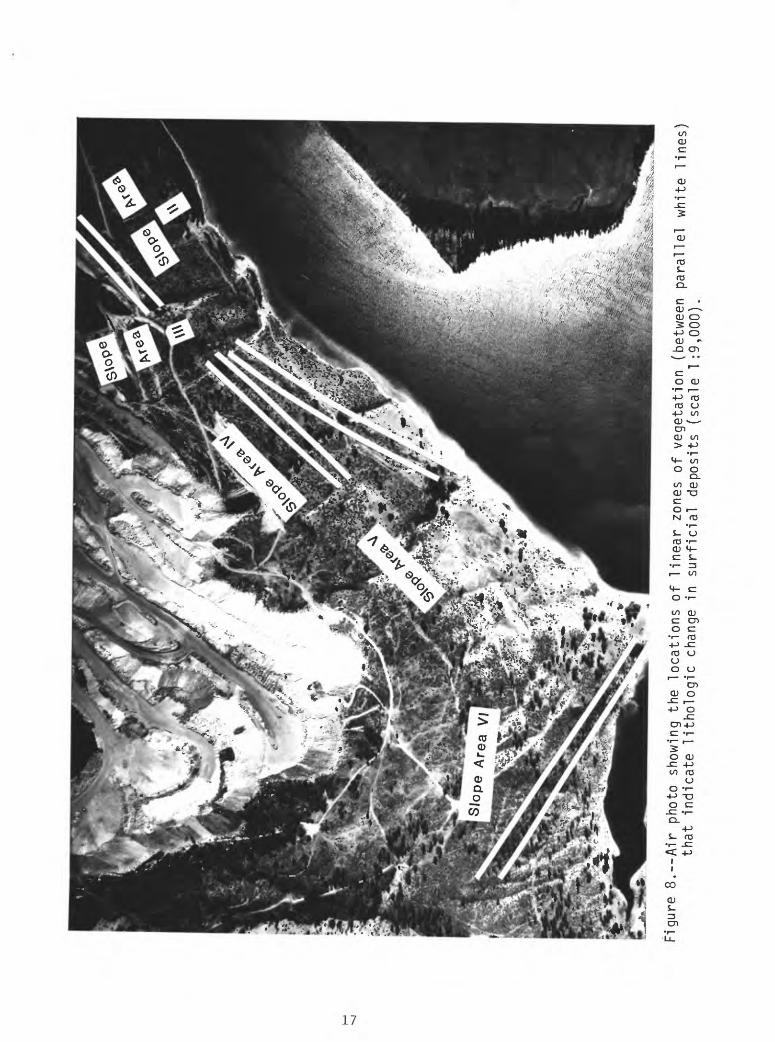
Fig
ure
8.-
-Air
phot
o sh
owin
g th
e
loca
tio
ns of
linear
zone
s o
f ve
ge
tatio
n
(bet
wee
n p
ara
llel
white
lin
es)
tha
t in
dic
ate
lith
olo
gic
ch
ange
in
surf
icia
l deposi
ts
(sca
le
1:9
,000).
(light and dark lamina pairs) were counted in one bed. Silty clay beds, which often occur directly beneath the varved clays, generally lack prominent fissures or planar discontinuities parallel to bedding. Randomly oriented small fissures (each <50 cm (7.7 in. ) in area) observed at silty clay locality no. 13 (pi. 1), are probably the result of desiccation.
Landslide deposits, terraces, and alluvial fans
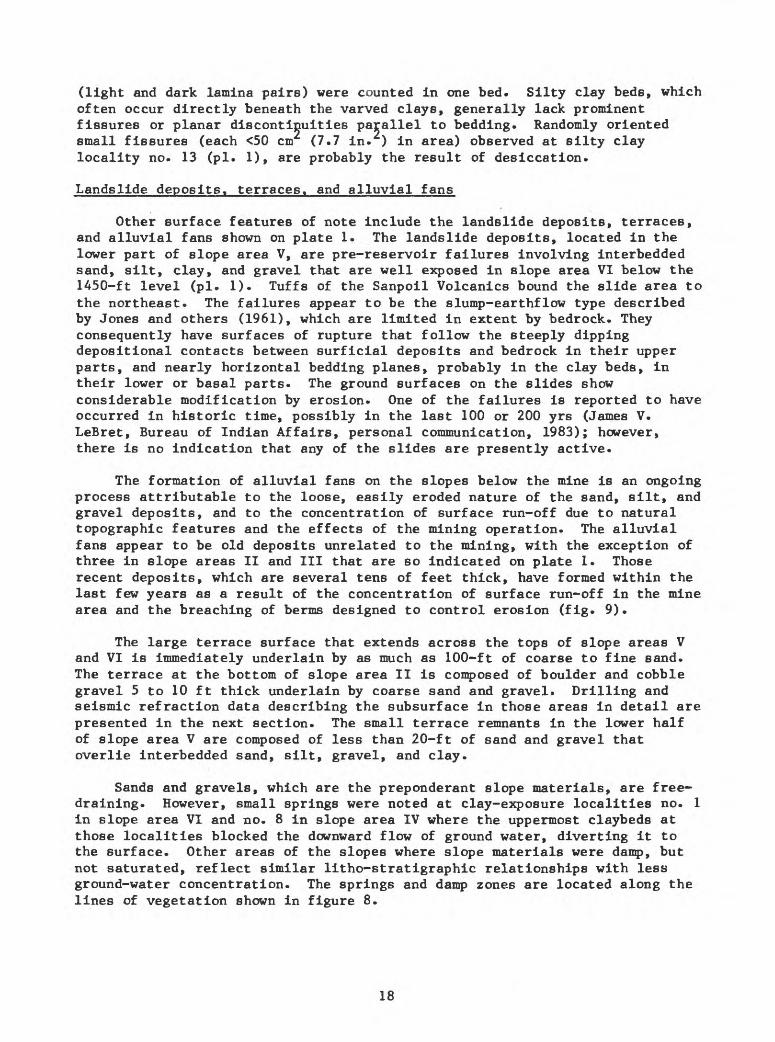
Other surface features of note include the landslide deposits, terraces, and alluvial fans shown on plate 1. The landslide deposits, located in the lower part of slope area V, are pre-reservoir failures involving interbedded sand, silt, clay, and gravel that are well exposed in slope area VI below the 1450-ft level (pi. 1). Tuffs of the Sanpoil Volcanics bound the slide area to the northeast. The failures appear to be the slump-earthflow type described by Jones and others (1961), which are limited in extent by bedrock. They consequently have surfaces of rupture that follow the steeply dipping depositional contacts between surficial deposits and bedrock in their upper parts, and nearly horizontal bedding planes, probably in the clay beds, in their lower or basal parts. The ground surfaces on the slides show considerable modification by erosion. One of the failures is reported to have occurred in historic time, possibly in the last 100 or 200 yrs (James V. LeBret, Bureau of Indian Affairs, personal communication, 1983); however, there is no indication that any of the slides are presently active.
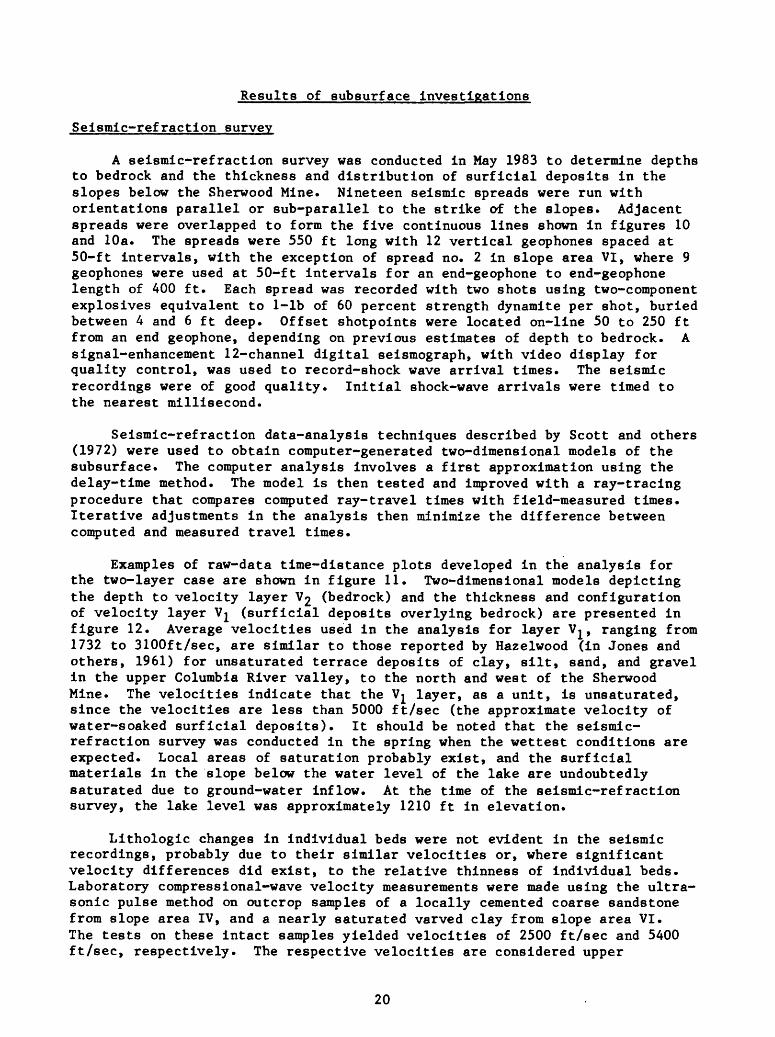
The formation of alluvial fans on the slopes below the mine is an ongoing process attributable to the loose, easily eroded nature of the sand, silt, and gravel deposits, and to the concentration of surface run-off due to natural topographic features and the effects of the mining operation. The alluvial fans appear to be old deposits unrelated to the mining, with the exception of three in slope areas II and III that are so indicated on plate 1. Those recent deposits, which are several tens of feet thick, have formed within the last few years as a result of the concentration of surface run-off in the mine area and the breaching of berms designed to control erosion (fig. 9).
The large terrace surface that extends across the tops of slope areas V and VI is immediately underlain by as much as 100-ft of coarse to fine sand. The terrace at the bottom of slope area II is composed of boulder and cobble gravel 5 to 10 ft thick underlain by coarse sand and gravel. Drilling and seismic refraction data describing the subsurface in those areas in detail are presented in the next section. The small terrace remnants in the lower half of slope area V are composed of less than 20-ft of sand and gravel that overlie interbedded sand, silt, gravel, and clay.
Sands and gravels, which are the preponderant slope materials, are free- draining. However, small springs were noted at clay-exposure localities no. 1 in slope area VI and no. 8 in slope area IV where the uppermost claybeds at those localities blocked the downward flow of ground water, diverting it to the surface. Other areas of the slopes where slope materials were damp, but not saturated, reflect similar litho-stratigraphic relationships with less ground-water concentration. The springs and damp zones are located along the lines of vegetation shown in figure 8.
18
Results of subsurface investigations
Seismic-refraction survey
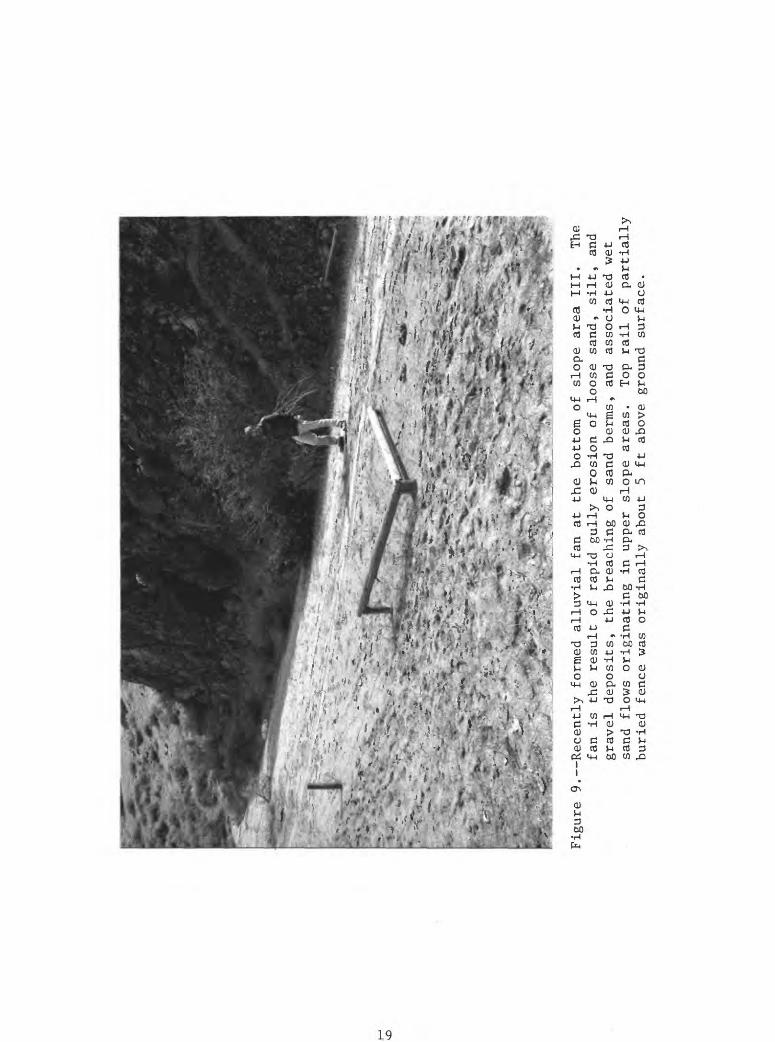
A seismic-refraction survey was conducted in May 1983 to determine depths to bedrock and the thickness and distribution of surficial deposits in the slopes below the Sherwood Mine. Nineteen seismic spreads were run with orientations parallel or sub-parallel to the strike of the slopes. Adjacent spreads were overlapped to form the five continuous lines shown in figures 10 and lOa. The spreads were 550 ft long with 12 vertical geophones spaced at 50-ft intervals, with the exception of spread no. 2 in slope area VI, where 9 geophones were used at 50-ft intervals for an end-geophone to end-geophone length of 400 ft. Each spread was recorded with two shots using two-component explosives equivalent to 1-lb of 60 percent strength dynamite per shot, buried between 4 and 6 ft deep. Offset shotpoints were located on-line 50 to 250 ft from an end geophone, depending on previous estimates of depth to bedrock. A signal-enhancement 12-channel digital seismograph, with video display for quality control, was used to record-shock wave arrival times. The seismic recordings were of good quality. Initial shock-wave arrivals were timed to the nearest millisecond.
Seismic-refraction data-analysis techniques described by Scott and others (1972) were used to obtain computer-generated two-dimensional models of the subsurface. The computer analysis involves a first approximation using the delay-time method. The model is then tested and improved with a ray-tracing procedure that compares computed ray-travel times with field-measured times. Iterative adjustments in the analysis then minimize the difference between computed and measured travel times.
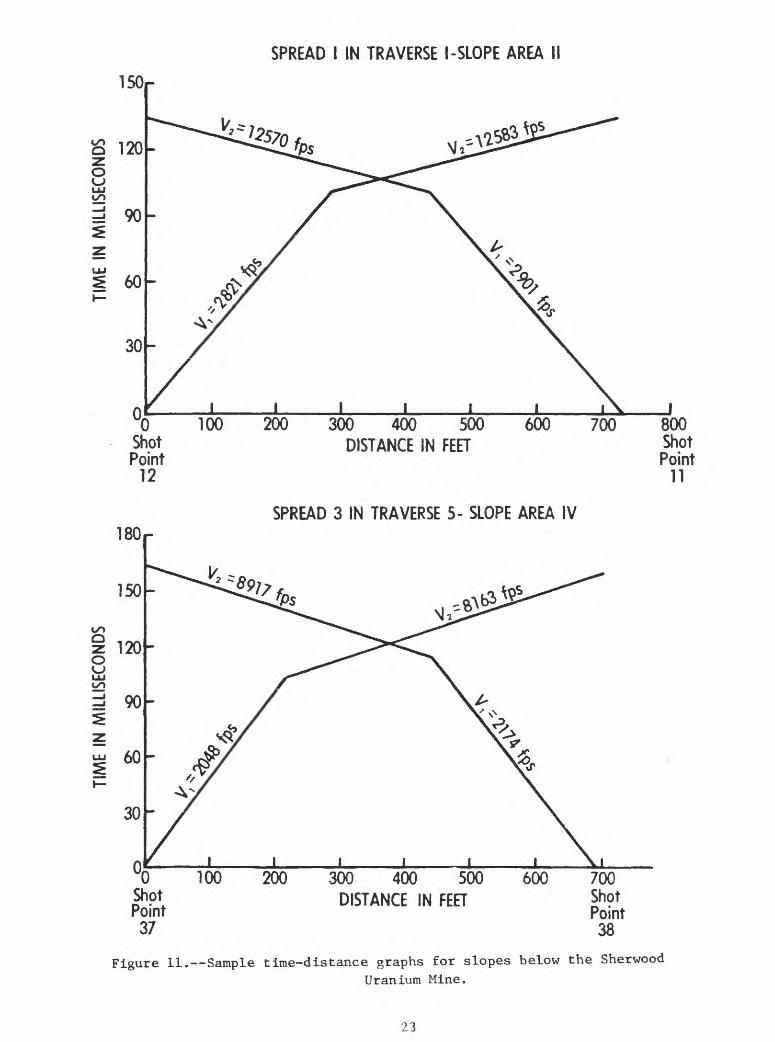
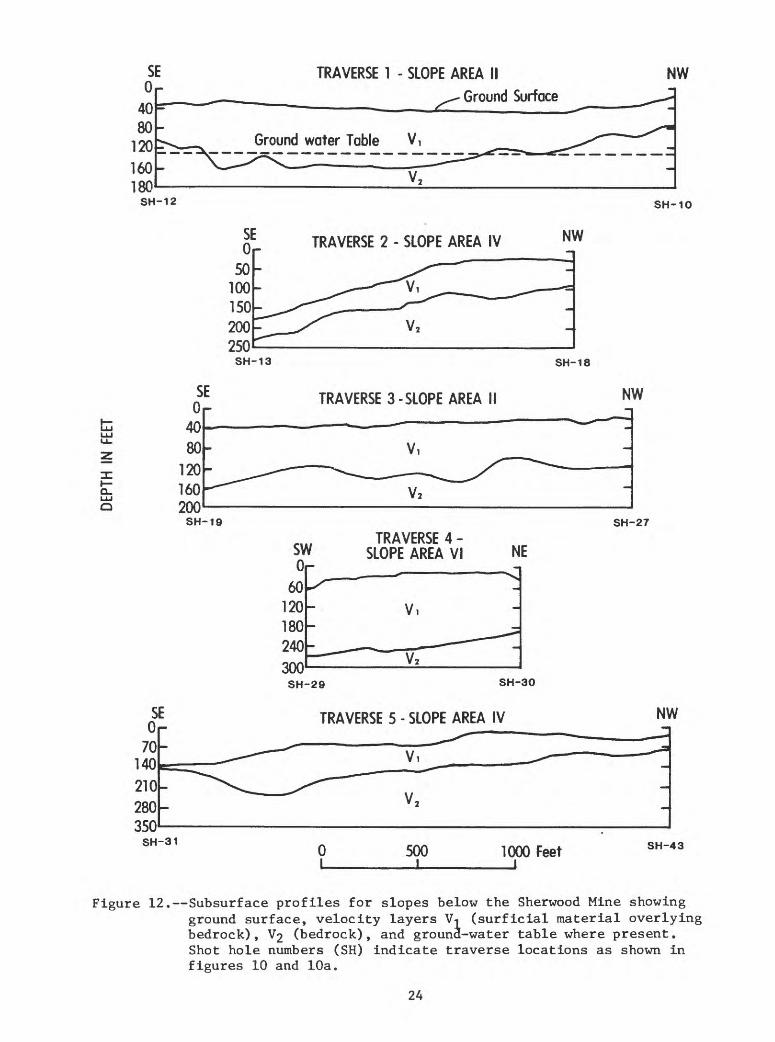
Examples of raw-data time-distance plots developed in the analysis for the two-layer case are shown in figure 11. Two-dimensional models depicting the depth to velocity layer V£ (bedrock) and the thickness and configuration of velocity layer Vj (surficial deposits overlying bedrock) are presented in figure 12. Average velocities used in the analysis for layer V^, ranging from 1732 to 3100ft/sec, are similar to those reported by Hazelwood (in Jones and others, 1961) for unsaturated terrace deposits of clay, silt, sand, and gravel in the upper Columbia River valley, to the north and west of the Sherwood Mine. The velocities indicate that the Vj layer, as a unit, is unsaturated, since the velocities are less than 5000 ft/sec (the approximate velocity of water-soaked surficial deposits). It should be noted that the seismic- refraction survey was conducted in the spring when the wettest conditions are expected. Local areas of saturation probably exist, and the surficial materials in the slope below the water level of the lake are undoubtedly saturated due to ground-water inflow. At the time of the seismic-refraction survey, the lake level was approximately 1210 ft in elevation.
Lithologic changes in individual beds were not evident in the seismic recordings, probably due to their similar velocities or, where significant velocity differences did exist, to the relative thinness of individual beds. Laboratory compressional-wave velocity measurements were made using the ultra sonic pulse method on outcrop samples of a locally cemented coarse sandstone from slope area IV, and a nearly saturated varved clay from slope area VI. The tests on these intact samples yielded velocities of 2500 ft/sec and 5400 ft/sec, respectively. The respective velocities are considered upper
20
sD
Figure 9. Recently fo
rmed
al
luvi
al fan
at th
e bottom of sl
ope
area
II
I.
The
fan
is the
resu
lt of ra
pid
gull
y erosion of loose
sand
, si
lt,
and
gravel de
posi
ts,
the
brea
chin
g of
sand be
rms,
an
d as
soci
ated
wet
sand fl
ows
originating
in up
per
slope areas.
Top
rail of partially
buri
ed fence
was
orig
inal
ly about
5 ft ab
ove
ground su
rfac
e.
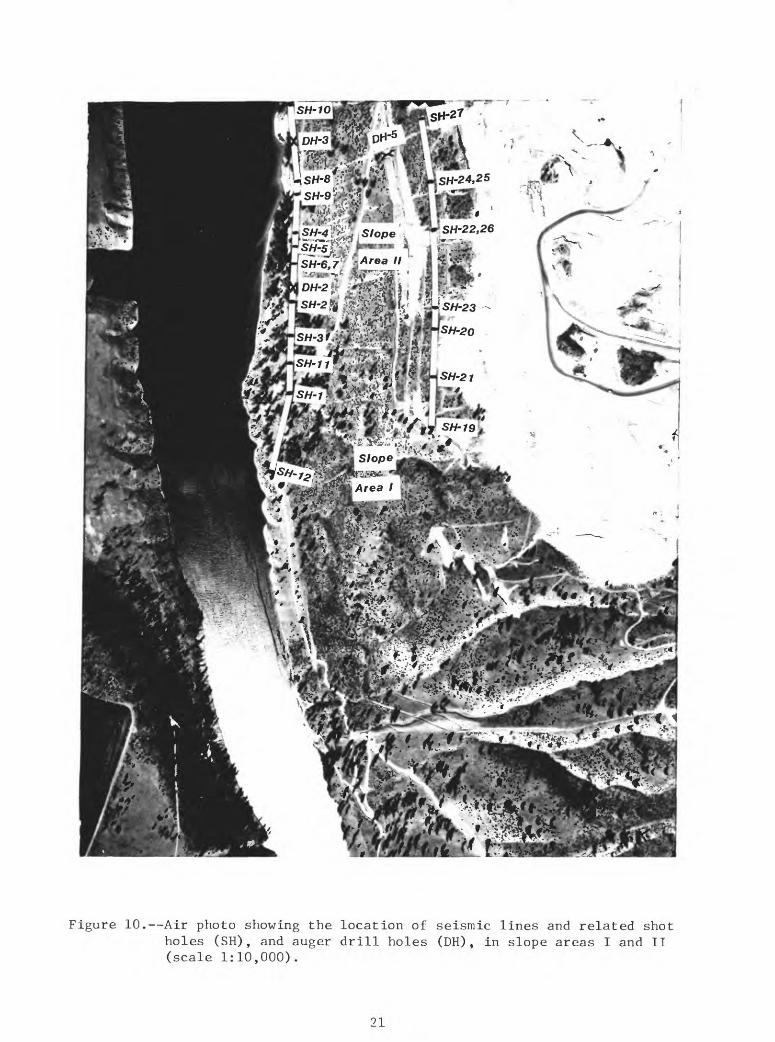
Figure 10. Air photo showing the location of seismic lines and related shot holes (SH), and auger drill holes (DH), in slope areas I and II (scale 1:10,000).
21
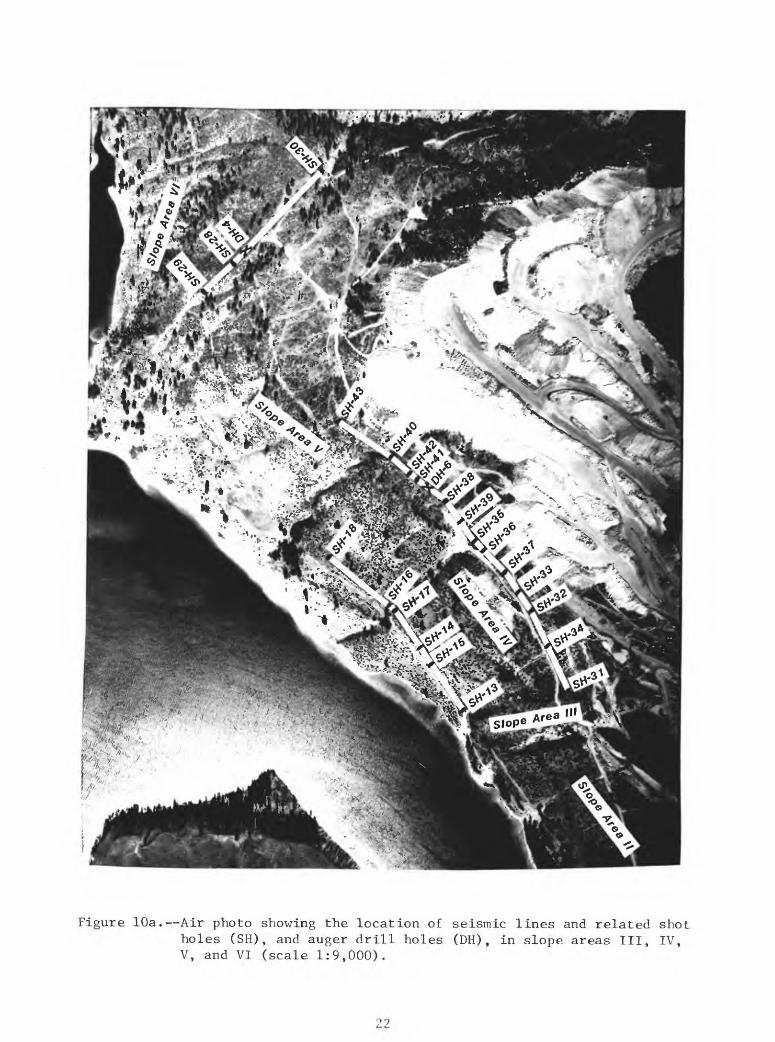
Figure lOa. Air photo showing the location of seismic lines and related shot holes (SH), and auger drill holes (DH), in slope areas III, IV, V, and VI (scale 1:9,000).
SPREAD I IN TRAVERSE I-SLOPE AREA II
150r
o 120 ouu
3 90£uuI 60H-
30
0Shot Point
12
180r
150
120
uu on
^ 90£
^ 60P
30
100 200 300 400 500 600 700DISTANCE IN FEET
SPREAD 3 IN TRAVERSE 5- SLOPE AREA IV
ShotPoint
37
100 200 300 400 500 DISTANCE IN FEET
600 700 Shot Point 38
j800ShotPoint
11
Figure 11. Sample time-distance graphs for slopes below the SherwoodUranium Mine.
23
SE0
4080
120160180
TRAVERSE 1 - SLOPE AREA II
^- Ground Surface
NW
Ground water Table V,
SH-12 SH-10
SE0
50100150200250SH-13
TRAVERSE 2 - SLOPE AREA IV NW
SH-18
TRAVERSE 3-SLOPE AREA II NW
a.LUo
SH-19 SH-27
SW
060
120180240300
TRAVERSE 4 - SLOPE AREA VI NE
SH-29 SH-30
TRAVERSE 5 - SLOPE AREA IV NW
SH-31500
I 1000 Feet _iSH-43
Figure 12. Subsurface profiles for slopes below the Sherwood Mine showingground surface, velocity layers V-j (surficial material overlying bedrock), ^2 (bedrock), and ground-water table where present. Shot hole numbers (SH) indicate traverse locations as shown in figures 10 and lOa.
24
limits in the range of velocities to be expected for the dry or nearly dry coarser-grained materials and for saturated clay beds. As such, they support the existence of the large velocity contrast between velocity layer V^ (surficial material) and velocity layer Y£ (bedrock) detected in the field.
Average velocities used in the computer analysis for layer Y£ (bedrock) range from 10,000 to 12,000 ft/sec. The fastest bedrock velocities appear to be associated with areas of quartz monzonite, and the slowest with known areas of pyroclastics.
Drilling
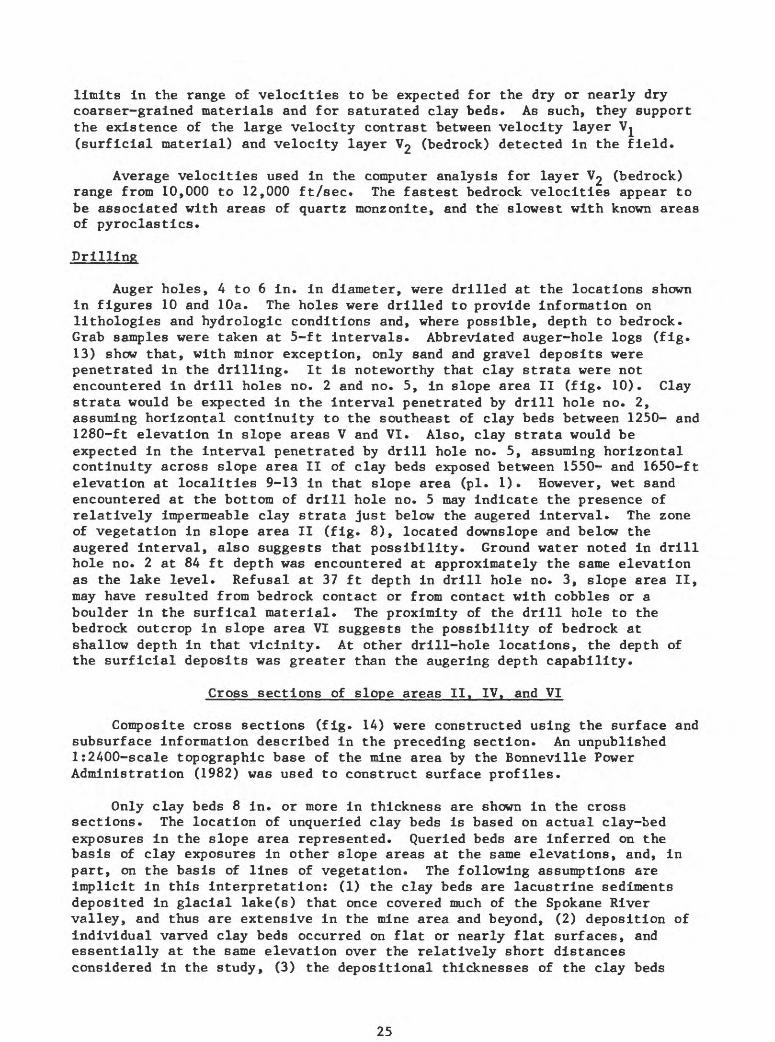
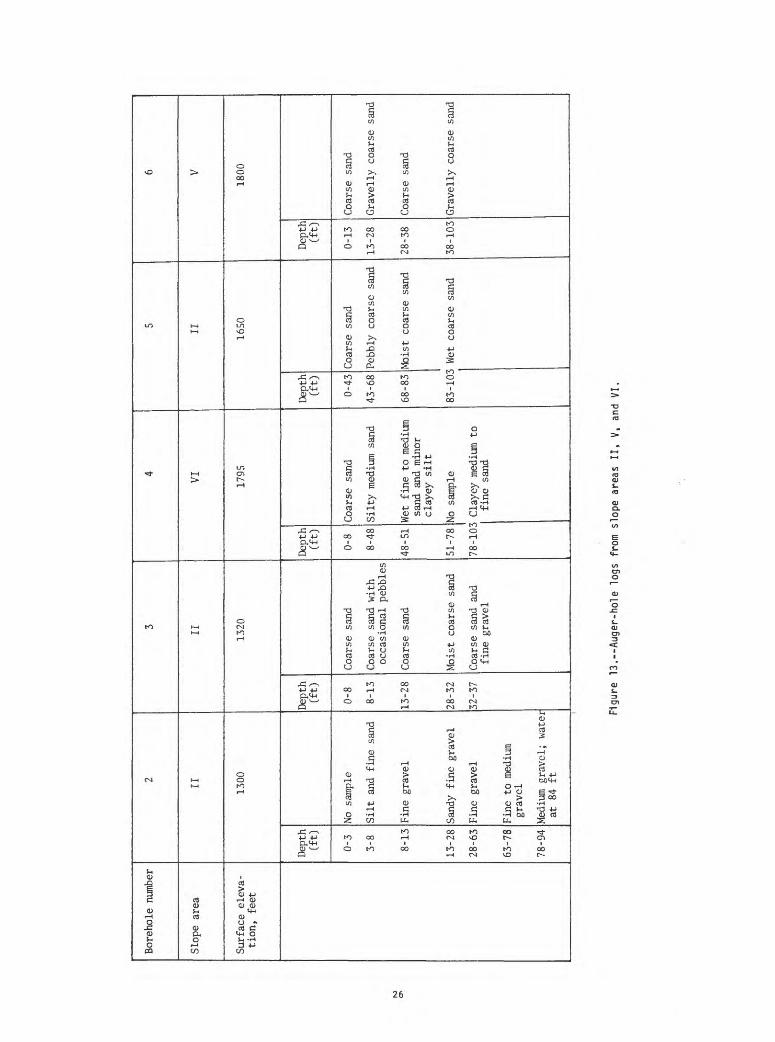
Auger holes, A to 6 in. in diameter, were drilled at the locations shown in figures 10 and lOa. The holes were drilled to provide information on lithologies and hydrologic conditions and, where possible, depth to bedrock. Grab samples were taken at 5-ft intervals. Abbreviated auger-hole logs (fig. 13) show that, with minor exception, only sand and gravel deposits were penetrated in the drilling. It is noteworthy that clay strata were not encountered in drill holes no. 2 and no. 5, in slope area II (fig. 10). Clay strata would be expected in the interval penetrated by drill hole no. 2, assuming horizontal continuity to the southeast of clay beds between 1250- and 1280-ft elevation in slope areas V and VI. Also, clay strata would be expected in the interval penetrated by drill hole no. 5, assuming horizontal continuity across slope area II of clay beds exposed between 1550- and 1650-ft elevation at localities 9-13 in that slope area (pi. 1). However, wet sand encountered at the bottom of drill hole no. 5 may indicate the presence of relatively impermeable clay strata just below the augered interval. The zone of vegetation in slope area II (fig. 8), located downslope and below the augered interval, also suggests that possibility. Ground water noted in drill hole no. 2 at 84 ft depth was encountered at approximately the same elevation as the lake level. Refusal at 37 ft depth in drill hole no. 3, slope area II, may have resulted from bedrock contact or from contact with cobbles or a boulder in the surfical material. The proximity of the drill hole to the bedrock outcrop in slope area VI suggests the possibility of bedrock at shallow depth in that vicinity. At other drill-hole locations, the depth of the surficial deposits was greater than the augering depth capability.
Cross sections of slope areas II, IV, and VI
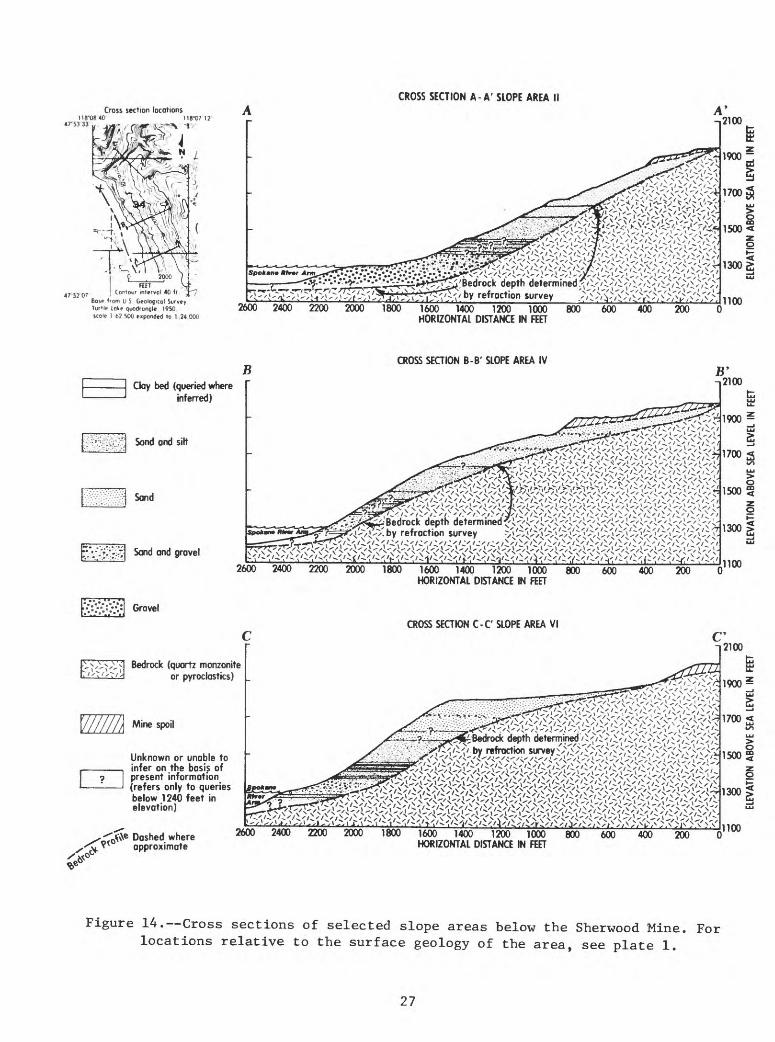
Composite cross sections (fig. 14) were constructed using the surface and subsurface information described in the preceding section. An unpublished l:2400-scale topographic base of the mine area by the Bonneville Power Administration (1982) was used to construct surface profiles.
Only clay beds 8 in. or more in thickness are shown in the cross sections. The location of unqueried clay beds is based on actual clay-bed exposures in the slope area represented. Queried beds are inferred on the basis of clay exposures in other slope areas at the same elevations, and, in part, on the basis of lines of vegetation. The following assumptions are implicit in this interpretation: (1) the clay beds are lacustrine sediments deposited in glacial lake(s) that once covered much of the Spokane River valley, and thus are extensive in the mine area and beyond, (2) deposition of individual varved clay beds occurred on flat or nearly flat surfaces, and essentially at the same elevation over the relatively short distances considered in the study, (3) the depositional thicknesses of the clay beds
25
Bore
hole
number
Slop
e ar
ea
Surface
elev
ati
on,
feet
2 II 1300
Depth
(ft)
0-3
3-8
8-13
13-2
8
28-6
3
63-7
8
78-94
No s
ample
Silt
an
d fi
ne sa
nd
Fine
gra
vel
Sand
y fi
ne g
rave
l
Fine
gra
vel
Fine
to me
dium
gravel
Medi
um g
ravel; wa
ter
at 84 ft
3 II 1320
Depth
(ft)
0-8
8-13
13-2
8
28-32
32-37
Coarse s
and
Coarse sa
nd wit
h occasional p
ebbl
es
Coarse s
and
Moist
coarse s
and
Coarse s
and
and
fine
gra
vel
4
VI 1795
Depth
(ft)
0-8
8-48
48-51
51-78
78-102
Coarse sa
nd
Silt
y me
dium
san
d
Wet
fine
to me
dium
sand a
nd minor
clayey s
ilt
No s
ample
Clayey med
ium
to
fine
sand
5 II 1650
Depth
(ft)
0-43
43-6
8
68-8
3
Coarse sand
Pebbly c
oarse
sand
Mois
t coarse sa
nd
83-1
03 W
et coarse s
and
6 V
1800
Depth
(ft)
0-13
13-28
28-38
38-1
03
Coar
se s
and
Grav
elly
coa
rse
sand
Coarse sa
nd
Grav
elly
coarse
sand
Fig
ure
13
.--A
ug
er-
ho
le
logs
fr
om
slop
e ar
eas
II,
V,
and
VI.
NJ
H- OQ c l-l (D
R !
£ n
2 n
P
Ow
en
<f
rt£
' H
-<
O
(I>
prt
W
O
Ort
^
tJ*
CO
sra
o (D
CO
00
O
O
TO ?&
(D
O
»
«
H
rt(D
CT
1j»
) (D
»
S2
n»(D
hj
o
§H
1 O
03 pL
rt (D
gH-B
-
(D
88
88
EL
EVAT
ION
ABOV
E SE
A LE
VEL
IN F
EET
88
8
ELEV
ATIO
N AB
OVE
SEA
LEVE
L IN
FEE
T8
10
88
8
ELEV
ATIO
N AB
OVE
SEA
LEVE
L IN
FEE
T
shown in the cross sections are reasonably uniform throughout the area, and 4) despite contemporaneous or subsequent erosion by catastrophic floods, glacial scouring, landsliding, river downcutting, etc., the clay beds remain in place over large areas.
Beds of sand, silt, and gravel in the cross sections are also somewhat idealized in that some of these units are visibly discontinuous in several field exposures* In general, however, the thicknesses shown seem to persist throughout the slope areas*
Irregularities, not shown in the longitudinal bedrock profiles, probably exist as they do in the cross-slope refraction survey profiles of figure 12. It is assumed, however, that the irregularities are not as pronounced as those in the cross-slope directions, which cross downslope drainage and erosion channels on the old bedrock surface. Consequently, the bedrock profiles shown in figure 14 are considered reasonably accurate.
LABORATORY TEST DATA
Laboratory tests were run on surficial slope materials to determine basic physical properties and shear strength parameters needed to evaluate slope stability.
Sand deposits
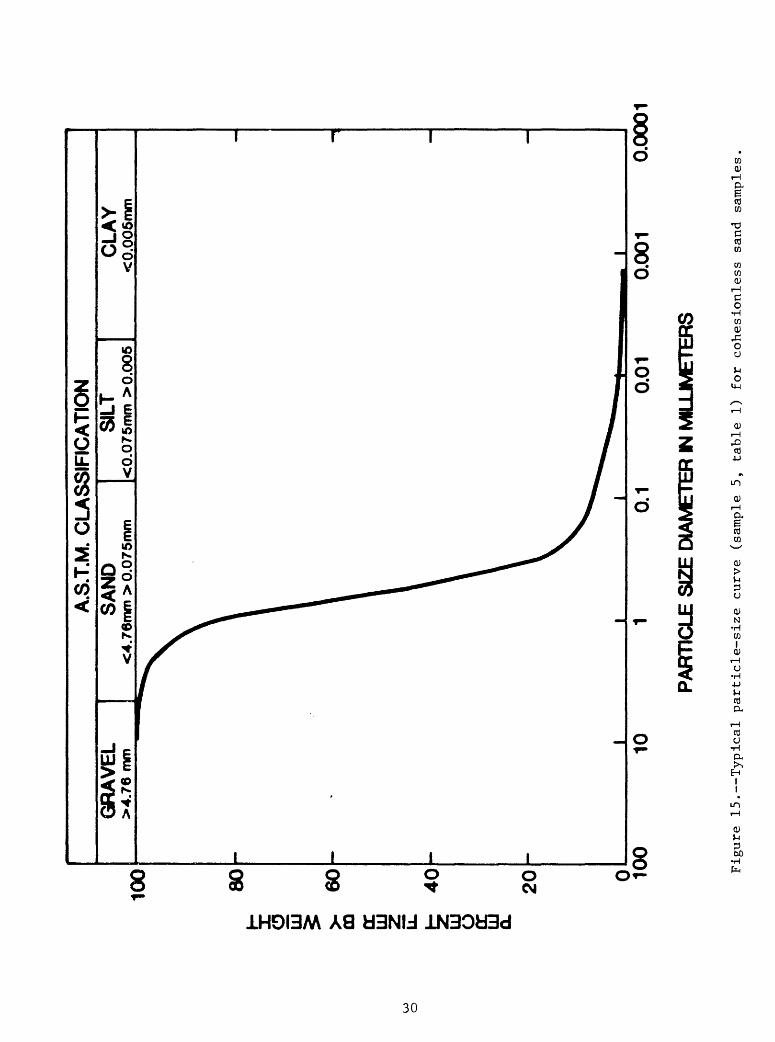
Deposits of cohesionless sand (the most abundant slope material) were sampled with a surface tube sampler at upper, lower, and mid-slope locations in slope areas II, IV, and VI. Grain-size analyses and bulk-density tests were performed, and void-ratio and relative-density values calculated. Based on laboratory test results and visual examination (Table 1 and fig. 15), the samples can be characterized as mostly medium-to coarse-grained, loose to very loose, uniform lithic sands, with minor amounts of silt, clay, and gravel. Usually, a high percentage of the grains are lithics derived from the granitic, volcanic, and metamorphic rocks of the region. Grain density is estimated at 2.65 g/cc based on the composition of the grains. The high void ratios and low densities indicated in table 1 are representative of near- surface conditions rather than conditions at depth where somewhat lower void ratios and higher densities would be expected due to increased overburden pressures. Correlations between peak friction angles, void ratios, angularity of grains, and confining pressures indicate a friction angle range of 32° to 42° (Lambe and Whitman, 1969). Existing sand slope angles in the study area vary between 24° and 38°. However, field observations indicate the lower values in the range are due to erosion rather than mass movement and that the higher values are representative of the true angles of repose.
Clay depositso
Block samples of varved clay and underlying silty clay (1 ft or larger in volume) were taken at clay exposure localities 1, 8, and 11 (pi. 1). In addition, smaller clay samples were collected at other numbered localities shown on plate 1. Physical-property tests included size analyses, Atterberg limits, moisture contents, densities, and X-ray diffraction analyses to determine clay mineralogy. As shown in table 2, the varved clays are highly plastic and contain only a small percentage of silt and fine sand* Interestingly, the light and dark laminae tested have similar grain-size distributions and Atterberg limit values. Reported Atterberg limits for
28
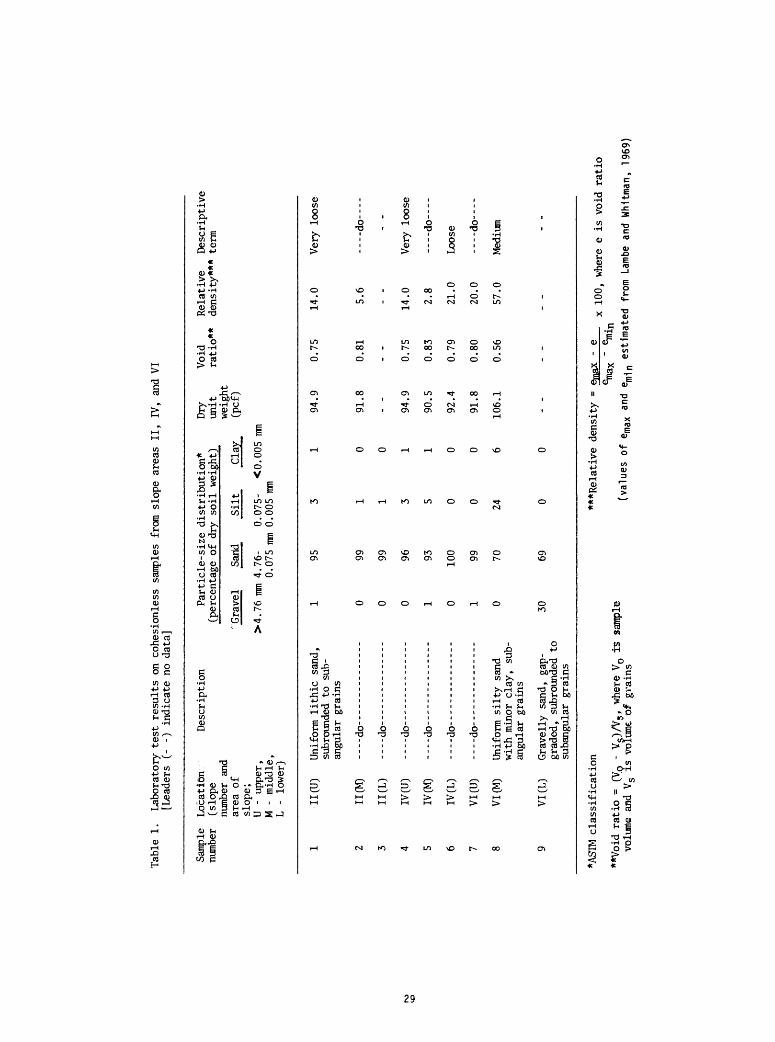
Tabl
e 1.
Laboratory t
est
results
on c
ohes
ionl
ess
samples
from
slo
pe a
reas
II
, IV
, an
d VI
[L
eade
rs (-
-)
indicate no
data
]
Samp
le
Location
numb
er
(slope
Desc
ript
ion
Particle-size
distribution*
(percentage
of d
ry so
il w
eight)
numb
er and
area
of
"Gravel
Sarid
slop
e;
U - upper,
>4.76 mm 4
.76-
M -
middle,
0.07
5 mm
Dry
Void
Re
lati
ve
Desc
ript
ive
unit
ratio**
dens
ity*
** t
erm
weig
ht
Silt
Cl
ay
(pcf)
0.07
5-
<0.005mm
0.005 mm
L -
lowe
r)
1 2 3 4 5 6 7 8 9
*AST
M
'H(U
)
II CM)
H (L)
IV (U
)
IV CM)
IV (L
)
VI (U)
VI (M)
VI (L)
Uniform
lithic sa
nd,
subr
ound
ed t
o su
b-angular
grai
ns
----do---------------
-.--do-- -------------
----
do--
----
----
----
-
----do------
---------
----do--------------
----
do--
- -----------
Uniform
silty
sand
with
min
or c
lay,
su
b-angular
grains
Grav
elly
sa
nd,
gap-
graded,
subrounded t
osubangular g
rain
s
1 0 0 0 1 0 1 0 30
95 99 99 96 93 100 99 70 69
classification
3 1 1 3 5 0 0 24 0
1 0 0 1 1 0 0 6 0
***R
elat
ive
94.9
0.75
14.0
Very l
oose
91.8
0.81
5.6
- do
- -
94.9
0.75
14.0
Very
loo
se
90.5
0.83
2.8
----do----
92.4
0.79
21.0
Lo
ose
91.8
0.80
20.0
--
--do
----
106.
1 0.56
57.0
Medium
-_
._
..
--
density
= em
ax
- e
inn
. .
.
**Vo
id ratio =
(Vp
" V?)/V
?, wh
ere Vo is sa
mple
volunle
and Vs is v
olum
e of g
rain
s
emax
" ^in
(values
of e
max
and
em1n es
tima
ted
from Lambe
and
Whitman, 19
69)
O
100
80
O LLJ >
60
CO o:
LU LL t;
40
LLJ o ffi Q.
20
A.S
.T.M
. C
LA
SS
IFIC
AT
ION
GR
AV
EL
>4.
76 m
mS
AN
D<4
.76m
m >
0.0
75m
mS
ILT
<0.0
75m
m >
0.0
05C
LA
Y<
0.00
6mm
100
0.00
10.
0001
PA
RTI
CLE
SIZ
E D
IAM
ETE
R IN
MIL
LIM
ETE
RS
Figure 15. Typical particle-size curve (s
ampl
e 5, table
1) for
cohesionless sa
nd samples.
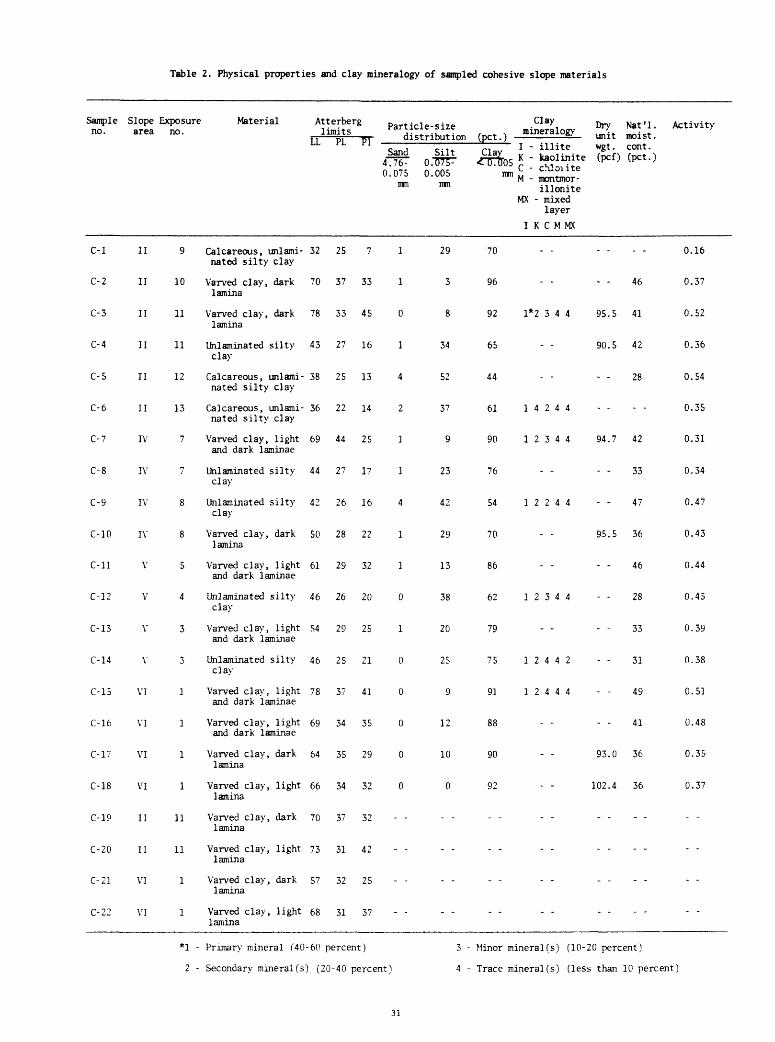
Table 2. Physical properties and clay mineralogy of sampled cohesive slope materials
Sample no.
C-l
C-2
C-3
C-4
C-5
C-6
C-7
C-8
C-9
C-10
C-ll
C-12
C-13
C-14
C-15
C-16
C-17
C-18
C-19
C-20
C-21
C-22
Slope Exposure Material area no.
II
II
II
II
II
II
TV
IV
IV
IV
V
V
V
V
VI
VI
VI
VI
II
II
VI
VI
9
10
11
11
12
13
7
7
8
8
5
4
3
3
1
1
1
1
11
11
1
1
Calcareous, unlami-nated silty clay
Varved clay, darklamina
Varved clay, darklamina
Unlaminated siltyclay
Calcareous, unlami-nated silty clay
Calcareous, unlami-nated silty clay
Varved clay, lightand dark laminae
Unlaminated siltyclay
Unlaminated siltyclay
Varved clay, darklamina
Varved clay, lightand dark laminae
Unlaminated siltyclay
Varved clay, lightand dark laminae
Unlaminated siltyclay
Varved clay, lightand dark laminae
Varved clay, lightand dark laminae
Varved clay, darklamina
Varved clay, lightlamina
Varved clay, darklamina
Varved clay, lightlamina
Varved clay, darklamina
Varved clay, lightlamina
Ati 1:
LL
32
70
78
43
38
36
69
44
42
50
61
46
54
46
78
69
64
66
70
73
57
68
terbe: imits
PL
25
37
33
27
25
22
44
27
26
28
29
26
29
25
37
34
35
34
37
31
32
31
BY~ distribution (pet.) sL_ unit moist.
Sand Silt Clav l ' illite vgtt COnt \ 4776^ O.T57T <To7tr05 * ' J»°li te (pcf) (pet.)
0.075 0.005 mm fj " c-uoilte
** "in " mSite MX - mixed
layer
I K C M MX
71 29 70 - - ... .
33 1 3 96 - - - - 46
45 0 8 92 1*2 3 4 4 95.5 41
16 1 34 65 - - 90.5 42
13 4 52 44 - - - - 28
14 2 37 61 14244
25 1 9 90 12344 94.7 42
17 1 23 76 - - - - 33
16 4 42 54 12244 - - 47
22 1 29 70 - - 95.5 36
32 1 13 86 - - - - 46
20 0 38 62 12344 - - 28
25 1 20 79 - - - - 33
21 0 25 75 12442 - - 31
41 0 9 91 12444 - - 49
35 0 12 88 - - - - 41
29 0 10 90 - - 93.0 36
32 0 0 92 - - 102.4 36
32 - - - - - - - - - - - -
42 - - - - - - - - ....
25 - - - - - - - - - - - -
37 - - - - - - - - - - - -
Activity
0.16
0.37
0.52
0.36
0.54
0.35
0.31
0.34
0.47
0.43
0.44
0.45
0.39
0.38
0.51
0.48
0.35
0.37
- -
- -
. -
- -
*1 - Primary mineral (40-60 percent)
2 - Secondary mineral(s) (20-40 percent) 4 -
Minor mineral(s) (10-20 percent)
Trace mineral(s) (less than 10 percent)
31
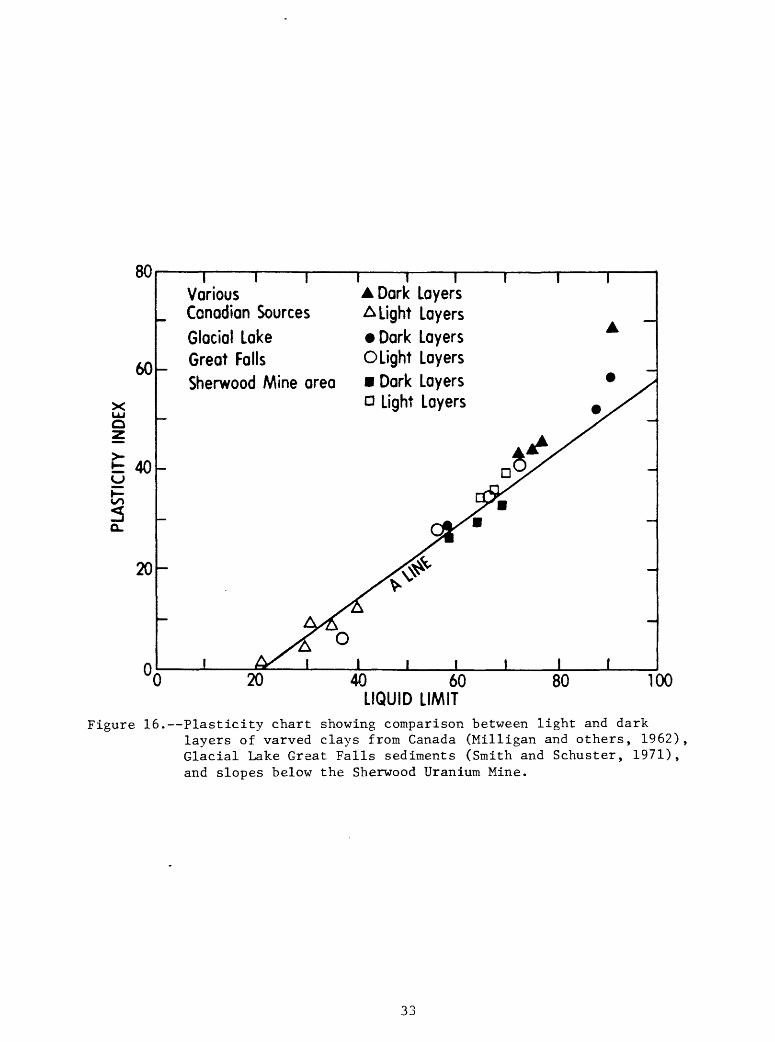
varved clays from other areas often show considerable differences between light and dark laminae, usually reflecting higher sand and silt contents of the light lamina. The test values of this study are similar, however, to Atterbergs reported by Smith and Schuster (1971) for certain varved clays from the Great Falls area of Montana (see fig. 16). The reasons for the atypical similarities between light and dark laminae are unknown. This factor may, however, have significant implications with regard to strength properties, should local exceptions exist to the freely drained, .zero-pore-pressure (i.e., effective stress) condition assumed. Coarser grained laminae interlayered with finer materials may provide avenues for drainage and a reduction of pore pressure in the clay-rich layers, increasing effective stresses and soil strengths. Clay-rich light and dark laminae with similar characteristics and little drainage may develop high pore pressures, lowering effective stresses and shear strengths. A detailed study of grain-size and pore-pressure distributions in the individual lamina has not been made and would be necessary to thoroughly evaluate any such effects on strength properties.
X-ray diffraction analyses show illite as the most abundant clay mineral group present. Kaolinite is a secondary clay mineral group in all the samples analyzed except for sample no. C-6, table 2, which contains abundant chlorite and only a trace of kaolinite. Sample C-6 is from silty clay locality no. 13 in slope area II. As previously noted, the clay exposed at that locality appears disturbed and discontinuous. The anomalous clay mineralogy may indicate a different source for the clay minerals, and possibly for the entire clay block. The clay mineralogies for this suite of samples are consistent with the indicated Atterberg limit and activity (Lambe and Whitman, 1969) values. Activity is a measure of the water-holding ability of the clay minerals and suggests the presence of certain clay types. Activities for clays range from a low of less than 1 for kaolinite to more than 4 for montmorillonite (Sowers, 1979).
Natural moisture contents for the clays vary from 28 to 49 percent. The higher, nearly saturated, values are associated with clay-rich samples and the lower values with silty clays and clayey silts.
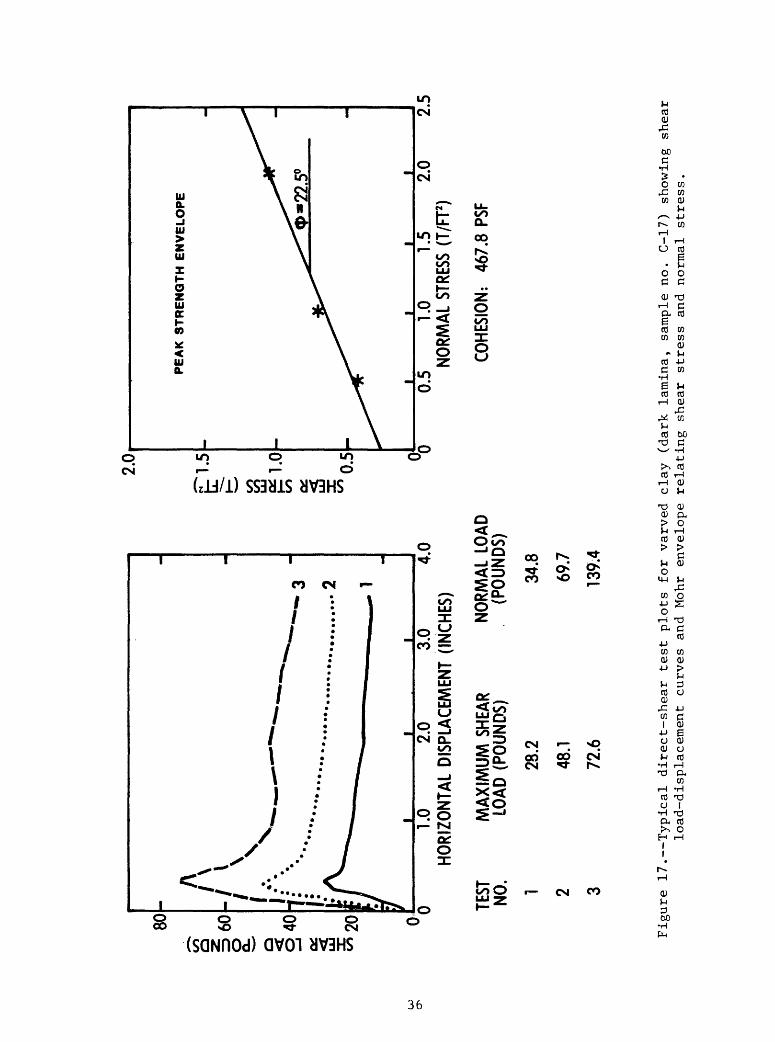
Strength properties were obtained from direct-shear and ring-shear tests on individual varves (laminae), and on unlaminated silty clay from the block samples previously described. Head (1982) defines shear strength as: "The maximum shear resistance which a soil can offer under defined conditions of effective pressure and drainage", and further states that the above definition is often used synonymously with peak strength. Residual strength is defined as: "The shear resistance which a soil can maintain when subjected to large shear displacement after peak strength has been mobilized". The actual soil strength in situ (i.e., peak or residual) is dependent on many factors including stress history. Both peak and residual strength parameters were used to analyze slope stability, as described in a later section. Peak and residual effective-stress parameters were determined parallel to bedding in drained direct-shear tests on 2.5-in.-diameter samples. To approximate f-'eld conditions and obtain Mohr envelopes from which peak and residual strength o parameters could be determined, normal stresses of 0.5, 1.0, and 2.0 tons/ft^ were used. The strain rate of 0.0048 mm/min (0.0002 in./min) used in the tests slow enough to eliminate pore-pressure buildup was calculated using consolidation data from similar samples (Bishop and Henkel, 1962). Residual values were determined by manually shearing the sample back and forth to obtain a well-developed failure surface and then repeating the test procedure at the normal loads used in prior peak-strength tests. Details of the
32
80
60
xuu O
t 40
00
Q_
20
00
Various Canadian SourcesGlacial Lake Great Falls Sherwood Mine area
A Dark Layers A Light Layers Dark Layers O Light Layers Dark Layers a Light Layers
20 40 60 LIQUID LIMIT
80 TOO
Figure 16. Plasticity chart showing comparison between light and darklayers of varved clays from Canada (Milligan and others, 1962), Glacial Lake Great Falls sediments (Smith and Schuster, 1971), and slopes below the Sherwood Uranium Mine.
33
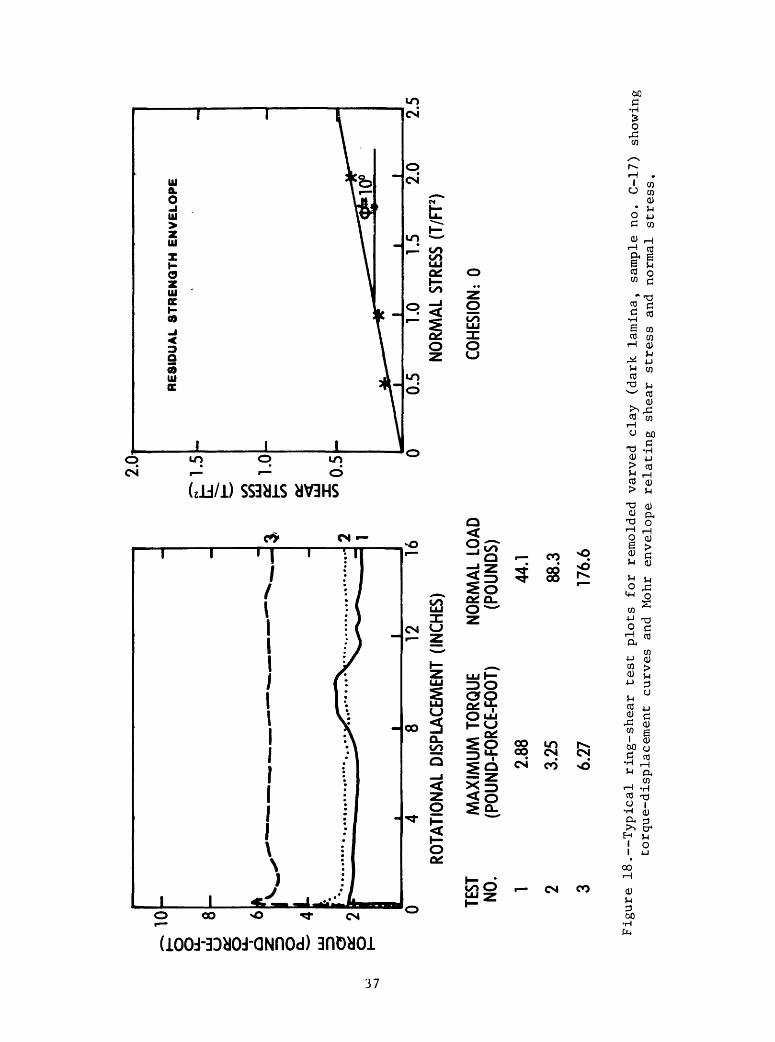
direct-shear test method and apparatus used are described by Head (1982). Ring-shear tests to determine residual strengths were run on remolded annular samples 5 mm (0.20 in.) thick, with inner and outer diameters of 70 mm (2.76 in.) and 100 mm (3.94 in). Normal stresses of 0.5, 1.0, and 2.0 tons/ft2 , a shearing rate of 0.267 mm/min (0.009 in./min), and a total mean rotational displacement of 400 mm (15.7 in.) were used to achieve the desired test condition. Important advantages of the ring-shear test over the direct-shear test in determining residual shear strength parameters are: (1) constant area of cross section of the shear plane during testing and (2) large magnitudes of continuous displacement. Consequently, only the ring-shear values are reported. A complete description of the ring-shear test is given by Bishop and others, 1971. Shear-test results are presented in table 3. Figures 17 and 18 are examples of shear-test plots. The peak and residual values for the varved clay layers are similar to those reported by Smith and Schuster (1971) for glacial Lake Great Falls varved clays from Montana.
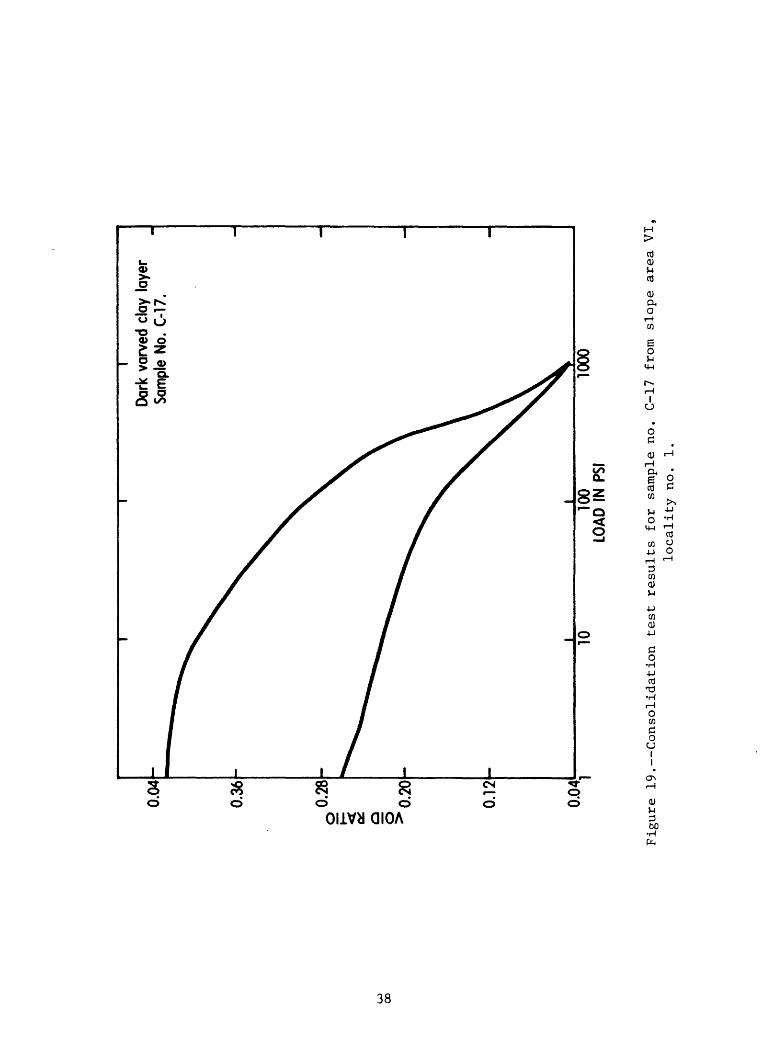
Maximum past consolidation stress interpreted by the Casagrande method for varved clay samples (fig. 19) is 5.8 tons/ft . The past consolidation stress may be accounted for by the previous overburden of valley-fill material, since removed by erosion.
SLOPE-STABILITY ANALYSES
Methods
Conventional limit-equilibrium methods were chosen to analyze the stability of the slopes below the Sherwood Mine spoil piles. These methods, in essence, compare the forces acting to fail the slope with the available resisting forces. Limit-equilibrium analyses yield a factor of safety (FS), that can be defined as the ratio of resisting forces to driving forces along a specified trial failure surface. Incipient failure can be assumed, in the idealized case, when the factor of safety is equal to one.
An essential first step in choosing a particular method of analysis is the visualization of the probable shape of failure surface. Two models or potential forms of slope failure are suggested by what is known about previous failures along the shores of Franklin D. Roosevelt Lake (Jones and others, 1961; U.S. Bureau of Reclamation, 1966-82), and by detailed information on the composition, thickness, and orientation of strata obtained in this study.
A probable form of slope failure in coarse-grained cohesionless materials is suggested by the "slip-off slope" type described by Jones and others (1961). In this type of failure a relatively thin skin of surface material is involved, and the failure surface (the lower bound of the failure) roughly parallels the natural slope. The area and the volume of material involved in this type of mass movement are usually small. The stability of dry cohesionless sand slopes above the water table and saturated sand slopes beneath lake level is almost wholly dependent on the internal angle of friction of the sand relative to the existing slope angle. If the angle of slope exceeds the internal angle of friction of the sand, failure will theoretically occur. The factor of safety for the cohesionless sand slopes described is easily computed using the equation:
FS * Tan <}> /Tan 3,where <j> is the angle of internal friction of the cohesionless material and $ is the existing slope angle. Using the above equation and values for <j> and 3 presented in the previous section, factors of safety for some of the cohesionless slopes may approach one, indicating incipient failure. The
34
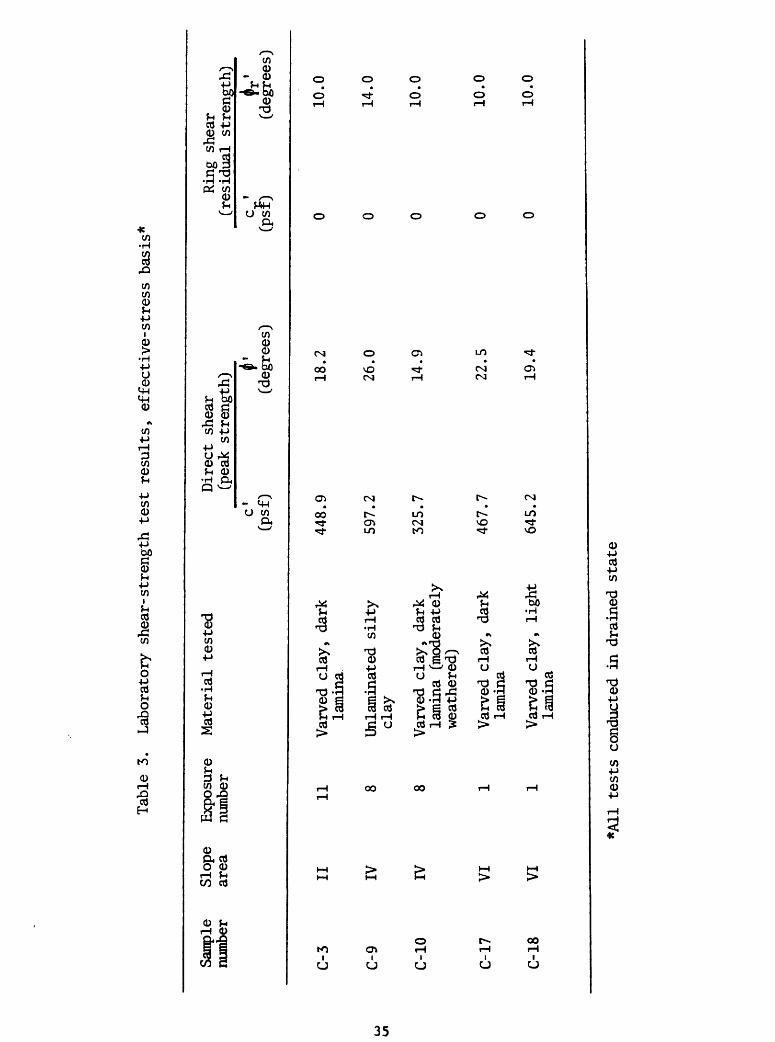
Table
3.
Labo
rato
ry s
hear-strength
test r
esul
ts,
effe
ctive-stress b
asis*
Samp
le
Slop
e Exposure
Mate
rial
tes
ted
Dire
ct s
hear
number
area
number
(pea
k st
reng
th)
c1
f1
(psf
) (degrees)
C-3
II
11
Varved c
lay, da
rk
448.9
18.2
la
mina
C-9
IV
8 Un
lami
nate
d si
lty
597.2
26.0
clay
C-10
IV
8 Varved c
lay, da
rk
325.
7 14.9
lami
na (m
oder
atel
y we
athe
red)
C-17
VI
1 Va
rved
clay, da
rk
467.7
22.5
lamina
C-18
VI
1 Va
rved
clay, light
645.
2 19.4
lami
na
Ring s
hear
(r
esid
ual
stre
ngth
)r
' A
' v
iT(p
sf)
(degrees)
0 10.0
0 14.0
0 10.0
0 10.0
0 10.0
*A11 t
ests
con
duct
ed i
n drained
state
0 TEST
NO
.
1 2 3
1.0
2.0
3.0
HORI
ZONT
AL D
ISPL
ACEM
ENT
(INCH
ES)
4.0
1.5
MA
XIM
UM
SHE
AR
LOAD
(PO
UNDS
)
28.2
48.1
72.6
NORM
AL L
OAD
(PO
UNDS
)
34.8
69.7
139.
4
CO
C
O
LJJ
CO
CXL
0.5
PEAK STRENGTH ENVELOPE
'0
0.5
1.0
1.5
2.0
NORM
AL S
TRES
S (T
/FT2
)
COHE
SION
: 46
7.8
PSF
2.5
Figure 17. Typical direct-shear te
st plots fo
r varved clay (d
ark
lami
na,
sample no.
C-17
) showing shear
load-displacement cu
rves
and
Mohr envelope relating shear
stress and
normal stress.
TORQUE (POUND-FORCE-FOOT)H-
OQV
fD
h-100
O |
,n <^
fD "{I
H- t-« CO
13 i-{I-1 H- 03 P O OQ
fo nrs & rt 03_ HO£ rtH f£)
< COfD rtCO
&3 1 _f
P 0
!":fD l-j
< 3fD OH1 (_.
z 1 Co NO Q oo
. -H
^5O ^z
k> k> bo i;^ >4 Ul OO O 5
m o*TI TOf*\ f>oc -H m> "
Z
"^ xD
^ g ^ C ^^^ ~ r^
C> ^** ~^ S r~""">
O
^"^ 1
700
>oz
oCO
C °°
rn^5mjf 1 ^
o tomCO
0*
m
"i
^ /^c\
1
1
)t1 i i
10 **
f^ 1 1
I1!
I /
i i ij
OQ o
CO Q3
03 CO Hrt 5C-1 HfD ( « CO 03co g
P coO 03
§ 103 Jl*I-1 fD
co a
co p* oH- P
SHEAR STRESS (T/FT2)P r11 i""1 !° In o tn O
lt
m co
coH
OH Z
u> 00
0.04
0.36
o 5 O
0.28
0.20
0.12
0.04
1010
0 LO
AD I
N PS
I
Dar
k va
rved
cla
y la
yer
Sam
ple
No.
C-1
7.
1000
Figure 19. Consolidation test re
sult
s for
sample no
. C-
17 fr
om sl
ope
area VI
,lo
cali
ty no
. 1.
likelihood that such a failure on the slopes below the Sherwood mine would result in blockage of the Spokane river or in contamination of lake water by mine spoil appears remote, however, for two reasons. First, the upper slope areas adjacent to the spoil have slope angles which are generally well below the estimated internal angle of friction (see fig. 14), and second, the probable form of failure precludes the involvement of a large volume of material.
Another more-threatening form of slope failure is suggested by previous failures such as the Jackson Springs slide (fig. 5) and failures described by Jones and others, in which the failure surface cuts steeply from the ground surface to a bedding surface (usually a clay layer) which it then follows back to the ground surface. Sudden reservoir drawdown can be an important factor in activating this form of slope failure if all or part of the slope is submerged. Drawdown removes the supporting buoyant force of the reservoir water, thus reducing the factor of safety. The varved and silty clay layers in the slopes below the mine represent well-defined zones of relative weakness along which a landslide of this type might develop, assuming unstable conditions. Trial failure surfaces involving the clay layers were analyzed using the Morgenstern-Price method of stability analysis (Morgenstern and Price, 1965). The method is one of several available that subdivide the potential sliding mass into a number of vertical slices, thus simplifying irregularities in the failure surface, ground-surface profile, and stratigraphy. In the analysis, moment equilibrium is considered for each slice, as well as normal and tangential equilibrium. This method can be used to analyze the stability of a potential failure surface composed of a series of straight-line segments. The internal piezometric level or the external water surface can be incorporated in the analyses, allowing for the drawdown condition, and the slope may be zoned or layered with materials of different properties. Problems chosen for analyses are made statically determinant by assuming a suitable distribution (f(x)) for the ratio of normal force to shear force acting on the vertical sides of the slices. The factor of safety computed in the analysis for a given trial failure surface is considered acceptable provided the indicated interslice forces are physically feasible. Specifically, a line of thrust for the interslice forces positioned above the ground surface or below the failure surface represents a physical impossibility. Also, where the vertical factor of safety between slices is less than one, vertical shear is implied, and required local equilibrium is not maintained. It is generally recognized that these criteria are difficult to meet simultaneously for all slices, and may be relaxed somewhat under certain conditions (Chowdhury, 1978). Computations were made by computer using a Morgenstern-Price stability analysis program. In this study, a variety of failure-surface configurations was examined using various combinations of hydrologic conditions, material properties, and degrees of spoil-pile involvement. The Morgenstern-Price method yielded acceptable solutions for the majority of trial failure surfaces; however, attempts to obtain acceptable solutions were sometimes unsuccessful even though several different distributions relating normal and tangential interslice forces were tried. In most of those instances, the calculated line of thrust rose above the sliding mass, implying tension in the soil; or the factor of safety for one or more of the vertical slice faces fell below unity, indicating vertical shear failure. In a few cases, where the Morgenstern-Price analysis did not yield acceptable solutions, a computer-programmed sliding-wedge analysis was used. The sliding-wedge analysis (SWASE for Plane Failure (Huang, 1983)) is
39
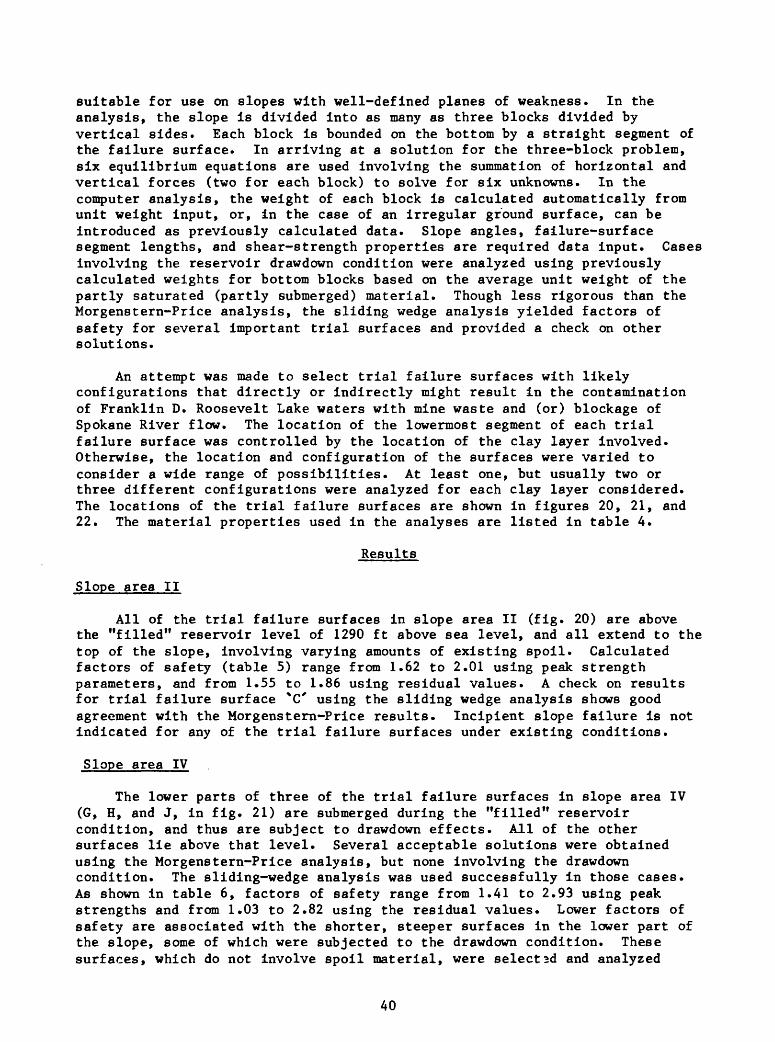
suitable for use on slopes with well-defined planes of weakness. In the analysis, the slope Is divided Into as many as three blocks divided by vertical sides. Each block Is bounded on the bottom by a straight segment of the failure surface. In arriving at a solution for the three-block problem, six equilibrium equations are used involving the summation of horizontal and vertical forces (two for each block) to solve for six unknowns. In the computer analysis, the weight of each block Is calculated automatically from unit weight input, or, in the case of an irregular ground surface, can be Introduced as previously calculated data. Slope angles, failure-surface segment lengths, and shear-strength properties are required data input. Cases involving the reservoir drawdown condition were analyzed using previously calculated weights for bottom blocks based on the average unit weight of the partly saturated (partly submerged) material. Though less rigorous than the Morgenstern-Price analysis, the sliding wedge analysis yielded factors of safety for several important trial surfaces and provided a check on other solutions.
An attempt was made to select trial failure surfaces with likely configurations that directly or Indirectly might result in the contamination of Franklin D. Roosevelt Lake waters with mine waste and (or) blockage of Spokane River flow. The location of the lowermost segment of each trial failure surface was controlled by the location of the clay layer Involved. Otherwise, the location and configuration of the surfaces were varied to consider a wide range of possibilities. At least one, but usually two or three different configurations were analyzed for each clay layer considered. The locations of the trial failure surfaces are shown in figures 20, 21, and 22. The material properties used in the analyses are listed in table 4.
Results
Slope area II
All of the trial failure surfaces In slope area II (fig. 20) are above the "filled" reservoir level of 1290 ft above sea level, and all extend to the top of the slope, involving varying amounts of existing spoil. Calculated factors of safety (table 5) range from 1.62 to 2.01 using peak strength parameters, and from 1.55 to 1.86 using residual values. A check on results for trial failure surface *C' using the sliding wedge analysis shows good agreement with the Morgenstern-Price results. Incipient slope failure Is not indicated for any of the trial failure surfaces under existing conditions.
Slope area IV
The lower parts of three of the trial failure surfaces In slope area IV (G, H, and J, in fig. 21) are submerged during the "filled" reservoir condition, and thus are subject to drawdown effects. All of the other surfaces lie above that level. Several acceptable solutions were obtained using the Morgenstern-Price analysis, but none involving the drawdown condition. The sliding-wedge analysis was used successfully in those cases. As shown in table 6, factors of safety range from 1.41 to 2.93 using peak strengths and from 1.03 to 2.82 using the residual values. Lower factors of safety are associated with the shorter, steeper surfaces in the lower part of the slope, some of which were subjected to the drawdown condition. These surfaces, which do not involve spoil material, were select2d and analyzed
40
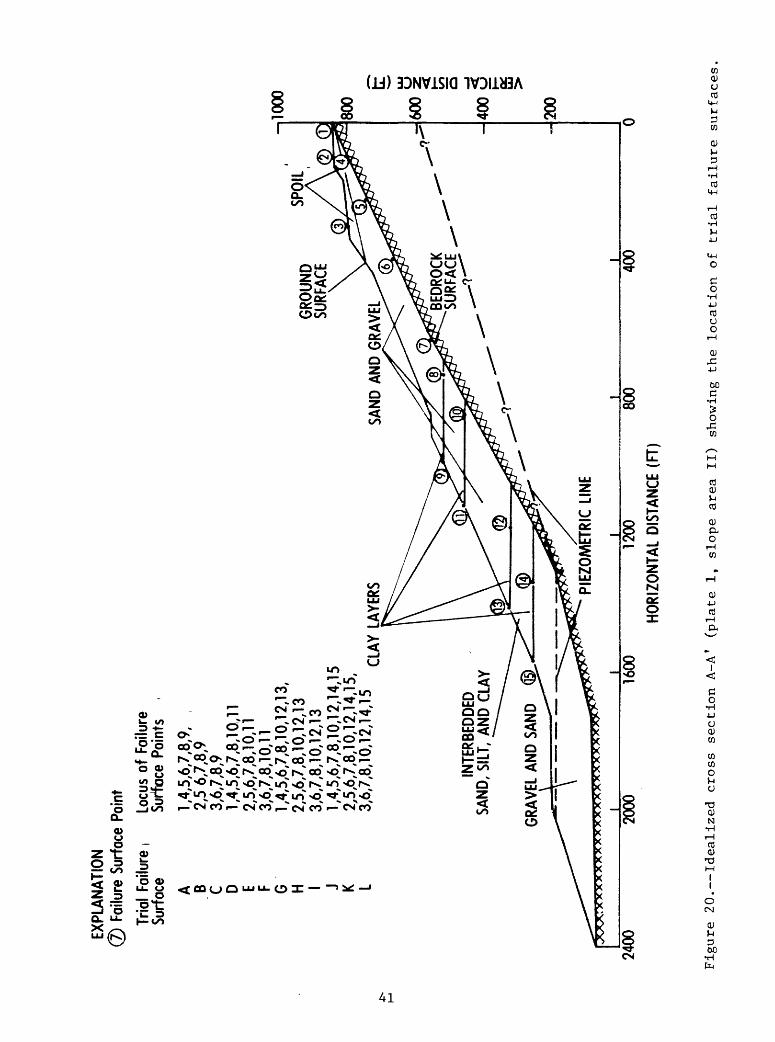
EXPL
ANAT
ION
7)
Failu
re S
urfa
ce P
oint
Tria
l Fa
ilure
S
urfa
ce A B C D E F G H I J K L
Locu
s of
Fai
lure
S
urfa
ce P
oint
s
1,4,
5,6,
7,8,
9,
,2,
5 6,
7,8,
93,
6,7,
8,9
1,4,
5,6,
7,8,
10,1
12,
5,6,
7,8,
10,1
13,
6,7,
8,10
,11
1,4,
5,6,
7,8,
10,1
2,13
,2,
5,6,
7,8,
10,1
2,13
3,6,
7,8,
10,1
2,13
1,4,
5,6,
7,8,
10,1
2,14
,15
2,5,
6,7,
8,10
,12,
14,1
53,
6,7,
8,10
,12,
14,1
5
GR
OU
ND
SU
RFAC
E
SPO
IL
jGlK
XX
XX
XX
XX
XX
XX
XX
XX
XX
X-!
_________I_
____
INTE
RBED
DED
SAN
D,
SILT
, AN
D C
LAY
GRA
VEL
AND
SAN
D
PIEZ
OM
ETR
IC L
INE
_____i
1000
800
600
400
5
200
2400
2000
1600
12
00
HO
RIZ
ON
TAL
DIST
ANCE
(FT
)
800
400
Figure 20. Idealized cross
section A-A' (plate 1, slope area II)
showing the
location of
tr
ial
failure surfaces
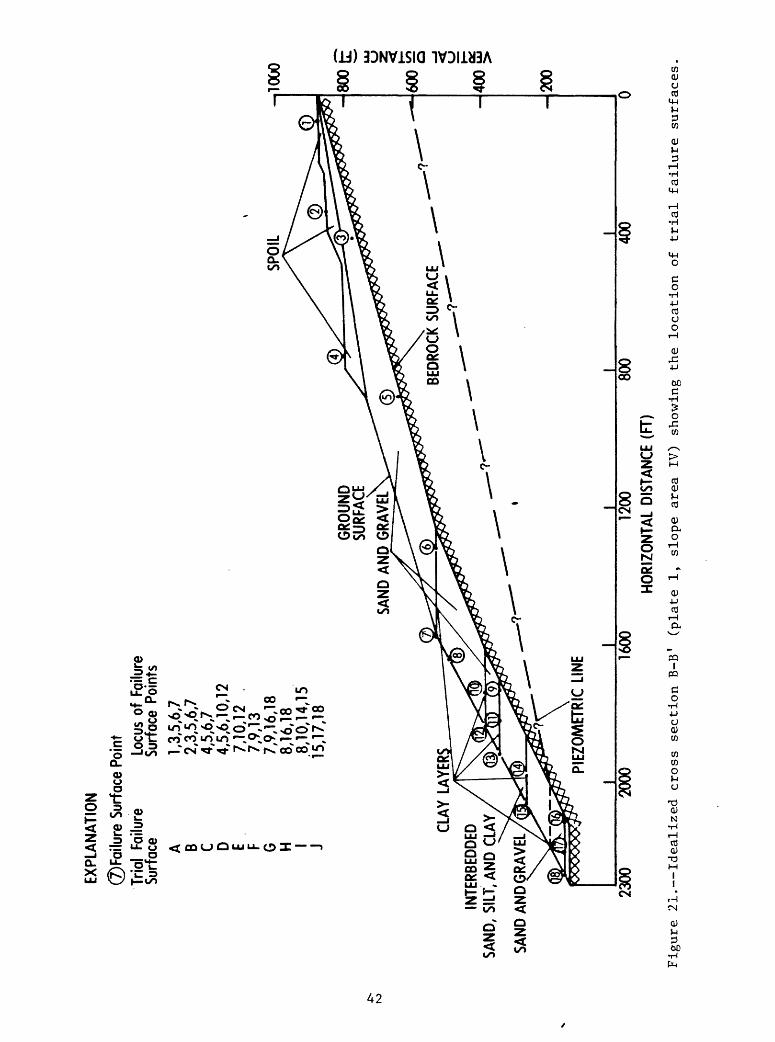
EXPL
ANAT
ION
©Fa
ilure
Sur
face
Poi
ntTr
ial
Failu
re
Locu
s of
Fai
lure
Su
rface
Su
rface
Poi
nts
A B C D E F G H
1,3,
5,6,
7 2,
3,5,
6,7
4,5,
6,7
4,5,
6,10
,12
7,10
,12
, 7,
9,13
7,
9,16
,18
8,16
,18
8,10
,14,
15
15,1
7,18
SPO
IL-
1000
CLAY
LAY
ER
INTE
RBED
DED
SAND
, SI
LT, A
ND
CLA
Y v.
SAND
AN
D G
RAVE
L
2300
2000
1600
400
1200
HORIZONTAL DISTANCE
(FT)
Figure 21. Idealized cr
oss
sect
ion
B-B'
(plate 1, sl
ope
area
IV
) showing
the
loca
tion
of trial
failure
surf
aces
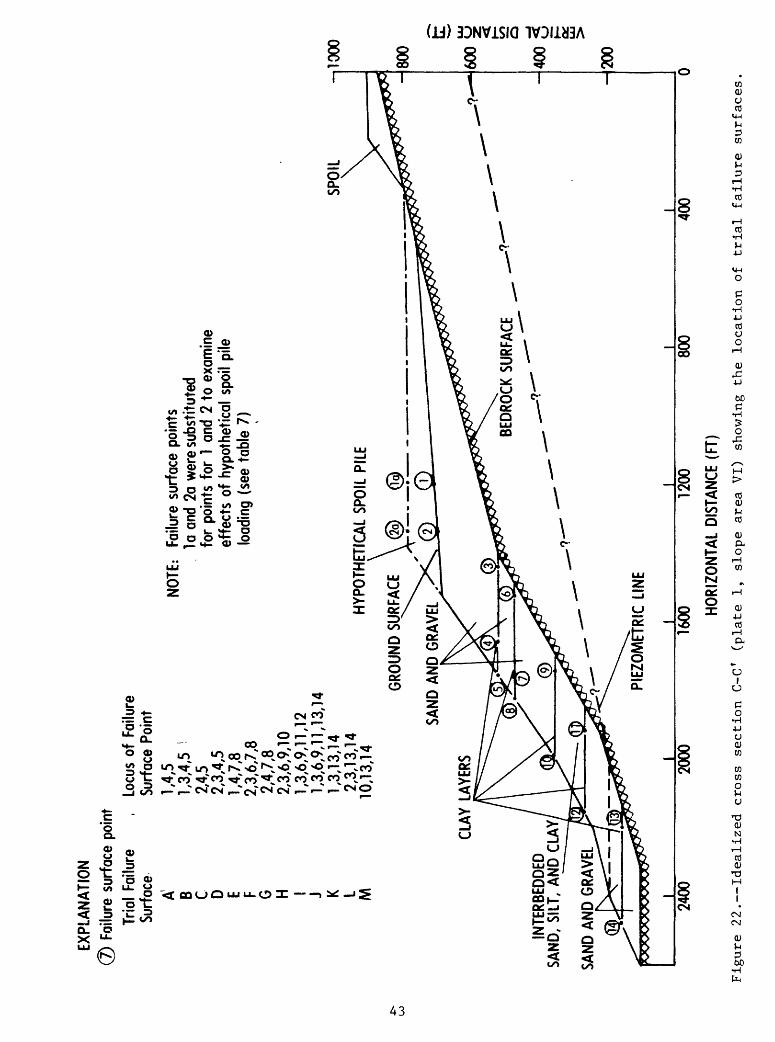
EXPL
ANAT
ION
) Fa
ilure
sur
face
poi
ntTr
ial
Failu
reSu
rface
A B C D E F G H 1 J K L M
Locu
s of
Fai
lure
Surfa
ce P
oint
1,4,
51,
3,4,
5 l
2,4,
52,
3,4,
51,
4,7,
82,
3,6,
7,8
2,4,
7,8
2,3,
6,9,
101,
3,6,
9,11
,12
1,3,
6,9,
11,1
3,14
1,3,
13,1
42,
3,13
,14
10,1
3,14
NOTE
: Fa
ilure
sur
face
poi
nts
1 a a
nd 2
a w
ere
subs
titut
ed
for
poin
ts f
or 1
and
2 t
o ex
amin
e ef
fect
s of
hyp
othe
tical
spo
il pi
le
load
ing
(see
tab
le 7
)
SPOI
L-.1
000
HYPO
THET
ICAL
SPO
IL P
ILE
GROU
ND S
URFA
CE
CLAY
LAY
ERS
INTE
RBED
DED
SAND
, SI
LT,
AND
CLAY
SAND
AND
GRA
VEL
2400
2000
400
1600
12
00
HORI
ZONT
AL D
ISTA
NCE
(FT)
Figure 22. Idealized cr
oss
sect
ion
C-C' (plate 1, slope
area
VI)
show
ing
the
loca
tion
of tr
ial
fail
ure
surfaces.
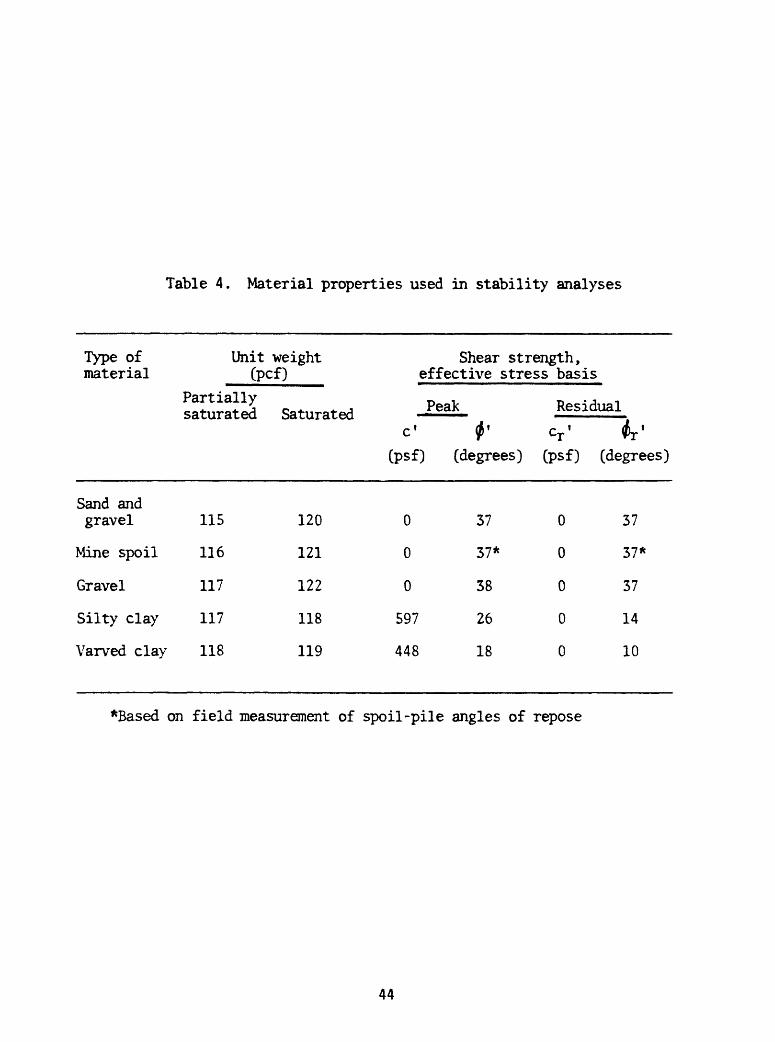
Table 4. Material properties used in stability analyses
Type of material
Sand andgravel
Mine spoil
Gravel
Silty clay
Varved clay
Unit weight(PCf)
Partially saturated
115
116
117
117
118
Saturated
120
121
122
118
119
Shear strength, effective stress basis
Peakc 1
(psf)
0
0
0
597
448
*'
(degrees)
37
37*
38
26
18
ResidualCT'
(psf)
0
0
0
0
0
*r'
(degrees)
37
37*
37
14
10
*Based on field measurement of spoil-pile angles of repose
44
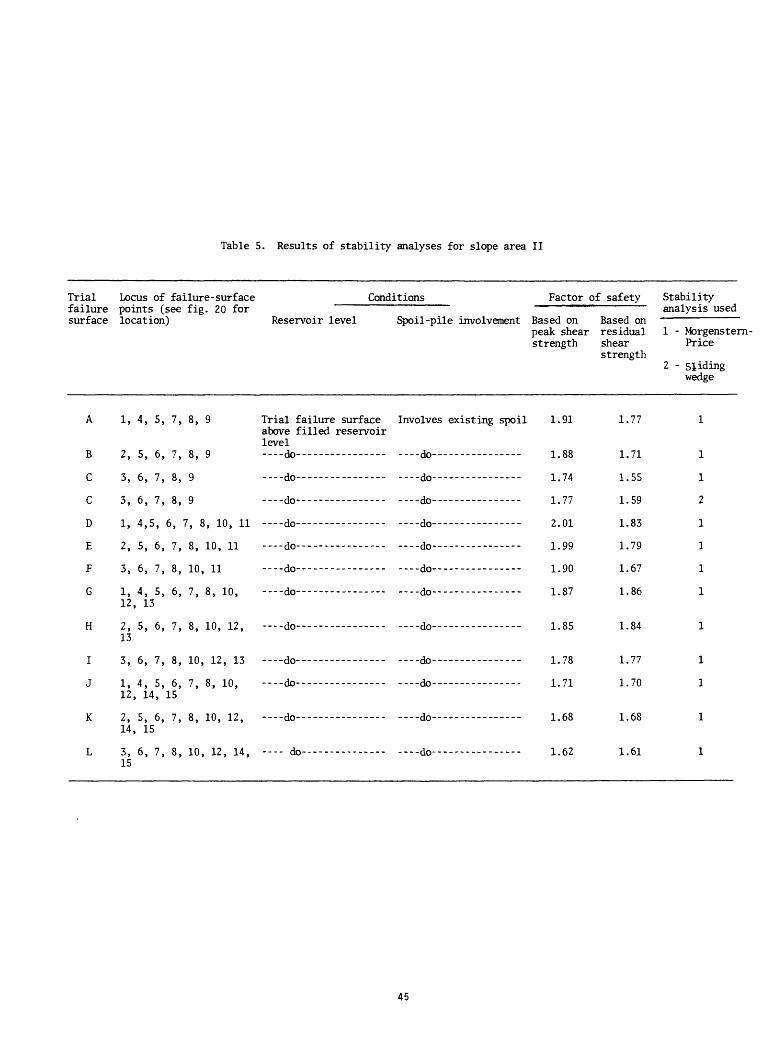
Table 5. Results of stability analyses for slope area II
Trial Locus of failure -surf ace Conditionsfailure points (see tig. 20 tor
Factor of safety Stability
surface location) Reservoir level Spoil -pile involvement Based on peak shear strength
A
C
C
D
E
F
I
J
L
1,
2
3,
3,
1,
2
3,
112,
9
13
3,
1,12,
214,
3,
4
S
6
6
4
6
4
S
6
4
S
6
, 5, 7, 8, 9 Trial failure surface Involves existing spoilabove filled reservoirlevel
> 6, 7, 8, 9 - --- do-------- ----- - do------- ---
, 7, 8, 9 ...-do-- ----------- - do---- - -
, 7, 8, 9 ...-do---------------- ---do----------------
, 6, 7, 8, 10, 11 - do ------------- ...-do------------ -
, 7, 8, 10, 11 ----do---------------- - do -
13
, 6, 7, 8, 10, 12, ---do---------------- do
, 7, 8, 10, 12, 13 ----do---------------- ----do----- --------
, 5, 6, 7, 8, 10, ----do--------------- -do 14, 15
, 6, 7, 8, 10, 12, ----do---- --------- -do ---------- 15
, 7, 8, 10, 12, 14, ---- do--------------- - do---
1.
1.
1.
1.
2.
1.
1.
1.
1.
1.
1.
1.
1.
91
CO
74
77
01
99
90
07
or
78
71
<o
62
analysis usedBased on residual 1 shear strength
2
1.
1.
1.
1.
1.
1.
1.
1.
1.
1.
1.
1.
1.
77
71
55
59
83
79
67
OS
84
77
70
£ O
61
- Morgenstei Price
- Slidingwedge
1
1
1
2
1
1
1
1
1
1
1
1
115
45
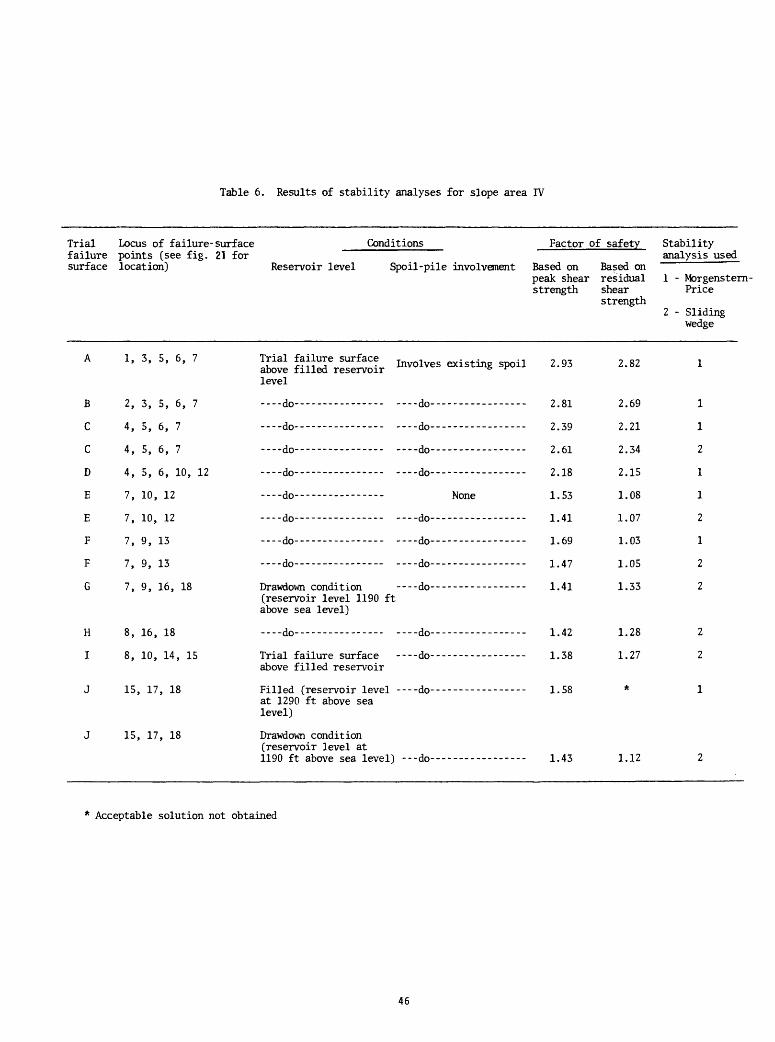
Table 6. Results of stability analyses for slope area IV
Trial Locus of failure -surf ace Conditions Factor of safety Stabilityfailure points (see fig. 21 for surface location) Reservoir level Spoil-pile involvement Based on
peak shear strength
A ' 3> 5> 6 ' 7 2£ ̂ TrSSSr a-* ̂ ^ ̂ level
B 2, 3, 5, 6, 7 ----do---- --- --- ----do-----------------
C 4, 5, 6, 7 ...-do---------------- do -- -
C 4, 5, 6, 7 - do------------ - -do-------- ---------
D 4, 5, 6, 10, 12 do do -
E 7, 10, 12 ...-do---------------- None
F 7, 9, 13 ....do--------------- - do
F 7, 9, 13 do ------ do --- -
(reservoir level 1190 ft above sea level)
H 8, 16, 18 - do -do---
I 8, 10, 14, 15 Trial failure surface - do-----------------above filled reservoir
J 15, 17, 18 Filled (reservoir level -do----------------- at 1290 ft above sea level)
J 15, 17, 18 Drawdown condition (reservoir level at
2.93
2.81
2.39
2.61
2.18
1.53
1.41
1.69
1.47
1.41
1.42
1.38
1.58
1.43
analysis usedBased on residual 1 shear strength
2
2.82
2.69
2.21
2.34
2.15
1.08
1.07
1.03
1.05
1.33
1.28
1.27
*
1.12
- Morgensten Price
- Sliding wedge
1
1
1
2
1
1
2
1
2
2
2
2
1
2
* Acceptable solution not obtained
46
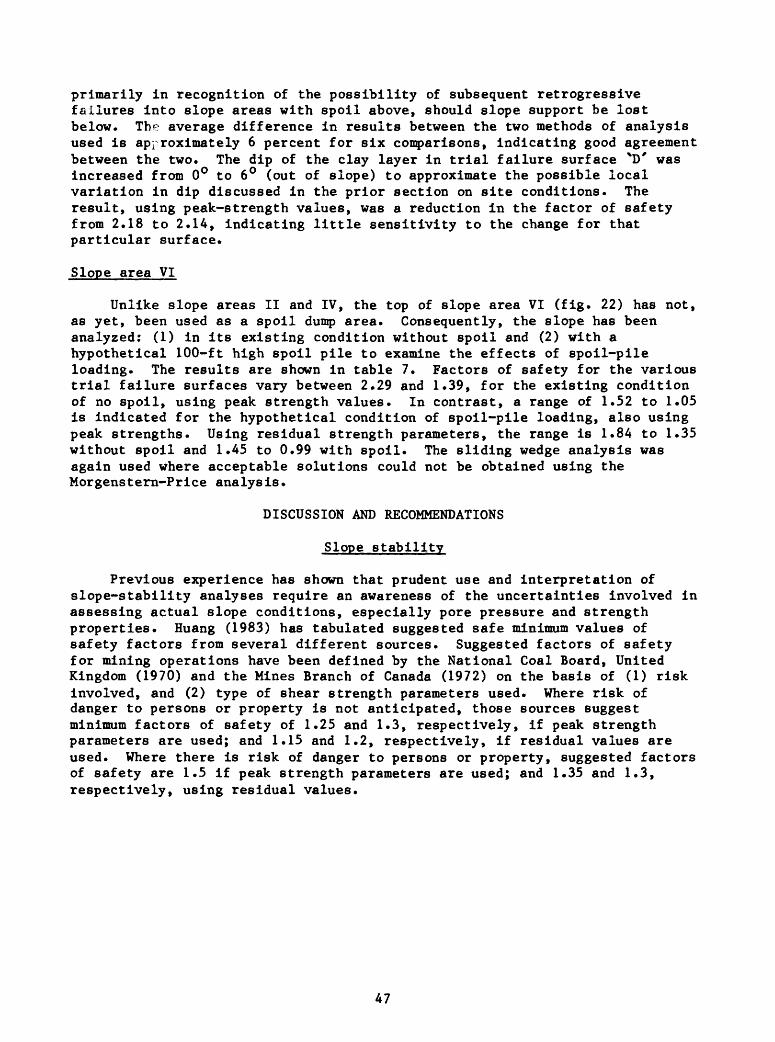
primarily in recognition of the possibility of subsequent retrogressive failures into slope areas with spoil above, should slope support be lost below. The average difference in results between the two methods of analysis used is approximately 6 percent for six comparisons, indicating good agreement between the two. The dip of the clay layer in trial failure surface %D' was increased from 0° to 6° (out of slope) to approximate the possible local variation in dip discussed in the prior section on site conditions. The result, using peak-strength values, was a reduction in the factor of safety from 2.18 to 2.14, indicating little sensitivity to the change for that particular surface.
Slope area VI
Unlike slope areas II and IV, the top of slope area VI (fig. 22) has not, as yet, been used as a spoil dump area. Consequently, the slope has been analyzed: (1) in its existing condition without spoil and (2) with a hypothetical 100-ft high spoil pile to examine the effects of spoil-pile loading. The results are shown in table 7. Factors of safety for the various trial failure surfaces vary between 2.29 and 1.39, for the existing condition of no spoil, using peak strength values. In contrast, a range of 1.52 to 1.05 is indicated for the hypothetical condition of spoil-pile loading, also using peak strengths. Using residual strength parameters, the range is 1.8A to 1.35 without spoil and 1.A5 to 0.99 with spoil. The sliding wedge analysis was again used where acceptable solutions could not be obtained using the Morgenstern-Price analysis.
DISCUSSION AND RECOMMENDATIONS
Slope stability
Previous experience has shown that prudent use and interpretation of slope-stability analyses require an awareness of the uncertainties involved in assessing actual slope conditions, especially pore pressure and strength properties. Huang (1983) has tabulated suggested safe minimum values of safety factors from several different sources. Suggested factors of safety for mining operations have been defined by the National Coal Board, United Kingdom (1970) and the Mines Branch of Canada (1972) on the basis of (1) risk involved, and (2) type of shear strength parameters used. Where risk of danger to persons or property is not anticipated, those sources suggest minimum factors of safety of 1.25 and 1.3, respectively, if peak strength parameters are used; and 1.15 and 1.2, respectively, if residual values are used. Where there is risk of danger to persons or property, suggested factors of safety are 1.5 if peak strength parameters are used; and 1.35 and 1.3, respectively, using residual values.
47
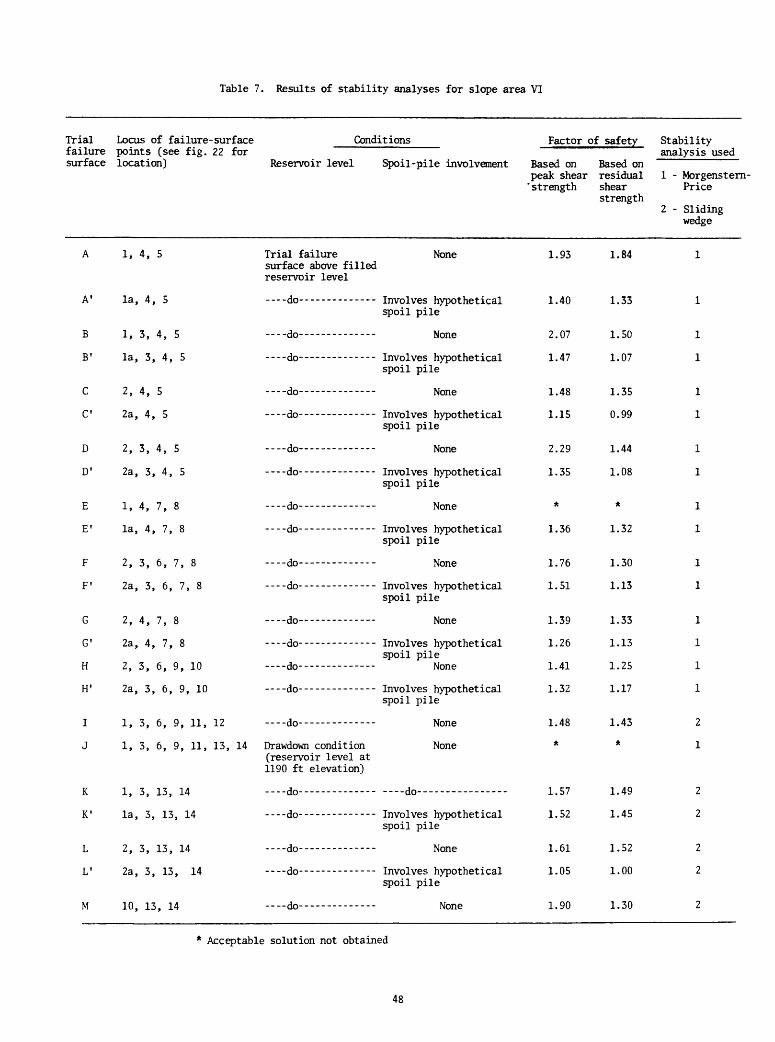
Table 7. Results of stability analyses for slope area VI
Trial Locus of failure-surface Conditions___failure points (see fig. 22 forsurface location) Reservoir level Spoil-pile involvement
Factor of safety Stabilityanalysis used
Based on Based on peak shear residual 1 - Morgenstern- "strength shear Price
strength2 - Sliding
wedge
1, 4, 5 Trial failure surface above filled reservoir level
None
A' la, 4, 5 ----do---- ------- involves hypotheticalspoil pile
B 1, 3, 4, 5 -do - --- None
B' la, 3, 4, 5 -..-do-------------- Involves hypotheticalspoil pile
C 2, 4, 5 --.-do-------------- None
C' 2a, 4, 5 ----(jo---.-----.--.- involves hypotheticalspoil pile
D 2, 3, 4, 5 -..-(jo------ ----- None
D' 2a, 3, 4, 5 -..-do------- - ----- Involves hypotheticalspoil pile
E 1, 4, 7, 8 ...-do----- --- None
E' la, 4, 7, 8 ----do--- -------- involves hypotheticalspoil pile
F 2, 3, 6, 7, 8 ----do- ---------- None
F' 2a, 3, 6, 7, 8 ----do - -- - Involves hypotheticalspoil pile
G 2, 4, 7, 8 -.--do-------------- None
G' 2a, 4, 7, 8 -.--do-------------- Involves hypotheticalspoil pile
H 2, 3, 6, 9, 10 -do- --- None
H 1 2a, 3, 6, 9, 10 ----do -- Involves hypotheticalspoil pile
I 1, 3, 6, 9, 11, 12 ---do------------ None
J 1, 3, 6, 9, 11, 13, 14 Drawdown condition None(reservoir level at 1190 ft elevation}
K 1, 3, 13, 14 --.-do-------------- do------ -----
K' la, 3, 13, 14 ...-do-------------- Involves hypotheticalspoil pile
L 2, 3, 13, 14 ...-do-------------- None
L' 2a, 3, 13, 14 ..--do-------------- Involves hypotheticalspoil pile
M 10, 13, 14 -.--do-------------- None
1.93
1.40
2.07
1.47
1.48
1.15
2.29
1.35
*
1.36
1.76
1.51
1.39
1.26
1.41
1.32
1.48
1.57
1.52
1.61
1.05
1.90
1.84
1.33
1.50
1.07
1.35
0.99
1.44
1.08
*
1.32
1.30
1.13
1.33
1.13
1.25
1.17
1.43
1.49
1.45
1.52
1.00
1.30
* Acceptable solution not obtained
48
The following trial failure surfaces have factors of safety (FS) lower than the recommended minimums if a risk of danger to persons or property is involved.
Slope area
II
IV
VI
Shear strength parameter used
Residual (FS <1.35)Peak (FS <1.5)
Residual (FS <1.35)Peak (FS <1.5)
Residual (FS <1.35)
Peak (FS <1.5)
Trial failure surfaces (see figs. 20, 21, and 22 for locations, and tables 6 and 7 for type analysis used)NoneNone
E, F, G, H, I, and J G, H, I, and J
A',IT,C',D',E',F, F',6, 6 , H, H , L , M A,£,C, C,D,E, G, G , H, H , I, L
Factors of safety for slope area II give no indication of an immediate threat of slope failure under existing conditions. However, additional spoil pile loading at the top of the slope may result in a reduction of the factor of safety, for one or more of the trial failure surfaces, below the suggested minimum. It is recommended that, prior to actualization, the effects of additional loading be analyzed and the results evaluated in terms of the recommended factors of safety. Factors of safety less than the suggested minimum will require the selection of alternate dumping sites that eliminate or reduce the risk of a massive slope failure. Mitigating circumstances associated with slope area II include the apparent absence of clay strata in the interval below the "filled" reservoir level penetrated by drill hole no. 2, relatively low slope angles (<30°), and the presence of a large terrace area at the bottom of the slope that may prevent any slope failures originating above from reaching Franklin D. Roosevelt Lake.
Trial failure surfaces in slope area IV with computed factors of safety lower than suggested safe minimums are located in the lower part of the slope and do not involve existing spoil. However, a landslide on any of those surfaces may result in subsequent retrogressive failures by destabilizing slope areas above, possibly incorporating some areas overlain by spoil. It is recommended that such landslide-susceptible areas be routinely examined, especially during periods of drawdown and wet periods, to identify any newly formed or impending slope failures. If such a failure occurs, the slope should be re-analyzed in light of the new conditions, and corrective action taken to eliminate or prevent additional mass movements that might result in contamination of Franklin D. Roosevelt Lake or blockage of Spokane River flow. Factors of safety for trial failure surfaces in the upper parts of slope area IV are relatively high, indicating no immediate threat under existing conditions of spoil-pile loading. Additional spoil added to the top of the slope will increase shear forces and may result in an unacceptable reduction in the factors of safety. It is recommended, therefore, that the effect of additional spoil-pile loading be determined, in advance, and appropriate action be taken to maintain factors of safety above the recommended minimums.
Most of the trial failure surfaces in slope area VI have factors of safety below the recommended minimums of 1*5, using peak strengths, and 1.3 using residual. This is attributable, in large part, to the hypothetical condition of spoil-pile loading imposed on some of the trial failure surfaces and to the slope steepness (as great as 37°). Because of the low factors of safety associated with the hypothetical condition of spoil-pile loading, it is recommended that the top of slope area VI not be used as a spoil dump area. A massive landslide on slope area VI, under present conditions, may block the flow of Blue Creek, a small stream that flows into the Spokane Arm of Franklin D. Roosevelt Lake from the north (fig. 1), but would not involve existing spoil and almost certainly would not block the flow of the Spokane River.
Surface run-off and erosion
Surface run-off that is concentrated and uncontrolled has the following undesirable effects:
The surface run-off quickly erodes the cohesionless sand, silt, and gravel deposits creating deep gullies that may cut headward into the spoil piles. Radioactive materials and toxic metals present in the spoil may then be transported downslope, and eventually deposited in Franklin D. Roosevelt Lake. In addition, large alluvial fans are formed at the bottoms of slopes that block access roads and bury fence lines. If the run-off from the mine is channeled onto slope areas susceptible to landsliding, such as the lower part of slope area IV, or if water is ponded above such areas, it increases the likelihood of slope failure by saturating the slope and any weak clay layers present. It is recommended that surface run-off from the mine area be directed away from potentially unstable slopes and distributed or otherwise controlled to eliminate concentrations that tend to result in gully erosion, movement of spoil material downslope, and the development of alluvial fans. Pipe or other impervious conduit should be used if runoff must be carried across an unstable slope. Also, changes in the topography that would result in ponding above unstable slopes should be avoided, and any existing conditions that cause such ponding should be eliminated.
50
REFERENCES
Atwater, B. F., 1983, JBkulhlaups in the Sanpoil arm of glacial Lake Columbia,Washington: U.S. Geological Survey Open-File Report 83-456, 19 p., 9figs.
Baker, V.R., 1973, Paleohydrology and sedimentology of Lake Missoula floodingin eastern Washington: Geological Society of America Special Paper 144,79 p.
Becraft, G. E., and Wels, P. L., 1963, Geology and mineral deposits of theTurtle Lake Quadrangle, Washington: U.S. Geol. Survey Bulletin 1131, 73P-
Bishop, A. W., Green, G. E., Garga, V. K., Andresen, A., and Brown, J. D.,1971, A new ring shear apparatus and its application to the measurementof residual shear strength: Geotechnique, v. 21, no. 4, p. 273-328.
Bishop, A. W., and Henkel, D. J., 1962, The measurement of soil properties inthe triaxial test: London, Edward Arnold (Publishers) Ltd., 228 p.
Bretz, J. H., 1923, Glacial drainage on the Columbia Plateau: GeologicalSociety of America Bulletin, v. 34, no. 3, p. 573-608.
Bretz, J. H., 1928, The Channeled Scabland of eastern Washington: GeographicalReview, V. 18, p. 446-477.
Bretz, J. H., Smith, H. T. U., and Neff, G. E., 1956, Channeled Scabland ofWashington new data and interpretations: Geological Society of AmericaBulletin, v. 67, p. 957-1049.
Chowdhury, R. N., 1978, Slope analysis, v. 22 j>£ Developments in geotechnicalengineering: New York, Elsevier Scientific Publishing Company, 423 p.
Flint, R. F., 1936, Stratified drift and deglaciation in eastern Washington:Geological Society of America Bulletin, v. 47, p. 1849-1884.
Fookes, P. G., and Denness, B., 1969, Observational studies on fissurepatterns in Cretaceous sediments of south-east England: Geotechnique, v.19, no. 4, p. 453-477.
Head, K. H., 1982, Manual of soil laboratory testing, volume 2 Permeability,shear strength and compressibility tests: New York, John Wiley & Sons,747 p.
Huang, Y. H. 1983, Stability analysis of earth slopes: New York, Van NostrandReinhold Company, 305 p.
Jones, F. 0., Embody, D. R., and Peterson, W. L., 1961, Landslides along theColumbia River valley, northeastern Washington: U. S. Geological SurveyProfessional Paper 367, 98 p.
Lambe, T. W., and Whitman, R. V., 1969, Soil mechanics: New York, John Wiley &Sons, Inc., 553 p.
Milligan, V., Soderman, L. G., and Rutka, A., 1962, Experience with Canadianvarved clays: Journal of the Soil Mechanics and Foundations Division,Proceedings of the American Society of Civil Engineers, v. 88, no. SM4, p. 31-67.
Mines Branch (Canada), 1972, Tentative design guide for mine waste embankmentsin Canada: Department of Energy, Mines, and Resources, Canada.
Morgenstern, N. R., and Price, V. E., 1965, The analysis of the stability ofgeneral slip surfaces: Geotechnique, v. 15, no. 1, p. 79-93.
National Coal Board (United Kingdom), 1970, Spoil heaps and lagoons: London,England, Technical handbook.
Pardee, J. T., 1942, Unusual currents in glacial Lake Missoula, Montana:Geological Society of America Bulletin, v. 53, p. 1569-1600.
51
Pearson, R. C. and Obradovich, J. D., 1977, Eocene rocks In northeastWashington radlometrlc ages and correlation: U. S. Geological SurveyBulletin 1433, 41 p.
Richmond, G. M., Fryxell, R., Neff, G. E., and Weis, P. L., 1965, TheCordilleran Ice sheet of the northern Rocky Mountains, and relatedQuaternary history of the Columbia Plateau, _in Wright, H. E., and Frey,D. G., eds., The Quaternary of the United States: Princeton, N. J.,Princeton Univ. Press, p. 231-242.
Schuster, R. L., 1979, Reservoir-induced landslides: Bulletin of theInternational Association of Engineering Geology, no. 20, p. 8-15.
Scott, J. H., Tibbetts, B. L., and Burdick, R. G., 1972, Computer analysis ofseismic refraction data: Bureau of Mines Report of Investigations, no.7594, 95 p.
Smith, R. M., and Schuster, R. L., 1971, Engineering properties of glaciallake deposits in the Missouri River Canyon, Montana: Proceedings of the9th Annual Engineering Geology and Soil Engineering Symposium, Boise,Idaho, p. 65-89.
Sowers, G. F., 1979, Introductory soil mechanics and foundations Geotechnicalengineering: New York, Macmillan Publishing Co.,Inc., 621 p.
U. S. Bureau of Reclamation, 1966-82, Franklin D. Roosevelt Lake annualinspection reports, Columbia Basin project: Unpublished internal reportsavailable at U.S. Bureau of Reclamation office, Boise, Idaho.
U. S. Department of Commerce, Weather Bureau, 1949, Climatalogical data Washington, annual summary 1948: v. 52, no. 13, p. 290-300.
Waitt, R. B., Jr., 1980a, Cordilleran ice sheet and Lake Missoula catastrophicfloods, Columbia River valley, Chelan to Walla Walla: Guidebook for WestCoast Friends of the Pleistocene Field Conference.
Waitt, R. B., Jr., 1980b, About forty last-glacial Lake Missoula jBkulhlaupsthrough southern Washington: Journal of Geology, V. 88, p. 653-679.
Waitt, R. B., Jr., 1983, Tens of successive, colossal Missoula floods at northand east margins of Channeled Scabland: U. S. Geological Survey Open-FileReport 83-671, 23 p., 6 figs.
Waitt, R. B., Jr., and Thorson, R. M., 1983, The Cordilleran ice sheet inWashington, Idaho, and Montana, JLn_ Porter, S. C., ed., Late PleistoceneEnvironments of the United States: University of Minnesota Press, p. 53-70.
Walker, F. C., and Irwin, W. H., 1954, Engineering problems in Columbia Basinvarved clay: American Society of Civil Engineers, Proceedings, Separateno. 515, v. 80, 18 p.
Weaver, C. E., 1920, The mineral resources of Stevens County: WashingtonGeological Survey Bulletin, no. 20, 350 p.
52