Embed Size (px)
Citation preview
Department of the Environment
Tad Aburn - Air Director, MDEJune 21, 2012 - AWMA Meeting - San Antonio, TX
Complying With the NAAQS- 2012 and Beyond -
The Dominant Role of Air Pollution Transport- Science, Control Programs and Challenges -

Department of the Environment
EPATad
Just submit the SIP!! …I don’t care what you think - the law says
you can clean the air by 2013
But that’s scientificall
y impossible
… man

Topics• A little background on Maryland and the Mid-
Atlantic
• The sad story of Baltimore– The poster child of transport
• A “meteorologically challenged” area
• Really understanding transport– The elevated pollution reservoir
– The different types of transport
• Pushing for National Control Programs
– The critical role of CSAPR, Tier 3/Low Sulfur Fuel and CSAPR #2
• Other CAA legal options– Now being considered by MD and other states

p. 4
Progress in Cleaning Maryland’s Air
152 153 149 143126 129
121
0
40
80
120
160
1997 1999 2001 2003 2005 2007 2009
1-H
our
Ozo
ne (
ppb)
1-Hour Ozone
15.8 15.914.5
11.6
17.1
12.915.616.215.9
0
4
8
12
16
20
2002 2003 2004 2005 2006 2007 2008 2009 2010
Ann
ual P
M2.
5 (
ug/m
3 )
Annual Fine Particulate41 41 39
3530
42 4137
33
2002 2003 2004 2005 2006 2007 2008 2009 2010
Dai
ly P
M2.
5 (
ug/m
3 )
0
10
20
30
40
50Daily Fine Particulate
8-Hour Ozone
110 110 106 10391 94 89919394
104107107
87
1997 1999 2001 2003 2005 2007 2009
8-H
our
Ozo
ne (
ppb)
0
40
80
120
What Have We Learned from All of This?
What Have We Learned from All of This?
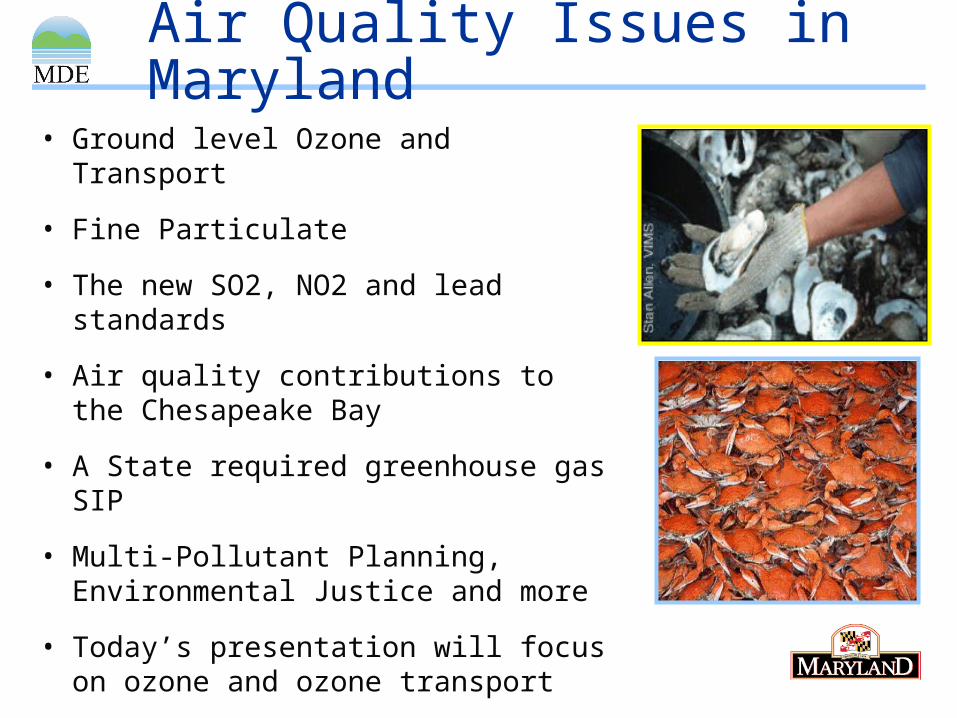
Air Quality Issues in Maryland
• Ground level Ozone and Transport
• Fine Particulate
• The new SO2, NO2 and lead standards
• Air quality contributions to the Chesapeake Bay
• A State required greenhouse gas SIP
• Multi-Pollutant Planning, Environmental Justice and more
• Today’s presentation will focus on ozone and ozone transport
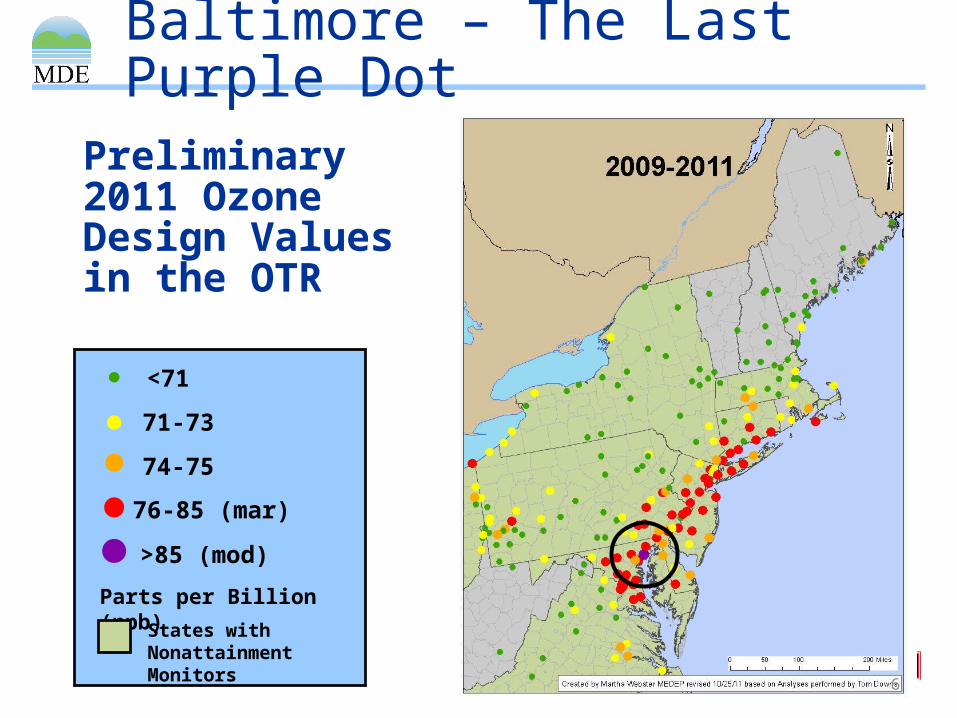
Preliminary 2011 OzoneDesign Valuesin the OTR
6
Parts per Billion (ppb)
<71
71-73
74-75
76-85 (mar)
>85 (mod)
States with Nonattainment Monitors
Baltimore – The Last Purple Dot

The Top 10 – or Maybe the Bottom 10 - List
p. 7
81
81
81
82
82
82
83
83
84
92
Davidsonville, MD (240030014)
Fairhill, MD (240150003)
Colliers Mills, NJ (340290006)
Clarksboro, NJ (340150002)
Holtsville, NY (361030009)
Franconia, VA (510590030)
Susan Wagner, NY (360850067)
NEA, PA (421010024)
Babylon, NY (361030002)
Edgewood, MD (240251001)
Top 10 Ozone Sites in OTR for 2011 (ppb)
Note: 2011 data are preliminary.

What About Maryland’s Healthy Air Act?• Yes – It’s a $3 Billion EGU control program
– Single sources in upwind states now emit more NOx than all of MDs sources combined
– NJ, PA, Philly – Say thank you!
• Also a California Car State– Toughest car standards allowed by law
• New local rules on everything we can find– Cement kilns to perfume
– Even pushing crazy stuff• Using transportation conformity budgets to drive
deeper mobile source NOx reductions
• If you have a new idea – let me know
• Supporting EPA on Tier 3/LSF, CSAPR, MATs, and every other federal effort on regional rules
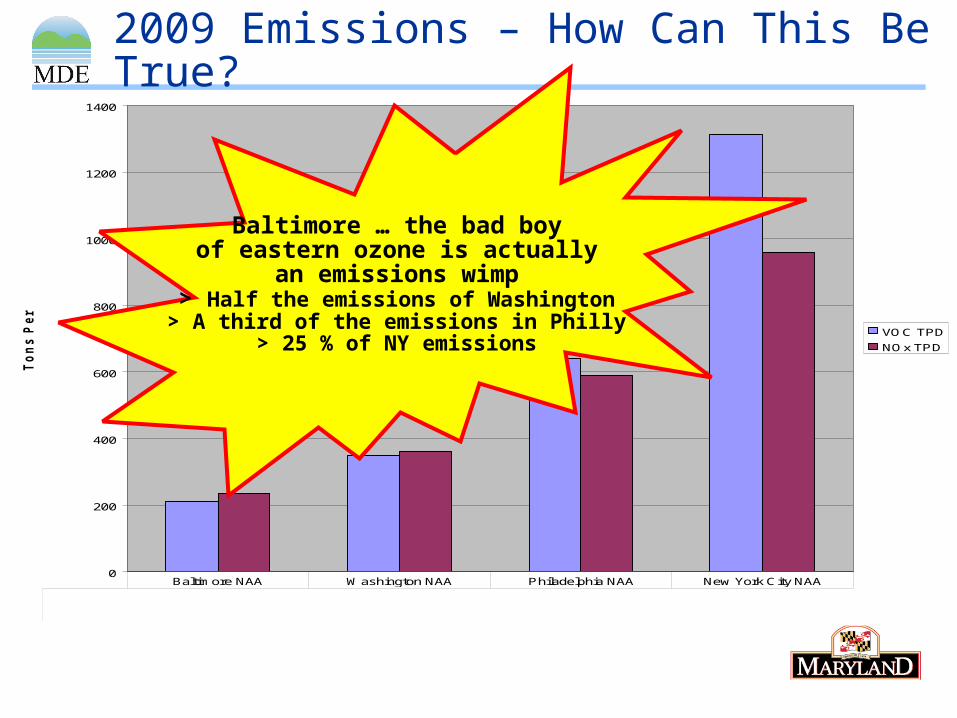
2009 Emissions – How Can This Be True?
0
200
400
600
800
1000
1200
1400
To
ns P
er D
ay
VOC TPD
NOx TPD
VOC TPD 210.9 348.75 640.43 1314.27
NOx TPD 236.46 362.06 590.94 960.8
Baltimore NAA Washington NAA Philadelphia NAA New York City NAA
Baltimore … the bad boyof eastern ozone is actually
an emissions wimp> Half the emissions of Washington> A third of the emissions in Philly
> 25 % of NY emissions

2009 Emissions – What About Nearby States?
0
200
400
600
800
1000
1200
1400
To
ns P
er D
ay
VOC TPD
NOx TPD
VOC TPD 210.9 348.75 640.43 1314.27
NOx TPD 236.46 362.06 590.94 960.8
Baltimore NAA Washington NAA Philadelphia NAA New York City NAA
Add the NOx emissions from the 4 most significant upwind,
nearby states - that contributeto Maryland
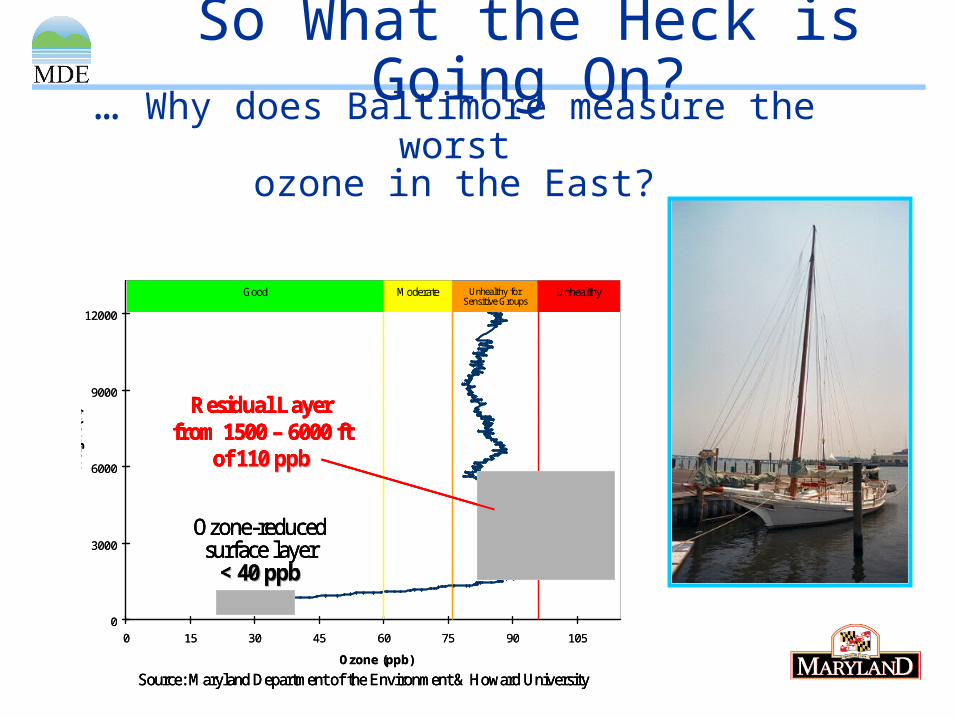
So What the Heck is Going On?
0
3000
6000
9000
12000
0 15 30 45 60 75 90 105
Ozone (ppb)
He
igh
t (f
t)
Incoming OzoneAugust 2, 2005 (7:00 AM EDT)
Beltsville, MDGood Moderate Unhealthy for
Sensitive GroupsUnhealthy
Residual Layerfrom 1500 – 6000 ft
of 110 ppb110 ppb
Ozone-reduced surface layer
<< 40 ppb40 ppb
Source: Maryland Department of the Environment & Howard University
0
3000
6000
9000
12000
0 15 30 45 60 75 90 105
Ozone (ppb)
He
igh
t (f
t)
Incoming OzoneAugust 2, 2005 (7:00 AM EDT)
Beltsville, MDGood Moderate Unhealthy for
Sensitive GroupsUnhealthyGood Moderate Unhealthy for
Sensitive GroupsUnhealthy
Residual Layerfrom 1500 – 6000 ft
of 110 ppb110 ppb
Ozone-reduced surface layer
<< 40 ppb40 ppb
Source: Maryland Department of the Environment & Howard University
Residual Layerfrom 1500 – 6000 ft
of 110 ppb110 ppb
Ozone-reduced surface layer
<< 40 ppb40 ppb
Source: Maryland Department of the Environment & Howard University
… Why does Baltimore measure the worstozone in the East?
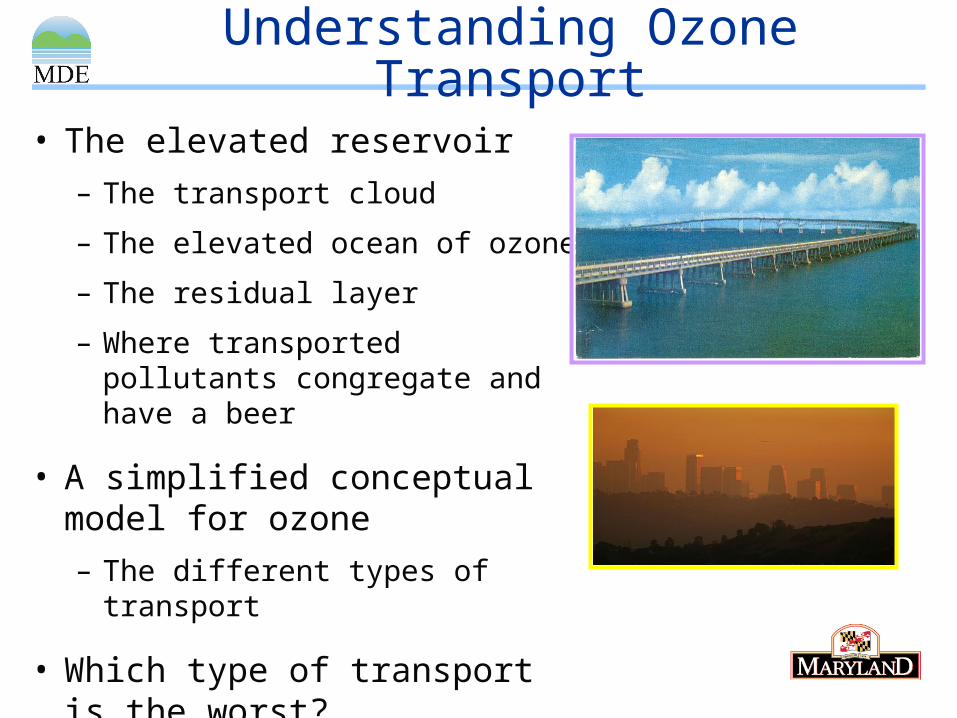
Understanding Ozone Transport
• The elevated reservoir
– The transport cloud
– The elevated ocean of ozone
– The residual layer
– Where transported pollutants congregate and have a beer
• A simplified conceptual model for ozone
– The different types of transport
• Which type of transport is the worst?
p. 13
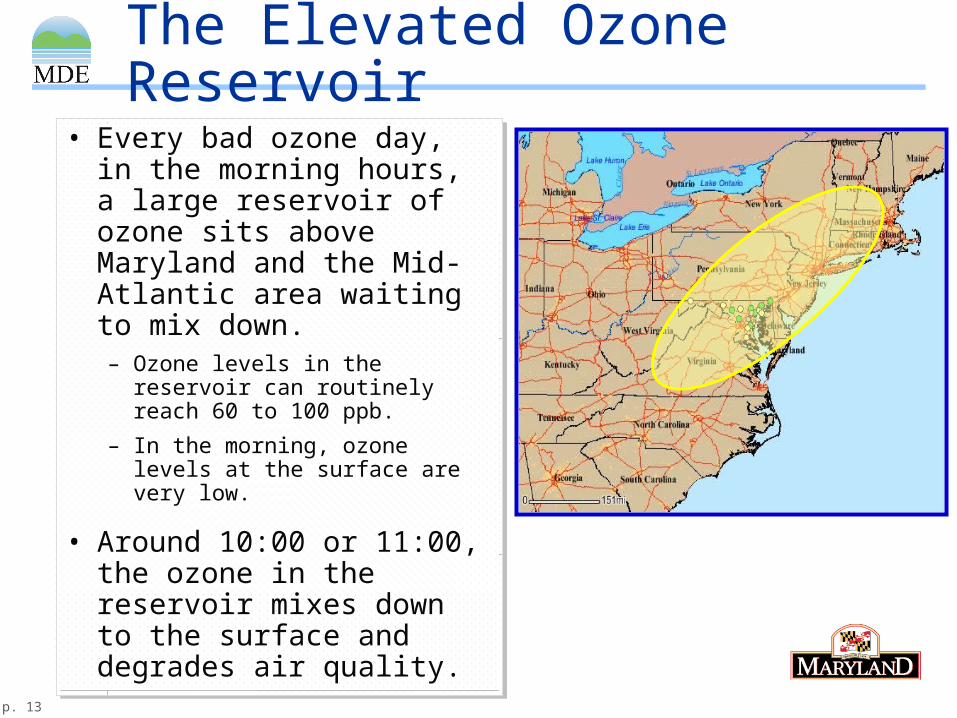
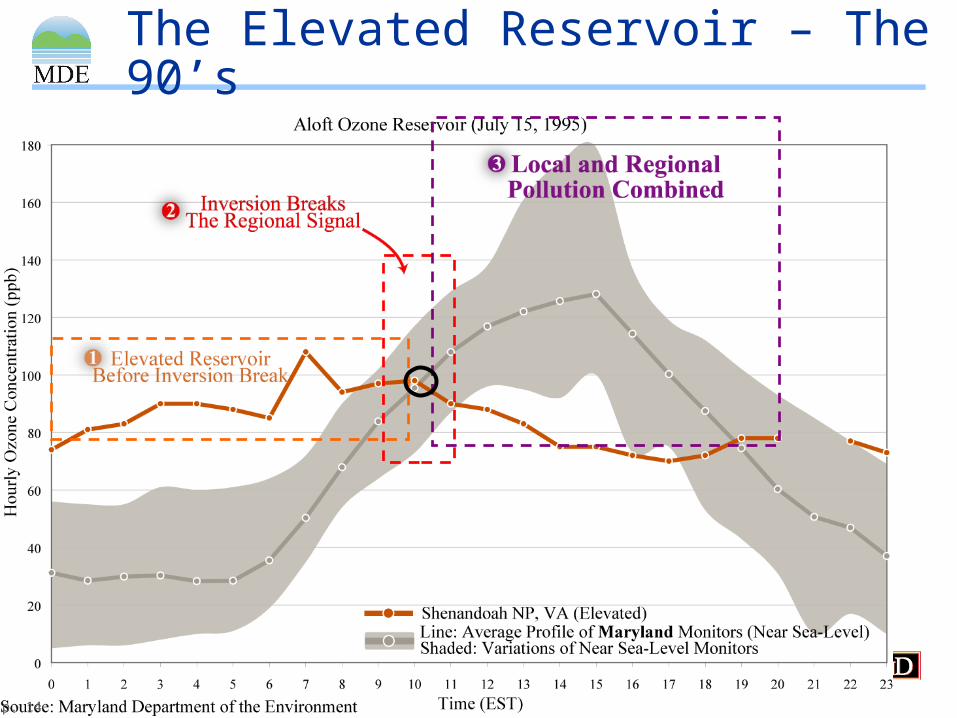
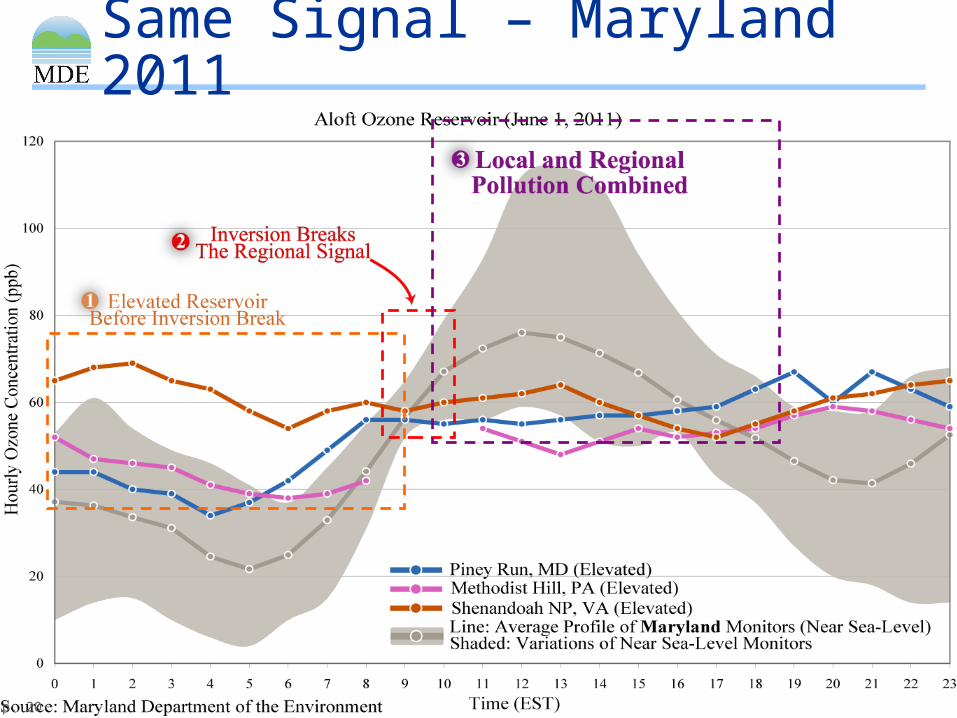
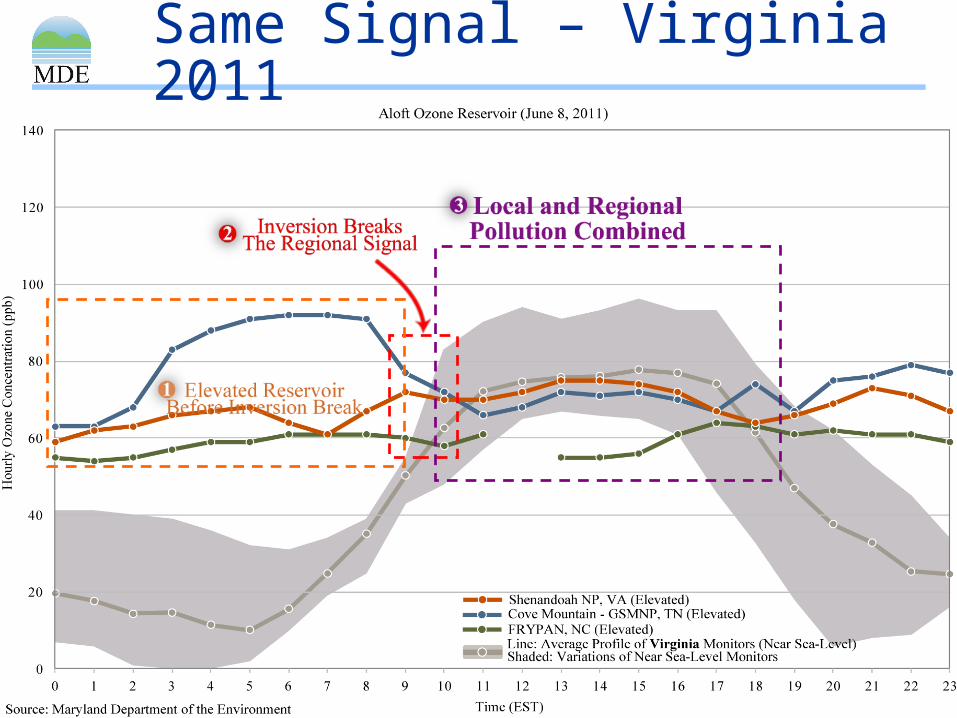
The Elevated Ozone Reservoir
• Every bad ozone day, in the morning hours, a large reservoir of ozone sits above Maryland and the Mid-Atlantic area waiting to mix down.– Ozone levels in the reservoir
can routinely reach 60 to 100 ppb.
– In the morning, ozone levels at the surface are very low.
• Around 10:00 or 11:00, the ozone in the reservoir mixes down to the surface and degrades air quality.
p. 14
The Elevated Reservoir – The 90’s

p. 15
Same Signal – Philly 1995
p. 16
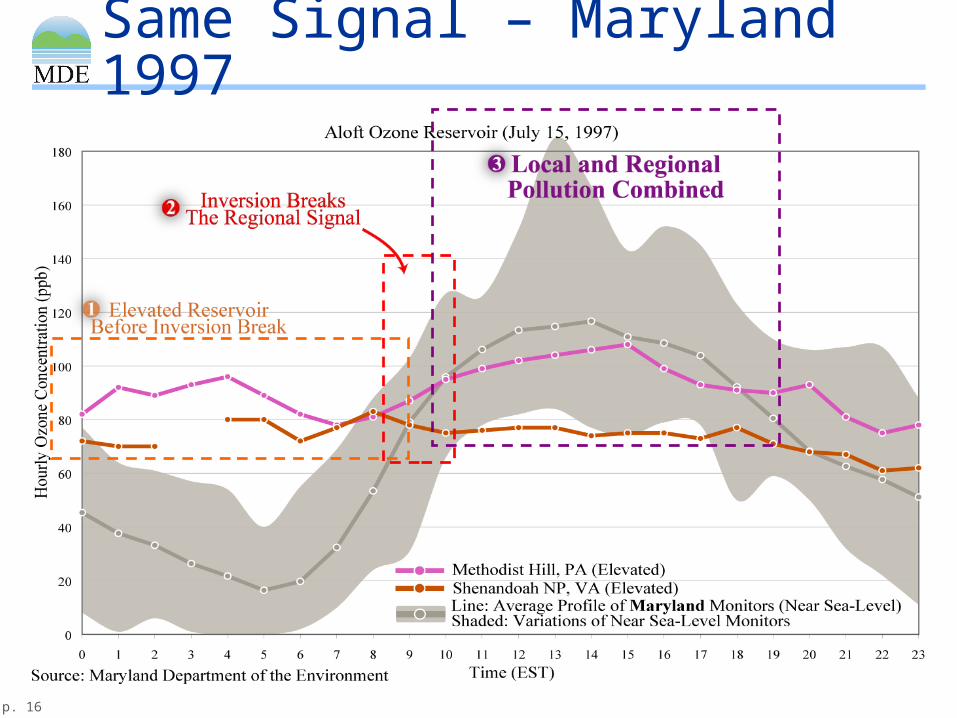
Same Signal – Maryland 1997

p. 17
Same Signal – Philly 1997

p. 18
Same Signal – Maryland 2008

p. 19
Same Signal – Philly 2008
p. 20
Same Signal – Maryland 2011

p. 21
Same Signal – Tennessee 2011
p. 22
Same Signal – Virginia 2011

p. 23
Same Signal – Massachusetts 2011
p. 24
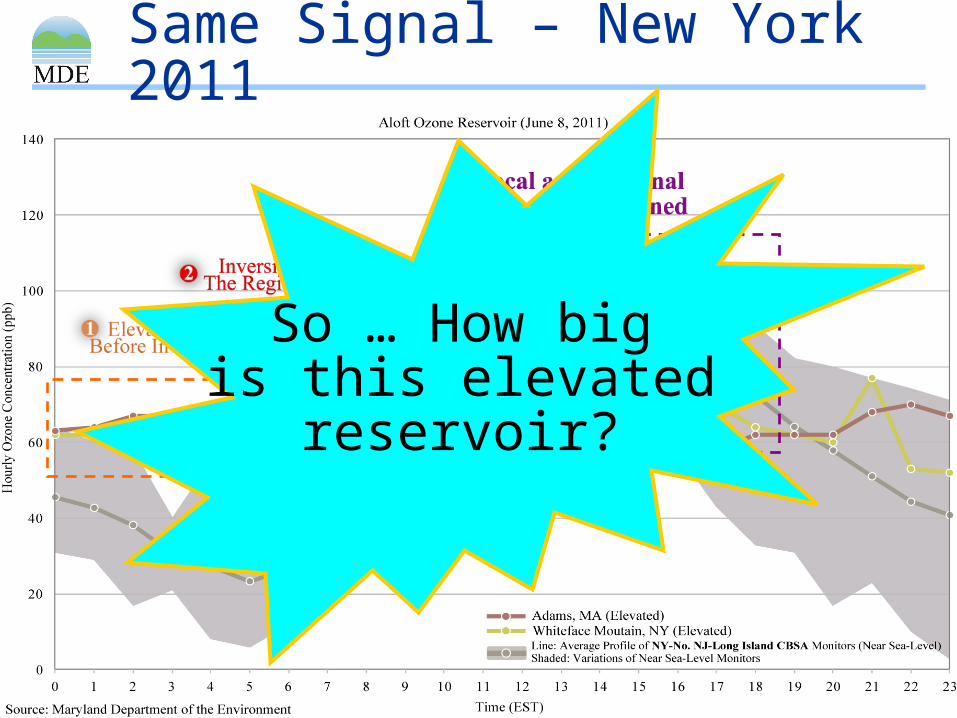
Same Signal – New York 2011
So … How bigis this elevated
reservoir?

p. 25
Who’s Filling the Reservoir?• What’s over MD on Tuesday
started off in Ohio or North Carolina on Monday.
– MD’s pollution soup floats to NJ and NY
– New York’s pollution floats to New England
• Power plants, cars, trucks and other sources are all contributors to the elevated pollutant reservoir.
• Filled with ozone and ozone precursors.
• What’s over MD on Tuesday started off in Ohio or North Carolina on Monday.
– MD’s pollution soup floats to NJ and NY
– New York’s pollution floats to New England
• Power plants, cars, trucks and other sources are all contributors to the elevated pollutant reservoir.
• Filled with ozone and ozone precursors.)
Aircraft Data – All Morning Ozone Profiles
(1996 – 2004)
Median Ozone in ppb
Courtesy of Jennifer Hains
University of Maryland

p. 26
June 8, 2011
Map is courtesy of EPA AIRNow.
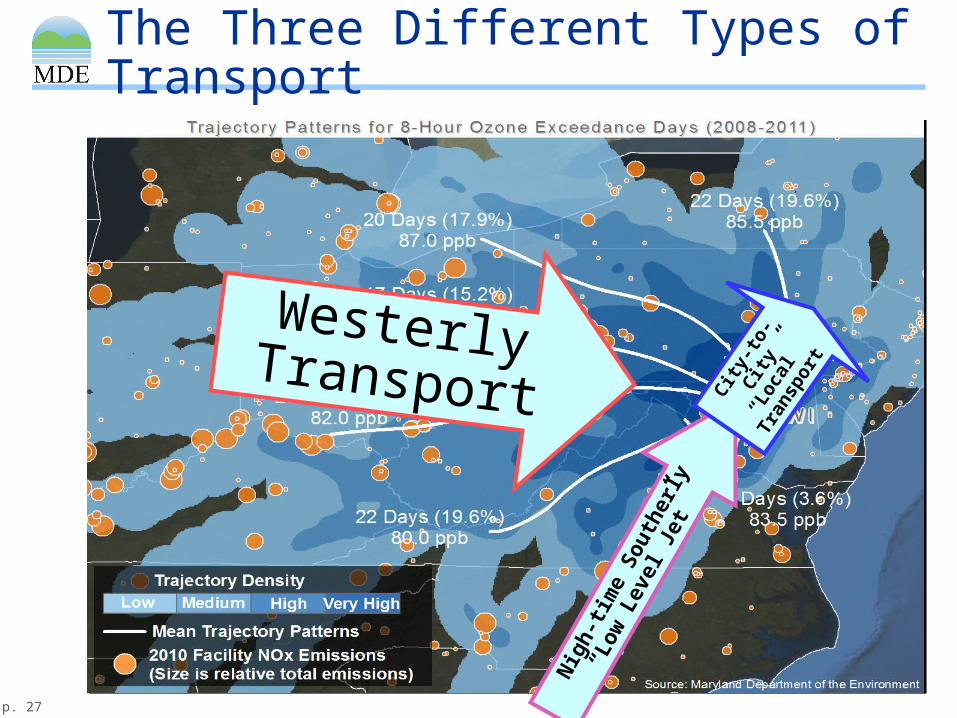
A Simplified Conceptual Model
• Local emissions in Cities (nonattainment areas)
– Reducing local emissions can be important
• If you’re smart
• Three distinct types of transport– Short range - City to city
• “Ground level” transport
• Washington to Baltimore, Baltimore to Philadelphia, etc.
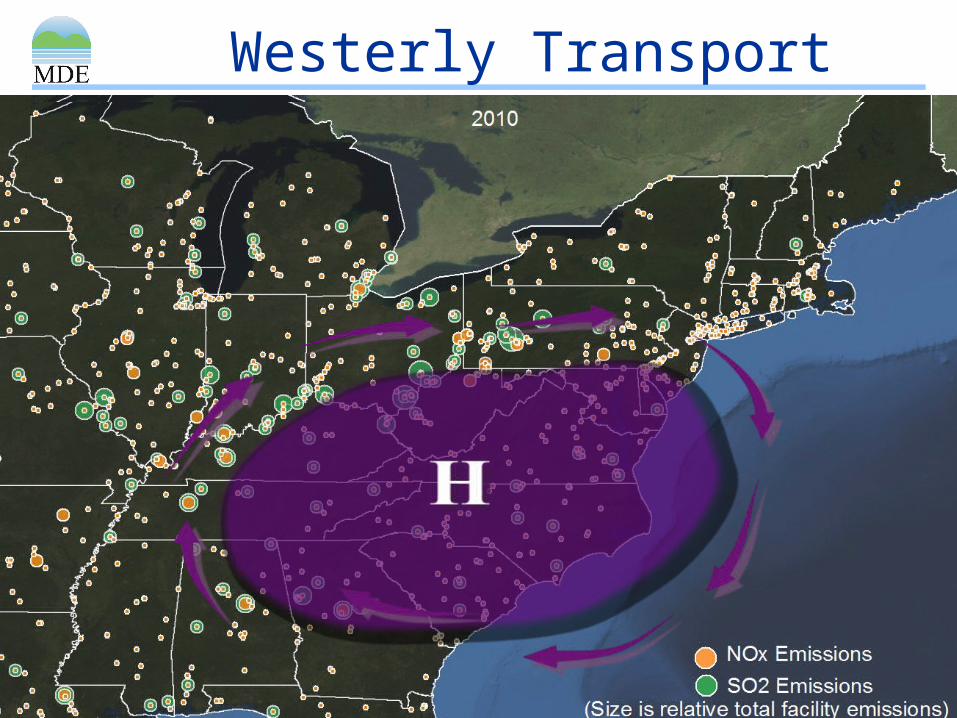
– Westerly, Long range (up-over-and-down)
• “Aloft” transport - 100s of miles
• Generally from W or NW
– Southerly, Nocturnal Low Level Jet (NLLJ)
• “Aloft” transport at night !!!
• 100s of miles
• SW to NE along the Atlantic
• Local emissions in Cities (nonattainment areas)
– Reducing local emissions can be important
• If you’re smart
• Three distinct types of transport– Short range - City to city
• “Ground level” transport
• Washington to Baltimore, Baltimore to Philadelphia, etc.
– Westerly, Long range (up-over-and-down)
• “Aloft” transport - 100s of miles
• Generally from W or NW
– Southerly, Nocturnal Low Level Jet (NLLJ)
• “Aloft” transport at night !!!
• 100s of miles
• SW to NE along the Atlantic
Four Distinct Parts
p. 27
The Three Different Types of Transport
Westerly Transport
Nig
h-tim
e So
uthe
rly
“Low
Lev
el J
et”
City
-to-C
ity“L
ocal
”
Trans
port

p. 28
Classic Mid-Atlantic Ozone Weather
p. 29
Westerly Transport

p. 30
Winds ~ 1000 Feet Above Surface
MDE
Southerly Transport at NightThe Nocturnal Low Level Jet (NLLJ)
Air Hock
ey
Fast-moving, narrow “river” of air typically around 1000 feet above the surface
In the Mid-Atlantic, typically observed during the night between Appalachians and the Atlantic Ocean.
Wind speeds can reach 40 mph or more.
Stretches from NC to MD to NJ and further up the east coast.
Seen during most, Mid-Atlantic summer-time air pollution events.
Some form of NLLJ on virtually all code orange or red days
Recent findings indicate: Presence of a NLLJ increased
Baltimore maximum ozone by 7 ppb. Ozone concentrations of 90 – 100 ppb
have been measured in the NLLJ.

p. 31
Hei
ght
(ft)
Wind Speed and Wind Direction - Beltsville, MD on August 9 - 10, 2010Wind Speed and Wind Direction - Beltsville, MD on August 9 - 10, 2010
30 mph for 7 hours is about 21010 miles
What does this graph tell us?- Wind direction- Wind speed- From the ground up
August 9th, 11 PM – 7 AMWinds from the southwest at
about 25 - 3025 - 30 mph
Nocturnal Inversion up to 1000 ft
August 10th, 10 PM – 8 AMWinds from the southwest at
about 25 - 4025 - 40 mph
Measuring the NLLJ

p. 32
July 12 | July 13, 2008
Howard University launched 4 ozonesondes on July 12-13, 2008. The 10:30 PM (Saturday, July 12th) and 2:30 AM (Sunday, July 13th) occurred during a NLLJ event, as captured by MDE’s Wind Profiler.
Mid
nig
ht
(ED
T)
(22+ mph for 14+ hours) Air Traveled 300+ miles.
10:30 PM
Ozone Spike at
NLLJ Core
NLLJNLLJ
2:30 AM
NearCode Red
Ozone
Measuring Ozone Transport in the NLLJ

p. 33
How Big is the NLLJ?
Beltsville, MDBeltsville, MD
New Brunswick, NJNew Brunswick, NJ
Stow, MAStow, MA
Raleigh, NCRaleigh, NC
8 PM 11 PM 2 AM 5 AM 8 AM 11 AM
NLLJ
August 25, 2008Satellite Image
Sources: NASA, NOAA MADIS
NL
LJ
WIND SPEED AND DIRECTION

p. 34
City-to-City “Local” Transport
• Surface winds are typically from the southwest to the northeast.
• The morning pollution in Washington stays at ground level and floats downwind to become part of the afternoon pollution in Baltimore.
– Pollution from Central/Northern VA ⇨ DC ⇨ Baltimore ⇨ Philly ⇨ NJ ⇨ NY …
• Emissions from cars, area sources and stationary sources all contribute.
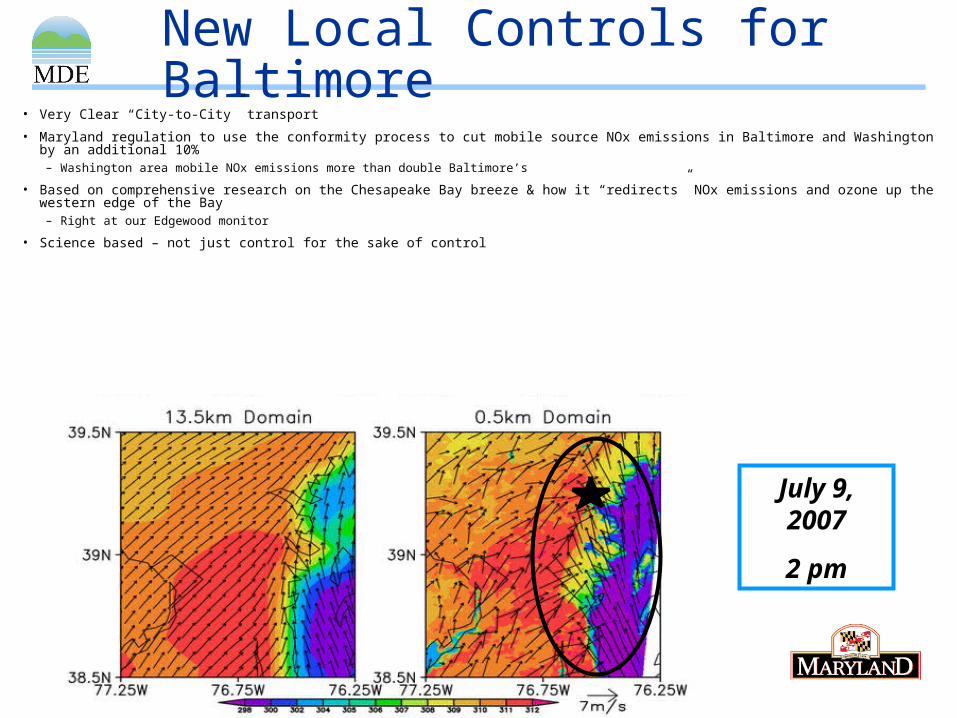
New Local Controls for Baltimore
July 9, 2007
2 pm
• Very Clear “City-to-City” transport
• Maryland regulation to use the conformity process to cut mobile source NOx emissions in Baltimore and Washington by an additional 10%– Washington area mobile NOx emissions more than double Baltimore’s
• Based on comprehensive research on the Chesapeake Bay breeze & how it “redirects” NOx emissions and ozone up the western edge of the Bay– Right at our Edgewood monitor
• Science based – not just control for the sake of control

p. 36
When Transport Patterns Collide
• Ozone air pollutions perfect storm. Westerly, local and southerly/NLLJ transport converge on the Mid-Atlantic states.
• Sea and bay breezes act as a barrier - or wall - and funnel ozone and other air pollutants up the Northeast Corridor.
THETRANSPORT
CROSS-ROADS
p. 37
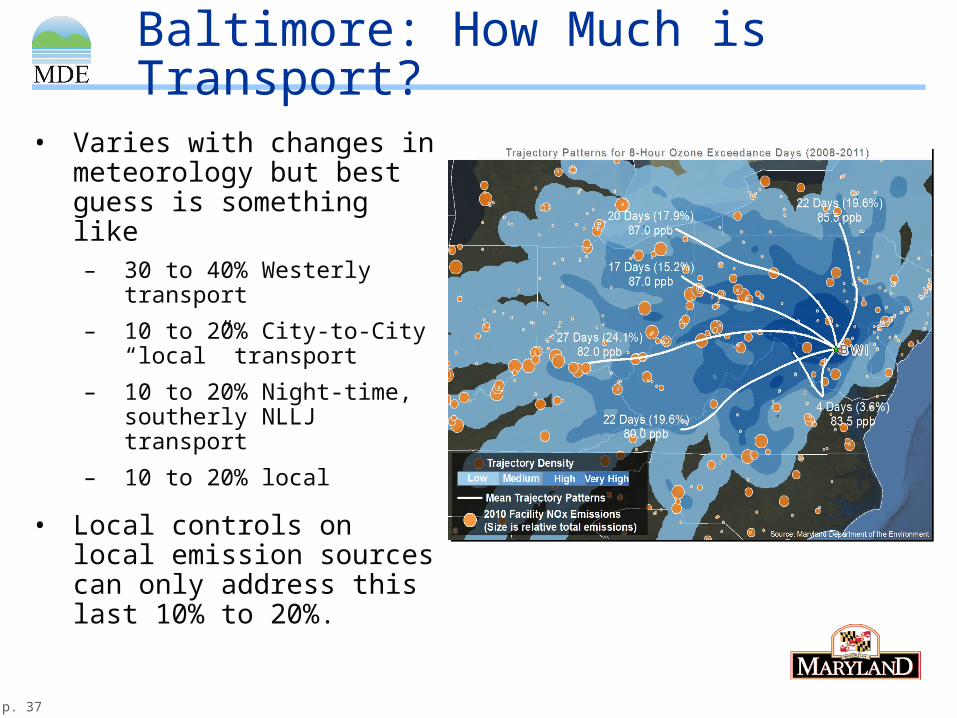
Baltimore: How Much is Transport?
• Varies with changes in meteorology but best guess is something like– 30 to 40% Westerly
transport
– 10 to 20% City-to-City “local” transport
– 10 to 20% Night-time, southerly NLLJ transport
– 10 to 20% local
• Local controls on local emission sources can only address this last 10% to 20%.

So What is the Solution?• Super-Regional NOx controls
– With science-based (not formula based) local controls in the toughest areas
• NOx and – in some cases VOC
• So what is this “only in the toughest areas” thing coming from MD
– We (MD) will need to have very aggressive local controls to complement the super-regional controls
• The question is – do the new local controls make any sense alone?
• And yes – for all of those new areas that are just joining the nonattainment club
– Or some of the old “on the edge” areas• Local controls alone do not make sense

Pushing Federal Measures
• Multiple OTC actions on federal measures over the past 2 years– Support for federal measures to
reduce transport from almost all 50 states
• The OTC has built a very strong scientific basis for the need to reduce regional emissions with federal measures– Analyses of past efforts show that
these regional emission reduction programs will work
… as the best tool to address transport
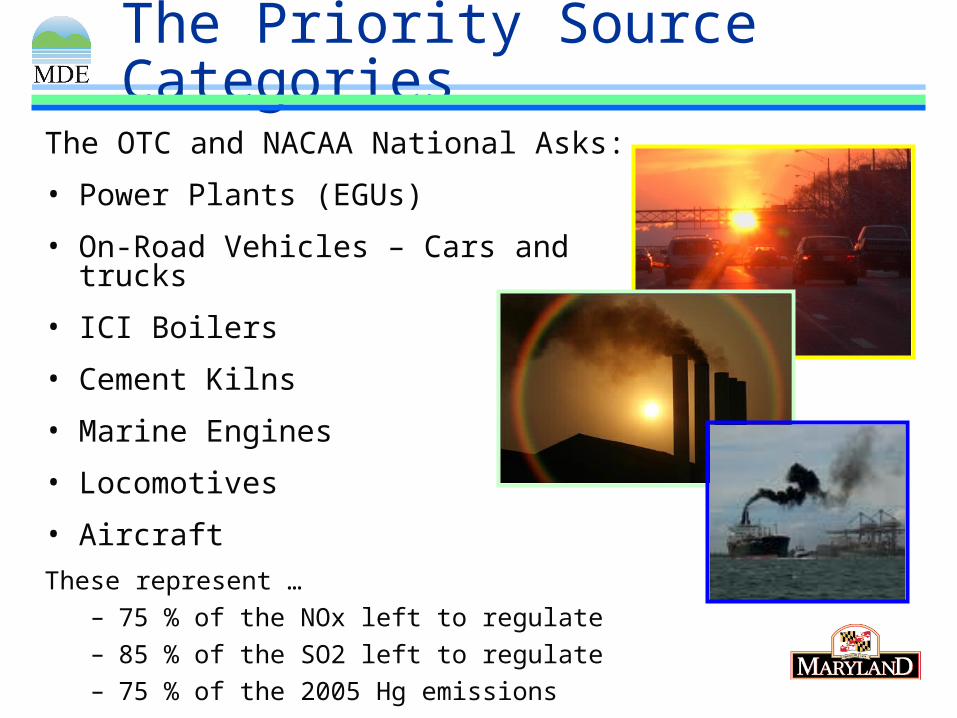
The Priority Source Categories
The OTC and NACAA National Asks:
• Power Plants (EGUs)
• On-Road Vehicles – Cars and trucks
• ICI Boilers
• Cement Kilns
• Marine Engines
• Locomotives
• Aircraft
These represent …
– 75 % of the NOx left to regulate
– 85 % of the SO2 left to regulate
– 75 % of the 2005 Hg emissions
Why Are Federal Measures Important?
2 1 25
18
23
77
50
13
8
30
15
62 2
2 3 5 10
28
51
128
178191
199
229
244250 252 254
0
10
20
30
40
50
60
70
80
90
1995 1997 1999 2000 2001 2002 2003 2004 2005 2006 2007 2008 2009 2010 2011
0
50
100
150
200
250Number of Units
Cumulative Total Units 1.92
1.22
0.59 0.520.38
0.0
0.5
1.0
1.5
2.0
2.5
1990 2000 2005 2008 2009
Year
Ozo
ne S
easo
n N
OX (
mil
lio
n t
on
s) .
1.92
1.22
0.59 0.520.38
0.0
0.5
1.0
1.5
2.0
2.5
1990 2000 2005 2008 2009
Year
Ozo
ne
Sea
son
NO
X (
mil
lio
n t
on
s) .
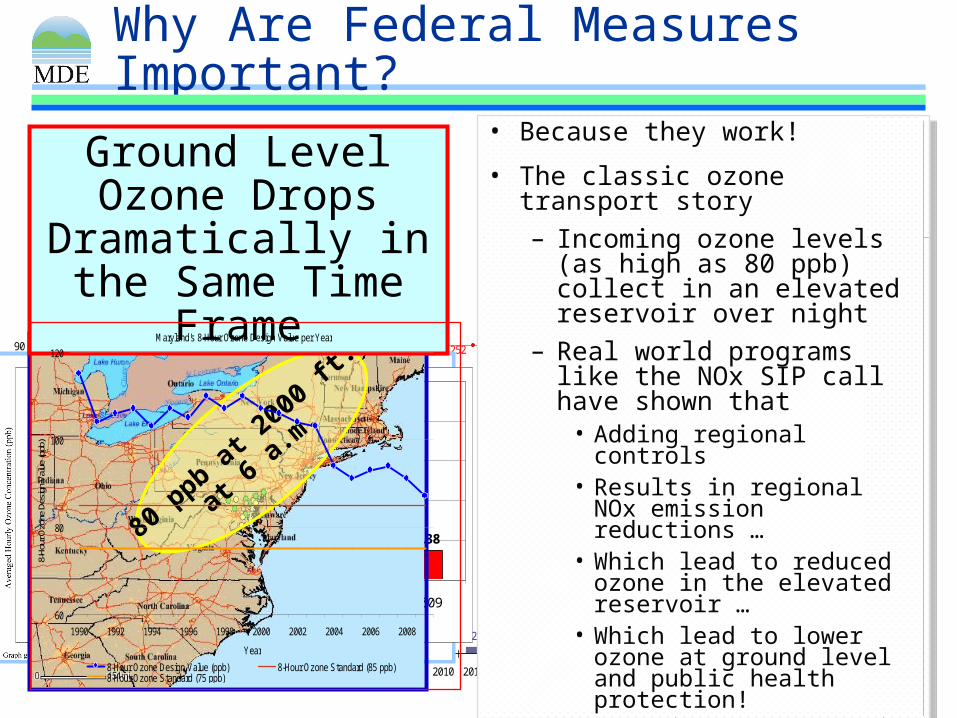
• Because they work!
• The classic ozone transport story
– Incoming ozone levels (as high as 80 ppb) collect in an elevated reservoir over night
– Real world programs like the NOx SIP call have shown that
• Adding regional controls• Results in regional NOx
emission reductions …• Which lead to reduced
ozone in the elevated reservoir …
• Which lead to lower ozone at ground level and public health protection!
80 ppb at 2
000 ft.
at 6 a.m
.
Morning Elevated Reservoir of Ozone Above the OTR
Huge Investment in SCRs in 2003 and
2004
Regional NOx Emissions Drop
Dramatically in 2004
Ozone Levels in the Elevated Reservoir
Reduced by 25% after 2004
Ground Level Ozone Drops Dramatically in the Same Time
FrameMaryland's 8-Hour Ozone Design Value per Year
60
80
100
120
1990 1992 1994 1996 1998 2000 2002 2004 2006 2008
Year
8-Ho
ur O
zone
Des
ign
Valu
e (p
pb)
8-Hour Ozone Design Value (ppb) 8-Hour Ozone Standard (85 ppb)8-Hour Ozone Standard (75 ppb)

Will Federal Measures Get Us to 75 ppb?
42
PRELIMINARY OTCMODELING,
“SCENARIO 4,”GENERALLY GETS
US TO THE 75 PPB STANDARD
Note: “Scenario 4” includes estimates for reductions from Tier 3 and CSAPR #2
Benefits Outside ofthe OTR are
even More Dramatic

Status of EPA’s Federal Measures?• Federal rules for all key
categories in some stage of adoption or proposal– Kudos to EPA
• Tier 3/low sulfur fuel and CSAPR are two good examples of EPA’s efforts on federal rules to reduce transport
• That said … many of EPA’s current efforts fall short in reducing NOx – the key to reducing ozone transport
– For example, EPA has promised to do more with NOx – in CSAPR “#2”
• Some final rules and rules that are being proposed are likely to be litigated and delayed
Other Legal Options for “Transport”
• At it’s November 10, 2011 meeting the OTC charged the OTC Air Directors to develop a technical and legal strategy to better address regional transport
– Some areas of the OTR continue to measure “incoming” ozone levels that are already above the new 75 ppb standard.
• A Transport Workgroup is now in place to coordinate this effort
– Looking at both technical analyses and legal tools
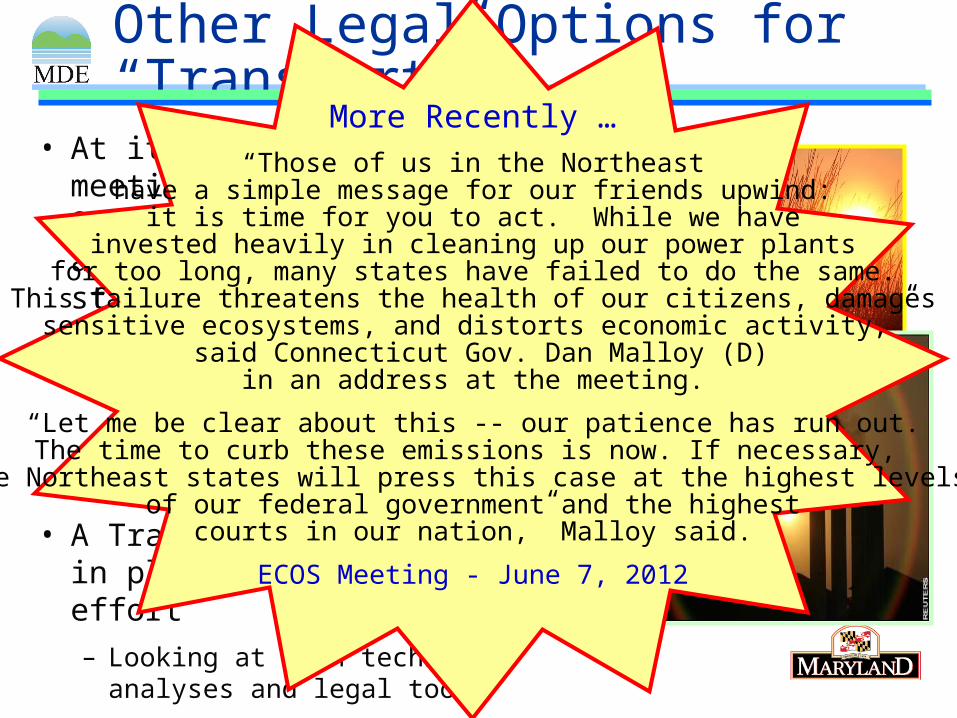
More Recently …“Those of us in the Northeast
have a simple message for our friends upwind:it is time for you to act. While we have
invested heavily in cleaning up our power plantsfor too long, many states have failed to do the same.
This failure threatens the health of our citizens, damagessensitive ecosystems, and distorts economic activity,”
said Connecticut Gov. Dan Malloy (D)in an address at the meeting.
“Let me be clear about this -- our patience has run out.The time to curb these emissions is now. If necessary,
the Northeast states will press this case at the highest levels of our federal government and the highest
courts in our nation,” Malloy said.
ECOS Meeting - June 7, 2012
CAA Transport Tools• Section 107
– Giant non-attainment areas
• Section 126 Petitions against stationary sources
• Section 110A2D “Good Neighbor” requirements
• Section 176A (or 184) Petition to create a new, much larger “Eastern Transport Region”
• Another “state partnership” effort
– Daughter of OTAG
• One, none or some combination of above?
So What Can States Do?• Four pretty basic choices
1. Push and Support EPA on their efforts to adopt federal measures to reduce transport
2. Each state could – as required in the CAAs “Good Neighbor” provisions in Section 110(A)(2)(d) - adopt it’s own set of NOx reduction programs – to reduce it’s significant
contribution to downwind neighbors
3. Do both 1 and 2 – MDs plan
4. Do nothing & cross your fingers

Questions?