Embed Size (px)
Citation preview
DEPARTMENT OF TECHNOLOGY
International outsourcing in Swedish companies–
How to keep key competencies in Swedish firms?
Xiaoding wei
August 2007
Master Thesis in Industrial Engineering and Management Examiner: Mandar Dabhilkar
Abstract
This thesis is mainly based on an extensive literature review and statistic analysis. The
purpose is to find out the motives and effects of four different options in both
literature and empirical study and then answer research questions. The four options
are in house production, off-shoring, domestic outsourcing and international
outsourcing.
After the explanation of four options’ definitions, literature review will discuss most
common motives and effects of outsourcing from many articles. The theory basis,
such as transaction cost, resource based view, industrial view and their influence on
the outsourcing will be mentioned to help reader to understand outsourcing.
In empirical study, four options model and two questions (in house/outsourcing,
domestic/off-shoring) from survey are used to classify Swedish companies into four
groups which stand for four options. The statistics analysis results are from SPSS's
ANOVA and Scheffe.
According to the results, important motives of Swedish companies are “cost
reduction”, “investment reduction”, “fixed cost”, and “accessing to core competence”.
They are a little different from the literature review. And most effects of four options
are positive, only “lead time” and “delivery time” is significant between “in house
production” and “off-shoring” options.
Key words: outsourcing motives, outsourcing effects, four options.

Acknowledgement
I am full of gratitude to Dr. Mandar Dabhilkar, the examiner of my thesis. Under his
personal guidance and hard work, I learn a lot of knowledge from his generous help
and care. Meanwhile, the data-base of manufacturing strategy and outsourcing survey
which he collected for a long time help me a lot in my master thesis. And also I
appreciate my friends, classmates and other lecturers in the school. They give me a lot
of support. Thank you.

Content
Abstract .............................................................................................................................................1 Acknowledgement ............................................................................................................................1 1 Introduction....................................................................................................................................1
1.1 Background .........................................................................................................................1 1.2 Research questions..............................................................................................................1
2 A company’s outsourcing options ..................................................................................................1 2.2 Domestic Outsourcing, International outsourcing and Off-shoring ....................................3
3 Literature review............................................................................................................................4 3.1 Motives in manufacturing outsourcing ...............................................................................4 3.2 Effects in manufacturing outsourcing .................................................................................6
4 Theoretical influence on outsourcing...........................................................................................10 4.1 Transaction cost economics...............................................................................................10 4.2 Resource based view.........................................................................................................10 4.3 Relational view .................................................................................................................11 4.4 The influence on the outsourcing ......................................................................................12
5 Methodology ................................................................................................................................13 5.1 Data collection ..................................................................................................................13 5.2 Analytical approaches .......................................................................................................13 5.3 Validity and reliability.......................................................................................................14 5.4 Data analysis .....................................................................................................................16
6 Results..........................................................................................................................................18 6.1Classify the data into four groups: .....................................................................................19 6.2 Results of ANOVA and Scheffe ........................................................................................20
7 Discussion ....................................................................................................................................25 7.1 Summery of empirical results ...........................................................................................25 7.2 Answer research questions ................................................................................................26
8 Conclusion ...................................................................................................................................29 9 References....................................................................................................................................30 Appendix 1: The manufacturing strategy and outsourcing survey. .................................................34 Appendix 2: ANOVA and Scheffe ..................................................................................................42

1 Introduction
1.1 Background
In order to keep key competencies and upgrade the structure of the firms, many firms
choose way of outsourcing. As globalization become a trend and widely using of
internet and information communication technology, new market and low cost labor
are appeared in some low cost regions, so that trade, FDI and international
outsourcing become new ways to make companies more profitable. At the same time,
risks are arising. Long distances make the coordinate cost increase. Different culture
and law systems make the relationship between supplier and firms more complex.
International outsourcing causes job transfer which becomes a social problem in both
outsourcing countries and the countries who receive the outsourcing.
1.2 Research questions
What are motives and effects of outsourcing in literature review and empirical
study?
Are there some differences among four options in Swedish companies?
Comparison of literatures review and empirical study
2 A company’s outsourcing options
The term “off shoring” is sometimes used synonymously with the term “outsourcing.”
However, outsourcing means acquiring services from an outside (unaffiliated)
company, which can be either another domestic company or an offshore supplier. In
contrast, a company can source offshore services from either an unaffiliated foreign
company (offshore outsourcing) or by investing in a foreign affiliate (offshore
in-house sourcing). In the latter case, the services supplied by the company’s foreign
1

affiliate would not be considered outsourcing since the company has an ownership
stake in both the U.S. and foreign operations (GAO, 2004).Figure 1 demonstrates the
difference between outsourcing and off shoring.
(Figure 1, from GAO, 2004)
There are four different options for companies’ outsourcing plan:
The most common way is the domestic in house production. The company has the
whole manufacturing or service process with out any outside contract. This is the
oldest way to run the business for a company. Even nowadays, there are still many
companies use this modality. The advantage of in house production is that the
company can control every procedure of its operation process.
Compare to in house produce, companies may outsource their not important or less
making money parts of procedures to an external supplier. When it just happened
between domestic companies, it is the domestic outsourcing. The domestic
outsourcing maybe is the original outsourcing modality in the outsourcing options.
2

Using the economics scale of one of the standard procedures, the companies can get
rid of the boring and less profitable parts of procedure to contractors.
Off shoring in house means the counterpart of domestic in house does the same thing
in foreign countries. Low cost, new resources and markets bait the companies FDI an
affiliated company over sea.
The last one is off shoring outsourcing or international outsourcing. The companies
have contract with overseas supplier. The OEM, ODM and EMS are the popular ways
to cooperate with the supplier. The companies can save a lot of investing money and
fix cost to operate an affiliated company.
Those four options are the main methods for a company operating their business
nowadays. In the statistic part of this article, those four groups will be used as a tool
for classifying the survey.
2.2 Domestic Outsourcing, International outsourcing and
Off-shoring
“Outsourcing,” “offshore outsourcing,” and “off shoring” are used interchangeably in
public discourse despite important technical differences. Generally speaking,
outsourcing means that share organizational control with other organizations, or a
process of establishing network relations within an organizational field. Off shoring is
transferring business processes from one country to another including any business
process not necessarily a transformation of internal organizational control. Off shoring
can be seen in either production off shoring or services off shoring (Norwood et al,
2006).
3
The economic logic to outsourcing and off shoring is to reduce costs. They have the
common motives to reduce cost, but they choose the different ways to obtain the goal.
The idea is that countries trade the goods which cost the less than them to produce. In
the reality, there are many boundaries of resources transferring. In order to avoid
those boundaries, the companies began to go abroad to find the new and cheaper
resource, so that the domestic outsourcing or in house production became the
international outsourcing and off shoring.
3 Literature review
Outsourcing is a common practice among both private and public organizations and is
a major element in business strategy. Due to widespread outsourcing practices, it has
become a frequent topic in the literature. Numerous reasons why outsourcing is
initiated have been identified by researchers. Organizations may expect to achieve
many different benefits through successful outsourcing. There is an abundance of
outsourcing literature where many benefits, risks, motivators, and decision factors
have been presented (Tibor Kremic et al, 2006).
3.1 Motives in manufacturing outsourcing
A large number of publications list many motives for outsourcing. Table 1 indicates
the main motives in literature.
4
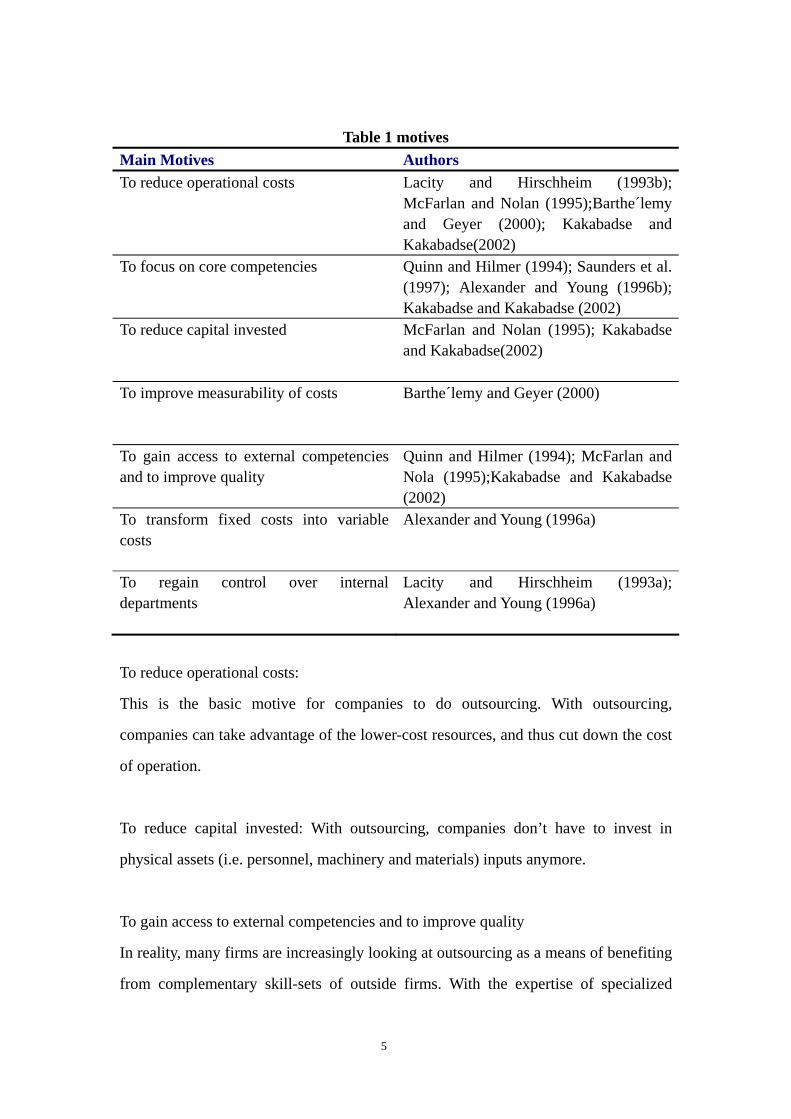
Table 1 motives
Main Motives Authors To reduce operational costs Lacity and Hirschheim (1993b);
McFarlan and Nolan (1995);Barthe´lemy and Geyer (2000); Kakabadse and Kakabadse(2002)
To focus on core competencies Quinn and Hilmer (1994); Saunders et al. (1997); Alexander and Young (1996b); Kakabadse and Kakabadse (2002)
To reduce capital invested
McFarlan and Nolan (1995); Kakabadse and Kakabadse(2002)
To improve measurability of costs
Barthe´lemy and Geyer (2000)
To gain access to external competencies and to improve quality
Quinn and Hilmer (1994); McFarlan and Nola (1995);Kakabadse and Kakabadse (2002)
To transform fixed costs into variable costs
Alexander and Young (1996a)
To regain control over internal departments
Lacity and Hirschheim (1993a); Alexander and Young (1996a)
To reduce operational costs:
This is the basic motive for companies to do outsourcing. With outsourcing,
companies can take advantage of the lower-cost resources, and thus cut down the cost
of operation.
To reduce capital invested: With outsourcing, companies don’t have to invest in
physical assets (i.e. personnel, machinery and materials) inputs anymore.
To gain access to external competencies and to improve quality
In reality, many firms are increasingly looking at outsourcing as a means of benefiting
from complementary skill-sets of outside firms. With the expertise of specialized
5

suppliers in certain areas, quality or performance of the product can be improved.
To transform fixed costs into variable costs
There are several other potential sources of value enhancement from outsourcing,
some of which involve risk management. The supplier may be better able to cope with
its demand fluctuations than the firm, not just because of economies of scale, but also
due to more flexible management or work practices, alternative uses for spare
capacity and so on. The level of risk may therefore be reduced, or simply reallocated
between the parties involved.
To regain control over internal departments
Lacity and Hirschheim examined information systems departments that had to bid
against outsource providers, but had retained their franchise. They concluded that
many of the benefits that an outsider would bring could in fact be achieved internally,
but only with a significant shift in attitudes and perceptions. Bidding on an equal
footing with outsiders was one way of achieving this shift. Once an internal
department saw itself competing directly with outside providers, it was often able to
achieve changes that had previously been considered impossible.
3.2 Effects in manufacturing outsourcing
Some effects are positive for outsourcing. At the same time, some positive effects are
founded in literatures. Table 2 will illuminate the effects of outsourcing:
6
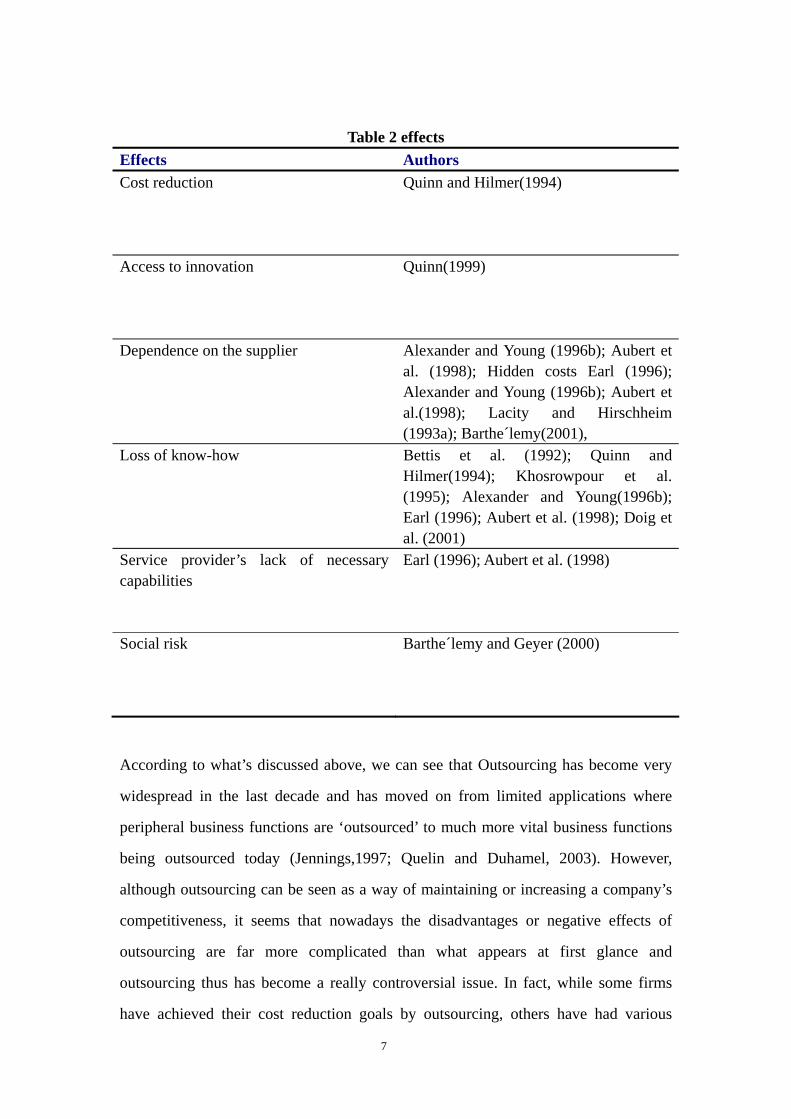
Table 2 effects
Effects Authors Cost reduction
Quinn and Hilmer(1994)
Access to innovation
Quinn(1999)
Dependence on the supplier Alexander and Young (1996b); Aubert et al. (1998); Hidden costs Earl (1996); Alexander and Young (1996b); Aubert et al.(1998); Lacity and Hirschheim (1993a); Barthe´lemy(2001),
Loss of know-how Bettis et al. (1992); Quinn and Hilmer(1994); Khosrowpour et al. (1995); Alexander and Young(1996b); Earl (1996); Aubert et al. (1998); Doig et al. (2001)
Service provider’s lack of necessary capabilities
Earl (1996); Aubert et al. (1998)
Social risk
Barthe´lemy and Geyer (2000)
According to what’s discussed above, we can see that Outsourcing has become very
widespread in the last decade and has moved on from limited applications where
peripheral business functions are ‘outsourced’ to much more vital business functions
being outsourced today (Jennings,1997; Quelin and Duhamel, 2003). However,
although outsourcing can be seen as a way of maintaining or increasing a company’s
competitiveness, it seems that nowadays the disadvantages or negative effects of
outsourcing are far more complicated than what appears at first glance and
outsourcing thus has become a really controversial issue. In fact, while some firms
have achieved their cost reduction goals by outsourcing, others have had various
7
degrees of failure (Due, 1992; Rochester and Douglas, 1990, 1993; Lacity and
Hirschheim, 1993a).
1. Hidden costs in outsourcing.
Most fundamentally, the primary motive that companies started outsourcing is to cut
down the cost of operation, such as lower labor natural resources cost. In fact, the
belief that one can obtain a component more cheaply by purchasing rather than
manufacturing it oneself is a powerful argument for outsourcing. Nevertheless, while
most of the discussion on outsourcing seems to focus on the cost-cutting initiatives of
firms, what is often overlooked is that there are accentually many hidden costs in
outsourcing which are much higher than it appears. Many researchers are of the
opinion that cost calculations often do not give a clear indication either way, and with
many incalculable variables, considerations other than visible costs are more
important.
2. Outsourcing may hinder innovation.
There is a problematic assumption that service providers are always able to infuse
best practice into the company. In reality, however, it is usually not the case. The
ability to infuse best industry practice may not only depend on the relative
competence of the provider, but the service providers may also be restricted in their
ability to pass on best practices by confidentiality agreement with previous and other
current clients.
Therefore, from the above aspects, we can see that the company may become
dependent and also may not get the best practice. That’s how outsourcing can hinder
innovation, and it is the reason that integration of the producing process becomes
necessary to some companies.
3. There may be leakage of vital know-how and thus influence companies’ core
competence.
8
Despite the fact that outsourcing can be helpful for the company to focus on its own
core competence, we can not deny that there is a great possibility that its vital
information maybe leaked to its suppliers. According to Hamel (1991), core
competence or core skills can be both maintained and lost in strategic alliances. Skills
can be learnt from the other party and absorbed into one's own company; in the same
way, one's own skills can pass to a partner and unique competitive advantages are lost.
Therefore, there also exist the important questions of the potential for losing one’s
core skills and competitive advantage to competitors in the process of collaboration.
Furthermore, outsourcing may simultaneously erode the firm’s potential for
organizational learning and development of new technologies, particularly those skills
necessary for the development of new business and core capabilities (Bettis et al,
1992).
4. Outsourcing sometimes can not play the role of improving product quality or
manufacturing performance.
One main motive for companies to outsource is that the supplier can supply a higher
quality product at a more competitive price than is the case in-house. However, it is
not necessarily the case that outsourcing can always improve product quality as the
company expects, and they may lack some vital capabilities. Usually, overseas
managers may often not understand the foreign business environment: their customers,
lingo, traditions, and high-quality control and expectations for prompt delivery of
goods and performance of services.
5. Reliability risks.
Besides, there exist reliability risks in outsourcing. In fact, many newcomers to
overseas contracting may find themselves dealing with unreliable suppliers who put
their work aside when they gain a more important client, or their overseas vendor may
suffer rapid turnover of skilled employees who find jobs with more desirable firms.
9

4 Theoretical influence on outsourcing
This part provides an overview of the theoretical perspectives that have influenced the
development of the framework for outsourcing evaluation and management. Those
area include the transaction cost economics (TCE), the resource based view and the
relational view.
4.1 Transaction cost economics
Transaction cost is a cost incurred in making an economic exchange. When rationally
evaluating a potential transaction, it is important to consider transaction costs that
might prove significant. The transactional difficulties include the following:
Bounded rationality- the rationality of human behavior is limited by the ability of
the actor to process information.
Opportunism- people are prone to behave opportunistically which leads to
self-interest seeking with guile.
Small numbers bargaining- some barging between buyer and supplier are in
frequent or small quantities
Information impactedness- asymmetrical distribution of information among the
exchanging parties that means that one party might have more knowledge than
another (Williamson, 1985).
4.2 Resource based view
The boundary of the firm is explained by author theory. It is the resource based view
(RBV). From the resource based view, it focuses on that a firm must be organized to
exploit its resources and capability. With the complementary resources, the can create
competitive advantage, however, the achievement of competitive advantage needs to
10

be combined with other resources. It is important to emphasize that even though a
firm may possess a range of valuable, rare and costly to imitate resources ineffective
organization will prevent the full exploitation of these resources. The core
competence approach and its relationship with outsourcing have evolved from the
resource base view of the firm. Core competence is importance to the study of
outsourcing, as it has proposed the internal organization of the firm as the potential
for competitive advantage.
The core competences are the following (Quinn and Hilmer, 1994)
Skills or knowledge sets, not products or functions.
Flexible, long-term platforms which are capable of adaptation or evolution.
Limited in number.
Unique source of leverage in the value chain.
Areas where the organization can dominate.
Elements important to customers in the long run.
Embedded in the functional know how, processes and technologies that the
organization has developed and nurtured.
4.3 Relational view
The relationship view has evolved from the limitations of TCE in relation to potential
governance structures. The relational view argues that the firm can develop valuable
resources by carefully managing relationships with external entities including
suppliers, customers, government agencies and universities. Therefore, a firm can
gain and sustain competitive advantage by accessing its key resources in a way that
spans the boundaries of the firm. Competitive advantage can be embedded in asset of
relationships across the boundaries of firms, rather than residing inside an individual
firm (Gulati, 1999).
There are four sources of relational rents:
Inter-firm specific assets.
11

Inter-firm knowledge-sharing routines- inter firm processes can be designed to
facilitate knowledge exchange between the alliance firms.
Complementary resource endowments.
Effective governance.
4.4 The influence on the outsourcing
TCE:
Transaction cost economics is the easiest way to understand the outsourcing.
The nature of a firm is chasing the profits. If the cost in producing the goods in house
is higher than the transaction cost plus the price which suppliers offer. Technically
speaking, the outsourcing can happen. The off-shoring is the same.
RBV:
A firm should concentrate its resources on a set of core competences where it can
achieve definable pre-eminence and provide unique value for customers and
strategically outsource other activities for which it has neither a critical strategic need
nor special capabilities. In the outsourcing context, the core should be considered as:
1. The activity is crucial in the eyes of the customer.
2. The activity may be a source of competitive differentiation in the marketplace
3. The organization is more competent at performing the activity than suppliers or
competitors.
RV:
The RV has a lot to do with the supply chain relationships. Every company has
supplier(s), and increasingly, companies have been pursuing more intensive and
interactive relationships with their suppliers, collaborating in areas such as new
product development, supplier development, and information sharing on a range of
issues (Mclvor et al, 1997). And increased outsourcing has led companies to become
12

more dependent on their supplier network.
5 Methodology
5.1 Data collection
The data is from the survey B: The manufacturing strategy and outsourcing survey.
The survey consists of 51 questions. It was distributed to a disproportionately
stratified random sample of 563 manufacturing plants of Swedish engineering
industry companies. This sampling technique is suggested when the population
consists of subgroups with different numbers of plants. After two reminders, 267 of
the targeted plants returned the instrument to us, which yielded an overall response
rate of 47% (Dabhilkar, 2006).
The survey’s constructs were mainly based on the IMSS, with additional studies when
needed. Dr. Mandar did interviews to follow-up survey results. Several managers or
other senior employees were interviewed at Atlas Copco, Scania and SKF,
respectively, during autumn 2005 and spring 2006.
5.2 Analytical approaches
The steps of data analysis process in this thesis are as follows:
1. Classify the survey data into four groups by the four options from figure 1 (GAO,
2000) and question f44c and f44b
The question F44c (off shoring/to a Swedish supplier) is used to classify the
“domestic” or “off shoring” companies in the survey. There are 5 answers for this
question f44c. The 4 and 5 answers mean the Swedish company did the “off shoring”.
13

The 1 and 2 mean those companies only have a “domestic” supplier.
The question f44b (in house/ outsourcing) is used to classify the “in house” or
“outsourcing”. There also are 5 answers for this question. The 4 and 5 answers are the
companies who only “in house” manufacturing. The 1 and 2 answers means those
companies had their manufactory outsourced.
2. Taking one-way ANOVA to find the significant difference between four options
and taking mean value of the different questions in different groups
In the ANOVA, several questions will be tested by soft ware SPSS. There are some
criteria to choose different questions. Those questions are from different several
groups. In the discussion part, the mean value will be compared, so in order to
compare the literatures and the empirical study, some related survey questions should
be selected from the criteria groups.
5.3 Validity and reliability
Validity
Because of the knowledge-creating ambitions and the methodological approach of the
underlying studies, the following four quality criteria are chosen:
External validity refers to the possibility of generalizing findings beyond the studied
sample to a greater population. Very high response rates were obtained (in this survey:
47%) and a lot of effort was made to detect response bias by telephoning non
respondents.
Construct validity refers to the extent that investigated concepts are correctly
operationalized, meaning that they measure what they were intended to, and not
14

something else. Prior to finalizing the survey instruments and the interview guides for
the case studies, considerable effort was put into examining how other researchers had
operationalized the concepts emphasized.
Internal validity refers to the extent that causal relationships can be established. The
researcher has to avoid situations where one claims that changes in variable A causes
changes in variable B, while there is an unacknowledged variable C which causes
both A and B.
An interaction effect, which suggests that any positive effects of outsourcing
manufacturing are more likely to be realized by a concurrent adoption of lean
manufacturing practices.
These claims are all based on quantitative analysis; therefore, the most important
action to strengthen internal validity has been to undertake Case Study B, letting
results of two different methodological approaches point in the same direction.
Another important way to strengthen internal validity has been to provide solid
theoretical foundations that explain the asserted relationships (Dabhilkar, 2006).
Reliability
Reliability refers to the extent that data collection procedures can be repeated with the
same results. It would be easy to repeat the studies and come to the same conclusions,
since plenty of details are given on how things are done. Many tests are also done to
test the reliability (Dabhilkar, 2006).
15
5.4 Data analysis
5.4.1 Frequency
210 Swedish companies answer question f44c and 209 Swedish companies answer
question f44b. Those answers can be used to classify the four options. So in this
classification, the frequencies of the 5 answers are crucial. In order to classify the four
options from the survey, the frequency of the 5 answers in question f44c and f44b
should be analyzed respectively. After doing frequency, the numbers of 5 different
answerers are representing in the frequency results.
In question f44c (domestic or off-shoring), if answers are 4 or 5, those Swedish
companies are doing off shoring. If answers are 1 or 2, those Swedish companies are
using domestic suppliers.
In question f44b (in house production or outsourcing manufactory), if answers are 4
or 5, Swedish companies are dong in house production. If answers are 1 or 2, those
Swedish companies are using manufacturing outsourcing companies.
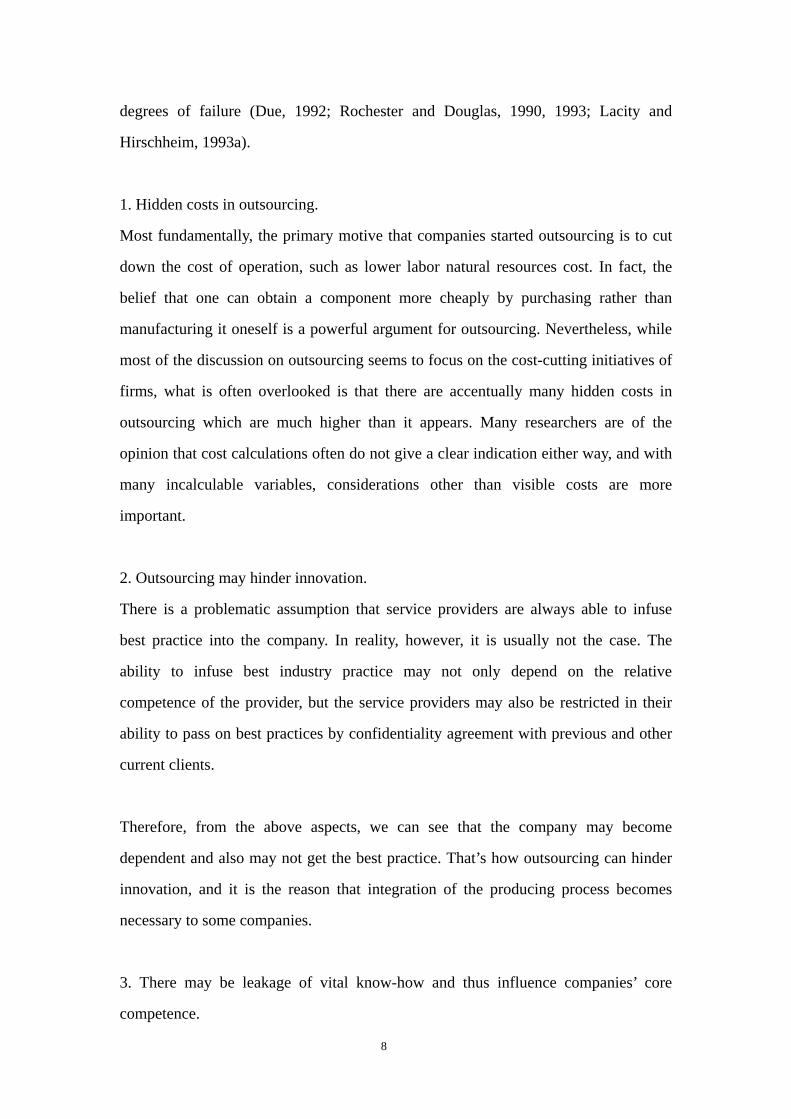
Then combine those two question f44c and f44b together. The Swedish companies
will be classified into 4 different groups. See table
Table 3 the four options classification
Group 1 Domestic in house The answers: F44c=1 or 2=domestic. and f44b=4 or 5=in house
Group 2 off shoring The answers: F44c=4 or 5=off-shoring. and f44b= 4 or 5 in house
Group 3 domestic outsourcing The answers: F44c=1 or 2=domestic. and f44b=1 or 2=outsourcing
Group 4 international outsourcing The answers: F44c=4 or 5=off-shoring. and f44b=1 or 2=outsourcing
16

5.4.2 ANOVA and Scheffe
To research the relationship between four options and the comparisons between
literature review and empirical study, the research uses SPSS software, taking four
options which are classified in above as the independent variable and the three
groups’ questions as the independent variables to get the mean value of each questions
and the significant diversity performance between each groups. Then use Scheffe to
check the significant difference. According to the theory above, I select some question
groups as standard to evaluate the performance.
Question group f43a-f43f: “what characteristics the companies/products that your
firm has outsourced?”
Question group f45a-f45q: “Motives for outsourcing”
Question group f46a-f46p: “effects of outsourcing”
In the three criteria groups, those questions are important for four options. ANOVA
results and Scheffe will show the difference between and inside the four options. Then,
I choose some questions related to the literatures from each group, in order to
compare the literature review and empirical study.
17

Table 4 the related questions Main Motives
Related questions from group 43 a-43 f
To reduce operational costs
f45a(reduce costs), f45b(increase cost control)
To focus on core competencies f45g(access to core competence), f45 k(focus on NPD)
To reduce capital invested f45d(reduce investment), f45e(reduce capital needs)
To gain access to external competencies and to improve quality
f45i(use supplier’s innovation), f45 h(increase quality)
To transform fixed costs into variable costs
f45c(fixed costs)
To regain control over internal departments
f45l(manufactory control)
Products characteristics
Related questions from group 45 a-45 q
Product design, research and development process are relatively hard to offshore
f43b(easy/hard to produce), f43c(easy/hard to design)
Unique products are produced in house
f43a(standard/special)
Effects
Related questions from group 46 a-46 p
Cost reduction/hidden cost in outsourcing
f46a(costs), f46b(control of cost)
Access to innovation/outsourcing hinder innovation
f46f(functionality), f46i(NPD time), f46k(cost for NPD)
Quality improve/quality not improve
f46c(quality), f46g(efficiency)
Reliability risk
f46l(flexibility)
6 Results
Motives and effects form for four options are almost the same in literature study. Now,
in this part, the data in the survey will be used for testifying..
18

6.1Classify the data into four groups:
Figure2 Defining outsourcing and off shoring ((MARI SAKO, 2006)
Table 5 Domestic or off shoring in Swedish companies: F44c Frequency Relative Frequency 5 28 0.25 4 10 0.09 3 21 0.19 2 11 0.10 1 40 0.37 Total 110 1
Form the survey, there are 38 companies had the off shoring. 51 companies just had
the domestic manufacture in Sweden. More Swedish companies prefer staying home
to going abroad. It is common that most companies stay in their own companies,
because the main customers are the domestic citizens. But the gap of off shoring and
From domestic to off shore
From
in house to outsourcing
Domestic in – house Off-shoring Domestic divisions Foreign affiliates
(FDI & international trade)
Domestic outsourcing International outsourcing Domestic supplier Foreign suppliers
(International trade)
19
domestic is not as large as some developing countries.
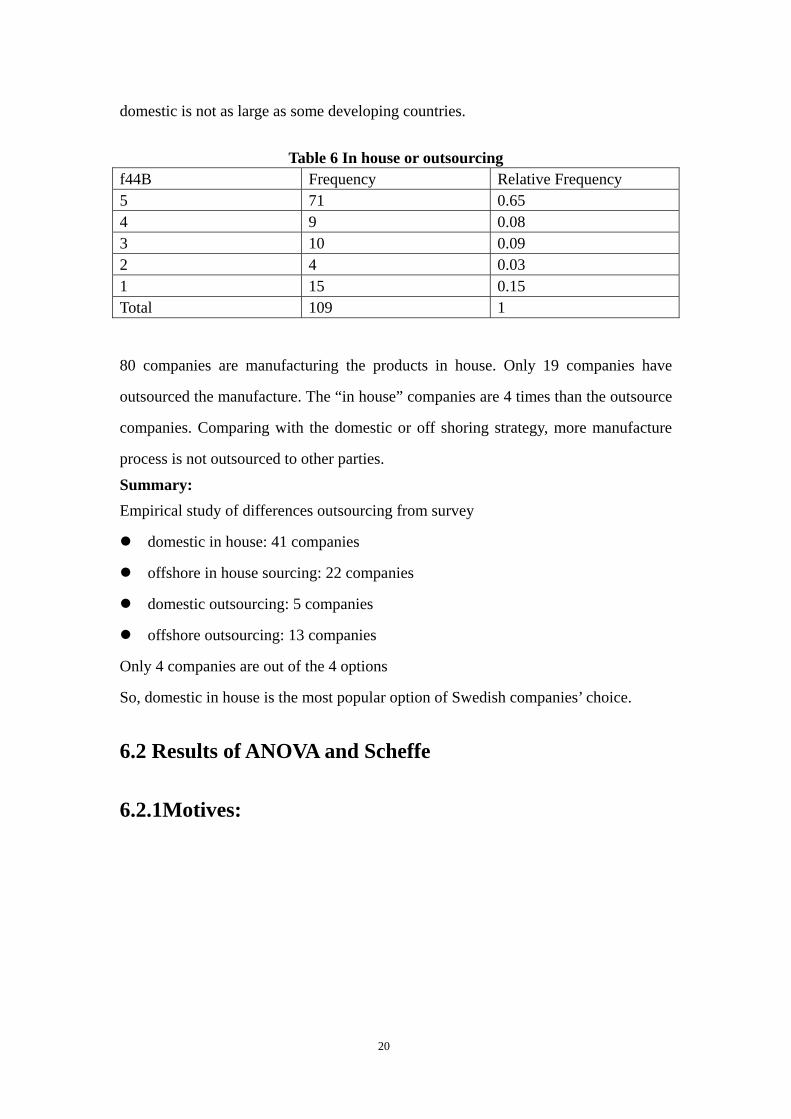
Table 6 In house or outsourcing f44B Frequency Relative Frequency 5 71 0.65 4 9 0.08 3 10 0.09 2 4 0.03 1 15 0.15 Total 109 1
80 companies are manufacturing the products in house. Only 19 companies have
outsourced the manufacture. The “in house” companies are 4 times than the outsource
companies. Comparing with the domestic or off shoring strategy, more manufacture
process is not outsourced to other parties. Summary: Empirical study of differences outsourcing from survey
domestic in house: 41 companies
offshore in house sourcing: 22 companies
domestic outsourcing: 5 companies
offshore outsourcing: 13 companies
Only 4 companies are out of the 4 options
So, domestic in house is the most popular option of Swedish companies’ choice.
6.2 Results of ANOVA and Scheffe
6.2.1Motives:
20
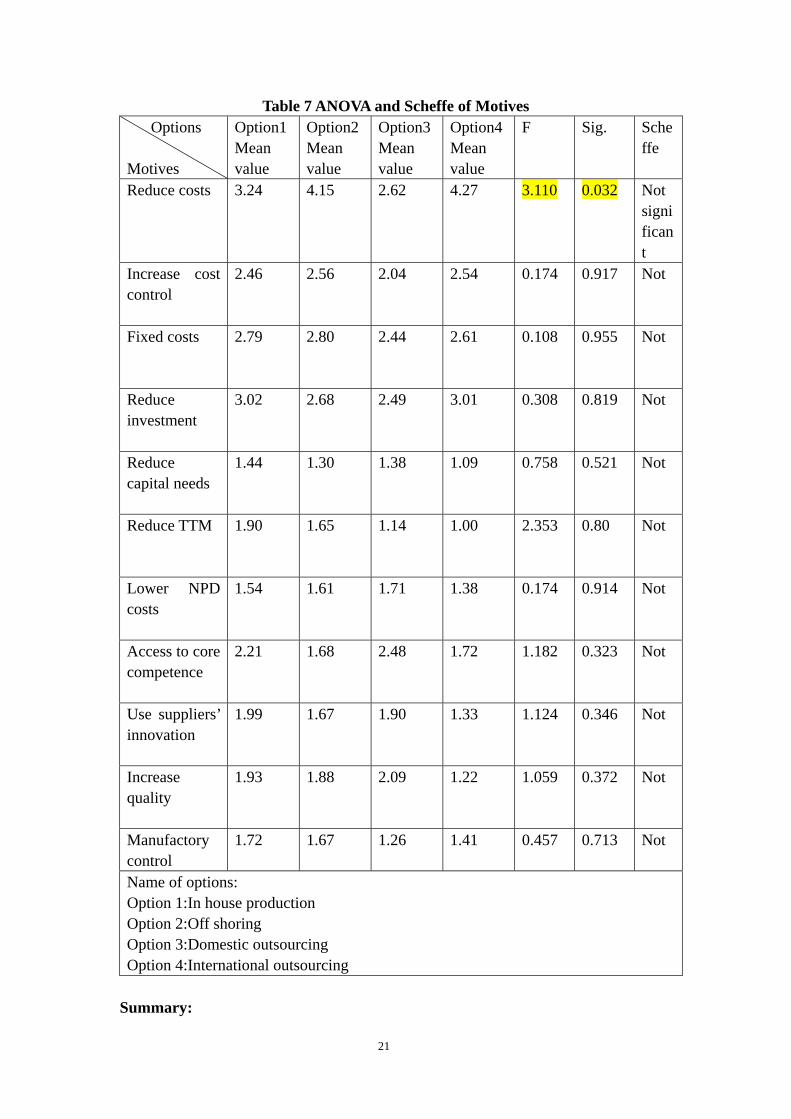
Table 7 ANOVA and Scheffe of Motives Options Motives
Option1 Mean value
Option2 Mean value
Option3 Mean value
Option4 Mean value
F Sig. Scheffe
Reduce costs
3.24 4.15 2.62 4.27 3.110 0.032 Not significant
Increase cost control
2.46 2.56 2.04 2.54 0.174 0.917 Not
Fixed costs
2.79 2.80 2.44 2.61 0.108 0.955 Not
Reduce investment
3.02 2.68 2.49 3.01 0.308 0.819 Not
Reduce capital needs
1.44 1.30 1.38 1.09 0.758 0.521 Not
Reduce TTM
1.90 1.65 1.14 1.00 2.353 0.80 Not
Lower NPD costs
1.54 1.61 1.71 1.38 0.174 0.914 Not
Access to core competence
2.21 1.68 2.48 1.72 1.182 0.323 Not
Use suppliers’ innovation
1.99 1.67 1.90 1.33 1.124 0.346 Not
Increase quality
1.93 1.88 2.09 1.22 1.059 0.372 Not
Manufactory control
1.72 1.67 1.26 1.41 0.457 0.713 Not
Name of options: Option 1:In house production Option 2:Off shoring Option 3:Domestic outsourcing Option 4:International outsourcing
Summary:
21

Difference between four options: No significant difference between four options in Motives’ group Motives comparison inside options: Option 1: In house production Reduce costs>reduce investment>fixed cost Option 2: Off shoring Reduce costs>fixed cost>reduce investment Option 3: Domestic outsourcing Reduce investment> access to core competence>reduce cost Option 4: International outsourcing Reduce costs>reduce investment>fixed cost
6.2.2 Characteristics of products:
Table 8 ANOVA and Scheffe of Characteristics of products
Options Characteristics of products
Option1 Mean value
Option2 Mean value
Option3 Mean value
Option4 Mean value
F Sig. Scheffe
Standard/Special
2.78 2,57 1.93 2.31 0.701 0.555 Not significant
Easy/ Hard to produce
2.66 2.67 1.99 2.71 0.174 0.917 Not significant
Easy/Hard to design
2.94 2.59 2.29 3.02 0.108 0.955 Not significant
Name of options Name of options: Option 1:In house production Option 2:Off shoring Option 3:Domestic outsourcing Option 4:International outsourcing
Summary:
22
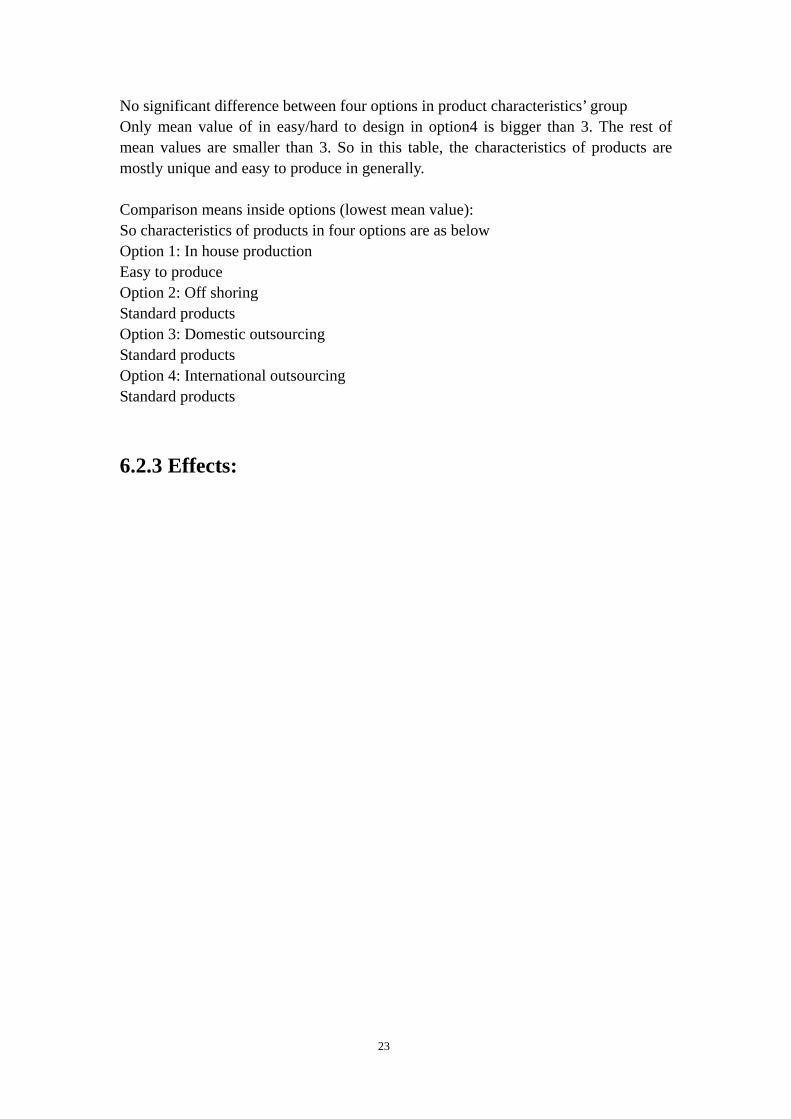
No significant difference between four options in product characteristics’ group Only mean value of in easy/hard to design in option4 is bigger than 3. The rest of mean values are smaller than 3. So in this table, the characteristics of products are mostly unique and easy to produce in generally. Comparison means inside options (lowest mean value): So characteristics of products in four options are as below Option 1: In house production Easy to produce Option 2: Off shoring Standard products Option 3: Domestic outsourcing Standard products Option 4: International outsourcing Standard products
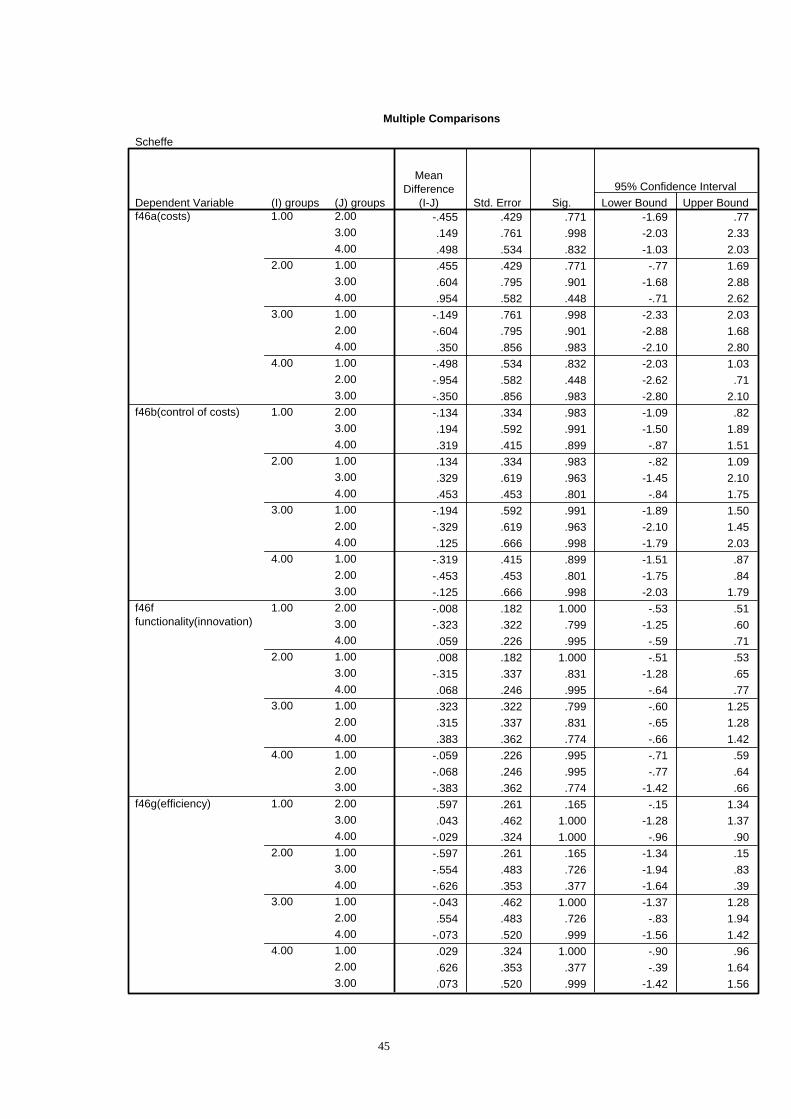
6.2.3 Effects:
23

Table 9 ANOVA and Scheffe of Effects Options Effects
Option1 Mean value
Option2 Mean value
Option3 Mean value
Option4 Mean value
P Sig. Scheffe
Costs
0.72 1.18 0.57 0.22 0.956 0.419 Not
Control of costs
0.58 0.71 0.38 0.26 0.370 0.775 Not
Functionality(innovation)
0.06 0.07 0.38 0.00 1.979 0.125 Not
Efficiency
0.88 0.28 0.91 0.71 1.979 0.125 Not
NPD time
0.18 0.15 0.00 0.17 0.096 0.962 Not
Time for industrial
0.24 0.18 0.00 0.04 0.379 0.768 Not
Costs for NPD
0.15 0.11 0.00 0.00 0.259 0.855 Not
Flexibility
1.19 0.71 0.55 0.57 1.730 0.167 Not
Quality
0.01 0.18 0.57 -0.77 2.589 0.060 Not
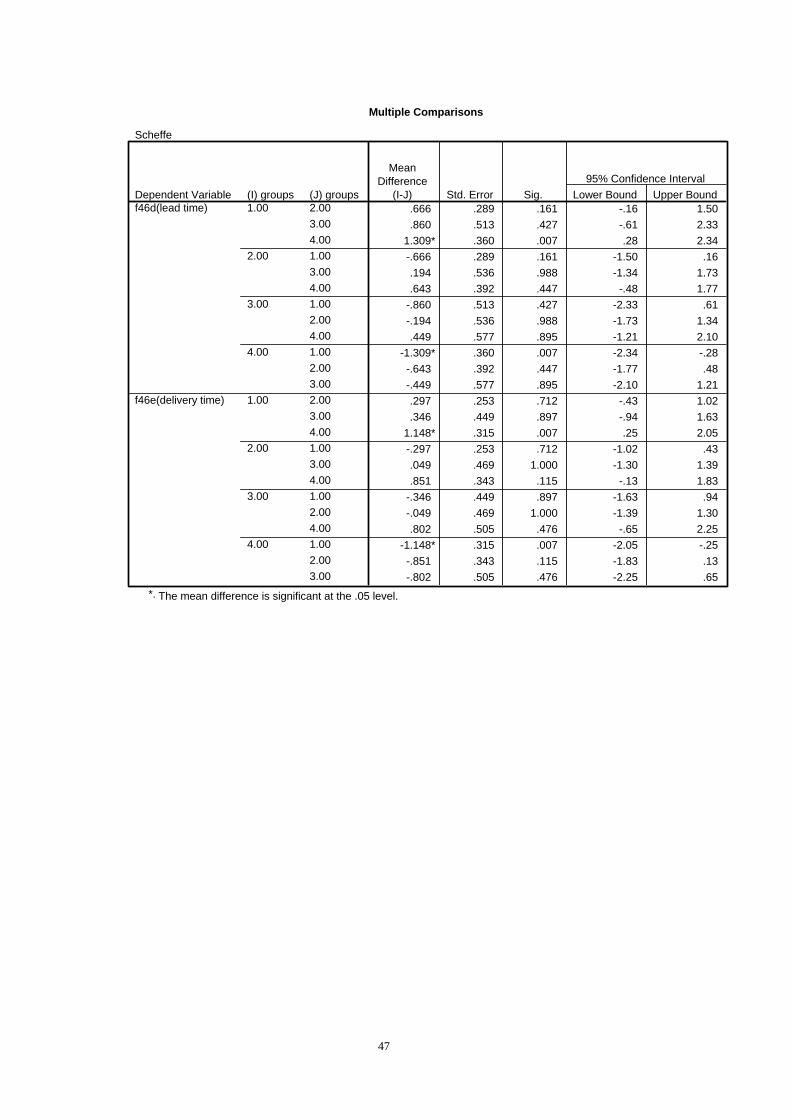
Lead time
0.29 -0.38 -0.57 -0.15 5.271 0.006* 1>4
Delivery time
0.15 -0.14 -0.19 -0.99 4.451 0.006* 1>4
Name of options: The mean difference is significant at the .05Option 1: In house production 1 means in house. Option 2: Off shoring 4 means international outsourcing Option 3: Domestic outsourcing * means sig. < 0.05, ** means sig.<0.005 Option 4: International outsourcing
Summary: “Delivery time” and “lead time” are significant different between in house production and international outsourcing. And 1>4, it means the delivery time and lead time effects in option 1 (In house production) are better than option 4 (International outsourcing). Positive effects inside four options are as below:
24
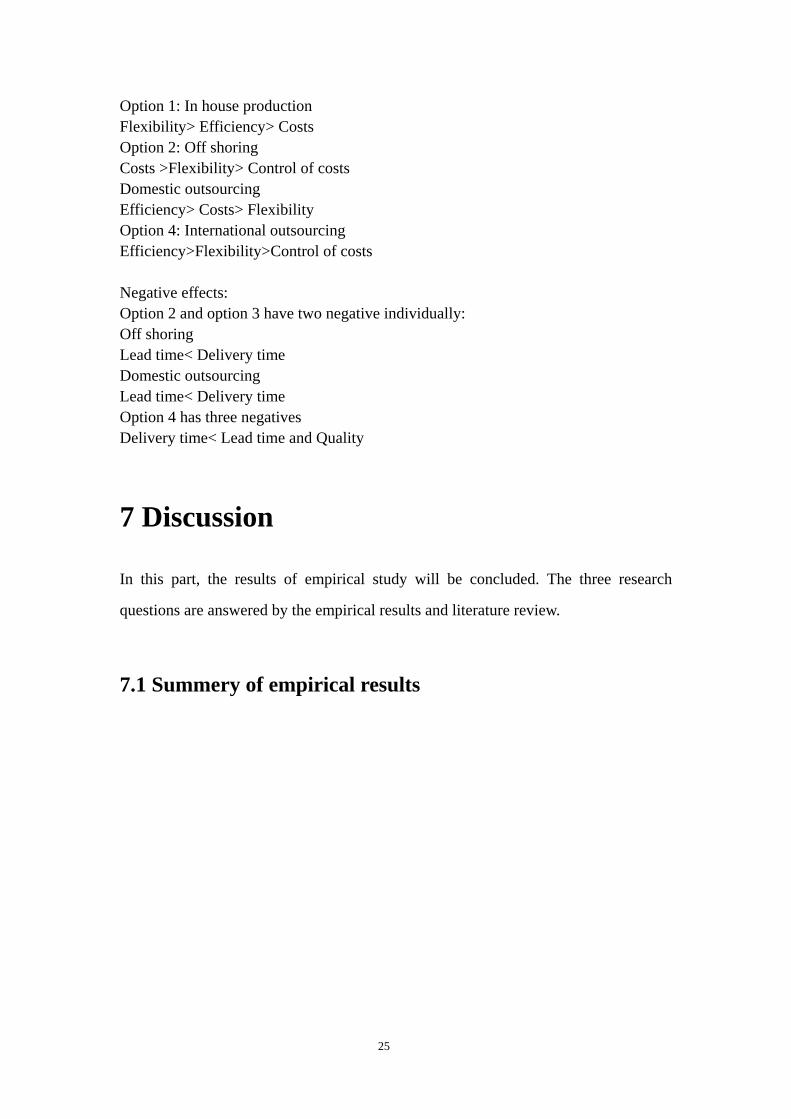
Option 1: In house production Flexibility> Efficiency> Costs Option 2: Off shoring Costs >Flexibility> Control of costs Domestic outsourcing Efficiency> Costs> Flexibility Option 4: International outsourcing Efficiency>Flexibility>Control of costs Negative effects: Option 2 and option 3 have two negative individually: Off shoring Lead time< Delivery time Domestic outsourcing Lead time< Delivery time Option 4 has three negatives Delivery time< Lead time and Quality
7 Discussion
In this part, the results of empirical study will be concluded. The three research
questions are answered by the empirical results and literature review.
7.1 Summery of empirical results
25
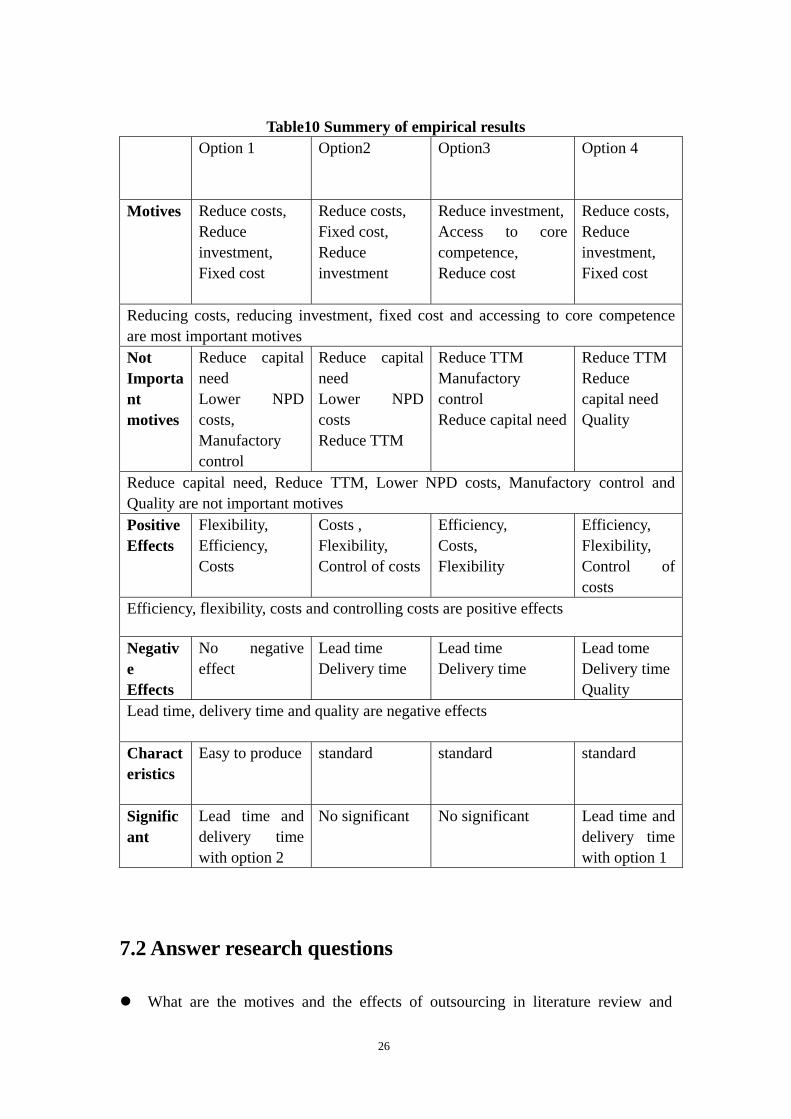
Table10 Summery of empirical results
Option 1
Option2 Option3 Option 4
Motives Reduce costs, Reduce investment, Fixed cost
Reduce costs, Fixed cost, Reduce investment
Reduce investment, Access to core competence, Reduce cost
Reduce costs, Reduce investment, Fixed cost
Reducing costs, reducing investment, fixed cost and accessing to core competence are most important motives Not Important motives
Reduce capital need Lower NPD costs, Manufactory control
Reduce capital need Lower NPD costs Reduce TTM
Reduce TTM Manufactory control Reduce capital need
Reduce TTM Reduce capital need Quality
Reduce capital need, Reduce TTM, Lower NPD costs, Manufactory control and Quality are not important motives Positive Effects
Flexibility, Efficiency, Costs
Costs , Flexibility, Control of costs
Efficiency, Costs, Flexibility
Efficiency, Flexibility, Control of costs
Efficiency, flexibility, costs and controlling costs are positive effects
Negative Effects
No negative effect
Lead time Delivery time
Lead time Delivery time
Lead tome Delivery time Quality
Lead time, delivery time and quality are negative effects Characteristics
Easy to produce standard standard standard
Significant
Lead time and delivery time with option 2
No significant No significant Lead time and delivery time with option 1
7.2 Answer research questions
What are the motives and the effects of outsourcing in literature review and
26

empirical study?
From the results of empirical study, the motives are “reducing costs”, “reducing
investment”, “fixed cost” and “accessing to core competence”. The positive effects
are “efficiency”, “flexibility costs” and “controlling costs”. Negative effects are both
“lead time” and “delivery time” for all outsourcing options and off shoring option.
“Quality” is particularly negative effect only for international outsourcing.
From literature review, motives are: “to reduce operational costs”, “to focus on core
competencies”, “to reduce capital invested”, “to gain access to external competencies”,
“to improve quality”, “to transform fixed costs into variable costs” and “to regain
control over internal departments”. The effects from literature review are: “Cost
reduction” or “hidden cost in outsourcing”, “accessing to innovation” or “outsourcing
hinder innovation”, “Qualities improve” or “qualities not improve” and “Reliability
risk”.
Are there some differences among four options in Swedish companies?
Significant differences between four options are quite few. Only delivery time and
lead time are significant differences between in house production and international
outsourcing options.
Comparison of literatures review and empirical study
Motives:
27
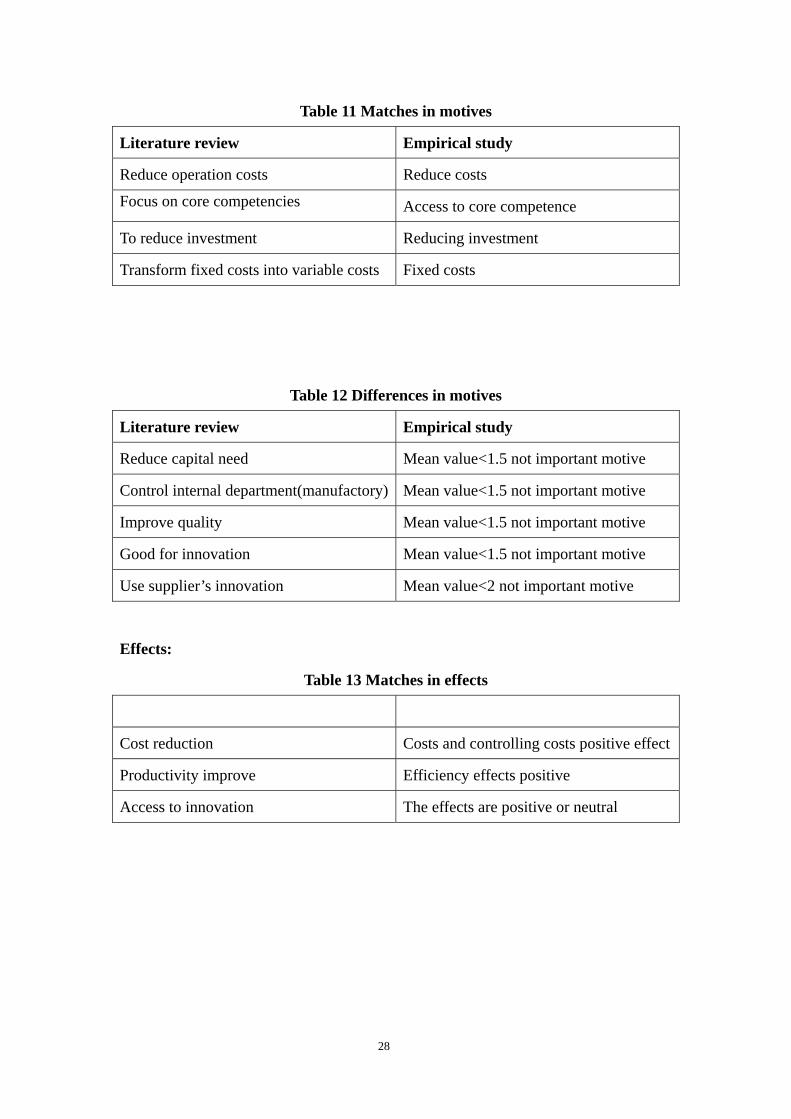
Table 11 Matches in motives
Literature review Empirical study
Reduce operation costs Reduce costs
Focus on core competencies Access to core competence
To reduce investment Reducing investment
Transform fixed costs into variable costs Fixed costs
Table 12 Differences in motives
Literature review Empirical study
Reduce capital need Mean value<1.5 not important motive
Control internal department(manufactory) Mean value<1.5 not important motive
Improve quality Mean value<1.5 not important motive
Good for innovation Mean value<1.5 not important motive
Use supplier’s innovation Mean value<2 not important motive
Effects:
Table 13 Matches in effects
Cost reduction Costs and controlling costs positive effect
Productivity improve Efficiency effects positive
Access to innovation The effects are positive or neutral
28

Table 14 Differences in effects
Literature review Empirical study
Hinder innovation The effects are positive or neutral
Reliable risk Flexibility positive
Quality improve Negative quality effect in international
outsourcing
Loss core competences Positive or neutral
Products characteristics
Table 15 Matches in products characteristics
Literature review Empirical study
Standard and easy to produce Standard and easy to produce
8 Conclusion
In literature review, the important motives for the decision in all options are the same. they are “reducing cost”, “accessing to core competence”, “using suppliers' resources”, “focusing on innovation”, “reducing capital”, “regain control of inside companies”, “transfer fixed cost into available cost”, and so on. In those articles, there are also many parts discussing the effects of those four options. Some of them believe that the benefits of outsourcing options are a lot, such as “reducing cost”, “accessing core competence”, “quality improvement”, “productivity improvement”. However, many authors think the outsourcing options have a lot of shortages as well. If companies begin to use an outside supplier or off-shoring, they will lose their independence, rely on supplier. And it could hinder innovation result by losing core competences and decreasing quality. Even the cost is not as low as the companies suppose. In the survey analysis, it contains a lot of information of the Swedish companies' choices of four options and performances of their business. The statistics results shows us that “cost”, “fixed cost” and “investment reducing” are important motives for all four options. Especially, the off-shoring has an “accessing core competence” motive. Others motives which high lighted in literatures, are not as important. Some of them, like “TTM”, in data analysis, are almost equals to 1(1 means least important). The good news is that effects from empirical study are positive. In house production option has all positive effect results. In outsourcing and off shoring options, only have
29

“delivery time” and “lead time” negative effects. International outsourcing option has one more positive effect, it is quality. In Scheffe’s results, in-house production and international outsourcing options have significant different in “delivery time” and “lead time” effects. It means the time effects is difference between those two options. In characteristic group, the results also show that production characteristics are “easy to produce” and “standard products”. Comparing with literature, the conclusion can be drawn. In the motives groups, most important motives of option decisions are “costs reduce”, “fix costs” and “investment reducing”. Off-shoring option has one more important motive, “accessing core competence”. I realize that motives of “focusing on innovation”, “lower NPD”, “reducing capital need”, “reducing TTM” and “Manufactory control” are not important motives in Swedish companies. In the effects group, effects of in house option are the best. In house production option has no negative effect. Other options have both “lead-time” and “delivery time” negative effects. International outsourcing option has one more negative effect, it is “Quality”. From literature review, outsourcing may hinder innovation and rely on supplier, however, in empirical study, all those effects are positive. In production characteristics’ group, Swedish companies only outsourced “standard” and “easy products”. So this is one reason why “hinder innovation” and “rely on supplier” are positive effects.
9 References
Argyres, N. and J. Liebeskind. (1999), “Contractual Commitments, Bargaining Power, and Governance Inseparability: Incorporating History into Transaction Cost Theory” Academy of Management Review, 24(1), pp.49-63. Alexander, M. and Young, D. (1996a) Outsourcing: where’s the value? Long Range Planning 29, pp728–730. Alexander, M. and Young, D. (1996b) Strategic outsourcing. Long Range Planning 29, pp116–119. Aubert, B.A., Patry, M. and Rivard, S. (1998), “Assessing the risk of IT outsourcing”, Working paper, 98s-16 May 1998, Cirano Montreal. Barney, J.B. (1999) “how a firm’s capabilities affect boundary decisions.” Sloan Management Review, 40. 3. 37-45 Barthe´lemy, J. and Geyer, D. (2000) “IT outsourcing: findings from an empirical survey in France and Germany,” European Management Journal 19(2), pp195–202. Bettis, R. A.; Bradley, S. P. and Hamel, G. (1992); Outsourcing and industrial decline,
30

Academy of Management Executive, (6:1), pp. 7-22. Chiles, T. H. and J. F. McMackin (1996), "Integrating variable risk preferences, trust, and transaction cost economics," Academy of Management Review,Vol. 21, No. 1, pp.73-99. Coase, R. H. (1937), “The Nature of the Firm,” Economica, Vol.4, pp.386-405. Due, R.T., 1992. “The real cost of outsourcing”. Information Systems Management (Winter), 74–76. Doig, S.J., Ritter, R.C., Speckhals, K. and Woolson, D. (2001) “Has outsourcing gone too far?” McKinsey Quarterly 4, pp24–37. Earl, M. (1996), “The risks of outsourcing IT”, Sloan Management Review, Vol. 37 No. 3, pp. 26-32. Gulati. (1999). “Network location and learning: the influence of network resources and capabilities on alliance formation,” Strategic Management Journal 20, NO. 5, 397-400 GAO, (2004), “international trade, Current Government Data Provide Limited Insight into Off-shoring of services,” United States Government Accountability Office Washington, D.C. Hamel, (1991) G. Hamel, Competition for competence and interpartner learning within international strategic alliances, Strategic Management Journal 12. Jennings, D. (1997), "Strategic guidelines for outsourcing decisions", Journal of Strategic Change, Vol. 6 pp.85-96. Klein, B. and R. Crawford, and A. Alchain(1978), “Vertical Integration, Appropriable Rents and the Competitive Contracting Process”, Journal of Law and Economics, Vol.21, pp.297-326. Kakabadse, A. and Kakabadse, N. (2002) “Trends in outsourcing.” European Management Journal 20(2), pp189–198. Lacity, M. and Hirschheim, R. (1993b) “Information systems outsourcing.” Wiley, New York. Lacity, M. and Hirschheim, R. (1993a) “The information systems outsourcing bandwagon.” Sloan Management Review Fall, pp73–86.
31
Menard, C.(1997), “Transaction Cost Economics: Recent Developments,” Edward Elgar, Chapters 1-3. McFarlan, F.W. and Nolan, R.L. (1995) “How to manage an IT outsourcing alliance.” Sloan Management Review Winter, pp9–22. McFarlan, F.W. and Nolan, R.L. (1995) “How to manage an IT outsourcing alliance.” Sloan Management Review Winter, pp9–22. Mclvor, R.T., Humphreys,P.K and McAleer,W.E. (1997). “The implications of the trend towards partershio sourcing in buyer supplier relations.” The journal of general management, 23, NO. 1, 53-69 Mandar Dabhilkar, (2006) “Acting creatively for enhanced performance: challenges for Swedish manufacturers in an age of outsourcing,” Doctoral Thesis Royal Institute of Technology (KTH) Department of Industrial Economics and Management Stockholm, Sweden. Norwood, et al. (2006) “Off-shoring: an elusive phenomenon,” National academy of
public administration. Quinn, J. and Hilmer, F. (1994) “Strategic outsourcing.” Sloan Management Review Summer, pp43–55. Quinn, J.B. (1999), "Strategic outsourcing: leveraging knowledge capabilities", Sloan Management Review, Summer, pp.9-21. Quelin, B., Duhamel, F. (2003), "Bringing together strategic outsourcing and corporate strategy: outsourcing motives and risks", European Management Journal, Vol. 21 No.5, pp.647-61 Rochester, J., Douglas, D. Eds., (1990). “Taking an objective look at outsourcing”. IS analyzer 28, 1–16. Saunders, C.S., Gebelt, M. and Hu, Q. (1997) “Achieving success in information systems outsourcing.” California Management Review 39(2), pp.63–79. Tibor Kremic, Oya Icmeli Tukel, Walter O. Rom, (2006), “Outsourcing decision support: a survey of benefits, risks, and decision factors,” Supply Chain Management: An International Journal, 11(6) pp 467 - 482 Williamson, O. E. (1979), “Transaction Cost Economics: The Government of Contractual Relations,” Journal of Law and Economics, 22(3), pp233-261.
32

Williamson, O. E. (1981), “The Economics of Organization: the Transaction Cost Approach,” American Journal of Sociology, Vol.87, no.3, pp.548-577.
Williamson, O. E. (1985),“ The Economic Institutions of Capitalism:Firms, Markets,
Relational Contracting,"New York:Free Press.
Williamson, O. E. (1991),“Comparative Economic Organization:The Analysis of
Discrete Structural Alternatives,” Administrative Science Quarterly, Vol.36, pp.269-296
33
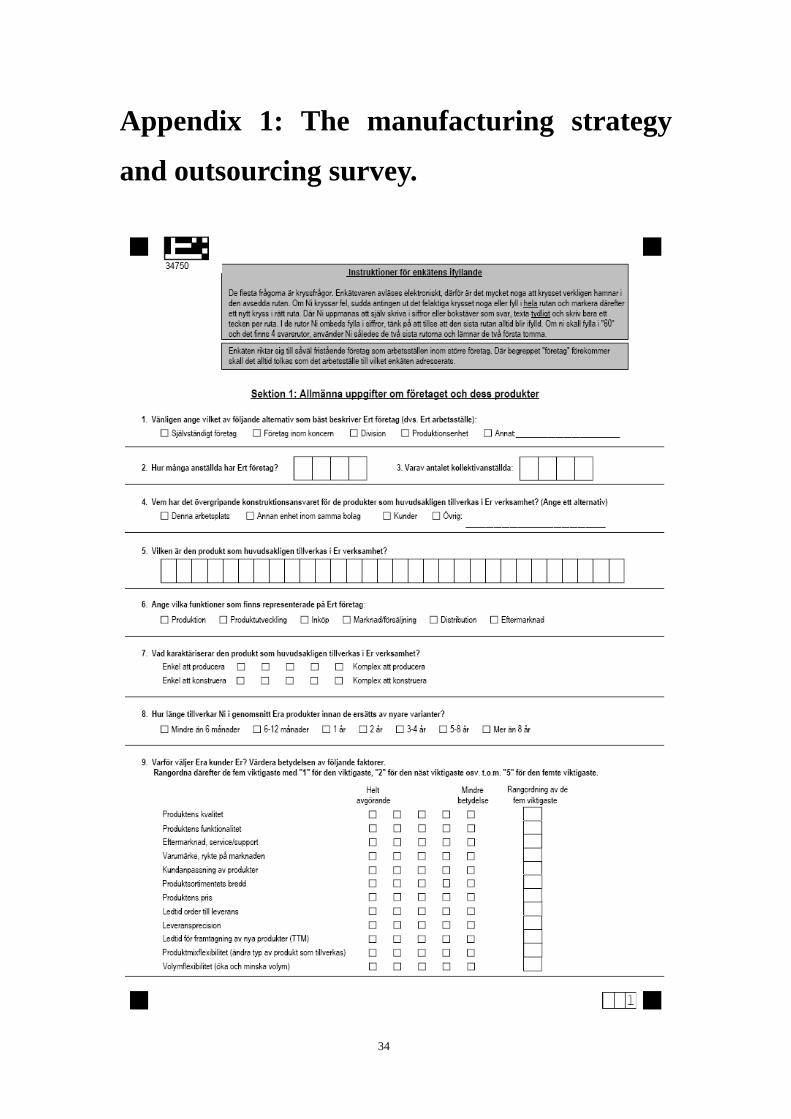
Appendix 1: The manufacturing strategy
and outsourcing survey.
34

35
36

37

38

39

40
41
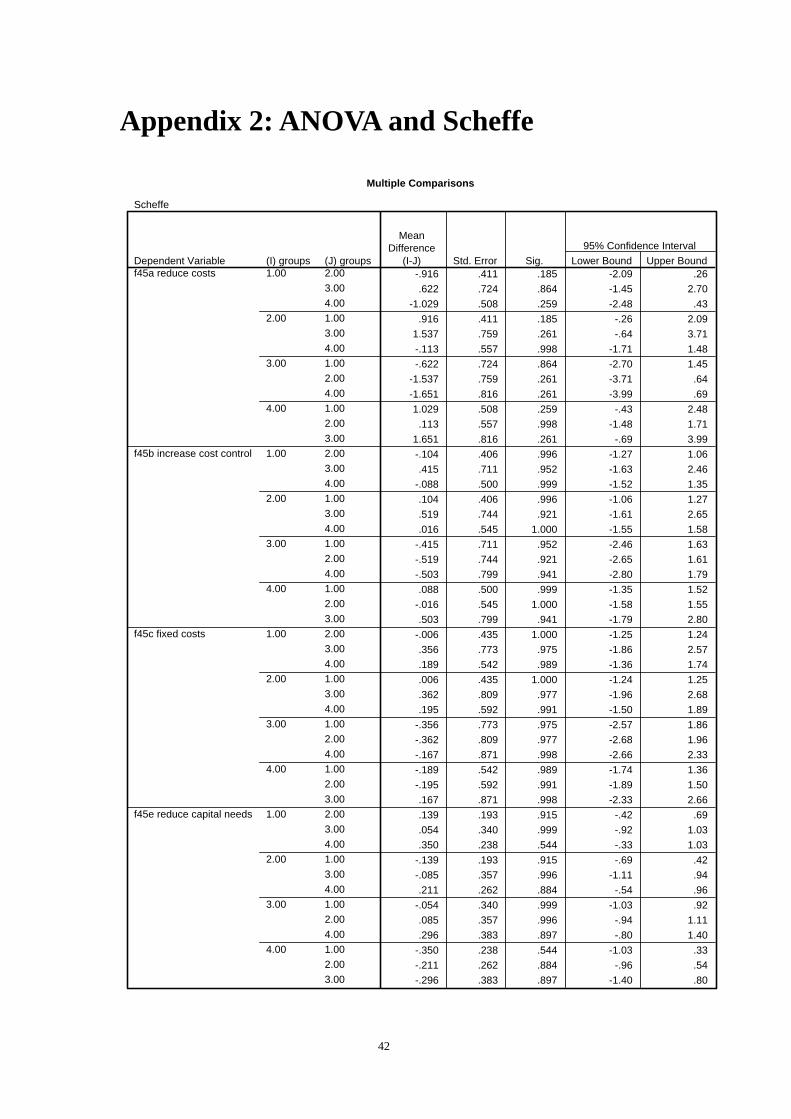
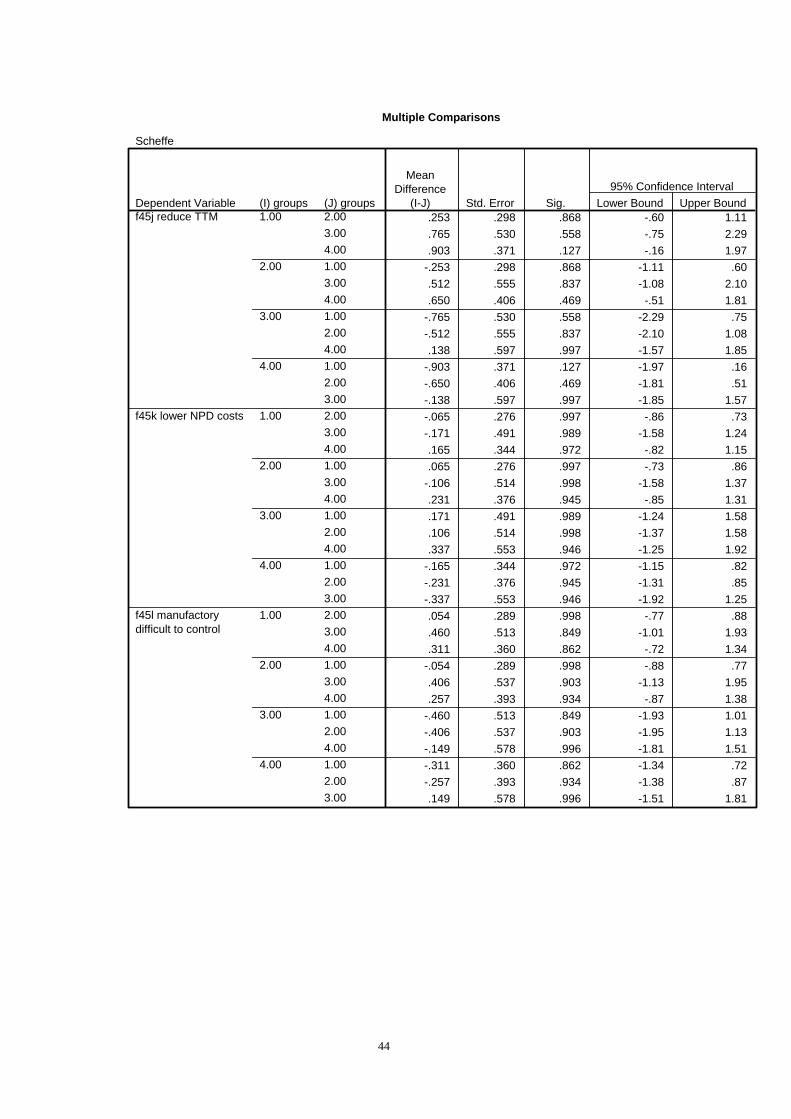
Appendix 2: ANOVA and Scheffe
Multiple Comparisons
Scheffe
-.916 .411 .185 -2.09 .26.622 .724 .864 -1.45 2.70
-1.029 .508 .259 -2.48 .43.916 .411 .185 -.26 2.09
1.537 .759 .261 -.64 3.71-.113 .557 .998 -1.71 1.48-.622 .724 .864 -2.70 1.45
-1.537 .759 .261 -3.71 .64-1.651 .816 .261 -3.99 .691.029 .508 .259 -.43 2.48
.113 .557 .998 -1.48 1.711.651 .816 .261 -.69 3.99-.104 .406 .996 -1.27 1.06.415 .711 .952 -1.63 2.46
-.088 .500 .999 -1.52 1.35.104 .406 .996 -1.06 1.27.519 .744 .921 -1.61 2.65.016 .545 1.000 -1.55 1.58
-.415 .711 .952 -2.46 1.63-.519 .744 .921 -2.65 1.61-.503 .799 .941 -2.80 1.79.088 .500 .999 -1.35 1.52
-.016 .545 1.000 -1.58 1.55.503 .799 .941 -1.79 2.80
-.006 .435 1.000 -1.25 1.24.356 .773 .975 -1.86 2.57.189 .542 .989 -1.36 1.74.006 .435 1.000 -1.24 1.25.362 .809 .977 -1.96 2.68.195 .592 .991 -1.50 1.89
-.356 .773 .975 -2.57 1.86-.362 .809 .977 -2.68 1.96-.167 .871 .998 -2.66 2.33-.189 .542 .989 -1.74 1.36-.195 .592 .991 -1.89 1.50.167 .871 .998 -2.33 2.66.139 .193 .915 -.42 .69.054 .340 .999 -.92 1.03.350 .238 .544 -.33 1.03
-.139 .193 .915 -.69 .42-.085 .357 .996 -1.11 .94.211 .262 .884 -.54 .96
-.054 .340 .999 -1.03 .92.085 .357 .996 -.94 1.11.296 .383 .897 -.80 1.40
-.350 .238 .544 -1.03 .33-.211 .262 .884 -.96 .54-.296 .383 .897 -1.40 .80
(J) groups2.003.004.001.003.004.001.002.004.001.002.003.002.003.004.001.003.004.001.002.004.001.002.003.002.003.004.001.003.004.001.002.004.001.002.003.002.003.004.001.003.004.001.002.004.001.002.003.00
(I) groups1.00
2.00
3.00
4.00
1.00
2.00
3.00
4.00
1.00
2.00
3.00
4.00
1.00
2.00
3.00
4.00
Dependent Variablef45a reduce costs
f45b increase cost control
f45c fixed costs
f45e reduce capital needs
MeanDifference
(I-J) Std. Error Sig. Lower Bound Upper Bound95% Confidence Interval
42

Multiple Comparisons
Scheffe
.381 .301 .661 -.48 1.24
.596 .535 .744 -.94 2.13
.405 .375 .761 -.67 1.48-.381 .301 .661 -1.24 .48.215 .560 .986 -1.39 1.82.024 .410 1.000 -1.15 1.20
-.596 .535 .744 -2.13 .94-.215 .560 .986 -1.82 1.39-.191 .603 .992 -1.92 1.54-.405 .375 .761 -1.48 .67-.024 .410 1.000 -1.20 1.15.191 .603 .992 -1.54 1.92.534 .350 .512 -.47 1.54
-.262 .621 .981 -2.04 1.52.494 .435 .732 -.75 1.74
-.534 .350 .512 -1.54 .47-.796 .650 .684 -2.66 1.07-.039 .476 1.000 -1.40 1.32.262 .621 .981 -1.52 2.04.796 .650 .684 -1.07 2.66.757 .700 .761 -1.25 2.76
-.494 .435 .732 -1.74 .75.039 .476 1.000 -1.32 1.40
-.757 .700 .761 -2.76 1.25.053 .340 .999 -.92 1.03
-.161 .604 .995 -1.89 1.57.711 .423 .425 -.50 1.92
-.053 .340 .999 -1.03 .92-.214 .632 .990 -2.03 1.60.658 .462 .570 -.67 1.98.161 .604 .995 -1.57 1.89.214 .632 .990 -1.60 2.03.872 .680 .651 -1.08 2.82
-.711 .423 .425 -1.92 .50-.658 .462 .570 -1.98 .67-.872 .680 .651 -2.82 1.08.329 .311 .773 -.56 1.22.091 .550 .999 -1.48 1.67.667 .386 .400 -.44 1.77
-.329 .311 .773 -1.22 .56-.237 .573 .982 -1.88 1.41.339 .419 .884 -.86 1.54
-.091 .550 .999 -1.67 1.48.237 .573 .982 -1.41 1.88.576 .617 .832 -1.19 2.35
-.667 .386 .400 -1.77 .44-.339 .419 .884 -1.54 .86-.576 .617 .832 -2.35 1.19
(J) groups2.003.004.001.003.004.001.002.004.001.002.003.002.003.004.001.003.004.001.002.004.001.002.003.002.003.004.001.003.004.001.002.004.001.002.003.002.003.004.001.003.004.001.002.004.001.002.003.00
(I) groups1.00
2.00
3.00
4.00
1.00
2.00
3.00
4.00
1.00
2.00
3.00
4.00
1.00
2.00
3.00
4.00
Dependent Variable45f_Riskspridning
f45g access to corecompetence
f45h increase quality
f45i use suppliers'innovation
MeanDifference
(I-J) Std. Error Sig. Lower Bound Upper Bound95% Confidence Interval
43
Multiple Comparisons
Scheffe
.253 .298 .868 -.60 1.11
.765 .530 .558 -.75 2.29
.903 .371 .127 -.16 1.97-.253 .298 .868 -1.11 .60.512 .555 .837 -1.08 2.10.650 .406 .469 -.51 1.81
-.765 .530 .558 -2.29 .75-.512 .555 .837 -2.10 1.08.138 .597 .997 -1.57 1.85
-.903 .371 .127 -1.97 .16-.650 .406 .469 -1.81 .51-.138 .597 .997 -1.85 1.57-.065 .276 .997 -.86 .73-.171 .491 .989 -1.58 1.24.165 .344 .972 -.82 1.15.065 .276 .997 -.73 .86
-.106 .514 .998 -1.58 1.37.231 .376 .945 -.85 1.31.171 .491 .989 -1.24 1.58.106 .514 .998 -1.37 1.58.337 .553 .946 -1.25 1.92
-.165 .344 .972 -1.15 .82-.231 .376 .945 -1.31 .85-.337 .553 .946 -1.92 1.25.054 .289 .998 -.77 .88.460 .513 .849 -1.01 1.93.311 .360 .862 -.72 1.34
-.054 .289 .998 -.88 .77.406 .537 .903 -1.13 1.95.257 .393 .934 -.87 1.38
-.460 .513 .849 -1.93 1.01-.406 .537 .903 -1.95 1.13-.149 .578 .996 -1.81 1.51-.311 .360 .862 -1.34 .72-.257 .393 .934 -1.38 .87.149 .578 .996 -1.51 1.81
(J) groups2.003.004.001.003.004.001.002.004.001.002.003.002.003.004.001.003.004.001.002.004.001.002.003.002.003.004.001.003.004.001.002.004.001.002.003.00
(I) groups1.00
2.00
3.00
4.00
1.00
2.00
3.00
4.00
1.00
2.00
3.00
4.00
Dependent Variablef45j reduce TTM
f45k lower NPD costs
f45l manufactorydifficult to control
MeanDifference
(I-J) Std. Error Sig. Lower Bound Upper Bound95% Confidence Interval
44
Multiple Comparisons
Scheffe
-.455 .429 .771 -1.69 .77.149 .761 .998 -2.03 2.33.498 .534 .832 -1.03 2.03.455 .429 .771 -.77 1.69.604 .795 .901 -1.68 2.88.954 .582 .448 -.71 2.62
-.149 .761 .998 -2.33 2.03-.604 .795 .901 -2.88 1.68.350 .856 .983 -2.10 2.80
-.498 .534 .832 -2.03 1.03-.954 .582 .448 -2.62 .71-.350 .856 .983 -2.80 2.10-.134 .334 .983 -1.09 .82.194 .592 .991 -1.50 1.89.319 .415 .899 -.87 1.51.134 .334 .983 -.82 1.09.329 .619 .963 -1.45 2.10.453 .453 .801 -.84 1.75
-.194 .592 .991 -1.89 1.50-.329 .619 .963 -2.10 1.45.125 .666 .998 -1.79 2.03
-.319 .415 .899 -1.51 .87-.453 .453 .801 -1.75 .84-.125 .666 .998 -2.03 1.79-.008 .182 1.000 -.53 .51-.323 .322 .799 -1.25 .60.059 .226 .995 -.59 .71.008 .182 1.000 -.51 .53
-.315 .337 .831 -1.28 .65.068 .246 .995 -.64 .77.323 .322 .799 -.60 1.25.315 .337 .831 -.65 1.28.383 .362 .774 -.66 1.42
-.059 .226 .995 -.71 .59-.068 .246 .995 -.77 .64-.383 .362 .774 -1.42 .66.597 .261 .165 -.15 1.34.043 .462 1.000 -1.28 1.37
-.029 .324 1.000 -.96 .90-.597 .261 .165 -1.34 .15-.554 .483 .726 -1.94 .83-.626 .353 .377 -1.64 .39-.043 .462 1.000 -1.37 1.28.554 .483 .726 -.83 1.94
-.073 .520 .999 -1.56 1.42.029 .324 1.000 -.90 .96.626 .353 .377 -.39 1.64.073 .520 .999 -1.42 1.56
(J) groups2.003.004.001.003.004.001.002.004.001.002.003.002.003.004.001.003.004.001.002.004.001.002.003.002.003.004.001.003.004.001.002.004.001.002.003.002.003.004.001.003.004.001.002.004.001.002.003.00
(I) groups1.00
2.00
3.00
4.00
1.00
2.00
3.00
4.00
1.00
2.00
3.00
4.00
1.00
2.00
3.00
4.00
Dependent Variablef46a(costs)
f46b(control of costs)
f46ffunctionality(innovation)
f46g(efficiency)
MeanDifference
(I-J) Std. Error Sig. Lower Bound Upper Bound95% Confidence Interval
45

Multiple Comparisons
Scheffe
.031 .195 .999 -.53 .59
.184 .344 .963 -.80 1.17
.017 .242 1.000 -.68 .71-.031 .195 .999 -.59 .53.153 .359 .980 -.88 1.18
-.014 .263 1.000 -.77 .74-.184 .344 .963 -1.17 .80-.153 .359 .980 -1.18 .88-.166 .387 .980 -1.28 .94-.017 .242 1.000 -.71 .68.014 .263 1.000 -.74 .77.166 .387 .980 -.94 1.28.054 .180 .993 -.46 .57.237 .319 .907 -.68 1.15.195 .224 .858 -.45 .84
-.054 .180 .993 -.57 .46.183 .333 .959 -.77 1.14.142 .244 .952 -.56 .84
-.237 .319 .907 -1.15 .68-.183 .333 .959 -1.14 .77-.041 .359 1.000 -1.07 .99-.195 .224 .858 -.84 .45-.142 .244 .952 -.84 .56.041 .359 1.000 -.99 1.07.038 .152 .996 -.40 .47.146 .270 .961 -.63 .92.146 .189 .897 -.40 .69
-.038 .152 .996 -.47 .40.108 .282 .986 -.70 .92.108 .206 .964 -.48 .70
-.146 .270 .961 -.92 .63-.108 .282 .986 -.92 .70.000 .303 1.000 -.87 .87
-.146 .189 .897 -.69 .40-.108 .206 .964 -.70 .48.000 .303 1.000 -.87 .87.472 .283 .433 -.34 1.28.637 .502 .659 -.80 2.08.617 .352 .387 -.39 1.63
-.472 .283 .433 -1.28 .34.165 .525 .992 -1.34 1.67.145 .384 .986 -.96 1.25
-.637 .502 .659 -2.08 .80-.165 .525 .992 -1.67 1.34-.020 .565 1.000 -1.64 1.60-.617 .352 .387 -1.63 .39-.145 .384 .986 -1.25 .96.020 .565 1.000 -1.60 1.64
(J) groups2.003.004.001.003.004.001.002.004.001.002.003.002.003.004.001.003.004.001.002.004.001.002.003.002.003.004.001.003.004.001.002.004.001.002.003.002.003.004.001.003.004.001.002.004.001.002.003.00
(I) groups1.00
2.00
3.00
4.00
1.00
2.00
3.00
4.00
1.00
2.00
3.00
4.00
1.00
2.00
3.00
4.00
Dependent Variablef46i(NPD time)
f46j time for industrial
f46k costs for NPD
f46l flexibility
MeanDifference
(I-J) Std. Error Sig. Lower Bound Upper Bound95% Confidence Interval
46
Multiple Comparisons
Scheffe
.666 .289 .161 -.16 1.50
.860 .513 .427 -.61 2.331.309* .360 .007 .28 2.34-.666 .289 .161 -1.50 .16.194 .536 .988 -1.34 1.73.643 .392 .447 -.48 1.77
-.860 .513 .427 -2.33 .61-.194 .536 .988 -1.73 1.34.449 .577 .895 -1.21 2.10
-1.309* .360 .007 -2.34 -.28-.643 .392 .447 -1.77 .48-.449 .577 .895 -2.10 1.21.297 .253 .712 -.43 1.02.346 .449 .897 -.94 1.63
1.148* .315 .007 .25 2.05-.297 .253 .712 -1.02 .43.049 .469 1.000 -1.30 1.39.851 .343 .115 -.13 1.83
-.346 .449 .897 -1.63 .94-.049 .469 1.000 -1.39 1.30.802 .505 .476 -.65 2.25
-1.148* .315 .007 -2.05 -.25-.851 .343 .115 -1.83 .13-.802 .505 .476 -2.25 .65
(J) groups2.003.004.001.003.004.001.002.004.001.002.003.002.003.004.001.003.004.001.002.004.001.002.003.00
(I) groups1.00
2.00
3.00
4.00
1.00
2.00
3.00
4.00
Dependent Variablef46d(lead time)
f46e(delivery time)
MeanDifference
(I-J) Std. Error Sig. Lower Bound Upper Bound95% Confidence Interval
The mean difference is significant at the .05 level.*.
47