Embed Size (px)
Citation preview

2010-11 Queensland State Budget - Service Delivery Statements – Department of Public Works 2-154
PART 14
Department of Public Works Summary of departmental portfolio budgets
Page Agency 2009-10Budget
$’000
2009-10 Est. act.
$’000
2010-11Estimate
$’000 2-154 Department of Public Works - controlled 612,357 620,291 643,450 Department of Public Works - administered 68,743 68,491 43,881 2-179 QBuild 735,883 804,065 838,8102-186 Project Services 142,591 179,709 151,1312-194 QFleet 143,099 208,155 222,5742-201 CITEC 173,705 174,596 201,1922-209 Goprint 15,186 13,938 14,2542-216 SDS (Sales and Distribution Services) 66,031 68,588 64,136 2-223 Shared Service Agency 184,681 177,964 189,5802-230 CorpTech 129,044 130,865 123,608 2-237 Queensland Building Services Authority 126,260 145,351 148,085 Note: 1. Explanations of variances are provided in the financial statements.

2010-11 Queensland State Budget - Service Delivery Statements – Department of Public Works 2-155
DEPARTMENTAL OVERVIEW
MINISTERIAL RESPONSIBILITY The Minister for Public Works and Information and Communication Technology has administrative responsibility for the functions of the Department of Public Works.
STRATEGIC ISSUES The department performs a key role by working with other government agencies in assisting them to deliver their services to the people of Queensland. The department has lead agency responsibility for the design, construction, fitout and maintenance of government buildings; Information and Communication Technology (ICT); procurement; and recordkeeping in Queensland’s public sector. It also provides high quality, standardised corporate services and business solutions to Government agencies through the Shared Service Agency and CorpTech, and provides the primary point of contact for Queenslanders accessing government services through Smart Service Queensland. A significant number of the department’s services are delivered through its commercialised business units: QBuild; Project Services; QFleet; CITEC; Goprint; and SDS. The department supports the Government’s Toward Q2: Tomorrow’s Queensland – the Government’s blueprint to address the State’s long term economic, environment and social challenges and opportunities – through five ambitions:
� Strong – Creating a diverse economy powered by bright ideas through built infrastructure, ICT and services that support growth in Queensland
� Green – Protecting our lifestyle and environment through sustainable fleet management, green ICT and building initiatives
� Smart – Delivering world class education and training by providing graduate programs and local training and employment opportunities through construction trade apprentices, graduate programs in ICT and procurement and traineeships
� Healthy – Making Queenslanders Australia’s healthiest people through implementing a whole-of-department health program to assist staff manage their health, wellbeing and safety (Better Pathways to Health Program)
� Fair – Supporting safe and caring communities through volunteer programs at Roma Street Parkland and Queensland State Archives, and supporting reconciliation through the department’s Reconciliation Management Plan 2007-10 Working Towards Reconciliation.
The department’s lead role in coordinating built infrastructure projects under the Australian Government’s Nation Building – Economic Stimulus Plan (the plan to stimulate the economy and build lasting infrastructure for Australia’s future) also contributes to a strong Queensland. Fast-tracking the implementation of the Nation Building – Economic Stimulus Plan and the Government’s building capital works program to support jobs and strengthen the Queensland economy remains a key challenge for the department. The department is striving to improve service delivery through the use of emerging technologies and shared arrangements, and reduce costs through the efficient use of resources. The community’s growing demand for seamless access to government services, and the need to meet a high standard of accountability, transparency and integrity are key factors influencing service delivery.

2010-11 Queensland State Budget - Service Delivery Statements – Department of Public Works 2-156
To address these issues, the department is pursuing seven strategic objectives: � improve building asset management outcomes across government – measured through
delivering capital works projects on time and within budget; gaining a return on investment for the office portfolio and government employee housing; and reducing vacancy rates for office accommodation and employee housing portfolios
� improve efficiency and effectiveness in ICT investment – measured by savings and benefits delivered through ICT programs
� enhance delivery of cost-effective support services – measured through reduced cost for services; and meeting government fiscal targets
� deliver better procurement outcomes for the Government – measured by savings and benefits delivered under existing and new arrangements for government agencies
� manage information effectively – measured by client satisfaction � manage environmental initiatives effectively– measured through reductions in energy
consumption in government buildings; and vehicle fleet carbon dioxide emissions � enhance organisational capability and governance to support future service delivery –
measured through cost-effective departmental corporate services.
2010-11 HIGHLIGHTS
Building infrastructure The department will manage an extensive program of building capital works on behalf of Government agencies and provide advice and building asset management services including: � delivering major construction infrastructure projects, including:
- a 23,000-seat AFL stadium at Carrara on the Gold Coast capable of accommodating international standard sporting events;
- the 19-storey Supreme Court and District Court complex in the Brisbane central business district;
- government office buildings at Maroochydore, Thursday Island and Cairns; - an Ecosciences Precinct at Boggo Road, Brisbane (Australia’s first science “centre of
excellence” supporting innovative research into climate change, healthy environment, balanced growth, sustainable industries and mineral and petroleum resources);
- procurement management of new major State hospitals including including the Gold Coast University Hospital and Queensland Children’s Hospital, and redevelopment of hospitals at Robina, Cairns, Townsville, Mackay and Rockhampton; and
- significant correctional centre facilities at Gatton and Lotus Glen. � continuing to coordinate the implementation of the Australian Government’s Nation
Building – Economic Stimulus for State-wide education, social housing, roads and safety projects.
Information and communication technology The Government’s strategy for government information and communication technology, Toward Q2 through ICT (2009-2014), sets the direction for improving the management and use of information and communication technology investment, and for driving initiatives, programs and projects across government. These endeavours, as outlined in the Toward Q2 through ICT implementation plan, help create a more accessible, efficient and effective government, and a strong industry/government partnership.

2010-11 Queensland State Budget - Service Delivery Statements – Department of Public Works 2-157
In addition, the department will deliver ICT initiatives including: � embedding the ‘one government’ approach to ICT investment and management through
increased visibility and collaboration on ICT initiatives and reduced duplication of effort (resources) across the sector
� promoting a single general enquiries number for the Government � delivering improved online information and services through the Government website
www.qld.gov.au � working with the Australian Government and Queensland Government agencies to
prioritise rollout principles and objectives, and identify Queensland broadband assets and capabilities to influence the timing and extent of the broadband rollout in Queensland
� pursuing the use of Web 2.0 technologies to engage the Queensland public in policy development
� opening two further Queensland Government Service Centres in Cairns and Maroochydore to provide a single point of service delivery managed by Smart Service Queensland
� implementing whole-of-Government capability to use SMS to support service delivery across all agencies
� progressing agencies’ adoption of the Government’s ‘share before buy before build’ and early market engagement practices for planned ICT investments
� progressing sector adoption of ICT policies, methodologies and frameworks to enable the maximisation of government ICT investment for delivery of business outcomes
� continuing to implement the program and project management methodologies within agencies and within the department
� progressing human resources and finance systems consolidation under the Corporate Solutions Program.
Environmental initiatives The department will deliver environmental initiatives including: � reducing the government vehicle fleet’s engine emissions by 25% by the end of 2012
from the 30 June 2007 baseline � supporting the Government’s commitment to meeting national greenhouse gas emissions
reductions targets by assisting agencies to improve the energy efficiency of their building portfolios
� increasing the minimum energy performance standard target for new government office buildings to 5 stars (out of 5) using the National Australian Built Environment Rating System for Offices (energy), where practical
� continuing to trial new low emission and renewable energy technologies for potential application in government buildings.
Cost-effective government service delivery The department will progress: � delivering savings and benefits through sector-wide procurement arrangements for
common use items � providing standardised shared services, delivered by the Shared Service Agency,
CorpTech and Smart Service Queensland � completing the rollout of the Travel Management System across all government agencies � providing a range of building, ICT and administrative services to agencies by the
department’s commercialised business units (QBuild, Project Services, QFleet, CITEC, Goprint and SDS)

2010-11 Queensland State Budget - Service Delivery Statements – Department of Public Works 2-158
� continuing to provide project, program and portfolio management, planning methodologies, and risk management.
RECENT ACHIEVEMENTS
Building infrastructure Building infrastructure achievements in 2009-10 included the: � completion of the Kurilpa Bridge linking the Central Business District and South Bank � completion of the Joint Contact Centre at Zillmere which was awarded the six star Green
Star - Office Design v2 rating � redevelopment of the former Kangaroo Point TAFE site adjacent to the Kangaroo Point
cliffs � progression of new government office buildings at Maroochydore, Cairns and Thursday
Island � completion of the Health and Food Sciences Precinct at Coopers Plains � completion of the developed design and demolition works, and commencing site works
for the AFL stadium at Carrara on the Gold Coast � commencement of the construction of the Supreme Court and District Court complex in
Brisbane � development of a new minimum security standard for all government employee housing
located in remote areas and completing a security audit against the new standard across 30 remote communities
� ongoing improvement and upgrade of the security and safety of government employee accommodation facilities in remote areas, including the Torres Strait region and central, south west and north west areas of Queensland
� introduction of the Government Employee Housing Management Framework, which was approved in November 2009 and is now mandated across the Government to improve employee housing portfolios and enhance the safety and security of government employees and their families
� continued coordination of the implementation of the Australian Government’s Nation Building – Economic Stimulus Plan in Queensland.
Information and communication technology Information and communication technology achievements in 2009-10 included: � developing the Government’s Toward Q2 through ICT strategy and establishing a
collaborative ‘one government’ approach to the implementation of ICT initiatives � opening the first Queensland Government Service Centre; a multi-agency counter in the
Brisbane CBD providing approximately 5,000 transactions a month through a single point of service delivery with services ranging from seniors, carers and companion card information, first home owner grants, payroll tax and land tax payments, and gaming and liquor licences
� reinforcing the ‘share before buy before build’ direction in the Queensland Government Enterprise Architecture and reviewing ICT purchases of more than $2 million and providing the opportunity to realise savings through the reuse of existing assets
� developing a strong foundation of ICT methodologies and frameworks to enable agencies to maximise their ICT investment
� establishing new Queensland Government Agent Program services in eight new locations including Childers, Gayndah, Mossman, Nanango, Pittsworth, Taroom, Toogoolawah and Tully

2010-11 Queensland State Budget - Service Delivery Statements – Department of Public Works 2-159
� establishing an office in Queensland to focus on the National Broadband Network (NBN) and maximise the benefits of NBN rollout in the State and the State’s investment in telecommunication
� transitioning the equipment and other ICT infrastructure of three departments and the Public Trustee to Polaris Data Centre at Springfield
� being the front door to the Queensland Government and managing over 3 million telephone interactions, approximately 2 million online interactions and over 280,000 face-to-face interactions through Smart Service Queensland
� commemorating Queensland’s 150th Anniversary through a Queensland State Archives’ travelling events and exhibition program which showcased Queenslanders memorable moments and people in 32 venues across the State
� launching the Queensland State Archives’ and State Library joint strategy Towards a Queensland Digital Content Strategy: A Statement of Intent by State Library of Queensland and Queensland State Archives to improve access to important archival and cultural material.
Environmental initiatives Achievements related to environmental initiatives included: � managing a bulk renewable energy purchase to reduce annual carbon emissions from
government building electricity use by over 33,500 tonnes � reducing the carbon dioxide emissions from vehicle fleet by 20.9% from the 30 June 2007
baseline, exceeding the target of 15% set to be achieved by the end of 2010 in the QFleet ClimateSmart Action Plan 2007-2010
� delivering the Energy Smart Buildings program to assist agencies reduce energy consumption in their buildings
� progressing construction of the Ecosciences Precinct at Boggo Road, Brisbane (Australia’s first science “centre of excellence” supporting innovative research into climate change, healthy environment, balanced growth, sustainable industries and mineral and petroleum resources)
� improving the department’s technical capability to support delivery of the Government’s environmental and safety initiatives, particularly in the removal of asbestos containing material and safety within the construction industry
� provision of disaster management support to Queensland residents following monsoonal flooding and tropical cyclones Neville, Olga, Ului and Paul from January to April 2010 and central and south Queensland flooding in December 2009
� deploying the whole-of-Government Recycling Policy for Buildings and Civil Infrastructure for application by government agencies.
Cost-effective government service delivery Achievements in 2009-10 included: � procurement benefits in the form of $41 million savings generated from common use
arrangements � continuing to implement a Travel Management System now live in all 13 agencies with
the complete rollout expected to be finalised in December 2010 � establishing a print management broker to ensure that competitive quotes are received for
all print work undertaken by core departments.

2010-11 Queensland State Budget - Service Delivery Statements – Department of Public Works 2-160
DEPARTMENTAL SERVICES
The Government’s Performance Management Framework is being progressively implemented. The Framework no longer uses the concepts of ‘outputs’ and ‘performance measures’ that were previously used in Service Delivery Statements. They are replaced with ‘services’ and ‘service standards’. These terms are defined in the Budget Readers’ Guide. Together, they begin to provide information about how efficiently and effectively agencies deliver services within their approved Budget. All agencies reviewed their service structures and service standards as part of this transition year. Approved changes are included in this year’s Service Delivery Statement. Results against measures that have been discontinued are included in Appendix A (Book 5 of the Service Delivery Statements) for this year only. A key aspect of improving performance information is reviewing performance data. As such, each year agencies will continue to review and improve their service standards to provide better information on the effectiveness and efficiency of their services. The department comprises four divisions (Information and Communication Technology; Services; Works; and Corporate and Executive Services), which deliver and support the following services: � Building Procurement and Asset Management � Procurement Services � Information and Communication Technology (ICT) Strategies � Public Records Management and Advisory Services � Access to Government Services and Information.
Building Procurement and Asset Management Building Procurement and Asset Management assists building industry improvement and provides support and advice to the Government and its agencies on the delivery of services through the cost-effective provision and management of building assets. This is achieved through: � introducing major initiatives and programs to improve the environmental aspects of the
built environment � initiating and delivering strategic building and infrastructure projects � providing and managing government accommodation and special estates � providing building policy and advice and improved government and industry
relationships.
Procurement Services Procurement Services, delivered by the Queensland Government Chief Procurement Office (QGCPO), focuses on achieving cost savings and benefits through effective procurement policy and practice. The QGCPO provides a policy framework and is currently leading procurement reform through the implementation of the Service Delivery and Performance Commission’s Report on the Review of Purchasing and Logistics in the Queensland Government.

2010-11 Queensland State Budget - Service Delivery Statements – Department of Public Works 2-161
Information and Communication Technology (ICT) Strategies Information and Communication Technology (ICT) Strategies is delivered by several service areas within the ICT Division:
� the Telecommunications, Broadband and Digital Economy Coordination Office, which focuses on the strategic direction of radio and telecommunications for the State, the roll-out of broadband and the readiness of the State to participate in the broadband agenda, and the coordination of digital economy activities.
� the ICT Policy and Coordination Office, which focuses on high-level, whole-of-Government ICT policy and coordination. This office is responsible for the whole-of-Government enterprise architecture and for the management of the State’s representation on national bodies, specific State-based coordination requirements and for whole-of-Government ICT strategy.
� the Public Sector ICT Development Office, which is responsible for coordinated liaison with agencies, understanding key agency ICT directions and linking agencies with like agendas and objectives. This office works with agencies to achieve the implementation of whole-of-Government ICT priorities and to provide the necessary assistance to encourage agencies to adopt the recommended policies and practices.
Public Records Management and Advisory Services Queensland State Archives (QSA) is the lead agency for the management of the public records of Queensland through the application of the Public Records Act 2002 and the accompanying recordkeeping policy framework. QSA is also the custodian of the largest and most significant documentary heritage collection in Queensland.
Access to Government Services and Information Smart Service Queensland facilitates easier access to responsive government services and information and provides the primary point of contact for Queenslanders to access government services through multiple delivery channels. Smart Service Queensland’s key objective is to deliver value for money by making government services more accessible, efficient and convenient to customers; and by minimising service delivery costs for agencies and government as a whole.

2010-11 Queensland State Budget - Service Delivery Statements – Department of Public Works 2-162
STAFFING1
Service Notes 2009-10Budget
2009-10 Est. actual
2010-11Estimate
Services
Building Procurement and Asset Management 2 207 210 212Procurement Services 3 92 108 119Information and Communication Technology (ICT) Strategies
4 78
101 98
Public Records Management and Advisory Services 5 59 59 61Access to Government Services and Information 6 399 420 444
Total services 835 898 934 BUSINESS UNITS
QBuild 7 2,700 2,800 2,780Project Services 8 782 778 722QFleet 9 121 125 125CITEC 10 732 737 761Goprint 60 61 61SDS (Sales and Distribution Services) 129 129 129
Total business units 4,524 4,630 4,578 SHARED SERVICE INITIATIVE
Shared Service Agency 11 1,534 1,450 1,370CorpTech 12 390 425 412
Total shared service initiative 1,924 1,875 1,782 Corporate Services (Recovered from Services, Business Units and Department of Communities)
13 264 282 333
Total 7,547 7,685 7,627 Notes: 1. Full-time equivalents (FTEs) as at 30 June. 2. The overall increase in both the 2009-10 Estimated actual and the 2010-11 Estimate is due to additional temporary
resources required for whole-of-Government program delivery initiatives. 3. The overall increase in both the 2009-10 Estimated actual and the 2010-11 Estimate is due to a restructure and additional
temporary project resources within the Print Management Unit. 4. The overall increase in both the 2009-10 Estimated actual and the 2010-11 Estimate is due to staff required to support the
National Broadband and Council of Australian Governments initiatives and to meet the Government’s strategic Information Communication Technology (ICT) objectives and needs.
5. The increase in the 2010-11 Estimate is due to additional resources required for Digital Preservation initiatives. 6. The overall increase in both the 2009-10 Estimated actual and the 2010-11 Estimate is due to additional staff required to
meet an increase in client servicing arrangements. 7. The overall increase in both the 2009-10 Estimated actual and the 2010-11 Estimate is due to increased volumes of work. 8. The reduction in both 2009-10 Estimated actual and the 2010-11 Estimate is due to a reduced program of work. 9. The overall increase in both the 2009-10 Estimated actual and the 2010-11 Estimate is due to the filling of vacant positions. 10. The overall increase in both the 2009-10 Estimated actual and the 2010-11 Estimate is due to additional resources required
to support Data Centre, Network and Infrastructure Services at a whole-of-government level. 11. The overall reduction in both the 2009-10 Estimated actual and the 2010-11 Estimate is due to the transfer of ICT staff to the
Corporate Services area, the cessation of some existing non-mandated services and ongoing systems and process reform improvements.
12. The overall increase in both the 2009-10 Estimated actual and the 2010-11 Estimate is due to additional temporary staff required for software development supporting the whole-of-government Corporate Solutions Program.
13. The overall increase in both the 2009-10 Estimated actual and the 2010-11 Estimate is due to the transfer of ICT staff from the Shared Service Agency, the conversion of agency staff to temporary employees and additional IT staff to support departmental business systems.

2010-11 Queensland State Budget - Service Delivery Statements – Department of Public Works 2-163
2010-11 SERVICE SUMMARY1
Sources of revenue2
Service area Total cost$’000
State Contribution
$’000
Usercharges
$’000
C’wealth revenue
$’000
Otherrevenue
$’000 Building Procurement and Asset Management
473,251 (17,547) 489,389 .. 1,409
Procurement Services 25,151 12,301 12,850 .. .. Information and Communication Technology (ICT) Strategies
37,713
37,500
213
..
.. Public Records Management and Advisory Services
18,562
18,462
100
..
.. Access to Government Services and Information
56,619
43,060
13,559
..
..
Total 611,296 93,776 516,111 .. 1,409 Notes: 1. Explanations of variances are provided in the “Departmental financial statements”. 2. The total of the sources of revenue columns does not equal the “Total income” in the “Departmental financial statements”
because transactions have been eliminated on consolidation in the “Departmental financial statements”. In addition, there are corporate services provided to the Department of Communities, business units and shared service providers of the Department of Public Works and the revenues and costs associated with these services are not included in the above Services summary.

2010-11 Queensland State Budget - Service Delivery Statements – Department of Public Works 2-164
DEPARTMENTAL STATEMENTS
PERFORMANCE STATEMENT
Service standards Notes 2009-10Target/est.
2009-10 Est. actual
2010-11Target/est.
Service: Building Procurement and Asset Management Manage government funded programs that focus on the built environment
Program of completed
works on time, within budget
and in accordance with agreed
program outcomes
Program of completed
works on time, within budget
and in accordance with agreed
program outcomes
Program of completed
works on time, within budget
and in accordance with agreed
program outcomes
Whole-of-Government built environment information system availability
95% 95% 95%
Whole-of-department emergency/disaster and continuity management plans are reviewed and evaluated for their accuracy, operational adequacy and alignment to departmental policy relevant State-wide strategy and policy
Review of whole-of-
department emergency/ disaster and
continuity management
plans annually
Review of whole-of-
department emergency
/disaster and continuity
management plans annually
Review of whole-of-
department emergency/disaster and
continuity management
plans annually
Strategic projects facilitated within preset parameters focussing on time and budget
�90% 100% �90%
Electricity consumption for office buildings greater than 9,000m2
(Net lettable area) in the owned office portfolio
1 �265kWh/m2/ each year
250 �250
Water use for owned office buildings between 9,000m2 and 18,000m2 (Net lettable area)
2,3 �19.8Kl/person/each year
11.5 �15
Water use for owned office accommodation >18,000m2 (Net lettable area)
2 �16 Kl/person/ each year
14.8 �15
Reduction in CO2 emissions due to waste not going to landfill
�425 tonnes 410 �425
Return on investment for the commercial properties included in the office portfolio (inclusive of maintenance)
6.5% 6.5% 6.5%
Return on investment for the government employee housing portfolio (inclusive of maintenance)
4 2.2% 3.2% 2.2%
2010-11 Queensland State Budget - Service Delivery Statements – Department of Public Works 2-165
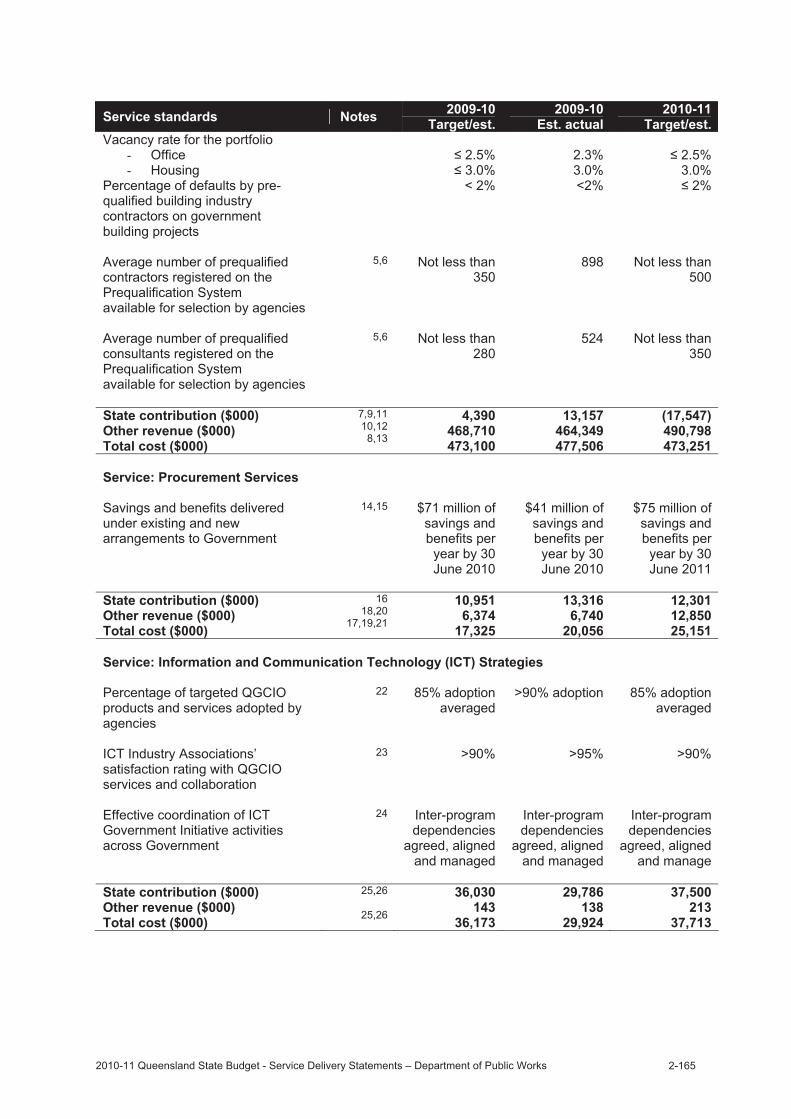
Service standards Notes 2009-10
Target/est.2009-10
Est. actual 2010-11
Target/est.Vacancy rate for the portfolio
- Office - Housing
� 2.5%
� 3.0%
2.3% 3.0%
� 2.5%3.0%
Percentage of defaults by pre-qualified building industry contractors on government building projects
< 2% <2% � 2%
Average number of prequalified contractors registered on the Prequalification System available for selection by agencies
5,6 Not less than 350
898 Not less than 500
Average number of prequalified consultants registered on the Prequalification System available for selection by agencies
5,6 Not less than 280
524 Not less than 350
State contribution ($000) Other revenue ($000) Total cost ($000)
7,9,11 10,12
8,13
4,390468,710473,100
13,157 464,349 477,506
(17,547)490,798473,251
Service: Procurement Services Savings and benefits delivered under existing and new arrangements to Government
14,15 $71 million of savings and benefits per
year by 30 June 2010
$41 million of savings and benefits per
year by 30 June 2010
$75 million of savings and benefits per
year by 30 June 2011
State contribution ($000) Other revenue ($000) Total cost ($000)
16 18,20
17,19,21
10,9516,374
17,325
13,316 6,740
20,056
12,30112,85025,151
Service: Information and Communication Technology (ICT) Strategies Percentage of targeted QGCIO products and services adopted by agencies
22 85% adoption averaged
>90% adoption 85% adoption averaged
ICT Industry Associations’ satisfaction rating with QGCIO services and collaboration
23 >90% >95% >90%
Effective coordination of ICT Government Initiative activities across Government
24 Inter-program dependencies
agreed, aligned and managed
Inter-program dependencies
agreed, aligned and managed
Inter-program dependencies
agreed, aligned and manage
State contribution ($000) Other revenue ($000) Total cost ($000)
25,26
25,26
36,030143
36,173
29,786 138
29,924
37,500213
37,713

2010-11 Queensland State Budget - Service Delivery Statements – Department of Public Works 2-166
Service standards Notes 2009-10
Target/est.2009-10
Est. actual 2010-11
Target/est. Service: Public Records Management and Advisory Services
Number of Public Clients - Online - Walk-in
440,000
6,700
440,000
6,600 440,000
6,800
Level of client satisfaction with QSA services
95% 95% 95%
State contribution ($000) Other revenue ($000) Total cost ($000)
18,938100
19,038
18,185 100
18,285
18,462100
18,562 Service: Access to Government Services and Information Volume of interactions with Smart Service Queensland service delivery channels
- Telephone - Online - Face-to-face
27 28
3,150,000 2,300,000
230,000
3,200,000 1,935,000
285,000
3,200,000 2,000,000
300,000
Number of cards issued to eligible Queenslanders
40,000
40,000 40,000
Number of concession services provided for eligible Queenslanders
29 900,000 1,010,000 1,020,000
Level of customer satisfaction with the services delivered by Smart Service Queensland
80% 80% 80%
State contribution ($000) Other revenue ($000) Total cost ($000)
30,33,34 31,35
32,33,36
33,85513,55947,414
38,033 16,545 54,578
43,06013,55956,619
Notes: 1. The full effect of electricity-saving initiatives has resulted in a marked reduction in electricity usage. 2. The full effect of water-saving initiatives has resulted in a marked reduction in water usage. 3. The increase in the 2010-11 Target/estimate from the 2009-10 Estimated actual is due to the relaxation of water
restrictions which is expected to increase usage. 4. The increase in the 2009-10 Estimated actual from the 2009-10 Target/estimate is due to rent reviews that have increased
income, while expenses have remained stable for 2009-10. 5. The increase in the 2009-10 Estimated actual from the 2009-10 Target/estimate is principally due to industry response to
the requirement that contractors and consultants be prequalified to be eligible to participate in the Building the Education Revolution (BER) element of the Australian Government’s Nation Building – Economic Stimulus Plan (NB-ESP).
6. The decrease from the 2009-10 Estimated actual to the 2010-11 Target/estimate is due to the expectation that government tender activity and the market generally will begin returning to normal levels prior to the BER, with the 2010-11 targets representing the minimum necessary to provide government with a competitive market for its program.
7. The increase in the 2009-10 Estimated actual from the 2009-10 Target/estimate is principally due to: - additional funding required from the Consolidated Fund as a result of the retention of lower rent revenue from the
relocation of government activities in government owned and leased buildings to support new service delivery objectives across government; and
- funds deferred from 2008-09 to 2009-10 for various projects. 8. These increases are partly offset by the deferral of funds from 2009-10 to 2010-11 for various projects. 9. The increase in the 2009-10 Estimated actual from the 2009-10 Target/estimate is mainly due to carryover of funds from
2008-09 for continuing programs. 10. The decrease from the 2009-10 Target/estimate to 2010-11 Target/estimate is mainly due to the finalisation of various
projects and programs in 2009-10 and lower funding required from the Consolidated Fund as a result of additional rent revenue from new government owned office buildings.
11. The increase from the 2009-10 Target/estimate to 2010-11 Target/estimate is mainly due to additional rent revenue from private sector leases and new government owned office buildings.

2010-11 Queensland State Budget - Service Delivery Statements – Department of Public Works 2-167
12. The decrease in the 2010-11 Target/estimate from the 2009-10 Estimated actual is mainly due to the finalisation of various projects and programs in 2009-10 and lower funding required from the Consolidated Fund as a result of additional rent revenue from private sector leases and new government owned office buildings.
13. The increase in the 2010-11 Target/estimate from the 2009-10 Estimated actual is mainly due to additional rent revenue from private sector leases and new government owned office buildings.
14. The decrease in the 2010-11 Target/estimate from the 2009-10 Estimated actual is mainly due to programmed completion of projects in 2009-10.
15. The reduction in savings/benefits from the 2009-10 Target/estimate to the 2009-10 Estimated actual primarily relates to a rationalisation of products and services and reduced demand/volume of purchases as a result of the amalgamation of government agencies under Machinery of Government changes. In addition, there has been a change in spend patterns across government for certain products. Longer than anticipated implementation timeframes due to the complexity of some new arrangements, including ICT contractors and consultants, non-ICT contractors and consultants and couriers and freight, have also contributed to the variance. In 2010-11, improved market conditions are expected to assist the delivery of savings and benefits.
16. The increase from the 2009-10 Estimated actual to a 2010-11 Target/estimate relates to the finalisation and implementation of new Standing Offer Arrangements, including ICT contractors and consultants, non-ICT contractors and consultants, and print management as well as changes to existing furniture arrangements, which are expected to result in increased savings.
17. The increase in the 2009-10 Estimated actual from the 2009-10 Target/estimate is mainly due to additional funding secured for the Travel Management System.
18. The increase in the 2009-10 Estimated actual from the 2009-10 Target/estimate is mainly due to additional funding secured for the Travel Management System and the Procurement Process Reform Initiative Project.
19. The increase from the 2009-10 Target/estimate to 2010-11 Target/estimate primarily relates to additional rebates from new whole-of-Government standing offer arrangements being implemented as part of the procurement reform agenda.
20. The increase from the 2009-10 Target/estimate to 2010-11 Target/estimate primarily relates to the new whole-of-Government standing offer arrangements being implemented as part of the procurement reform agenda, and funding approved towards the development of a whole-of-Government e-procurement system.
21. The increase in the 2010-11 Target/estimate from the 2009-10 Estimated actual primarily relates to additional rebates from new whole-of-Government standing offer arrangements being implemented as part of the procurement reform agenda.
22. The increase in the 2010-11 Target/estimate from the 2009-10 Estimated actual primarily relates to the new whole-of-Government standing offer arrangements being implemented as part of the procurement reform agenda, and funding approved towards the development of a whole-of-Government e-procurement system, which is partly offset by additional funding secured for the Travel Management System in 2009-10.
23. Targeted products for 2009-10 include the ICT Planning Methodology, IS2 Deliverables, Queensland Government Enterprise Architecture 2.0, Project and Program Management Maturity, and panel arrangements.
24. Satisfaction rating is based on an annual survey conducted with executive members of the ICT Industry Workgroup. 25. The ICT Government Initiative has been superseded by the Queensland Government ICT Strategy – Toward Q2 through
ICT. The measure will be discontinued. 26. The decrease in the 2009-10 Estimated actual from the 2009-10 Target/estimate is mainly due to the transfer of the
Technology Transformation Program to CITEC which is partly offset by funds approved for the whole-of-Government arrangement for the acquisition of core Microsoft products and support.
27. The increase in the 2010-11Target/estimate from the 2009-10 Estimated actual primarily relates to the appropriation funding for the whole-of-Government Information and Communication Technology Investment Fund.
28. The reduction in Internet traffic received websites managed by Smart Service Queensland for the 2009-10 year primarily relates to a trend in the marketplace to use Google to access Queensland Government information and services instead of www.qld.gov.au. The Single Website Experience project is proactively addressing issues around search engine optimisation (Google and Funnelback), content quality and website organisation for the Queensland Government online presence.
29. In addition to the transactions performed by regional offices throughout Queensland comprising the Queensland Government Agent Program (QGAP), the opening of the Queensland Government Service Centre in the Brisbane CBD during October 2009 has increased the Smart Service Queensland overall face-to-face transaction total by an average of 5,000 transactions per month.
30. The 2009-10 Estimated actual is higher than the 2009-10 Target/estimate due to the escalating awareness of concessions schemes and the deteriorating economic environment in 2009-10, resulting in an increased number of people applying for the concessions. This measure is also reported in the 2010-11 Service Delivery Statement for the Department of Communities.
31. The increase from the 2009-10 Target/estimate to 2009-10 Estimated actual primarily relates to additional funding allocated for depreciation and rent supplementation, and carryover of funds for various projects from 2008-09 into 2009-10. This increase is offset by a deferral of funds from 2009-10 to 2010-11 mainly due to transition funding for approved projects for Smart Service Queensland.
32. The increase from the 2009-10 Target/estimate to 2009-10 Estimated actual is mainly due to higher volumes of services provided and contributions by the Department of Communities for the completion of the Redress Project and Seniors Card and Concession program.
33. The increase from the 2009-10 Target/estimate to 2009-10 Estimated actual is explained in Notes 30 and 31. 34. The increase from the 2009-10 Target/estimate to 2010-11 Target/estimate is mainly due to increased funding allocated
for depreciation and ICT infrastructure, and funding approved for various funding proposals in 2010-11. 35. The increase in the 2010-11 Target/estimate from 2009-10 Estimated actual primarily relates to funding approved for
various funding proposals in 2010-11. 36. The decrease in the 2010-11 Target/estimate from the 2009-10 Estimated actual is mainly due to the 2009-10 Estimated
actual including one-off campaigns and disaster support services. 37. The increase in the 2010-11 Target/estimate from the 2009-10 Estimated actual is mainly due to funding approved for
various funding proposals in 2010-11 and an additional allocation for depreciation funding partly offset by finalisation of the Redress Services project which will return to the Department of Communities in 2010-11 and one-off Seniors Card funding received from Department of Communities in 2009-10.
2010-11 Queensland State Budget - Service Delivery Statements – Department of Public Works 2-168
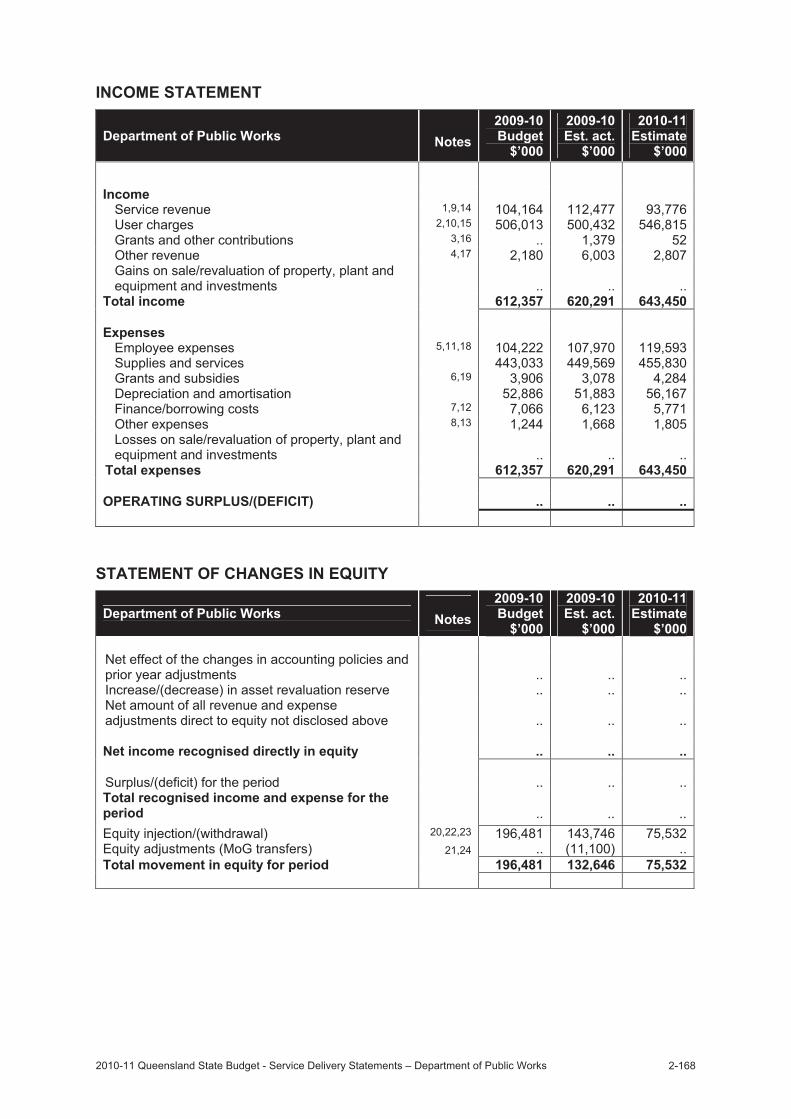
INCOME STATEMENT
Department of Public Works Notes2009-10Budget
$’000
2009-10 Est. act.
$’000
2010-11Estimate
$’000
Income Service revenue 1,9,14 104,164 112,477 93,776User charges 2,10,15 506,013 500,432 546,815Grants and other contributions 3,16 .. 1,379 52Other revenue 4,17 2,180 6,003 2,807Gains on sale/revaluation of property, plant and equipment and investments
..
.. ..Total income 612,357 620,291 643,450 Expenses
Employee expenses 5,11,18 104,222 107,970 119,593Supplies and services 443,033 449,569 455,830Grants and subsidies 6,19 3,906 3,078 4,284Depreciation and amortisation 52,886 51,883 56,167Finance/borrowing costs 7,12 7,066 6,123 5,771Other expenses 8,13 1,244 1,668 1,805Losses on sale/revaluation of property, plant and equipment and investments ..
.. ..
Total expenses 612,357 620,291 643,450 OPERATING SURPLUS/(DEFICIT) .. .. ..
STATEMENT OF CHANGES IN EQUITY
Department of Public Works Notes2009-10Budget
$’000
2009-10 Est. act.
$’000
2010-11Estimate
$’000
Net effect of the changes in accounting policies and prior year adjustments .. .. ..Increase/(decrease) in asset revaluation reserve .. .. ..Net amount of all revenue and expense adjustments direct to equity not disclosed above .. .. .. Net income recognised directly in equity .. .. .. Surplus/(deficit) for the period .. .. ..Total recognised income and expense for the period .. .. ..Equity injection/(withdrawal) 20,22,23 196,481 143,746 75,532Equity adjustments (MoG transfers) 21,24 .. (11,100) ..Total movement in equity for period 196,481 132,646 75,532

2010-11 Queensland State Budget - Service Delivery Statements – Department of Public Works 2-169
BALANCE SHEET
Department of Public Works Notes2009-10Budget
$’000
2009-10 Est. act.
$’000
2010-11Estimate
$’000 CURRENT ASSETS
Cash assets 25,37 11,798 35,702 28,557Receivables 26,38 40,607 46,062 47,072Other financial assets .. .. ..Inventories .. .. ..Other 27,39 20,328 25,130 25,450Non-financial assets held for sale 28,40 19,445 1,000 6,053
Total current assets 92,178 107,894 107,132 NON-CURRENT ASSETS
Receivables 7,668 7,511 7,426Other financial assets .. .. ..Property, plant and equipment 29,41,49 3,417,478 2,919,748 2,971,939Intangibles 30,42 5,971 5,014 4,790Other .. .. ..
Total non-current assets 3,431,117 2,932,273 2,984,155 TOTAL ASSETS 3,523,295 3,040,167 3,091,287 CURRENT LIABILITIES
Payables 39,676 40,260 40,853Accrued employee benefits 31,43 2,081 3,458 3,795Interest-bearing liabilities and derivatives 44,50 24,919 24,807 20,064Provisions .. .. ..Other 32,45 786 1,367 1,617
Total current liabilities 67,462 69,892 66,329 NON-CURRENT LIABILITIES
Payables 3,042 3,042 2,257Accrued employee benefits .. .. ..Interest-bearing liabilities and derivatives 33,46,51 62,114 69,689 49,625Provisions .. .. ..Other 208 177 177
Total non-current liabilities 65,364 72,908 52,059 TOTAL LIABILITIES 132,826 142,800 118,388 NET ASSETS/(LIABILITIES) 3,390,469 2,897,367 2,972,899 EQUITY
Capital/contributed equity 34,52 1,102,037 1,055,523 1,131,055Retained surplus/(accumulated deficit) 35,47 578,115 598,236 598,236Reserves:
- Asset revaluation reserve 36,48 1,710,317 1,243,608 1,243,608- Other (specify) .. .. ..
TOTAL EQUITY 3,390,469 2,897,367 2,972,899

2010-11 Queensland State Budget - Service Delivery Statements – Department of Public Works 2-170
CASH FLOW STATEMENT
Department of Public Works Notes2009-10Budget
$’000
2009-10 Est. act.
$’000
2010-11Estimate
$’000 CASH FLOWS FROM OPERATING ACTIVITIES
Inflows: Service receipts 53,60,67 104,164 120,070 93,776User charges 54,61,68 521,275 507,069 567,320Grants and other contributions .. 1,379 52Other 4,680 8,503 5,307
Outflows: Employee costs 62,69 (104,222) (106,809) (119,013)Supplies and services 55,63 (457,873) (474,487) (476,428)Grants and subsidies (4,400) (3,733) (5,009)Borrowing costs (7,066) (6,123) (5,771)Other (3,750) (4,850) (4,917)
Net cash provided by/(used in) operating activities 52,808 41,019 55,317 CASH FLOWS FROM INVESTING ACTIVITIES
Inflows: Sales of property, plant and equipment 56,70 3,750 30,534 1,050Investments redeemed .. .. ..Loans and advances redeemed 65 65 ..
Outflows: Payments for property, plant and equipment and intangibles
57,64,71 (240,297) (190,322) (114,237)
Payments for investments .. .. ..Loans and advances made .. .. ..
Net cash provided by/(used in) investing activities (236,482) (159,723) (113,187) CASH FLOWS FROM FINANCING ACTIVITIES
Inflows: Borrowings 58,65,72 10,825 25,159 ..Equity injections 59,66,73 196,481 153,695 75,532
Outflows: Borrowing redemptions (26,041) (24,917) (24,807)Finance lease payments .. .. ..Equity withdrawals .. .. ..
Net cash provided by/(used in) financing activities 181,265 153,937 50,725
Net increase/(decrease) in cash held (2,409) 35,233 (7,145) Cash at the beginning of financial year 14,207 469 35,702 Cash transfers from restructure .. .. ..Cash at the end of financial year 11,798 35,702 28,557

2010-11 Queensland State Budget - Service Delivery Statements – Department of Public Works 2-171
ADMINISTERED INCOME STATEMENT
Department of Public Works Notes2009-10Budget
$’000
2009-10 Est. act.
$’000
2010-11Estimate
$’000 Revenues
Commonwealth grants .. .. ..Taxes, fees and fines .. .. ..Royalties, property income and other territorial Revenue .. .. ..Interest .. .. ..Administered revenue 74, 78, 82 67,815 70,983 42,953Other 79,83 10,928 10,928 5,928
Total revenues 78,743 81,911 48,881 Expenses
Supplies and services 75 17,932 28,883 27,591Depreciation and amortisation .. .. ..Grants and subsidies 76, 80, 84 50,811 39,608 16,290Benefit payments .. .. ..Borrowing costs .. .. ..Other .. .. ..
Total expenses 68,743 68,491 43,881 Net surplus or deficit before transfers to Government 77,81,85 10,000 13,420 5,000 Transfers of administered revenue to Government 10,000
13,420 5,000
OPERATING SURPLUS/(DEFICIT) .. .. ..

2010-11 Queensland State Budget - Service Delivery Statements – Department of Public Works 2-172
ADMINISTERED BALANCE SHEET
Department of Public Works Notes2009-10Budget
$’000
2009-10 Est. act.
$’000
2010-11Estimate
$’000 CURRENT ASSETS
Cash assets .. .. ..Receivables .. .. ..Inventories .. .. ..Other .. .. ..Non-financial assets held for sale .. .. ..
Total current assets .. .. .. NON-CURRENT ASSETS
Receivables .. .. ..Other financial assets .. .. ..Property, plant and equipment .. .. ..Intangibles .. .. ..Other .. .. ..
Total non-current assets .. .. .. TOTAL ADMINISTERED ASSETS .. .. .. CURRENT LIABILITIES
Payables .. .. ..Transfers to Government payable .. .. ..Interest-bearing liabilities .. .. ..Other .. .. ..
Total current liabilities .. .. .. NON-CURRENT LIABILITIES
Payables .. .. ..Interest-bearing liabilities .. .. ..Other .. .. ..
Total non-current liabilities .. .. .. TOTAL ADMINISTERED LIABILITIES .. .. .. ADMINISTERED NET ASSETS/(LIABILITIES) .. .. .. EQUITY
Capital/Contributed equity 33,095 33,095 33,095Retained surplus/(Accumulated deficit) (33,095) (33,095) (33,095)Reserves:
- Asset revaluation reserve .. .. ..- Other (specify) .. .. ..
TOTAL ADMINISTERED EQUITY .. .. ..

2010-11 Queensland State Budget - Service Delivery Statements – Department of Public Works 2-173
ADMINISTERED CASH FLOW STATEMENT
Department of Public Works Notes2009-10 Budget
$’000
2009-10 Est. act.
$’000
2010-11Estimate
$’000 CASH FLOWS FROM OPERATING ACTIVITIES
Inflows: Administered item receipts 86,93,99 67,815 71,739 42,953Grants and other contributions 87,100 .. 32,492 ..Taxes, fees and fines .. .. ..Royalties, property income and other territorial revenues .. .. ..Other 94,101 10,928 11,196 5,928
Outflows: Transfers to Government 88,95,102 (10,000) (49,236) (5,000)Grants and subsidies 89,96,103 (50,811) (39,608) (16,290)Supplies and services 90,104 (17,932) (35,743) (27,591)Borrowing costs .. .. ..Other .. .. ..
Net cash provided by/(used in) operating activities .. (9,160) ..
CASH FLOWS FROM INVESTING ACTIVITIES
Inflows: Sales of property, plant and equipment .. .. ..Investments redeemed .. .. ..Loans and advances redeemed .. .. ..
Outflows: Payments for property, plant and equipment and intangibles .. .. ..Payments for investments .. .. ..Loans and advances made .. .. ..
Net cash provided by/(used in) investing activities .. .. ..
CASH FLOWS FROM FINANCING ACTIVITIES
Inflows: Borrowings .. .. ..Equity injections 91,97,105 13,126 40,422 34,553
Outflows: Borrowing redemptions .. .. ..Finance lease payments .. .. ..Equity withdrawals 92,98,106 (13,126) (39,305) (34,553)
Net cash provided by/(used in) financing activities .. 1,117 ..
Net increase/(decrease) in cash held .. (8,043) ..
Administered cash at beginning of financial year .. 8,043 ..
Cash transfers from restructure .. .. ..
Administered cash at end of financial year .. .. ..

2010-11 Queensland State Budget - Service Delivery Statements – Department of Public Works 2-174
EXPLANATION OF VARIANCES IN THE FINANCIAL STATEMENTS
Income statement Major variations between 2009-10 Budget and 2009-10 Estimated actual include: 1. The increase is mainly due to:
- carryover of funding from 2008-09 for various programs; - additional funding for the whole-of-Government arrangement for the acquisition of core Microsoft products and support; - additional funding required from the Consolidated Fund as a result of the retention of lower rent revenue from the
relocation of government activities in government owned and leased buildings to support new service delivery objectives across government; and
- funds approved for various projects and initiatives during the 2009-10 financial year. This increase is partly offset by the transfer of funds for the Technology Transformation Program (TTP) to CITEC and the deferral of funds for various projects from 2009-10 to 2010-11.
2. The decrease is primarily due to relocation of government activities in government owned and leased buildings to support new service delivery objectives across government.
3. One-off funding provided for the finalisation of the Redress Services project which will return to the Department of Communities in 2010-11 and one-off Seniors Card funding.
4. The increase is principally due to: - the recoveries of building related services including tenant make good and mail screen and delivery recovery; and - once off recovery from Project Services for the SAP implementation project.
5. The increase is mainly due to temporary positions for project work within Information Services Directorate (ISD) and newly created positions.
6. The decrease is mainly due to the deferral of various grants including Royal Society for the Prevention of Cruelty to Animals (RSPCA) relocation and funding to Queensland Government Agent Program offices. This is partly offset by a grant for the security audits in Indigenous communities to various departments and transfer of funding to Queensland University of Technology for the Old Government House refurbishment.
7. The decrease is mainly due to a lower than expected loan balance as a result of the deferral of new loans. 8. The increase mainly relates to revised Queensland Audit Office (QAO) audit fees estimate for 2009-10 and an increase in
the land tax bill for two private sector leases. Major variations between 2009-10 Budget and 2010-11 Estimate include: 9. The decrease is mainly due to:
- the finalisation of various projects and programs in 2009-10; and - lower funding required from the Consolidated Fund mainly as a result of additional rent revenue from new government
owned office buildings. This is partly offset by additional funding for the whole-of-Government arrangement for the acquisition of core Microsoft products and support, funds approved for various projects and initiatives in 2010-11 and deferral of funds into 2010-11.
10. The increase is primarily due to: - additional rent revenue from private sector leases and new government owned office buildings; - recovery of additional third party costs from clients, together with the transfer of functions to ISD from Shared Service
Agency (SSA) and additional IT resource requirements for QBuild; and - additional supplier rebates from the whole-of-government rebate arrangements.
11. The increase is mainly due to: - transfer of functions to ISD from SSA and additional IT resource requirements for QBuild; - additional staff for the restructure of Queensland Government Chief Procurement Office (QGCPO); - additional staff for the growth in Smart Service Queensland contact centres; and - an enterprise bargaining pay increase of 4% effective from 1 August 2010.
12. The decrease is mainly due to a lower interest expense as a result of a decreased loan liability. 13. The increase mainly relates to revised QAO audit fees estimate for 2010-11 as a result of increased audit activity from
cross sector audits and an increase in land tax for two private sector leases. Major variations between 2009-10 Estimated actual and the 2010-11 Estimate include: 14. The decrease is mainly due to:
- the finalisation of various projects and programs in 2009-10; and - lower funding required from the Consolidated Fund mainly as a result of additional rent revenue from private sector
leases and new government owned office buildings. This decrease is partly offset by the deferral of funds into 2010-11 and funds approved for various projects and initiatives in 2010-11.
15. The increase is primarily due to: - additional rent revenue from private sector leases and new government owned office buildings; - transfer of functions to ISD from SSA and additional IT resource requirements for QBuild; and - additional supplier rebates from the whole-of-Government rebate arrangements.
16. The 2009-10 Estimated actual relates to a one-off funding provided for the finalisation of the Redress Services project which will return to the Department of Communities in 2010-11 and one-off Seniors Card funding. The 2010-11 Estimate is a contribution from Arts Queensland for artwork to be purchased for the Kangaroo Point Parklands.
17. The decrease is mainly due to: - a once off contribution relating to the SAP implementation from Project Services in 2009-10; and - Tenant Make Good income received in 2009-10 but not budgeted in 2010-11 due to the unpredictability of this activity.
18. The increase is mainly due to: - transfer of functions to ISD from SSA and additional IT resource requirements for QBuild; - additional staff for the restructure of the QGCPO; - additional staff for the growth in Smart Service Queensland contact centres; and - an enterprise bargaining pay increase of 4% effective from 1 August 2010.

2010-11 Queensland State Budget - Service Delivery Statements – Department of Public Works 2-175
19. The increase is mainly due to the deferral of the RSPCA grant and the Queensland Government Agent Program subsidy to 2010-11. This is offset by grant payments in 2009-10 for the security audit in Indigenous communities to various departments and transfer of funding to Queensland University of Technology for the Old Government House refurbishment.
Statement of changes in equity Major variations between 2009-10 Budget and 2009-10 Estimated actual include: 20. The decrease is mainly due to the deferral of funds for the Maroochydore and Thursday Island government office
buildings, and the Boggo Road Brisbane redevelopment. 21. The decrease is due to the transfer of land at Kangaroo Point Brisbane to the Department of Environment and Resource
Management, and a once off transfer of fitout costs to the government tenants occupying premises at 53 Albert Street Brisbane for nil consideration.
Major variations between 2009-10 Budget and 2010-11 Estimate include: 22. The decrease is mainly due to projects nearing completion in 2010-11 including Cairns, Maroochydore and Thursday
Island government office buildings, the Joint Contact Centre at Zillmere Brisbane, the Boggo Road Brisbane redevelopment, and the completion of the 63 George Street Brisbane Refurbishment in 2009-10.
Major variations between 2009-10 Estimated actual and the 2010-11 Estimate include: 23. The decrease is mainly due to projects near completion in 2010-11 including Cairns government office building, Joint
Contact Centre at Zillmere Brisbane, the Boggo Road Brisbane redevelopment and the completion of the 63 George Street Brisbane refurbishment in 2009-10.
24. The increase is due to the transfer of land at Kangaroo Point Brisbane to the Department of Environment and Resource Management and a once off transfer of the fitout costs to various agencies occupying premises at 53 Albert Street Brisbane both occurring in 2009-10.
Balance sheet Major variations between 2009-10 Budget and 2009-10 Estimated actual include: 25. The increase is mainly due to additional asset sales including proceeds from the sale of the Yungaba site, Kangaroo Point
Brisbane. 26. The increase primarily relates to the receivable raised for the construction of a new multicultural centre. 27. The increase is principally due to higher prepayments as a result of an increase in building outgoings. 28. The decrease is mainly due to the sale of the Yungaba site, Kangaroo Point Brisbane and the re-classification of
properties back into the property plant and equipment category. 29. The decrease is primarily due to:
- devaluation of land and buildings as at the end of June 2009; and - deferral of funding for various capital projects into 2010-11 including Maroochydore and Thursday Island government
office buildings and the Boggo Road Brisbane redevelopment. 30. The decrease is mainly due to the transfer of GovNet capital funding to CITEC and carryover of former Queensland
Government Chief Information Office (QGCIO) capital funding into 2010-11. This is partly offset by a carryover adjustment from 2008-09.
31. The increase is due to the rollover of opening balance adjustments from the finalisation of accounts in the 2008-09 financial year.
32. The increase is due to the rollover of opening balance adjustments from the finalisation of accounts in the 2008-09 financial year.
33. The increase is due to the deferral of the drawdown of loans from 2008-09 for loans relating to the improvement of energy efficiency in government buildings and loans drawndown for various properties constructed in previous years.
34. The decrease is mainly due to the deferral of funds for the Maroochydore and Thursday Island government office buildings, and the Boggo Road Brisbane redevelopment.
35. The increase is primarily due to the opening balance adjustment for the profit attained in 2008-09 for the take up of land at Albert Park for a non-cash consideration from the Brisbane City Council.
36. The decrease is due to the devaluation of land and buildings at the end of June 2009. Major variations between 2009-10 Budget and 2010-11 Estimate include: 37. The increase is mainly due to cash received from asset sales. 38. The increase primarily relates to the receivable raised for the construction of a new multicultural centre. 39. The increase is principally due to higher prepayments as a result of an increase in building outgoings. 40. The decrease is mainly due to the sale of the Yungaba site, Kangaroo Point Brisbane and the re-classification of
properties back into the property plant and equipment category. This decrease is partly offset by additional assets held for sale in 2010-11.
41. The decrease is primarily due to the devaluation of land and buildings at the end of June 2009. 42. The decrease is mainly due to the transfer of GovNet capital funding to CITEC. 43. The increase is due to the rollover of opening balance adjustments from the finalisation of accounts in the 2008-09
financial year. 44. The decrease is mainly due to the loan repayments. 45. The increase is due to the rollover of opening balance adjustments from the finalisation of accounts in the 2008-09
financial year. 46. The decrease is due to the overall reduction on the outstanding loans. 47. The increase is primarily due to the opening balance adjustment for the profit attained in 2008-09 for the take up of land at
Albert Park for a non-cash consideration from the Brisbane City Council. 48. The decrease is due to the devaluation of land and buildings at the end of June 2009. Major variations between 2009-10 Estimated actual and the 2010-11 Estimate include: 49. The increase is mainly due to the deferral of capital acquisitions from 2009-10 to 2010-11. 50. The decrease is mainly due to the loan repayments.

2010-11 Queensland State Budget - Service Delivery Statements – Department of Public Works 2-176
51. The decrease is due to the overall reduction on the outstanding loans. 52. The increase is mainly due to the continued construction of Maroochydore, Cairns and Thursday Island government office
buildings and the Boggo Road Brisbane redevelopment.
Cash flow statement Major variations between 2009-10 Budget and 2009-10 Estimated actual include: 53. The increase is mainly due to:
- the receipt of funds relating to invoices accrued as at 30 June 2009; - carryover of funding from 2008-09 for various programs; - additional funding for the whole-of-Government arrangement for the acquisition of core Microsoft products and support; - additional funding required from the Consolidated Fund as a result of the retention of lower rent revenue from the
relocation of government activities in government owned and leased buildings to support new service delivery objectives across government; and
- funds approved for various projects and initiatives during the 2009-10 financial year. This increase is partly offset by the transfer of funds for the TTP to CITEC and the deferral of funds for various projects from 2009-10 to 2010-11.
54. The decrease is primarily due to relocation of government activities in government owned and leased buildings to support new service delivery objectives across government.
55. The increase is mainly due to the: - payment of invoices accrued as at 30 June 2009; and - carryover of funds from 2008-09 for continuing programs.
56. The increase is mainly due to the additional asset sales for Yungaba site, Kangaroo Point Brisbane, 131 Colchester St, South Brisbane and 36 Shields St, Cairns.
57. The decrease is mainly due to the deferral of funding for various projects into 2010-11 including Maroochydore and Thursday Island government office buildings and the Boggo Road Brisbane redevelopment.
58. The increase is principally due to the deferral of the drawdown of loans from 2008-09 for loans relating to the improvement of energy efficiency in government buildings and loans drawndown for various properties constructed in previous years.
59. The decrease is mainly due to the deferral of funding for various projects into 2010-11 including Maroochydore and Thursday Island government office buildings and the Boggo Road Brisbane redevelopment. These decreases are partly offset by the receipt of appropriation from the Consolidated Fund relating to invoices accrued as at 30 June 2009.
Major variations between 2009-10 Budget and the 2010-11 Estimate include: 60. The decrease is mainly due to:
- the finalisation of various projects and programs in 2009-10; and - lower funding required from the Consolidated Fund mainly as a result of additional rent revenue from new government
owned office buildings. This is partly offset by additional funding for the whole-of-Government arrangement for the acquisition of core Microsoft products and support, funds approved for various projects and initiatives in 2010-11 and deferral of funds into 2010-11.
61. The increase is primarily due to: - additional rent revenue from private sector leases and new government owned office buildings; - recovery of additional third party costs from clients, together with the transfer of functions to ISD from SSA and
additional IT resource requirements for QBuild; and - additional supplier rebates from the whole-of-Government rebate arrangements.
62. The increase is mainly due to: - transfer of functions to ISD from SSA and additional IT resource requirements for QBuild; - additional staff for the restructure of Queensland Government Chief Procurement Office; - additional staff for the growth in Smart Service Queensland contact centres; and - an enterprise bargaining pay increase of 4% effective from 1 August 2010.
63. The increase is mainly due to funds approved for various projects and initiatives in 2010-11. 64. The decrease is mainly due to projects nearing completion in 2010-11 including Cairns, Maroochydore and Thursday
Island government office buildings, the Joint Contact Centre at Zillmere Brisbane, the Boggo Road Brisbane redevelopment, and the completion of 63 George Street Brisbane Refurbishment in 2009-10.
65. There were no drawdowns in 2010-11 as there is no expected capital expenditure in 2010-11 funded by borrowings. 66. The decrease is mainly due to projects nearing completion in 2010-11 including Cairns, Maroochydore and Thursday
Island government office buildings, the Joint Contact Centre at Zillmere Brisbane, the Boggo Road Brisbane redevelopment, and the completion of 63 George Street Brisbane refurbishment in 2009-10.
Major variations between 2009-10 Estimated actual and the 2010-11 Estimate include: 67. The decrease is mainly due to:
- the finalisation of various projects and programs in 2009-10; and - lower funding required from the Consolidated Fund mainly as a result of additional rent revenue from private sector
leases and new government owned office buildings. This decrease is partly offset by the deferral of funds into 2010-11 and funds approved for various projects and initiatives in 2010-11.
68. The increase is primarily due to: - additional rent revenue from private sector leases and new government owned office buildings; - recovery of additional third party costs from clients, together with the transfer of functions to ISD from SSA and
additional IT resource requirements for QBuild; and - additional supplier rebates from the whole-of-Government rebate arrangements.
69. The increase is mainly due to: - transfer of functions to ISD from SSA and additional IT resource requirements for QBuild; - additional staff for the restructure of Queensland Government Chief Procurement Office; - additional staff for the growth in Smart Service Queensland contact centres; and - an enterprise bargaining pay increase of 4% effective from 1 August 2010.The decrease is mainly due to the 2009-10
Estimated actual includes the sale of the Yungaba site Kangaroo Point Brisbane, 131 Colchester St, South Brisbane and 36 Shields St, Cairns and a lower number of government employee housing disposals in 2010-11.

2010-11 Queensland State Budget - Service Delivery Statements – Department of Public Works 2-177
70. The decrease is mainly due to projects near completion in 2010-11 including Cairns government office building, Joint Contact Centre at Zillmere Brisbane, the Boggo Road Brisbane redevelopment and the completion of 63 George Street Brisbane refurbishment in 2009-10.
71. There were no drawdowns in 2010-11 as there is no expected capital expenditure in 2010-11 funded by borrowings. 72. The decrease is mainly due to projects near completion in 2010-11 including Cairns government office building, Joint
Contact Centre at Zillmere Brisbane, the Boggo Road Brisbane redevelopment and the completion of 63 George Street Brisbane refurbishment in 2009-10.
Administered income statement Major variations between 2009-10 Budget and 2009-10 Estimated actual include: 73. The increase is mainly due to:
- carryover of funds from 2008-09 for CorpTech; - funding for the TTP transferred to CITEC; - funding for Natural Disaster Relief Assistance (NDRA) claims for various storms throughout Queensland; and - rent supplementation for the business units and shared service providers. These increases are offset by the receipt from CorpTech for grant funds which were returned to the Consolidated Fund and deferral of CorpTech funding to 2011-12 for the Corporate Solutions Program (CSP).
74. The increase is mainly due to: - funding for the TTP transferred to CITEC; - funding for NDRA claims for various storms throughout Queensland; and - rent supplementation for the business units and shared service providers.
75. The decrease is mainly due to the deferral of grant funding to 2011-12 relating to CorpTech for the CSP. These decreases are partly offset by carryover of funds from 2008-09 for CorpTech.
76. The increase relates to the payment of funds for SSA grant funding to the Consolidated Fund. Major variations between 2009-10 Budget and 2010-11 Estimate include: 77. The decrease is mainly due to:
- lower CorpTech grant funding in 2010-11; and - deferral of funding from 2009-10 to 2010-11 for Information and Communication Technology Consolidation
(ICTC - previously called TTP). These decreases are offset by rent supplementation funding for the business units and shared service providers.
78. The decrease is due to the timing of receipts relating to the whole-of-Government telecommunication and ICT arrangements.
79. The decrease is principally due to lower CorpTech grant funding in 2010-11. 80. The decrease is due to the timing of receipts relating to the whole-of-Government telecommunication and ICT
arrangements. Major variations between 2009-10 Estimated actual and the 2010-11 Estimate include: 81. The decrease is mainly due to lower CorpTech grant funding. 82. The decrease is due to the timing of receipts relating to the whole-of-Government telecommunication and ICT
arrangements. 83. The decrease is mainly due to lower CorpTech grant funding. 84. The decrease is due to timing of payments to the Consolidated Fund relating to the whole-of-Government
telecommunication and ICT arrangements and no payment for SSA grant funding in 2010-11.
Administered cash flow statement Major variations between 2009-10 Budget and 2009-10 Estimated actual include: 85. The increase is mainly due to:
- carryover of funds from 2008-09 for CorpTech; - funding for the TTP transferred to CITEC; - funding for NDRA claims for various storms throughout Queensland; and - rent supplementation for the business units and shared service providers. These increases are offset by the remittance of CorpTech grant funds to the Consolidated Fund and deferral of CorpTech funding to 2011-12 for the CSP.
86. The increase relates to carryover funding from 2008-09 for grants received from CorpTech which was paid to the Consolidated Fund.
87. The increase primarily relates to the payment of funds for CorpTech grants to the Consolidated Fund. 88. The decrease is mainly due to the deferral of grant funding to 2011-12 relating to CorpTech for the CSP. These decreases
are partly offset by carryover of funds from 2008-09 for CorpTech. 89. The increase is mainly due to:
- funding for the TTP transferred to CITEC; - funding for NDRA claims for various storms throughout Queensland; and - rent supplementation for the business units and shared service providers.
90. The increase mainly relates to equity funding received from the Consolidated Fund to support CITEC’s operations in transitioning to a whole-of-Government services provider and for CorpTech as a result of the equity to output swap no longer required.
91. The increase mainly relates to equity funding repaid to CorpTech as a result of the equity to output swap no longer required.

2010-11 Queensland State Budget - Service Delivery Statements – Department of Public Works 2-178
Major variations between 2009-10 Budget and 2010-11 Estimate include: 92. The decrease is mainly due to:
- lower CorpTech grant funding in 2010-11; and - deferral of funding from 2009-10 to 2010-11 for ICTC; These decreases are offset by rent supplementation funding for the business units and shared service providers.
93. The decrease is due to the timing of receipts relating to the whole-of-Government telecommunication and ICT arrangements.
94. The decrease is due to the timing of receipts relating to the whole-of-Government telecommunication and ICT arrangements.
95. The decrease is principally due to lower CorpTech grant funding in 2010-11. 96. The increase mainly relates to a receipt from CorpTech for the re-commencement of a depreciation funding withdrawal
which is to be returned to the Consolidated Fund. 97. The increase mainly relates to a payment to the Consolidated Fund for the re-commencement of a depreciation funding
withdrawal for CorpTech. Major variations between 2009-10 Estimated actual and the 2010-11 Estimate include: 98. The decrease is mainly due to lower CorpTech grant funding. 99. The 2009-10 amount relates to the carryover funding from 2008-09 received from CorpTech for grants which was paid to
the Consolidated Fund in 2009-10. 100. The decrease mainly relates to the timing of receipts relating to the whole-of-Government telecommunications and ICT
arrangements. 101. The decrease primarily relates to a one-off payment of funds to the Consolidated Fund in relation to CorpTech grant
funding in 2009-10 and the timing of payments for the whole-of-government telecommunications and ICT arrangements. 102. The decrease is mainly due to lower CorpTech grant funding. 103. The decrease is mainly due to a 2008-09 administered payable paid in 2009-10 primarily relating to CorpTech and SSA. 104. The equity injection for 2009-10 Estimated actual is provided mainly to support CITEC’s operations in transitioning to a
whole-of-Government services provider and for an equity to output swap for CorpTech which did not proceed. The 2010-11 Estimate mainly relates to a receipt from CorpTech for depreciation funding to be returned to the Consolidated Fund and debt service payments received from the Consolidated Fund to be paid to CITEC associated with ICTC projects, as well as carryover of funding for GovNet.
105. The equity withdrawal for 2009-10 Estimated actual mainly relates to an equity injection to CITEC to support the business unit’s operations in transitioning to a whole-of-Government services provider and an equity to output swap for CorpTech which did not proceed. The 2010-11 Estimate mainly relates to payments to the Consolidated Fund for depreciation funding from CorpTech and debt service payments paid to CITEC associated with ICTC projects, as well as carryover of funding for GovNet.

2010-11 Queensland State Budget - Service Delivery Statements – QBuild 2-179
Commercialised Business Units QBuild
OVERVIEW
QBuild is responsible for delivering building maintenance and construction services to government agencies. It also provides a response to protect and maintain government infrastructure assets in the event of natural disasters and major incidents and provides other services in the areas of building security, cleaning, horticulture, and the management of Brisbane’s Roma Street Parkland. QBuild employs approximately 390 apprentices and trainees at any one time with an annual intake of 100 State-wide. A Community Service Obligation of $8.7 million is allocated in support of this initiative. Key factors and challenges impacting on QBuild include: � upskilling QBuild and industry contract staff on safe work methods for handling or
working with asbestos products � developing workforce capacity and an effective supply chain in the far north of
Queensland to deliver client expectations in Indigenous communities � maximising investment in the new enterprise system Ellipse to achieve business
efficiencies while providing timely and accurate reporting.
REVIEW OF PERFORMANCE
Recent achievements QBuild’s recent achievements include: � delivering security works for employee housing to the value of $1.7 million in Indigenous
communities � delivering $459 million of client maintenance programs including:
- the Government agency annual maintenance programs; - the Housing Improvement Program in Indigenous communities for the Department of
Communities; - the maintenance and upgrade component of the Nation Building – Economic Stimulus
Plan; and - the State Schools of Tomorrow Program for the Department of Education and
Training� � delivering a number of projects including the:
- Inala Urban Renewal program; - Southport Fire Station Refurbishment for the Department of Community Safety; - Boonah ‘the Outlook’ New Accommodation Block for the Department of
Communities; - rectification works to the Administration Block at Mount Gravatt High School for the
Department of Education and Training following major fire damage; - Byfield State Forest Ranger’s office building for the Department of Environment and
Resource Management; - reconstruction of a 13-metre high timber windmill at the Southern Queensland
Institute of TAFE in Toowoomba for the Q150 celebrations; - multi-unit upgrades for the Department of Communities – Housing and Homelessness
in Caloundra, Maroochydore and Buderim; and

2010-11 Queensland State Budget - Service Delivery Statements – QBuild 2-180
- Turner Street, Scarborough construction of eight two-bedroom units with all ground floor accommodation adaptable to suit people with a disability.
� assisting with the clean-up, re-building and recovery activities of flood damaged regions throughout Queensland
� introducing a comprehensive new enterprise system Ellipse, which enables QBuild to streamline business processes and enhance service delivery
� supporting the Government’s Toward Q2: Tomorrow’s Queensland – delivering world-class education and training under the ‘Smart’ initiative by continuing to employ 100 new apprentices each year. Currently, 390 apprentices and trainees are employed including 61 Indigenous apprentices/trainees and 18 female apprentices and trainees. Since October 1998, a total of 1,339 apprentices and trainees have been employed by QBuild in the apprentice program
� focusing on improved technical capability to support QBuild’s delivery of government environmental and safety initiatives
� managing Roma Street Parkland, which attracts approximately 650,000 visitors a year.
Future developments In the future, QBuild will: � continue to deliver Government agency annual maintenance programs � continue to improve delivery of services to the Department of Education and Training,
and to the Department of Communities’ housing programs � work collaboratively with other agencies to meet clients and Indigenous community
expectations in the delivery of the remote Indigenous housing and homelessness upgrade program
� undertake maintenance works to all government-owned employee housing across the State
� continue to improve technical capabilities to support QBuild’s delivery of Government environmental and safety initiatives with a particular focus on asbestos awareness, management and training for contractors
� continue to develop and implement a safety culture within QBuild and the Queensland Building Industry. Accreditation through the Australian Quality Training Framework is being sought for the recently developed structured training program, which focuses on demonstrating safe methods for working with or removing asbestos containing material
� develop workforce capability and an effective supply chain to ensure timely delivery of programs within regional and remote centres particularly in the far north of Queensland
� continue to streamline QBuild’s supply chain management within the Ellipse business system to realise business efficiencies.

2010-11 Queensland State Budget - Service Delivery Statements – QBuild 2-181
STATEMENTS
PERFORMANCE STATEMENT Service standards
Notes2009-10
Target/est.2009-10
Est. actual 2010-11
Target/est.
Financial performance measures Gross Profit as a % of Sales Current ratio Net Profit as a % of Sales Non-financial performance measures Certification of Quality Assurance and Environmental Systems Project Competency – Workplace Health and Safety Certification under AS48001 Workplace Health and Safety – Working days lost Percentage of apprentices indentured outside the metropolitan region Percentage of apprentices successfully complete training Percentage of female participation in annual apprentice program
1
2,3
4
5
11.19%
1.32:1
0.71%
Certification maintained
Certification maintained
1,459
� 65%
� 80%
� 8%
12.70%
1.30:1
0.58%
Certification maintained
Certification maintained
1,458
72%
80%
8%
11.69%
1.31:1
0.59%
Certification maintained
Certification maintained
1,459
� 65%
80%
� 8%
Notes: 1. The increase in the 2009-10 Estimated actual from the 2009-10 Target/estimate is mainly due to the effect of cost
reclassifications and anticipated efficiencies in service delivery. 2. The decrease in 2009-10 Estimated actual from the 2009-10 Target/estimate is due to increases in some supplies and
services costs. 3. The increase in the 2010-11 Target/estimate from the 2009-10 Estimated actual is due to the higher volume of anticipated
work. 4. Percentage of apprentices indentured outside the metropolitan region is given as part of the 2010 apprentice intake and
includes 27% Indigenous apprentices from a 15% target, due to an anticipated increase in construction projects in regional centres. Placements where English is a second language was 9% from a 2% target.
5. Percentage of apprentices successfully completing training given as part of the 2006 apprentice intake.

2010-11 Queensland State Budget - Service Delivery Statements – QBuild 2-182
INCOME STATEMENT
QBuild Notes2009-10Budget
$’000
2009-10 Est. act.
$’000
2010-11Estimate
$’000 Income
User charges 1,5 731,279 798,333 833,738Grants and other contributions 8,793 8,886 8,945Other revenue 975 1,432 1,061Gains on sale/revaluation of property, plant and equipment and investments
..
5 13Total income 741,047 808,656 843,757 Expenses
Employee expenses 6,9 201,300 207,765 233,389Supplies and services 2,7 528,196 590,755 599,652Grants and subsidies .. .. ..Depreciation and amortisation 3,8,10 4,707 2,340 3,463Finance/borrowing costs 333 1,623 768Other expenses 1,347 1,582 1,538Losses on sale/revaluation of property, plant and equipment and investments
..
.. ..Total expenses 735,883 804,065 838,810 Surplus or deficit before related income tax 5,164 4,591 4,947 Income tax expense/revenue 4 1,552 1,166 1,235OPERATING SURPLUS/(DEFICIT) after related income tax 3,612 3,425 3,712
STATEMENT OF CHANGES IN EQUITY
QBuild Notes2009-10Budget
$’000
2009-10 Est. act.
$’000
2010-11Estimate
$’000
Net effect of the changes in accounting policies and prior year adjustments .. .. ..Increase/(decrease) in asset revaluation reserve .. .. ..Net amount of all revenue and expense adjustments direct to equity not disclosed above .. .. .. Net income recognised directly in equity .. .. .. Surplus/(deficit) for the period 3,612 3,425 3,712Total recognised income and expense for the period 3,612 3,425 3,712Equity injection/(withdrawal) Equity adjustments (MoG transfers) Dividends paid or provided (1,806) (1,712) (1,856)Total movement in equity for period 1,806 1,713 1,856

2010-11 Queensland State Budget - Service Delivery Statements – QBuild 2-183
BALANCE SHEET
QBuild Notes2009-10Budget
$’000
2009-10 Est. act.
$’000
2010-11Estimate
$’000 CURRENT ASSETS
Cash assets 11,19 31,649 54,170 52,862Receivables 114,661 111,781 116,682Other financial assets .. .. ..Inventories 12,20 18,341 24,503 25,259Other 21 1,051 2,822 2,444Non-financial assets held for sale .. .. ..
Total current assets 165,702 193,276 197,247 NON-CURRENT ASSETS
Receivables .. .. ..Other financial assets .. .. ..Property, plant and equipment 13 4,318 3,014 4,016Deferred tax assets 14,25 7,210 4,232 4,914Intangibles 26 24,024 25,309 22,627Other .. .. ..
Total non-current assets 35,552 32,555 31,557 TOTAL ASSETS 201,254 225,831 228,804 CURRENT LIABILITIES
Payables 22 74,900 86,207 85,180Interest-bearing liabilities and derivatives 2,234 2,750 2,925Current tax liabilities 15 1,995 .. ..Accrued employee benefits 16 3,279 4,643 5,154Provisions .. .. ..Other 17,23 43,165 54,774 57,198
Total current liabilities 125,573 148,374 150,457 NON-CURRENT LIABILITIES
Payables .. .. ..Interest-bearing liabilities and derivatives 27 4,721 4,241 1,358Deferred tax liabilities 18,24,28 76 1,765 3,682Accrued employee benefits .. .. ..Provisions .. .. ..Other 38 .. ..
Total non-current liabilities 4,835 6,006 5,040 TOTAL LIABILITIES 130,408 154,380 155,497 NET ASSETS/(LIABILITIES) 70,846 71,451 73,307 EQUITY
Capital/contributed equity 20,900 20,900 20,900Retained surplus/(accumulated deficit) 49,946 50,551 52,407Reserves:
- Asset revaluation reserve .. .. ..- Other (specify) .. .. ..
TOTAL EQUITY 70,846 71,451 73,307

2010-11 Queensland State Budget - Service Delivery Statements – QBuild 2-184
CASH FLOW STATEMENT
QBuild Notes2009-10Budget
$’000
2009-10 Est. act.
$’000
2010-11Estimate
$’000 CASH FLOWS FROM OPERATING ACTIVITIES
Inflows: User charges 29,34 773,371 843,523 878,064Grants and other contributions 8,793 8,886 8,945Other 30,35 56,094 62,333 60,826
Outflows: Employee costs 31,36 (200,879) (211,855) (232,879)Supplies and services 32,37 (585,310) (652,283) (661,242)Grants and subsidies .. .. ..Borrowing costs 33 (333) (1,623) (768)Taxation equivalents paid .. .. ..Other 38 (42,683) (46,205) (48,063)
Net cash provided by/(used in) operating activities 9,053 2,776 4,883 CASH FLOWS FROM INVESTING ACTIVITIES
Inflows: Sales of property, plant and equipment .. 5 13Investments redeemed .. .. ..Loans and advances redeemed .. .. ..
Outflows: Payments for property, plant and equipment and intangibles
39,40 (9,345) (9,237) (1,783)
Payments for investments .. .. ..Loans and advances made .. .. ..
Net cash provided by/(used in) investing activities (9,345) (9,232) (1,770) CASH FLOWS FROM FINANCING ACTIVITIES
Inflows: Borrowings .. .. ..Equity injections .. .. ..
Outflows: Dividends paid (2,758) (3,457) (1,712)Borrowing redemptions (2,455) (2,548) (2,709)Finance lease payments .. .. ..Equity withdrawals` .. .. ..
Net cash provided by/(used in) financing activities (5,213) (6,005) (4,421)
Net increase/(decrease) in cash held (5,505) (12,461) (1,308) Cash at the beginning of financial year 37,154 66,631 54,170 Cash transfers from restructure .. .. ..Cash at the end of financial year 31,649 54,170 52,862

2010-11 Queensland State Budget - Service Delivery Statements – QBuild 2-185
EXPLANATION OF VARIANCES IN THE FINANCIAL STATEMENTS
Income statement Major variations between 2009-10 Budget and 2009-10 Estimated actual include: 1. The increase is due to additional work from various Australian Government and State Government initiatives. 2. The increase is due to higher subcontractor costs resulting from new programs of work. 3. The decrease is a consequence of a review of expected useful life of the new business system resulting in lower
amortisation costs. 4. The decrease is due to a lower income tax expense as a percentage of operating surplus as a consequence of reduced
capital depreciation and amortisation costs.
Major variances between 2009-10 Budget and 2010-11 Estimate include: 5. The increase is due to additional volumes of work emanating from Australian Government and State Government
initiatives. 6. The increase is due to the additional volumes of work emanating from various Australian Government and State
Government initiatives. 7. The increase is due to additional subcontractor costs as a consequence of the increased volumes of work. 8. The decrease is a consequence of a review of the expected useful life of the new business system resulting in lower
amortisation costs.
Major variances between 2009-10 Estimated actual and the 2010-11 Estimate include: 9. The increase reflects additional volumes of work under various Australian Government and State Government initiatives
and agreed upon enterprise bargaining arrangements. 10. The increase reflects a full year of amortisation of the new business system.
Balance sheet Major variances between 2009-10 Budget and 2009-10 Estimated actual include: 11. The cash balances have increased in line with additional volumes of work. 12. The increase relates to higher work in progress on construction works. 13. The decrease is due to lower opening balance due to fewer acquisitions than originally budgeted in prior year. 14. The decrease is due to tax effect of recognition of new business system as an intangible asset. 15. The decrease is due to tax effects of Annual Leave Central Scheme. 16. The increase is due to a higher than anticipated level of leave liability following implementation of the Annual Leave
Central Scheme. 17. The increase reflects the effect of unearned revenue due to additional volume of work. 18. The increase due to tax effect of recognition of new business system as an intangible asset. Major variances between 2009-10 Budget and 2010-11 Estimate include: 19. Cash balances have increased in line with additional volumes of work. 20. The increase relates to higher work in progress on construction works. 21. The increase reflects prepayment on maintenance agreements for software support. 22. The increase reflects trade payables in line with increased volume of work. 23. The increase reflects effect of unearned revenue due to additional volume of work. 24. The increase is due to tax effect of recognition of new business system as an intangible asset. Major variances between 2009-10 Estimated actual and the 2010-11 Estimate include: 25. The increase is due to tax effect of recognition of new business system as an intangible asset. 26. The decrease reflects full year of amortisation of new business system. 27. The decrease reflects the reduction in borrowing following a further year repayment of a five year business system
replacement loan. 28. The increase is due to tax effect of recognition of new business system as an intangible asset.
Cash flow statement Major variances between 2009-10 Budget and 2009-10 Estimated actual include: 29. The increase reflects additional work from various Australian Government and State Government initiatives. 30. The increase reflects higher GST input tax due to changes in services delivered within GST-grouped entities. 31. The increase reflects higher labour costs and Annual Leave Central Scheme outflows. 32. The increase reflects higher cost of subcontractors in line with increased volume of work. 33. The increase reflects working capital arrangements during the financial year.
Major variances between 2009-10 Budget and 2010-11 Estimate include: 34. The increase reflects additional work from various Australian Government and State Government initiatives. 35. The increase reflects GST input tax due to changes in services delivered within GST-grouped entities. 36. The increase reflects higher labour costs and Annual Leave Central Scheme outflows. 37. The increase reflects higher cost of subcontractors in line with increased volume of work. 38. The increase reflects other direct costs in line with increased volume of work. 39. The decrease reflects the capitalisation of the new business system during 2009-10. Major variances between 2009-10 Estimated actual and the 2010-11 Estimate include: 40. The decrease reflects the capitalisation of the new business system in 2009-10.

2010-11 Queensland State Budget - Service Delivery Statements – Project Services 2-186
Project Services OVERVIEW Project Services provides building and property consultancy services to the Government. Project Services assists its clients in the delivery of building programs and projects within the Government’s capital works framework, minimising risk and assisting in meeting the reporting obligations of the Government. Project Services provides a complete range of consultancy services to its clients, including: � program, project, procurement and risk management � professional building design (architecture, landscape architecture, interior design,
engineering – civil, structural, mechanical, electrical, environmental, fire and specialist) � quantity surveying, superintendency, contract management and administration, building
surveying, property and corporate real estate services and town planning. The key factors and challenges impacting on Project Services include: � delivering Project Services’ commitment to the Nation Building – Economic Stimulus
Plan (NB-ESP), including the Department of Communities’ Social Housing Initiative � extending the use of Building Information Modelling technologies in the design and
construction of public buildings � supporting clients in implementing government policy by investing in higher levels of
environmental sustainability in their building projects � sustaining a role as the building procurement and risk manager for government � attracting, developing and retaining a skilled workforce, and responding to an ageing staff
profile � retaining appropriate market share with a capital works program which is forecast to
reduce, impacting upon both the private and public sectors’ work levels.
REVIEW OF PERFORMANCE
Recent achievements As part of the Government’s building capital works program, Project Services delivered a diverse range of projects throughout the State in 2009-10 including the: � Joint Contact Centre at Zillmere, Brisbane which achieved a 6-star green star rating,
signifying World Leadership status. The project received the highest Green Star rating ever received for an office building in Australia
� Kangaroo Point Park, which transformed the former Kangaroo Point TAFE site into a public space
� Coomera Police District Headquarters, accommodating more than 160 police officers across specialist units including forensic crash, traffic, criminal investigation, child protection, dog squad as well as a vehicle examination bay
� Townsville Hospital Expansion, where, as part of Stage 1, a 17-bed medical inpatient unit opened in July 2009 and a 13-bed Acute Elder Care Assessment Unit opened in August 2009
� Palm Island CBD Master Plan, which was developed in collaboration with Indigenous Business Australia and the Palm Island Aboriginal Shire Council. The Master Plan aims to formally define the land use relationships within the central business district on Palm Island for future development.

2010-11 Queensland State Budget - Service Delivery Statements – Project Services 2-187
Future developments Project Services will continue to deliver significant building capital works projects and programs on behalf of the Government including: � the AFL stadium at Carrara on the Gold Coast (a 23,000-seat stadium capable of
accommodating international standard sporting events) � the 19-storey Supreme Court and District Court complex in the Brisbane central business
district � government office buildings at Maroochydore, Thursday Island and Cairns � an Ecosciences Precinct at Boggo Road, Brisbane (Australia’s first science “centre of
excellence” supporting innovative research into climate change, healthy environment, balanced growth, sustainable industries and mineral and petroleum resources)
� new major State hospitals including the Gold Coast University Hospital and Queensland Children’s Hospital, and redevelopment of hospitals at Robina, Cairns, Townsville, Mackay and Rockhampton
� procurement management of new major State hospitals including the Gold Coast University Hospital and Queensland Children’s Hospital, and the redevelopment of hospitals at Robina, Cairns, Townsville, Mackay and Rockhampton
� significant correctional centre facilities at Gatton and Lotus Glen � the Social Housing Initiatives under the NB–ESP. Project Services will also continue to: � maintain an influential, sustainable and recognised commercial position with clients
through the ongoing refinement and development of partnering agreements with all core clients and develop strategic alliances through professional performance
� manage its workforce profile and level to sustain viability � enhance business systems to deliver integrated project management, design services and
contract administration for the delivery of the Government’s building capital works program
� maintain positive relationships with the building and construction industry to ensure capacity to deliver projects on behalf of the Government.

2010-11 Queensland State Budget - Service Delivery Statements – Project Services 2-188
STATEMENTS
PERFORMANCE STATEMENT Service standards
Notes2009-10
Target/est.2009-10
Est. actual 2010-11
Target/est.
Financial performance measures Gross Profit as a % of Total Sales Current ratio Net Profit as a % of Total Sales Non-financial performance measures Project Competency – on Time Project Competency – on Budget
1,2
3,4
42.2%
3.5:1
5.9%
90%
90%
31.8%
3.3:1
3.4%
90%
90%
33.8%
3.2:1
1.4%
90%
90%
Notes: 1. The decrease in the 2009-10 Estimated actual from the 2009-10 Target/estimate is due to additional outsourced project
activity mainly relating to major hospital projects and the Gatton Correctional Precinct Development. 2. The decrease in the 2010-11 Target/estimate from the 2009-10 Target/estimate is due to additional outsourced project
activity mainly relating to major hospital projects and the Gatton Correctional Precinct Development. 3. The decrease in the 2009-10 Estimated actual from the 2009-10 Target/estimate is due to a downturn in the program of
work delivered internally while the service delivery structure has remained relatively stable. This is due to the Business Unit’s commitment to continued investment in business systems and staff capability to be positioned for the future upturn of the market.
4. The decrease in the 2010-11 Target/estimate from the 2009-10 Estimated actual is due to a downturn in the program of work delivered internally while the service delivery structure has remained relatively stable. This is due to the business unit’s commitment to continued investment in business systems and staff capability to be positioned for the future upturn of the market.

2010-11 Queensland State Budget - Service Delivery Statements – Project Services 2-189
INCOME STATEMENT
Project Services Notes2009-10Budget
$’000
2009-10 Est. act.
$’000
2010-11Estimate
$’000 Income
User charges 1,11 149,576 183,855 150,626Grants and other contributions .. .. ..Other revenue 2,6,12 1,896 2,090 2,612Gains on sale/revaluation of property, plant and equipment and investments
..
.. ..Total income 151,472 185,945 153,238 Expenses
Employee expenses 7,13 71,829 70,694 67,824Supplies and services 3,8,14 69,214 108,019 82,394Grants and subsidies .. .. ..Depreciation and amortisation 4,9 1,198 623 595Finance/borrowing costs .. .. ..Other expenses 350 373 318Losses on sale/revaluation of property, plant and equipment and investments
..
.. ..Total expenses 142,591 179,709 151,131 Surplus or deficit before related income tax 5,10,15 8,881 6,236 2,107 Income tax expense/revenue
2,666 1,961
522
OPERATING SURPLUS/ (DEFICIT) after related income tax 6,215 4,275 1,585
STATEMENT OF CHANGES IN EQUITY
Project Services Notes2009-10Budget
$’000
2009-10 Est. act.
$’000
2010-11Estimate
$’000
Net effect of the changes in accounting policies and prior year adjustments .. .. ..Increase/(decrease) in asset revaluation reserve .. .. ..Net amount of all revenue and expense adjustments direct to equity not disclosed above .. .. .. Net income recognised directly in equity .. .. .. Surplus/(deficit) for the period 6,215 4,275 1,585Total recognised income and expense for the period 6,215 4,275 1,585Equity injection/(withdrawal) .. .. ..Equity adjustments (MoG transfers) .. .. ..Dividends paid or provided (3,108) (2,137) (793)Total movement in equity for period 3,107 2,138 792

2010-11 Queensland State Budget - Service Delivery Statements – Project Services 2-190
BALANCE SHEET
Project Services Notes2009-10Budget
$’000
2009-10 Est. act.
$’000
2010-11Estimate
$’000 CURRENT ASSETS
Cash assets 20,26 24,413 23,670 14,405Receivables 16,21,27 24,239 26,409 21,882Other financial assets 3 .. ..Inventories 17,22 1,189 .. ..Other 606 858 619Non-financial assets held for sale .. .. ..
Total current assets 50,450 50,937 36,906 NON-CURRENT ASSETS
Receivables .. .. ..Other financial assets .. .. ..Property, plant and equipment 1,118 1,330 850Deferred tax assets 1,372 982 1,157Intangibles 23,28 2,750 2,107 13,282Other .. .. ..
Total non-current assets 5,240 4,419 15,289 TOTAL ASSETS 55,690 55,356 52,195 CURRENT LIABILITIES
Payables 19,24,29 9,818 12,450 8,693Interest-bearing liabilities and derivatives .. .. ..Current tax liabilities 18,25 2,379 79 417Accrued employee benefits 1,441 1,446 1,347Provisions 717 1,457 957Other 192 .. ..
Total current liabilities 14,547 15,432 11,414 NON-CURRENT LIABILITIES
Payables .. .. ..Interest-bearing liabilities and derivatives .. .. ..Deferred tax liabilities 114 219 284Accrued employee benefits .. .. ..Provisions .. .. ..Other .. .. ..
Total non-current liabilities 114 219 284 TOTAL LIABILITIES 14,661 15,651 11,698 NET ASSETS/ (LIABILITIES) 41,029 39,705 40,497 EQUITY
Capital/contributed equity 1,730 1,730 1,730Retained surplus/(accumulated deficit) 39,299 37,975 38,767Reserves:
- Asset revaluation reserve .. .. ..- Other (specify) .. .. ..
TOTAL EQUITY 41,029 39,705 40,497

2010-11 Queensland State Budget - Service Delivery Statements – Project Services 2-191
CASH FLOW STATEMENT
Project Services Notes2009-10Budget
$’000
2009-10 Est. act.
$’000
2010-11Estimate
$’000 CASH FLOWS FROM OPERATING ACTIVITIES
Inflows: User charges 30,33,36 165,902 202,025 171,958Grants and other contributions .. .. ..Other 30,36 9,432 19,019 13,527
Outflows: Employee costs 32,37 (74,858) (71,753) (67,771)Supplies and services 30,33,36 (79,007) (115,937) (95,681)Grants and subsidies .. .. ..Borrowing costs .. .. ..Taxation equivalents paid (1,415) (1,792) (294)Other 30,36 (14,323) (24,715) (17,577)
Net cash provided by/(used in) operating activities 5,731 6,847 4,162 CASH FLOWS FROM INVESTING ACTIVITIES
Inflows: Sales of property, plant and equipment .. .. ..Investments redeemed .. .. ..Loans and advances redeemed .. .. ..
Outflows: Payments for property, plant and equipment and intangibles
31,34 (2,822) (718) (11,290)
Payments for investments .. .. ..Loans and advances made .. .. ..
Net cash provided by/ (used in) investing activities (2,822) (718) (11,290) CASH FLOWS FROM FINANCING ACTIVITIES
Inflows: Borrowings .. .. ..Equity injections .. .. ..
Outflows: Dividends paid 35,38 (4,043) (3,686) (2,137)Borrowing redemptions .. .. ..Finance lease payments .. .. ..Equity withdrawals .. .. ..
Net cash provided by/ (used in) financing activities (4,043) (3,686) (2,137)
Net increase/(decrease) in cash held (1,134) 2,443 (9,265) Cash at the beginning of financial year 25,547 21,227 23,670 Cash transfers from restructure .. .. ..Cash at the end of financial year 24,413 23,670 14,405

2010-11 Queensland State Budget - Service Delivery Statements – Project Services 2-192
EXPLANATION OF VARIANCES IN THE FINANCIAL STATEMENTS
Income statement Major variations between 2009-10 Budget and 2009-10 Estimated actual include: 1. User charges are higher due to additional outsourced project activity mainly relating to major hospital projects and the
Gatton Correctional Precinct Development. 2. Other revenues are more favourable due to higher interest revenue resulting from improved cash balances and increases
in interest rates, and the rental supplementation from the Consolidated Fund. 3. Supplies and services are higher due to an increase in the amount of work outsourced to the private sector in line with a
higher level of outsourced revenue included in User charges, mainly relating to major hospital projects. 4. Depreciation and amortisation are lower due to revised timings in the roll-out of SAP and other business system upgrades. 5. The net operating surplus is reduced due to a downturn in the program of work delivered internally while the service
delivery structure has remained relatively stable. This is due to Business Unit’s commitment to continued investment in business systems and staff capability to be positioned for the future upturn of the market.
Major variations between 2009-10 Budget and 2010-11 Estimate include: 6. Other revenues are expected to be higher due to the rental supplementation funding and improved interest revenue as a
result of higher interest rates and improved cash balances. 7. Employee expenses are expected to be lower due to a reduced program of work. 8. Supplies and services are expected to be higher mainly due to a greater level of outsourced work to the private sector
which is included in user charges. 9. Depreciation and amortisation are expected to be lower due to the revised timing of the planned SAP upgrade. 10. The net operating surplus is reduced due to a downturn in the program of work delivered internally while the service
delivery structure has remained relatively stable. This is due to the Business Unit’s commitment to continued investment in business systems and staff capability to be positioned for the future upturn of the market.
Major variations between 2009-10 Estimated actual and the 2010-11 Estimate include: 11. User charges are expected to be lower due to a reduced program of work, both internal fees and outsourced revenue. 12. Other revenue is expected to be higher due to improved interest revenue as a result of higher interest rates and improved
cash balances. 13. Employee expenses are expected to be lower due to a reduced program of work. 14. Supplies and services are expected to be lower in line with a reduced program of work. 15. The net operating surplus is reduced due to a downturn in the program of work delivered internally while the service
delivery structure has remained relatively stable. This is due to the Business Unit’s commitment to continued investment in business systems and staff capability to be positioned for the future upturn of the market.
Balance sheet Major variations between 2009-10 Budget and 2009-10 Estimated actual include: 16. Receivables are higher due to an increase in revenue outsourced to the private sector. 17. Inventories were budgeted to allow for some Work-In-Progress to be completed but not yet billed at year-end due to timing
differences. It is now anticipated that the Business Unit is likely to be in a neutral position. 18. The tax liability is lower due to a reduced net profit position and has been offset by tax instalments for the current year. 19. Payables are higher as a result of an increase in cost of sales relating to revenue outsourced to the private sector. Major variations between 2009-10 Budget and 2010-11 Estimate include: 20. The decrease in cash is mainly due to the proposed major upgrades to SAP and other business systems including
eTender and eContract. 21. The decrease in receivables is mainly due to a reduction in internal fees and continued improvements in debt
management. 22. Inventories were budgeted to allow for some Work-In-Progress to be completed but not yet billed at year-end due to timing
differences. It is now anticipated that the Business Unit is likely to be in a neutral position. 23. The increase in intangibles is due to the proposed major upgrade to SAP and a number of other business systems. 24. The decrease in payables is due to a reduced program of work delivered internally, and a reduction in dividends payable
as a result of the reduced net profit position. 25. The tax liability is lower due to a reduced net profit position. Major variations between 2009-10 Estimated actual and the 2010-11 Estimate include: 26. The decrease in cash is due to the proposed upgrades to SAP and other business systems including eTender and
eContract. 27. The decrease in receivables is in line with an expected smaller program of work, which will also result in a lower volume of
work outsourced to the private sector. 28. The increase in intangibles is due to the major upgrades to SAP and a number of other business systems. 29. The decrease in payables is mainly due to a reduction in the program of work which will also result in less work being
outsourced to external consultants. Dividends payable are also expected to decrease in line with a lower net profit position.
Cash flow statement Major variations between 2009-10 Budget and 2009-10 Estimated actual include: 30. Cash inflows and outflows are higher primarily due to increased user charges particularly the outsourced revenue
component and associated external consultant costs included in supplies and services. The movement also impacts on GST receivable and payable which are included in other inflows and outflows.
31. Payments for property, plant and equipment and intangibles are lower due to the postponement of business systems upgrades.

2010-11 Queensland State Budget - Service Delivery Statements – Project Services 2-193
Major variations between 2009-10 Budget and 2010-11 Estimate include: 32. Employee expenses are expected to be lower due to a reduced program of work. 33. Supplies and services are expected to be higher mainly due to a greater level of outsourced work to the private sector,
including major hospital and housing projects. 34. Payments for property, plant and equipment, and intangibles are expected to be higher due to the major upgrades to SAP
and other business systems. 35. Dividends paid are expected to be lower due to a reduced net profit position.
Major variations between 2009-10 Estimated actual and the 2010-11 Estimate include: 36. Material movements in cash inflows and outflows are primarily due to a lower program of work which also impact on the
level of cost of sales included in Supplies and services. The movement also impacts on GST receivable and payable which are included in other inflows and outflows.
37. Employee expenses are expected to be lower due to a reduced program of work. 38. Dividends paid are expected to be lower due to a reduced net profit position.
2010-11 Queensland State Budget - Service Delivery Statements – QFleet 2-194
QFleet OVERVIEW QFleet is the Government’s centralised fleet owner and manager. QFleet’s role and value to Government is based on its capacity to aggregate the Government fleet, enable economies of scale and provide centralised expertise in fleet management. In 2009-10, QFleet managed approximately 13,500 vehicles on behalf of the Government. QFleet’s key services are vehicle procurement; fleet leasing, management and advisory services; vehicle servicing and repairs; used vehicle sales; fleet reporting; and the development and management of fleet policy. The key factors and challenges impacting on QFleet include: � minimising the Government’s exposure to risk and future market volatility � aligning the government fleet mix with market demand, ensuring the Government’s
policy priorities are met � continuing to deliver high quality, reliable, value-for-money fleet services, ensuring
government priorities are met.
REVIEW OF PERFORMANCE
Recent Achievements QFleet’s recent achievements include: � implementing an improved vehicle procurement model enabling substantive savings to
government whilst delivering on the Government’s priorities of greener and safer vehicles � further reducing vehicle emissions - the QFleet ClimateSmart Action Plan 2007-2010 set
a vehicle carbon dioxide (CO2) emission reduction target of 15% by the end of 2010. As at March 2010, a 20.9% reduction in CO2 emissions from the QFleet fleet had been achieved
� developing the Fleet Efficiency and Utilisation Policy (QFleet is the first government fleet in Australia to develop such a policy for client agencies)
� developing ClimateSmart strategic review modelling tools for operational, tactical and strategic performance analysis and reporting
� implementing a Driver Education and Awareness Program, including 102 workshops run in conjunction with CARRS-Q (QUT) for approximately 4,000 government drivers, State-wide.
Future developments In the future, QFleet will: � implement the Fleet Efficiency and Utilisation Policy, which provides a framework for
best practice fleet management for the Government � implement phase two of the ClimateSmart Action Plan 2010-2012 to meet targets to
reduce carbon emissions of the fleet by 25% by 2012 and 50% by 2017 � implement the second phase of QFleet’s strategic procurement plan to reduce
ClimateSmart emissions, enhance general fleet safety and lower the total cost of ownership to government
� develop and implement dashboard reporting on fleet performance for agency’s chief executive officers to inform them of significant performance indicators in their fleet
� develop and provide a Driver Safety Manual to government agencies.

2010-11 Queensland State Budget - Service Delivery Statements – QFleet 2-195
STATEMENTS
PERFORMANCE STATEMENT Service standards
Notes2009-10
Target/est.2009-10
Est. actual 2010-11
Target/est.
Financial performance measures Current ratio Gearing level Return on net assets Non-financial performance measures Reduction of carbon emissions in vehicles (ClimateSmart) Vehicle stocks on hand awaiting sale as a percentage of the total fleet
1
2
3
4
5
1.32:1
82%
6.7%
15% by 31 December
2010
<10%
1.19:1
80%
10.1%
20.9%
<10%
1.08:1
80%
5.8%
25% by 31 December
2012
<10%
Notes: 1. The decrease in the 2010-11 Target/estimate from the 2009-10 Estimated actual is mainly due to a reduction of
receivables from higher unearned income and improved recovery. 2. The variance between the 2009-10 Target/estimate and the 2010-11 Target/estimate relates to a reduction in debt to the
Queensland Treasury Corporation and a minor increase in equity due to profits. 3. The decrease in the 2010-11 Target/estimate from the 2009-10 Estimated actual is due to a trend across Australia for an
increase in new motor vehicle sales and a subsequent drop in used vehicle sales post the Global Financial Crisis. 4. QFleet met the target to reduce carbon dioxide emissions of its fleet by 15% in September 2009. As at end March 2010,
QFleet’s 2009-10 Estimated actual was 20.92%. 5. It is expected that by 30 June 2010, vehicle stocks on hand awaiting sale will be <10% of the total fleet.

2010-11 Queensland State Budget - Service Delivery Statements – QFleet 2-196
INCOME STATEMENT
QFleet Notes2009-10Budget
$’000
2009-10 Est. act.
$’000
2010-11Estimate
$’000 Income
User charges 1,7,13 147,807 227,481 226,414Grants and other contributions .. .. ..Other revenue 641 647 642Gains on sale/revaluation of property, plant and equipment and investments
2,8 421 .. ..
Total income 148,869 228,128 227,056 Expenses
Employee expenses 3,9 10,326 8,955 10,968Supplies and services 4,10 46,592 118,201 131,250Grants and subsidies .. .. ..Depreciation and amortisation 65,290 66,448 64,492Finance/borrowing costs 5,14 16,432 13,997 15,326Other expenses 279 554 538Losses on sale/revaluation of property, plant and equipment and investments
12 4,180 .. ..
Total expenses 143,099 208,155 222,574 Surplus or deficit before related income tax 5,770 19,973 4,482 Income tax expense/revenue
6,11,15 1,731 5,992 1,345
OPERATING SURPLUS/(DEFICIT) after related income tax 4,039 13,981 3,137
STATEMENT OF CHANGES IN EQUITY
QFleet Notes2009-10Budget
$’000
2009-10 Est. act.
$’000
2010-11Estimate
$’000
Net effect of the changes in accounting policies and prior year adjustments .. .. ..Increase/(decrease) in asset revaluation reserve .. .. ..Net amount of all revenue and expense adjustments direct to equity not disclosed above .. .. .. Net income recognised directly in equity .. .. .. Surplus/(deficit) for the period 16,18 4,039 13,981 3,137Total recognised income and expense for the period 4,039 13,981 3,137Equity injection/(withdrawal) .. .. ..Equity adjustments (MoG transfers) .. .. ..Dividends paid or provided 17,19 (2,020) (6,990) (1,568)Total movement in equity for period 2,019 6,991 1,569

2010-11 Queensland State Budget - Service Delivery Statements – QFleet 2-197
BALANCE SHEET
QFleet Notes2009-10Budget
$’000
2009-10 Est. act.
$’000
2010-11Estimate
$’000 CURRENT ASSETS
Cash assets 500 543 500Receivables 20,28 14,066 12,293 7,056Other financial assets .. .. ..Inventories 26 281 13,749 13,370Other 5,326 5,709 5,114Non-financial assets held for sale 27 12,783 .. ..
Total current assets 32,956 32,294 26,040 NON-CURRENT ASSETS
Receivables 2 .. ..Other financial assets .. .. ..Property, plant and equipment 21,25 312,868 306,309 316,961Deferred tax assets 1,372 759 759Intangibles 22 6,160 4,809 5,285Other .. .. ..
Total non-current assets 320,402 311,877 323,005 TOTAL ASSETS 353,358 344,171 349,045 CURRENT LIABILITIES
Payables 22,452 20,670 22,256Interest-bearing liabilities and derivatives .. .. ..Current tax liabilities 23 1,731 5,977 1,345Accrued employee benefits 449 497 497Provisions .. .. ..Other 270 .. ..
Total current liabilities 24,902 27,144 24,098 NON-CURRENT LIABILITIES
Payables .. .. ..Interest-bearing liabilities and derivatives 24,29 265,754 250,002 256,353Deferred tax liabilities 4,075 3,276 3,276Accrued employee benefits .. .. ..Provisions .. .. ..Other .. .. ..
Total non-current liabilities 269,829 253,278 259,629 TOTAL LIABILITIES 294,731 280,422 283,727 NET ASSETS/(LIABILITIES) 58,627 63,749 65,318 EQUITY
Capital/contributed equity 26,097 26,095 26,095Retained surplus/(accumulated deficit) 32,530 37,654 39,223Reserves:
- Asset revaluation reserve .. .. ..- Other (specify) .. .. ..
TOTAL EQUITY 58,627 63,749 65,318

2010-11 Queensland State Budget - Service Delivery Statements – QFleet 2-198
CASH FLOW STATEMENT
QFleet Notes2009-10Budget
$’000
2009-10 Est. act.
$’000
2010-11Estimate
$’000 CASH FLOWS FROM OPERATING ACTIVITIES
Inflows: User charges 30 160,425 244,169 251,431Grants and other contributions .. .. ..Other 932 663 642
Outflows: Employee costs 34 35 (10,326) (8,732) (10,968)Supplies and services 31,36 (56,090) (211,001) (218,165)Grants and subsidies .. .. ..Borrowing costs 39 (16,583) (13,984) (15,121)Taxation equivalents paid 40 (1,873) .. (5,977)Other (279) (554) (539)
Net cash provided by/(used in) operating activities 76,206 10,561 1,303 CASH FLOWS FROM INVESTING ACTIVITIES
Inflows: Sales of property, plant and equipment 32 76,825 .. ..Investments redeemed .. .. ..Loans and advances redeemed .. .. ..
Outflows: Payments for property, plant and equipment and intangibles
38 (148,016) (529) (707)
Payments for investments .. .. ..Loans and advances made .. .. ..
Net cash provided by/(used in) investing activities (71,191) (529) (707) CASH FLOWS FROM FINANCING ACTIVITIES
Inflows: Borrowings 33 7,069 30,000 18,456Equity injections .. .. ..
Outflows: Dividends paid 37,42 (2,186) (5,660) (6,990)Borrowing redemptions 41 (9,917) (35,001) (12,105)Finance lease payments .. .. ..Equity withdrawals .. .. ..
Net cash provided by/(used in) financing activities (5,034) (10,661) (639)
Net increase/(decrease) in cash held (19) (629) (43) Cash at the beginning of financial year 519 1,172 543 Cash transfers from restructure .. .. ..Cash at the end of financial year 500 543 500

2010-11 Queensland State Budget - Service Delivery Statements – QFleet 2-199
EXPLANATION OF VARIANCES IN THE FINANCIAL STATEMENTS General Note: As a result of a change in the accounting standards AASB 107 Statement of Cash Flows and AASB 116 Property Plant and Equipment, changes are required to the Income Statement, Balance Sheet and the Cash Flow Statement. The gross proceeds from sales of vehicles must be classified as user charges in the Income Statement with the written down value at date of sale classified as supplies and services. Vehicles awaiting sale must be classified as inventories in the Balance Sheet. The cash flows relating to sales and purchase of motor vehicle assets must now be classified as Cash Flows From Operating Activities in the Cash Flow Statement. These changes have been implemented for the 2009-10 Estimated actuals and 2010-11 Estimate. The 2009-10 Budget appears the same as in the 2009-10 Service Delivery Statements.
Income statement Major variations between 2009-10 Budget and 2009-10 Estimated actual include: 1. The increase is mainly due to the inclusion of the gross proceeds on vehicle sales (see General Note). 2. The decrease is due to gain on sale not being disclosed owing to changes in accounting standards (see General Note). 3. The decrease is due to utilisation of agency staff at workshops and staff capitalised to the core system replacement
project. 4. The increase is mainly due to the inclusion of written down values on sale of vehicles in supplies and services (see
General Note). 5. The decrease is due to lower interest rates for many months of the year and a reduced level of debt. 6. The increase in income tax is due to the higher profit for the 2009-10 year. Major variations between 2009-10 Budget and 2010-11 Estimate include: 7. The increase is mainly due to the inclusion of the gross proceeds on vehicle sales (see General Note). 8. The decrease is due to the gain on sale not being disclosed owing to changes in accounting standards (see General
Note). 9. The increase is due to enterprise bargaining increases and a restructure of business operations in 2009-10. 10. The increase is mainly due to the inclusion of written down values on sale of vehicles in supplies and services and costs
associated with the business systems replacement project (see General Note). 11. The reduced tax is due to the lower profits expected in the 2010-11 fiscal year. 12. The decrease is due to loss on sale not being disclosed owing to changes in accounting standards (see General Note). Major variations between 2009-10 Estimated actual and the 2010-11 Estimate include: 13. The decrease is due to a minor fall in the resale prices of used vehicles as the economy improves and new vehicle sales
increase, resulting in more used cars on the market. 14. The increase is due to higher borrowing costs resulting from higher interest rates and increased borrowing levels. 15. The decrease is due to the lower profits estimated for fiscal year 2010-11.
Statement of changes in equity Major variations between 2009-10 Budget and 2009-10 Estimated actual include: 16. The increase is due to gains on the sale of motor vehicles, user charges and savings in vehicle maintenance costs,
employee costs and finance borrowing costs. 17. The increase is due to a higher than budgeted net operating surplus, after taxes. Major variations between 2009-10 Estimated actual and the 2010-11 Estimate include: 18. The decrease is due to lower lease revenue due to a marginally smaller fleet size and estimated lower net profits on the
vehicle resale markets 19. The decrease in provision for dividends is due to lower net operating surplus after taxes.
Balance sheet Major variations between 2009-10 Budget and 2009-10 Estimated actual include: 20. The decrease is due to improved debt recovery. 21. The decrease is due to the lower residual values and therefore higher depreciation on motor vehicles. 22. The decrease in value of intangible assets is due to deferral of core system replacement implementation. 23. The increase in the provision for taxation is as a result of the higher operating surplus. 24. The decrease in borrowings is mainly due to extra cash flow from improved values on motor vehicle sales. Major variations between 2009-10 Budget and 2010-11 Estimate include: 25. The increase is due to potential higher prices of new vehicles to the required standards of safety and fit for purpose and
the need to replace the 3 year lease vehicles from 2007 at a higher cost. 26. The increase is due to the inclusion of motor vehicles held for sale, transferred from Non-financial assets held for sale
(see General Note). 27. The decrease is due to the transfer of motor vehicles held for sale to inventories (see General Note). Major variations between 2009-10 Estimated actual and the 2010-11 Estimate include: 28. The decrease is mainly due to improved recovery from debtors. 29. The increase in borrowings is due to higher average cost of replacement of motor vehicles and the higher number of
vehicles being replaced.
Cash flow statement Major variations between 2009-10 Budget and 2009-10 Estimated actual include: 30. The increase is due to the inclusion of the proceeds on sale of vehicles (see General Note). 31. The increase is mainly due to increased motor vehicle service costs and the inclusion of purchases of new vehicles
transferred from payments for property plant and equipment (see General Note).

2010-11 Queensland State Budget - Service Delivery Statements – QFleet 2-200
32. The decrease is due to the proceeds on sale of vehicles being now included in User charges (see General Note). 33. The increase in borrowings is due to need for short term borrowings offset by greater redemptions of the debt. 34. The reduction is due to the restructure of the business part way through the year, which saw the number of jobs reduced
and some vacancies filled later in the year, as well as capitalisation of staff working on the core system replacement project.
Major variations between 2009-10 Budget and 2010-11 Estimate include: 35. The increase is due to enterprise bargaining and more permanent positions to achieve the full staffing levels. 36. The increase is due to higher charges for motor vehicle servicing, core system replacement and the purchase of new
vehicles (see General Note). 37. The increase in dividend paid is due to the high operating surplus in 2009-10. 38. The decrease is due to the costs of motor vehicle purchases now being included in supplies and services (see General
Note). Major variations between 2009-10 Estimated actual and the 2010-11 Estimate include: 39. The increase is due to borrowings at higher interest rates, as a result of the recovery in global financial markets. 40. The increase is due to the improved surplus in 2009-10, resulting in tax payments in 2010-11. 41. The decrease in redemptions is due to less cash flow available from lower profits on sale of vehicles expected in 2010-11. 42. The increase is due to the higher operating profits in 2009-10 resulting mainly from resale of vehicles.

2010-11 Queensland State Budget - Service Delivery Statements – CITEC 2-201
CITEC OVERVIEW CITEC is the Queensland Government’s primary technology service provider. CITEC’s core business is to deliver data centre, network and infrastructure services, including solutions integration services, to the whole-of-Government. CITEC also delivers information brokerage services through CITEC Confirm. The Queensland Government Chief Technology Office (QGCTO), established within CITEC, provides leadership and direction, collaboration and management on whole-of-Government ICT to the Government and its agencies. The QGCTO has a focus on standards for the technology domain of the Government Enterprise Architecture and gives direction to technology consolidation programs across government. It ensures that whole-of-Government investment in technology is optimised to meet information management and integrated government service delivery outcomes. The key factors and challenges impacting on CITEC include: � progressing the long-term consolidation of agency ICT infrastructure to the
whole-of-Government providing economies of scale and secure environments � managing resources to effectively deliver ICT infrastructure services and their required
operating capacity � sustaining a viable CITEC financial position as well as managing long-term investments
in whole-of-Government ICT infrastructure � identifying opportunities for partnering with the ICT industry.
REVIEW OF PERFORMANCE
Recent achievements CITEC’s recent achievements include: � transitioning agencies equipment and other ICT infrastructure to the Polaris Data Centre
to facilitate whole-of-Government ICT infrastructure consolidation including equipment from the Department of Transport and Main Roads, the Department of Education and Training, the Department of Public Works as well as the Public Trust Office
� finalising consolidation strategies and roadmaps for the Department of Transport and Main Roads, the Department of Education and Training, and the Department of Public Works for transition to whole-of-Government ICT infrastructure service offerings with draft consolidation strategies and roadmaps developed for a further four agencies
� finalising an Applications Rationalisation Methodology for adoption by agencies in assessing and managing applications in use within each department
� completing the detailed design of the technology architecture of the whole-of-Government Identity Directory and Email Service (IDES), which will consolidate email service delivery across government and provide improved whole-of-Government identity management
� upgrading service and capacity through procurement of more advanced and cost effective technology, such as mainframes
� establishing a common Internet Service Provider arrangement for provisioning agency internet capacity needs which has been taken up by all departments with savings to agencies of $6.6 million as at March 2010
� finalising a large scale technology consolidation for the whole-of-Government intranet (GovNet) resulting in a reduction of $1 million annually and improved resilient and high speed connectivity between agencies sharing business critical applications

2010-11 Queensland State Budget - Service Delivery Statements – CITEC 2-202
� implementing a common agency ICT service call logging and management system, promoting a standard government-wide approach for improved help desk call resolution
� completing an evaluation process for the whole-of-Government Foundation Infrastructure Program, which includes network infrastructure
� developing a whole-of-Government approach to procurement of ICT infrastructure and services available for use by all departments resulting in agency cost avoidance of $1 million to December 2009.
Future developments In the future, CITEC will: � commission the Foundation ICT Infrastructure for network connectivity, data storage
facilities and server equipment to provide whole-of-Government consolidation capability � implement IDES technology and commence roll-out across departments � implement actions from the Government’s Toward Q2 through ICT Strategy to reform
technology capability and service delivery including reviewing future data centre capacity requirements of government and a shared utility approach to infrastructure service delivery
� continue the transition of agency ICT infrastructure into whole-of-Government ICT service delivery offerings
� investigate and, where appropriate, progress CITEC ICT infrastructure and service delivery capability in support of the Government’s response to the Council of Australian Governments initiatives.

2010-11 Queensland State Budget - Service Delivery Statements – CITEC 2-203
STATEMENTS
PERFORMANCE STATEMENT Service standards
Notes2009-10
Target/est.2009-10
Est. actual 2010-11
Target/est.
Financial performance measures Earnings Before Interest and Tax (EBIT) ($’000) Current Ratio Gearing Level Return on Net Assets Non-financial performance measures Number of Information Technology graduates, trainees and cooperative students employed each year Agency accepted design conversions to whole-of-Government ICT infrastructure Government Enterprise Architecture Papers
1,3,5
2,4,6
(5,131)
1.41:1
64.7%
(8.3%)
10
100%
10
(10,567)
1.86:1
54.4%
(17.1%)
16
100%
20
(14,910)
1.37:1
67.3%
(15.3%)
10
100%
10
Notes: 1. The decrease in the 2009-10 Estimated actual from the 2009-10 Target/estimate is a result of the winding back of
services to commercial clients, deferred ICT projects, costs of transitioning CITEC to a whole-of-Government services provider and the cost associated with delivering the Identity, Directory and Email Services (IDES) program of work.
2. The decrease in the 2009-10 Estimated actual from the 2009-10 Target/estimate is due to higher total equity as a result of the additional equity injection to support CITEC’s operations in transitioning to a whole-of-Government ICT services provider.
3. The decrease in the 2010-11 Target/estimate from the 2009-10 Target/estimate is a result of the winding back of services to commercial clients, deferred ICT projects, the costs of transitioning CITEC to a whole-of-Government services provider and the cost associated with delivering the IDES program of work.
4. The increase in the 2010-11 Target/estimate from the 2009-10 Target/estimate is due to loan draw downs for the IDES and ICTC programs.
5. The decrease in the 2010-11 Target/estimate from the 2009-10 Estimated actual is a result of the winding back of services to commercial clients, deferral of Queensland Government ICT discretionary projects and costs of transitioning CITEC to a whole-of-Government services provider.
6. The increase in the 2010-11 Target/estimate from the 2009-10 Target/estimate is due to loan draw downs for the IDES and ICTC programs.

2010-11 Queensland State Budget - Service Delivery Statements – CITEC 2-204
INCOME STATEMENT
CITEC Notes2009-10Budget
$’000
2009-10 Est. act.
$’000
2010-11Estimate
$’000 Income
User charges 1,6,11 165,092 160,636 182,205Grants and other contributions .. .. ..Other revenue 2,160 2,285 2,100Gains on sale/revaluation of property, plant and equipment and investments
..
.. ..Total income 167,252 162,921 184,305 Expenses
Employee expenses 2,7,12 60,633 62,640 70,119Supplies and services 3,8,13 98,833 101,082 114,768Grants and subsidies .. .. ..Depreciation and amortisation 4,9,14 10,542 8,283 12,126Finance/borrowing costs 2,430 1,560 3,096Other expenses 1,256 1,011 1,057Losses on sale/revaluation of property, plant and equipment and investments
11
20 26Total expenses 173,705 174,596 201,192 Surplus or deficit before related income tax 5,10,15 (6,453) (11,675) (16,887) Income tax expense/revenue
(3,691) (3,601) (4,053)
OPERATING SURPLUS/(DEFICIT) after related income tax 5,10,15 (2,762) (8,074) (12,834)
STATEMENT OF CHANGES IN EQUITY
CITEC Notes2009-10Budget
$’000
2009-10 Est. act.
$’000
2010-11Estimate
$’000
Net effect of the changes in accounting policies and prior year adjustments .. .. ..Increase/(decrease) in asset revaluation reserve .. .. ..Net amount of all revenue and expense adjustments direct to equity not disclosed above .. .. .. Net income recognised directly in equity .. .. .. Surplus/(deficit) for the period 16,18,20 (2,762) (8,074) (12,834)
Total recognised income and expense for the period (2,762) (8,074) (12,834)Equity injection/(withdrawal) 17,19,21 5,426 23,193 8,421Equity adjustments (MoG transfers) .. .. ..Dividends paid or provided .. .. ..Total movement in equity for period 2,664 15,119 (4,413)

2010-11 Queensland State Budget - Service Delivery Statements – CITEC 2-205
BALANCE SHEET
CITEC Notes2009-10Budget
$’000
2009-10 Est. act.
$’000
2010-11Estimate
$’000 CURRENT ASSETS
Cash assets 22,30,39 2,434 15,636 5,531Receivables 31,40 23,766 24,036 28,717Other financial assets .. .. ..Inventories 134 51 60Other 23,32 3,210 7,608 7,306Non-financial assets held for sale .. .. ..
Total current assets 29,544 47,331 41,614 NON-CURRENT ASSETS
Receivables .. .. ..Other financial assets 500 500 500Property, plant and equipment 33,41 45,241 44,829 54,526Deferred tax assets 24,34,42 5,881 8,635 13,692Intangibles 25,33,41 15,609 23,508 31,821Other 1,425 850 850
Total non-current assets 68,656 78,322 101,389 TOTAL ASSETS 98,200 125,653 143,003 CURRENT LIABILITIES
Payables 26,35,43 7,130 10,682 12,120Interest-bearing liabilities and derivatives 27,36,44 8,919 9,991 12,226Current tax liabilities .. .. ..Accrued employee benefits 940 1,903 2,319Provisions .. .. ..Other 3,965 2,841 3,819
Total current liabilities 20,954 25,417 30,484 NON-CURRENT LIABILITIES
Payables .. .. ..Interest-bearing liabilities and derivatives 27,36,44 47,648 56,662 72,354Deferred tax liabilities .. 808 1,812Accrued employee benefits .. .. ..Provisions .. .. ..Other .. .. ..
Total non-current liabilities 47,648 57,470 74,166 TOTAL LIABILITIES 68,602 82,887 104,650 NET ASSETS/(LIABILITIES) 29,598 42,766 38,353 EQUITY
Capital/contributed equity 28,37,45 21,238 37,514 45,935Retained surplus/(accumulated deficit) 29,38,46 8,360 5,252 (7,582)Reserves:
- Asset revaluation reserve .. .. ..- Other (specify) .. .. ..
TOTAL EQUITY 29,598 42,766 38,353

2010-11 Queensland State Budget - Service Delivery Statements – CITEC 2-206
CASH FLOW STATEMENT
CITEC Notes2009-10Budget
$’000
2009-10 Est. act.
$’000
2010-11Estimate
$’000 CASH FLOWS FROM OPERATING ACTIVITIES
Inflows: User charges 47,53,58 176,075 172,151 195,641Grants and other contributions .. .. ..Other 53,58 11,596 12,248 14,753
Outflows: Employee costs 54,59 (62,313) (62,309) (69,494)Supplies and services 48,55,60 (106,433) (116,811) (127,842)Grants and subsidies .. .. ..Borrowing costs (2,000) (920) (2,944)Taxation equivalents paid .. .. ..Other (16,842) (16,424) (16,431)
Net cash provided by/(used in) operating activities 83 (12,065) (6,317) CASH FLOWS FROM INVESTING ACTIVITIES
Inflows: Sales of property, plant and equipment .. .. ..Investments redeemed .. .. ..Loans and advances redeemed .. .. ..
Outflows: Payments for property, plant and equipment and intangibles
49,56,61 (43,406) (45,282) (30,136)
Payments for investments .. .. ..Loans and advances made .. .. ..
Net cash provided by/(used in) investing activities (43,406) (45,282) (30,136) CASH FLOWS FROM FINANCING ACTIVITIES
Inflows: Borrowings 50,57,62 45,400 47,750 28,167Equity injections 51,63 5,426 23,193 8,421
Outflows: Dividends paid .. .. ..Borrowing redemptions 52,64 (7,204) (3,758) (8,679)Finance lease payments .. (591) (1,561)Equity withdrawals .. .. ..
Net cash provided by/(used in) financing activities 43,622 66,594 26,348
Net increase/(decrease) in cash held 299 9,247 (10,105) Cash at the beginning of financial year 2,135 6,389 15,636 Cash transfers from restructure .. .. ..Cash at the end of financial year 2,434 15,636 5,531
2010-11 Queensland State Budget - Service Delivery Statements – CITEC 2-207
EXPLANATION OF VARIANCES IN THE FINANCIAL STATEMENTS
Income statement Major variations between 2009-10 Budget and 2009-10 Estimated actual include: 1. The decrease is mainly due to the winding back of services to commercial clients and reduced Identity, Directory and
Email Services (IDES) revenue as a result of timing differences in the delivery of the program. 2. The increase is due to additional resource requirements necessary to transition CITEC to a whole-of-Government ICT
services provider (including IDES and ICT Consolidation (ICTC)). 3. The increase is due to additional resource requirements necessary to transition CITEC to a whole-of-Government ICT
services provider (including IDES and ICTC). 4. The decrease is due to the timing of asset acquisitions associated with the IDES and ICTC programs. 5. The increased deficit is a result of the winding back of services to Commercial clients, deferral of the Queensland
Government ICT discretionary projects, costs of transitioning CITEC to a whole-of-Government ICT services provider and the cost associated with delivering upon the IDES program.
Major variations between 2009-10 Budget and 2010-11 Estimate include: 6. The increase is due to additional volumes for whole-of-Government ICT services (including IDES and ICTC). 7. The increase is due to enterprise bargaining and additional resource requirements to deliver whole-of-Government ICT
services. 8. The increase is due to service delivery expenditure necessary to support additional volume for whole-of-Government
services (including IDES and ICTC). 9. The increase is mainly due to the depreciation impact of asset acquisitions for the IDES and ICTC programs. 10. The increased deficit is a result of the winding back of services to Commercial clients, deferral of Queensland Government
ICT discretionary projects, the costs of transitioning CITEC to a whole-of-Government ICT services provider and the cost associated with delivering on the IDES program.
Major variations between 2009-10 Estimated actual and the 2010-11 Estimate include: 11. The increase is due to additional volumes for whole-of-Government ICT services (including IDES and ICTC). 12. The increase is due to enterprise bargaining and additional resource requirements to deliver whole-of-Government ICT
services. 13. The increase is due to service delivery expenditure necessary to support additional volume for whole-of-Government
services (including IDES and ICTC). 14. The increase is mainly due to the depreciation impact of asset acquisitions for the IDES and ICTC programs. 15. The increased deficit is a result of the winding back of services to Commercial clients, deferral of the Queensland
Government ICT discretionary projects, the costs of transitioning CITEC to a whole-of-Government ICT services provider and the cost associated with delivering on the IDES program.
Statement of changes in equity Major variations between 2009-10 Budget and 2009-10 Estimated actual include: 16. The increased deficit is a result of the winding back of services to Commercial clients, deferral of Queensland Government
ICT discretionary projects, costs of transitioning CITEC to a whole-of-Government ICT services provider and the cost associated with delivering upon the IDES program.
17. The increase is due to an equity injection to support CITEC’s operations in transitioning to a whole-of-Government ICT services provider offset by a reduction in equity injections due to the timing of principal payments made in respect to the ICTC loan facility.
Major variations between 2009-10 Budget and 2010-11 Estimate include: 18. The increased deficit is a result of the winding back of services to Commercial clients, deferral of Queensland Government
ICT discretionary projects, costs of transitioning CITEC to a whole-of-Government ICT services provider and the cost associated with delivering on the IDES program.
19. The increase is due to the timing of principal payments made in respect to the ICTC loan facility and funding for GovNet capital acquisitions.
Major variations between 2009-10 Estimated actual and the 2010-11 Estimate include: 20. The increased deficit is a result of the winding back of services to Commercial clients, deferral of the Queensland
Government ICT discretionary projects, costs of transitioning CITEC to a whole-of-Government ICT services provider and the cost associated with delivering upon the IDES program.
21. The decrease is due to an equity injection to support CITEC’s operations in transitioning to a whole-of-Government ICT services provider received in 2009-10 offset by an increase in equity injections due to the timing of principal payments made in respect to the ICTC loan facility and funding for GovNet capital acquisitions.
Balance sheet Major variations between 2009-10 Budget and 2009-10 Estimated actual include: 22. The increase is due to the cash impact of the payment and part utilisation of the equity injection to support CITEC’s
operations in transitioning to a whole-of-Government ICT services provider. 23. The increase is due to higher prepayments of supplies and services associated with the IDES Program. 24. The increase is due to the higher deficit and corresponding carried forward tax losses. 25. The increase is mainly due to additional asset acquisitions for the IDES and ICTC programs. 26. The increase is due to the impact of service delivery expenditure for additional volume for whole-of-Government ICT
services. 27. The increase is due to loan draw downs for the IDES and ICTC programs.

2010-11 Queensland State Budget - Service Delivery Statements – CITEC 2-208
28. The increase is due to an equity injection to support CITEC’s operations in transitioning to a whole-of-Government ICT services provider offset by a reduction in equity injections due to the timing of principal payments made in respect to the ICTC loan facility.
29. The decrease is due to the higher operating deficit as a result of the winding back of services to Commercial clients, deferral of Queensland Government ICT discretionary projects, costs of transitioning CITEC to a whole-of-Government ICT services provider and the cost associated with delivering upon the IDES program.
Major variations between 2009-10 Budget and 2010-11 Estimate include: 30. The increase is due to the cash impact of the payment and utilisation of the equity injection to support CITEC’s operations
in transitioning to a whole-of-Government ICT services provider. 31. The increase is due to additional volumes for whole-of-Government ICT services (including IDES and ICTC). 32. The increase is due to higher prepayments of supplies and services associated with the IDES Program. 33. The increase is mainly due to asset acquisitions for the IDES, ICTC and GovNet programs. 34. The increase is due to the higher deficit and corresponding carried forward tax losses. 35. The increase is due to the impact of service delivery expenditure for additional volume for whole-of-Government ICT
services. 36. The increase is due to loan draw downs for the IDES and ICTC programs. 37. The increase is due to the impact of the equity injection to support CITEC’s operations in transition to whole-of-
Government ICT services provider and funding for principal payments made in respect to the ICTC loan facility and GovNet capital acquisitions.
38. The decrease is due to the higher operating deficit as a result of the winding back of services to Commercial clients, deferral of Queensland Government ICT discretionary projects costs of transitioning CITEC to a whole-of-Government ICT services provider and the cost associated with delivering on the IDES program.
Major variations between 2009-10 Estimated actual and the 2010-11 Estimate include: 39. The decrease is due to the cash impact of the utilisation of the equity injection to support CITEC’s operations in
transitioning to a whole-of-Government ICT service provider. 40. The increase is due to additional volumes for whole-of-Government ICT services (including IDES and ICTC). 41. The increase is mainly due to asset acquisitions for the IDES and ICTC programs. 42. The increase is due to the higher deficit and corresponding carried forward tax losses. 43. The increase is due to the impact of service delivery expenditure for additional volume for whole-of-Government ICT
services. 44. The increase is due to loan draw downs for the IDES and ICTC programs. 45. The increase is due to the timing of principal payments made in respect to the ICTC loan facility and funding for GovNet
capital acquisitions. 46. The decrease is due to the higher operating deficit as a result of the winding back of services to Commercial clients,
deferral of Queensland Government ICT discretionary projects and the costs of transitioning CITEC to a whole-of-Government ICT services provider and the cost associated with delivering upon the IDES program.
Cash flow statement Major variations between 2009-10 Budget and 2009-10 Estimated actual include: 47. The decrease is mainly due to the winding back of services to Commercial clients and reduced IDES revenue as a result
of changes to the timing of program delivery. 48. The increase is due to additional resource requirements necessary to transition CITEC to a whole-of-Government ICT
services provider (including IDES and ICTC). 49. The increase is mainly due to asset acquisitions for the IDES and ICTC programs. 50. The increase is mainly due to asset acquisitions for the IDES and ICTC programs. 51. The increase is due to an equity injection to support CITEC’s operations in transitioning to a whole-of-Government ICT
services provider offset by the timing of principal payments made in respect to the ICTC loan facility. 52. The decrease is due to the timing of principal payments made in respect to the ICTC loan facility. Major variations between 2009-10 Budget and 2010-11 Estimate include: 53. The increase is due to additional volumes for whole-of-Government ICT services (including IDES and ICTC). 54. The increase is due to enterprise bargaining and additional resource requirements to deliver whole-of-Government ICT
services. 55. The increase is due to service delivery expenditure necessary to support additional volume for whole-of-Government
services (including IDES and ICTC). 56. The decrease reflects initial foundation asset acquisitions made in 2009-10 in respect to IDES and ICTC programs which
were of a non recurring nature. 57. The decrease is due to the borrowings made in 2009-10 in respect to the IDES and ICTC programs. Major variations between 2009-10 Estimated actual and the 2010-11 Estimate include: 58. The increase is due to additional volumes for whole-of-Government ICT services (including IDES and ICTC). 59. The increase is due to enterprise bargaining and additional resource requirements to deliver whole-of-Government ICT
services. 60. The increase is due to service delivery expenditure necessary to support additional volume for whole-of-Government
services (including IDES and ICTC). 61. The decrease reflects initial foundation asset acquisitions made in 2009-10 in respect to IDES and ICTC programs which
were of a non recurring nature. 62. The decrease is due to the borrowings made in 2009-10 in respect to the IDES and ICTC programs. 63. The decrease is due to an equity injection to support CITEC’s operations in transitioning to a whole-of-Government ICT
services provider received in 2009-10 offset by the timing of principal payments made in respect to the ICTC loan facility and funding for Govnet capital acquisitions.
64. The increase is due to the timing of principal payments made in respect to the ICTC loan facility.
2010-11 Queensland State Budget - Service Delivery Statements – Goprint 2-209
Goprint OVERVIEW Goprint, the Government printer for over 140 years, provides a range of print products and related services to Queensland Government agencies. It was the first printer in Queensland to gain Environmental Management Systems certification. This certification along with new environmentally friendly press technologies ensures Goprint products are produced in the most environmentally sustainable way and with minimal environmental impact. Goprint has primary responsibility for the production of reserved service documents for the Queensland Government. It is an accredited supplier to the new Print Management Unit, which will manage all Government print work with the exception of reserved services. The key factors and challenges impacting on Goprint include: � the need to obtain the right type and volume of work to ensure its production capacity is
sufficiently utilised � the increasing demand for electronic and web-based documents � restructuring to meet the changing demands and requirements within the print industry � reducing overhead costs to remain competitive.
REVIEW OF PERFORMANCE
Recent achievements Goprint’s recent achievements include:
� on time delivery of more than 2,500 jobs of a secure and confidential nature for Queensland Parliament and Executive Government including the State Budget, Bills, Acts as Passed, Hansard, Gazettes and Reprint series (reserved services)
� continuing work and improvements in the environmental area. Goprint is accredited to national environmental standards (ISO14001 Environmental Accreditation) and was the first printer in Queensland with this accreditation
� developing and implementing a Lean Manufacturing Program delivering a reduction in paper waste of 27% per annum
� establishing an ecoBiz eco-efficiency partnership with the Department of Environment and Resource Management, which provides improved management of energy, water and material resources through a six step on-site assessment program
� working with unions and staff to complete the restructure process as prescribed by Executive Government
� successfully delivering the requirements of Regional Parliament (sitting outside of Brisbane) including Bills, Hansard, tabled reports and Notice Papers.
Future developments In the future Goprint will: � continue to deliver mandated reserved services and print products to a high standard � refine business models and structures to improve service delivery and cost effectiveness � increase public sector awareness of its services and capabilities, especially in relation to
reserved services.
2010-11 Queensland State Budget - Service Delivery Statements – Goprint 2-210
STATEMENTS
PERFORMANCE STATEMENT Service standards
Notes2009-10
Target/est.2009-10
Est. actual 2010-11
Target/est.
Financial performance measures Gross Profit as a % of Sales Current Ratio
Non-financial performance measures Spoilage as a % of Sales On Time Deliveries for Reserved Services Utilisation of Core Equipment and Resources
1,2
3
4,5
28.08%
3.1:1
0.5%
100%
80%
23.16%
2.7:1
0.41%
100%
63%
25.85%
2.9:1
0.5%
100%
80%
Notes: 1. The decrease in the 2009-10 Estimated actual from the 2009-10 Target/estimate primarily relates to the timing of the
implementation of the Print Management Unit (PMU) and reduced spending on print within agencies. 2. The increase in the 2010-11 Target/estimate from the 2009-10 Estimated actual primarily relates to current market
trends and anticipated workflows through the PMU. 3. The decrease in the 2009-10 Estimated actual from the 2009-10 Target/estimate reflects the loss incurred in 2009-10. 4. The decrease in the 2009-10 Estimated actual from the 2009-10 Target/estimate was influenced by the economic
downturn and an overall reduction in print spend within the market, as well as the timing of the anticipated roll-out of the PMU.
5. The increase in the 2010-11 Target/estimate from the 2009-10 Estimated actual is due to the anticipated full implementation of the PMU within government departments throughout 2010-11, which will provide an increased opportunity for quoting on government work.
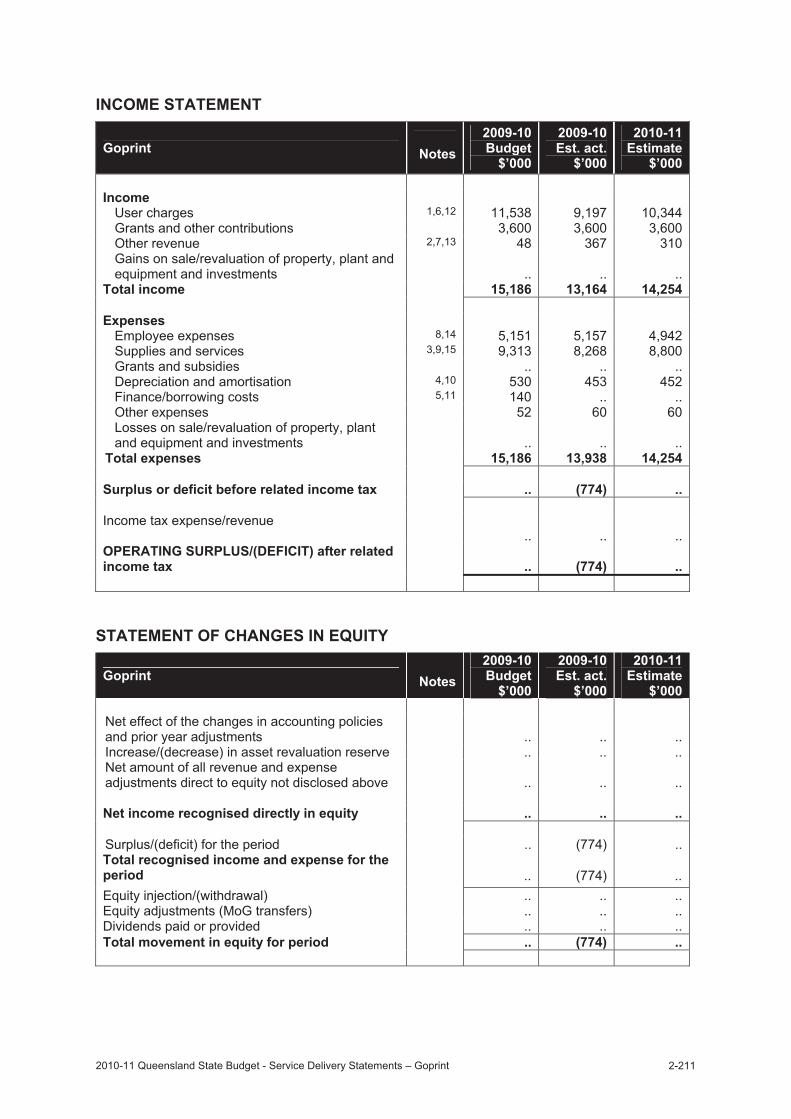
2010-11 Queensland State Budget - Service Delivery Statements – Goprint 2-211
INCOME STATEMENT
Goprint Notes2009-10Budget
$’000
2009-10 Est. act.
$’000
2010-11Estimate
$’000 Income
User charges 1,6,12 11,538 9,197 10,344Grants and other contributions 3,600 3,600 3,600Other revenue 2,7,13 48 367 310Gains on sale/revaluation of property, plant and equipment and investments
..
.. ..Total income 15,186 13,164 14,254 Expenses
Employee expenses 8,14 5,151 5,157 4,942Supplies and services 3,9,15 9,313 8,268 8,800Grants and subsidies .. .. ..Depreciation and amortisation 4,10 530 453 452Finance/borrowing costs 5,11 140 .. ..Other expenses 52 60 60Losses on sale/revaluation of property, plant and equipment and investments ..
.. ..
Total expenses 15,186 13,938 14,254 Surplus or deficit before related income tax .. (774) .. Income tax expense/revenue ..
.. ..
OPERATING SURPLUS/(DEFICIT) after related income tax .. (774) ..
STATEMENT OF CHANGES IN EQUITY
Goprint Notes2009-10Budget
$’000
2009-10 Est. act.
$’000
2010-11Estimate
$’000
Net effect of the changes in accounting policies and prior year adjustments .. .. ..Increase/(decrease) in asset revaluation reserve .. .. ..Net amount of all revenue and expense adjustments direct to equity not disclosed above .. .. .. Net income recognised directly in equity .. .. .. Surplus/(deficit) for the period .. (774) ..Total recognised income and expense for the period .. (774) ..Equity injection/(withdrawal) .. .. ..Equity adjustments (MoG transfers) .. .. ..Dividends paid or provided .. .. ..Total movement in equity for period .. (774) ..

2010-11 Queensland State Budget - Service Delivery Statements – Goprint 2-212
BALANCE SHEET
Goprint Notes2009-10Budget
$’000
2009-10 Est. act.
$’000
2010-11Estimate
$’000 CURRENT ASSETS
Cash assets 16,24,30 3,186 2,610 2,706Receivables 17,31 1,450 1,049 1,470Other financial assets .. .. ..Inventories 440 440 440Other 130 130 130Non-financial assets held for sale .. .. ..
Total current assets 5,206 4,229 4,746 NON-CURRENT ASSETS
Receivables .. .. ..Other financial assets .. .. ..Property, plant and equipment 18,25,32 2,982 3,094 2,642Deferred tax assets .. .. ..Intangibles .. .. ..Other .. .. ..
Total non-current assets 2,982 3,094 2,642 TOTAL ASSETS 8,188 7,323 7,388 CURRENT LIABILITIES
Payables 19,26 1,109 1,008 1,029Interest-bearing liabilities and derivatives .. .. ..Current tax liabilities .. .. ..Accrued employee benefits 20,33 231 197 241Provisions .. .. ..Other 350 350 350
Total current liabilities 1,690 1,555 1,620 NON-CURRENT LIABILITIES
Payables .. .. ..Interest-bearing liabilities and derivatives 21,27 2,256 .. ..Deferred tax liabilities .. .. ..Accrued employee benefits .. .. ..Provisions .. .. ..Other .. .. ..
Total non-current liabilities 2,256 .. .. TOTAL LIABILITIES 3,946 1,555 1,620 NET ASSETS/(LIABILITIES) 4,242 5,768 5,768 EQUITY
Capital/contributed equity 22,28 12,585 14,885 14,885Retained surplus/(accumulated deficit) 23,29 (8,343) (9,117) (9,117)Reserves:
- Asset revaluation reserve .. .. ..- Other (specify) .. .. ..
TOTAL EQUITY 4,242 5,768 5,768

2010-11 Queensland State Budget - Service Delivery Statements – Goprint 2-213
CASH FLOW STATEMENT
Goprint Notes2009-10Budget
$’000
2009-10 Est. act.
$’000
2010-11Estimate
$’000 CASH FLOWS FROM OPERATING ACTIVITIES
Inflows: User charges 34,42,50 13,039 10,337 11,274Grants and other contributions 35,43,51 3,918 3,749 3,288Other 36,44 933 1,136 1,148
Outflows: Employee costs 37,45,52 (5,216) (4,945) (4,898)Supplies and services 38,46,53 (10,283) (8,966) (9,612)Grants and subsidies .. .. ..Borrowing costs 39,47 (140) .. ..Taxation equivalents paid .. .. ..Other 40,48,54 (1,223) (993) (1,104)
Net cash provided by/(used in) operating activities 1,028 318 96 CASH FLOWS FROM INVESTING ACTIVITIES
Inflows: Sales of property, plant and equipment .. .. ..Investments redeemed .. .. ..Loans and advances redeemed .. .. ..
Outflows: Payments for property, plant and equipment and intangibles .. (15) ..Payments for investments .. .. ..Loans and advances made .. .. ..
Net cash provided by/(used in) investing activities .. (15) .. CASH FLOWS FROM FINANCING ACTIVITIES
Inflows: Borrowings .. .. ..Equity injections .. .. ..
Outflows: Dividends paid .. .. ..Borrowing redemptions .. .. ..Finance lease payments .. .. ..Equity withdrawals .. .. ..
Net cash provided by/(used in) financing activities .. .. ..
Net increase/(decrease) in cash held 1,028 303 96 Cash at the beginning of financial year 41,49 2,158 2,307 2,610 Cash transfers from restructure .. .. ..Cash at the end of financial year 3,186 2,610 2,706

2010-11 Queensland State Budget - Service Delivery Statements – Goprint 2-214
EXPLANATION OF VARIANCES IN THE FINANCIAL STATEMENTS
Income statement Major variations between 2009-10 Budget and 2009-10 Estimated actual include: 1. The decrease is due to the timing of the implementation of the Print Management Unit (PMU) and reduced spending on
print within departments. 2. The increase is due to unbudgeted cost recoveries and increased interest receipts. 3. The decrease is due to lower cost of sales resulting from the reduced sales. 4. The decrease is due to assets reaching the end of their useful lives in the asset register. 5. The decrease is due to the Queensland Treasury Corporation (QTC) loan being paid out in full in June 2009. Major variations between 2009-10 Budget and 2010-11 Estimate include: 6. The decrease is due to the timing of the implementation of the PMU and reduced spending on print within departments. 7. The increase is due to greater cost recoveries and interest receipts. 8. The decrease is due to a reduced establishment resulting from the restructure of Goprint's operations partially offset by an
enterprise bargaining increase. 9. The decrease is due to lower cost of sales resulting from the reduced sales. 10. The decrease is due to assets reaching the end of their useful lives in the asset register. 11. The decrease is due to the QTC loan being paid out in full in June 2009. Major variations between 2009-10 Estimated actual and the 2010-11 Estimate include: 12. The increase is due to current market trends and anticipated workflows through the PMU. 13. The decrease is due lower cost recoveries and interest receipts. 14. The decrease is due to a reduced establishment resulting from the restructure of Goprint's operations partially offset by an
enterprise bargaining increase. 15. The increase is due to higher cost of sales resulting from the increased sales.
Balance sheet Major variations between 2009-10 Budget and 2009-10 Estimated actual include: 16. The decrease is due to the loss incurred in 2009-10. 17. The decrease is due to lower monthly sales in the last quarter of 2009-10. 18. The increase is due to lower than anticipated depreciation resulting from assets reaching the end of their useful lives in the
asset register. 19. The decrease is due to reduced cost of sales outstanding in 2009-10. 20. The decrease is due to a lower than anticipated salaries and wages accrual at 30 June 2010. 21. The decrease is due to the QTC loan being paid out in full in June 2009. 22. The increase is due to the equity injection received from the Consolidated Fund to extinguish the long term loan. 23. The increased accumulated deficit is due to the loss incurred in 2009-10. Major variations between 2009-10 Budget and 2010-11 Estimate include: 24. The decrease is due to the loss incurred in 2009-10. 25. The decrease is due to depreciation of the asset base being greater than the estimated additions to the asset base. 26. The decrease is due to reduced cost of sales outstanding in 2010-11. 27. The decrease is due to the QTC loan being paid out in full in June 2009. 28. The increase is due to the equity injection received from the Consolidated Fund to extinguish the long term loan. 29. The increased accumulated deficit is due to the loss incurred in 2009-10. Major variations between 2009-10 Estimated actual and the 2010-11 Estimate include: 30. The increase is predominantly due to decreased employee related expenditures. 31. The increase is due to community service obligation grants receivable at the end of 2010-11. 32. The decrease is due to depreciation of the asset base being greater than the estimated additions to the asset base. 33. The increase is due to a higher anticipated salaries and wages accrual at 30 June 2011.
Cash flow statement Major variations between 2009-10 Budget and 2009-10 Estimated actual include: 34. The decrease is due to the timing of the implementation of the Print Management Unit and reduced spending on print
within departments. 35. The decrease is due to lower community service obligation grants receivable at 30 June 2009. 36. The increase is due to unbudgeted cost recoveries and increased interest receipts. 37. The decrease is due to a lower than anticipated salaries and wages accrual at 30 June 2010. 38. The decrease is due to lower cost of sales resulting from the reduced sales. 39. The decrease is due to the QTC loan being paid out in full in June 2009. 40. The decrease is due to lower GST reimbursements from the Australian Taxation Office (ATO) due to the lower cost of
supplies and services. 41. The increase is due to a lower than anticipated loss in June 2009. Major variations between 2009-10 Budget and 2010-11 Estimate include: 42. The decrease is due to the timing of the implementation of the PMU and reduced spending on print within departments. 43. The decrease is due to lower community service obligation grants receivable at 30 June 2010. 44. The increase is due greater cost recoveries and interest receipts. 45. The decrease is due to a reduced establishment resulting from the restructure of Goprint's operations partially offset by an
enterprise bargaining increase.

2010-11 Queensland State Budget - Service Delivery Statements – Goprint 2-215
46. The decrease is due to lower cost of sales resulting from the reduced sales. 47. The decrease is due to the QTC loan being paid out in full in June 2009. 48. The decrease is due to lower GST reimbursements from the ATO due to the lower cost of supplies and services. 49. The increase is due to a higher closing cash balance in June 2010. Major variations between 2009-10 Estimated actual and the 2010-11 Estimate include: 50. The increase is due to current market trends and anticipated workflows through the PMU. 51. The decrease is due to a higher community service obligation grant receivable at 30 June 2011. 52. The decrease is due to a reduced establishment resulting from the restructure of Goprint's operations partially offset by an
enterprise bargaining increase. 53. The increase is due to higher cost of sales resulting from the increased sales. 54. The increase is due to higher GST reimbursements from the ATO due to higher cost of supplies and services.

2010-11 Queensland State Budget - Service Delivery Statements – SDS (Sales and Distribution Services) 2-216
SDS (Sales and Distribution Services) OVERVIEW Sales and Distribution Services (SDS) provides supply management services and advice to support Queensland Government agency operations and service delivery. SDS operates three distinct service streams – SDS Distribution, SDS Publications and SDS Logistics. SDS Distribution is an online retail and distribution business trading educational, office, furniture and other agency specific products to schools and government agencies throughout Queensland. SDS Publications is an online retail and distribution business which manages electronic and printed publications on behalf of government agencies. SDS Logistics provides cost-effective warehousing and distribution services to government agencies. The key factors and challenges impacting on SDS include: � enhancing agency awareness of the significance of supply chain management in reducing
costs � continuing to improve the performance and cost management of all SDS’ operations � leveraging relationships with suppliers and customers to reduce the Government’s
environmental footprint relating to supply management � maintaining staff morale, skills and commitment through targeted workforce management
strategies � enhancing the value of SDS to agencies, including recognising SDS’ contribution to
government service delivery and savings strategies.
REVIEW OF PERFORMANCE
Recent achievements SDS’s recent achievements include: � developing further its position as a key supply partner to the department’s disaster
recovery efforts, recently assisting with the Shen Neng 1 Great Barrier Reef spill incident, tropical Cyclone Ului and the Charleville floods
� attaining 9.9% year-to-date sales growth across SDS’ three business divisions � attaining 40% growth in furniture sales as a result of SDS’ participation in the Building
the Education Revolution rollout, delivering interactive whiteboards to state schools across Queensland
� improving technology and shift management throughout the peak delivery period to reduce warehouse agency staff costs
� containing freight costs to a 1.7% increase despite a 6% increase in Cost of Goods Sold, ensuring efficient management of SDS’ 200,000 annual deliveries
� achieving $2.1 million in total savings to the public sector market following the introduction of the highly competitive Government Preferred Product List in General Merchandise
� conducting extensive business re-engineering to ensure a streamlined supply chain management solution including: - developing a new pricing model for SDS’ Publication Distribution Centre within
SDS Publications; - integrating duplicated functions within SDS; and - developing a new, transparent model for furniture acquisition, consolidation and
delivery.

2010-11 Queensland State Budget - Service Delivery Statements – SDS (Sales and Distribution Services) 2-217
Future developments
In the future, SDS will: � relocate the publications warehouse from Woolloongabba to Zillmere to reduce the
number of warehouses from three to two � re-engineer the Zillmere and Brendale warehouses to enhance the overall efficiency of
SDS’ warehouse operations � roll out the proposed supply model for furniture to the education sector � roll out the new pricing model for SDS Publications � develop a new supply model for SDS’ General Merchandise division � launch a communications campaign to enhance agency awareness of the significance of
supply chain management in delivering improved outcomes � implement a targeted business development campaign to engage major community
service agencies to utilise SDS’ full spectrum of supply management solutions.

2010-11 Queensland State Budget - Service Delivery Statements – SDS (Sales and Distribution Services) 2-218
STATEMENTS
PERFORMANCE STATEMENT Service standards
Notes2009-10
Target/est.2009-10
Est. actual 2010-11
Target/est.
Financial performance measures Gross Profit as a % of Sales Net profit as a % of sales (before tax) Improvement in Sales %
Non-financial performance measures Brendale warehouse asset utilisation Inventory turnover - General Merchandise - Furniture
1,2
3,4
31.7%
(1.54)%
1.0%
>90%
7.5 5
27.3%
(0.26)%
2.3%
>90%
8 6
28.6%
0.09%
(6.4)%
>90%
8 7
Notes: 1. The increase in the 2009-10 Estimated actual from the 2009-10 Target/estimate primarily relates to a number of direct
supplier to customer shipment initiatives undertaken at lower than average gross profit margins, which reduces direct costs associated with warehousing and despatch of inventory.
2. The increase in the 2010-11 Target/estimate from the 2009-10 Estimated actual relates to the sales mix used, which is expected to produce improved gross margin and also a decrease in fixed costs for 2010-11.
3. The increase in the 2009-10 Estimated actual from the 2009-10 Target/estimate primarily relates to the distribution of Interactive Whiteboards and other promotional products to various client agencies.
4. The decrease in the 2010-11 Target/estimate from the 2009-10 Estimated actual relates to discontinuation in 2010-11 of the initiatives referred to in Note 3.

2010-11 Queensland State Budget - Service Delivery Statements – SDS (Sales and Distribution Services) 2-219
INCOME STATEMENT
SDS (Sales and Distribution Services) Notes2009-10Budget
$’000
2009-10 Est. act.
$’000
2010-11Estimate
$’000 Income
User charges 1,7 63,946 66,502 62,230Grants and other contributions .. .. ..Other revenue 5 1,100 1,912 1,959Gains on sale/revaluation of property, plant and equipment and investments
..
.. ..Total income 65,046 68,414 64,189 Expenses
Employee expenses 2 9,030 8,507 8,847Supplies and services 1,8 55,663 59,335 54,527Grants and subsidies .. .. ..Depreciation and amortisation 379 343 342Finance/borrowing costs 3 357 256 260Other expenses 4,6 602 147 160Losses on sale/revaluation of property, plant and equipment and investments ..
.. ..
Total expenses 66,031 68,588 64,136 Surplus or deficit before related income tax (985) (174) 53 Income tax expense/revenue ..
.. 16
OPERATING SURPLUS/(DEFICIT) after related income tax (985) (174) 37
STATEMENT OF CHANGES IN EQUITY
SDS (Sales and Distribution Services) Notes2009-10Budget
$’000
2009-10 Est. act.
$’000
2010-11Estimate
$’000
Net effect of the changes in accounting policies and prior year adjustments .. .. ..Increase/(decrease) in asset revaluation reserve .. .. ..Net amount of all revenue and expense adjustments direct to equity not disclosed above .. .. .. Net income recognised directly in equity .. .. .. Surplus/(deficit) for the period (985) (174) 37Total recognised income and expense for the period (985) (174) 37Equity injection/(withdrawal) .. .. ..Equity adjustments (MoG transfers) .. .. ..Dividends paid or provided .. .. (18)Total movement in equity for period (985) (174) 19

2010-11 Queensland State Budget - Service Delivery Statements – SDS (Sales and Distribution Services) 2-220
BALANCE SHEET
SDS (Sales and Distribution Services) Notes 2009-10Budget
$’000
2009-10 Est. act.
$’000
2010-11Estimate
$’000 CURRENT ASSETS
Cash assets 450 450 450Receivables 9,14 5,000 7,000 6,875Other financial assets .. .. ..Inventories 15 6,500 6,000 6,100Other 10,16 150 295 295Non-financial assets held for sale .. .. ..
Total current assets 12,100 13,745 13,720 NON-CURRENT ASSETS
Receivables .. .. ..Other financial assets .. .. ..Property, plant and equipment 20 363 363 509Deferred tax assets 347 347 347Intangibles 823 823 750Other .. .. ..
Total non-current assets 1,533 1,533 1,606 TOTAL ASSETS 13,633 15,278 15,326 CURRENT LIABILITIES
Payables 11,17 6,598 5,917 5,946Interest-bearing liabilities and derivatives 12,18 4,500 5,500 5,500Current tax liabilities .. .. ..Accrued employee benefits 160 160 160Provisions .. .. ..Other 570 320 320
Total current liabilities 11,828 11,897 11,926 NON-CURRENT LIABILITIES
Payables .. .. ..Interest-bearing liabilities and derivatives .. .. ..Deferred tax liabilities .. .. ..Accrued employee benefits .. .. ..Provisions .. .. ..Other .. .. ..
Total non-current liabilities .. .. .. TOTAL LIABILITIES 11,828 11,897 11,926 NET ASSETS/(LIABILITIES) 1,805 3,381 3,400 EQUITY
Capital/contributed equity 13,19 4,950 5,974 5,974Retained surplus/(accumulated deficit) (3,145) (2,593) (2,574)Reserves:
- Asset revaluation reserve .. .. ..- Other (specify) .. .. ..
TOTAL EQUITY 1,805 3,381 3,400

2010-11 Queensland State Budget - Service Delivery Statements – SDS (Sales and Distribution Services) 2-221
CASH FLOW STATEMENT
SDS (Sales and Distribution Services) Notes 2009-10Budget
$’000
2009-10 Est. act.
$’000
2010-11Estimate
$’000 CASH FLOWS FROM OPERATING ACTIVITIES
Inflows: User charges 21,26,30 72,597 71,478 68,539Grants and other contributions .. .. ..Other 22 6,055 6,858 6,506
Outflows: Employee costs (9,028) (8,608) (8,847)Supplies and services 23,27,31 (61,135) (63,743) (59,230)Grants and subsidies .. .. ..Borrowing costs (357) (256) (260)Taxation equivalents paid (74) .. ..Other (6,985) (6,793) (6,418)
Net cash provided by/(used in) operating activities 1,073 (1,064) 290 CASH FLOWS FROM INVESTING ACTIVITIES
Inflows: Sales of property, plant and equipment .. .. ..Investments redeemed .. .. ..Loans and advances redeemed .. .. ..
Outflows: Payments for property, plant and equipment and intangibles (300) (428) (290)Payments for investments .. .. ..Loans and advances made .. .. ..
Net cash provided by/(used in) investing activities (300) (428) (290) CASH FLOWS FROM FINANCING ACTIVITIES
Inflows: Borrowings 24,28 5,000 15,650 12,000Equity injections .. .. ..
Outflows: Dividends paid (88) .. ..Borrowing redemptions 25,29 (5,661) (14,250) (12,000)Finance lease payments .. .. ..Equity withdrawals .. .. ..
Net cash provided by/(used in) financing activities (749) 1,400 ..
Net increase/(decrease) in cash held 24 (92) .. Cash at the beginning of financial year 426 542 450 Cash transfers from restructure .. .. ..Cash at the end of financial year 450 450 450

2010-11 Queensland State Budget - Service Delivery Statements – SDS (Sales and Distribution Services) 2-222
EXPLANATION OF VARIANCES IN THE FINANCIAL STATEMENTS
Income statement Major variations between 2009-10 Budget and 2009-10 Estimated actual include: 1. The variance is due to direct ship initiatives introduced in 2009-10 in the furniture stream resulting in additional sales. 2. The variance relates to a number of positions not being filled in 2009-10. 3. The decrease is attributable to the effective management of the working capital facility. 4. The decrease is due to the anticipated assessment of net realisable value on the preparatory year stock in 2008-09. This
however was no longer necessary due to successful strategies to minimise the stock. Major variations between 2009-10 Budget and 2010-11 Estimate include: 5. The increase is due to rent supplementation from the Consolidated Fund. 6. The anticipated assessment of net realisable value on the preparatory year stock in 2009-10 did not occur due to
successful strategies to minimise the stock. Major variations between 2009-10 Estimated actual and the 2010-11 Estimate include: 7. The reduction primarily relates to a number of one-off initiatives undertaken in 2009-10 that are not anticipated to continue
in 2010-11. 8. The decrease is primarily related to the reduction in cost of sales associated with the reduction in sales.
Balance sheet Major variations between 2009-10 Budget and 2009-10 Estimated actual include: 9. The increase is due to large client capital projects. 10. The increase is due to an increase in prepaid expenses. 11. The decrease is a consequence of more efficient management of creditors during 2009-10. 12. Business strategies undertaken during the year have required an increase in balance to the working capital facility to fund
stock purchases. 13. The increase is due to an equity injection received from the Consolidated Fund in 2009-10. Major variations between 2009-10 Budget and 2010-11 Estimate include: 14. The increase is mainly due to large client capital projects. 15. The decrease in inventory is due to implementation of direct ship initiatives. 16. The increase is due to an increase in prepaid expenses. 17. The decrease is mainly due to more efficient management of creditors during 2009-10 which has reduced payables. This
is partially offset by the recognition of the dividend payable to the Consolidated Fund. 18. Business strategies undertaken during year have required an increase in balance to the working capital facility to fund
stock purchases. 19. The increase is due to an equity injection received from the Consolidated Fund in 2009-10. Major variations between 2009-10 Estimated actual and the 2010-11 Estimate include: 20. The anticipated increase is due to property, plant and equipment requirements as a result of warehouse relocation and
restructure.
Cash flow statement Major variations between 2009-10 Budget and 2009-10 Estimated actual include: 21. The decrease is due to the anticipated increase to receivables. 22. The increase is due to the higher than anticipated GST credits on purchases to be received from the Australian Taxation
Office. 23. The increase is due to an increase in cost of sales. 24. The increase is due to borrowing requirements throughout the year. 25. The increase is due to borrowing redemptions throughout the year. Major variations between 2009-10 Budget and 2010-11 Estimate include: 26. The decrease is due to the lower than anticipated user charges. 27. The decrease is due to a reduction in the cost of sales. 28. The increase is due to borrowing requirements throughout the year. 29. The increase is due to borrowing redemptions throughout the year. Major variations between 2009-10 Estimated actual and the 2010-11 Estimate include: 30. The decrease is due to the lower than anticipated user charges owing to a number of one-off initiatives undertaken in
2009-10 that are not anticipated to continue in 2010-11. 31. The decrease is due to a reduction in the cost of sales.

2010-11 Queensland State Budget - Service Delivery Statements – Shared Service Agency 2-223
Shared Service Providers Shared Service Agency
OVERVIEW The Shared Service Agency (SSA) provides finance, procurement, human resource management, facilities management, and mail support services to around 80,000 public servants in 11 agencies and six statutory authorities. SSA’s delivery of back office services enables agencies to concentrate on their core business – providing essential services, such as policing, child protection, housing, ambulance services, environmental protection and delivering critical infrastructure for the State. The key factors and challenges impacting on the SSA include: � maintaining service delivery while realigning the organisational structure and how and
where services are delivered � implementing a contemporary business reform program aimed at improving customer
service and reducing costs � delivering agreed financial performance targets � maintaining an appropriately skilled and committed workforce.
REVIEW OF PERFORMANCE
Recent achievements SSA’s recent achievements include: � continuing to provide services to approximately 80,000 staff including processing
170,000 pays, 8,700 job applications, 4,200 appointments, 1,400 separations, payment of 330,000 invoice lines and raising 35,000 invoice lines on average per month
� ensuring around 3,500 carers of 6,700 children receive regular payments � providing an easier and more accessible process for the payment of higher duties for staff
in five versions of the human resource system � seamlessly migrating 2,300 staff into human resource systems for three different agencies
and finalising the transfer to one finance system for one of the more complex agencies to give effect to machinery-of-Government changes
� improving the internal controls supporting services to safeguard client agencies from potential theft, fraud or errors and to ensure greater administrative efficiency
� merging six mail rooms throughout Brisbane into one modern mail sorting facility serving nine agencies more efficiently and more cost-effectively
� designing a comprehensive technical training program to build the capability of SSA staff.
Future developments In the future, SSA will: � continue to work in collaboration with client agencies and with CorpTech to
progressively implement standard human resource and finance systems to reduce complexity and infrastructure costs
� consolidate and standardise processes and systems to provide more streamlined, cost-effective and timely services to clients and government

2010-11 Queensland State Budget - Service Delivery Statements – Shared Service Agency 2-224
� continue to refine the business model to better enable State-wide service delivery improvement and reduce the cost of services for client agencies
� design and implement strategies to foster a stronger performance-focused culture � implement robust performance measures to identify process improvement opportunities,
increase productivity and provide better performance information to clients.

2010-11 Queensland State Budget - Service Delivery Statements – Shared Service Agency 2-225
STATEMENTS
PERFORMANCE STATEMENT Service standards
Notes2009-10
Target/est.2009-10
Est. actual 2010-11
Target/est.
Financial performance measures Labour costs as a percentage of total expenses Current Ratio Non-financial performance measures Customer satisfaction with service delivery Targeted business reform projects delivered within agreed budget
1
2
58%
1.4:1
� 70%
Within 10% of budget
60%
1.8:1
N/A
Within 10% of budget
56%
2:1
� 70%
Within 10% of budget
Notes: 1. The increase in the 2009-10 Estimated actual from the 2009-10 Target/estimate is due to a reduction in actual and
forecast levels of unearned revenue. 2. The SSA did not conduct a major customer survey during 2009-10. This major survey and the rolling program of pulse
surveys, introduced to seek timelier customer feedback on major services, have been delayed due to the impact of machinery-of-Government changes on client agencies. The next major survey is expected to occur in 2011.

2010-11 Queensland State Budget - Service Delivery Statements – Shared Service Agency 2-226
INCOME STATEMENT
Shared Service Agency Notes2009-10Budget
$’000
2009-10 Est. act.
$’000
2010-11Estimate
$’000 Income
User charges 8 180,249 172,307 188,076Grants and other contributions 1,5,9 4,334 5,399 1,308Other revenue 2,6,10 98 258 196Gains on sale/revaluation of property, plant and equipment and investments
..
.. ..Total income 184,681 177,964 189,580 Expenses
Employee expenses 107,536 106,709 105,270Supplies and services 3,7,11 73,602 67,662 80,634Grants and subsidies .. .. ..Depreciation and amortisation 2,450 2,428 2,534Finance/borrowing costs .. .. ..Other expenses 4 1,093 1,165 1,142Losses on sale/revaluation of property, plant and equipment and investments ..
.. ..
Total expenses 184,681 177,964 189,580 OPERATING SURPLUS/(DEFICIT) .. .. ..
STATEMENT OF CHANGES IN EQUITY
Shared Service Agency Notes2009-10Budget
$’000
2009-10 Est. act.
$’000
2010-11Estimate
$’000
Net effect of the changes in accounting policies and prior year adjustments .. .. ..Increase/(decrease) in asset revaluation reserve .. .. ..Net amount of all revenue and expense adjustments direct to equity not disclosed above .. .. .. Net income recognised directly in equity .. .. .. Surplus/(deficit) for the period
..
.. ..Total recognised income and expense for the period .. .. ..Equity injection/(withdrawal) .. .. ..Equity adjustments (MoG transfers) .. .. ..Total movement in equity for period .. .. ..

2010-11 Queensland State Budget - Service Delivery Statements – Shared Service Agency 2-227
BALANCE SHEET
Shared Service Agency Notes2009-10Budget
$’000
2009-10 Est. act.
$’000
2010-11Estimate
$’000 CURRENT ASSETS
Cash assets 12,19,26 8,461 1,114 2,971Receivables 20,007 19,785 20,373Other financial assets .. .. ..Inventories 9 .. ..Other 13,20,27 64 896 510Non-financial assets held for sale .. .. ..
Total current assets 28,541 21,795 23,854 NON-CURRENT ASSETS
Receivables .. .. ..Other financial assets .. .. ..Property, plant and equipment 14,21,28 6,320 7,211 5,243Intangibles 15,22,29 960 856 525Other .. .. ..
Total non-current assets 7,280 8,067 5,768 TOTAL ASSETS 35,821 29,862 29,622 CURRENT LIABILITIES
Payables 9,416 9,439 9,532Accrued employee benefits 16,23,30 2,890 2,692 2,359Interest-bearing liabilities and derivatives .. .. ..Provisions .. .. ..Other 17,24 7,616 .. ..
Total current liabilities 19,922 12,131 11,891 NON-CURRENT LIABILITIES
Payables .. .. ..Accrued employee benefits .. .. ..Interest-bearing liabilities and derivatives .. .. ..Provisions .. .. ..Other .. .. ..
Total non-current liabilities .. .. .. TOTAL LIABILITIES 19,922 12,131 11,891 NET ASSETS/(LIABILITIES) 15,899 17,731 17,731 EQUITY
Capital/contributed equity 18,25 12,873 14,798 14,798Retained surplus/(accumulated deficit) 3,026 2,933 2,933Reserves:
- Asset revaluation reserve .. .. ..- Other (specify) .. .. ..
TOTAL EQUITY 15,899 17,731 17,731
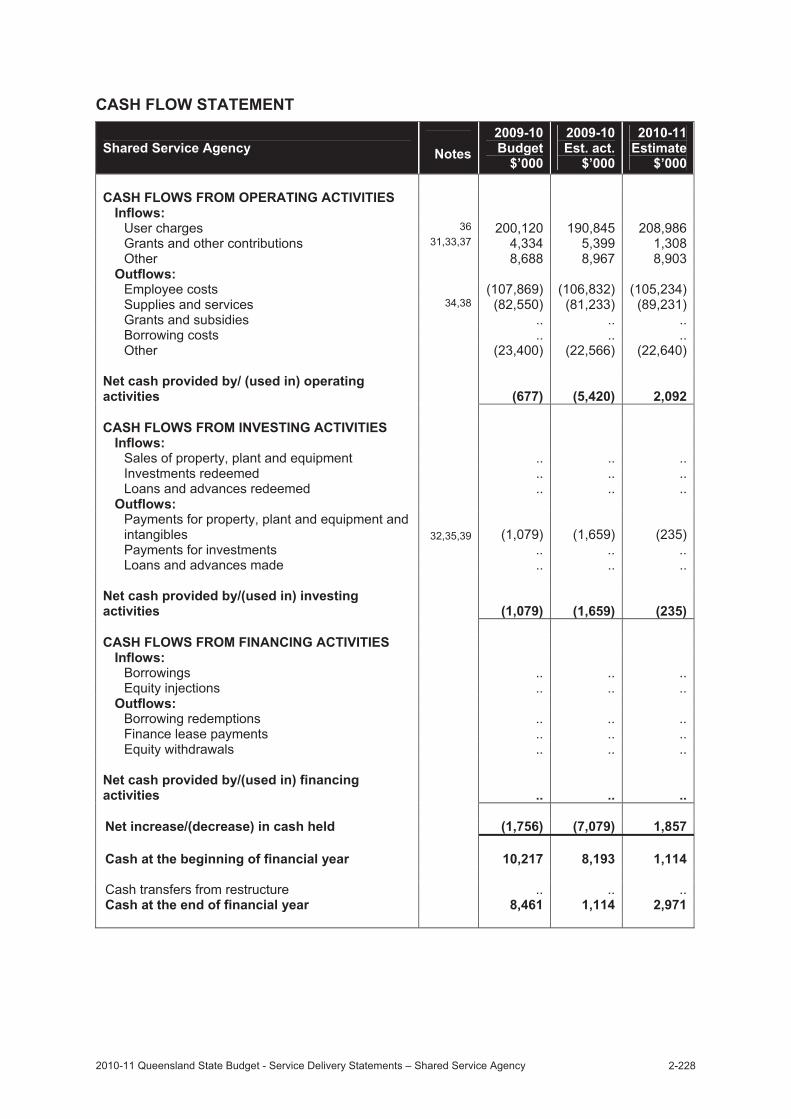
2010-11 Queensland State Budget - Service Delivery Statements – Shared Service Agency 2-228
CASH FLOW STATEMENT
Shared Service Agency Notes2009-10Budget
$’000
2009-10 Est. act.
$’000
2010-11Estimate
$’000 CASH FLOWS FROM OPERATING ACTIVITIES
Inflows: User charges 36 200,120 190,845 208,986Grants and other contributions 31,33,37 4,334 5,399 1,308Other 8,688 8,967 8,903
Outflows: Employee costs (107,869) (106,832) (105,234)Supplies and services 34,38 (82,550) (81,233) (89,231)Grants and subsidies .. .. ..Borrowing costs .. .. ..Other (23,400) (22,566) (22,640)
Net cash provided by/ (used in) operating activities (677) (5,420) 2,092 CASH FLOWS FROM INVESTING ACTIVITIES
Inflows: Sales of property, plant and equipment .. .. ..Investments redeemed .. .. ..Loans and advances redeemed .. .. ..
Outflows: Payments for property, plant and equipment and intangibles 32,35,39 (1,079) (1,659) (235)Payments for investments .. .. ..Loans and advances made .. .. ..
Net cash provided by/(used in) investing activities (1,079) (1,659) (235) CASH FLOWS FROM FINANCING ACTIVITIES
Inflows: Borrowings .. .. ..Equity injections .. .. ..
Outflows: Borrowing redemptions .. .. ..Finance lease payments .. .. ..Equity withdrawals .. .. ..
Net cash provided by/(used in) financing activities .. .. ..
Net increase/(decrease) in cash held (1,756) (7,079) 1,857 Cash at the beginning of financial year 10,217 8,193 1,114 Cash transfers from restructure .. .. ..Cash at the end of financial year 8,461 1,114 2,971

2010-11 Queensland State Budget - Service Delivery Statements – Shared Service Agency 2-229
EXPLANATION OF VARIANCES IN THE FINANCIAL STATEMENTS
Income statement Major variations between 2009-10 Budget and 2009-10 Estimated actual include: 1. The increase is due to a higher than forecast carry-over of funding for business improvement projects. 2. The increase is due to supplementation funding for increased accommodation costs. 3. The decrease is mainly due to a reduction in contractor costs as a result of reduced demand for services. 4. The increase mainly relates to higher audit costs. Major variations between 2009-10 Budget and 2010-11 Estimate include: 5. The decrease is due to a reduction in funding for business improvement projects. 6. The increase is due to supplementation funding for increased accommodation costs. 7. The increase is mainly due to higher third party provider costs. Major variations between 2009-10 Estimated actual and the 2010-11 Estimate include: 8. The increase in User charges is mainly due to cost increases associated with enterprise bargaining increases and higher
third party provider costs. 9. The decrease is due to a reduction in funding for business improvement projects. 10. The decrease is due to a forecast reduction in other revenue. 11. The increase is mainly due to higher third party provider costs.
Balance sheet Major variations between 2009-10 Budget and 2009-10 Estimated actual include: 12. The decrease is predominantly due to the billing for services changing from monthly in advance to monthly in arrears. 13. The increase is due to the recognition of prepaid salaries as at 30 June 2010. 14. The increase is due to the regional network upgrade. 15. The decrease is in line with a revised forecast of amortisation on intangibles. 16. The decrease is due to movements related to employee expenses. 17. The decrease is due to a reduction in unearned revenue. 18. The increase is mainly due to a capital injection in the prior financial year. Major variations between 2009-10 Budget and 2010-11 Estimate include: 19. The decrease is predominantly due to the billing for services changing from monthly in advance to monthly in arrears. 20. The increase is due to the recognition of prepaid salaries as at 30 June 2011. 21. The decrease is due to capital rationalisation and efficient capital management. 22. The decrease is in line with a revised forecast of amortisation on intangibles. 23. The decrease is due to movements related to employee expenses. 24. The decrease is due to a reduction in unearned revenue. 25. The increase is mainly due to a capital injection in the prior financial year. Major variations between 2009-10 Estimated actual and the 2010-11 Estimate include: 26. The increase is predominantly due to a reduction in capital expenditure. 27. The decrease is due to a reduction to prepaid salaries as at 30 June 2011. 28. The decrease is due to capital rationalisation and efficient capital management. 29. The decrease is in line with a revised forecast of amortisation on intangibles. 30. The decrease is due to movements related to employee expenses.
Cash flow statement Major variations between 2009-10 Budget and 2009-10 Estimated actual include: 31. The increase is due to a higher than forecast carry-over of funding for business improvement projects. 32. The increase is due to the regional network upgrade. Major variations between 2009-10 Budget and 2010-11 Estimate include: 33. The decrease is due to a reduction in funding for business improvement projects. 34. The increase is mainly due to higher third party provider costs. 35. The decrease is due to a reduction in capital purchases. Major variations between 2009-10 Estimated actual and the 2010-11 Estimate include: 36. The increase is mainly due to enterprise bargaining increases and higher third party provider costs. 37. The decrease is due to a reduction in funding for business improvement projects. 38. The increase is mainly due to higher third party provider costs. 39. The decrease is due to capital rationalisation, efficient capital management and a reduction in ICT infrastructure
replacement in preparedness for transition to a third party provider arrangement for these services.

2010-11 Queensland State Budget - Service Delivery Statements – CorpTech 2-230
CorpTech OVERVIEW CorpTech is responsible for supporting whole-of-Government information systems that are used to support the State’s finances, workforce and administration. These whole-of-Government information systems include payroll, rostering, purchasing, inventory management, asset management, accounts payable, accounts receivable and travel management. CorpTech plays a significant role in the implementation of the Government’s Toward Q2 through ICT strategy through the consolidation and standardisation of human resources (HR) and financial management information systems to reduce the cost of these services and systems to government. The key factors and challenges impacting on CorpTech include: � the diverse range of HR management systems and finance systems requires that the
workforce has the capacity and skills to deliver the development and support services � ongoing rationalisation and consolidation of HR and financial management systems.
REVIEW OF PERFORMANCE
Recent achievements CorpTech’s recent achievements include: � delivering payroll services for 180,000 public servants each fortnight � delivering significant enhancements to, and implementation of, whole-of-Government HR
and finance systems � migrating seven departments onto a consolidated Aurion payroll environment � completing a technical upgrade to the Department of Education and Training payroll
environment � implementing the new whole-of-Government finance system into the Department of
Community Safety � supporting the implementation of the human resource solution in Queensland Health � migrating over 900 Department of Communities staff into the new whole-of-Government
HR solution � a technical upgrade of the whole-of-Government recruitment system (RecruitASP)
including Jobs Online � a technical upgrade of the Queensland Health Finance system (FAMMIS) � machinery-of-Government projects for the Department of Communities, and the
Department of Employment, Economic Development and Innovation to migrate employee records on to whole-of-Government SAP systems.
Future developments In the future, CorpTech will: � progress the implementation of finance and payroll information systems through the
Corporate Solutions Program � implement robust, consistent end-to-end ICT industry standard practices to deliver faster
and more effective services.

2010-11 Queensland State Budget - Service Delivery Statements – CorpTech 2-231
STATEMENTS
PERFORMANCE STATEMENT Service standards
Notes2009-10
Target/est.2009-10
Est. actual 2010-11
Target/est.
Financial performance measures Labour costs as a percentage of total expenses Non-financial performance measures Percentage of OLAs signed Percentage of Incidents and Service Requests completed on time Percentage of system availability Projects completed on time, within budget and in accordance with agreed project outcomes
1,2
3,4
28%
100%
80%
98%
Completed and met
32%
100%
93%
99%
7 of 8 completed
and met
33%
100%
80%
98%
On time and on budget
Notes: 1. The increase in the 2009-10 Estimated actual from the 2009-10 Target/estimate is due to the engagement of additional
staff for the Corporate Solutions Program (CSP) and conversion of contract staff to departmental employees. 2. The increase in the 2010-11 Target/estimate from the 2009-10 Estimated actual is due to a decrease in overall total
expenditure as a result of a decrease in contractor expenditure associated with the CSP and a one-off contribution from the CSP to SSA for project activities in 2009-10.
3. Refers to priority projects in the Corporate Solutions Program. 4. Outstanding project expected to be completed in 2010-11 reporting period.

2010-11 Queensland State Budget - Service Delivery Statements – CorpTech 2-232
INCOME STATEMENT
CorpTech Notes2009-10Budget
$’000
2009-10 Est. act.
$’000
2010-11Estimate
$’000 Income
User charges 1,7,10 92,072 104,966 120,629Grants and other contributions 2,8,11 36,744 25,541 2,621Other revenue 228 358 358Gains on sale/revaluation of property, plant and equipment and investments
..
.. ..Total income 129,044 130,865 123,608 Expenses
Employee expenses 3 36,469 42,215 40,346Supplies and services 4,12 57,889 65,202 58,498Grants and subsidies .. .. ..Depreciation and amortisation 5 27,298 20,673 22,043Finance/borrowing costs .. .. ..Other expenses 6,9 7,388 2,775 2,721Losses on sale/revaluation of property, plant and equipment and investments ..
.. ..
Total expenses 129,044 130,865 123,608 OPERATING SURPLUS/(DEFICIT) .. .. ..
STATEMENT OF CHANGES IN EQUITY
CorpTech Notes2009-10Budget
$’000
2009-10 Est. act.
$’000
2010-11Estimate
$’000
Net effect of the changes in accounting policies and prior year adjustments .. .. ..Increase/(decrease) in asset revaluation reserve .. .. ..Net amount of all revenue and expense adjustments direct to equity not disclosed above .. .. .. Net income recognised directly in equity .. .. .. Surplus/(deficit) for the period
..
.. ..Total recognised income and expense for the period .. .. ..Equity injection/(withdrawal) 13,14,15 (7,700) 712 (26,132)Equity adjustments (MoG transfers) .. ..Total movement in equity for period (7,700) 712 (26,132)

2010-11 Queensland State Budget - Service Delivery Statements – CorpTech 2-233
BALANCE SHEET
CorpTech Notes2009-10Budget
$’000
2009-10 Est. act.
$’000
2010-11Estimate
$’000 CURRENT ASSETS
Cash assets 16,20,24 16,033 37,525 30,826Receivables 17 8,936 18,452 17,922Other financial assets .. .. ..Inventories .. .. ..Other 2,750 1,775 1,775Non-financial assets held for sale 2 2 2
Total current assets 27,721 57,754 50,525 NON-CURRENT ASSETS
Receivables .. .. ..Other financial assets .. .. ..Property, plant and equipment 1,288 809 1,209Intangibles 18,21,25 188,570 163,946 145,148Other .. .. ..
Total non-current assets 189,858 164,755 146,357 TOTAL ASSETS 217,579 222,509 196,882 CURRENT LIABILITIES
Payables 16,169 16,178 16,683Accrued employee benefits 940 2,553 2,553Interest-bearing liabilities and derivatives .. .. ..Provisions .. .. ..Other .. .. ..
Total current liabilities 17,109 18,731 19,236 NON-CURRENT LIABILITIES
Payables .. .. ..Accrued employee benefits .. .. ..Interest-bearing liabilities and derivatives .. .. ..Provisions .. .. ..Other .. .. ..
Total non-current liabilities .. .. .. TOTAL LIABILITIES 17,109 18,731 19,236 NET ASSETS/(LIABILITIES) 200,470 203,778 177,646 EQUITY
Capital/contributed equity 22,26 197,313 203,474 177,342Retained surplus/(accumulated deficit) 19,23 3,157 304 304Reserves:
- Asset revaluation reserve .. .. ..- Other (specify) .. .. ..
TOTAL EQUITY 200,470 203,778 177,646

2010-11 Queensland State Budget - Service Delivery Statements – CorpTech 2-234
CASH FLOW STATEMENT
CorpTech Notes2009-10Budget
$’000
2009-10 Est. act.
$’000
2010-11Estimate
$’000 CASH FLOWS FROM OPERATING ACTIVITIES
Inflows: User charges 27,33,37 101,258 105,478 121,159Grants and other contributions 28,34,38 17,373 25,541 2,621Other 7,931 16,735 13,364
Outflows: Employee costs 29 (38,001) (43,742) (40,341)Supplies and services (63,305) (62,720) (57,998)Grants and subsidies 30,39 .. (32,492) ..Borrowing costs .. .. ..Other (16,062) (19,352) (15,727)
Net cash provided by/ (used in) operating activities 9,194 (10,552) 23,078 CASH FLOWS FROM INVESTING ACTIVITIES
Inflows: Sales of property, plant and equipment .. .. ..Investments redeemed .. .. ..Loans and advances redeemed .. .. ..
Outflows: Payments for property, plant and equipment and intangibles
31,35,40 (49,032) (20,081) (3,645)
Payments for investments .. .. ..Loans and advances made .. .. ..
Net cash provided by/(used in) investing activities (49,032) (20,081) (3,645) CASH FLOWS FROM FINANCING ACTIVITIES
Inflows: Borrowings .. .. ..Equity injections .. 712 ..
Outflows: Borrowing redemptions .. .. ..Finance lease payments .. .. ..Equity withdrawals 32,36,41 (7,700) .. (26,132)
Net cash provided by/(used in) financing activities (7,700) 712 (26,132)
Net increase/(decrease) in cash held (47,538) (29,921) (6,699) Cash at the beginning of financial year 63,571 67,446 37,525 Cash transfers from restructure .. .. ..Cash at the end of financial year 16,033 37,525 30,826

2010-11 Queensland State Budget - Service Delivery Statements – CorpTech 2-235
EXPLANATION OF VARIANCES IN THE FINANCIAL STATEMENTS
Income statement Major variations between 2009-10 Budget and 2009-10 Estimated actual include: 1. The increase is mainly due to agency contributions towards the cost of the Corporate Solutions Program (CSP). 2. The decrease is mainly due to a reduction in grant funding for the CSP. 3. The increase is mainly due to additional staff for the CSP and the conversion of contract staff to departmental employees. 4. The increase is mainly due to contractor expenditure associated with CSP, a one-off contribution from the CSP to the
Shared Service Agency (SSA) for project activities in 2009-10 and the reclassification of SSA charges from other expenses. 5. The decrease is due to the change in the timing of the implementation of the CSP as a result of a change in direction to
support multiple systems and projects simultaneously rather than the previous approach based on a one solution model. 6. The decrease is due to a reduction in software licences and portable and attractive items and a reclassification of SSA
charges to supplies and services. Major variations between 2009-10 Budget and 2010-11 Estimate include: 7. The difference is primarily due to an increase in charges to agencies to cover the cost of services to offset the reduction in
grant funding in 2010-11. 8. The decrease is due to a reduction in grant funding which is offset by an increase in user charges. 9. The decrease is due to a reduction in software licences and portable and attractive items and a reclassification of SSA
charges to supplies and services. Major variations between 2009-10 Estimated actual and the 2010-11 Estimate include: 10. The difference is primarily due to an increase in charges to agency to cover the cost of services to offset the reduction in
grant funding in 2010-11. 11. The decrease is due to a reduction in grant funding which is offset by an increase in user charges. 12. The decrease is mainly due to a reduction in contractor expenditure associated with the CSP and a one-off contribution from
the CSP to SSA for project activities in 2009-10.
Statement of changes in equity Major variations between 2009-10 Budget and 2009-10 Estimated actual include: 13. The variance is due the cancellation of a planned equity withdrawal. Major variations between 2009-10 Budget and 2010-11 Estimate include: 14. The variance is due to a combination of the planned equity withdrawal in the 2009-10 Budget and the recommencement of
equity withdrawals in 2010-11. Major variations between 2009-10 Estimated actual and the 2010-11 Estimate include: 15. The variance is to due to the recommencement of equity withdrawals in 2010-11.
Balance sheet Major variations between 2009-10 Budget and 2009-10 Estimated actual include: 16. The increase is mainly due to the accumulation of cash balances for the CSP. 17. The increase in mainly due to a change in timing of the recovery of user charges from the SSA. 18. The decrease is due to the change in timing in the implementation of the CSP as a result of a change in direction to support
multiple systems and projects simultaneously rather than the previous approach based on a one solution model. 19. The difference is due to the reclassification of prior year adjustments for work in progress from capital/contributed equity to
retained surplus. Major variations between 2009-10 Budget and 2010-11 Estimate include: 20. The increase is mainly due to the accumulation of cash balances for the CSP. 21. The decrease is mainly due to a change in timing in the implementation of the CSP. 22. The variance is due to a combination of the planned equity withdrawal in the 2009-10 Budget and the recommencement of
equity withdrawals in 2010-11. 23. The difference is due to the reclassification of prior year adjustments for work in progress from capital/contributed equity to
retained surplus. Major variations between 2009-10 Estimated actual and the 2010-11 Estimate include: 24. The decrease is attributable to the net effect of depreciation, recovered through user charges, exceeding capital acquisitions
in 2010-11 and the equity withdrawal in 2010-11. 25. The decrease is mainly due to the depreciation charge on assets for 2010-11. 26. The variance is to due to the recommencement of equity withdrawals in 2010-11.
Cash flow statement Major variations between 2009-10 Budget and 2009-10 Estimated actual include: 27. The increase is mainly due to agency contributions towards the cost of the CSP. 28. The difference is due to the deferral of 2008-09 grant funding partially offset by funding deferred to future years. 29. The increase is mainly due to additional staff for the CSP and the conversion of contract staff to departmental employees. 30. The 2009-10 amount represents grant funding not utilised in 2008-09 and repaid to the Consolidated Fund in 2009-10. 31. The decrease is due to the change in the timing of the implementation of the CSP as a result of a change in direction to
support multiple systems and projects simultaneously rather than the previous approach based on a one solution model. 32. The variance is due the cancellation of a planned equity withdrawal.

2010-11 Queensland State Budget - Service Delivery Statements – CorpTech 2-236
Major variations between 2009-10 Budget and 2010-11 Estimate include: 33. The difference is primarily due to an increase in charges to agencies to cover the cost of services to offset the reduction in
grant funding in 2010-11. 34. The decrease is due to a reduction in grant funding which is offset by an increase in user charges. 35. The decrease is due to the change in the timing of the implementation of the CSP as a result of a change in direction to
support multiple systems and projects simultaneously rather than the previously approach based on a one solution model. 36. The variance is due to a combination of the planned equity withdrawal in the 2009-10 Budget and the recommencement of
equity withdrawals in 2010-11. Major variations between 2009-10 Estimated actual and the 2010-11 Estimate include: 37. The difference is primarily due to an increase in charges to agency to cover the cost services to offset the reduction in grant
funding in 2010-11. 38. The decrease is due to a reduction in grant funding which is offset by an increase in user charges. 39. The 2009-10 amount represents grant funding not utilised in 2008-09 and repaid to the Consolidated Fund in 2009-10. 40. The decrease is due to the change in the timing of the implementation of the CSP as a result of a change in direction to
support multiple systems and projects simultaneously rather than the previously approach based on a one solution model. 41. The variance is to due to the recommencement of equity withdrawals in 2010-11.

2010-11 Queensland State Budget - Service Delivery Statements – Queensland Building Services Authority 2-237
Statutory Body Queensland Building Services Authority
OVERVIEW The Queensland Building Services Authority (the Authority) is a statutory body established under the Queensland Building Services Authority Act 1991 (the Act). The Authority provides a comprehensive licensing regime for the building industry and performs regulatory functions under this Act. The Authority also administers the Building and Construction Industry Payments Act 2004, the Subcontractors Charges Act 1974 and the Domestic Building Contracts Act 2000. A principal role of the Authority is the provision of remedies for defective building work which includes a home warranty insurance scheme providing compensation for defective or incomplete construction. The Authority delivers information and advice to consumers, builders and contractors through a variety of mechanisms including publications, education shows and consumer seminars. The Authority’s staff consisted of 353 estimated full time equivalents at 30 June 2010, with estimated full time equivalents of 355 at 30 June 2011.
REVIEW OF PERFORMANCE
Recent achievements The Authority’s recent achievements include: � issuing 81,053 home warranty insurance policies for residential building work valued at
$7.2 billion and approved $47 million in home warranty insurance claims � successfully negotiating a two-year reinsurance contract effective 1 July 2010 � processing 6,200 dispute notifications � completing 13 Contractor Education Supershows, 27 Trade Specific Seminars and
39 Consumer Education Seminars attended by 6,900 contractors � registering 825 adjudicated decisions under the Building and Construction Industry
Payments Act 2004 for a value of $195 million � providing financial and business assistance to 1,342 contractors through education and
awareness � continuing an aggressive compliance program to remove rogues from the industry by
interviewing some 9,000 licensees on site � responding to 250,000 telephone enquiries.
Future developments In future the Authority will: � introduce fairer contracts in the residential sector � introduce technology to ensure lodgement of licence renewals online and increase
educational material available on-line � continue education of contractors on business management skills and common defects � continue education of consumers on the building process.

2010-11 Queensland State Budget - Service Delivery Statements – Queensland Building Services Authority 2-238
The Government’s Performance Management Framework is being progressively implemented. The Framework no longer uses the concepts of ‘outputs’ and ‘performance measures’ that were previously used in Service Delivery Statements. They are replaced with ‘services’ and ‘service standards’. These terms are defined in the Budget Readers’ Guide. Together, they begin to provide information about how efficiently and effectively agencies deliver services within their approved Budget. All agencies reviewed their service structures and service standards as part of this transition year. Approved changes are included in this year’s Service Delivery Statement. Results against measures that have been discontinued are included in Appendix A (Book 5 of the Service Delivery Statements) for this year only. A key aspect of improving performance information is reviewing performance data. As such, each year agencies will continue to review and improve their service standards to provide better information on the effectiveness and efficiency of their services.

2010-11 Queensland State Budget - Service Delivery Statements – Queensland Building Services Authority 2-239
STATEMENTS
STAFFING1 Notes
2009-10Budget
2009-10 Est. actual
2010-11Estimate
2
342
353
355
Notes: 1. Full-time equivalents (FTEs) as at 30 June. 2. The increase from the 2009-10 Budget to both the 2009-10 Estimated actual and 2010-11 Estimate is due to an
increase in technical staff numbers to accommodate additional work loads owing to the increase in licensee insolvencies.
PERFORMANCE STATEMENT
Service standards Notes 2009-10Target/est.
2009-10 Est. actual
2010-11Target/est.
Number of insurance policies issued Number of licensees including Accredited Building Certifiers Number of licence applications received Number of unlicensed contractor investigations initiated
1
72,000
85,222
8,760
675
81,053
84,121
9,000
680
82,000
87,315
8,000
680
Number of investigations into breaches of financial requirements for licensing Number of dispute notifications finalised Number of insurance claims finalised Number of investigations into breaches of legislated contractual obligations Number of licences cancelled
2 3
1800 5,500 1,600
300
3,645
1746 6,200 1,900
282
3,820
1800 6,800 1,800
280
3,600
Percentage of customers satisfied with advice and support provided Percentage of licence applications processed within 45 days Percentage of disputes finalised within 80 days Percentage of calls answered within 60 seconds or less Percentage movement in licensee database
4
90
80%
60%
80%
New
measure
85
83%
58%
60%
3.25%
90
82%
60%
70%
3%
Number of Building and Construction Industry Payments Act claims registered Number of Building and Construction Industry Payments Act claims decided Percentage of certifiers’ assessments of building permits compliant
New measure
New measure
New measure
1,100
825
80%
1,200
1,000
85%
State contribution ($’000) Other revenue ($’000) Total cost ($’000)
..124,239126,260
.. 152,302 145,351
..153,103148,085

2010-11 Queensland State Budget - Service Delivery Statements – Queensland Building Services Authority 2-240
Notes: 1. The variance is due to increase in new home construction following earlier than forecast recovery. 2. The variance is due to increased new dispute workloads as a result of increased licensee insolvencies. 3. The variance is due to higher than forecast claim numbers as a result of high non-completion claims following industry
downturn. 4. The variance is due to increased volume of compliance issues, contractor failures and the Building and Construction
Industry Payments Act 2004 enquiry calls.

2010-11 Queensland State Budget - Service Delivery Statements – Queensland Building Services Authority 2-241
INCOME STATEMENT
Queensland Building Services Authority Notes2009-10Budget
$’000
2009-10 Est. act.
$’000
2010-11Estimate
$’000 Income
User charges 3,6 57,416 60,540 71,602Grants and other contributions .. .. ..Other revenue 1,4,7 66,857 91,791 81,503Gains on sale/revaluation of property, plant and equipment and investments
(34)
(29) (2)Total income 124,239 152,302 153,103 Expenses
Employee expenses 29,094 28,593 32,332Supplies and services 14,054 15,568 15,467Grants and subsidies .. .. ..Depreciation and amortisation 1,686 1,743 1,587Finance/borrowing costs .. .. ..Other expenses 2,5 81,426 99,447 98,699Losses on sale/revaluation of property, plant and equipment and investments ..
.. ..
Total expenses 126,260 145,351 148,085 OPERATING SURPLUS/(DEFICIT) (2,021) 6,951 5,018
STATEMENT OF CHANGES IN EQUITY
Queensland Building Services Authority Notes2009-10Budget
$’000
2009-10 Est. act.
$’000
2010-11Estimate
$’000
Net effect of the changes in accounting policies and prior year adjustments .. .. .. Increase/(decrease) in asset revaluation reserve .. .. .. Net amount of all revenue and expense adjustments direct to equity not disclosed above .. .. .. Net income recognised directly in equity .. .. .. Surplus/(deficit) for the period (2,021) 6,951 5,018Total recognised income and expense for the period (2,021) 6,951 5,018Equity injection/(withdrawal) .. .. ..Equity adjustments (MoG transfers) .. .. ..Total movement in equity for period 8,9,10 (2,021) 6,951 5,018 ..

2010-11 Queensland State Budget - Service Delivery Statements – Queensland Building Services Authority 2-242
BALANCE SHEET
Queensland Building Services Authority Notes2009-10Budget
$’000
2009-10 Est. act.
$’000
2010-11Estimate
$’000 CURRENT ASSETS
Cash assets 5,306 5,306 5,306Receivables 11,17,24 29,795 41,315 54,354Other financial assets 18 131,132 139,969 149,608Inventories .. .. ..Other 20,419 20,308 23,457
Non-financial assets held for sale .. .. .. Total current assets 186,652 206,898 232,725 NON-CURRENT ASSETS
Receivables 83,095 76,515 84,771Other financial assets .. .. ..Property, plant and equipment 6,548 6,743 6,918Intangibles 12,19,25 3,501 1,355 1,695Other 498 498 426
Total non-current assets 93,642 85,111 93,810 TOTAL ASSETS 280,294 292,009 326,535 CURRENT LIABILITIES
Payables 13,20,26 35,381 40,314 52,706Accrued employee benefits 14,21 7,450 3,021 2,922Interest-bearing liabilities and derivatives .. .. ..Provisions 34,653 32,449 32,437Other 24,272 24,325 29,431
Total current liabilities 101,756 100,109 117,496 NON-CURRENT LIABILITIES
Payables .. .. ..Accrued employee benefits 15,22 2,580 3,455 3,855Interest-bearing liabilities and derivatives .. .. ..Provisions 132,172 124,200 136,224Other 27 1,815 1,794 1,491
Total non-current liabilities 136,567 129,449 141,570 TOTAL LIABILITIES 238,323 229,558 259,066 NET ASSETS/(LIABILITIES) 41,971 62,451 67,469 EQUITY
Capital/contributed equity .. .. ..Retained surplus/(accumulated deficit) 16,23 41,971 62,451 67,469Reserves:
- Asset revaluation reserve .. .. ..- Other (specify) .. .. ..
TOTAL EQUITY 41,971 62,451 67,469

2010-11 Queensland State Budget - Service Delivery Statements – Queensland Building Services Authority 2-243
CASH FLOW STATEMENT
Queensland Building Services Authority Notes2009-10Budget
$’000
2009-10 Est. act.
$’000
2010-11Estimate
$’000 CASH FLOWS FROM OPERATING ACTIVITIES
Inflows: User charges 64,959 64,455 63,669Grants and other contributions .. .. ..Other 28,33 53,484 68,961 67,444
Outflows: Employee costs (26,357) (28,269) (32,031)Supplies and services 29 (16,923) (21,066) (18,242)Grants and subsidies .. .. ..Borrowing costs .. .. ..Other 30,34 (65,616) (78,192) (74,843)
Net cash provided by/(used in) operating activities 9,547 5,889 5,997 CASH FLOWS FROM INVESTING ACTIVITIES
Inflows: Sales of property, plant and equipment 31,35,37 (34) (219) (2)Investments redeemed .. .. ..Loans and advances redeemed .. .. ..
Outflows: Payments for property, plant and equipment and intangibles
(1,812) (1,802) (2,102)
Payments for investments 32,36,38 (7,701) (6,317) (3,893)Loans and advances made .. .. ..
Net cash provided by/(used in) investing activities (9,547) (8,338) (5,997) CASH FLOWS FROM FINANCING ACTIVITIES
Inflows: Borrowings .. .. ..Equity injections .. .. ..
Outflows: Borrowing redemptions .. .. ..Finance lease payments .. .. ..Equity withdrawals .. .. ..
Net cash provided by/(used in) financing activities .. .. ..
Net increase/(decrease) in cash held .. (2,449) .. Cash at the beginning of financial year 5,306 7,755 5,306 Cash transfers from restructure .. .. ..Cash at the end of financial year 5,306 5,306 5,306

2010-11 Queensland State Budget - Service Delivery Statements – Queensland Building Services Authority 2-244
EXPLANATION OF VARIANCES IN THE FINANCIAL STATEMENTS
Income statement Major variations between 2009-10 Budget and 2009-10 Estimated actual include: 1. The movement is due to better than forecast investment returns as the market recovers from the global financial crisis (GFC)
and an increase in reinsurance recoveries on claims following high claim approvals. 2. The movement is due to Insurance claims being higher than forecast due to licensee insolvencies. Major variations between 2009-10 Budget and 2010-11 Estimate include: 3. The movement is due to higher insurance premium income as a result of growth in the residential building sector. 4. The movement is due to an increase in investment income and an increase in reinsurance recoveries due to an increase in
claim approvals. 5. The movement is due to insurance claims forecast to continue at higher than normal approvals resulting from licensee
insolvencies. Major variations between 2009-10 Estimated actual and the 2010-11 Estimate include: 6. The movement is due to higher insurance premium income as a result of growth in the residential building sector. 7. The movement is due to a decrease in reinsurance recoveries as a result of lower claims approvals forecast for 2010-11.
Statement of changes in equity Major variations between 2009-10 Budget and 2009-10 Estimated actual include: 8. The movement is due to better than forecast investment returns as the market recovers from the GFC and increase in
insurance premium revenue as a result of growth in the residential building sector. Major variations between 2009-10 Budget and 2010-11 Estimate include: 9. The movement is due to better than forecast investment returns as the market recovers from the GFC and an increase in
insurance premium revenue as a result of growth in the residential building sector. Major variations between 2009-10 Estimated actual and the 2010-11 Estimate include: 10. The movement is due to better than forecast investment returns as the market recovers from the GFC and an increase in
insurance premium revenue as a result of growth in the residential building sector.
Balance sheet Major variations between 2009-10 Budget and 2009-10 Estimated actual include: 11. The movement is due to an increase in claims recoveries as a result of gross claim approvals being above forecast 12. The movement is due to limited software development and amortisation of existing software. 13. The movement is due to reinsurers’ share of unearned income increased as a result of increased gross premium income
and increase in approved claims outstanding following high claim approvals. 14. The movement is due to a lower than forecast staff turnover rate and lower than forecast leave taken. 15. The movement is due to forecasted increase staff leave to be taken beyond 2010. 16. The movement is due to better than forecast investment returns as the market recovers from the GFC. Major variations between 2009-10 Budget and 2010-11 Estimate include: 17. The movement is due to an increase in claims recoveries as a result of gross claim approvals being above forecast. 18. The movement is due to an increase in amount of funds under investment. 19. The movement is due to limited software development and amortisation of existing software. 20. The movement is due to reinsurers’ share of unearned income increased as a result of increased gross premium income
and increase in approved claims outstanding following high claim approvals. 21. The movement is due to a lower than forecast staff turnover rate and lower than forecast leave taken. 22. The movement is due to forecasted increase staff leave to be taken beyond 2010. 23. The movement is due to better than forecast investment returns as the market recovers from the GFC. Major variations between 2009-10 Estimated actual and the 2010-11 Estimate include: 24. The movement is due to an increase in claims recoveries as a result of gross claim approvals continuing above normal
levels. 25. The movement is due to limited software development and amortisation of existing software. 26. The movement is due to reinsurers’ share of unearned income increased as a result of increased gross premium income
and increase in approved claims outstanding following high claim approvals. 27. The movement is due to a lease incentive payment received.
Cash flow Statement Major variations between 2009-10 Budget and 2009-10 Estimated actual include: 28. The movement is due to better than forecast investment returns as market recovers from the GFC and an increase in
reinsurance recoveries on claims following high claim approvals. 29. The movement is due to increased legal fees associated with major legal case, increased technical inspection costs as a
result of increased dispute numbers and the cost of the April 2009 media campaign invoiced in August 2009. 30. The movement is due to Insurance claims being higher than forecast due to licensee insolvencies. 31. The movement is due to losses on motor vehicle trade values due to movement in vehicle types. 32. The movement is due to better than forecast investment returns as the market recovers from the GFC.

2010-11 Queensland State Budget - Service Delivery Statements – Queensland Building Services Authority 2-245
Major variations between 2009-10 Budget and 2010-11 Estimate include: 33. The movement is due to better than forecast investment returns as the market recovers from the GFC and an increase in
reinsurance recoveries on claims following high claim approvals. 34. The movement is due to Insurance claims being higher than forecast owing to licensee insolvencies. 35. The movement is due to a change in vehicle retention years and completion of new fleet trades. 36. The movement is due to better than forecast investment returns as the market recovers from the GFC. Major variations between 2009-10 Estimated actual and the 2010-11 Estimate include: 37. The movement is due to better than forecast investment returns as the market recovers from the GFC. 38. The movement is due to better than forecast investment returns as the market recovers from the GFC.