Embed Size (px)
Citation preview
Great state. Great opportunity.
State Budget 2013-14
Budget Strategy and OutlookBudget Paper No.2
State Budget 2013-14 Budget Strategy and Outlook
Budget Paper No.2
State Budget 2013–14 Budget Strategy and Outlook Budget Paper No.2 www.budget.qld.gov.au
2013–14 State Budget Papers1. Budget Speech
2. Budget Strategy and Outlook
3. Capital Statement
4. Budget Measures
5. Service Delivery Statements
Appropriation Bills
Concessions Statement
The suite of Budget Papers is similar to that published in 2012-13.
The Budget Papers are available online at www.budget.qld.gov.au
© Crown copyright All rights reservedQueensland Government 2013
Excerpts from this publication may be reproduced, with appropriate acknowledgement, as permitted under the Copyright Act.
Budget Strategy and OutlookBudget Paper No.2ISSN 1445-4890 (Print)ISSN 1445-4904 (Online)
STATE BUDGET 2013-14
BUDGET STRATEGY AND OUTLOOK
Budget Paper No. 2
TABLE OF CONTENTS 1. Fiscal strategy and outlook ............................................................ 1 Context ............................................................................................. 3 Overview .......................................................................................... 5 Budget outcomes 2012-13 .............................................................. 10 2013-14 Budget and outyear projections ....................................... 13 Fiscal strategy as a guiding principle for policy .............................. 19 Achievement of fiscal principles ..................................................... 24 2. Economic performance and outlook .......................................... 27 External environment ..................................................................... 28 Queensland economy .................................................................... 31 3. Revenue ........................................................................................ 47 2013-14 Revenue by category ....................................................... 49 Revenue changes since the 2012-13 Budget and MYFER ............ 51 Queensland’s revenue trends ........................................................ 52 2013-14 Budget initiatives .............................................................. 55 Taxation revenue ........................................................................... 59 Queensland’s competitive tax status ............................................... 64 Grants revenue ............................................................................... 65 Sales of goods and services .......................................................... 68 Interest income ............................................................................... 70 Dividend and income tax equivalent income .................................. 71 Other revenue ................................................................................. 71 4. Expenses ...................................................................................... 75 2012-13 estimated actual ................................................................ 76 2013-14 Budget and outyears ......................................................... 77 Expenses by operating statement category .................................... 78 Operating expenses by purpose ..................................................... 87 Departmental expenses .................................................................. 88
5. Balance sheet and cash flows ..................................................... 91 Background ..................................................................................... 91 Balance sheet ................................................................................ 92 Cash flows ..................................................................................... 100 Reconciliation of operating cash flows to the operating statement ................................................................................ 102 6. Inter-governmental financial relations ...................................... 103 Federal financial arrangements .................................................... 104 Australian Government funding to Queensland ............................ 107 Payments to Queensland for specific purposes ............................ 108 GST revenue payments ................................................................ 115 State-local government financial relations ..................................... 122 7. Public Non-financial Corporations sector ................................. 123 Context .......................................................................................... 123 Reform .......................................................................................... 124 Independent Commission of Audit ................................................ 125 Finances and performance ............................................................ 128 8. Uniform presentation framework ............................................... 137 Introduction ................................................................................... 137 Uniform presentation framework financial information................... 137 Reconciliation of net operating balance to accounting operating result ....................................................................... 147 General Government time series .................................................. 148 Other General Government uniform presentation framework data ........................................................................................ 149 Contingent liabilities ...................................................................... 155 Background and interpretation of uniform presentation framework ............................................................................... 156 Sector classification....................................................................... 158 Reporting entities .......................................................................... 159
Appendix A – Tax expenditure statement ........................................ 163 Overview .............................................................................................. 163 The Tax Expenditure Statement .......................................................... 164 Discussion of individual taxes .............................................................. 166 Appendix B – Revenue and expense assumptions and sensitivity analysis ............................................................................ 171 Taxation revenue assumptions and revenue risks ............................... 173 Royalty assumptions and revenue risks............................................... 174 Sensitivity of expenditure estimates and expenditure risks .................. 176
Budget Strategy and Outlook 2013-14 1
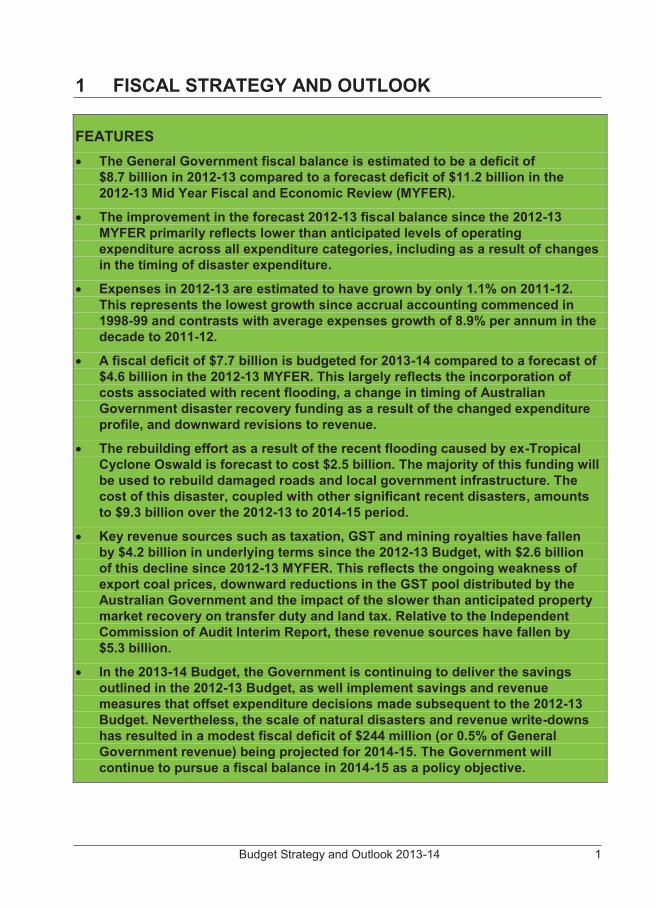
1 FISCAL STRATEGY AND OUTLOOK
FEATURES � The General Government fiscal balance is estimated to be a deficit of
$8.7 billion in 2012-13 compared to a forecast deficit of $11.2 billion in the 2012-13 Mid Year Fiscal and Economic Review (MYFER).
� The improvement in the forecast 2012-13 fiscal balance since the 2012-13 MYFER primarily reflects lower than anticipated levels of operating expenditure across all expenditure categories, including as a result of changes in the timing of disaster expenditure.
� Expenses in 2012-13 are estimated to have grown by only 1.1% on 2011-12. This represents the lowest growth since accrual accounting commenced in 1998-99 and contrasts with average expenses growth of 8.9% per annum in the decade to 2011-12.
� A fiscal deficit of $7.7 billion is budgeted for 2013-14 compared to a forecast of $4.6 billion in the 2012-13 MYFER. This largely reflects the incorporation of costs associated with recent flooding, a change in timing of Australian Government disaster recovery funding as a result of the changed expenditure profile, and downward revisions to revenue.
� The rebuilding effort as a result of the recent flooding caused by ex-Tropical Cyclone Oswald is forecast to cost $2.5 billion. The majority of this funding will be used to rebuild damaged roads and local government infrastructure. The cost of this disaster, coupled with other significant recent disasters, amounts to $9.3 billion over the 2012-13 to 2014-15 period.
� Key revenue sources such as taxation, GST and mining royalties have fallen by $4.2 billion in underlying terms since the 2012-13 Budget, with $2.6 billion of this decline since 2012-13 MYFER. This reflects the ongoing weakness of export coal prices, downward reductions in the GST pool distributed by the Australian Government and the impact of the slower than anticipated property market recovery on transfer duty and land tax. Relative to the Independent Commission of Audit Interim Report, these revenue sources have fallen by $5.3 billion.
� In the 2013-14 Budget, the Government is continuing to deliver the savings outlined in the 2012-13 Budget, as well implement savings and revenue measures that offset expenditure decisions made subsequent to the 2012-13 Budget. Nevertheless, the scale of natural disasters and revenue write-downs has resulted in a modest fiscal deficit of $244 million (or 0.5% of General Government revenue) being projected for 2014-15. The Government will continue to pursue a fiscal balance in 2014-15 as a policy objective.
2 Budget Strategy and Outlook 2013-14
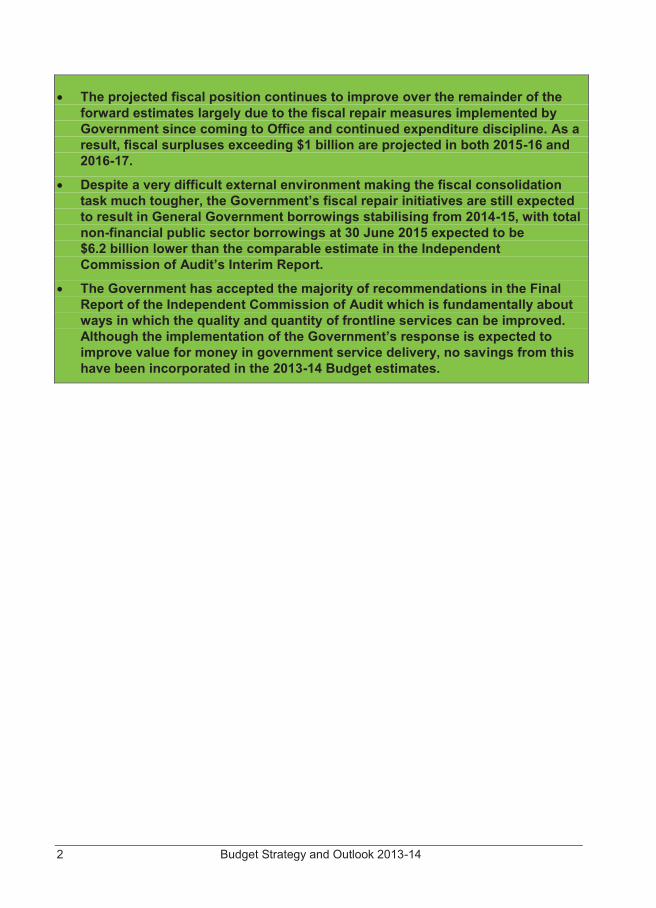
� The projected fiscal position continues to improve over the remainder of the forward estimates largely due to the fiscal repair measures implemented by Government since coming to Office and continued expenditure discipline. As a result, fiscal surpluses exceeding $1 billion are projected in both 2015-16 and 2016-17.
� Despite a very difficult external environment making the fiscal consolidation task much tougher, the Government’s fiscal repair initiatives are still expected to result in General Government borrowings stabilising from 2014-15, with total non-financial public sector borrowings at 30 June 2015 expected to be $6.2 billion lower than the comparable estimate in the Independent Commission of Audit’s Interim Report.
� The Government has accepted the majority of recommendations in the Final Report of the Independent Commission of Audit which is fundamentally about ways in which the quality and quantity of frontline services can be improved. Although the implementation of the Government’s response is expected to improve value for money in government service delivery, no savings from this have been incorporated in the 2013-14 Budget estimates.
Budget Strategy and Outlook 2013-14 3
CONTEXT The 2012-13 Budget implemented significant fiscal repair in Queensland. The 2012-13 Budget delivered measures totalling $7.8 billion over the 2012-13 to 2015-16 period. These savings were made by exiting activities that are not the domain of the Queensland Government, by reducing waste and inefficiency in Government activities and by implementing specifically targeted revenue measures.
As part of this process of fiscal repair, the Government adopted a new set of fiscal principles clearly aimed at improving the sustainability of the State’s finances. These principles are:
� stabilise then significantly reduce debt
� achieve and maintain a General Government sector fiscal balance by 2014-15
� maintain a competitive tax environment for business
� target full funding of long term liabilities such as superannuation in accordance with actuarial advice.
These fiscal principles guided Government decision making during the preparation of the 2012-13 Budget and continue to guide Government decisions including in the 2013-14 Budget.
Since coming to Office, the Government has clearly demonstrated its ability to manage expenditure, with operating expenses in 2012-13 estimated to be almost $2 billion lower than budgeted. This means expenses in 2012-13 are estimated to have grown by only 1.1% on 2011-12, which represents the lowest growth since accrual accounting commenced in 1998-99 and contrasts with average expenses growth of 8.9% per annum in the decade to 2011-12.
The Government will continue to focus its efforts on restraining expenditure growth both through ensuring that the fiscal repair measures in the 2012-13 continue to be achieved and by pursuing further reform.
However, the 2013-14 Budget has been made significantly more difficult by the rebuilding task following the widespread flooding arising from ex-Tropical Cyclone Oswald. This disaster has been estimated to cost $2.5 billion and comes on top of the significant natural disasters in 2010-11 and 2011-12 to bring total disaster spending over the 2012-13 to 2014-15 period to $9.3 billion.
In addition, key revenue sources such as taxation, GST and mining royalties have fallen by $4.2 billion in underlying terms since the 2012-13 Budget, with $2.6 billion of this decline since 2012-13 Mid Year Fiscal and Economic Review (MYFER). This reflects the ongoing weakness of export coal prices, downward reductions in the GST pool distributed by the Australian Government and the impact of the slower than anticipated property market recovery on transfer duty and land tax.
4 Budget Strategy and Outlook 2013-14
To keep a fiscal balance in 2014-15 within reach and ensure borrowings in the General Government sector stabilise, the Government has decided that some further measures will be implemented in the 2013-14 Budget including:
� a two year deferral of the planned increase in the payroll tax threshold, from $1.1 million to $1.2 million, to 1 July 2015
� an increase in duty rates on general insurance products, more closely aligning Queensland’s rates with those applied in other states
� extending the Emergency Management, Fire and Rescue Levy (currently known as the Urban Fire Levy) to all rateable properties to ensure a sustainable funding base for emergency management services
� additional departmental savings of $100 million per annum from 2013-14 onwards.
Further detail on these measures is provided in the Revenue and Expense Chapters of this Budget Paper, with financial impacts detailed in Budget Paper 4 – Budget Measures.
In the absence of measures taken in the 2012-13 and 2013-14 Budgets, the fiscal deficit would be $10.1 billion in 2013-14.
In addition to these measures, the Government has accepted the majority of the recommendations outlined in the Final Report of the Independent Commission of Audit. The Final Report is fundamentally about examining ways in which the quality and quantity of frontline services can be improved, including models that make better use of the skills, capacity and innovation of the private and not-for-profit sectors.
The Government’s implementation of the accepted recommendations represents the next stage of public sector reform in Queensland and will guide how public services are delivered into the future. Many of the recommendations relate to contestability. Contestability is not an outcome, but rather a process whereby Government tests the market to ensure it is providing the public with the best possible solution at the best possible price. The Government is determined to transition to being the “enabler”. It does not always need to be the “doer”.
While there is a clear expectation that the associated reforms will result in improved value for money outcomes in the delivery of services, no associated savings have been factored into the forward estimates presented in the 2013-14 Budget.
Budget Strategy and Outlook 2013-14 5
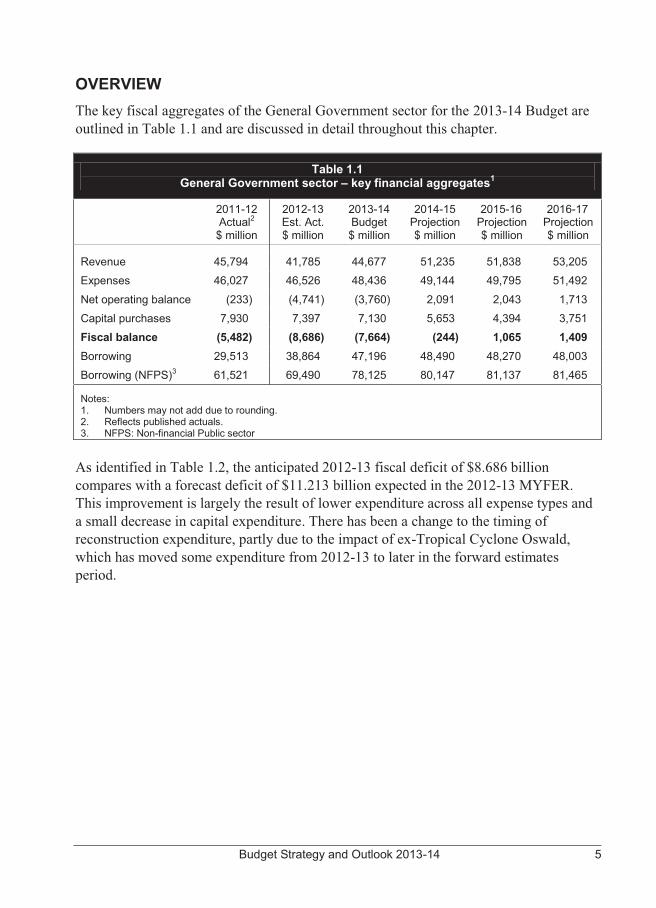
OVERVIEW The key fiscal aggregates of the General Government sector for the 2013-14 Budget are outlined in Table 1.1 and are discussed in detail throughout this chapter.
Table 1.1 General Government sector – key financial aggregates1
2011-12 Actual2 $ million
2012-13 Est. Act. $ million
2013-14 Budget $ million
2014-15 Projection $ million
2015-16 Projection $ million
2016-17 Projection $ million
Revenue 45,794 41,785 44,677 51,235 51,838 53,205 Expenses 46,027 46,526 48,436 49,144 49,795 51,492
Net operating balance (233) (4,741) (3,760) 2,091 2,043 1,713
Capital purchases 7,930 7,397 7,130 5,653 4,394 3,751 Fiscal balance (5,482) (8,686) (7,664) (244) 1,065 1,409 Borrowing 29,513 38,864 47,196 48,490 48,270 48,003 Borrowing (NFPS)3 61,521 69,490 78,125 80,147 81,137 81,465
Notes: 1. Numbers may not add due to rounding. 2. Reflects published actuals. 3. NFPS: Non-financial Public sector
As identified in Table 1.2, the anticipated 2012-13 fiscal deficit of $8.686 billion compares with a forecast deficit of $11.213 billion expected in the 2012-13 MYFER. This improvement is largely the result of lower expenditure across all expense types and a small decrease in capital expenditure. There has been a change to the timing of reconstruction expenditure, partly due to the impact of ex-Tropical Cyclone Oswald, which has moved some expenditure from 2012-13 to later in the forward estimates period.
6 Budget Strategy and Outlook 2013-14
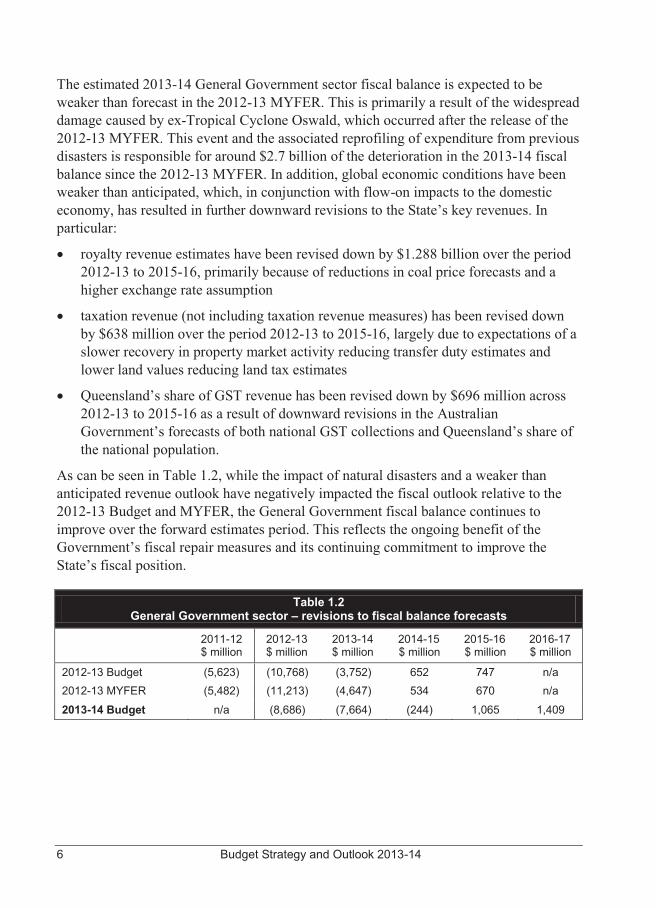
The estimated 2013-14 General Government sector fiscal balance is expected to be weaker than forecast in the 2012-13 MYFER. This is primarily a result of the widespread damage caused by ex-Tropical Cyclone Oswald, which occurred after the release of the 2012-13 MYFER. This event and the associated reprofiling of expenditure from previous disasters is responsible for around $2.7 billion of the deterioration in the 2013-14 fiscal balance since the 2012-13 MYFER. In addition, global economic conditions have been weaker than anticipated, which, in conjunction with flow-on impacts to the domestic economy, has resulted in further downward revisions to the State’s key revenues. In particular:
� royalty revenue estimates have been revised down by $1.288 billion over the period 2012-13 to 2015-16, primarily because of reductions in coal price forecasts and a higher exchange rate assumption
� taxation revenue (not including taxation revenue measures) has been revised down by $638 million over the period 2012-13 to 2015-16, largely due to expectations of a slower recovery in property market activity reducing transfer duty estimates and lower land values reducing land tax estimates
� Queensland’s share of GST revenue has been revised down by $696 million across 2012-13 to 2015-16 as a result of downward revisions in the Australian Government’s forecasts of both national GST collections and Queensland’s share of the national population.
As can be seen in Table 1.2, while the impact of natural disasters and a weaker than anticipated revenue outlook have negatively impacted the fiscal outlook relative to the 2012-13 Budget and MYFER, the General Government fiscal balance continues to improve over the forward estimates period. This reflects the ongoing benefit of the Government’s fiscal repair measures and its continuing commitment to improve the State’s fiscal position.
Table 1.2 General Government sector – revisions to fiscal balance forecasts
2011-12 $ million
2012-13 $ million
2013-14 $ million
2014-15 $ million
2015-16 $ million
2016-17 $ million
2012-13 Budget (5,623) (10,768) (3,752) 652 747 n/a 2012-13 MYFER (5,482) (11,213) (4,647) 534 670 n/a
2013-14 Budget n/a (8,686) (7,664) (244) 1,065 1,409
Budget Strategy and Outlook 2013-14 7
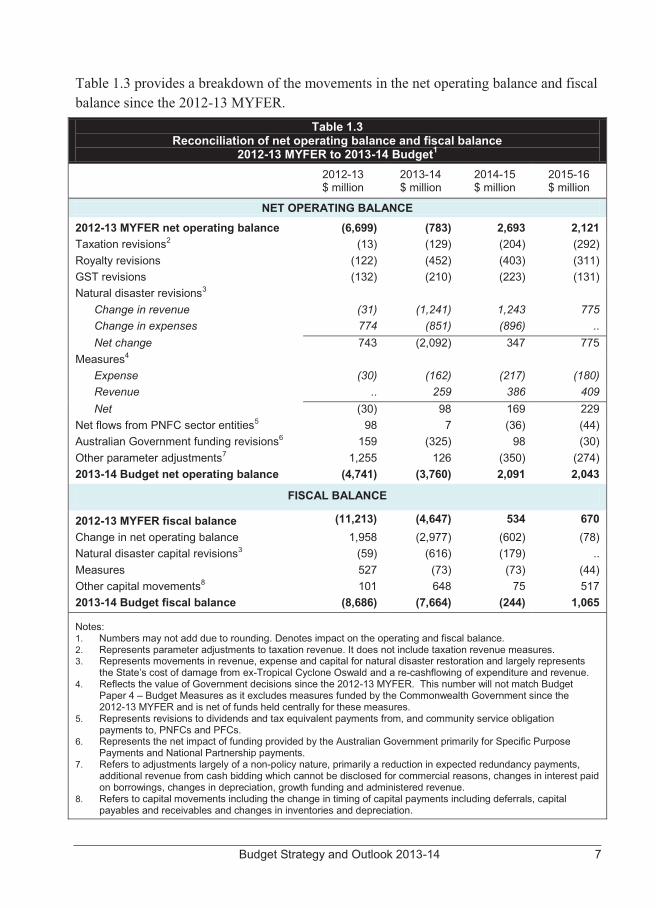
Table 1.3 provides a breakdown of the movements in the net operating balance and fiscal balance since the 2012-13 MYFER.
Table 1.3 Reconciliation of net operating balance and fiscal balance
2012-13 MYFER to 2013-14 Budget1 2012-13
$ million 2013-14 $ million
2014-15 $ million
2015-16 $ million
NET OPERATING BALANCE
2012-13 MYFER net operating balance (6,699) (783) 2,693 2,121 Taxation revisions2 (13) (129) (204) (292) Royalty revisions (122) (452) (403) (311) GST revisions (132) (210) (223) (131) Natural disaster revisions3 Change in revenue (31) (1,241) 1,243 775 Change in expenses 774 (851) (896) .. Net change 743 (2,092) 347 775 Measures4 Expense (30) (162) (217) (180) Revenue .. 259 386 409 Net (30) 98 169 229 Net flows from PNFC sector entities5 98 7 (36) (44) Australian Government funding revisions6 159 (325) 98 (30) Other parameter adjustments7 1,255 126 (350) (274) 2013-14 Budget net operating balance (4,741) (3,760) 2,091 2,043
FISCAL BALANCE
2012-13 MYFER fiscal balance (11,213) (4,647) 534 670 Change in net operating balance 1,958 (2,977) (602) (78) Natural disaster capital revisions3 (59) (616) (179) .. Measures 527 (73) (73) (44) Other capital movements8 101 648 75 517 2013-14 Budget fiscal balance (8,686) (7,664) (244) 1,065
Notes: 1. Numbers may not add due to rounding. Denotes impact on the operating and fiscal balance. 2. Represents parameter adjustments to taxation revenue. It does not include taxation revenue measures. 3. Represents movements in revenue, expense and capital for natural disaster restoration and largely represents
the State’s cost of damage from ex-Tropical Cyclone Oswald and a re-cashflowing of expenditure and revenue. 4. Reflects the value of Government decisions since the 2012-13 MYFER. This number will not match Budget
Paper 4 – Budget Measures as it excludes measures funded by the Commonwealth Government since the 2012-13 MYFER and is net of funds held centrally for these measures.
5. Represents revisions to dividends and tax equivalent payments from, and community service obligation payments to, PNFCs and PFCs.
6. Represents the net impact of funding provided by the Australian Government primarily for Specific Purpose Payments and National Partnership payments.
7. Refers to adjustments largely of a non-policy nature, primarily a reduction in expected redundancy payments, additional revenue from cash bidding which cannot be disclosed for commercial reasons, changes in interest paid on borrowings, changes in depreciation, growth funding and administered revenue.
8. Refers to capital movements including the change in timing of capital payments including deferrals, capital payables and receivables and changes in inventories and depreciation.
8 Budget Strategy and Outlook 2013-14
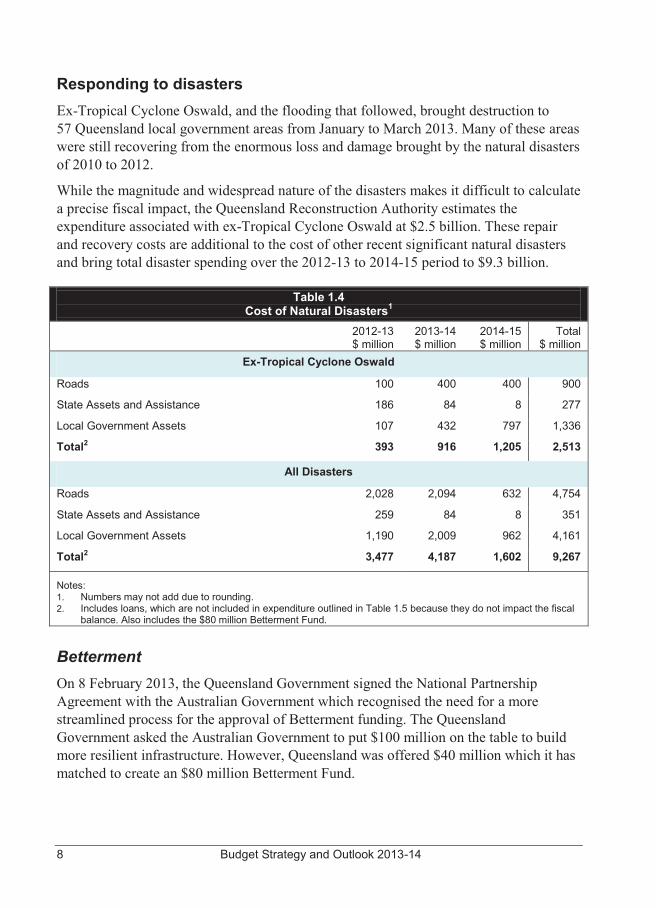
Responding to disasters Ex-Tropical Cyclone Oswald, and the flooding that followed, brought destruction to 57 Queensland local government areas from January to March 2013. Many of these areas were still recovering from the enormous loss and damage brought by the natural disasters of 2010 to 2012.
While the magnitude and widespread nature of the disasters makes it difficult to calculate a precise fiscal impact, the Queensland Reconstruction Authority estimates the expenditure associated with ex-Tropical Cyclone Oswald at $2.5 billion. These repair and recovery costs are additional to the cost of other recent significant natural disasters and bring total disaster spending over the 2012-13 to 2014-15 period to $9.3 billion.
Table 1.4 Cost of Natural Disasters1
2012-13 $ million
2013-14 $ million
2014-15 $ million
Total $ million
Ex-Tropical Cyclone Oswald
Roads 100 400 400 900
State Assets and Assistance 186 84 8 277
Local Government Assets 107 432 797 1,336
Total2 393 916 1,205 2,513
All Disasters
Roads 2,028 2,094 632 4,754
State Assets and Assistance 259 84 8 351
Local Government Assets 1,190 2,009 962 4,161
Total2 3,477 4,187 1,602 9,267
Notes: 1. Numbers may not add due to rounding. 2. Includes loans, which are not included in expenditure outlined in Table 1.5 because they do not impact the fiscal
balance. Also includes the $80 million Betterment Fund. Betterment On 8 February 2013, the Queensland Government signed the National Partnership Agreement with the Australian Government which recognised the need for a more streamlined process for the approval of Betterment funding. The Queensland Government asked the Australian Government to put $100 million on the table to build more resilient infrastructure. However, Queensland was offered $40 million which it has matched to create an $80 million Betterment Fund.
Budget Strategy and Outlook 2013-14 9
A number of roads and bridges have been rendered inaccessible on multiple occasions as a result of weather events in recent years. A map identifying the number of times sections of the State-controlled road network have been impacted by events is available at www.qldreconstruction.org.au.
The Queensland Government has identified a number of proposed betterment works, including sealing and strengthening road pavements and installing flood mitigation infrastructure. Betterment projects already benefiting from the Fund include:
� Gayndah Water Intake (North Burnett Regional Council)
� Blacks Road, Isis River (Bundaberg Regional Council)
� Barretts Road, Isis River (Bundaberg Regional Council)
� Gentle Annie Bridge, Apple Tree Creek (Bundaberg Regional Council).
Australian Government payments The Australian Government released its 2013-14 Budget on 14 May 2013. As well as reducing forecasts for Queensland’s share of GST revenue, the Australian Government again reduced forecasts for health payments. Since the 2012-13 Budget, the Australian Government has reduced health funding forecasts by approximately $476 million across the forward estimates.
In addition, the Australian Government has continued its practice of moving cash payments to suit its own fiscal requirements, rather than to align with the actual delivery of services. Funding from the Australian Government has a significant impact on Queensland’s fiscal position when it is not matched by an expense in the same financial year. This increases the volatility of the Queensland Budget estimate and makes it difficult to identify underlying trends over time.
The timing of revenue and expenditure in relation to natural disasters has significantly impacted Queensland’s headline fiscal balance. In particular, the Australian Government provided significant natural disaster funding in 2010-11 and 2011-12 in advance of spending requirements with the remaining payments in arrears of expenditure. This timing mismatch had the effect of improving Queensland’s budget outcomes in 2011-12, but is negatively impacting the State’s fiscal position in 2012-13 and 2013-14.
10 Budget Strategy and Outlook 2013-14
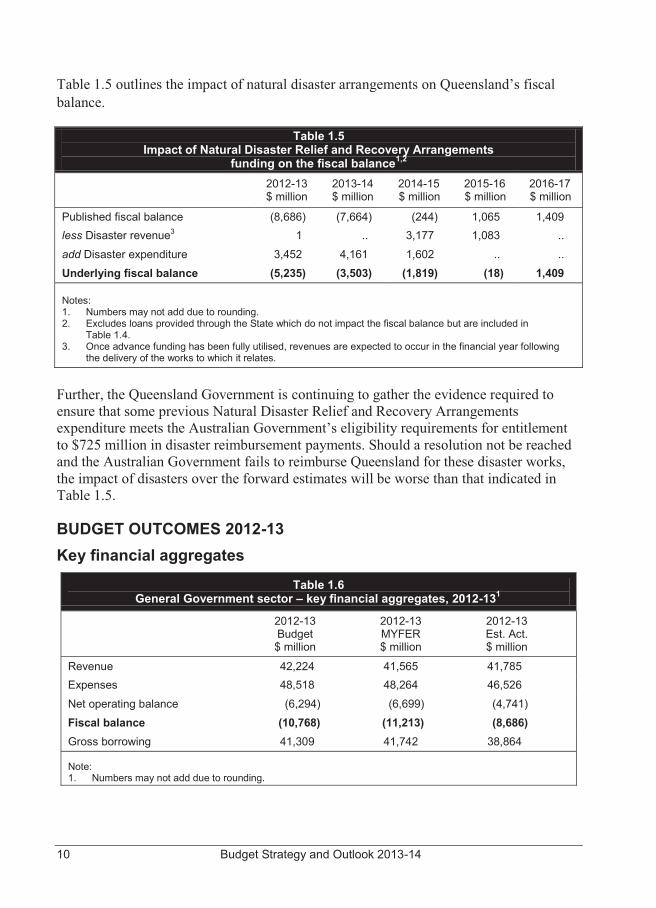
Table 1.5 outlines the impact of natural disaster arrangements on Queensland’s fiscal balance.
Table 1.5 Impact of Natural Disaster Relief and Recovery Arrangements
funding on the fiscal balance1,2 2012-13
$ million 2013-14 $ million
2014-15 $ million
2015-16 $ million
2016-17 $ million
Published fiscal balance (8,686) (7,664) (244) 1,065 1,409 less Disaster revenue3 1 .. 3,177 1,083 ..
add Disaster expenditure 3,452 4,161 1,602 .. .. Underlying fiscal balance (5,235) (3,503) (1,819) (18) 1,409
Notes: 1. Numbers may not add due to rounding. 2. Excludes loans provided through the State which do not impact the fiscal balance but are included in
Table 1.4. 3. Once advance funding has been fully utilised, revenues are expected to occur in the financial year following
the delivery of the works to which it relates.
Further, the Queensland Government is continuing to gather the evidence required to ensure that some previous Natural Disaster Relief and Recovery Arrangements expenditure meets the Australian Government’s eligibility requirements for entitlement to $725 million in disaster reimbursement payments. Should a resolution not be reached and the Australian Government fails to reimburse Queensland for these disaster works, the impact of disasters over the forward estimates will be worse than that indicated in Table 1.5.
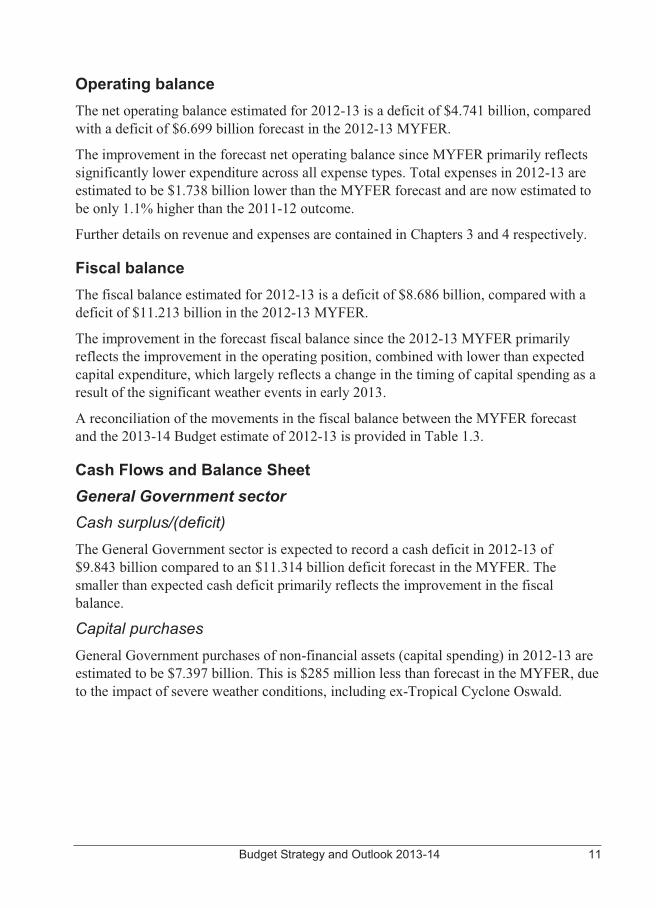
BUDGET OUTCOMES 2012-13 Key financial aggregates
Table 1.6 General Government sector – key financial aggregates, 2012-131
2012-13 Budget $ million
2012-13 MYFER $ million
2012-13 Est. Act. $ million
Revenue 42,224 41,565 41,785 Expenses 48,518 48,264 46,526
Net operating balance (6,294) (6,699) (4,741)
Fiscal balance (10,768) (11,213) (8,686) Gross borrowing 41,309 41,742 38,864
Note: 1. Numbers may not add due to rounding.
Budget Strategy and Outlook 2013-14 11
Operating balance The net operating balance estimated for 2012-13 is a deficit of $4.741 billion, compared with a deficit of $6.699 billion forecast in the 2012-13 MYFER.
The improvement in the forecast net operating balance since MYFER primarily reflects significantly lower expenditure across all expense types. Total expenses in 2012-13 are estimated to be $1.738 billion lower than the MYFER forecast and are now estimated to be only 1.1% higher than the 2011-12 outcome.
Further details on revenue and expenses are contained in Chapters 3 and 4 respectively.
Fiscal balance The fiscal balance estimated for 2012-13 is a deficit of $8.686 billion, compared with a deficit of $11.213 billion in the 2012-13 MYFER.
The improvement in the forecast fiscal balance since the 2012-13 MYFER primarily reflects the improvement in the operating position, combined with lower than expected capital expenditure, which largely reflects a change in the timing of capital spending as a result of the significant weather events in early 2013.
A reconciliation of the movements in the fiscal balance between the MYFER forecast and the 2013-14 Budget estimate of 2012-13 is provided in Table 1.3.
Cash Flows and Balance Sheet General Government sector Cash surplus/(deficit) The General Government sector is expected to record a cash deficit in 2012-13 of $9.843 billion compared to an $11.314 billion deficit forecast in the MYFER. The smaller than expected cash deficit primarily reflects the improvement in the fiscal balance.
Capital purchases General Government purchases of non-financial assets (capital spending) in 2012-13 are estimated to be $7.397 billion. This is $285 million less than forecast in the MYFER, due to the impact of severe weather conditions, including ex-Tropical Cyclone Oswald.
12 Budget Strategy and Outlook 2013-14
Borrowings Net borrowings (additional borrowings for the year as itemised in the Cash Flow Statement) of $9.043 billion are expected in 2012-13, $3.056 billion less than forecast in the MYFER, primarily reflecting the lower cash deficit including the proceeds from the sale and leaseback of government office accommodation.
Gross borrowings (the stock of borrowings outstanding as stated in the Balance Sheet) of $38.864 billion are estimated at 30 June 2013. The reduction in net borrowing requirements as a result of the improved fiscal position is the key driver of the gross borrowings estimate being $2.878 billion less than the MYFER estimate.
Public Non-financial Corporations sector The Public Non-financial Corporations (PNFC) sector is comprised of the State’s commercial entities, such as those that operate in the energy, transport and water industries. Further detail on the PNFC sector is provided in Chapter 7.
The PNFC sector is expecting a net repayment of $1.263 billion of borrowings in 2012-13, similar to the $1.231 billion 2012-13 MYFER estimate, largely reflecting lower capital spending in the sector. Gross borrowings in the PNFC sector of $30.626 billion are projected at 30 June 2013, slightly below the MYFER estimate of $30.705 billion.
Non-financial Public sector The Non-financial Public (NFP) sector is the combination of the General Government and Public Non-financial Corporations (PNFC) sectors, with transactions between these sectors being eliminated.
Net borrowings of $7.779 billion are expected in the NFP sector in 2012-13, a decrease of $3.089 billion compared with the 2012-13 MYFER estimate, primarily driven by the improvement in the fiscal balance in the General Government sector.
Gross borrowings of $69.49 billion are projected at 30 June 2013, comprising $38.864 billion in the General Government sector and $30.626 billion in the PNFC sector. Total NFP sector borrowings are expected to be $2.957 billion less than the MYFER estimate, largely reflecting the lower borrowing requirement in the General Government in 2012-13.
Capital purchases of $11.355 billion are expected in the NFP sector in 2012-13, $826 million lower than MYFER estimate.
Budget Strategy and Outlook 2013-14 13
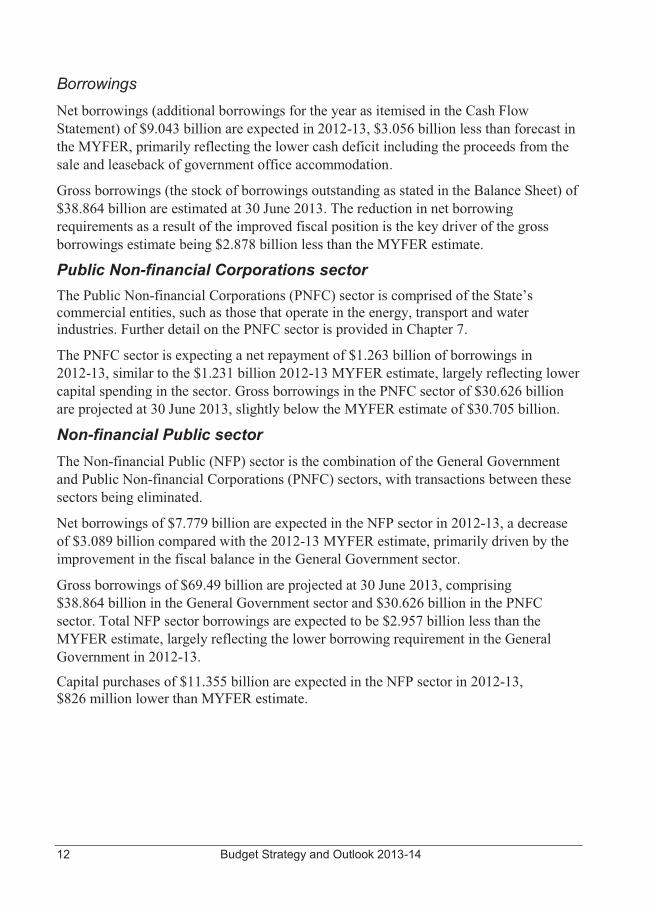
2013-14 BUDGET AND OUTYEAR PROJECTIONS Key financial aggregates Table 1.7 provides aggregate actual outcome information for 2011-12, estimated actual outcome information for 2012-13, forecasts for 2013-14 and projections for the outyears.
Table 1.7 General Government sector – key financial aggregates1
2011-12 Actual2 $ million
2012-13 Est. Act. $ million
2013-14 Budget $ million
2014-15 Projection $ million
2015-16 Projection $ million
2016-17 Projection $ million
Revenue 45,794 41,785 44,677 51,235 51,838 53,205 Expenses 46,027 46,526 48,436 49,144 49,795 51,492
Net operating balance (233) (4,741) (3,760) 2,091 2,043 1,713 Fiscal balance (5,482) (8,686) (7,664) (244) 1,065 1,409 Gross borrowing 29,513 38,864 47,196 48,490 48,270 48,003
Notes: 1. Numbers may not add due to rounding. 2. Reflects published actuals.
Operating balance 2013-14 Budget A net operating deficit of $3.76 billion is budgeted for 2013-14, compared with an estimated deficit of $783 million in the MYFER.
The deterioration in the forecast operating position since MYFER is largely driven by the incorporation of expenditure associated with ex-Tropical Cyclone Oswald and changes to the timing of Natural Disaster Relief and Recovery Arrangement revenue.
As shown in Table 1.5, there is a significant mismatch between the timing of natural disaster revenue from the Australian Government and the timing of the associated expenditure.
Grant funding from the Australian Government, excluding GST, is expected to be approximately $1.5 billion lower in 2013-14 than estimated at MYFER. The main contributors to this reduction are changes in the timing of funding for natural disasters and local government grant funding (paid via the State) being brought forward into 2012-13.
14 Budget Strategy and Outlook 2013-14
The other key drivers in the deterioration of the forecast 2013-14 net operating position since the 2012-13 MYFER are:
� a $452 million reduction in forecast royalty revenue, largely due to a weaker outlook for coal prices
� a $210 million reduction in Queensland’s forecast share of GST revenue, as a result of the Australian Government revising down the size of the national GST pool and also revising down Queensland’s share of the national population
� a $129 million underlying reduction in taxation revenue, primarily reflecting a slower recovery in property market activity and weakness in taxable land values.
Forward estimates Significant improvements in the net operating balance are projected over the forward estimates as a result of the fiscal repair measures announced in the 2012-13 Budget, which were estimated to improve the fiscal balance by an average of $2.4 billion per annum from 2013-14 onwards.
The 2013-14 Budget demonstrates the Government’s ongoing commitment to fiscal discipline. While the Government is implementing service delivery enhancements, such as Great Teachers = Great Results, the budget impact of spending measures since the 2012-13 Budget has been offset across the forward estimates by saving and revenue measures.
Total operating expenses are expected to grow by 4.1% in 2013-14, with the largest component of this growth relating to grants to local governments associated with disaster recovery. Abstracting from disaster related expenditure, operating expenses are expected to grow by 2.8%. Expenses are projected to continue to grow modestly from 2014-15 onwards.
Budget Strategy and Outlook 2013-14 15
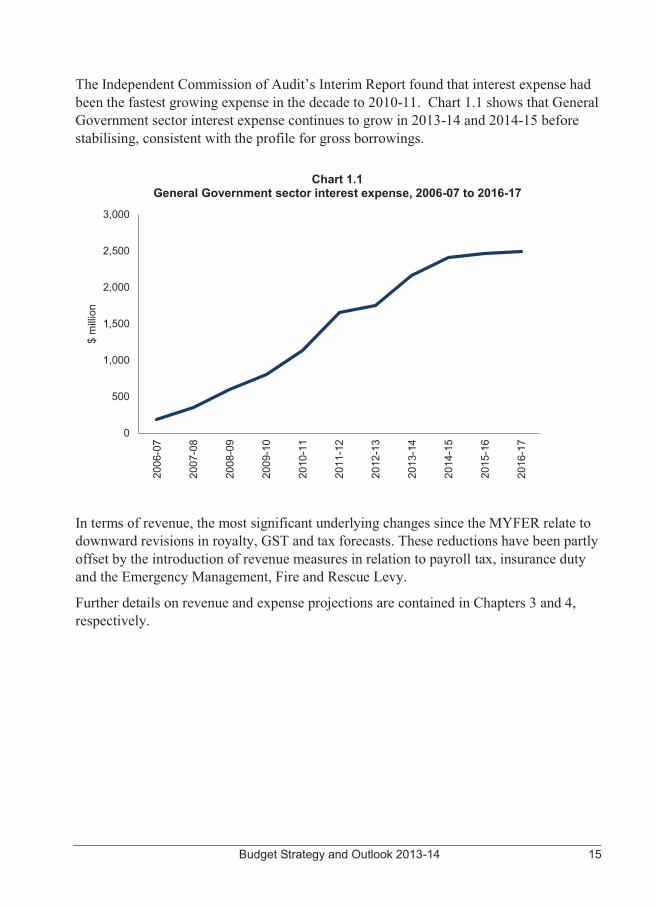
The Independent Commission of Audit’s Interim Report found that interest expense had been the fastest growing expense in the decade to 2010-11. Chart 1.1 shows that General Government sector interest expense continues to grow in 2013-14 and 2014-15 before stabilising, consistent with the profile for gross borrowings.
Chart 1.1
General Government sector interest expense, 2006-07 to 2016-17
In terms of revenue, the most significant underlying changes since the MYFER relate to downward revisions in royalty, GST and tax forecasts. These reductions have been partly offset by the introduction of revenue measures in relation to payroll tax, insurance duty and the Emergency Management, Fire and Rescue Levy.
Further details on revenue and expense projections are contained in Chapters 3 and 4, respectively.
0
500
1,000
1,500
2,000
2,500
3,000
2006
-07
2007
-08
2008
-09
2009
-10
2010
-11
2011
-12
2012
-13
2013
-14
2014
-15
2015
-16
2016
-17
$ m
illio
n
16 Budget Strategy and Outlook 2013-14
Fiscal balance A fiscal deficit of $7.664 billion is budgeted for 2013-14. As with the operating balance, the estimated fiscal balance is significantly impacted by the expenditure associated with natural disasters, including ex-Tropical Cyclone Oswald, and the timing of Australian Government funding, particularly the mismatch between natural disaster revenue and expenditure. The estimated impact of natural disaster arrangements on the fiscal balance across the forward estimates is outlined in Table 1.5 earlier in this chapter.
The extent of this mismatch in 2013-14, now estimated at $4.161 billion, has increased substantially since MYFER, where it was estimated at $1.453 billion.
The fiscal deficit expected in 2013-14 represents a $3.017 billion deterioration from the 2012-13 MYFER estimate of $4.647 billion, largely reflecting the revisions to the operating position.
From 2014-15 onwards, there is a significant improvement in the fiscal balance each year as natural disaster expenses reduce and revenue grows faster than expenditure.
Cash Flows and Balance Sheet General Government Sector Cash surplus/(deficit) A cash deficit of $7.469 billion is expected for the General Government sector in 2013-14, reducing to $134 million in 2014-15, with cash surpluses in excess of $1 billion projected from 2015-16 onwards.
Capital purchases Total General Government capital purchases of $7.13 billion are budgeted for 2013-14, slightly lower than the $7.228 billion forecast in the 2012-13 MYFER. Budget Paper 3 – Capital Statement provides details of budgeted 2013-14 capital outlays, by portfolio.
Over the period 2013-14 to 2016-17, purchases of non-financial assets (capital purchases) in the General Government sector of $20.928 billion are planned.
Borrowings Net borrowings of $7.966 billion are budgeted for 2013-14, with the $2.352 billion deterioration since 2012-13 MYFER driven by the same factors as the deterioration in the fiscal balance. Net borrowing requirements improve significantly across the forward estimates, leading to a stabilisation of debt.
The net borrowing requirement is larger than implied by the fiscal balance each year due to the reinvestment of earnings on financial assets, equity injections to PNFC entities and the non-cash nature of some items in the Operating Statement.
Budget Strategy and Outlook 2013-14 17
Gross borrowings of $47.196 billion are expected in the General Government sector at 30 June 2014, similar to the 2012-13 MYFER forecast of $47.103 billion, reflecting the lower borrowing requirement in 2012-13 being offset by the higher borrowing requirement in 2013-14.
Over the Budget and forward estimates period, total General Government net borrowings of $8.74 billion are planned. Gross borrowings are expected to peak at $48.49 billion at 30 June 2015, before declining slightly to $48.003 billion at 30 June 2017. This would represent the first reduction in General Government gross borrowings since 2005-06.
Non-financial Public Sector Net borrowings in 2013-14 are estimated at $8.496 billion, compared to a 2012-13 MYFER forecast of $6.839 billion. This largely reflects the deterioration in the General Government sector’s fiscal balance, partially offset by a lower than expected borrowing requirement in the PNFC sector.
Total net borrowings across 2013-14 and the forward estimates are expected to be $11.653 billion. These borrowings represent less than a third of the planned $36.274 billion of purchases of non-financial assets in this period, which includes $15.346 billion in the PNFC sector.
Gross NFP sector borrowings of $78.125 billion are expected at 30 June 2014, $1 billion below the 2012-13 MYFER forecast of $79.135 billion, reflecting a lower borrowing requirement in the PNFC sector.
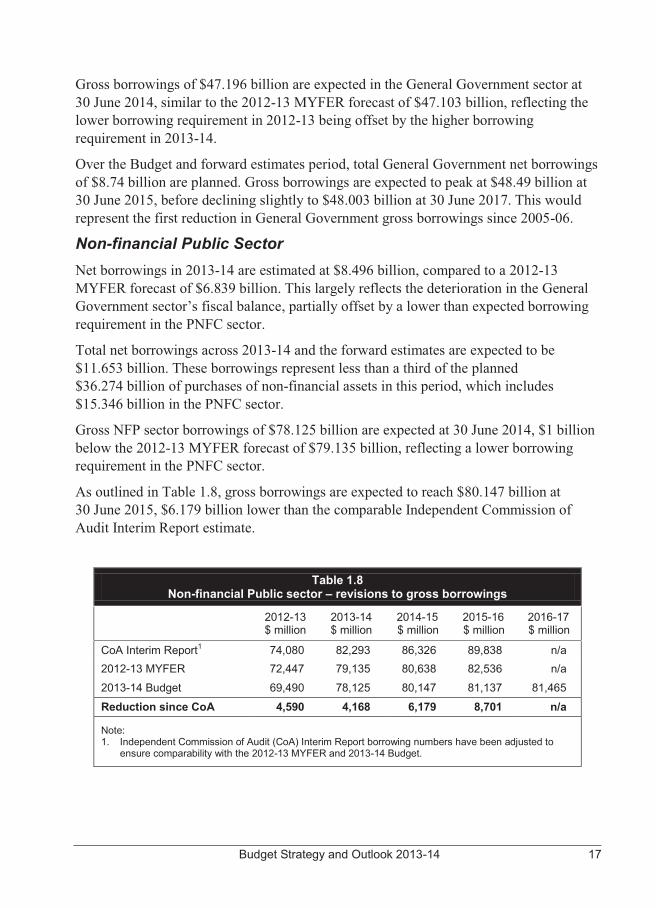
As outlined in Table 1.8, gross borrowings are expected to reach $80.147 billion at 30 June 2015, $6.179 billion lower than the comparable Independent Commission of Audit Interim Report estimate.
Table 1.8 Non-financial Public sector – revisions to gross borrowings
2012-13
$ million 2013-14 $ million
2014-15 $ million
2015-16 $ million
2016-17 $ million
CoA Interim Report1 74,080 82,293 86,326 89,838 n/a 2012-13 MYFER 72,447 79,135 80,638 82,536 n/a
2013-14 Budget 69,490 78,125 80,147 81,137 81,465
Reduction since CoA 4,590 4,168 6,179 8,701 n/a
Note: 1. Independent Commission of Audit (CoA) Interim Report borrowing numbers have been adjusted to
ensure comparability with the 2012-13 MYFER and 2013-14 Budget.
18 Budget Strategy and Outlook 2013-14
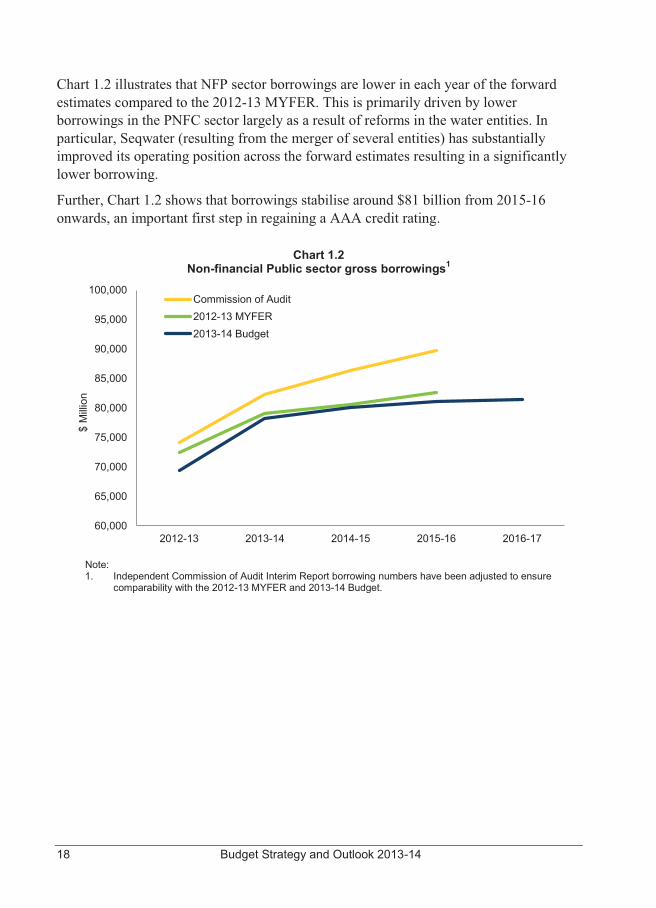
Chart 1.2 illustrates that NFP sector borrowings are lower in each year of the forward estimates compared to the 2012-13 MYFER. This is primarily driven by lower borrowings in the PNFC sector largely as a result of reforms in the water entities. In particular, Seqwater (resulting from the merger of several entities) has substantially improved its operating position across the forward estimates resulting in a significantly lower borrowing.
Further, Chart 1.2 shows that borrowings stabilise around $81 billion from 2015-16 onwards, an important first step in regaining a AAA credit rating.
Chart 1.2
Non-financial Public sector gross borrowings1
Note: 1. Independent Commission of Audit Interim Report borrowing numbers have been adjusted to ensure
comparability with the 2012-13 MYFER and 2013-14 Budget.
60,000
65,000
70,000
75,000
80,000
85,000
90,000
95,000
100,000
2012-13 2013-14 2014-15 2015-16 2016-17
$ M
illio
n
Commission of Audit2012-13 MYFER2013-14 Budget
Budget Strategy and Outlook 2013-14 19
FISCAL STRATEGY AS A GUIDING PRINCIPLE FOR POLICY The Government undertook significant fiscal reform in the 2012-13 Budget. Without this reform the Government would not have been as well placed to meet the costs associated with the rebuilding task arising from the ex-Tropical Cyclone Oswald. However, the extent of the disaster repairs and continued weakness in global economic conditions has created further fiscal challenges for Government.
Savings on Track The 2012-13 Budget included measures worth $7.766 billion over the period 2012-13 to 2015-16, comprising:
� expense measures of $5.277 billion � revenue measures of $0.812 billion � capital measures of $1.677 billion.
These measures were largely achieved by Government exiting activities that are not the domain of the Queensland Government, by reducing waste and inefficiency in Government activities and by implementing specifically targeted revenue measures.
The Government implemented a number of expense measures in late 2011-12 (for example, $431.2 million from 2011-12 to 2014-15 from the abolition of redundant carbon schemes) or part way through 2012-13 (for example, $287.7 million from 2012-13 to 2015-16 from ceasing state employment programs which are appropriately the responsibility of the Australian Government). Once implemented, these measures resulted in ongoing annual savings.
Another major component of the 2012-13 Budget fiscal measures was a 14,000 reduction in Full Time Equivalent (FTE) positions in 2012-13 including 10,600 redundancies. As outlined in Chapter 4, the Government is now estimating the reduction in FTEs in 2012-13 to be 12,800, including approximately 9,200 redundancies.
The Government has clearly demonstrated its ability to manage expenditure, with operating expenses in 2012-13 estimated to be $2 billion lower than budgeted. It is estimated that total operating expenses in 2012-13 will be only 1.1% above 2011-12 levels.
Ongoing monitoring of Government activity will ensure that forecast savings continue to be met across the forward estimates. As part of this monitoring process, the Government has decided that departments will achieve further savings of $100 million per annum from 2013-14. More detail on this measure can be found in Chapter 4 of this Budget Paper and in Budget Paper 4 – Budget Measures.
20 Budget Strategy and Outlook 2013-14
Improvements in Key Measures of Queensland’s Fiscal Position
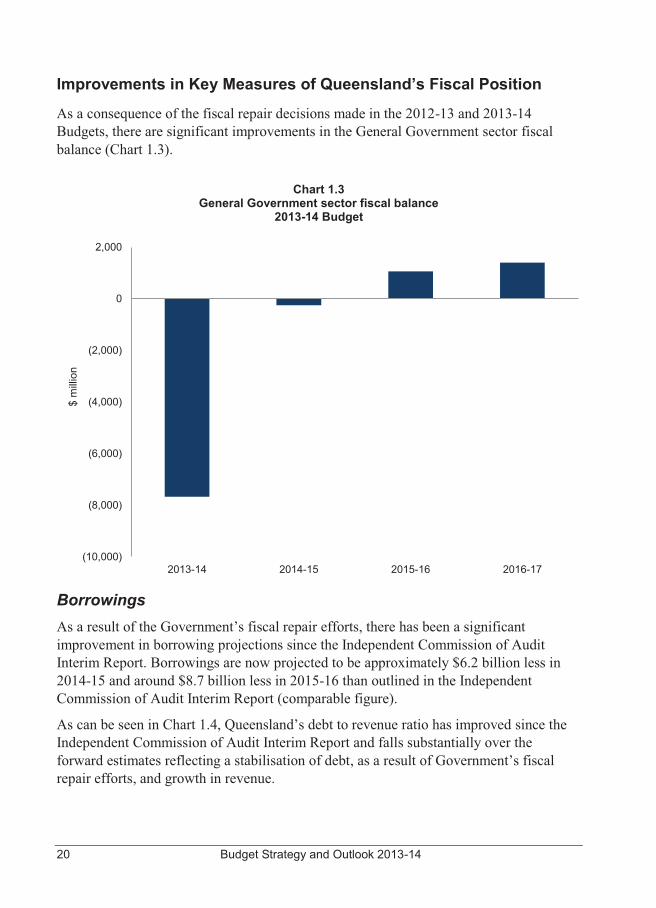
As a consequence of the fiscal repair decisions made in the 2012-13 and 2013-14 Budgets, there are significant improvements in the General Government sector fiscal balance (Chart 1.3).
Chart 1.3
General Government sector fiscal balance 2013-14 Budget
Borrowings As a result of the Government’s fiscal repair efforts, there has been a significant improvement in borrowing projections since the Independent Commission of Audit Interim Report. Borrowings are now projected to be approximately $6.2 billion less in 2014-15 and around $8.7 billion less in 2015-16 than outlined in the Independent Commission of Audit Interim Report (comparable figure).
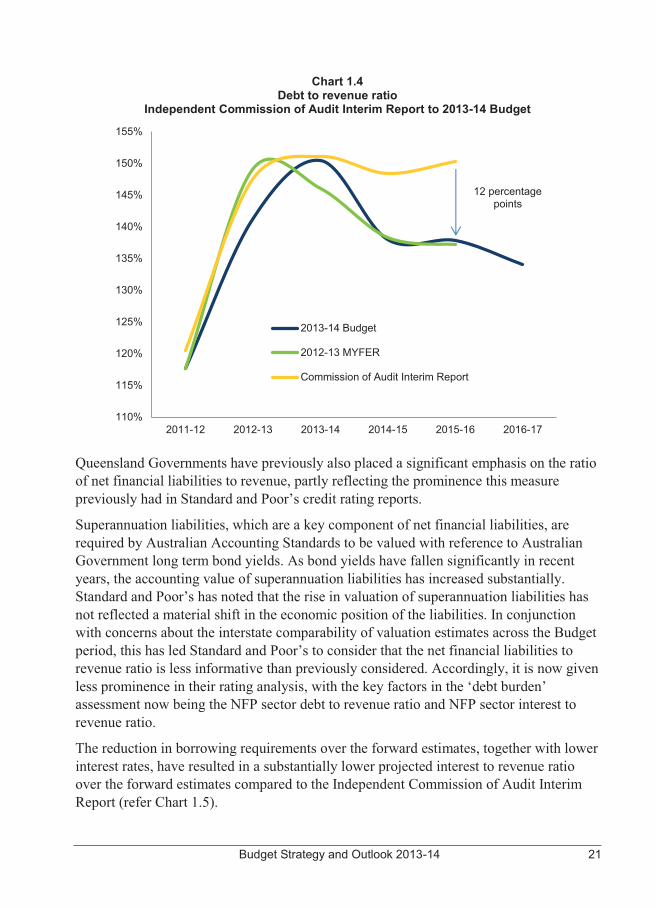
As can be seen in Chart 1.4, Queensland’s debt to revenue ratio has improved since the Independent Commission of Audit Interim Report and falls substantially over the forward estimates reflecting a stabilisation of debt, as a result of Government’s fiscal repair efforts, and growth in revenue.
(10,000)
(8,000)
(6,000)
(4,000)
(2,000)
0
2,000
2013-14 2014-15 2015-16 2016-17
$ m
illio
n
Budget Strategy and Outlook 2013-14 21
Chart 1.4 Debt to revenue ratio
Independent Commission of Audit Interim Report to 2013-14 Budget
Queensland Governments have previously also placed a significant emphasis on the ratio of net financial liabilities to revenue, partly reflecting the prominence this measure previously had in Standard and Poor’s credit rating reports.
Superannuation liabilities, which are a key component of net financial liabilities, are required by Australian Accounting Standards to be valued with reference to Australian Government long term bond yields. As bond yields have fallen significantly in recent years, the accounting value of superannuation liabilities has increased substantially. Standard and Poor’s has noted that the rise in valuation of superannuation liabilities has not reflected a material shift in the economic position of the liabilities. In conjunction with concerns about the interstate comparability of valuation estimates across the Budget period, this has led Standard and Poor’s to consider that the net financial liabilities to revenue ratio is less informative than previously considered. Accordingly, it is now given less prominence in their rating analysis, with the key factors in the ‘debt burden’ assessment now being the NFP sector debt to revenue ratio and NFP sector interest to revenue ratio.
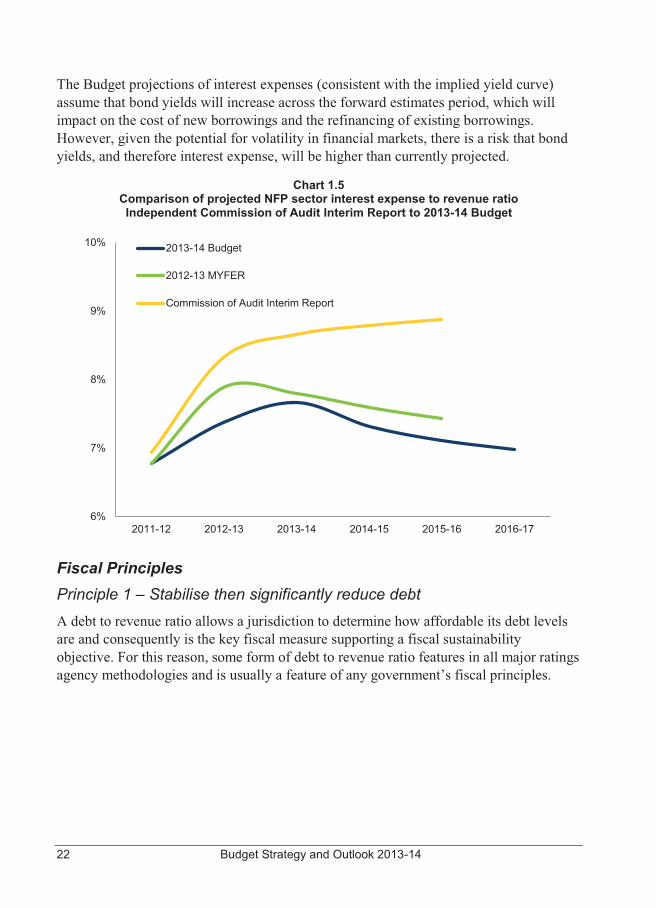
The reduction in borrowing requirements over the forward estimates, together with lower interest rates, have resulted in a substantially lower projected interest to revenue ratio over the forward estimates compared to the Independent Commission of Audit Interim Report (refer Chart 1.5).
110%
115%
120%
125%
130%
135%
140%
145%
150%
155%
2011-12 2012-13 2013-14 2014-15 2015-16 2016-17
2013-14 Budget
2012-13 MYFER
Commission of Audit Interim Report
12 percentage points
22 Budget Strategy and Outlook 2013-14
The Budget projections of interest expenses (consistent with the implied yield curve) assume that bond yields will increase across the forward estimates period, which will impact on the cost of new borrowings and the refinancing of existing borrowings. However, given the potential for volatility in financial markets, there is a risk that bond yields, and therefore interest expense, will be higher than currently projected.
Chart 1.5
Comparison of projected NFP sector interest expense to revenue ratio Independent Commission of Audit Interim Report to 2013-14 Budget
Fiscal Principles Principle 1 – Stabilise then significantly reduce debt A debt to revenue ratio allows a jurisdiction to determine how affordable its debt levels are and consequently is the key fiscal measure supporting a fiscal sustainability objective. For this reason, some form of debt to revenue ratio features in all major ratings agency methodologies and is usually a feature of any government’s fiscal principles.
6%
7%
8%
9%
10%
2011-12 2012-13 2013-14 2014-15 2015-16 2016-17
2013-14 Budget
2012-13 MYFER
Commission of Audit Interim Report
Budget Strategy and Outlook 2013-14 23
Principle 2 – Achieve and maintain a General Government sector fiscal balance by 2014-15 The Independent Commission of Audit’s Interim Report emphasised that fiscal repair requires realigning recurrent and capital spending so that it can be funded from recurrent revenue. The achievement of an operating surplus in itself is not sufficient for Government to attain fiscal sustainability or maintain or improve its credit rating given the impact of capital investment on the debt position.
Borrowing should not be undertaken for the maintenance of the existing capital base. This means that Government needs a minimum of a balanced operating position (depreciation and maintenance are expensed) with any operating surplus used to fund new capital expansion. The size of that surplus should be determined by the appropriate size of the capital program and the sustainability of current debt levels.
While it is arguably appropriate to borrow for new essential infrastructure when debt levels are manageable, they are currently too high.
Accordingly, the fiscal balance has replaced the operating balance as the primary fiscal target of the Government.
In the 2013-14 Budget, the Government has implemented savings and revenue measures that offset expenditure decisions since MYFER, and is continuing to deliver the savings outlined in the 2012-13 Budget. Nevertheless, the scale of natural disasters and revenue write-downs has resulted in a modest fiscal deficit of $244 million (or 0.5% of General Government revenue) being projected for 2014-15. The Government will continue to pursue a fiscal balance in 2014-15 as a policy objective.
Principle 3 – Maintain a competitive tax environment for business Queensland has a competitive tax environment for business. Queensland’s General Government taxation revenue as a percentage of gross state product has fallen over the past decade (in part reflecting the relative weakness in the property sector and the abolition of state taxes under the Intergovernmental Agreement on Federal Financial Relations). Queensland’s tax take, on a per capita basis, is also significantly less than the average of the other states.
Principle 4 – Target full funding of long term liabilities such as superannuation in accordance with actuarial advice One of the enduring features of Queensland public finance has been setting aside funding, on an actuarially determined basis, to meet long term employee entitlements – most notably superannuation and long service leave.
24 Budget Strategy and Outlook 2013-14
Uniquely, despite the very difficult climate in investment markets over recent years (and with the transfer of the Queensland Motorways Ltd asset), Queensland’s superannuation liabilities remain fully funded as per the last formal actuarial valuation. The Australian Government and other states have plans that aspire to this over the coming decades.
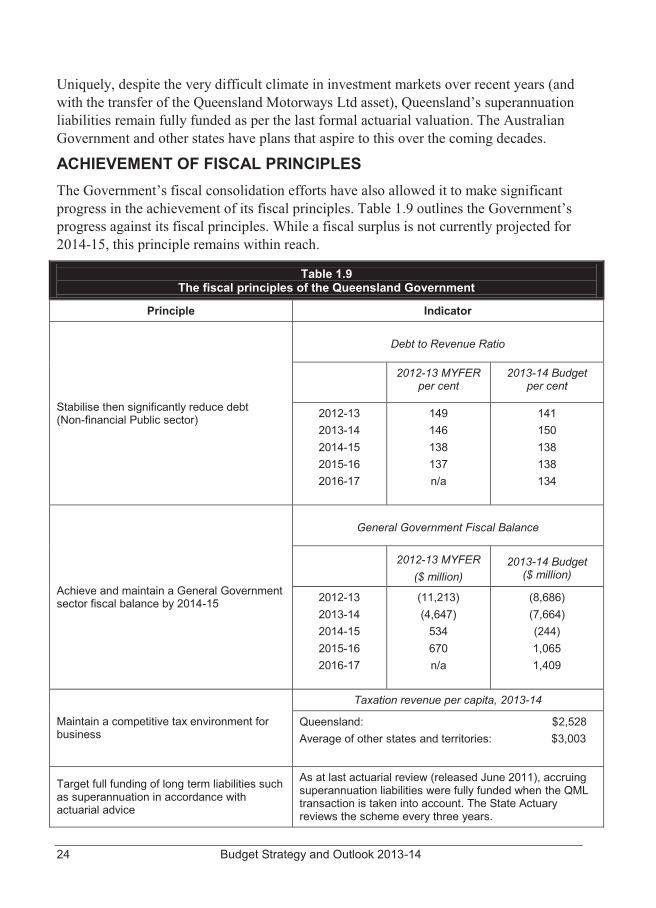
ACHIEVEMENT OF FISCAL PRINCIPLES The Government’s fiscal consolidation efforts have also allowed it to make significant progress in the achievement of its fiscal principles. Table 1.9 outlines the Government’s progress against its fiscal principles. While a fiscal surplus is not currently projected for 2014-15, this principle remains within reach.
Table 1.9 The fiscal principles of the Queensland Government
Principle Indicator
Stabilise then significantly reduce debt (Non-financial Public sector)
Debt to Revenue Ratio
2012-13 MYFER per cent
2013-14 Budget per cent
2012-13 2013-14 2014-15 2015-16 2016-17
149 146 138 137 n/a
141 150 138 138 134
Achieve and maintain a General Government sector fiscal balance by 2014-15
General Government Fiscal Balance
2012-13 MYFER
($ million) 2013-14 Budget
($ million)
2012-13 2013-14 2014-15 2015-16 2016-17
(11,213) (4,647)
534 670 n/a
(8,686) (7,664) (244) 1,065 1,409
Maintain a competitive tax environment for business
Taxation revenue per capita, 2013-14
Queensland: $2,528 Average of other states and territories: $3,003
Target full funding of long term liabilities such as superannuation in accordance with actuarial advice
As at last actuarial review (released June 2011), accruing superannuation liabilities were fully funded when the QML transaction is taken into account. The State Actuary reviews the scheme every three years.
Budget Strategy and Outlook 2013-14 25
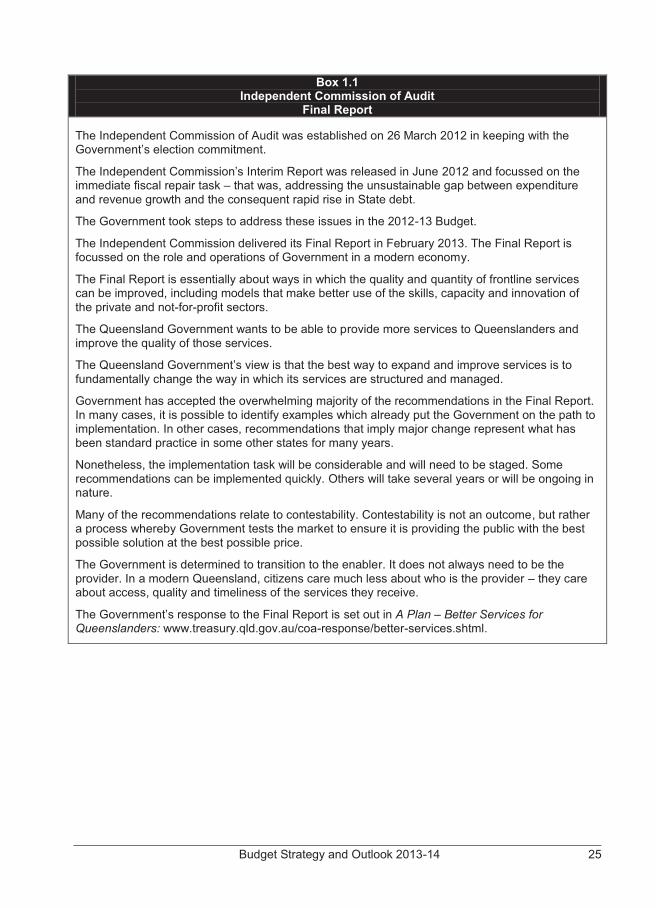
Box 1.1 Independent Commission of Audit
Final Report
The Independent Commission of Audit was established on 26 March 2012 in keeping with the Government’s election commitment.
The Independent Commission’s Interim Report was released in June 2012 and focussed on the immediate fiscal repair task – that was, addressing the unsustainable gap between expenditure and revenue growth and the consequent rapid rise in State debt.
The Government took steps to address these issues in the 2012-13 Budget.
The Independent Commission delivered its Final Report in February 2013. The Final Report is focussed on the role and operations of Government in a modern economy.
The Final Report is essentially about ways in which the quality and quantity of frontline services can be improved, including models that make better use of the skills, capacity and innovation of the private and not-for-profit sectors.
The Queensland Government wants to be able to provide more services to Queenslanders and improve the quality of those services.
The Queensland Government’s view is that the best way to expand and improve services is to fundamentally change the way in which its services are structured and managed.
Government has accepted the overwhelming majority of the recommendations in the Final Report. In many cases, it is possible to identify examples which already put the Government on the path to implementation. In other cases, recommendations that imply major change represent what has been standard practice in some other states for many years.
Nonetheless, the implementation task will be considerable and will need to be staged. Some recommendations can be implemented quickly. Others will take several years or will be ongoing in nature.
Many of the recommendations relate to contestability. Contestability is not an outcome, but rather a process whereby Government tests the market to ensure it is providing the public with the best possible solution at the best possible price.
The Government is determined to transition to the enabler. It does not always need to be the provider. In a modern Queensland, citizens care much less about who is the provider – they care about access, quality and timeliness of the services they receive.
The Government’s response to the Final Report is set out in A Plan – Better Services for Queenslanders: www.treasury.qld.gov.au/coa-response/better-services.shtml.

26 Budget Strategy and Outlook 2013-14
Budget Strategy and Outlook 2013-14 27
2 ECONOMIC PERFORMANCE AND OUTLOOK
FEATURES � Economic growth in Queensland’s major trading partners is expected to
strengthen from 2¾% in 2013 to 3¼% per annum from 2014 onwards, with non-Japan Asia continuing to be the main driver of growth.
� Queensland again faced the challenge of severe weather conditions in early 2013, with the impact on economic production estimated to be around one quarter of a percentage point of gross state product. As a result, Queensland economic growth is estimated to be 3½% in 2012-13, compared with 3¾% forecast in the 2012-13 Mid Year Fiscal and Economic Review.
� For three years, business investment has been boosted by the extraordinarily large investment in three liquefied natural gas (LNG) projects, whose capital expenditure exceeds $60 billion in the construction phase. This investment is expected to peak in 2013. With no projects of similar size currently committed to commence construction, the staged completion of these three mega-projects will see business investment fall in each year from 2013-14 to 2015-16.
� However, this unwinding of LNG investment masks a forecast improvement in investment conditions outside of the resources sector. This is in line with the Government’s strategy of broadening the economy through focusing on the four pillars of construction, tourism, resources and agriculture.
� Meanwhile, household consumption and dwelling investment are expected to strengthen over the forecast period due to a combination of low interest rates, stronger income growth and faster population growth.
� The resources sector is moving from an investment phase towards an export phase. Specifically, the ramp up in LNG production will drive growth in overseas exports by 23¼% in 2015-16 which, combined with a stronger domestic sector, will boost economic growth to 6% in that year.
� The forecast strengthening in the household sector is expected to drive a recovery in employment growth from 2013-14 onwards and a steady improvement in the unemployment rate from 6% in 2013-14 to 5½% in 2015-16.
28 Budget Strategy and Outlook 2013-14
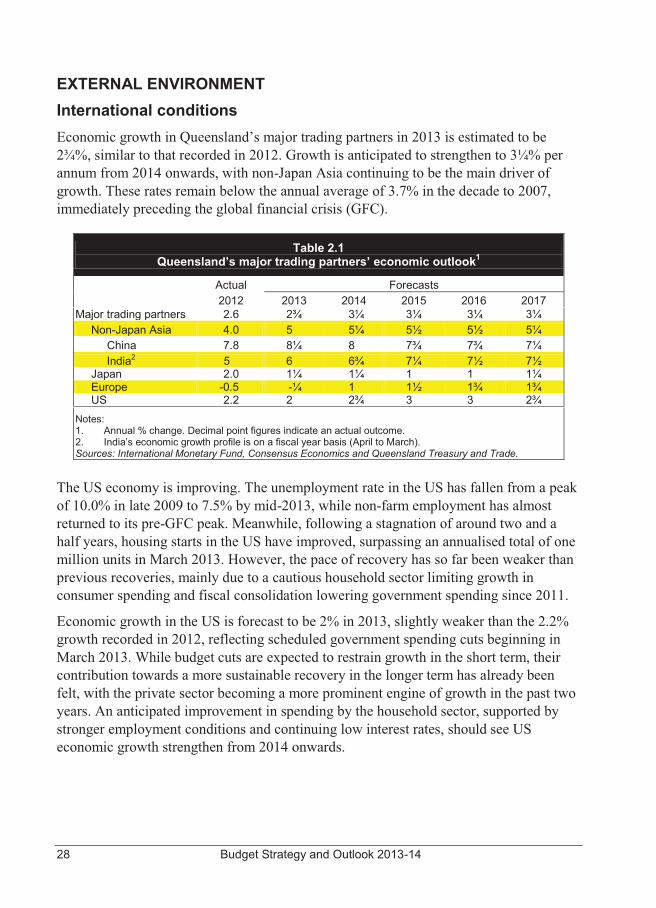
EXTERNAL ENVIRONMENT International conditions Economic growth in Queensland’s major trading partners in 2013 is estimated to be 2¾%, similar to that recorded in 2012. Growth is anticipated to strengthen to 3¼% per annum from 2014 onwards, with non-Japan Asia continuing to be the main driver of growth. These rates remain below the annual average of 3.7% in the decade to 2007, immediately preceding the global financial crisis (GFC).
Table 2.1 Queensland’s major trading partners’ economic outlook1
Actual Forecasts 2012 2013 2014 2015 2016 2017
Major trading partners 2.6 2¾ 3¼ 3¼ 3¼ 3¼ Non-Japan Asia 4.0 5 5¼ 5½ 5½ 5¼ China 7.8 8¼ 8 7¾ 7¾ 7¼ India2 5 6 6¾ 7¼ 7½ 7½ Japan 2.0 1¼ 1¼ 1 1 1¼ Europe -0.5 -¼ 1 1½ 1¾ 1¾ US 2.2 2 2¾ 3 3 2¾ Notes: 1. Annual % change. Decimal point figures indicate an actual outcome. 2. India’s economic growth profile is on a fiscal year basis (April to March). Sources: International Monetary Fund, Consensus Economics and Queensland Treasury and Trade.
The US economy is improving. The unemployment rate in the US has fallen from a peak of 10.0% in late 2009 to 7.5% by mid-2013, while non-farm employment has almost returned to its pre-GFC peak. Meanwhile, following a stagnation of around two and a half years, housing starts in the US have improved, surpassing an annualised total of one million units in March 2013. However, the pace of recovery has so far been weaker than previous recoveries, mainly due to a cautious household sector limiting growth in consumer spending and fiscal consolidation lowering government spending since 2011.
Economic growth in the US is forecast to be 2% in 2013, slightly weaker than the 2.2% growth recorded in 2012, reflecting scheduled government spending cuts beginning in March 2013. While budget cuts are expected to restrain growth in the short term, their contribution towards a more sustainable recovery in the longer term has already been felt, with the private sector becoming a more prominent engine of growth in the past two years. An anticipated improvement in spending by the household sector, supported by stronger employment conditions and continuing low interest rates, should see US economic growth strengthen from 2014 onwards.
Budget Strategy and Outlook 2013-14 29
In Japan, economic growth in 2012 was boosted by reconstruction related government expenditure, offsetting the decline in exports due to subdued overseas demand and high Yen exchange rates. Recognising the underlying weakness of the economy, the Bank of Japan launched another round of quantitative easing in September and October 2012. Subsequently, a large scale fiscal stimulus package was announced by the Japanese Government in January 2013.
In an attempt to end the deflation spiral in Japan, the Bank of Japan implemented an aggressive monetary easing regime in April 2013 that aims to lift the country’s inflation rate to the Bank’s increased target of 2% per annum in two years. As a result of these stimulatory policies, growth prospects for the Japanese economy have improved, with a moderate recovery anticipated from mid-2013 onwards. However, scheduled increases in the consumption tax in 2014 and 2015, together with an unwinding in reconstruction spending, may disrupt the pace of the recovery at that time.
Confronted by weakening overseas demand, Korea’s economic growth moderated to 2.0% in 2012. Although overseas demand may improve somewhat in 2013, the recent sharp depreciation of the Yen is likely to adversely affect Korea’s export performance and, therefore, its overall economic growth, due to the similarity of the two countries’ export profiles.
Despite the announcement of a large fiscal stimulus package in September 2012 and an easy monetary stance resulting in social financing increasing almost 23% in 2012, China’s economic growth slowed to 7.8% in the year. The focus of the new national leaders on income redistribution, together with the longer term objective of a more domestically driven economy, is expected to see China’s economic growth moderate somewhat during this transition phase. However, China’s demand for resources from overseas is not expected to wane, due to the intention of the Chinese Government to limit the pace of growth in domestic mining.
With the implementation of “Outright Monetary Transactions” and the establishment of the “European Stability Mechanism” in September 2012, the risk of a financial meltdown in the Euro Area has been largely averted. However, large scale fiscal austerity in some peripheral economies and the risk averseness of the banking sector pushed the Euro Area deeper into recession over the course of 2012. This trend is expected to continue in 2013, with the realisation of an anticipated recovery in 2014 hinging on the progress of banking and fiscal unions in the region. Confidence remains fragile, as seen during the crisis in Cyprus in early 2013.
30 Budget Strategy and Outlook 2013-14
Assumptions Forecasts for the Queensland economy are based on several assumptions, including about the RBA’s monetary policy stance, the A$ exchange rate and seasonal conditions over the forecast period:
� in line with market expectations, the official cash rate is assumed to be lowered some time in 2013-14, with the easing cycle ending in early 2015. The official cash rate is anticipated to gradually move toward a more neutral level by the end of 2016-17
� as anticipated in the 2012-13 State Budget, the A$ has remained well above parity with the US$ for most of 2012-13. The ongoing appetite for Australian debt is expected to see the A$ remain close to parity in 2013-14, before gradually easing over the remainder of the forecast period, as global monetary and economic conditions improve. Recent volatility in the exchange rate has seen the A$ fall below parity. This has occurred more quickly than the budget projections, but current levels would need to be sustained for a number of months before forecasts would need to be adjusted
� after flooding in early 2013, seasonal conditions in the State as a whole are assumed to return to normal from 2013-14 onward. However, uneven rainfall distribution has meant that parts of western and south western Queensland were recently drought declared.
This chapter ends with a discussion of the risks related to the global economy, financial markets and other assumptions driving the Queensland outlook.
Budget Strategy and Outlook 2013-14 31
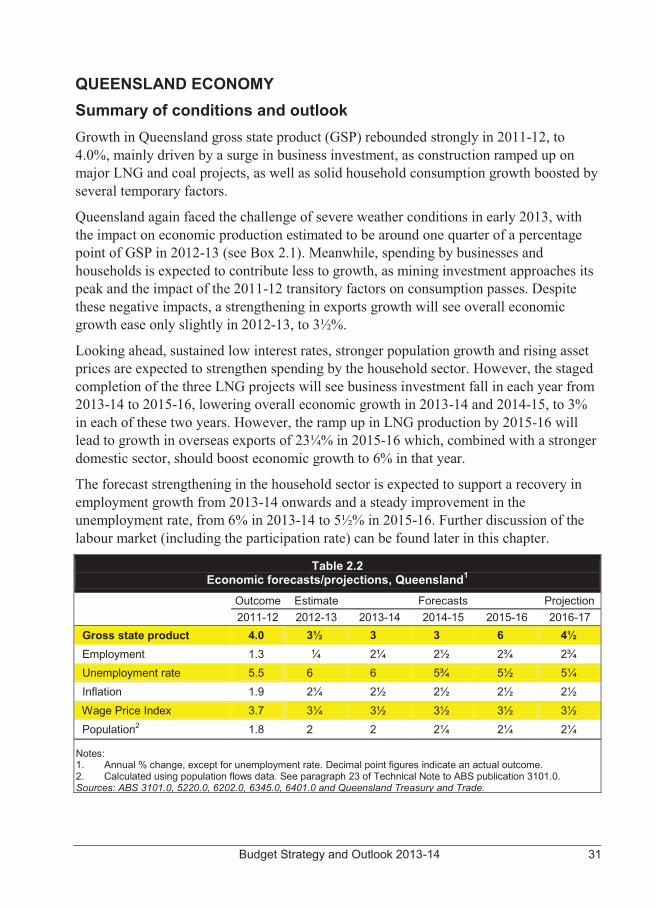
QUEENSLAND ECONOMY Summary of conditions and outlook Growth in Queensland gross state product (GSP) rebounded strongly in 2011-12, to 4.0%, mainly driven by a surge in business investment, as construction ramped up on major LNG and coal projects, as well as solid household consumption growth boosted by several temporary factors.
Queensland again faced the challenge of severe weather conditions in early 2013, with the impact on economic production estimated to be around one quarter of a percentage point of GSP in 2012-13 (see Box 2.1). Meanwhile, spending by businesses and households is expected to contribute less to growth, as mining investment approaches its peak and the impact of the 2011-12 transitory factors on consumption passes. Despite these negative impacts, a strengthening in exports growth will see overall economic growth ease only slightly in 2012-13, to 3½%.
Looking ahead, sustained low interest rates, stronger population growth and rising asset prices are expected to strengthen spending by the household sector. However, the staged completion of the three LNG projects will see business investment fall in each year from 2013-14 to 2015-16, lowering overall economic growth in 2013-14 and 2014-15, to 3% in each of these two years. However, the ramp up in LNG production by 2015-16 will lead to growth in overseas exports of 23¼% in 2015-16 which, combined with a stronger domestic sector, should boost economic growth to 6% in that year.
The forecast strengthening in the household sector is expected to support a recovery in employment growth from 2013-14 onwards and a steady improvement in the unemployment rate, from 6% in 2013-14 to 5½% in 2015-16. Further discussion of the labour market (including the participation rate) can be found later in this chapter.
Table 2.2 Economic forecasts/projections, Queensland1
Outcome Estimate Forecasts Projection 2011-12 2012-13 2013-14 2014-15 2015-16 2016-17
Gross state product 4.0 3½ 3 3 6 4½ Employment 1.3 ¼ 2¼ 2½ 2¾ 2¾ Unemployment rate 5.5 6 6 5¾ 5½ 5¼ Inflation 1.9 2¼ 2½ 2½ 2½ 2½
Wage Price Index 3.7 3¼ 3½ 3½ 3½ 3½ Population2 1.8 2 2 2¼ 2¼ 2¼
Notes: 1. Annual % change, except for unemployment rate. Decimal point figures indicate an actual outcome. 2. Calculated using population flows data. See paragraph 23 of Technical Note to ABS publication 3101.0. Sources: ABS 3101.0, 5220.0, 6202.0, 6345.0, 6401.0 and Queensland Treasury and Trade.
32 Budget Strategy and Outlook 2013-14
Box 2.1 Impact of early 2013 floods on the Queensland economy
In an eight day period ending 29 January 2013, the entire coastal area of Queensland received an extraordinary amount of rainfall from ex-Tropical Cyclone Oswald, with particularly large totals recorded in the Central Coast, Wide Bay-Burnett and Gold Coast Hinterland regions. This rainfall resulted in severe flooding, with the Burnett River experiencing record flood peaks and devastating several communities. Strong winds with gusts in excess of 100 km/h, large waves, storm surges and several tornadoes also added to the destruction.
In terms of losses to economic production, the impact of this extreme weather event is estimated to be in the order of $500 million to $750 million in 2012-13, or a detraction of around one quarter of a percentage point in gross state product.
This estimate is of the direct impact of the disasters on economic output and therefore does not include the damage bill for private and business premises and public property, such as schools and roads.
There was a substantial impact on agricultural production in the Wide Bay-Burnett, Lockyer and Fassifern Valley areas, including sugar cane, fruit and vegetable production. The Department of Agriculture, Fisheries and Forestry estimates losses from the event of around $300 million in the gross value of agricultural production in 2012-13. This estimate includes destroyed crops, reduction in yields, downgrades to quality, waterlogging and livestock losses.
In other primary industries, coal mining operations and transportation were temporarily disrupted, with the important Blackwater rail system closed for several days and the Moura coal line closed for almost a month.
While devastating for affected communities, the economic impact of this weather event is expected to be much less than that of floods and Cyclone Yasi in 2010-11, when assessed at a whole of State level. The key difference is that many coal mines were flooded in the 2010-11 event, leading to a significant loss in coal production of around A$5.7 billion in that year.
In addition, while Cyclone Yasi also caused significant damage to the State’s banana and sugar crops in 2011, the primary growing areas for these crops were not affected as much in the latest event. Further, although this event spanned most tourism regions, there appears to have been limited knock-on effects to Queensland’s reputation as a tourism destination, suggesting the direct loss of tourism exports attributable to the latest event is much smaller than in 2010-11.
The economic impact of this weather event will be partly offset by reconstruction activity and a range of disaster relief payments from the Queensland and Federal Governments. Natural Disaster Relief and Recovery Arrangements are assisting Queenslanders. These arrangements include personal hardship assistance and a range of grants and concessional loans for primary producers, small business and non-profit organisations.
Australian Government Disaster Recovery Payments (AGDRP) to affected households and Disaster Income Recovery Subsidy (DIRS) payments for affected employees and small businesses have exceeded $100 million, with over 100,000 claims activated across Queensland. This compares with more than 700,000 claims totalling around $845 million of combined AGDRP and DIRS payments following the 2010-11 Floods and Cyclone Yasi.
Budget Strategy and Outlook 2013-14 33
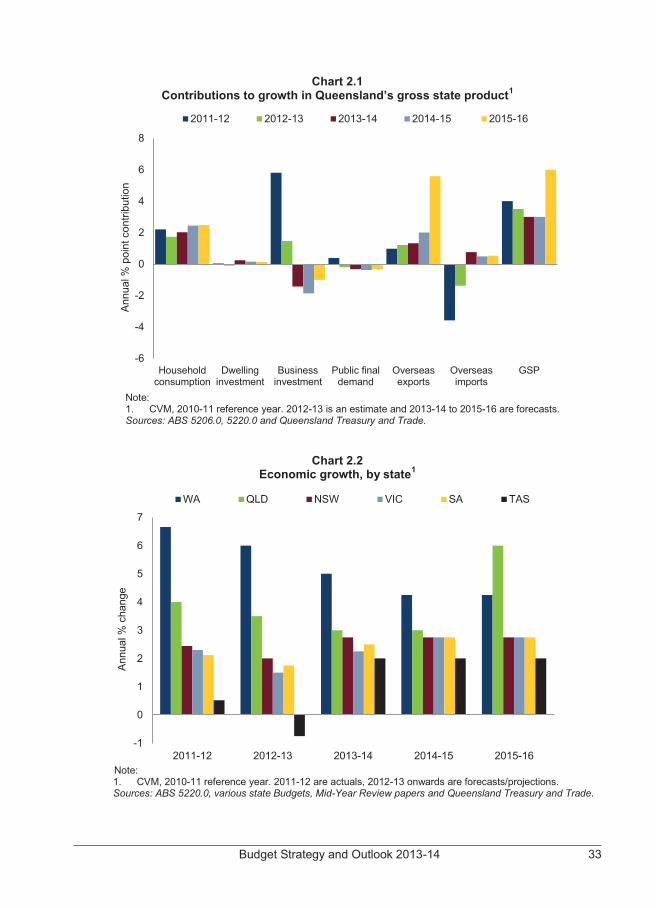
Chart 2.1 Contributions to growth in Queensland’s gross state product1
Note: 1. CVM, 2010-11 reference year. 2012-13 is an estimate and 2013-14 to 2015-16 are forecasts. Sources: ABS 5206.0, 5220.0 and Queensland Treasury and Trade.
Chart 2.2 Economic growth, by state1
Note: 1. CVM, 2010-11 reference year. 2011-12 are actuals, 2012-13 onwards are forecasts/projections. Sources: ABS 5220.0, various state Budgets, Mid-Year Review papers and Queensland Treasury and Trade.
-6
-4
-2
0
2
4
6
8
Householdconsumption
Dwellinginvestment
Businessinvestment
Public finaldemand
Overseasexports
Overseasimports
GSP
Ann
ual %
poi
nt c
ontri
butio
n2011-12 2012-13 2013-14 2014-15 2015-16
-1
0
1
2
3
4
5
6
7
2011-12 2012-13 2013-14 2014-15 2015-16
Ann
ual %
cha
nge
WA QLD NSW VIC SA TAS
34 Budget Strategy and Outlook 2013-14
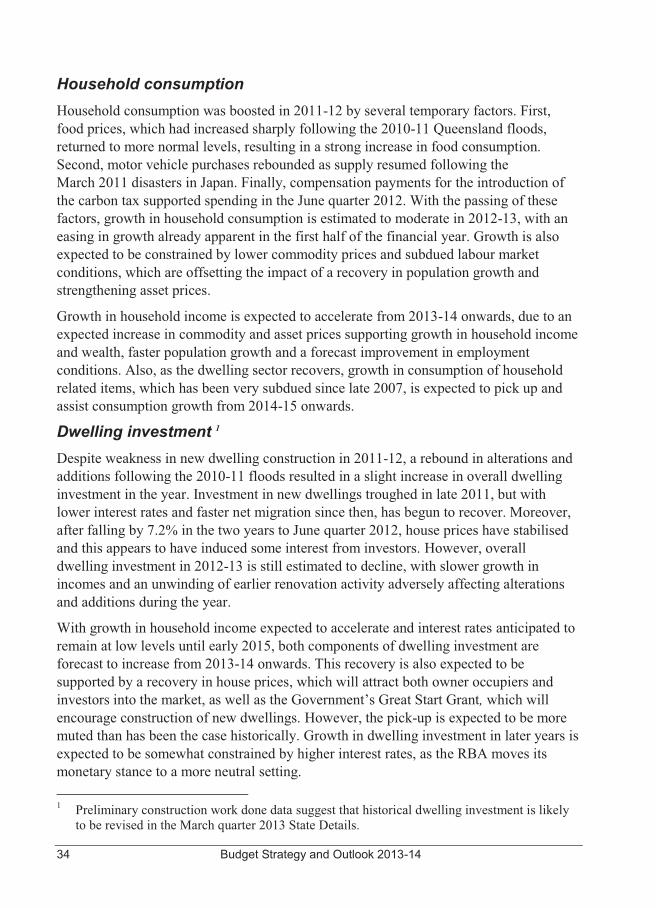
Household consumption Household consumption was boosted in 2011-12 by several temporary factors. First, food prices, which had increased sharply following the 2010-11 Queensland floods, returned to more normal levels, resulting in a strong increase in food consumption. Second, motor vehicle purchases rebounded as supply resumed following the March 2011 disasters in Japan. Finally, compensation payments for the introduction of the carbon tax supported spending in the June quarter 2012. With the passing of these factors, growth in household consumption is estimated to moderate in 2012-13, with an easing in growth already apparent in the first half of the financial year. Growth is also expected to be constrained by lower commodity prices and subdued labour market conditions, which are offsetting the impact of a recovery in population growth and strengthening asset prices.
Growth in household income is expected to accelerate from 2013-14 onwards, due to an expected increase in commodity and asset prices supporting growth in household income and wealth, faster population growth and a forecast improvement in employment conditions. Also, as the dwelling sector recovers, growth in consumption of household related items, which has been very subdued since late 2007, is expected to pick up and assist consumption growth from 2014-15 onwards.
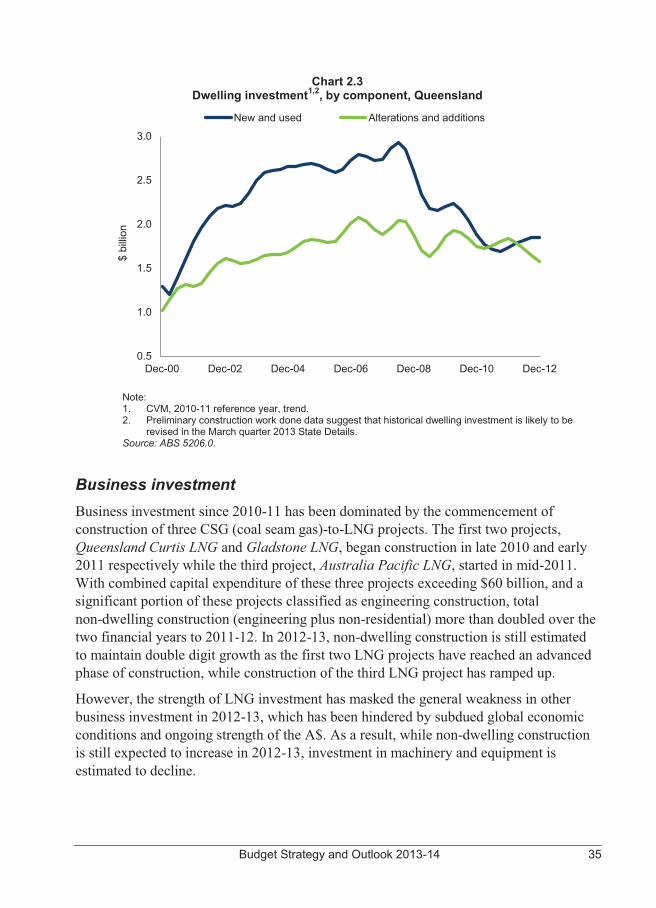
Dwelling investment 1 Despite weakness in new dwelling construction in 2011-12, a rebound in alterations and additions following the 2010-11 floods resulted in a slight increase in overall dwelling investment in the year. Investment in new dwellings troughed in late 2011, but with lower interest rates and faster net migration since then, has begun to recover. Moreover, after falling by 7.2% in the two years to June quarter 2012, house prices have stabilised and this appears to have induced some interest from investors. However, overall dwelling investment in 2012-13 is still estimated to decline, with slower growth in incomes and an unwinding of earlier renovation activity adversely affecting alterations and additions during the year.
With growth in household income expected to accelerate and interest rates anticipated to remain at low levels until early 2015, both components of dwelling investment are forecast to increase from 2013-14 onwards. This recovery is also expected to be supported by a recovery in house prices, which will attract both owner occupiers and investors into the market, as well as the Government’s Great Start Grant, which will encourage construction of new dwellings. However, the pick-up is expected to be more muted than has been the case historically. Growth in dwelling investment in later years is expected to be somewhat constrained by higher interest rates, as the RBA moves its monetary stance to a more neutral setting. 1 Preliminary construction work done data suggest that historical dwelling investment is likely
to be revised in the March quarter 2013 State Details.
Budget Strategy and Outlook 2013-14 35
Chart 2.3 Dwelling investment1,2, by component, Queensland
Note: 1. CVM, 2010-11 reference year, trend. 2. Preliminary construction work done data suggest that historical dwelling investment is likely to be
revised in the March quarter 2013 State Details. Source: ABS 5206.0.
Business investment Business investment since 2010-11 has been dominated by the commencement of construction of three CSG (coal seam gas)-to-LNG projects. The first two projects, Queensland Curtis LNG and Gladstone LNG, began construction in late 2010 and early 2011 respectively while the third project, Australia Pacific LNG, started in mid-2011. With combined capital expenditure of these three projects exceeding $60 billion, and a significant portion of these projects classified as engineering construction, total non-dwelling construction (engineering plus non-residential) more than doubled over the two financial years to 2011-12. In 2012-13, non-dwelling construction is still estimated to maintain double digit growth as the first two LNG projects have reached an advanced phase of construction, while construction of the third LNG project has ramped up.
However, the strength of LNG investment has masked the general weakness in other business investment in 2012-13, which has been hindered by subdued global economic conditions and ongoing strength of the A$. As a result, while non-dwelling construction is still expected to increase in 2012-13, investment in machinery and equipment is estimated to decline.
0.5
1.0
1.5
2.0
2.5
3.0
Dec-00 Dec-02 Dec-04 Dec-06 Dec-08 Dec-10 Dec-12
$ bi
llion
New and used Alterations and additions
36 Budget Strategy and Outlook 2013-14
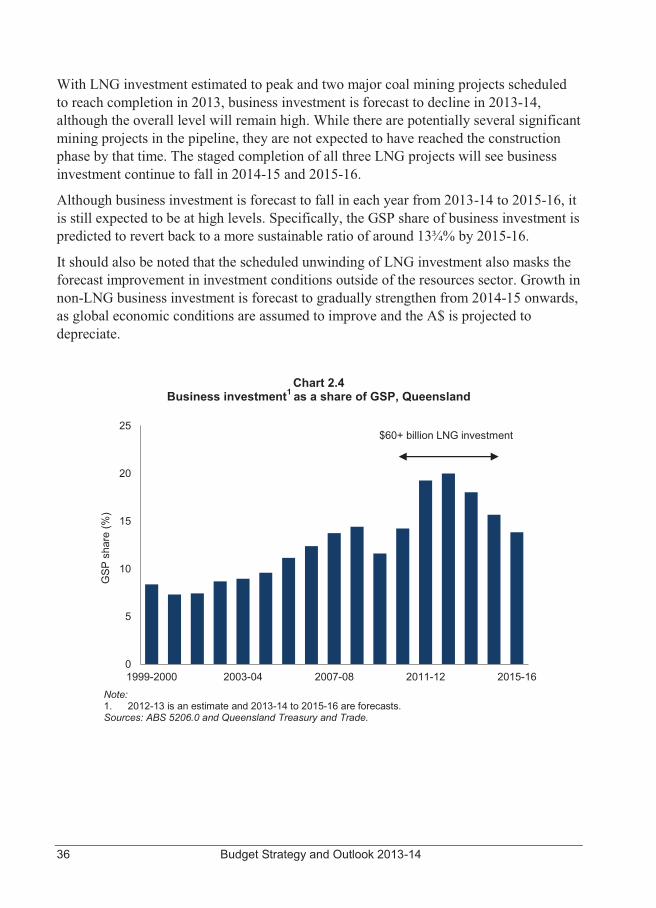
With LNG investment estimated to peak and two major coal mining projects scheduled to reach completion in 2013, business investment is forecast to decline in 2013-14, although the overall level will remain high. While there are potentially several significant mining projects in the pipeline, they are not expected to have reached the construction phase by that time. The staged completion of all three LNG projects will see business investment continue to fall in 2014-15 and 2015-16.
Although business investment is forecast to fall in each year from 2013-14 to 2015-16, it is still expected to be at high levels. Specifically, the GSP share of business investment is predicted to revert back to a more sustainable ratio of around 13¾% by 2015-16.
It should also be noted that the scheduled unwinding of LNG investment also masks the forecast improvement in investment conditions outside of the resources sector. Growth in non-LNG business investment is forecast to gradually strengthen from 2014-15 onwards, as global economic conditions are assumed to improve and the A$ is projected to depreciate.
Chart 2.4 Business investment1 as a share of GSP, Queensland
Note: 1. 2012-13 is an estimate and 2013-14 to 2015-16 are forecasts. Sources: ABS 5206.0 and Queensland Treasury and Trade.
0
5
10
15
20
25
1999-2000 2003-04 2007-08 2011-12 2015-16
GSP
sha
re (%
)
$60+ billion LNG investment
Budget Strategy and Outlook 2013-14 37
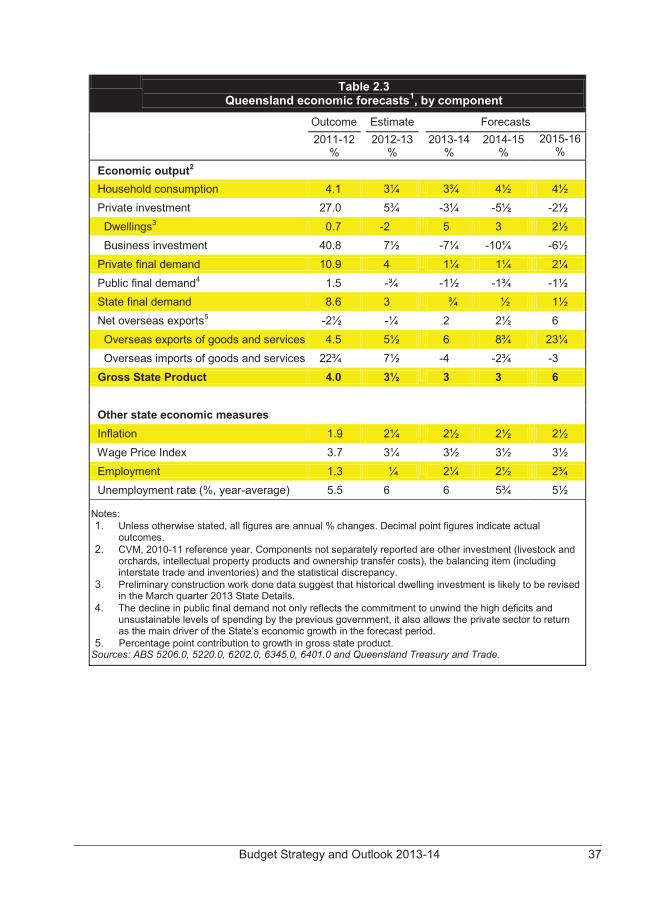
Table 2.3 Queensland economic forecasts1, by component
Outcome Estimate Forecasts 2011-12
% 2012-13 %
2013-14 % 2014-15
% 2015-16 %
Economic output2 Household consumption 4.1 3¼ 3¾ 4½ 4½ Private investment 27.0 5¾ -3¼ -5½ -2½ Dwellings3 0.7 -2 5 3 2½ Business investment 40.8 7½ -7¼ -10¼ -6½ Private final demand 10.9 4 1¼ 1¼ 2¼ Public final demand4 1.5 -¾ -1½ -1¾ -1½ State final demand 8.6 3 ¾ ½ 1½ Net overseas exports5 -2½ -¼ 2 2½ 6 Overseas exports of goods and services 4.5 5½ 6 8¾ 23¼ Overseas imports of goods and services 22¾ 7½ -4 -2¾ -3 Gross State Product 4.0 3½ 3 3 6 Other state economic measures Inflation 1.9 2¼ 2½ 2½ 2½ Wage Price Index 3.7 3¼ 3½ 3½ 3½ Employment 1.3 ¼ 2¼ 2½ 2¾ Unemployment rate (%, year-average) 5.5 6 6 5¾ 5½
Notes: 1. Unless otherwise stated, all figures are annual % changes. Decimal point figures indicate actual
outcomes. 2. CVM, 2010-11 reference year. Components not separately reported are other investment (livestock and
orchards, intellectual property products and ownership transfer costs), the balancing item (including interstate trade and inventories) and the statistical discrepancy.
3. Preliminary construction work done data suggest that historical dwelling investment is likely to be revised in the March quarter 2013 State Details.
4. The decline in public final demand not only reflects the commitment to unwind the high deficits and unsustainable levels of spending by the previous government, it also allows the private sector to return as the main driver of the State’s economic growth in the forecast period.
5. Percentage point contribution to growth in gross state product. Sources: ABS 5206.0, 5220.0, 6202.0, 6345.0, 6401.0 and Queensland Treasury and Trade.
38 Budget Strategy and Outlook 2013-14
Public final demand Very strong growth in government spending contributed significantly to economic growth over the second half of the decade to 2009-10. However the level of spending was not sustainable and drove up government debt, creating the risk of a massive adjustment if not quickly addressed. Continuing on the path established in the previous budget, this Budget further unwinds the high deficits and unsustainable levels of spending by the previous government. This consolidation at the state level is combined with Australian Government fiscal tightening. As a result, real public final demand (which is the sum of Federal, state and local government consumption and investment) is forecast to decline modestly in each year over the period to 2015-16.
Box 2.2
Red tape reduction
Unnecessary and excessive regulation can be a significant hindrance on Queensland’s economy, by stifling productivity and increasing costs for businesses. Regulatory reform and red tape reduction is therefore essential to boost Queensland’s economy. By ensuring that Queensland’s regulatory system is efficient and streamlined, the Government can allow business to focus on innovation, productivity, growth and competitiveness, rather than being bogged down in unnecessary or duplicative forms and requirements.
Queensland is implementing Australia’s most rigorous framework for measuring and reducing the burden of regulation. This framework will establish a baseline measure of the regulatory burden and set targets for each agency toward achieving the Government’s objective of reducing this burden by 20% by 2018. Over 150 different regulatory reforms have been delivered so far, ranging from major legislative changes through to targeted administrative changes. The Government has also significantly increased the rigour around the development of new regulation and changes to existing regulation by establishing the Office of Best Practice Regulation in the Queensland Competition Authority. Agencies are required to develop regulatory proposals in accordance with regulatory best practice principles, including the development of Regulatory Impact Statements and public consultation for significant regulatory changes.
Budget Strategy and Outlook 2013-14 39
Overseas exports and imports Growth in the volume of overseas exports of goods in 2012-13 is expected to be similar to that in 2011-12. Coal export volumes have recovered from the weak outcome in 2011-12, which was caused by industrial action and weak overseas demand. However, growth in base metal and cotton exports are estimated to be slower. Base metal production was temporarily hampered by the transition of the Ernest Henry copper mine from open cut to underground operations, while a fall in cotton prices led to lower cotton production in the year.
Lower commodity prices are expected to lower the nominal value of overseas exports of goods in 2012-13. So far in 2012-13, international prices of aluminium, copper and zinc have fallen 11%, 6% and 5% respectively in year-average terms, and unit export values of hard coking and thermal coal have also declined 36% and 18% respectively relative to 2011-12.
Coal export volumes are forecast to continue to grow from 2013-14 onwards, supported by stronger demand from China and the completion of the Daunia and Caval Ridge hard coking coal mines. Also, the scheduled completion of the Eagle Downs and Grosvenor (Phase 1) coal mines by 2015-16 should provide support to coal exports from 2016-17 onwards. While coal prices are expected to recover over the forecast period, increases in supply and the slow pace of recovery in advanced economies are expected to limit the extent of this rebound.
The first LNG exports are scheduled for 2014-15 but export volumes are only expected to ramp up substantially in the following year, driving double digit growth in overseas goods exports in 2015-16.
With more than a dozen regional areas in the west of Queensland now drought declared, beef producers face very challenging circumstances. Following several years of good weather conditions which underpinned herd rebuilding, a hot and dry 2012-13 summer west of the Great Dividing Range has seen producers start to de-stock properties. In addition, a reduction in the live cattle import quota to Indonesia has reduced demand for live cattle exports, further adding to supply and putting downward pressure on prices. These conditions are expected to bring forward beef export volumes into 2012-13 and 2013-14, but will adversely affect supply in later years. Meanwhile, demand is expected to be supported by rising exports to China, which will partly offset reduced demand from some traditional markets.
After two consecutive seasons of low production due to poor weather conditions, raw sugar production has rebounded in the 2012-13 season to above 4.3 million tonnes and some further growth is anticipated in the 2013-14 season. Lower cotton prices have resulted in a significant reduction in the area planted to cotton, leading to a fall in cotton exports in 2013-14.
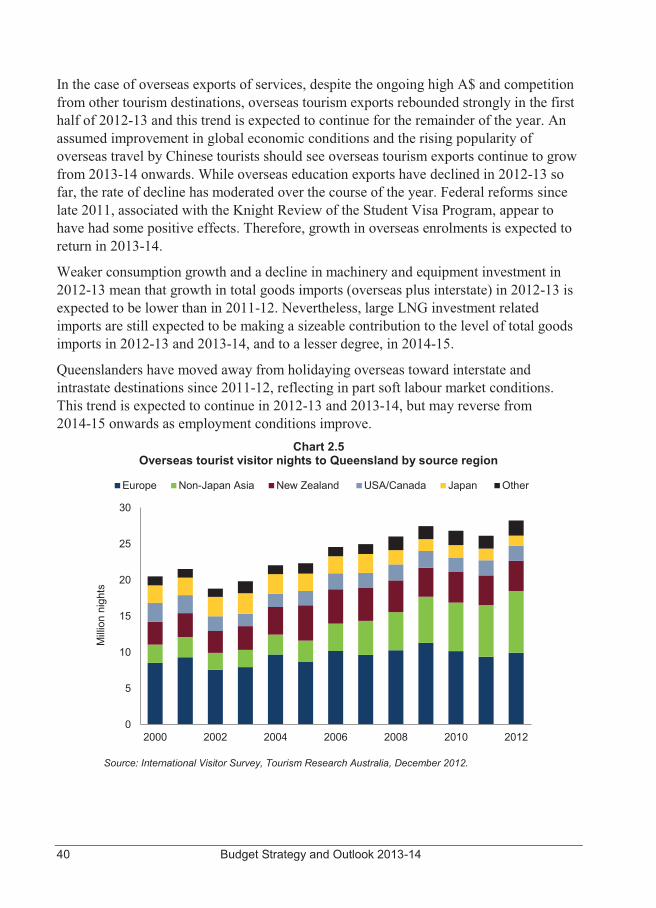
40 Budget Strategy and Outlook 2013-14
In the case of overseas exports of services, despite the ongoing high A$ and competition from other tourism destinations, overseas tourism exports rebounded strongly in the first half of 2012-13 and this trend is expected to continue for the remainder of the year. An assumed improvement in global economic conditions and the rising popularity of overseas travel by Chinese tourists should see overseas tourism exports continue to grow from 2013-14 onwards. While overseas education exports have declined in 2012-13 so far, the rate of decline has moderated over the course of the year. Federal reforms since late 2011, associated with the Knight Review of the Student Visa Program, appear to have had some positive effects. Therefore, growth in overseas enrolments is expected to return in 2013-14.
Weaker consumption growth and a decline in machinery and equipment investment in 2012-13 mean that growth in total goods imports (overseas plus interstate) in 2012-13 is expected to be lower than in 2011-12. Nevertheless, large LNG investment related imports are still expected to be making a sizeable contribution to the level of total goods imports in 2012-13 and 2013-14, and to a lesser degree, in 2014-15.
Queenslanders have moved away from holidaying overseas toward interstate and intrastate destinations since 2011-12, reflecting in part soft labour market conditions. This trend is expected to continue in 2012-13 and 2013-14, but may reverse from 2014-15 onwards as employment conditions improve.
Chart 2.5 Overseas tourist visitor nights to Queensland by source region
Source: International Visitor Survey, Tourism Research Australia, December 2012.
0
5
10
15
20
25
30
2000 2002 2004 2006 2008 2010 2012
Mill
ion
nigh
ts
Europe Non-Japan Asia New Zealand USA/Canada Japan Other
Budget Strategy and Outlook 2013-14 41
Labour market Year average employment growth is estimated to moderate in 2012-13, although some improvement has occurred since late 2012. This reflects a combination of factors, including household caution and the high A$, which have impacted on labour intensive sectors such as retail, building construction, accommodation and food services, manufacturing, and arts and recreation services. Further, falling commodity prices and the high A$ have induced trade exposed industries to cut costs by winding back employment during the course of 2012-13. With growth in household spending expected to pick up from 2013-14 onwards, employment growth is forecast to accelerate over the forecast period.
With strong employment growth between early and mid-2000s encouraging entrants into the labour market, the labour participation rate in Queensland rose from below 65% in 2004 to reach almost 68% by 2009. The weakening of employment conditions following the GFC saw the labour participation rate gradually fall and the decline has steepened since early 2012. This sharp drop in the participation rate coincided with a slight reduction in employment of females, who generally have a greater propensity to leave the labour force. Meanwhile, the impact of the baby boomers reaching retirement age has begun to place downward pressure on the labour participation rate. However, as employment growth is expected to strengthen from 2013-14 onwards, the “encouraged worker effect” will result in the labour participation rate remaining relatively stable over the forecast period.
With labour force growth predicted to be slightly below employment growth, the unemployment rate is forecast to fall steadily over the forecast period.
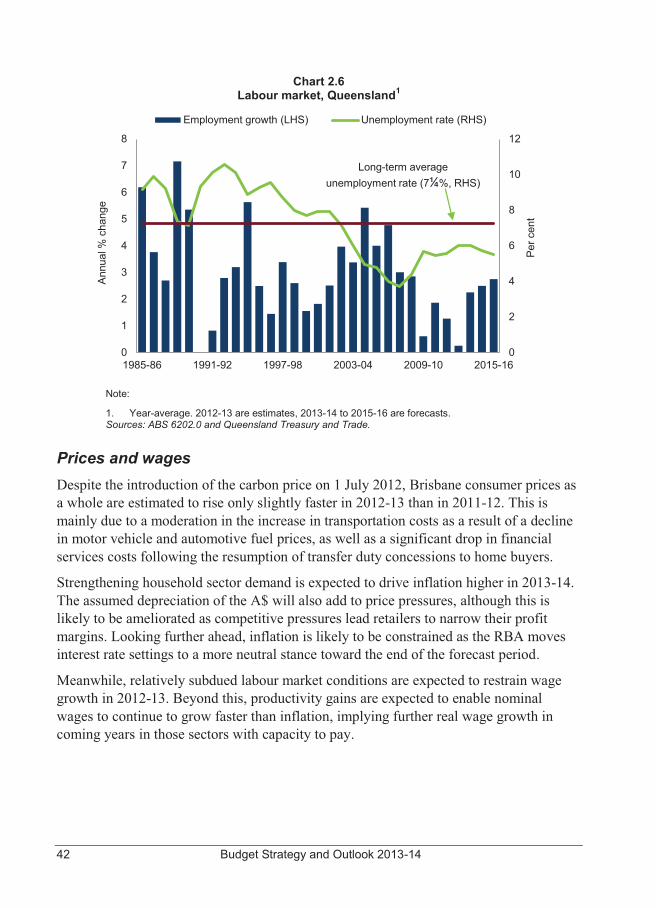
42 Budget Strategy and Outlook 2013-14
Chart 2.6 Labour market, Queensland1
Note:
1. Year-average. 2012-13 are estimates, 2013-14 to 2015-16 are forecasts. Sources: ABS 6202.0 and Queensland Treasury and Trade.
Prices and wages Despite the introduction of the carbon price on 1 July 2012, Brisbane consumer prices as a whole are estimated to rise only slightly faster in 2012-13 than in 2011-12. This is mainly due to a moderation in the increase in transportation costs as a result of a decline in motor vehicle and automotive fuel prices, as well as a significant drop in financial services costs following the resumption of transfer duty concessions to home buyers.
Strengthening household sector demand is expected to drive inflation higher in 2013-14. The assumed depreciation of the A$ will also add to price pressures, although this is likely to be ameliorated as competitive pressures lead retailers to narrow their profit margins. Looking further ahead, inflation is likely to be constrained as the RBA moves interest rate settings to a more neutral stance toward the end of the forecast period.
Meanwhile, relatively subdued labour market conditions are expected to restrain wage growth in 2012-13. Beyond this, productivity gains are expected to enable nominal wages to continue to grow faster than inflation, implying further real wage growth in coming years in those sectors with capacity to pay.
0
2
4
6
8
10
12
0
1
2
3
4
5
6
7
8
1985-86 1991-92 1997-98 2003-04 2009-10 2015-16
Per c
ent
Ann
ual %
cha
nge
Employment growth (LHS) Unemployment rate (RHS)
Long-term average unemployment rate (7¼%, RHS)
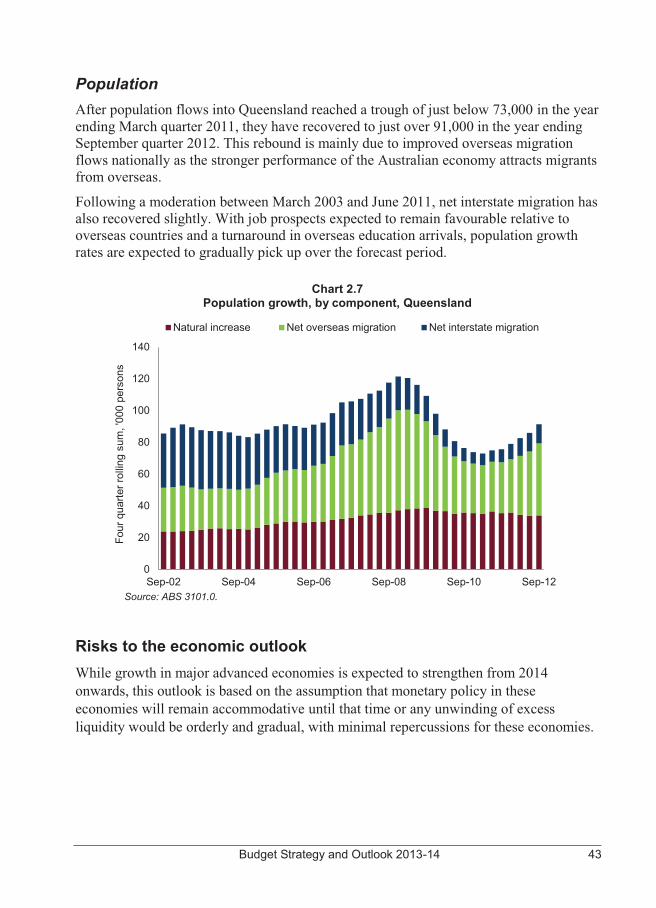
Budget Strategy and Outlook 2013-14 43
Population After population flows into Queensland reached a trough of just below 73,000 in the year ending March quarter 2011, they have recovered to just over 91,000 in the year ending September quarter 2012. This rebound is mainly due to improved overseas migration flows nationally as the stronger performance of the Australian economy attracts migrants from overseas.
Following a moderation between March 2003 and June 2011, net interstate migration has also recovered slightly. With job prospects expected to remain favourable relative to overseas countries and a turnaround in overseas education arrivals, population growth rates are expected to gradually pick up over the forecast period.
Chart 2.7 Population growth, by component, Queensland
Source: ABS 3101.0.
Risks to the economic outlook While growth in major advanced economies is expected to strengthen from 2014 onwards, this outlook is based on the assumption that monetary policy in these economies will remain accommodative until that time or any unwinding of excess liquidity would be orderly and gradual, with minimal repercussions for these economies.
0
20
40
60
80
100
120
140
Sep-02 Sep-04 Sep-06 Sep-08 Sep-10 Sep-12
Four
qua
rter r
ollin
g su
m, '
000
pers
ons
Natural increase Net overseas migration Net interstate migration
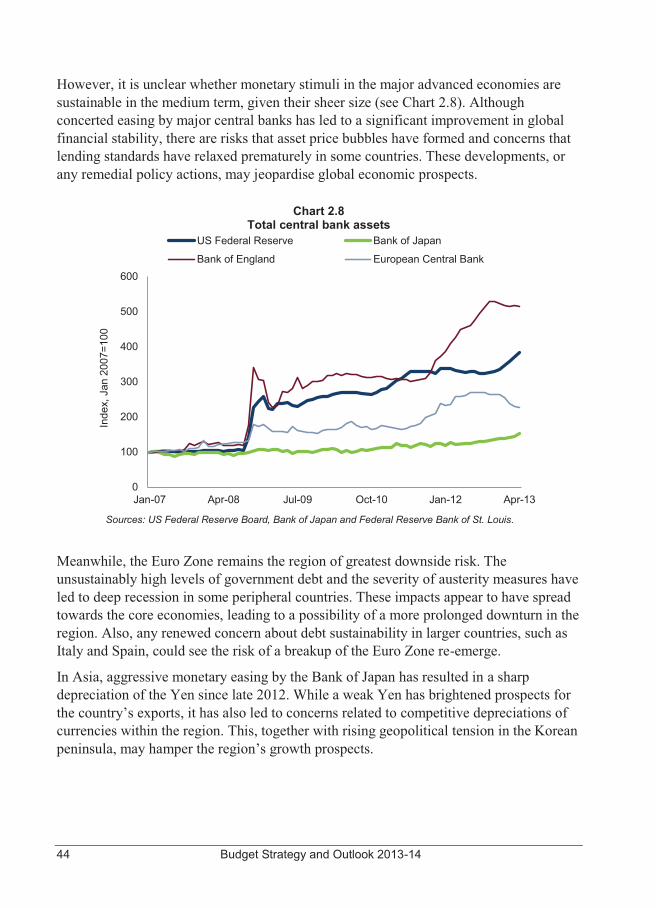
44 Budget Strategy and Outlook 2013-14
However, it is unclear whether monetary stimuli in the major advanced economies are sustainable in the medium term, given their sheer size (see Chart 2.8). Although concerted easing by major central banks has led to a significant improvement in global financial stability, there are risks that asset price bubbles have formed and concerns that lending standards have relaxed prematurely in some countries. These developments, or any remedial policy actions, may jeopardise global economic prospects.
Chart 2.8
Total central bank assets
Sources: US Federal Reserve Board, Bank of Japan and Federal Reserve Bank of St. Louis.
Meanwhile, the Euro Zone remains the region of greatest downside risk. The unsustainably high levels of government debt and the severity of austerity measures have led to deep recession in some peripheral countries. These impacts appear to have spread towards the core economies, leading to a possibility of a more prolonged downturn in the region. Also, any renewed concern about debt sustainability in larger countries, such as Italy and Spain, could see the risk of a breakup of the Euro Zone re-emerge.
In Asia, aggressive monetary easing by the Bank of Japan has resulted in a sharp depreciation of the Yen since late 2012. While a weak Yen has brightened prospects for the country’s exports, it has also led to concerns related to competitive depreciations of currencies within the region. This, together with rising geopolitical tension in the Korean peninsula, may hamper the region’s growth prospects.
0
100
200
300
400
500
600
Jan-07 Apr-08 Jul-09 Oct-10 Jan-12 Apr-13
Inde
x, J
an 2
007=
100
US Federal Reserve Bank of Japan
Bank of England European Central Bank
Budget Strategy and Outlook 2013-14 45
Any deterioration of global growth prospects means that the assumed moderate recovery in commodity prices may not eventuate. Nevertheless, the recent depreciation of the Yen has led the A$ to fall below parity against the US$ from mid-May. If the A$ depreciates faster than currently assumed, it would offset some of the adverse effect of lower than expected commodity prices.
For Queensland, the major domestic risk surrounds the timing and the pace of the unwinding of LNG investment due for completion between 2014 and 2016. Given the large size of the three LNG projects, any pick-up in growth from other parts of the Queensland economy may not be enough to prevent economic growth slowing more rapidly than currently expected, especially in 2014-15.

46 Budget Strategy and Outlook 2013-14
Budget Strategy and Outlook 2013-14 47
3 REVENUE
FEATURES � Total General Government sector revenue is estimated to be $41.785 billion in
2012-13, $4 billion lower than in 2011-12. This reduction is attributable to a decline of $4.2 billion in grants revenue from the Australian Government.
� Total General Government sector revenue is estimated to be $44.677 billion in 2013-14. The increase of $2.892 billion on 2012-13 estimated actual revenue is primarily driven by growth of $1.665 billion in grants from the Australian Government and $853 million in taxation revenue.
� Key revenue sources such as taxation, GST and mining royalties have fallen by $4.2 billion in underlying terms since the 2012-13 Budget, with $2.6 billion of this decline since 2012-13 MYFER. This reflects the ongoing weakness of export coal prices, downward reductions in the GST pool distributed by the Australian Government and the impact of the slower than anticipated property market recovery on transfer duty and land tax. Relative to the Independent Commission of Audit Interim Report, these revenue sources have fallen by $5.3 billion.
� To continue to assist with the fiscal repair task the Government has introduced a number of new measures: – rates of general insurance duty will be increased to 9% from 1 August 2013,
providing consistency across general insurance products and more closely aligning Queensland with other jurisdictions
– from 1 January 2014 increase and broaden the coverage of the Urban Fire levy to ensure a sustainable funding base for emergency services. The levy will be known as the Emergency Management, Fire and Rescue Levy and will be applied to all rateable properties
– the second payroll tax threshold increase from $1.1 million to $1.2 million will be deferred two years to now take effect from 1 July 2015 rather than 1 July 2013.
� Total revenue is expected to grow across the forward estimates, with average growth of 6.2% over the period 2012-13 to 2016-17, supported by measures taken by the Government in the 2012-13 and 2013-14 Budgets. However, this is significantly less than the 9.3% per annum average growth over the period 2001-02 to 2011-12. If revenue was to grow by 9.3% from 2012-13, then estimated total revenue would be almost $9 billion higher over this period.
� Queensland will retain its competitive tax status, with per capita state tax estimated at $2,528 in 2013-14, compared to an average of $3,003 for the other states and territories.
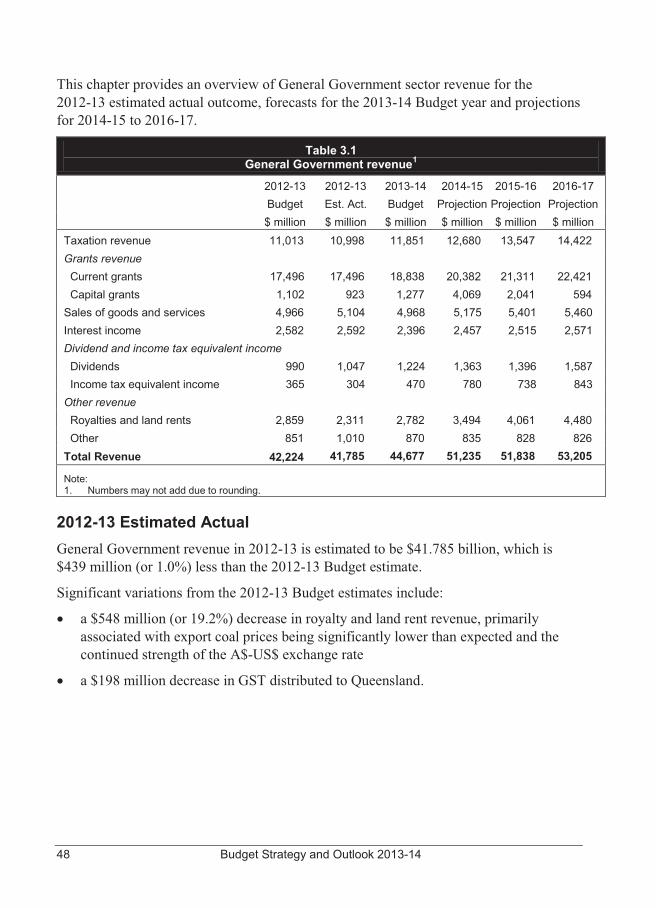
48 Budget Strategy and Outlook 2013-14
This chapter provides an overview of General Government sector revenue for the 2012-13 estimated actual outcome, forecasts for the 2013-14 Budget year and projections for 2014-15 to 2016-17.
Table 3.1 General Government revenue1
2012-13 Budget
2012-13 Est. Act.
2013-14 Budget
2014-15 Projection
2015-16 Projection
2016-17 Projection
$ million $ million $ million $ million $ million $ million Taxation revenue 11,013 10,998 11,851 12,680 13,547 14,422 Grants revenue Current grants 17,496 17,496 18,838 20,382 21,311 22,421 Capital grants 1,102 923 1,277 4,069 2,041 594 Sales of goods and services 4,966 5,104 4,968 5,175 5,401 5,460 Interest income 2,582 2,592 2,396 2,457 2,515 2,571 Dividend and income tax equivalent income Dividends 990 1,047 1,224 1,363 1,396 1,587 Income tax equivalent income 365 304 470 780 738 843 Other revenue Royalties and land rents 2,859 2,311 2,782 3,494 4,061 4,480 Other 851 1,010 870 835 828 826 Total Revenue 42,224 41,785 44,677 51,235 51,838 53,205
Note: 1. Numbers may not add due to rounding.
2012-13 Estimated Actual General Government revenue in 2012-13 is estimated to be $41.785 billion, which is $439 million (or 1.0%) less than the 2012-13 Budget estimate.
Significant variations from the 2012-13 Budget estimates include:
� a $548 million (or 19.2%) decrease in royalty and land rent revenue, primarily associated with export coal prices being significantly lower than expected and the continued strength of the A$-US$ exchange rate
� a $198 million decrease in GST distributed to Queensland.
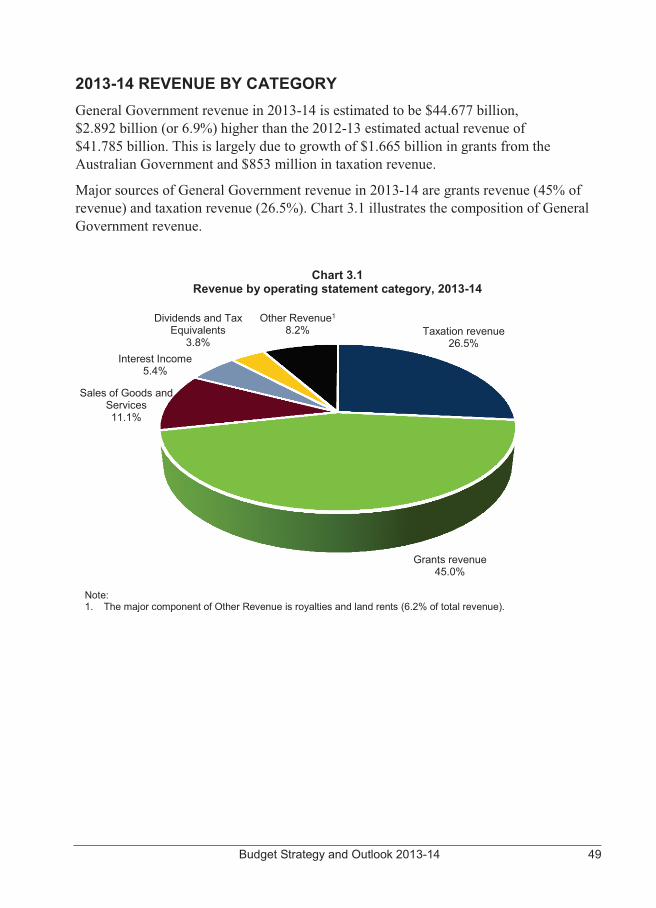
Budget Strategy and Outlook 2013-14 49
2013-14 REVENUE BY CATEGORY General Government revenue in 2013-14 is estimated to be $44.677 billion, $2.892 billion (or 6.9%) higher than the 2012-13 estimated actual revenue of $41.785 billion. This is largely due to growth of $1.665 billion in grants from the Australian Government and $853 million in taxation revenue.
Major sources of General Government revenue in 2013-14 are grants revenue (45% of revenue) and taxation revenue (26.5%). Chart 3.1 illustrates the composition of General Government revenue.
Chart 3.1
Revenue by operating statement category, 2013-14
Note: 1. The major component of Other Revenue is royalties and land rents (6.2% of total revenue).
Taxation revenue 26.5%
Grants revenue 45.0%
Sales of Goods and Services 11.1%
Interest Income 5.4%
Dividends and Tax Equivalents
3.8%
Other Revenue1 8.2%
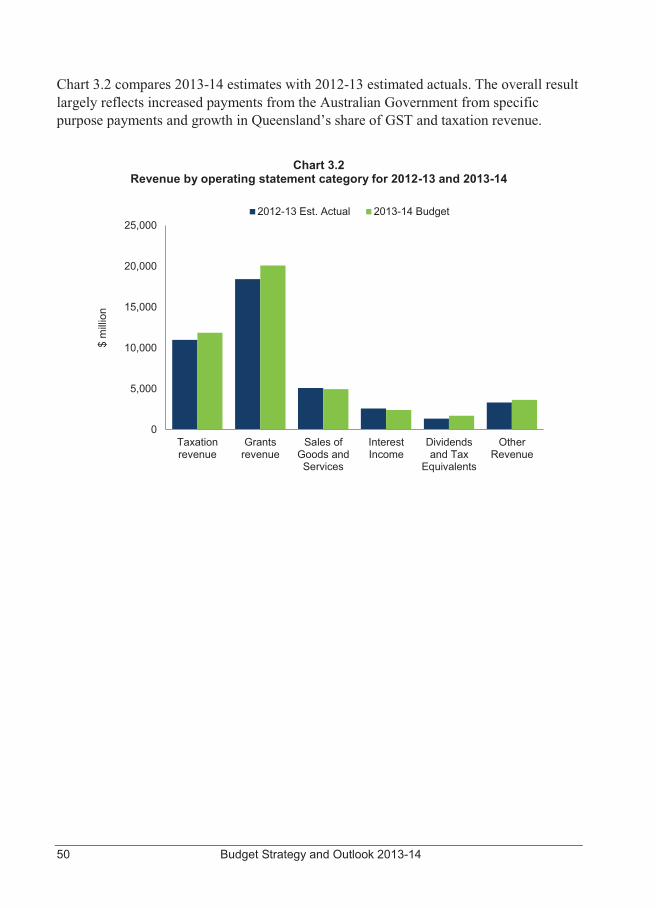
50 Budget Strategy and Outlook 2013-14
Chart 3.2 compares 2013-14 estimates with 2012-13 estimated actuals. The overall result largely reflects increased payments from the Australian Government from specific purpose payments and growth in Queensland’s share of GST and taxation revenue.
Chart 3.2 Revenue by operating statement category for 2012-13 and 2013-14
0
5,000
10,000
15,000
20,000
25,000
Taxationrevenue
Grantsrevenue
Sales ofGoods andServices
InterestIncome
Dividendsand Tax
Equivalents
OtherRevenue
$ m
illio
n
2012-13 Est. Actual 2013-14 Budget
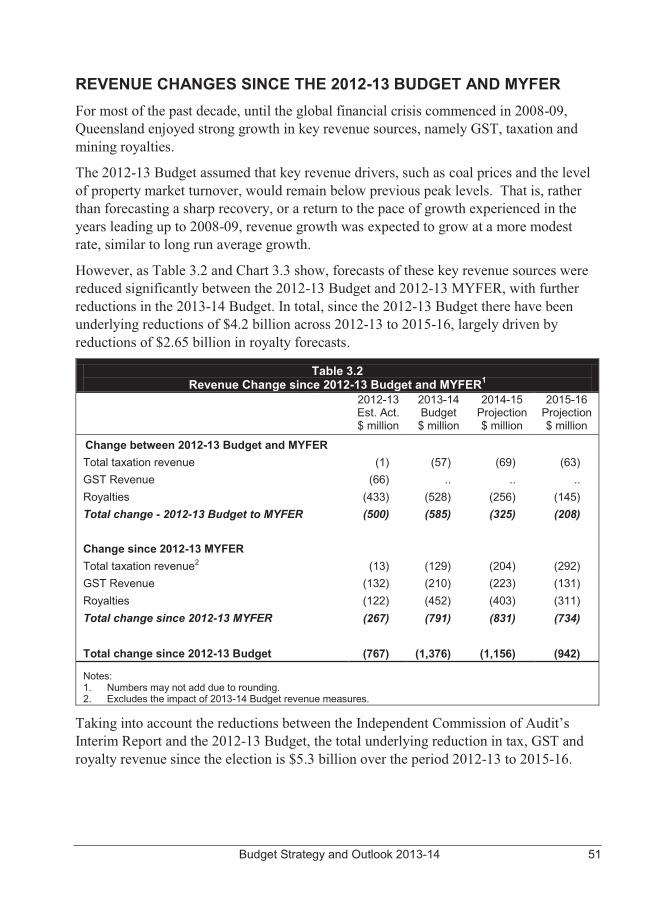
Budget Strategy and Outlook 2013-14 51
REVENUE CHANGES SINCE THE 2012-13 BUDGET AND MYFER For most of the past decade, until the global financial crisis commenced in 2008-09, Queensland enjoyed strong growth in key revenue sources, namely GST, taxation and mining royalties.
The 2012-13 Budget assumed that key revenue drivers, such as coal prices and the level of property market turnover, would remain below previous peak levels. That is, rather than forecasting a sharp recovery, or a return to the pace of growth experienced in the years leading up to 2008-09, revenue growth was expected to grow at a more modest rate, similar to long run average growth.
However, as Table 3.2 and Chart 3.3 show, forecasts of these key revenue sources were reduced significantly between the 2012-13 Budget and 2012-13 MYFER, with further reductions in the 2013-14 Budget. In total, since the 2012-13 Budget there have been underlying reductions of $4.2 billion across 2012-13 to 2015-16, largely driven by reductions of $2.65 billion in royalty forecasts.
Table 3.2 Revenue Change since 2012-13 Budget and MYFER1
2012-13 Est. Act. $ million
2013-14 Budget $ million
2014-15 Projection $ million
2015-16 Projection $ million
Change between 2012-13 Budget and MYFER Total taxation revenue (1) (57) (69) (63) GST Revenue (66) .. .. .. Royalties (433) (528) (256) (145) Total change - 2012-13 Budget to MYFER (500) (585) (325) (208) Change since 2012-13 MYFER Total taxation revenue2 (13) (129) (204) (292) GST Revenue (132) (210) (223) (131) Royalties (122) (452) (403) (311) Total change since 2012-13 MYFER (267) (791) (831) (734) Total change since 2012-13 Budget (767) (1,376) (1,156) (942)
Notes: 1. Numbers may not add due to rounding. 2. Excludes the impact of 2013-14 Budget revenue measures.
Taking into account the reductions between the Independent Commission of Audit’s Interim Report and the 2012-13 Budget, the total underlying reduction in tax, GST and royalty revenue since the election is $5.3 billion over the period 2012-13 to 2015-16.
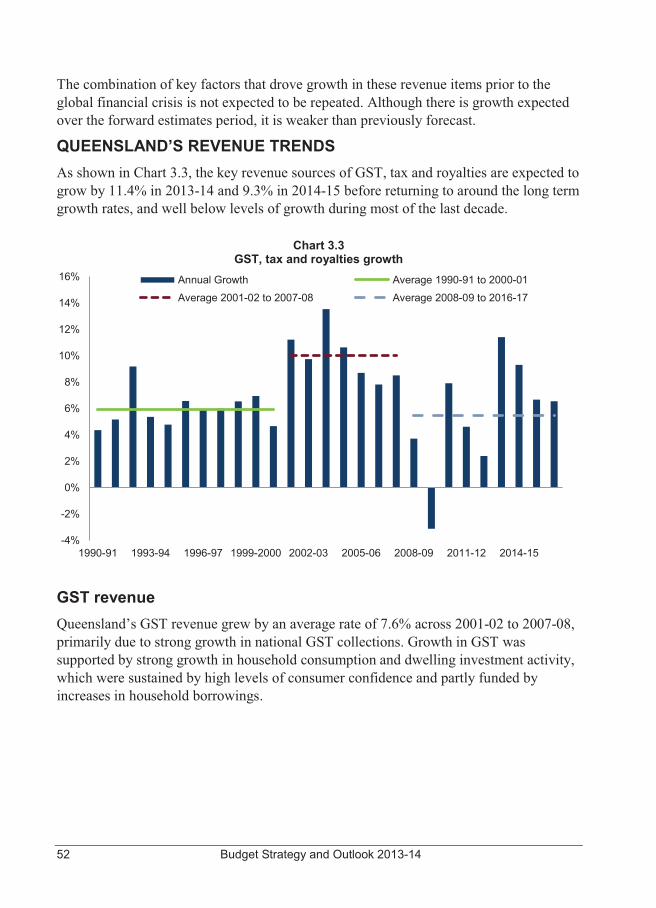
52 Budget Strategy and Outlook 2013-14
The combination of key factors that drove growth in these revenue items prior to the global financial crisis is not expected to be repeated. Although there is growth expected over the forward estimates period, it is weaker than previously forecast.
QUEENSLAND’S REVENUE TRENDS
As shown in Chart 3.3, the key revenue sources of GST, tax and royalties are expected to grow by 11.4% in 2013-14 and 9.3% in 2014-15 before returning to around the long term growth rates, and well below levels of growth during most of the last decade.
Chart 3.3
GST, tax and royalties growth
GST revenue Queensland’s GST revenue grew by an average rate of 7.6% across 2001-02 to 2007-08, primarily due to strong growth in national GST collections. Growth in GST was supported by strong growth in household consumption and dwelling investment activity, which were sustained by high levels of consumer confidence and partly funded by increases in household borrowings.
-4%
-2%
0%
2%
4%
6%
8%
10%
12%
14%
16%
1990-91 1993-94 1996-97 1999-2000 2002-03 2005-06 2008-09 2011-12 2014-15
Annual Growth Average 1990-91 to 2000-01
Average 2001-02 to 2007-08 Average 2008-09 to 2016-17
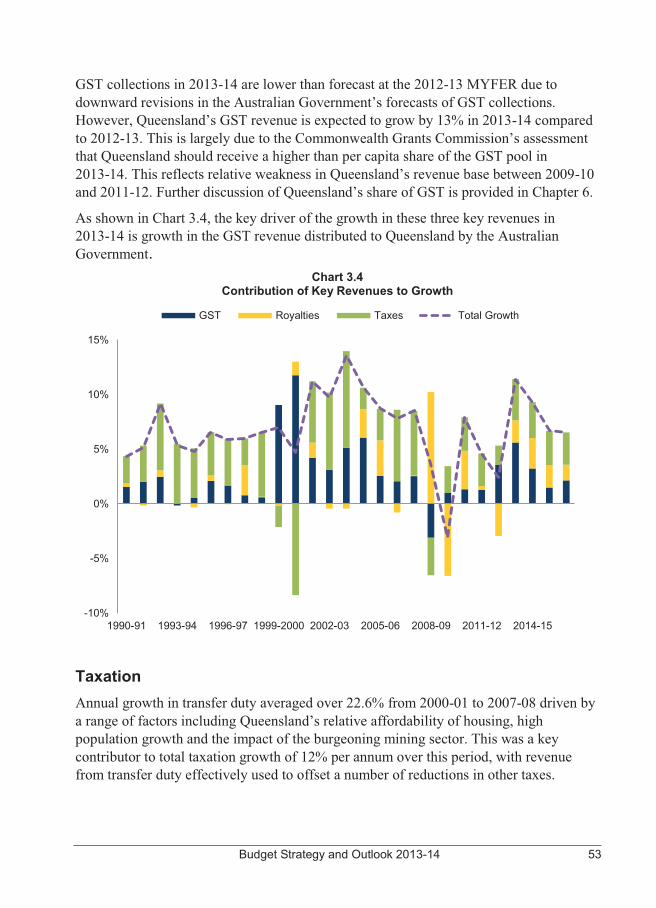
Budget Strategy and Outlook 2013-14 53
GST collections in 2013-14 are lower than forecast at the 2012-13 MYFER due to downward revisions in the Australian Government’s forecasts of GST collections. However, Queensland’s GST revenue is expected to grow by 13% in 2013-14 compared to 2012-13. This is largely due to the Commonwealth Grants Commission’s assessment that Queensland should receive a higher than per capita share of the GST pool in 2013-14. This reflects relative weakness in Queensland’s revenue base between 2009-10 and 2011-12. Further discussion of Queensland’s share of GST is provided in Chapter 6.
As shown in Chart 3.4, the key driver of the growth in these three key revenues in 2013-14 is growth in the GST revenue distributed to Queensland by the Australian Government.
Chart 3.4 Contribution of Key Revenues to Growth
Taxation Annual growth in transfer duty averaged over 22.6% from 2000-01 to 2007-08 driven by a range of factors including Queensland’s relative affordability of housing, high population growth and the impact of the burgeoning mining sector. This was a key contributor to total taxation growth of 12% per annum over this period, with revenue from transfer duty effectively used to offset a number of reductions in other taxes.
-10%
-5%
0%
5%
10%
15%
1990-91 1993-94 1996-97 1999-2000 2002-03 2005-06 2008-09 2011-12 2014-15
GST Royalties Taxes Total Growth
54 Budget Strategy and Outlook 2013-14
Looking forward, transfer duty growth is expected to be modest relative to that experienced between 2000-01 and 2007-08. While low interest rates and a solid economic outlook are expected to support recovery in the property market, this is expected to occur at a gradual pace, particularly in the non-residential sector. Growth of around 5.3% per annum is expected over the period 2011-12 to 2016-17.
While housing turnover over the forward estimates is expected to improve from its historically low levels and prices recover, this will still see transfer duty growth lower than for most of the past decade. Expected growth rates across the forward estimates are lower than in previous budget updates with transfer duty collections expected to remain below the 2007-08 peak level until beyond 2016-17.
Since the global financial crisis, payroll tax has taken over from transfer duty as the key contributor to Queensland’s tax revenue collections. In 2007-08, these two taxes contributed around $2.9 billion each but since then payroll tax has grown to exceed $4 billion while transfer duty has remained steady at around $2 billion. The growth in payroll tax is due to the relatively stable base and relationship to the underlying strength in economic conditions compared with the volatility associated with transfer duty. However, slower growth in the resources sector will moderate growth going forward. Hence, payroll tax is expected to grow by 7.8% on average across the forward estimates, well below the 9.4% average across the period 1999-00 to 2011-12.
Royalty revenue Royalty revenue grew strongly between 2000-01 and 2007-08, with growth in revenue in excess of 50% in both 2004-05 and 2005-06. In contrast to the other key discretionary revenues, royalty revenues reached a peak in 2008-09, as record coal prices had been contracted prior to the onset of the global financial crisis. Royalty revenue then fell significantly in 2009-10, along with coal contract prices, and has not yet returned to the levels of 2008-09.
Royalty revenue is estimated to have declined in 2012-13, primarily due to the current weakness in coal prices and high A$-US$ exchange rate. However, royalties are expected to recover from 2013-14 onwards, supported by steady growth in export volumes, a recovery in coal prices and the exchange rate depreciating. The average growth rates projected across the forward estimates are still substantially lower than experienced during the 2000s, which was driven by sharp increases in price to a greater extent than volume growth.
The LNG industry is expected to start contributing to royalties from 2014-15 but with growth strongest in 2015-16. As a consequence of the method used to levy royalties on gas, State royalties are directly impacted by cost escalation on projects.
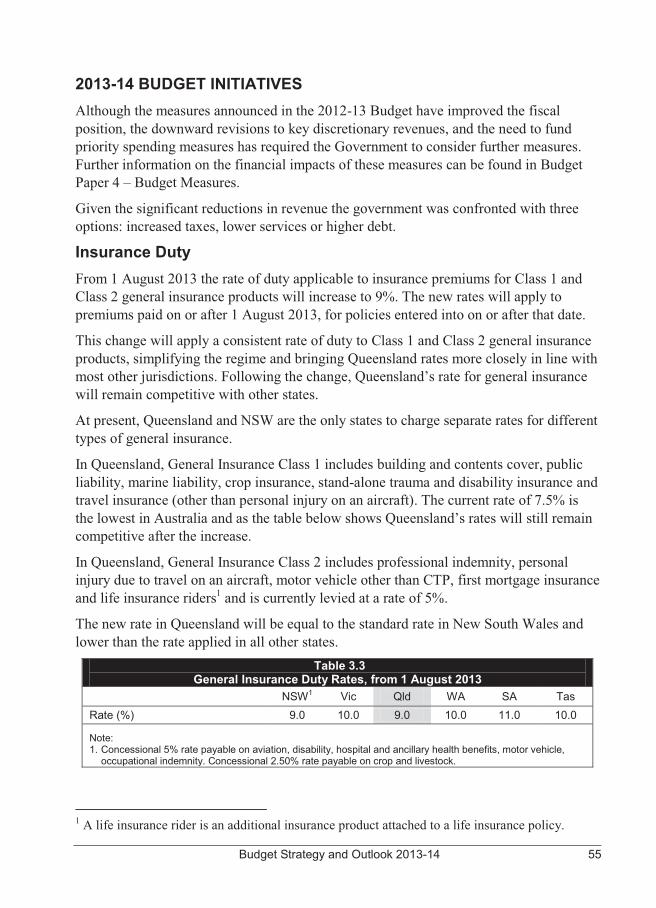
Budget Strategy and Outlook 2013-14 55
2013-14 BUDGET INITIATIVES Although the measures announced in the 2012-13 Budget have improved the fiscal position, the downward revisions to key discretionary revenues, and the need to fund priority spending measures has required the Government to consider further measures. Further information on the financial impacts of these measures can be found in Budget Paper 4 – Budget Measures.
Given the significant reductions in revenue the government was confronted with three options: increased taxes, lower services or higher debt.
Insurance Duty From 1 August 2013 the rate of duty applicable to insurance premiums for Class 1 and Class 2 general insurance products will increase to 9%. The new rates will apply to premiums paid on or after 1 August 2013, for policies entered into on or after that date.
This change will apply a consistent rate of duty to Class 1 and Class 2 general insurance products, simplifying the regime and bringing Queensland rates more closely in line with most other jurisdictions. Following the change, Queensland’s rate for general insurance will remain competitive with other states.
At present, Queensland and NSW are the only states to charge separate rates for different types of general insurance.
In Queensland, General Insurance Class 1 includes building and contents cover, public liability, marine liability, crop insurance, stand-alone trauma and disability insurance and travel insurance (other than personal injury on an aircraft). The current rate of 7.5% is the lowest in Australia and as the table below shows Queensland’s rates will still remain competitive after the increase.
In Queensland, General Insurance Class 2 includes professional indemnity, personal injury due to travel on an aircraft, motor vehicle other than CTP, first mortgage insurance and life insurance riders1 and is currently levied at a rate of 5%.
The new rate in Queensland will be equal to the standard rate in New South Wales and lower than the rate applied in all other states.
Table 3.3 General Insurance Duty Rates, from 1 August 2013
NSW1 Vic Qld WA SA Tas Rate (%) 9.0 10.0 9.0 10.0 11.0 10.0
Note: 1. Concessional 5% rate payable on aviation, disability, hospital and ancillary health benefits, motor vehicle,
occupational indemnity. Concessional 2.50% rate payable on crop and livestock.
1 A life insurance rider is an additional insurance product attached to a life insurance policy.
56 Budget Strategy and Outlook 2013-14
There will be no changes to the duty payable on Workers Compensation or Compulsory Third Party (CTP) premiums.
This change is expected to provide additional revenue of approximately $195 million in 2013-14 and will be used to partially fund the State’s contribution to the National Disability Insurance Scheme (DisabilityCare).
Emergency Management, Fire and Rescue Levy From 1 January 2014, the Government is increasing and broadening the coverage of the Urban Fire Levy to ensure a sustainable funding base for emergency services. The levy will be known as the Emergency Management, Fire and Rescue Levy and will be applied to all rateable properties. Local governments affected for the first time will be provided with transitional assistance.
The levy will be extended to include Emergency Management Queensland, recognising that all Queenslanders are at risk from a wide range of emergencies including floods, cyclones, storms as well as fire and accidents. Emergency Management Queensland operates the State Emergency Service, emergency helicopter, disaster management and supports volunteer marine rescue services.
Since the levy was introduced the equipment needed and expertise involved with emergency management has grown significantly. The rate of the levy will increase by 6.5% to help partially offset the increasing costs of providing these services throughout Queensland although the levy does not cover the full costs of service provision.
Table 3.4 identifies the annual Emergency Management, Fire and Rescue Levy amount payable from 1 January 2014, for each property group and location class. Property group 1 includes vacant land, while detached houses are in property group 2. Property groups 3 to 16 cover a range of commercial properties.
Location classes are based on the number of funded service personnel in each location, with the more urbanised areas of Queensland (e.g. Brisbane, Cairns, Townsville) being in location class A. Location class E covers rateable properties that are not currently subject to the Urban Fire Levy, reflecting the broader purpose of the Emergency Management, Fire and Rescue Levy.
Further details of each property group and location class are available from www.dcs.qld.gov.au.
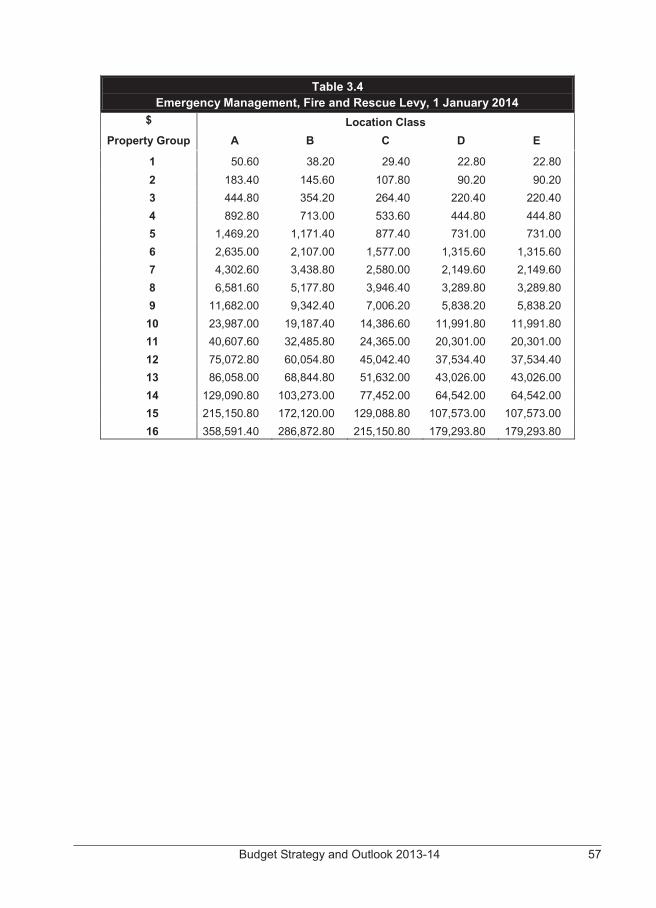
Budget Strategy and Outlook 2013-14 57
Table 3.4 Emergency Management, Fire and Rescue Levy, 1 January 2014
$ Location Class Property Group A B C D E
1 50.60 38.20 29.40 22.80 22.80 2 183.40 145.60 107.80 90.20 90.20 3 444.80 354.20 264.40 220.40 220.40 4 892.80 713.00 533.60 444.80 444.80 5 1,469.20 1,171.40 877.40 731.00 731.00 6 2,635.00 2,107.00 1,577.00 1,315.60 1,315.60 7 4,302.60 3,438.80 2,580.00 2,149.60 2,149.60 8 6,581.60 5,177.80 3,946.40 3,289.80 3,289.80 9 11,682.00 9,342.40 7,006.20 5,838.20 5,838.20
10 23,987.00 19,187.40 14,386.60 11,991.80 11,991.80 11 40,607.60 32,485.80 24,365.00 20,301.00 20,301.00 12 75,072.80 60,054.80 45,042.40 37,534.40 37,534.40 13 86,058.00 68,844.80 51,632.00 43,026.00 43,026.00 14 129,090.80 103,273.00 77,452.00 64,542.00 64,542.00 15 215,150.80 172,120.00 129,088.80 107,573.00 107,573.00 16 358,591.40 286,872.80 215,150.80 179,293.80 179,293.80
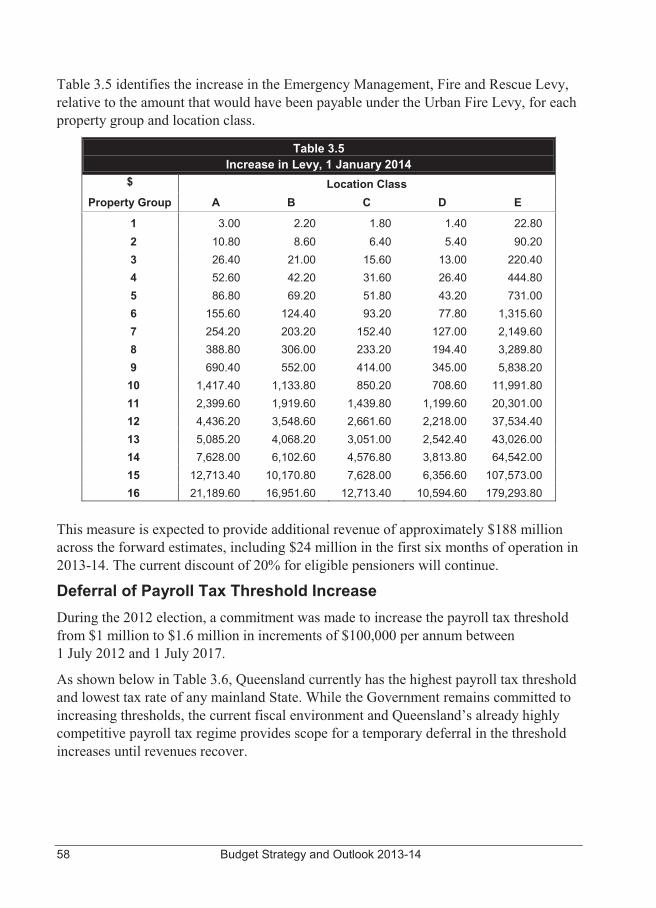
58 Budget Strategy and Outlook 2013-14
Table 3.5 identifies the increase in the Emergency Management, Fire and Rescue Levy, relative to the amount that would have been payable under the Urban Fire Levy, for each property group and location class.
Table 3.5 Increase in Levy, 1 January 2014
$ Location Class Property Group A B C D E
1 3.00 2.20 1.80 1.40 22.80 2 10.80 8.60 6.40 5.40 90.20 3 26.40 21.00 15.60 13.00 220.40 4 52.60 42.20 31.60 26.40 444.80 5 86.80 69.20 51.80 43.20 731.00 6 155.60 124.40 93.20 77.80 1,315.60 7 254.20 203.20 152.40 127.00 2,149.60 8 388.80 306.00 233.20 194.40 3,289.80 9 690.40 552.00 414.00 345.00 5,838.20
10 1,417.40 1,133.80 850.20 708.60 11,991.80 11 2,399.60 1,919.60 1,439.80 1,199.60 20,301.00 12 4,436.20 3,548.60 2,661.60 2,218.00 37,534.40 13 5,085.20 4,068.20 3,051.00 2,542.40 43,026.00 14 7,628.00 6,102.60 4,576.80 3,813.80 64,542.00 15 12,713.40 10,170.80 7,628.00 6,356.60 107,573.00 16 21,189.60 16,951.60 12,713.40 10,594.60 179,293.80
This measure is expected to provide additional revenue of approximately $188 million across the forward estimates, including $24 million in the first six months of operation in 2013-14. The current discount of 20% for eligible pensioners will continue.
Deferral of Payroll Tax Threshold Increase During the 2012 election, a commitment was made to increase the payroll tax threshold from $1 million to $1.6 million in increments of $100,000 per annum between 1 July 2012 and 1 July 2017.
As shown below in Table 3.6, Queensland currently has the highest payroll tax threshold and lowest tax rate of any mainland State. While the Government remains committed to increasing thresholds, the current fiscal environment and Queensland’s already highly competitive payroll tax regime provides scope for a temporary deferral in the threshold increases until revenues recover.
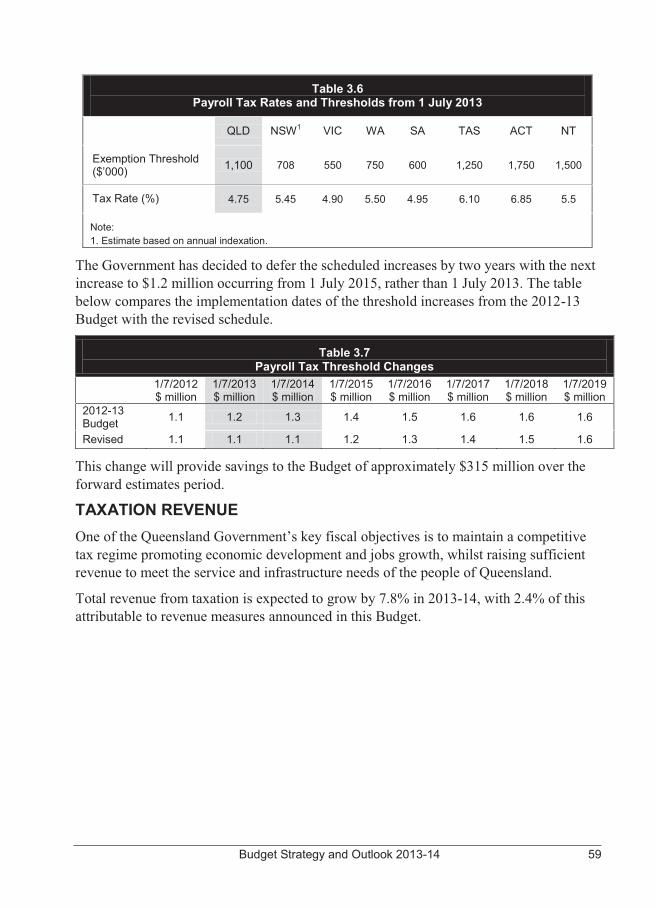
Budget Strategy and Outlook 2013-14 59
Table 3.6 Payroll Tax Rates and Thresholds from 1 July 2013
QLD NSW1 VIC WA SA TAS ACT NT
Exemption Threshold ($’000) 1,100 708 550 750 600 1,250 1,750 1,500
Tax Rate (%) 4.75 5.45 4.90 5.50 4.95 6.10 6.85 5.5
Note: 1. Estimate based on annual indexation.
The Government has decided to defer the scheduled increases by two years with the next increase to $1.2 million occurring from 1 July 2015, rather than 1 July 2013. The table below compares the implementation dates of the threshold increases from the 2012-13 Budget with the revised schedule.
Table 3.7 Payroll Tax Threshold Changes
1/7/2012 $ million
1/7/2013 $ million
1/7/2014 $ million
1/7/2015 $ million
1/7/2016 $ million
1/7/2017 $ million
1/7/2018 $ million
1/7/2019 $ million
2012-13 Budget 1.1 1.2 1.3 1.4 1.5 1.6 1.6 1.6
Revised 1.1 1.1 1.1 1.2 1.3 1.4 1.5 1.6
This change will provide savings to the Budget of approximately $315 million over the forward estimates period.
TAXATION REVENUE One of the Queensland Government’s key fiscal objectives is to maintain a competitive tax regime promoting economic development and jobs growth, whilst raising sufficient revenue to meet the service and infrastructure needs of the people of Queensland.
Total revenue from taxation is expected to grow by 7.8% in 2013-14, with 2.4% of this attributable to revenue measures announced in this Budget.
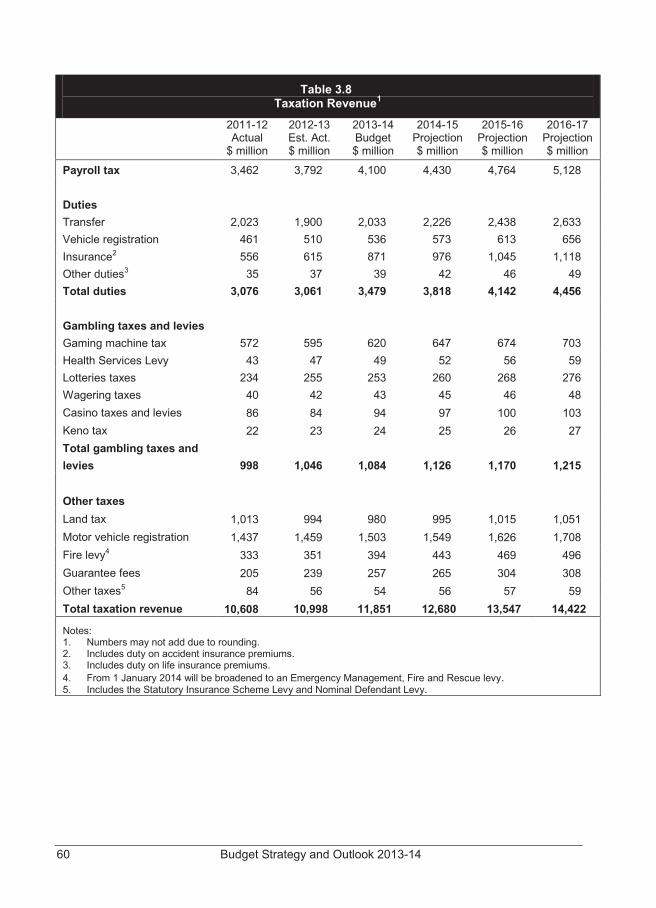
60 Budget Strategy and Outlook 2013-14
Table 3.8 Taxation Revenue1
2011-12 Actual
$ million
2012-13 Est. Act. $ million
2013-14 Budget $ million
2014-15 Projection $ million
2015-16 Projection $ million
2016-17 Projection $ million
Payroll tax 3,462 3,792 4,100 4,430 4,764 5,128 Duties Transfer 2,023 1,900 2,033 2,226 2,438 2,633 Vehicle registration 461 510 536 573 613 656 Insurance2 556 615 871 976 1,045 1,118 Other duties3 35 37 39 42 46 49 Total duties 3,076 3,061 3,479 3,818 4,142 4,456 Gambling taxes and levies Gaming machine tax 572 595 620 647 674 703 Health Services Levy 43 47 49 52 56 59 Lotteries taxes 234 255 253 260 268 276 Wagering taxes 40 42 43 45 46 48 Casino taxes and levies 86 84 94 97 100 103 Keno tax 22 23 24 25 26 27 Total gambling taxes and levies 998 1,046 1,084 1,126 1,170 1,215 Other taxes Land tax 1,013 994 980 995 1,015 1,051 Motor vehicle registration 1,437 1,459 1,503 1,549 1,626 1,708 Fire levy4 333 351 394 443 469 496 Guarantee fees 205 239 257 265 304 308 Other taxes5 84 56 54 56 57 59 Total taxation revenue 10,608 10,998 11,851 12,680 13,547 14,422
Notes: 1. Numbers may not add due to rounding. 2. Includes duty on accident insurance premiums. 3. Includes duty on life insurance premiums. 4. From 1 January 2014 will be broadened to an Emergency Management, Fire and Rescue levy. 5. Includes the Statutory Insurance Scheme Levy and Nominal Defendant Levy.
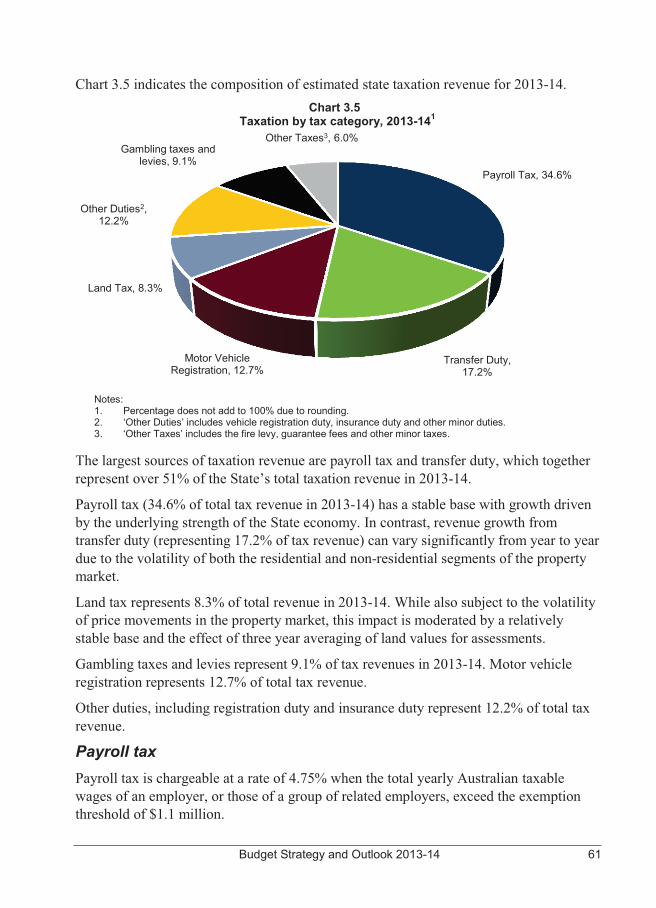
Budget Strategy and Outlook 2013-14 61
Chart 3.5 indicates the composition of estimated state taxation revenue for 2013-14. Chart 3.5
Taxation by tax category, 2013-141
Notes: 1. Percentage does not add to 100% due to rounding. 2. ‘Other Duties’ includes vehicle registration duty, insurance duty and other minor duties. 3. ‘Other Taxes’ includes the fire levy, guarantee fees and other minor taxes.
The largest sources of taxation revenue are payroll tax and transfer duty, which together represent over 51% of the State’s total taxation revenue in 2013-14.
Payroll tax (34.6% of total tax revenue in 2013-14) has a stable base with growth driven by the underlying strength of the State economy. In contrast, revenue growth from transfer duty (representing 17.2% of tax revenue) can vary significantly from year to year due to the volatility of both the residential and non-residential segments of the property market.
Land tax represents 8.3% of total revenue in 2013-14. While also subject to the volatility of price movements in the property market, this impact is moderated by a relatively stable base and the effect of three year averaging of land values for assessments.
Gambling taxes and levies represent 9.1% of tax revenues in 2013-14. Motor vehicle registration represents 12.7% of total tax revenue.
Other duties, including registration duty and insurance duty represent 12.2% of total tax revenue.
Payroll tax Payroll tax is chargeable at a rate of 4.75% when the total yearly Australian taxable wages of an employer, or those of a group of related employers, exceed the exemption threshold of $1.1 million.
Payroll Tax, 34.6%
Transfer Duty, 17.2%
Motor Vehicle Registration, 12.7%
Land Tax, 8.3%
Other Duties2, 12.2%
Gambling taxes and levies, 9.1%
Other Taxes3, 6.0%
62 Budget Strategy and Outlook 2013-14
The overall payroll tax rate of 4.75% is the lowest in Australia and the exemption threshold of $1.1 million is the highest threshold of any mainland state. Queensland employers with total yearly Australian taxable wages between $1.1 million and $5.5 million also obtain a partial deduction, with the deduction withdrawn at a rate of $1 in every $4 of taxable wages.
Payroll tax collections are estimated to be $4.1 billion in 2013-14, representing growth of 8.1% on the 2012-13 estimated actual. Despite modest employment growth in 2012-13 payroll tax collections are estimated to have grown by 9.5% over 2011-12. This reflects the relative strength of the resources sector. The expectation is that slower growth in the resources sector will moderate payroll tax growth in 2013-14 and beyond.
As outlined in Chapter 2, labour market conditions are expected to improve over the budget and forward estimates period but the average growth of 7.8% remains well below the average of 9.4% from the period 1999-00 to 2011-12.
Duties Duties are levied on a range of financial and property transactions.
The major duties include transfer, vehicle registration and insurance duties.
� Transfer duty is charged at various rates on the transfer of real and business property. The Queensland Government offers extensive concessions for the transfer of land where the property is purchased as a home. For example, eligible first home buyers of properties up to $500,000 will pay no duty with reduced rates available up to $550,000.
Revenue from transfer duty is expected to grow by 7% in 2013-14. This is based on the expectation that the recent increase in the number of transactions, along with modest growth in house prices will continue, offsetting a subdued outlook for non-residential activity.
From 2014-15 the non-residential sector is expected to recover allowing for the rate of growth to pick up slightly in 2014-15 and 2015-16. The extraordinary annual growth in transfer duty of 22.6% from 2000-01 to 2007-08 is unlikely to ever be repeated.
� Vehicle registration duty is charged at rates of between 2% and 4% of the dutiable value of a motor vehicle on the transfer or initial registration of the motor vehicle, with the rate generally depending on the number of cylinders or rotors of the vehicle.
Revenue from vehicle registration duty is expected to grow by 5% in 2013-14, reflecting a moderation in the number of sales following strong growth of 10.6% in 2012-13.
Budget Strategy and Outlook 2013-14 63
� Insurance duty is charged on contracts of general insurance, life insurance and accident insurance. From 1 August 2013 the rate for most general insurance products will increase to 9%. The new rates will apply to premiums paid on or after 1 August 2013, for policies entered into on or after that date. Temporary or term life insurance continues to attract duty at 5% of the first year’s premium. Other contracts of life insurance are charged at 0.05% of the sum insured up to $2,000, and 0.01% of the balance of the sum insured. Revenue from insurance duty is expected to grow strongly in 2013-14, primarily reflecting the impact of the rate increases.
Gambling taxes and levies A range of gambling activities are subject to state taxes and levies. Total gambling tax and levy collections are estimated to grow by 3.6% in 2013-14.
Land tax
Land tax is levied on the taxable value of the landowner’s aggregated holdings of freehold land owned in Queensland as at midnight on 30 June each year. The principal place of residence is deducted from this value.
Resident individuals are generally liable for land tax if the total taxable value of the freehold land owned by that person as at 30 June is equal to or greater than $600,000. Companies, trustees and absentees are liable for land tax if the total taxable value of the freehold land owned as at 30 June is equal to or greater than $350,000.
Land tax is estimated to fall by 1.4% to $980 million in 2013-14 with very restrained growth over the outyears. In recent years, land tax revenue has been adversely impacted by declining values, particularly for commercial and multi-unit residential land. Even with modest recovery in land values expected going forward, the three year averaging process dilutes the impact on tax collections which is reflected by the moderate growth over the budget period.
Motor vehicle registration fees Motor vehicle registration fees are expected to grow by 3.0% in 2013-14, primarily reflecting an increase in the number of motor vehicles as under the Government’s election commitment there is no increase in the level of registration fees for private vehicles during this term of government.
64 Budget Strategy and Outlook 2013-14
Emergency Management, Fire and Rescue Levy The Emergency Management, Fire and Rescue Levy revenue, which is used partly to offset the costs of emergency management in Queensland is expected to grow by 12.4% in 2013-14 reflecting the rate increase of 6.5% and extending the levy to all rateable properties.
Guarantee fees Guarantee fees are revenues collected by Queensland Treasury Corporation (QTC) on behalf of the State and comprise performance dividends, competitive neutrality fees and credit margin fees. These fees promote competitive neutrality between public sector agencies and those in the private sector, and ensure that the benefits accruing from the financial backing and superior borrowing performance of the State (through QTC) are shared between the borrower and the State.
Other taxes Other taxes represent revenue from taxes such as the Statutory Insurance Scheme levy and the Nominal Defendant levy.
Tax expenditures Tax expenditures are reductions in tax revenue that result from the use of the tax system as a policy tool to deliver Government policy objectives. Tax expenditures are provided through a range of concessions, including tax exemptions, reduced tax rates, tax rebates, tax deductions and provisions which defer payment of a tax liability to a future period. Appendix A provides details of tax expenditure arrangements currently provided by the Queensland Government.
QUEENSLAND’S COMPETITIVE TAX STATUS Taxation can impact on business decisions regarding investment and employment, and also household investment and home ownership. Maintaining the competitiveness of Queensland’s tax system provides a competitive advantage to business and moderates the tax burden for its citizens, and is therefore fundamental to the Government’s commitment to job creation and sustainable development.
One of the Queensland Government’s fiscal objectives is to maintain a competitive tax environment for business. As Table 3.9 shows, taxation per capita in Queensland is significantly lower than the average taxation per capita in the other states and territories. In 2013-14, it is estimated that Queensland’s taxation per capita will be $475 per capita less than the average of other jurisdictions.
Queensland’s tax effort, as measured by the Commonwealth Grants Commission, was more than 12% below the national average in 2011-12.
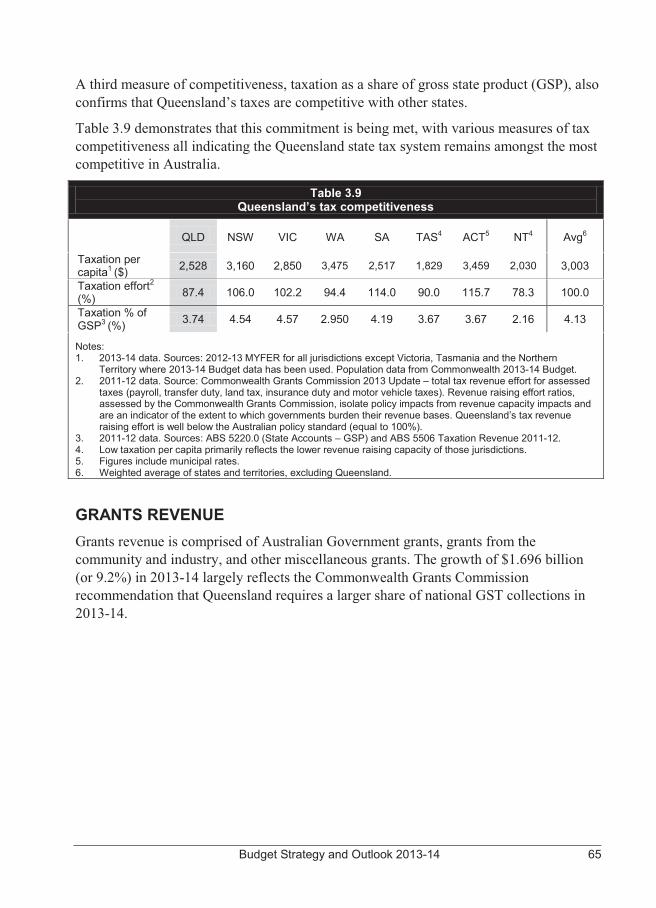
Budget Strategy and Outlook 2013-14 65
A third measure of competitiveness, taxation as a share of gross state product (GSP), also confirms that Queensland’s taxes are competitive with other states.
Table 3.9 demonstrates that this commitment is being met, with various measures of tax competitiveness all indicating the Queensland state tax system remains amongst the most competitive in Australia.
Table 3.9 Queensland’s tax competitiveness
QLD NSW VIC WA SA TAS4 ACT5 NT4 Avg6
Taxation per capita1 ($) 2,528 3,160 2,850 3,475 2,517 1,829 3,459 2,030 3,003
Taxation effort2
(%) 87.4 106.0 102.2 94.4 114.0 90.0 115.7 78.3 100.0
Taxation % of GSP3 (%) 3.74 4.54 4.57 2.950 4.19 3.67 3.67 2.16 4.13
Notes: 1. 2013-14 data. Sources: 2012-13 MYFER for all jurisdictions except Victoria, Tasmania and the Northern
Territory where 2013-14 Budget data has been used. Population data from Commonwealth 2013-14 Budget. 2. 2011-12 data. Source: Commonwealth Grants Commission 2013 Update – total tax revenue effort for assessed
taxes (payroll, transfer duty, land tax, insurance duty and motor vehicle taxes). Revenue raising effort ratios, assessed by the Commonwealth Grants Commission, isolate policy impacts from revenue capacity impacts and are an indicator of the extent to which governments burden their revenue bases. Queensland’s tax revenue raising effort is well below the Australian policy standard (equal to 100%).
3. 2011-12 data. Sources: ABS 5220.0 (State Accounts – GSP) and ABS 5506 Taxation Revenue 2011-12. 4. Low taxation per capita primarily reflects the lower revenue raising capacity of those jurisdictions. 5. Figures include municipal rates. 6. Weighted average of states and territories, excluding Queensland.
GRANTS REVENUE Grants revenue is comprised of Australian Government grants, grants from the community and industry, and other miscellaneous grants. The growth of $1.696 billion (or 9.2%) in 2013-14 largely reflects the Commonwealth Grants Commission recommendation that Queensland requires a larger share of national GST collections in 2013-14.
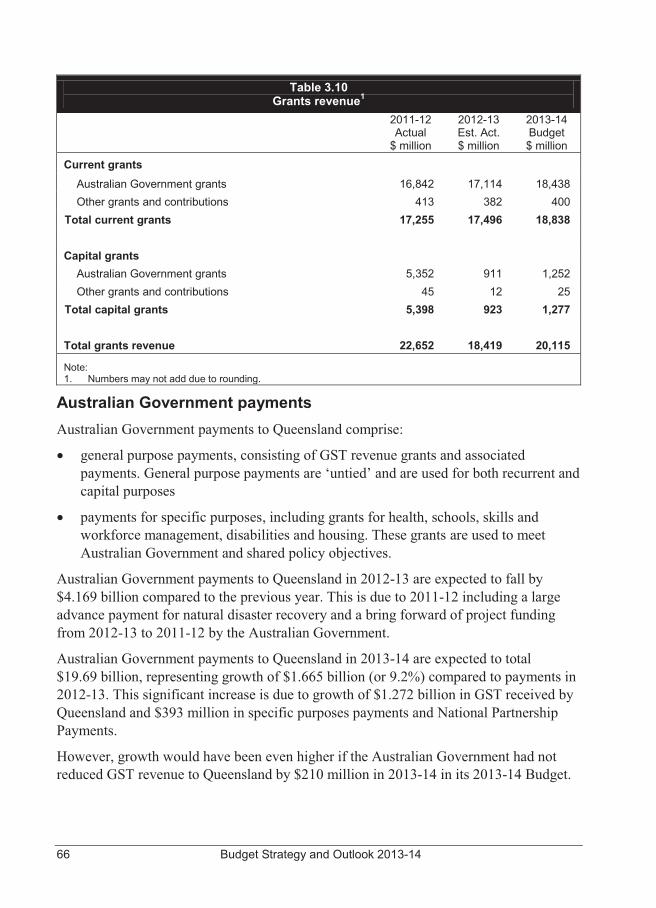
66 Budget Strategy and Outlook 2013-14
Table 3.10 Grants revenue1
2011-12 Actual
$ million
2012-13 Est. Act. $ million
2013-14 Budget $ million
Current grants
Australian Government grants 16,842 17,114 18,438 Other grants and contributions 413 382 400
Total current grants 17,255 17,496 18,838 Capital grants
Australian Government grants 5,352 911 1,252 Other grants and contributions 45 12 25
Total capital grants 5,398 923 1,277 Total grants revenue 22,652 18,419 20,115
Note: 1. Numbers may not add due to rounding.
Australian Government payments Australian Government payments to Queensland comprise:
� general purpose payments, consisting of GST revenue grants and associated payments. General purpose payments are ‘untied’ and are used for both recurrent and capital purposes
� payments for specific purposes, including grants for health, schools, skills and workforce management, disabilities and housing. These grants are used to meet Australian Government and shared policy objectives.
Australian Government payments to Queensland in 2012-13 are expected to fall by $4.169 billion compared to the previous year. This is due to 2011-12 including a large advance payment for natural disaster recovery and a bring forward of project funding from 2012-13 to 2011-12 by the Australian Government.
Australian Government payments to Queensland in 2013-14 are expected to total $19.69 billion, representing growth of $1.665 billion (or 9.2%) compared to payments in 2012-13. This significant increase is due to growth of $1.272 billion in GST received by Queensland and $393 million in specific purposes payments and National Partnership Payments.
However, growth would have been even higher if the Australian Government had not reduced GST revenue to Queensland by $210 million in 2013-14 in its 2013-14 Budget.
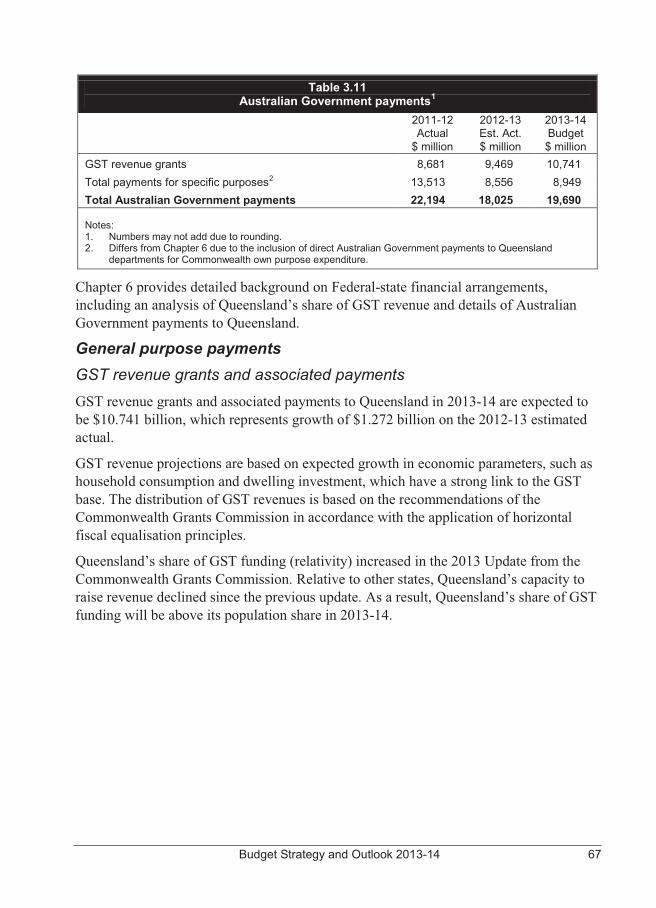
Budget Strategy and Outlook 2013-14 67
Table 3.11 Australian Government payments1
2011-12 Actual
$ million
2012-13 Est. Act. $ million
2013-14 Budget $ million
GST revenue grants 8,681 9,469 10,741 Total payments for specific purposes2 13,513 8,556 8,949 Total Australian Government payments 22,194 18,025 19,690
Notes: 1. Numbers may not add due to rounding. 2. Differs from Chapter 6 due to the inclusion of direct Australian Government payments to Queensland
departments for Commonwealth own purpose expenditure.
Chapter 6 provides detailed background on Federal-state financial arrangements, including an analysis of Queensland’s share of GST revenue and details of Australian Government payments to Queensland.
General purpose payments GST revenue grants and associated payments GST revenue grants and associated payments to Queensland in 2013-14 are expected to be $10.741 billion, which represents growth of $1.272 billion on the 2012-13 estimated actual.
GST revenue projections are based on expected growth in economic parameters, such as household consumption and dwelling investment, which have a strong link to the GST base. The distribution of GST revenues is based on the recommendations of the Commonwealth Grants Commission in accordance with the application of horizontal fiscal equalisation principles.
Queensland’s share of GST funding (relativity) increased in the 2013 Update from the Commonwealth Grants Commission. Relative to other states, Queensland’s capacity to raise revenue declined since the previous update. As a result, Queensland’s share of GST funding will be above its population share in 2013-14.
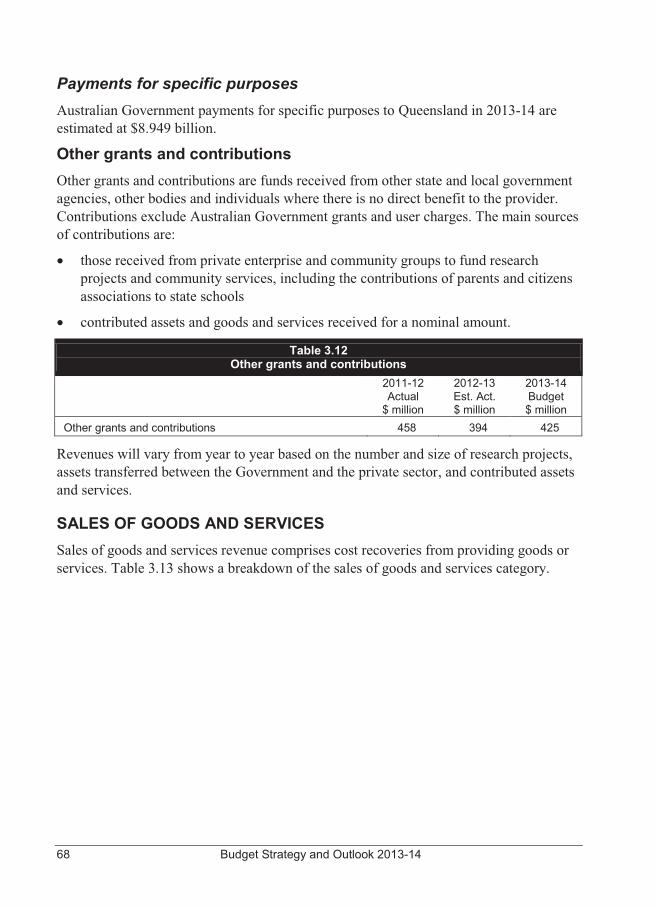
68 Budget Strategy and Outlook 2013-14
Payments for specific purposes Australian Government payments for specific purposes to Queensland in 2013-14 are estimated at $8.949 billion.
Other grants and contributions Other grants and contributions are funds received from other state and local government agencies, other bodies and individuals where there is no direct benefit to the provider. Contributions exclude Australian Government grants and user charges. The main sources of contributions are:
� those received from private enterprise and community groups to fund research projects and community services, including the contributions of parents and citizens associations to state schools
� contributed assets and goods and services received for a nominal amount.
Table 3.12 Other grants and contributions
2011-12 Actual
$ million
2012-13 Est. Act. $ million
2013-14 Budget $ million
Other grants and contributions 458 394 425
Revenues will vary from year to year based on the number and size of research projects, assets transferred between the Government and the private sector, and contributed assets and services.
SALES OF GOODS AND SERVICES Sales of goods and services revenue comprises cost recoveries from providing goods or services. Table 3.13 shows a breakdown of the sales of goods and services category.
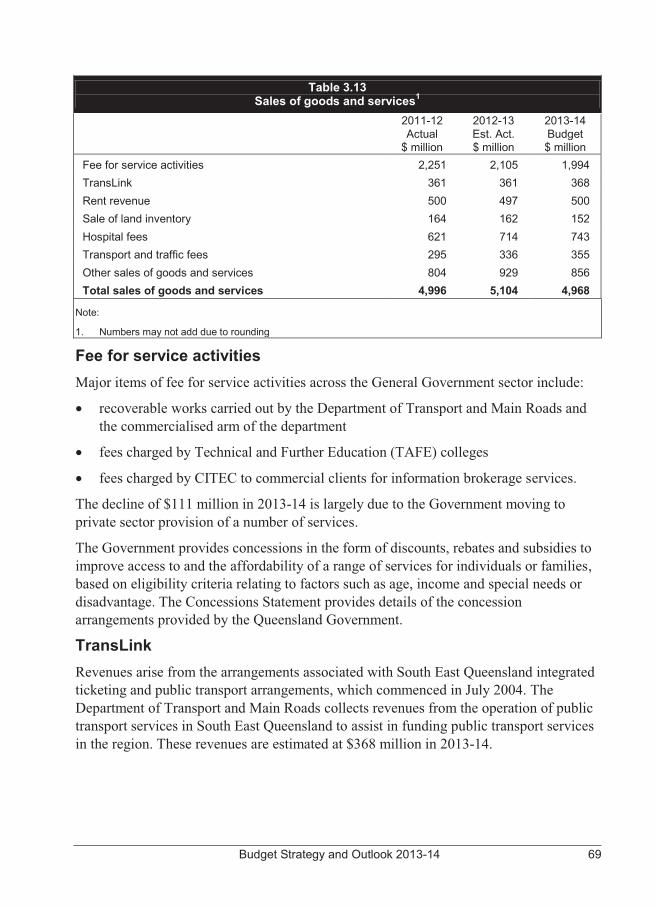
Budget Strategy and Outlook 2013-14 69
Table 3.13 Sales of goods and services1
2011-12 Actual
$ million
2012-13 Est. Act. $ million
2013-14 Budget $ million
Fee for service activities 2,251 2,105 1,994 TransLink 361 361 368 Rent revenue 500 497 500 Sale of land inventory 164 162 152 Hospital fees 621 714 743 Transport and traffic fees 295 336 355 Other sales of goods and services 804 929 856 Total sales of goods and services 4,996 5,104 4,968
Note:
1. Numbers may not add due to rounding
Fee for service activities Major items of fee for service activities across the General Government sector include:
� recoverable works carried out by the Department of Transport and Main Roads and the commercialised arm of the department
� fees charged by Technical and Further Education (TAFE) colleges
� fees charged by CITEC to commercial clients for information brokerage services.
The decline of $111 million in 2013-14 is largely due to the Government moving to private sector provision of a number of services.
The Government provides concessions in the form of discounts, rebates and subsidies to improve access to and the affordability of a range of services for individuals or families, based on eligibility criteria relating to factors such as age, income and special needs or disadvantage. The Concessions Statement provides details of the concession arrangements provided by the Queensland Government.
TransLink Revenues arise from the arrangements associated with South East Queensland integrated ticketing and public transport arrangements, which commenced in July 2004. The Department of Transport and Main Roads collects revenues from the operation of public transport services in South East Queensland to assist in funding public transport services in the region. These revenues are estimated at $368 million in 2013-14.
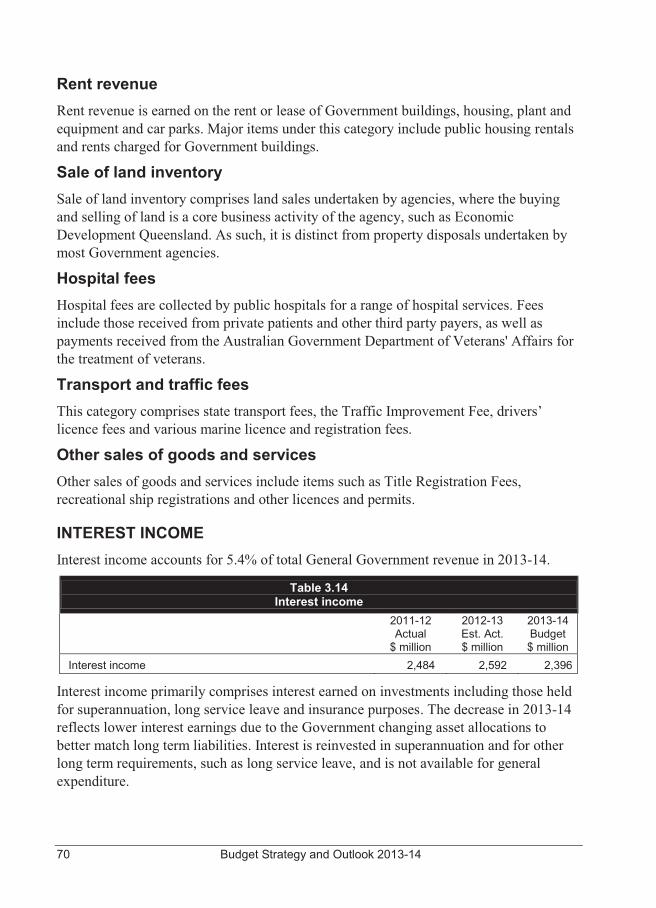
70 Budget Strategy and Outlook 2013-14
Rent revenue Rent revenue is earned on the rent or lease of Government buildings, housing, plant and equipment and car parks. Major items under this category include public housing rentals and rents charged for Government buildings.
Sale of land inventory Sale of land inventory comprises land sales undertaken by agencies, where the buying and selling of land is a core business activity of the agency, such as Economic Development Queensland. As such, it is distinct from property disposals undertaken by most Government agencies.
Hospital fees Hospital fees are collected by public hospitals for a range of hospital services. Fees include those received from private patients and other third party payers, as well as payments received from the Australian Government Department of Veterans' Affairs for the treatment of veterans.
Transport and traffic fees This category comprises state transport fees, the Traffic Improvement Fee, drivers’ licence fees and various marine licence and registration fees.
Other sales of goods and services Other sales of goods and services include items such as Title Registration Fees, recreational ship registrations and other licences and permits.
INTEREST INCOME Interest income accounts for 5.4% of total General Government revenue in 2013-14.
Table 3.14 Interest income
2011-12 Actual
$ million
2012-13 Est. Act. $ million
2013-14 Budget $ million
Interest income 2,484 2,592 2,396
Interest income primarily comprises interest earned on investments including those held for superannuation, long service leave and insurance purposes. The decrease in 2013-14 reflects lower interest earnings due to the Government changing asset allocations to better match long term liabilities. Interest is reinvested in superannuation and for other long term requirements, such as long service leave, and is not available for general expenditure.
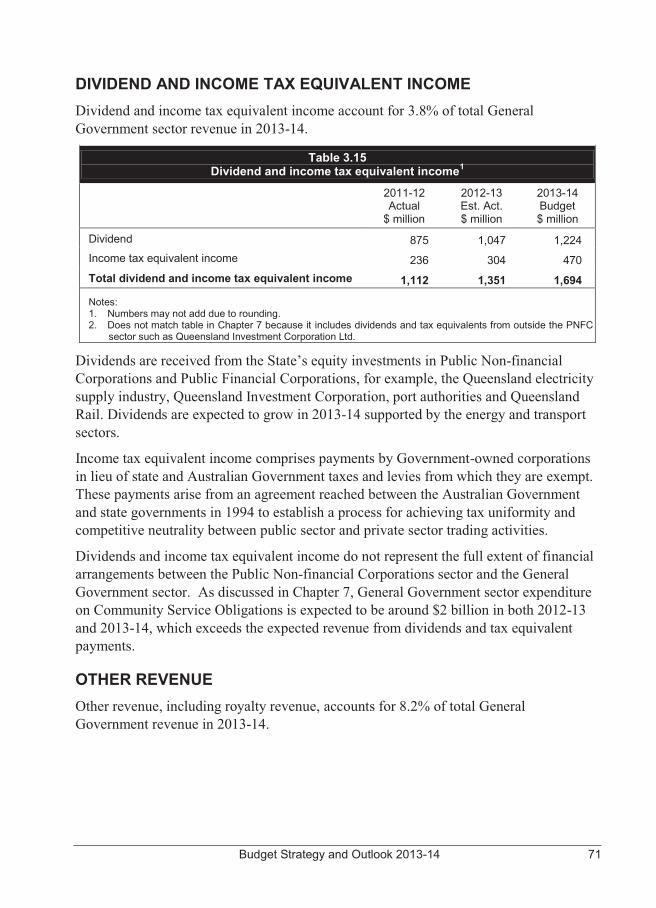
Budget Strategy and Outlook 2013-14 71
DIVIDEND AND INCOME TAX EQUIVALENT INCOME Dividend and income tax equivalent income account for 3.8% of total General Government sector revenue in 2013-14.
Table 3.15 Dividend and income tax equivalent income1
2011-12
Actual $ million
2012-13 Est. Act. $ million
2013-14 Budget $ million
Dividend 875 1,047 1,224 Income tax equivalent income 236 304 470 Total dividend and income tax equivalent income 1,112 1,351 1,694
Notes: 1. Numbers may not add due to rounding. 2. Does not match table in Chapter 7 because it includes dividends and tax equivalents from outside the PNFC
sector such as Queensland Investment Corporation Ltd.
Dividends are received from the State’s equity investments in Public Non-financial Corporations and Public Financial Corporations, for example, the Queensland electricity supply industry, Queensland Investment Corporation, port authorities and Queensland Rail. Dividends are expected to grow in 2013-14 supported by the energy and transport sectors.
Income tax equivalent income comprises payments by Government-owned corporations in lieu of state and Australian Government taxes and levies from which they are exempt. These payments arise from an agreement reached between the Australian Government and state governments in 1994 to establish a process for achieving tax uniformity and competitive neutrality between public sector and private sector trading activities.
Dividends and income tax equivalent income do not represent the full extent of financial arrangements between the Public Non-financial Corporations sector and the General Government sector. As discussed in Chapter 7, General Government sector expenditure on Community Service Obligations is expected to be around $2 billion in both 2012-13 and 2013-14, which exceeds the expected revenue from dividends and tax equivalent payments.
OTHER REVENUE Other revenue, including royalty revenue, accounts for 8.2% of total General Government revenue in 2013-14.
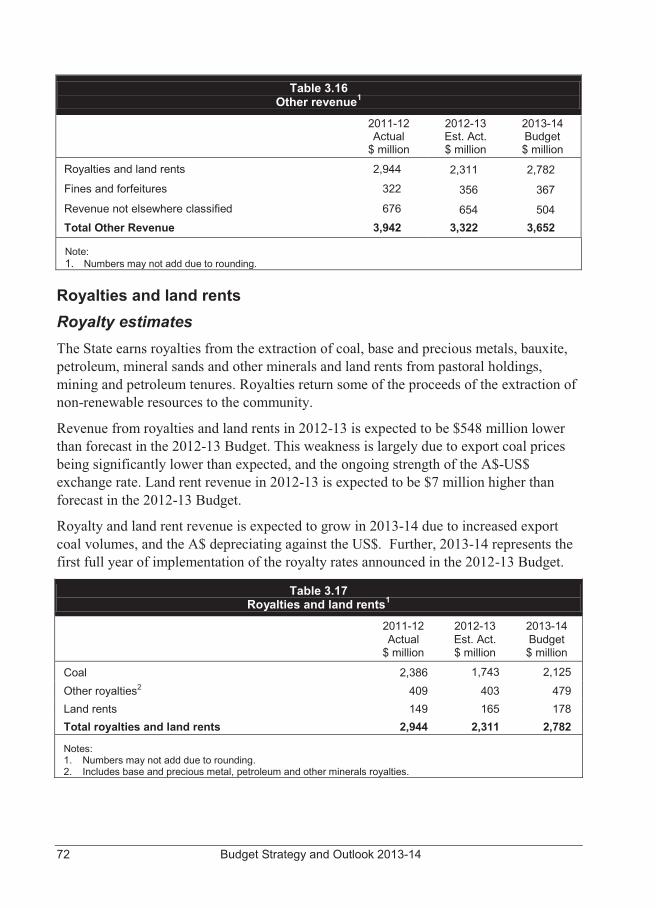
72 Budget Strategy and Outlook 2013-14
Table 3.16 Other revenue1
2011-12 Actual
$ million
2012-13 Est. Act. $ million
2013-14 Budget $ million
Royalties and land rents 2,944 2,311 2,782
Fines and forfeitures 322 356 367 Revenue not elsewhere classified 676 654 504 Total Other Revenue 3,942 3,322 3,652
Note: 1. Numbers may not add due to rounding.
Royalties and land rents Royalty estimates The State earns royalties from the extraction of coal, base and precious metals, bauxite, petroleum, mineral sands and other minerals and land rents from pastoral holdings, mining and petroleum tenures. Royalties return some of the proceeds of the extraction of non-renewable resources to the community.
Revenue from royalties and land rents in 2012-13 is expected to be $548 million lower than forecast in the 2012-13 Budget. This weakness is largely due to export coal prices being significantly lower than expected, and the ongoing strength of the A$-US$ exchange rate. Land rent revenue in 2012-13 is expected to be $7 million higher than forecast in the 2012-13 Budget.
Royalty and land rent revenue is expected to grow in 2013-14 due to increased export coal volumes, and the A$ depreciating against the US$. Further, 2013-14 represents the first full year of implementation of the royalty rates announced in the 2012-13 Budget.
Table 3.17 Royalties and land rents1
2011-12 Actual
$ million
2012-13 Est. Act. $ million
2013-14 Budget $ million
Coal 2,386 1,743 2,125 Other royalties2 409 403 479 Land rents 149 165 178 Total royalties and land rents 2,944 2,311 2,782
Notes: 1. Numbers may not add due to rounding. 2. Includes base and precious metal, petroleum and other minerals royalties.
Budget Strategy and Outlook 2013-14 73
Although global economic uncertainty will influence demand for resources from our trading partners, the longer term outlook for royalties is generally positive. Production volumes are expected to improve as demand is driven by more competitive prices and the rates of growth in our major trading partners increase. Coal prices are expected to settle above recent contract benchmarks but still well below historical levels. The exchange rate is expected to return below parity across the forward estimates gradually falling as international markets stabilise and the fundamental determinants of the exchange rate determine its ‘fair value’.
There is a significant degree of uncertainty associated with estimates of commodity prices and the A$-US$ exchange rate, both of which have significant impacts on royalty revenue.
Further details of the assumptions underlying the royalty estimates, and the impact of changes in the assumptions are contained in Appendix B.
Fines and forfeitures The major fines and infringements included in this category are issued by Department of Transport and Main Roads, Queensland Police Service and toll road operators, incorporating fixed and mobile camera offences, speeding and tolling offences. There is an expected growth of 3.1% in collections of fines and forfeitures in 2013-14.
Since taking over responsibility for the State Penalties Enforcement Registry (SPER) on 25 May 2012, the Office of State Revenue has implemented a number of reforms. The legislation program commenced with new information gathering powers as part of the Fiscal Repair Amendment Act 2012, allowing the Registrar to access new data sources. The SPER debt pool has been analysed and tailored approaches are being developed to ensure the most appropriate and cost effective enforcement strategy is deployed.
The trial of the use of Mercantile Agents has shown positive indications of improved debt collections. Additional options for collection of debts are being evaluated. The SPER website has been updated and new tools made available to debtors. Online facilities are now available for payment, balance enquiry and instalment plans.
Revenue not elsewhere classified The $151 million decrease in 2013-14 includes an expected decline in asset transfers from non-Queensland Government entities and reductions in sundry revenue across a number of departments.

74 Budget Strategy and Outlook 2013-14
Budget Strategy and Outlook 2013-14 75
4 EXPENSES
FEATURES � Reflecting the focus of the 2012-13 Budget on fiscal repair, General
Government sector expenses in 2012-13 are estimated to be only 1.1% higher than in 2011-12. This is the lowest rate of growth since accrual accounting commenced in 1998-99, and contrasts with an average rate of expenses growth of 8.9% over the decade to 2011-12.
� The main reason why expenses growth is so modest is the Government’s determination to keep employee expenses under control and reduce the size of the public service. The number of Full Time Equivalent (FTE) positions in government departments is estimated to have fallen by around 12,800 from 30 June 2012 to 30 June 2013.
� FTE redundancies related to the Government’s fiscal repair program are estimated to be around 9,200 in 2012-13. This is lower than the 2012-13 Budget estimate of 10,600 redundancies.
� The number of FTEs in the public service in 2016-17 is projected to be less than in 2011-12. This, combined with a disciplined approach to affordable wage outcomes, is expected to result in average employee expenses growth of 2.5% over the period 2011-12 to 2016-17.
� Employee expenses in 2012-13 are estimated to be only 0.9% above 2011-12. This is the smallest increase since accrual accounting commenced in 1998-99. On current estimates, employee expenses growth in 2013-14 will be only 0.1% above 2012-13, primarily reflecting the full year effort of savings measures implemented in the 2012-13 Budget.
� In 2013-14, General Government sector expenses, excluding natural disaster expenses, are expected to increase by $1.254 billion (or 2.8%) over the estimated actual for 2012-13 primarily as a result of increased service delivery including the provision of public hospital and education services.
� In 2012-13, total General Government sector expenses decreased by $1.738 billion over the 2012-13 Mid Year Fiscal and Economic Review (MYFER) partly reflecting a change in the timing of natural disaster reconstruction spending and lower than expected cost of redundancies.
� Expenses are projected to grow on average by 2.6% over the period 2012-13 to 2016-17.
� The major areas of expenditure are health and education, which together constitute approximately 50% of General Government sector expenses.
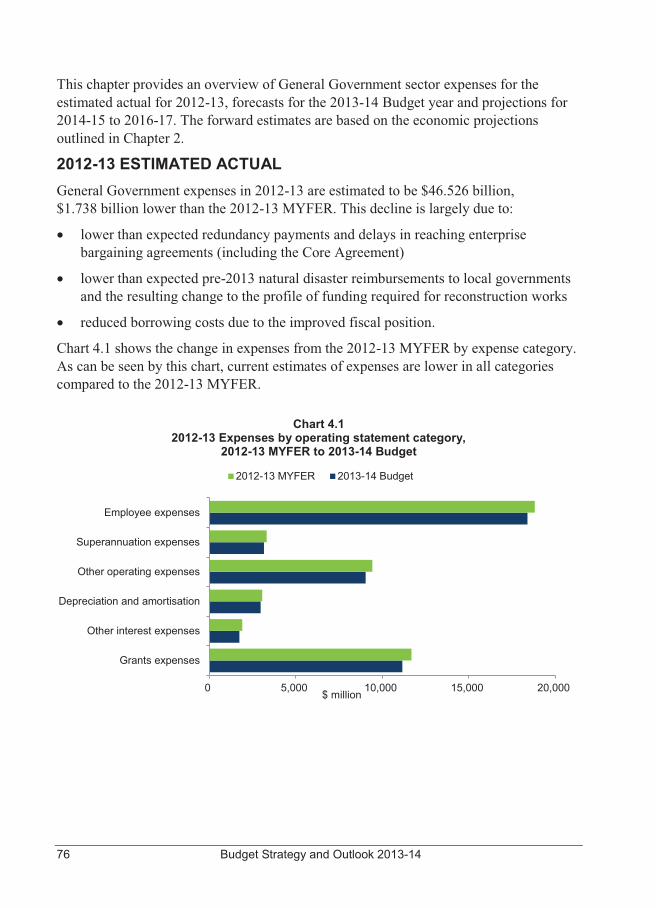
76 Budget Strategy and Outlook 2013-14
This chapter provides an overview of General Government sector expenses for the estimated actual for 2012-13, forecasts for the 2013-14 Budget year and projections for 2014-15 to 2016-17. The forward estimates are based on the economic projections outlined in Chapter 2.
2012-13 ESTIMATED ACTUAL General Government expenses in 2012-13 are estimated to be $46.526 billion, $1.738 billion lower than the 2012-13 MYFER. This decline is largely due to:
� lower than expected redundancy payments and delays in reaching enterprise bargaining agreements (including the Core Agreement)
� lower than expected pre-2013 natural disaster reimbursements to local governments and the resulting change to the profile of funding required for reconstruction works
� reduced borrowing costs due to the improved fiscal position.
Chart 4.1 shows the change in expenses from the 2012-13 MYFER by expense category. As can be seen by this chart, current estimates of expenses are lower in all categories compared to the 2012-13 MYFER.
Chart 4.1
2012-13 Expenses by operating statement category, 2012-13 MYFER to 2013-14 Budget
0 5,000 10,000 15,000 20,000
Grants expenses
Other interest expenses
Depreciation and amortisation
Other operating expenses
Superannuation expenses
Employee expenses
$ million
2012-13 MYFER 2013-14 Budget
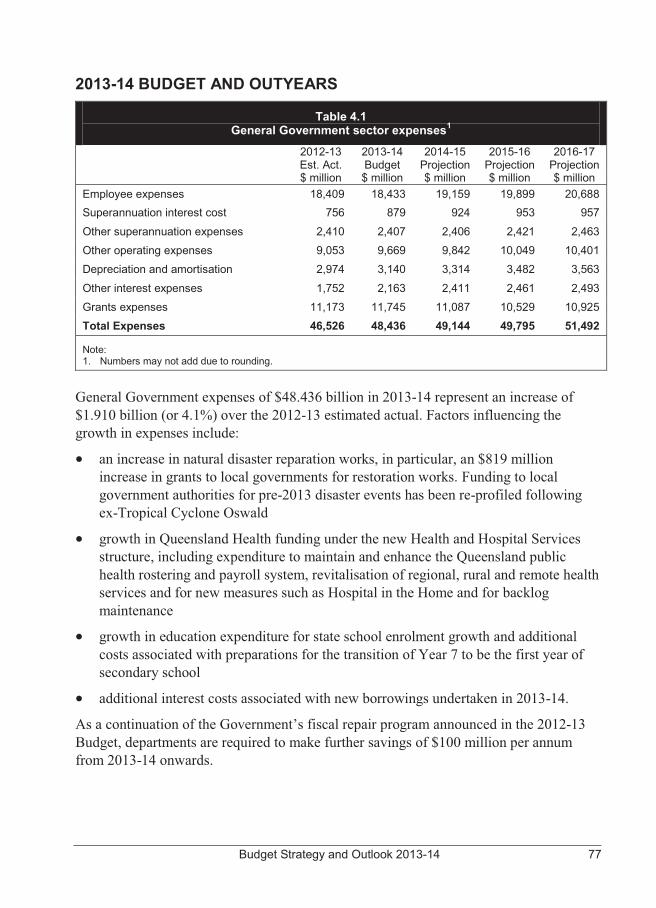
Budget Strategy and Outlook 2013-14 77
2013-14 BUDGET AND OUTYEARS
Table 4.1 General Government sector expenses1
2012-13 Est. Act.
2013-14 Budget
2014-15 Projection
2015-16 Projection
2016-17 Projection
$ million $ million $ million $ million $ million Employee expenses 18,409 18,433 19,159 19,899 20,688 Superannuation interest cost 756 879 924 953 957
Other superannuation expenses 2,410 2,407 2,406 2,421 2,463 Other operating expenses 9,053 9,669 9,842 10,049 10,401 Depreciation and amortisation 2,974 3,140 3,314 3,482 3,563
Other interest expenses 1,752 2,163 2,411 2,461 2,493
Grants expenses 11,173 11,745 11,087 10,529 10,925 Total Expenses 46,526 48,436 49,144 49,795 51,492
Note: 1. Numbers may not add due to rounding.
General Government expenses of $48.436 billion in 2013-14 represent an increase of $1.910 billion (or 4.1%) over the 2012-13 estimated actual. Factors influencing the growth in expenses include:
� an increase in natural disaster reparation works, in particular, an $819 million increase in grants to local governments for restoration works. Funding to local government authorities for pre-2013 disaster events has been re-profiled following ex-Tropical Cyclone Oswald
� growth in Queensland Health funding under the new Health and Hospital Services structure, including expenditure to maintain and enhance the Queensland public health rostering and payroll system, revitalisation of regional, rural and remote health services and for new measures such as Hospital in the Home and for backlog maintenance
� growth in education expenditure for state school enrolment growth and additional costs associated with preparations for the transition of Year 7 to be the first year of secondary school
� additional interest costs associated with new borrowings undertaken in 2013-14. As a continuation of the Government’s fiscal repair program announced in the 2012-13 Budget, departments are required to make further savings of $100 million per annum from 2013-14 onwards.
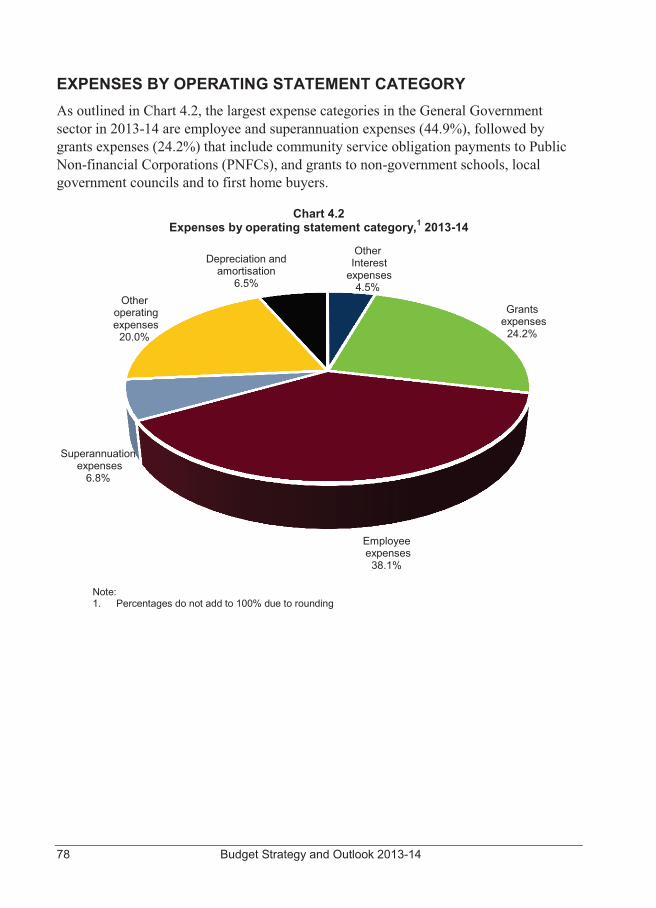
78 Budget Strategy and Outlook 2013-14
EXPENSES BY OPERATING STATEMENT CATEGORY As outlined in Chart 4.2, the largest expense categories in the General Government sector in 2013-14 are employee and superannuation expenses (44.9%), followed by grants expenses (24.2%) that include community service obligation payments to Public Non-financial Corporations (PNFCs), and grants to non-government schools, local government councils and to first home buyers.
Chart 4.2 Expenses by operating statement category,1 2013-14
Note: 1. Percentages do not add to 100% due to rounding
Other Interest
expenses 4.5%
Grants expenses
24.2%
Employee expenses
38.1%
Superannuation expenses
6.8%
Other operating expenses
20.0%
Depreciation and amortisation
6.5%
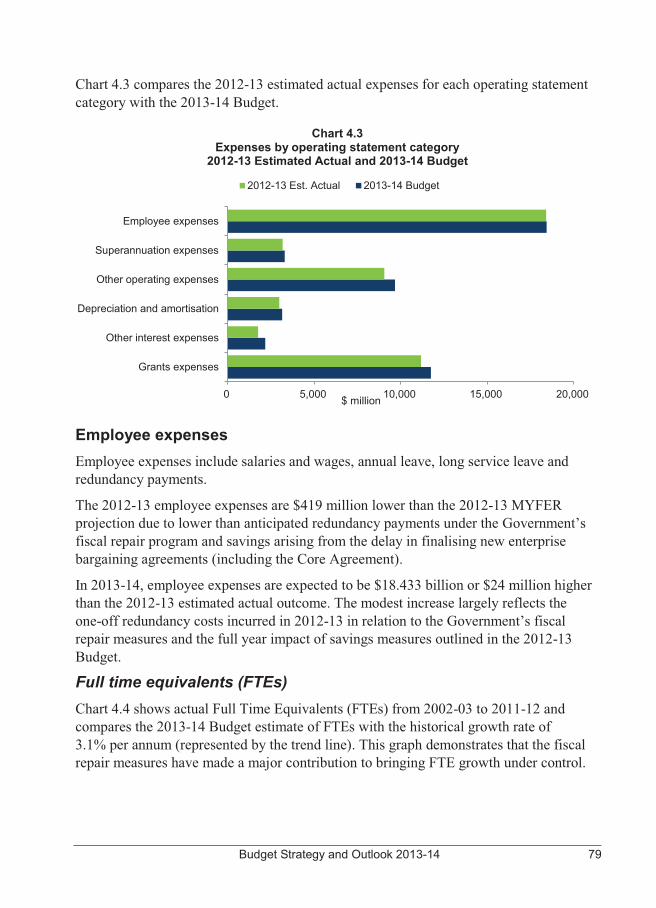
Budget Strategy and Outlook 2013-14 79
Chart 4.3 compares the 2012-13 estimated actual expenses for each operating statement category with the 2013-14 Budget.
Chart 4.3 Expenses by operating statement category
2012-13 Estimated Actual and 2013-14 Budget
Employee expenses Employee expenses include salaries and wages, annual leave, long service leave and redundancy payments.
The 2012-13 employee expenses are $419 million lower than the 2012-13 MYFER projection due to lower than anticipated redundancy payments under the Government’s fiscal repair program and savings arising from the delay in finalising new enterprise bargaining agreements (including the Core Agreement).
In 2013-14, employee expenses are expected to be $18.433 billion or $24 million higher than the 2012-13 estimated actual outcome. The modest increase largely reflects the one-off redundancy costs incurred in 2012-13 in relation to the Government’s fiscal repair measures and the full year impact of savings measures outlined in the 2012-13 Budget.
Full time equivalents (FTEs) Chart 4.4 shows actual Full Time Equivalents (FTEs) from 2002-03 to 2011-12 and compares the 2013-14 Budget estimate of FTEs with the historical growth rate of 3.1% per annum (represented by the trend line). This graph demonstrates that the fiscal repair measures have made a major contribution to bringing FTE growth under control.
0 5,000 10,000 15,000 20,000
Grants expenses
Other interest expenses
Depreciation and amortisation
Other operating expenses
Superannuation expenses
Employee expenses
$ million
2012-13 Est. Actual 2013-14 Budget
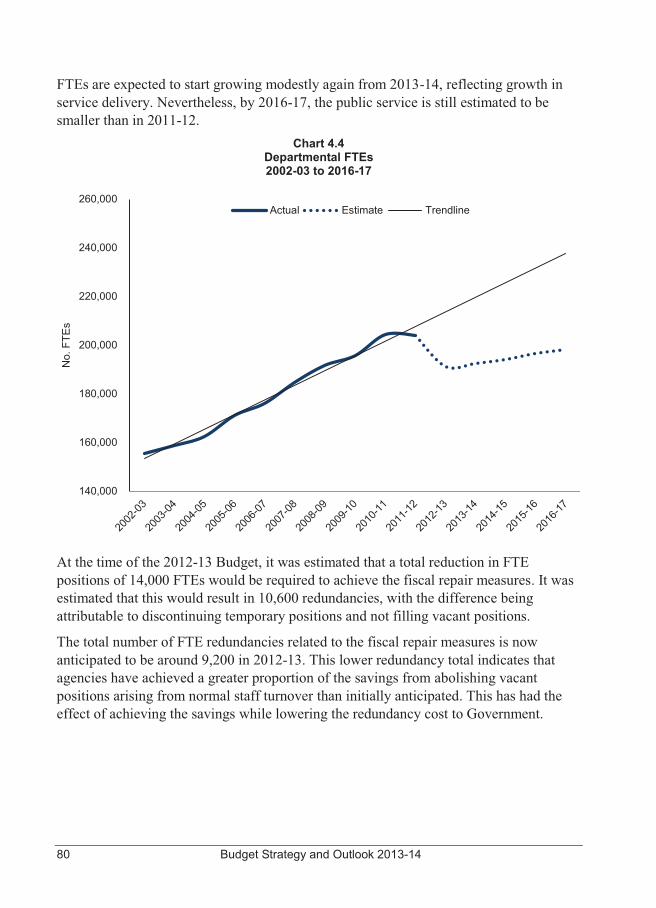
80 Budget Strategy and Outlook 2013-14
FTEs are expected to start growing modestly again from 2013-14, reflecting growth in service delivery. Nevertheless, by 2016-17, the public service is still estimated to be smaller than in 2011-12.
Chart 4.4 Departmental FTEs 2002-03 to 2016-17
At the time of the 2012-13 Budget, it was estimated that a total reduction in FTE positions of 14,000 FTEs would be required to achieve the fiscal repair measures. It was estimated that this would result in 10,600 redundancies, with the difference being attributable to discontinuing temporary positions and not filling vacant positions.
The total number of FTE redundancies related to the fiscal repair measures is now anticipated to be around 9,200 in 2012-13. This lower redundancy total indicates that agencies have achieved a greater proportion of the savings from abolishing vacant positions arising from normal staff turnover than initially anticipated. This has had the effect of achieving the savings while lowering the redundancy cost to Government.
140,000
160,000
180,000
200,000
220,000
240,000
260,000
No.
FTE
s
Actual Estimate Trendline
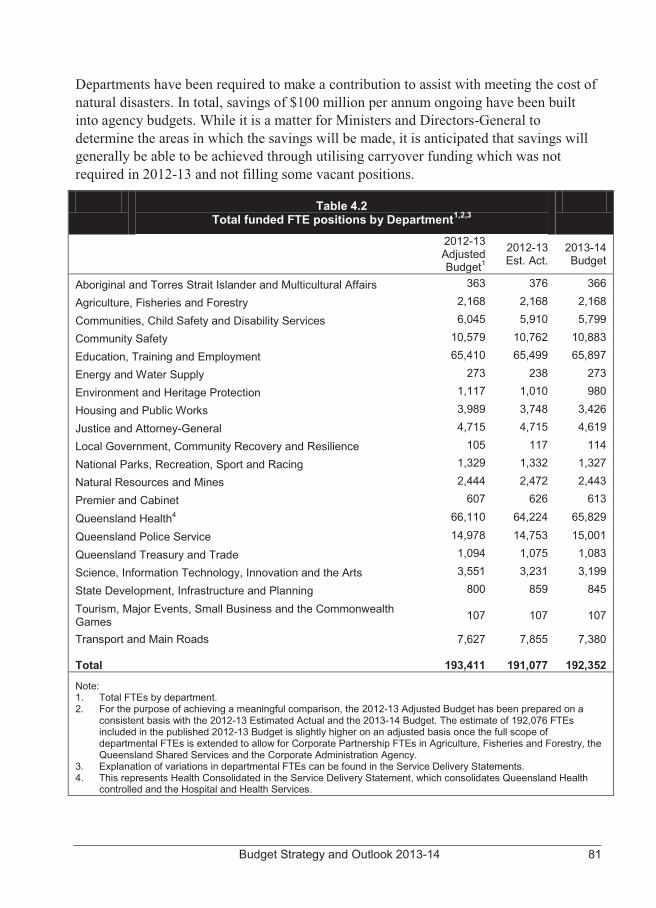
Budget Strategy and Outlook 2013-14 81
Departments have been required to make a contribution to assist with meeting the cost of natural disasters. In total, savings of $100 million per annum ongoing have been built into agency budgets. While it is a matter for Ministers and Directors-General to determine the areas in which the savings will be made, it is anticipated that savings will generally be able to be achieved through utilising carryover funding which was not required in 2012-13 and not filling some vacant positions.
Table 4.2 Total funded FTE positions by Department1,2,3
2012-13 Adjusted Budget1
2012-13 Est. Act.
2013-14 Budget
Aboriginal and Torres Strait Islander and Multicultural Affairs 363 376 366
Agriculture, Fisheries and Forestry 2,168 2,168 2,168
Communities, Child Safety and Disability Services 6,045 5,910 5,799
Community Safety 10,579 10,762 10,883
Education, Training and Employment 65,410 65,499 65,897
Energy and Water Supply 273 238 273
Environment and Heritage Protection 1,117 1,010 980
Housing and Public Works 3,989 3,748 3,426
Justice and Attorney-General 4,715 4,715 4,619
Local Government, Community Recovery and Resilience 105 117 114
National Parks, Recreation, Sport and Racing 1,329 1,332 1,327
Natural Resources and Mines 2,444 2,472 2,443
Premier and Cabinet 607 626 613
Queensland Health4 66,110 64,224 65,829
Queensland Police Service 14,978 14,753 15,001
Queensland Treasury and Trade 1,094 1,075 1,083
Science, Information Technology, Innovation and the Arts 3,551 3,231 3,199
State Development, Infrastructure and Planning 800 859 845
Tourism, Major Events, Small Business and the Commonwealth Games 107 107 107
Transport and Main Roads 7,627 7,855 7,380
Total 193,411 191,077 192,352
Note: 1. Total FTEs by department. 2. For the purpose of achieving a meaningful comparison, the 2012-13 Adjusted Budget has been prepared on a
consistent basis with the 2012-13 Estimated Actual and the 2013-14 Budget. The estimate of 192,076 FTEs included in the published 2012-13 Budget is slightly higher on an adjusted basis once the full scope of departmental FTEs is extended to allow for Corporate Partnership FTEs in Agriculture, Fisheries and Forestry, the Queensland Shared Services and the Corporate Administration Agency.
3. Explanation of variations in departmental FTEs can be found in the Service Delivery Statements. 4. This represents Health Consolidated in the Service Delivery Statement, which consolidates Queensland Health
controlled and the Hospital and Health Services.
82 Budget Strategy and Outlook 2013-14
Table 4.2 shows the total funded FTE positions by department and is consistent with agency Service Delivery Statements. Superannuation expenses The superannuation interest cost represents the imputed interest on the Government’s accruing defined benefit superannuation liabilities.
In determining the State’s defined benefit superannuation liabilities, AASB 119 Employee Benefits requires the discounting of future benefit obligations using yield rates on government bonds net of investment tax. In 2011-12 yields fell to historical lows resulting in a significant increase in the present value of superannuation liabilities. The fall in discount rates contributed to a lower superannuation interest cost in 2012-13.
In 2013-14, superannuation interest costs are projected to increase by $123 million over the estimated actual to $879 million. This increase is in part due to a revision of AASB 119, which applies from 1 July 2013, requiring interest costs be imputed on a net liability approach and applying the discount rate to both the gross liability and superannuation plan assets. Prior to 2013-14, interest calculated on plan assets were calculated using the expected rate of return of 7.0% per annum.
Other superannuation expenses represent employer superannuation contributions to accumulation superannuation and the current service cost of the State’s defined benefit obligation (or the increase in the present value of the defined benefit obligation resulting from employee service in the current period).
Other operating expenses
Other operating expenses comprise the non-labour costs of providing goods and services, repairs and maintenance, consultancies, contractors, electricity, communications and marketing.
In 2012-13, other operating expenses are $385 million lower than the 2012-13 MYFER estimate mainly due to deferrals in Commonwealth-funded education programs and change in the timing of NDRRA expenses.
In 2013-14 other operating expenses are estimated to increase by $616 million over the 2012-13 estimated actual to $9.669 billion. Factors contributing to the growth in other operating expenses include:
� an increase in Queensland Health funding under the new Health and Hospital Services structure including expenditure to maintain and enhance the Queensland public health rostering and payroll system, revitalisation of regional, rural and remote health services and backlog maintenance
� growth in school expenditure, including growth in Commonwealth-funded education programs.
Budget Strategy and Outlook 2013-14 83
Depreciation and amortisation Depreciation and amortisation expense is an estimate of the progressive consumption of the State’s assets through normal usage, wear and tear and obsolescence. Growth in this expense category primarily reflects asset revaluations and the size of the State’s capital program.
Other interest expenses Other interest expenses include interest paid on borrowings to acquire capital assets and infrastructure such as roads and government buildings.
In 2013-14, the General Government sector has total debt servicing costs forecast at $2.163 billion, representing 4.5% of total expenses. This is $184 million lower than forecast in the 2012-13 MYFER due to the improved fiscal balance in 2012-13 and lower interest rates.
Grants expenses
Current grants include grants and subsidies to the community (such as schools, hospitals, benevolent institutions and local governments) and personal benefit payments. Funding includes support for non-government healthcare providers and organisations servicing the community in partnership with government in the family support, disability, youth and childcare sectors. Community service obligations (CSOs) are provided where PNFCs are required to provide non-commercial services or services at non-commercial prices for the benefit of the community (for further details refer Chapter 7).
Table 4.3 provides a break down of grants by category and recipient type.
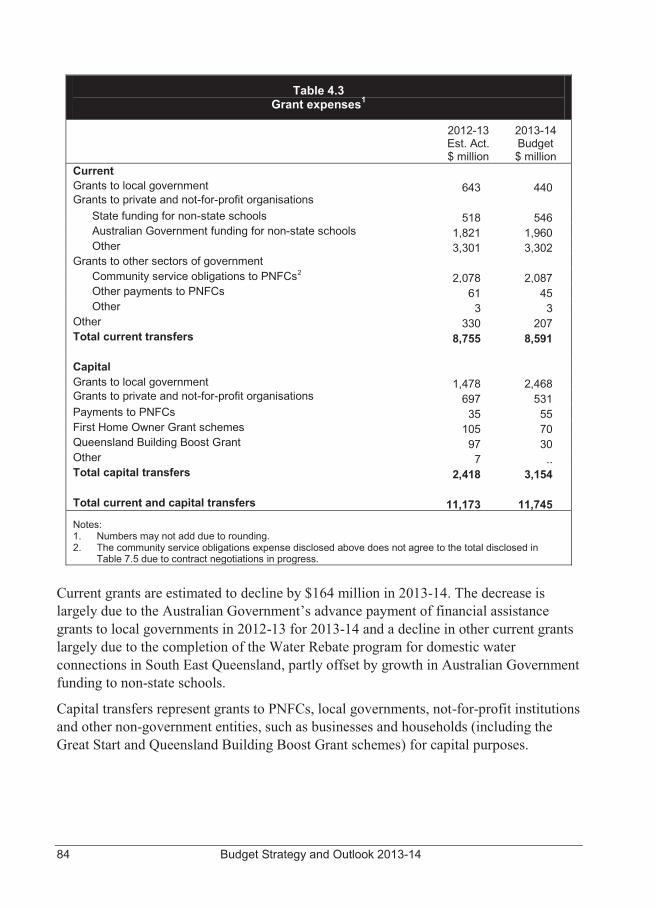
84 Budget Strategy and Outlook 2013-14
Table 4.3 Grant expenses1
2012-13 Est. Act. $ million
2013-14 Budget $ million
Current Grants to local government 643 440 Grants to private and not-for-profit organisations State funding for non-state schools 518 546 Australian Government funding for non-state schools 1,821 1,960 Other 3,301 3,302 Grants to other sectors of government Community service obligations to PNFCs2 2,078 2,087 Other payments to PNFCs 61 45 Other 3 3 Other 330 207 Total current transfers 8,755 8,591 Capital Grants to local government 1,478 2,468 Grants to private and not-for-profit organisations 697 531 Payments to PNFCs 35 55 First Home Owner Grant schemes 105 70 Queensland Building Boost Grant 97 30 Other 7 .. Total capital transfers 2,418 3,154 Total current and capital transfers 11,173 11,745 Notes: 1. Numbers may not add due to rounding. 2. The community service obligations expense disclosed above does not agree to the total disclosed in
Table 7.5 due to contract negotiations in progress. Current grants are estimated to decline by $164 million in 2013-14. The decrease is largely due to the Australian Government’s advance payment of financial assistance grants to local governments in 2012-13 for 2013-14 and a decline in other current grants largely due to the completion of the Water Rebate program for domestic water connections in South East Queensland, partly offset by growth in Australian Government funding to non-state schools.
Capital transfers represent grants to PNFCs, local governments, not-for-profit institutions and other non-government entities, such as businesses and households (including the Great Start and Queensland Building Boost Grant schemes) for capital purposes.
Budget Strategy and Outlook 2013-14 85
Capital grants are estimated to increase $736 million to $3.154 billion in 2013-14. This is largely due to natural disaster grants to local governments for the rebuilding of roads, bridges and transport infrastructure related to the pre-2013 disaster events and ex-Tropical Cyclone Oswald and associated disaster events in 2012-13.
The increased level of capital grant expenditure to local governments also includes funding under the Roads to Resources program and upgrading key rail crossings in Brisbane.
The decline in capital grants to private and not-for-profit organisations largely reflects the one-off grant in 2012-13 in relation to the Airportlink project.
First home owner grants include the First Home Owner Grants (FHOGs) and the Great Start Grants schemes. The FHOGs, which gave first home buyers of both new and existing properties a $7,000 grant, ceased on 11 October 2012. The Great Start Grant which commenced 11 September 2012, (previously known as the First Home Owner Construction grant) assists first home buyers with a one-off payment of $15,000 to purchase an eligible new house, unit or townhouse. Over the period October 2012 to 29 May 2013, 1,403 payments of the $15,000 Great Start Grant have been made. The decline in the Queensland Building Boost grant is due to the closure of the scheme, with the period to claim the building boost grant ending on 31 August 2012.
The recent Independent Commission of Audit Final Report included (Part C-4) an analysis of Grant Administration in the Queensland Government, identifying the scope of grant payments, grants definitions and conditions, and the effectiveness of grant programs and grant systems.
The section made three recommendations about grants in the context of Financial Administration of the State. These recommendations were:
� The Government publish a list of all grant programs on an annual basis (Recommendation 55)
� Grant programs across Government be rationalised and consolidated, with a view to:
o reducing the piecemeal and fragmented nature of current programs
o adopting a consistent definition and treatment of grants across Government, separate from subsidies, service level agreements and other forms of payment for services rendered
o ensuring the efficiency and effectiveness of grant programs in achieving stated objectives
o providing a more informed basis for future decisions on the nature, range and scope of grants proposed to be made, and the organisations receiving these grants
86 Budget Strategy and Outlook 2013-14
o achieving better value for money for the large expenditure made on grants (Recommendation 56)
� The administration of grant programs be managed by specialist grant administration systems based on best practice, to minimise the administrative and overhead costs involved. (Recommendation 57)
The Government’s response to these three recommendations was to accept each of them, noting that there would need to be a progressive approach to implementation and that the Social Services Cabinet Committee would play a key role in leading the implementation. The Government’s response also noted that this discussion of grants would be included in the 2013-14 Budget with progressively greater levels of detail provided in subsequent State Budgets.
There is a significant implementation task involved in achieving the outcome envisaged by the Independent Commission of Audit. As the Independent Commission noted, grant payments are a significant element of the State Budget, there are very broad definitions currently applied to grants across the sector and there is complexity in the number of grants programs, the number of recipients of grants, and the variability between departments in the cost of administering grant payments. In many cases, the structuring of grant payments will be a part of broader reform of departmental service delivery, and will occur in concert with service delivery improvements. Issues around the administration of grant payments also are part of broader approaches to delivering specialist services and the use of efficient ICT solutions across Government (also recommended by the Independent Commission of Audit), so there is a range of organisational impacts that emerge when considering grants administration across Government.
However, the Government remains committed to the outcomes recommended and is currently developing its detailed approach to implementing all the Independent Commission of Audit recommendations accepted, including those above in relation to grants administration. Outcomes from this implementation will be presented in future Budget papers.
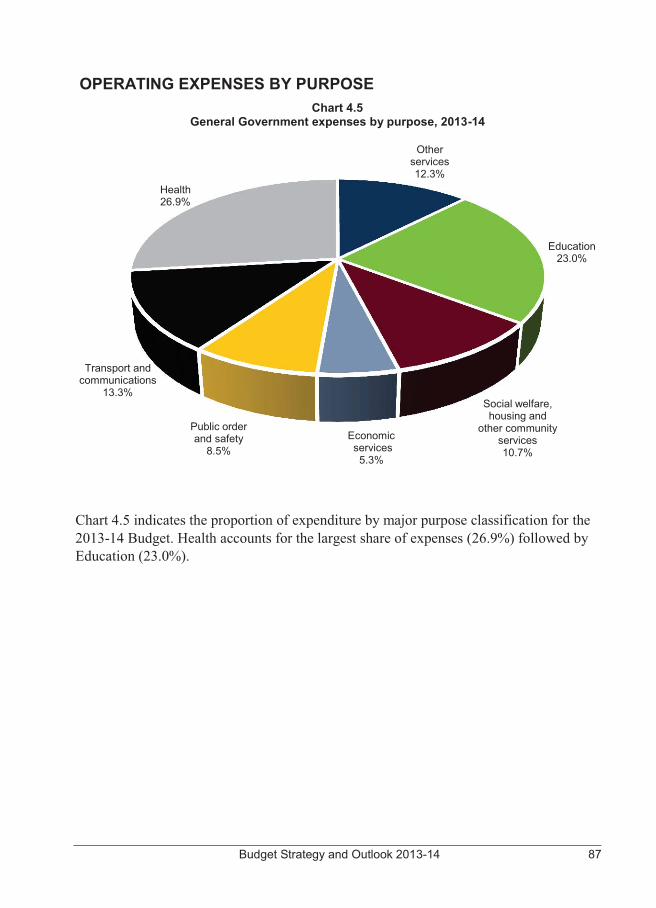
Budget Strategy and Outlook 2013-14 87
OPERATING EXPENSES BY PURPOSE Chart 4.5
General Government expenses by purpose, 2013-14
Chart 4.5 indicates the proportion of expenditure by major purpose classification for the 2013-14 Budget. Health accounts for the largest share of expenses (26.9%) followed by Education (23.0%).
Other services 12.3%
Education 23.0%
Social welfare, housing and
other community services 10.7%
Economic services
5.3%
Public order and safety
8.5%
Transport and communications
13.3%
Health 26.9%

88 Budget Strategy and Outlook 2013-14
DEPARTMENTAL EXPENSES Data presented in Tables 4.4 and 4.5 provide a summary drawn from financial statements contained in the Service Delivery Statements. Further information on the composition of expenses, outputs delivered and factors influencing the movement in expenses can also be obtained from the Service Delivery Statements.
Aboriginal and Torres Strait Islander and Multicultural Affairs 114,283 109,625 Agriculture, Fisheries and Forestry 440,601 403,064 Communities, Child Safety and Disability Services 2,526,498 2,580,163 Community Safety 1,826,487 1,925,095 Education,Training and Employment 8,172,749 8,672,444 Electoral Commission of Queensland 19,178 22,743 Energy and Water Supply 79,014 105,948 Environment and Heritage Protection 205,841 171,103 Housing and Public Works 1,809,075 1,610,864 Justice and Attorney-General 720,417 698,948 Legislative Assembly 82,831 82,152 Local Government, Community Recovery and Resilience 174,178 218,110 National Parks, Recreation, Sport and Racing 348,838 365,981 Natural Resources and Mines 555,517 479,518 Office of the Governor 5,780 5,925 Office of the Ombudsman 7,480 7,914 Premier and Cabinet 110,172 95,506 Public Service Commission 23,863 28,035 Queensland Audit Office 42,357 41,919 Health Consolidated3 11,793,745 12,326,421 Queensland Police Service 1,957,482 2,000,725 Queensland Treasury and Trade 219,057 228,751 Science, Information Technology, Innovation and the Arts 421,739 361,933 State Development, Infrastructure and Planning 240,068 324,527 The Public Trustee of Queensland 77,505 79,653 Tourism, Major Events, Small Business and the Commonwealth Games 51,042 99,992 Transport and Main Roads 4,996,629 5,457,566 Total Expenses 37,022,426 38,504,625
Notes:1.
2.3. This represents Health Consolidated in the Service Delivery Statement, which consolidates Queensland Health
controlled and the Hospital and Health Services.
$'000
Table 4.4Departmental Controlled Expense 1,2
Explanation of variations in departmental controlled expenses can be found in the Service Delivery Statements.
Total expenses by department does not equate to total General Government expenses in Uniform PresentationFramework (UPF) terms reported elsewhere in the Budget Papers as General Government expenses include awider range of entities including State Government statutory authorities. In addition transactions eliminatedbetween entities within the General Government sector (for example payroll tax payments) are excluded in thepreparation of whole-of-Government UPF financial statements.
2012-13Est. Actual
$'000
2013-14Estimate
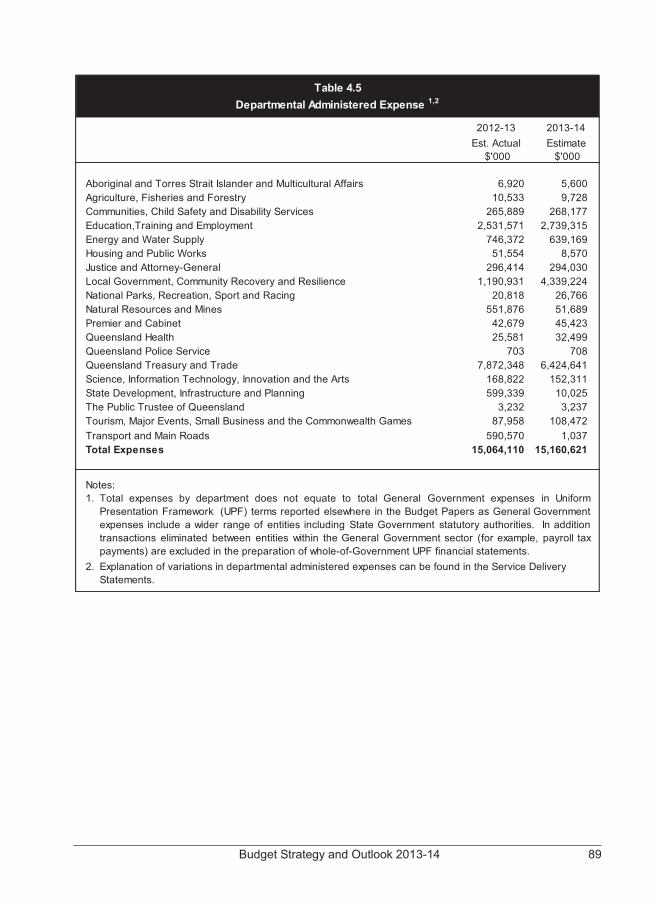
Budget Strategy and Outlook 2013-14 89
Aboriginal and Torres Strait Islander and Multicultural Affairs 6,920 5,600 Agriculture, Fisheries and Forestry 10,533 9,728 Communities, Child Safety and Disability Services 265,889 268,177 Education,Training and Employment 2,531,571 2,739,315 Energy and Water Supply 746,372 639,169 Housing and Public Works 51,554 8,570 Justice and Attorney-General 296,414 294,030 Local Government, Community Recovery and Resilience 1,190,931 4,339,224 National Parks, Recreation, Sport and Racing 20,818 26,766 Natural Resources and Mines 551,876 51,689 Premier and Cabinet 42,679 45,423 Queensland Health 25,581 32,499 Queensland Police Service 703 708 Queensland Treasury and Trade 7,872,348 6,424,641 Science, Information Technology, Innovation and the Arts 168,822 152,311 State Development, Infrastructure and Planning 599,339 10,025 The Public Trustee of Queensland 3,232 3,237 Tourism, Major Events, Small Business and the Commonwealth Games 87,958 108,472 Transport and Main Roads 590,570 1,037 Total Expenses 15,064,110 15,160,621
Notes:1.
2.
Table 4.5Departmental Administered Expense 1,2
Explanation of variations in departmental administered expenses can be found in the Service Delivery Statements.
Total expenses by department does not equate to total General Government expenses in UniformPresentation Framework (UPF) terms reported elsewhere in the Budget Papers as General Governmentexpenses include a wider range of entities including State Government statutory authorities. In additiontransactions eliminated between entities within the General Government sector (for example, payroll taxpayments) are excluded in the preparation of whole-of-Government UPF financial statements.
2012-13 2013-14Est. Actual
$'000Estimate $'000
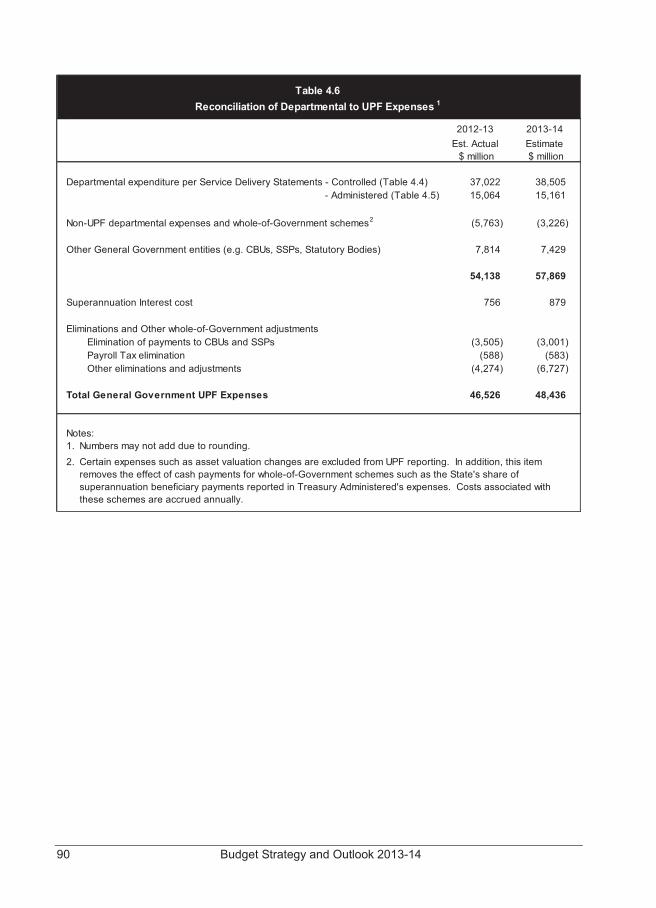
90 Budget Strategy and Outlook 2013-14
Departmental expenditure per Service Delivery Statements - Controlled (Table 4.4) 37,022 38,505 - Administered (Table 4.5) 15,064 15,161
Non-UPF departmental expenses and whole-of-Government schemes2 (5,763) (3,226)
Other General Government entities (e.g. CBUs, SSPs, Statutory Bodies) 7,814 7,429
54,138 57,869
Superannuation Interest cost 756 879
Eliminations and Other whole-of-Government adjustmentsElimination of payments to CBUs and SSPs (3,505) (3,001)Payroll Tax elimination (588) (583)Other eliminations and adjustments (4,274) (6,727)
Total General Government UPF Expenses 46,526 48,436
Notes:1. Numbers may not add due to rounding.2.
Reconciliation of Departmental to UPF Expenses 1Table 4.6
Certain expenses such as asset valuation changes are excluded from UPF reporting. In addition, this item removes the effect of cash payments for whole-of-Government schemes such as the State's share of superannuation beneficiary payments reported in Treasury Administered's expenses. Costs associated with these schemes are accrued annually.
$ millionEst. Actual2012-13 2013-14
Estimate $ million
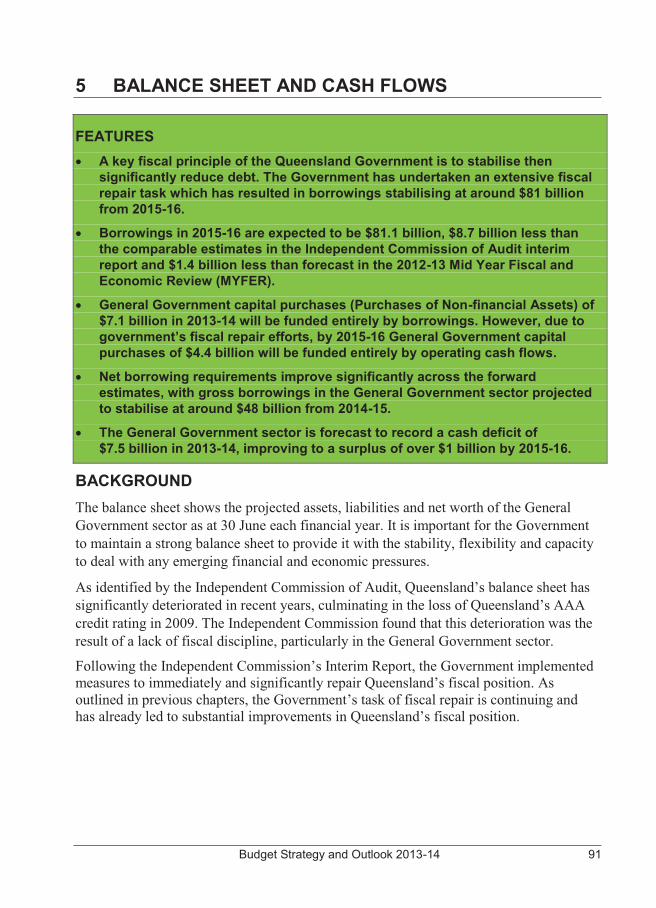
Budget Strategy and Outlook 2013-14 91
5 BALANCE SHEET AND CASH FLOWS
FEATURES � A key fiscal principle of the Queensland Government is to stabilise then
significantly reduce debt. The Government has undertaken an extensive fiscal repair task which has resulted in borrowings stabilising at around $81 billion from 2015-16.
� Borrowings in 2015-16 are expected to be $81.1 billion, $8.7 billion less than the comparable estimates in the Independent Commission of Audit interim report and $1.4 billion less than forecast in the 2012-13 Mid Year Fiscal and Economic Review (MYFER).
� General Government capital purchases (Purchases of Non-financial Assets) of $7.1 billion in 2013-14 will be funded entirely by borrowings. However, due to government’s fiscal repair efforts, by 2015-16 General Government capital purchases of $4.4 billion will be funded entirely by operating cash flows.
� Net borrowing requirements improve significantly across the forward estimates, with gross borrowings in the General Government sector projected to stabilise at around $48 billion from 2014-15.
� The General Government sector is forecast to record a cash deficit of $7.5 billion in 2013-14, improving to a surplus of over $1 billion by 2015-16.
BACKGROUND The balance sheet shows the projected assets, liabilities and net worth of the General Government sector as at 30 June each financial year. It is important for the Government to maintain a strong balance sheet to provide it with the stability, flexibility and capacity to deal with any emerging financial and economic pressures.
As identified by the Independent Commission of Audit, Queensland’s balance sheet has significantly deteriorated in recent years, culminating in the loss of Queensland’s AAA credit rating in 2009. The Independent Commission found that this deterioration was the result of a lack of fiscal discipline, particularly in the General Government sector.
Following the Independent Commission’s Interim Report, the Government implemented measures to immediately and significantly repair Queensland’s fiscal position. As outlined in previous chapters, the Government’s task of fiscal repair is continuing and has already led to substantial improvements in Queensland’s fiscal position.
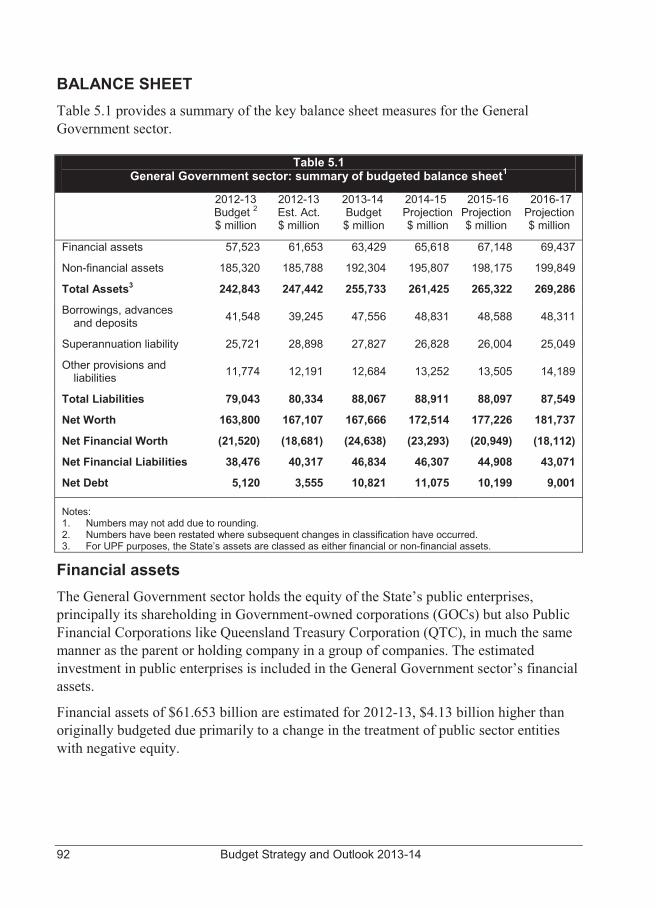
92 Budget Strategy and Outlook 2013-14
BALANCE SHEET Table 5.1 provides a summary of the key balance sheet measures for the General Government sector.
Table 5.1 General Government sector: summary of budgeted balance sheet1
2012-13 Budget 2 $ million
2012-13 Est. Act. $ million
2013-14 Budget $ million
2014-15 Projection $ million
2015-16 Projection $ million
2016-17 Projection $ million
Financial assets 57,523 61,653 63,429 65,618 67,148 69,437
Non-financial assets 185,320 185,788 192,304 195,807 198,175 199,849
Total Assets3 242,843 247,442 255,733 261,425 265,322 269,286
Borrowings, advances and deposits 41,548 39,245 47,556 48,831 48,588 48,311
Superannuation liability 25,721 28,898 27,827 26,828 26,004 25,049
Other provisions and liabilities 11,774 12,191 12,684 13,252 13,505 14,189
Total Liabilities 79,043 80,334 88,067 88,911 88,097 87,549
Net Worth 163,800 167,107 167,666 172,514 177,226 181,737
Net Financial Worth (21,520) (18,681) (24,638) (23,293) (20,949) (18,112)
Net Financial Liabilities 38,476 40,317 46,834 46,307 44,908 43,071
Net Debt 5,120 3,555 10,821 11,075 10,199 9,001
Notes: 1. Numbers may not add due to rounding. 2. Numbers have been restated where subsequent changes in classification have occurred. 3. For UPF purposes, the State’s assets are classed as either financial or non-financial assets.
Financial assets The General Government sector holds the equity of the State’s public enterprises, principally its shareholding in Government-owned corporations (GOCs) but also Public Financial Corporations like Queensland Treasury Corporation (QTC), in much the same manner as the parent or holding company in a group of companies. The estimated investment in public enterprises is included in the General Government sector’s financial assets.
Financial assets of $61.653 billion are estimated for 2012-13, $4.13 billion higher than originally budgeted due primarily to a change in the treatment of public sector entities with negative equity.
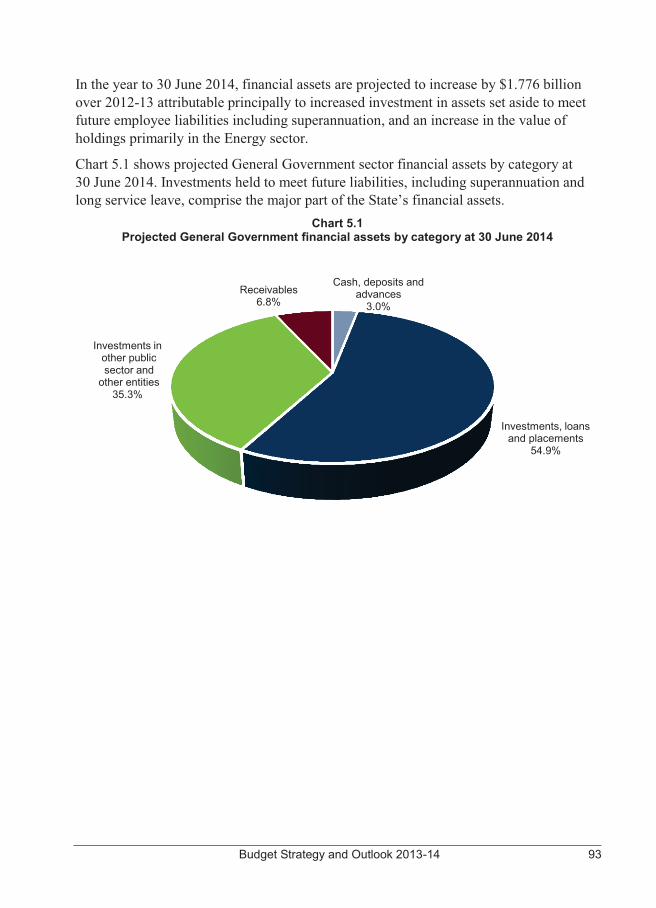
Budget Strategy and Outlook 2013-14 93
In the year to 30 June 2014, financial assets are projected to increase by $1.776 billion over 2012-13 attributable principally to increased investment in assets set aside to meet future employee liabilities including superannuation, and an increase in the value of holdings primarily in the Energy sector.
Chart 5.1 shows projected General Government sector financial assets by category at 30 June 2014. Investments held to meet future liabilities, including superannuation and long service leave, comprise the major part of the State’s financial assets.
Chart 5.1 Projected General Government financial assets by category at 30 June 2014
Cash, deposits and advances
3.0%
Investments, loans and placements
54.9%
Investments in other public sector and
other entities 35.3%
Receivables 6.8%
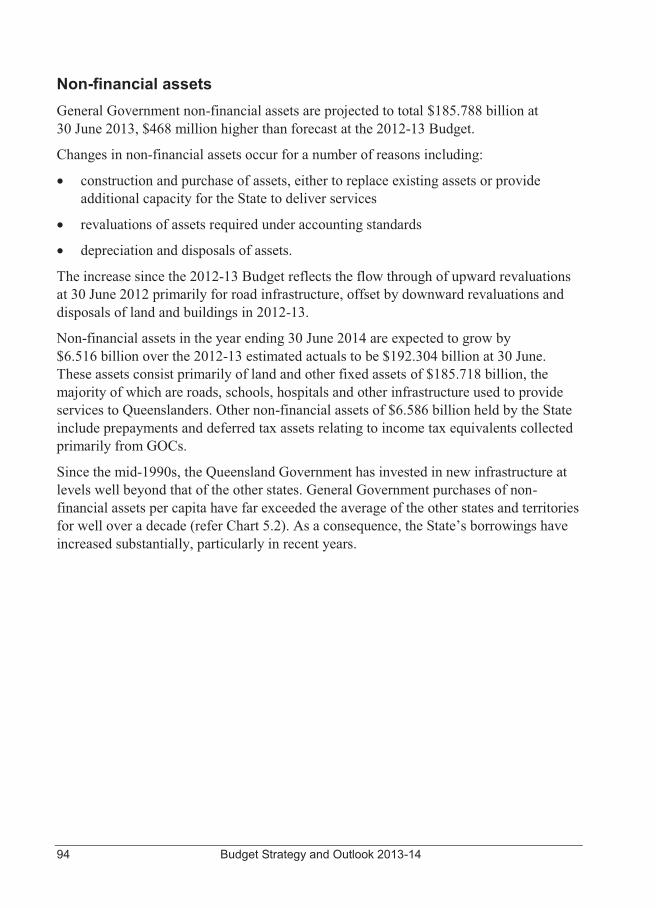
94 Budget Strategy and Outlook 2013-14
Non-financial assets General Government non-financial assets are projected to total $185.788 billion at 30 June 2013, $468 million higher than forecast at the 2012-13 Budget.
Changes in non-financial assets occur for a number of reasons including:
� construction and purchase of assets, either to replace existing assets or provide additional capacity for the State to deliver services
� revaluations of assets required under accounting standards
� depreciation and disposals of assets.
The increase since the 2012-13 Budget reflects the flow through of upward revaluations at 30 June 2012 primarily for road infrastructure, offset by downward revaluations and disposals of land and buildings in 2012-13.
Non-financial assets in the year ending 30 June 2014 are expected to grow by $6.516 billion over the 2012-13 estimated actuals to be $192.304 billion at 30 June. These assets consist primarily of land and other fixed assets of $185.718 billion, the majority of which are roads, schools, hospitals and other infrastructure used to provide services to Queenslanders. Other non-financial assets of $6.586 billion held by the State include prepayments and deferred tax assets relating to income tax equivalents collected primarily from GOCs.
Since the mid-1990s, the Queensland Government has invested in new infrastructure at levels well beyond that of the other states. General Government purchases of non-financial assets per capita have far exceeded the average of the other states and territories for well over a decade (refer Chart 5.2). As a consequence, the State’s borrowings have increased substantially, particularly in recent years.
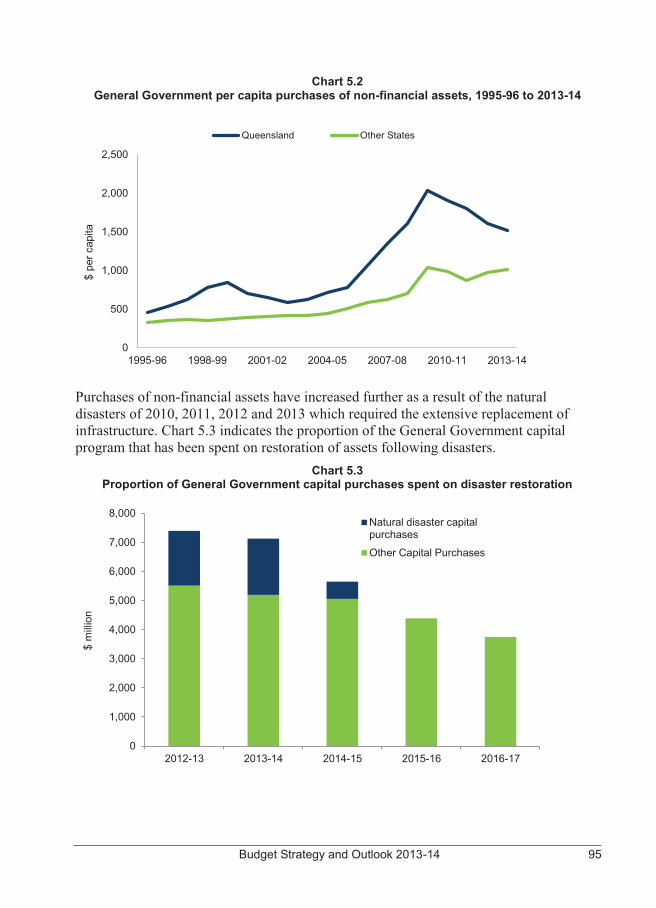
Budget Strategy and Outlook 2013-14 95
Chart 5.2 General Government per capita purchases of non-financial assets, 1995-96 to 2013-14
Purchases of non-financial assets have increased further as a result of the natural disasters of 2010, 2011, 2012 and 2013 which required the extensive replacement of infrastructure. Chart 5.3 indicates the proportion of the General Government capital program that has been spent on restoration of assets following disasters.
Chart 5.3 Proportion of General Government capital purchases spent on disaster restoration
0
500
1,000
1,500
2,000
2,500
1995-96 1998-99 2001-02 2004-05 2007-08 2010-11 2013-14
$ pe
r cap
ita
Queensland Other States
0
1,000
2,000
3,000
4,000
5,000
6,000
7,000
8,000
2012-13 2013-14 2014-15 2015-16 2016-17
$ m
illio
n
Natural disaster capitalpurchases
Other Capital Purchases
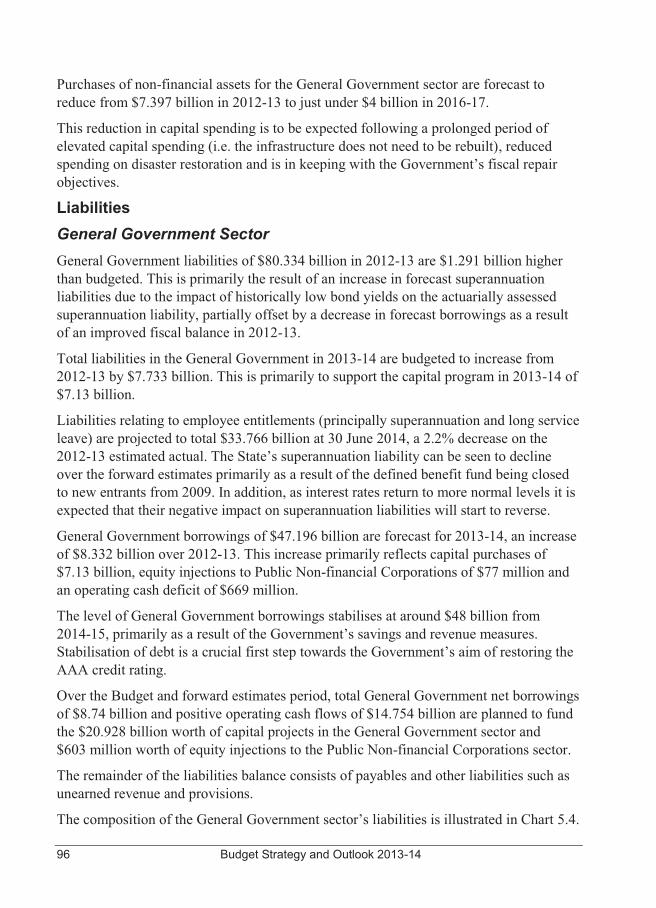
96 Budget Strategy and Outlook 2013-14
Purchases of non-financial assets for the General Government sector are forecast to reduce from $7.397 billion in 2012-13 to just under $4 billion in 2016-17.
This reduction in capital spending is to be expected following a prolonged period of elevated capital spending (i.e. the infrastructure does not need to be rebuilt), reduced spending on disaster restoration and is in keeping with the Government’s fiscal repair objectives.
Liabilities General Government Sector General Government liabilities of $80.334 billion in 2012-13 are $1.291 billion higher than budgeted. This is primarily the result of an increase in forecast superannuation liabilities due to the impact of historically low bond yields on the actuarially assessed superannuation liability, partially offset by a decrease in forecast borrowings as a result of an improved fiscal balance in 2012-13.
Total liabilities in the General Government in 2013-14 are budgeted to increase from 2012-13 by $7.733 billion. This is primarily to support the capital program in 2013-14 of $7.13 billion.
Liabilities relating to employee entitlements (principally superannuation and long service leave) are projected to total $33.766 billion at 30 June 2014, a 2.2% decrease on the 2012-13 estimated actual. The State’s superannuation liability can be seen to decline over the forward estimates primarily as a result of the defined benefit fund being closed to new entrants from 2009. In addition, as interest rates return to more normal levels it is expected that their negative impact on superannuation liabilities will start to reverse.
General Government borrowings of $47.196 billion are forecast for 2013-14, an increase of $8.332 billion over 2012-13. This increase primarily reflects capital purchases of $7.13 billion, equity injections to Public Non-financial Corporations of $77 million and an operating cash deficit of $669 million.
The level of General Government borrowings stabilises at around $48 billion from 2014-15, primarily as a result of the Government’s savings and revenue measures. Stabilisation of debt is a crucial first step towards the Government’s aim of restoring the AAA credit rating.
Over the Budget and forward estimates period, total General Government net borrowings of $8.74 billion and positive operating cash flows of $14.754 billion are planned to fund the $20.928 billion worth of capital projects in the General Government sector and $603 million worth of equity injections to the Public Non-financial Corporations sector.
The remainder of the liabilities balance consists of payables and other liabilities such as unearned revenue and provisions.
The composition of the General Government sector’s liabilities is illustrated in Chart 5.4.
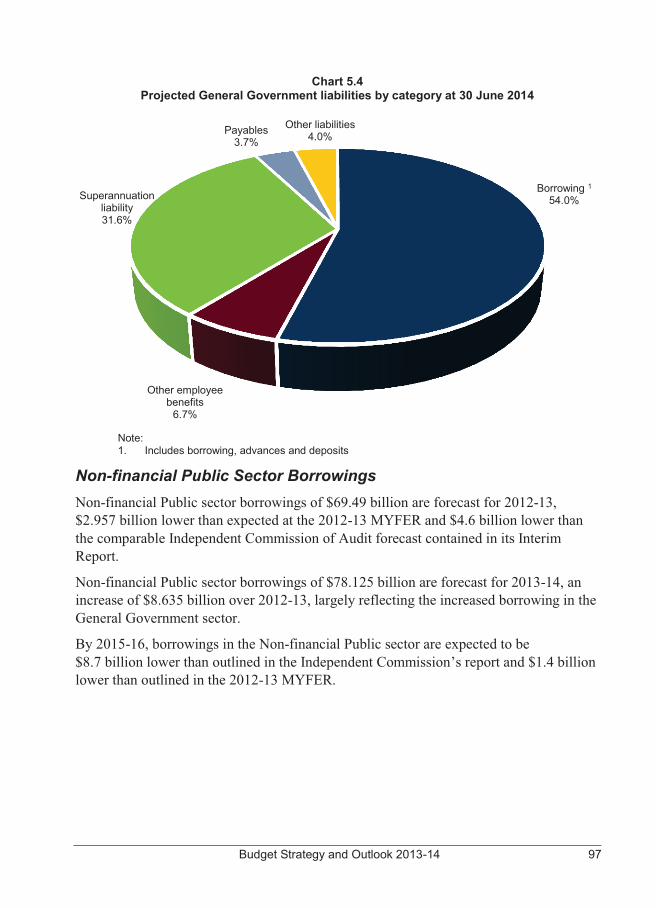
Budget Strategy and Outlook 2013-14 97
Chart 5.4 Projected General Government liabilities by category at 30 June 2014
Non-financial Public Sector Borrowings Non-financial Public sector borrowings of $69.49 billion are forecast for 2012-13, $2.957 billion lower than expected at the 2012-13 MYFER and $4.6 billion lower than the comparable Independent Commission of Audit forecast contained in its Interim Report.
Non-financial Public sector borrowings of $78.125 billion are forecast for 2013-14, an increase of $8.635 billion over 2012-13, largely reflecting the increased borrowing in the General Government sector.
By 2015-16, borrowings in the Non-financial Public sector are expected to be $8.7 billion lower than outlined in the Independent Commission’s report and $1.4 billion lower than outlined in the 2012-13 MYFER.
Borrowing 1 54.0%
Other employee benefits
6.7%
Superannuation liability 31.6%
Payables 3.7%
Other liabilities 4.0%
Note: 1. Includes borrowing, advances and deposits
98 Budget Strategy and Outlook 2013-14
As shown in Chart 1.2 (in Chapter 1), Non-financial Public sector borrowing is lower in each year of the forward estimates compared to the 2012-13 MYFER. This is primarily driven by lower borrowings in the Public Non-financial Corporations sector largely as a result of reforms to the water entities. In particular, Seqwater (resulting from the merger of several entities) has substantially improved its operating position across the forward estimates resulting in significantly lower borrowings.
As can also be seen in Chart 1.2, borrowings stabilise at around $81 billion from 2015-16, an important first step in regaining a AAA credit rating.
A number of small sales in 2012-13 have also assisted in reducing debt.
Following the initial public offering of QR National (now known as Aurizon) in November 2010, the State retained approximately 34% of the issued shares in the company. The share value at the initial public offering was $2.55.
By the end of November 2012, the Queensland Government sold over 430 million shares in Aurizon at a price of $3.47 through a selective buyback and cornerstone placement raising $1.5 billion. A further sale of 200 million shares at $4.03 in March 2013 brought total proceeds on sale to $2.3 billion. These proceeds have allowed the Government to repay the full amount of debt associated with the shares ($2.3 billion). Further, the sale prices achieved through both tranches have exceeded the assumptions used in the 2012-13 Budget and MYFER of $3.40 a share (based on the closing market price at 30 June 2012).
Proceeds from the sale of the remaining 189.2 million shares will depend upon the share price received, with the proceeds used to further reduce debt.
On 30 April 2013, sale proceeds of $527 million were received from the sale and leaseback of seven office buildings in the Brisbane CBD. These proceeds have also been used to pay down whole-of-Government debt.
The Government considers the Non-financial Public sector debt to revenue ratio to be an important indicator, consistent with its fiscal principle of stabilising debt (refer Chart 1.4 in Chapter 1). Consistent with the practice of ratings agencies, less emphasis is now placed on the net financial liabilities to revenue ratio, which incorporates the volatile superannuation liability.
Budget Strategy and Outlook 2013-14 99
Net financial worth The net financial worth measure is an indicator of financial strength. Net financial worth is defined as financial assets less all existing and accruing liabilities. Financial assets include cash and deposits, advances, financial investments, loans, receivables and equity in public enterprises.
The net financial worth measure is broader than the alternative measure – net debt – which measures only cash, advances and investments on the assets side and borrowings and advances on the liabilities side.
The net financial worth of the General Government sector for 2013-14 is forecast at negative $24.638 billion. The decrease in net financial worth from 2012-13 to 2013-14 ($5.957 billion) is primarily the result of the increase in borrowings partially offset by increases in investments, loans and placements and equity in public enterprises.
Net financial worth is expected to stabilise and improve over the forward estimates period as borrowings stabilise as a consequence of the Government’s fiscal repair efforts and as financial assets continue to grow.
Net financial liabilities Net financial liabilities are total liabilities less financial assets, other than equity investments in other public sector entities. This measure is broader than net debt as it includes significant liabilities, other than borrowings (for example, accrued employee liabilities such as superannuation and long service leave entitlements).
The net financial liabilities of the General Government sector for 2013-14 are forecast at $46.834 billion, $6.517 billion higher than 2012-13 which largely reflects additional borrowings in support of the capital program.
Net financial liabilities decrease after 2013-14 as borrowings stabilise and financial assets continue to grow.
Net worth The net worth, or equity, of the State is the amount by which the State’s assets exceed its liabilities. This is the value of the investment held on behalf of the people of Queensland by public sector instrumentalities.
Changes in the State’s net worth occur for a number of reasons including:
� operating surpluses (deficits) that increase (decrease) the Government’s equity
� revaluation of assets and liabilities as required by accounting standards. For example, the Government’s accruing liabilities for employee superannuation and long service leave are determined by actuarial assessments
100 Budget Strategy and Outlook 2013-14
� movements in the net worth of the State’s investments in the Public Non-financial Corporations and Public Financial Corporations sectors
� gains or losses on disposal of assets. Government agencies routinely buy and sell assets. Where the selling price of an asset is greater (less) than its value in an agency’s accounts, the resultant profit (loss) affects net worth.
The net worth of the General Government sector in 2012-13 is forecast to be $167.107 billion. This is $3.307 billion more than forecast in the 2012-13 Budget primarily due to a change in treatment of investments in public sector entities with negative equity.
From 2013-14, net worth is projected to steadily increase mainly as a result of the improved fiscal balance position and growth in assets.
Net debt Net debt is the sum of advances received and borrowings less cash and deposits, advances paid and investments, loans and placements.
Queensland maintains a strong net debt position due, in part, to the way it has structured its financial investments held to cover long term liabilities i.e. because the net debt measure includes assets held to cover long term liabilities. These financial investments are quarantined to cover primarily the superannuation obligations of Government.
Net debt for the General Government sector in 2012-13 is forecast to be $3.555 billion, $1.565 billion less than forecast in the 2012-13 Budget. Net debt will increase to $10.821 billion in 2013-14 as a result of increased borrowings in that year and is then projected to stabilise and then steadily decrease to a projected $9.001 billion in 2016-17.
CASH FLOWS The cash flow statement provides information on the Government’s estimated cash flows from its operating, financing and investing activities.
The cash flow statement records estimated cash payments and cash receipts and hence differs from accrued revenue and expenditure recorded in the operating statement. In particular, the operating statement records certain revenues and expenses that do not have an associated cash flow (for example, depreciation expense). The timing of recognition of accrued revenues or expenses in the operating statement may differ from the actual cash disbursement or receipt (for example, tax equivalents). A reconciliation between the cash flows from operations and the operating statement is provided in Table 5.2.
The cash flow statement also records cash flows associated with investing and financing activities that are otherwise reflected in the balance sheet. For example, purchases of capital equipment are recorded in the cash flow statement and impact on the balance sheet through an increase in physical assets.
Budget Strategy and Outlook 2013-14 101
The cash flow statement provides the cash surplus (deficit) measure which is comprised of the net cash flow from operating activities plus the net cash flow from investment in non-financial assets (or physical capital).
The Australian Bureau of Statistics Government Finance Statistics (GFS) surplus (deficit) is derived by including the initial increase in liability at the inception of finance leases in the cash surplus (deficit). This measure is also used to derive the Loan Council Allocation nomination, provided in Chapter 8.
The General Government cash deficit of $9.843 billion in 2012-13 is $833 million lower than that forecast at the time of the 2012-13 Budget and $1.471 billion lower than the 2012-13 MYFER. This is largely due to the improved operating position and the sale and leaseback of seven government buildings to QIC Limited.
A cash deficit of $7.469 billion is forecast in 2013-14 for the General Government sector, with the cash deficit forecast to decline significantly over the forward estimates, returning to a surplus in 2015-16.
The major factors contributing to the improved forecast cash position are improved net inflows from operating activities as a result of Government’s efforts in relation to the fiscal repair task and savings in the capital program partially as a result of the reduced Natural Disaster Relief and Recovery Arrangements requirement from 2015-16 as well as tighter expenditure management by Government.
Total General Government capital purchases of $7.13 billion are budgeted for 2013-14 and, over the period 2013-14 to 2016-17, capital expenditure is expected to total $20.928 billion in the General Government sector.
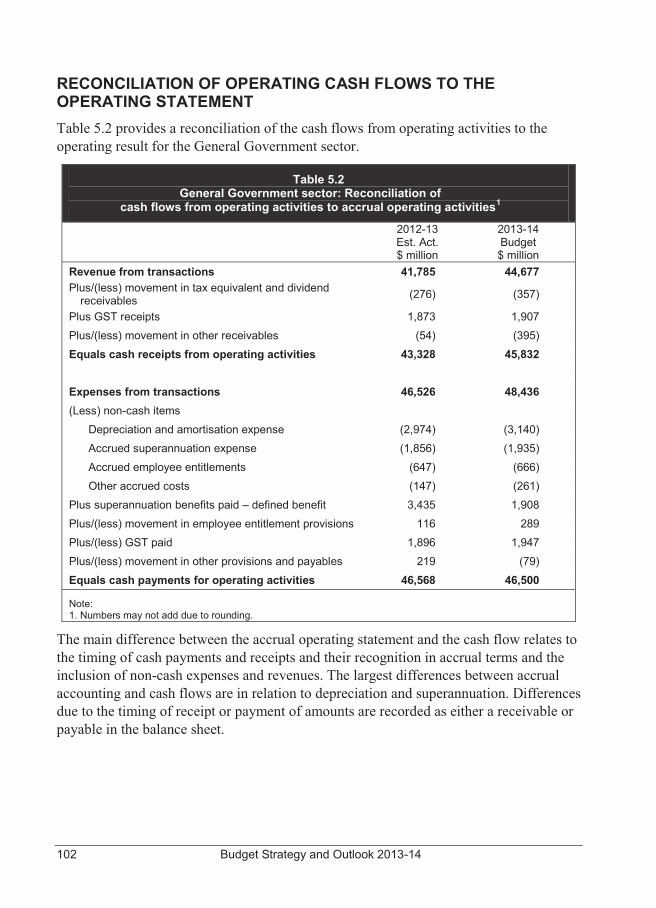
102 Budget Strategy and Outlook 2013-14
RECONCILIATION OF OPERATING CASH FLOWS TO THE OPERATING STATEMENT Table 5.2 provides a reconciliation of the cash flows from operating activities to the operating result for the General Government sector.
Table 5.2 General Government sector: Reconciliation of
cash flows from operating activities to accrual operating activities1
2012-13 Est. Act. $ million
2013-14 Budget $ million
Revenue from transactions 41,785 44,677 Plus/(less) movement in tax equivalent and dividend receivables (276) (357)
Plus GST receipts 1,873 1,907 Plus/(less) movement in other receivables (54) (395) Equals cash receipts from operating activities 43,328 45,832 Expenses from transactions 46,526 48,436 (Less) non-cash items
Depreciation and amortisation expense (2,974) (3,140) Accrued superannuation expense (1,856) (1,935)
Accrued employee entitlements (647) (666) Other accrued costs (147) (261)
Plus superannuation benefits paid – defined benefit 3,435 1,908 Plus/(less) movement in employee entitlement provisions 116 289 Plus/(less) GST paid 1,896 1,947 Plus/(less) movement in other provisions and payables 219 (79) Equals cash payments for operating activities 46,568 46,500
Note: 1. Numbers may not add due to rounding.
The main difference between the accrual operating statement and the cash flow relates to the timing of cash payments and receipts and their recognition in accrual terms and the inclusion of non-cash expenses and revenues. The largest differences between accrual accounting and cash flows are in relation to depreciation and superannuation. Differences due to the timing of receipt or payment of amounts are recorded as either a receivable or payable in the balance sheet.
Budget Strategy and Outlook 2013-14 103
6 INTER-GOVERNMENTAL FINANCIAL RELATIONS
FEATURES � The Australian Government Budget, released on 14 May 2013, made a number
of assumptions in relation to funding agreements for education and infrastructure that are still under consideration by the Queensland Government.
� Total GST revenue to all states is expected to be $50.250 billion in 2013-14, an increase of $2.55 billion or 5.3%. Since the 2012-13 Commonwealth Budget, the estimate of total GST revenue for 2013-14 has been revised down by $650 million. The growth of the GST pool has slowed substantially since 2007-08, reinforcing the need to protect the GST base.
� Estimated Australian Government funding in 2013-14 for Queensland included in the 2013-14 Queensland Budget is $19.530 billion. Queensland is estimated to receive $8.473 billion in payments for specific purposes, with $3.647 billion as National Specific Purpose Payments, $2.831 billion as National Health Reform funding and $1.995 billion as National Partnership Payments.
� The National Partnership (NP) model envisaged in the Intergovernmental Agreement on Federal Financial Relations poses policy and financial risks for Queensland. The uncertainty of ongoing Australian Government funding for expiring NPs which have raised service delivery levels poses a significant risk of cost shifting to Queensland. NPs that include input controls such as matched funding deliberately confuse roles and responsibilities by giving the Australian Government greater control over state funding and policy directions.
� Queensland is estimated to receive $10.741 billion of GST revenue in 2013-14, $608 million more than its population share. This is $453 million less than estimated in the 2012-13 Commonwealth Budget.
� The Australian Government’s GST Distribution Review final report, released in November 2012, proposed changes to the current horizontal fiscal equalisation arrangements, and the consideration by the Commonwealth Grants Commission (CGC) of issues in a future methodology review. Queensland welcomes many elements of the long term vision for federal financial relations articulated in the report.
� Federal and State Treasurers have agreed that the CGC would commence a methodology review this year, to be completed by 2015. A major issue for the Queensland Government will be reform of the mining revenue assessment, including full recognition of the expenses incurred by the State in the development and operation of the mining industry.
104 Budget Strategy and Outlook 2013-14
FEDERAL FINANCIAL ARRANGEMENTS
The Australian Government Budget, released on 14 May 2013, made a number of assumptions in relation to funding agreements for education and infrastructure that are still under consideration by the Queensland Government. National aggregates and interstate comparisons in this chapter will use Australian Government estimates for consistency. Queensland specific figures will be consistent with Queensland Budget estimates, which exclude the proposed funding for the National Education Reform Agreement and some large infrastructure projects such as Cross River Rail and the Gateway Upgrade North.
Federal financial relations in Australia are characterised by a disparity between the revenue raising capacity and the expenditure responsibilities of the federal and state governments. The Australian Government collects the major share of taxation revenues and states and territories (states) must rely on grants from the Australian Government to meet their expenditure requirements. These grants represent approximately 44.7% of all states’ revenues in 2013-14, up from 44.3% in 2012-13, based on the Australian Government Budget estimates.
This high degree of mismatch is known as vertical fiscal imbalance (VFI) and arises from a number of factors. These include:
� the Australian Constitution, which precludes states from levying customs duty or excise duty, or introducing taxes based on the value of goods produced – for example, a consumption or retail tax
� restrictions imposed by the Australian Government, particularly on the states’ levying of income tax. While the Constitution permits states to levy income tax, High Court decisions effectively allow the Australian Government to nullify this power
� agreements with the Australian Government, which prevent reinstatement of taxes that were abolished under the arrangements associated with the introduction of the GST. These include a number of duties and financial taxes, such as debits tax.
National tax reform and other changes since 2000 have led to an increase in VFI. Chart 6.1 shows that while the states received 35% of their revenues from the Australian Government in 1999-2000, this is forecast to increase to 44.7% in 2013-14. In contrast, the proportion of the states’ General Government revenues from state taxes has declined from 39.8% in 1999-2000 to 31.7% in 2013-14.
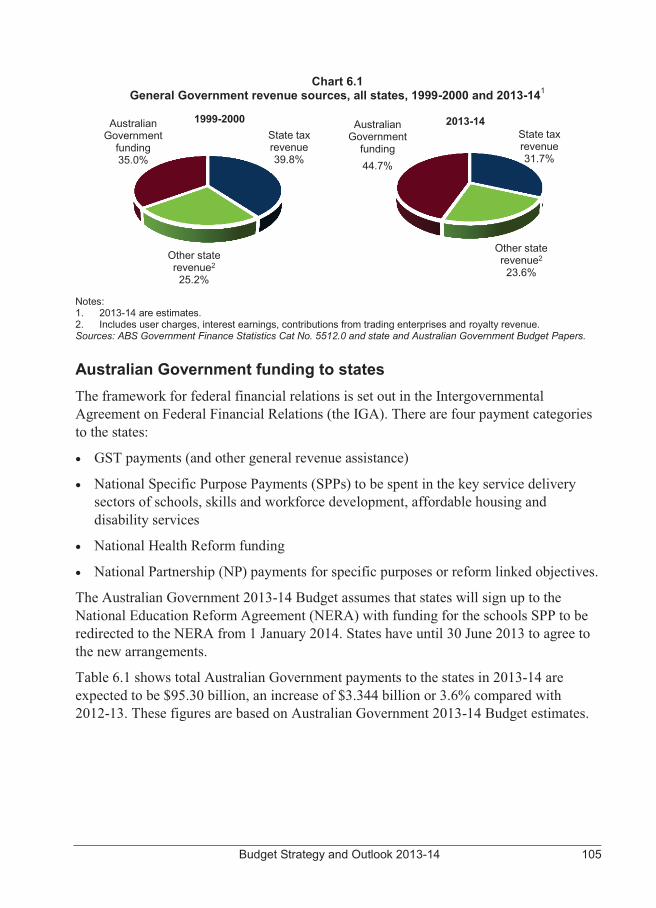
Budget Strategy and Outlook 2013-14 105
Chart 6.1 General Government revenue sources, all states, 1999-2000 and 2013-141
Notes: 1. 2013-14 are estimates. 2. Includes user charges, interest earnings, contributions from trading enterprises and royalty revenue. Sources: ABS Government Finance Statistics Cat No. 5512.0 and state and Australian Government Budget Papers.
Australian Government funding to states The framework for federal financial relations is set out in the Intergovernmental Agreement on Federal Financial Relations (the IGA). There are four payment categories to the states:
� GST payments (and other general revenue assistance)
� National Specific Purpose Payments (SPPs) to be spent in the key service delivery sectors of schools, skills and workforce development, affordable housing and disability services
� National Health Reform funding
� National Partnership (NP) payments for specific purposes or reform linked objectives.
The Australian Government 2013-14 Budget assumes that states will sign up to the National Education Reform Agreement (NERA) with funding for the schools SPP to be redirected to the NERA from 1 January 2014. States have until 30 June 2013 to agree to the new arrangements.
Table 6.1 shows total Australian Government payments to the states in 2013-14 are expected to be $95.30 billion, an increase of $3.344 billion or 3.6% compared with 2012-13. These figures are based on Australian Government 2013-14 Budget estimates.
1999-2000 Australian Government
funding 35.0%
State tax revenue 39.8%
Other state revenue2
25.2%
2013-14 State tax revenue 31.7%
Other state revenue2
23.6%
Australian Government
funding 44.7%
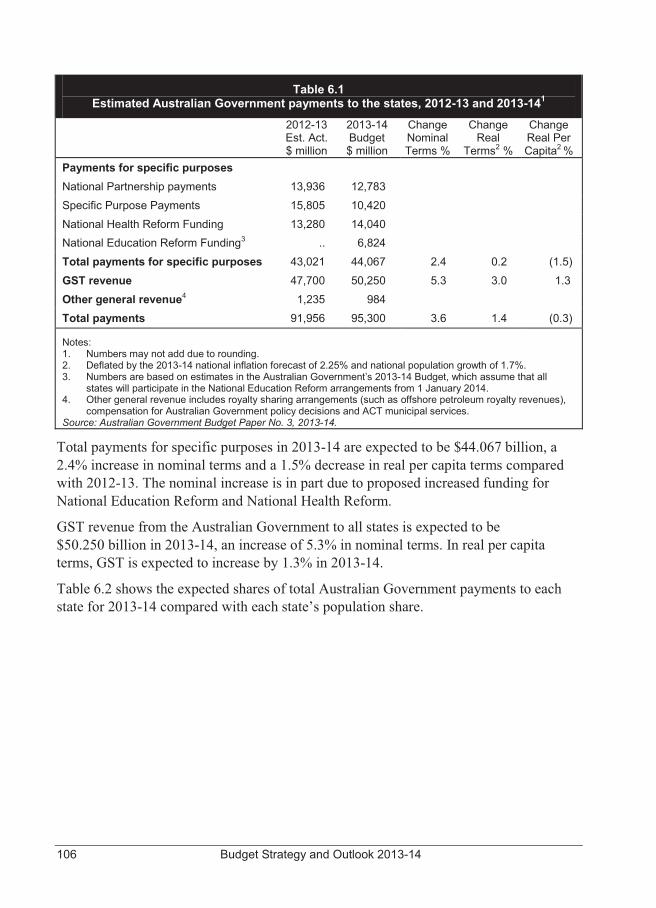
106 Budget Strategy and Outlook 2013-14
Table 6.1 Estimated Australian Government payments to the states, 2012-13 and 2013-141
2012-13 Est. Act. $ million
2013-14 Budget $ million
Change Nominal Terms %
Change Real
Terms2 %
Change Real Per Capita2 %
Payments for specific purposes National Partnership payments 13,936 12,783 Specific Purpose Payments 15,805 10,420 National Health Reform Funding 13,280 14,040 National Education Reform Funding3 .. 6,824 Total payments for specific purposes 43,021 44,067 2.4 0.2 (1.5) GST revenue 47,700 50,250 5.3 3.0 1.3 Other general revenue4 1,235 984 Total payments 91,956 95,300 3.6 1.4 (0.3)
Notes: 1. Numbers may not add due to rounding. 2. Deflated by the 2013-14 national inflation forecast of 2.25% and national population growth of 1.7%. 3. Numbers are based on estimates in the Australian Government’s 2013-14 Budget, which assume that all
states will participate in the National Education Reform arrangements from 1 January 2014. 4. Other general revenue includes royalty sharing arrangements (such as offshore petroleum royalty revenues),
compensation for Australian Government policy decisions and ACT municipal services. Source: Australian Government Budget Paper No. 3, 2013-14.
Total payments for specific purposes in 2013-14 are expected to be $44.067 billion, a 2.4% increase in nominal terms and a 1.5% decrease in real per capita terms compared with 2012-13. The nominal increase is in part due to proposed increased funding for National Education Reform and National Health Reform.
GST revenue from the Australian Government to all states is expected to be $50.250 billion in 2013-14, an increase of 5.3% in nominal terms. In real per capita terms, GST is expected to increase by 1.3% in 2013-14.
Table 6.2 shows the expected shares of total Australian Government payments to each state for 2013-14 compared with each state’s population share.
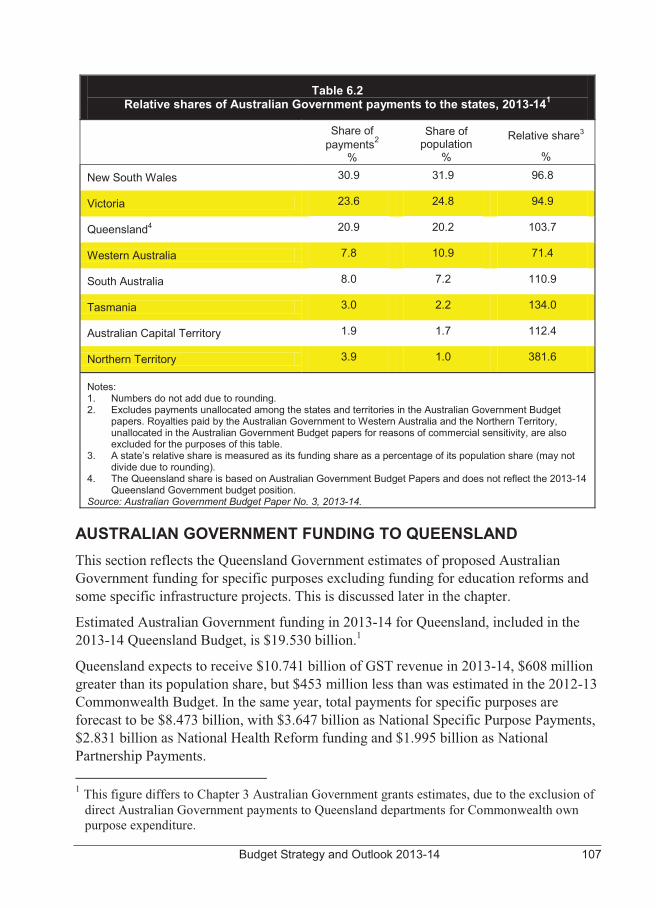
Budget Strategy and Outlook 2013-14 107
Table 6.2 Relative shares of Australian Government payments to the states, 2013-141
Share of
payments2
%
Share of population
%
Relative share3
%
New South Wales 30.9 31.9 96.8
Victoria 23.6 24.8 94.9
Queensland4 20.9 20.2 103.7
Western Australia 7.8 10.9 71.4
South Australia 8.0 7.2 110.9
Tasmania 3.0 2.2 134.0
Australian Capital Territory 1.9 1.7 112.4
Northern Territory 3.9 1.0 381.6
Notes: 1. Numbers do not add due to rounding. 2. Excludes payments unallocated among the states and territories in the Australian Government Budget
papers. Royalties paid by the Australian Government to Western Australia and the Northern Territory, unallocated in the Australian Government Budget papers for reasons of commercial sensitivity, are also excluded for the purposes of this table.
3. A state’s relative share is measured as its funding share as a percentage of its population share (may not divide due to rounding).
4. The Queensland share is based on Australian Government Budget Papers and does not reflect the 2013-14 Queensland Government budget position.
Source: Australian Government Budget Paper No. 3, 2013-14.
AUSTRALIAN GOVERNMENT FUNDING TO QUEENSLAND This section reflects the Queensland Government estimates of proposed Australian Government funding for specific purposes excluding funding for education reforms and some specific infrastructure projects. This is discussed later in the chapter.
Estimated Australian Government funding in 2013-14 for Queensland, included in the 2013-14 Queensland Budget, is $19.530 billion.1
Queensland expects to receive $10.741 billion of GST revenue in 2013-14, $608 million greater than its population share, but $453 million less than was estimated in the 2012-13 Commonwealth Budget. In the same year, total payments for specific purposes are forecast to be $8.473 billion, with $3.647 billion as National Specific Purpose Payments, $2.831 billion as National Health Reform funding and $1.995 billion as National Partnership Payments. 1 This figure differs to Chapter 3 Australian Government grants estimates, due to the exclusion of
direct Australian Government payments to Queensland departments for Commonwealth own purpose expenditure.
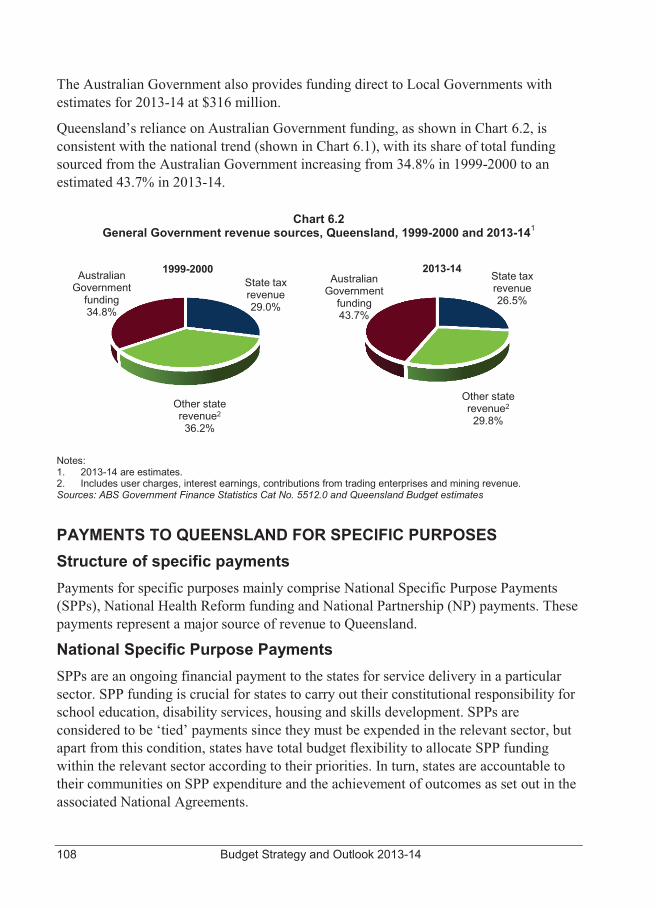
108 Budget Strategy and Outlook 2013-14
The Australian Government also provides funding direct to Local Governments with estimates for 2013-14 at $316 million.
Queensland’s reliance on Australian Government funding, as shown in Chart 6.2, is consistent with the national trend (shown in Chart 6.1), with its share of total funding sourced from the Australian Government increasing from 34.8% in 1999-2000 to an estimated 43.7% in 2013-14.
Chart 6.2 General Government revenue sources, Queensland, 1999-2000 and 2013-141
Notes: 1. 2013-14 are estimates. 2. Includes user charges, interest earnings, contributions from trading enterprises and mining revenue. Sources: ABS Government Finance Statistics Cat No. 5512.0 and Queensland Budget estimates
PAYMENTS TO QUEENSLAND FOR SPECIFIC PURPOSES Structure of specific payments Payments for specific purposes mainly comprise National Specific Purpose Payments (SPPs), National Health Reform funding and National Partnership (NP) payments. These payments represent a major source of revenue to Queensland. National Specific Purpose Payments SPPs are an ongoing financial payment to the states for service delivery in a particular sector. SPP funding is crucial for states to carry out their constitutional responsibility for school education, disability services, housing and skills development. SPPs are considered to be ‘tied’ payments since they must be expended in the relevant sector, but apart from this condition, states have total budget flexibility to allocate SPP funding within the relevant sector according to their priorities. In turn, states are accountable to their communities on SPP expenditure and the achievement of outcomes as set out in the associated National Agreements.
1999-2000 Australian Government
funding 34.8%
State tax revenue 29.0%
Other state revenue2 36.2%
2013-14 Australian
Government funding 43.7%
State tax revenue 26.5%
Other state revenue2
29.8%
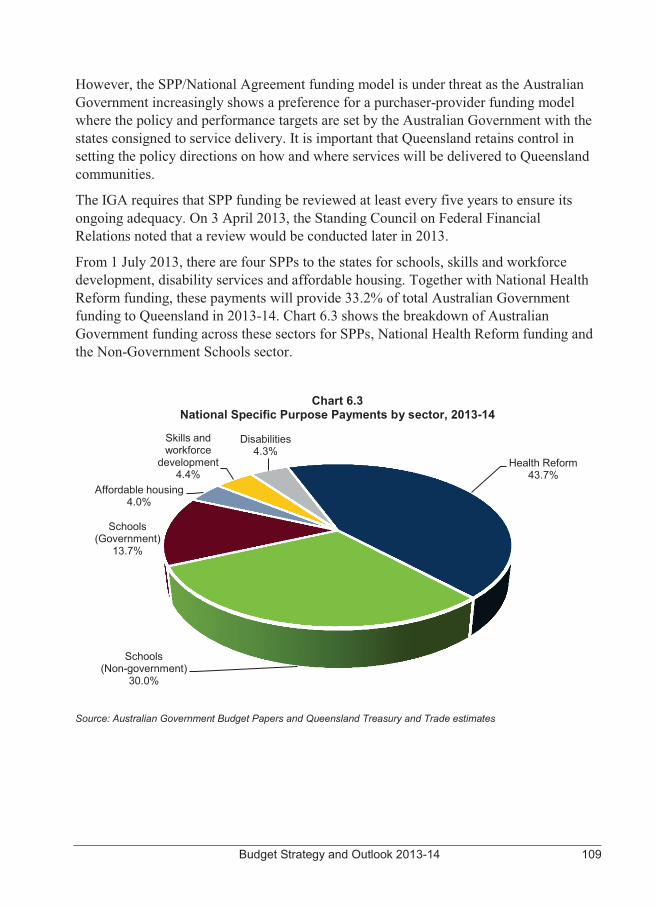
Budget Strategy and Outlook 2013-14 109
However, the SPP/National Agreement funding model is under threat as the Australian Government increasingly shows a preference for a purchaser-provider funding model where the policy and performance targets are set by the Australian Government with the states consigned to service delivery. It is important that Queensland retains control in setting the policy directions on how and where services will be delivered to Queensland communities.
The IGA requires that SPP funding be reviewed at least every five years to ensure its ongoing adequacy. On 3 April 2013, the Standing Council on Federal Financial Relations noted that a review would be conducted later in 2013.
From 1 July 2013, there are four SPPs to the states for schools, skills and workforce development, disability services and affordable housing. Together with National Health Reform funding, these payments will provide 33.2% of total Australian Government funding to Queensland in 2013-14. Chart 6.3 shows the breakdown of Australian Government funding across these sectors for SPPs, National Health Reform funding and the Non-Government Schools sector.
Chart 6.3 National Specific Purpose Payments by sector, 2013-14
Source: Australian Government Budget Papers and Queensland Treasury and Trade estimates
Health Reform 43.7%
Schools (Non-government)
30.0%
Schools (Government)
13.7%
Affordable housing 4.0%
Skills and workforce
development 4.4%
Disabilities4.3%
110 Budget Strategy and Outlook 2013-14
National Health Reform funding The National Healthcare SPP expired on 1 July 2012 and has been replaced by a new payment stream as set out in the National Health Reform Agreement. Under the previous National Healthcare SPP, states had discretion on how to allocate health funds between hospital and other health services. Under the new arrangement, Australian Government health payments are made direct to Hospital and Health Services with state governments having less flexibility over how to allocate health funding.
Health system funding in Queensland requires certainty so that hospitals and health services can meet the health needs of Queensland communities in a timely manner. This certainty was undermined in October 2012 with the Australian Government’s decision to claw back $103 million in health funding in 2012-13 which had a significant impact on the ability of the newly created Hospital and Health Services to plan and deliver services. Further reductions announced in the 2013-14 Budget mean that the Australian Government will claw back approximately $476 million in funding across the forward estimates, since the 2012-13 Budget. New reform initiatives The Australian Government is proposing significant reforms to disability services and school education which will impact the National Disability SPP and the National Schools SPP. The reforms include:
DisabilityCare Australia
In December 2012, the Queensland Government announced a commitment to provide an additional $868 million over the period to 2018-19 to address the historical under-funding of disability services in Queensland and to support implementation of DisabilityCare Australia in Queensland.
This funding, coupled with the Australian Government’s commitment to provide the states with a share of the proposed 0.5% Medicare Levy increase, will contribute to the Queensland Government funding of $2.03 billion of scheme costs in 2019-20 with the Australian Government funding the balance.
The roll out of DisabilityCare Australia in Queensland will impact the National Disability SPP payments currently paid to Queensland. The exact impact is yet to be determined and will be negotiated prior to the commencement of the scheme’s roll out in Queensland in July 2016.
Budget Strategy and Outlook 2013-14 111
National Education Reform
The Australian Government is proposing that the National Schools SPP and the National Education Agreement be replaced by National Education Reform funding and a new National Education Reform Agreement from 1 January 2014. The National Education Reform funding will also include some redirected National Partnership funding. States have until 30 June 2013 to agree to the National Education Reform Agreement and new funding arrangements. The proposed reforms will require significant additional Queensland contributions and will give the Australian Government greater control over Queensland own sourced education funding and its distribution.
The Queensland Government will continue to work through the detail of the Australian Government’s proposal, to determine whether it is in Queensland’s best interests to implement the reforms.
The 2013-14 Queensland Budget reflects the continuation of current arrangements for education funding as there are still a number of issues that need to be resolved.
National Partnership payments National Partnership (NP) payments are paid to states to implement specific NP agreements. These agreements are usually time limited and support the delivery of projects, facilitate reforms or reward states that deliver on national reforms or achieve service delivery improvements.
NP payments are an important source of revenue for Queensland. In 2013-14, proposed NP payments to Queensland will be 10.2% ($1.995 billion) of total Australian Government funding to Queensland.
Number of agreements and funding by sector
The education and health sectors have the largest number of NPs, collectively representing just under half of the 74 agreements for Queensland as at 30 April 2013.
The large number of agreements within these two sectors is problematic as it can obscure the real priorities of Government in these important areas. It also creates difficulties in correctly attributing outcomes to individual initiatives when there is duplication or overlap across agreements. In terms of payments, NP payments for infrastructure, health and education account for 72.7% of the total NP funding in 2013-14 (refer Chart 6.4).
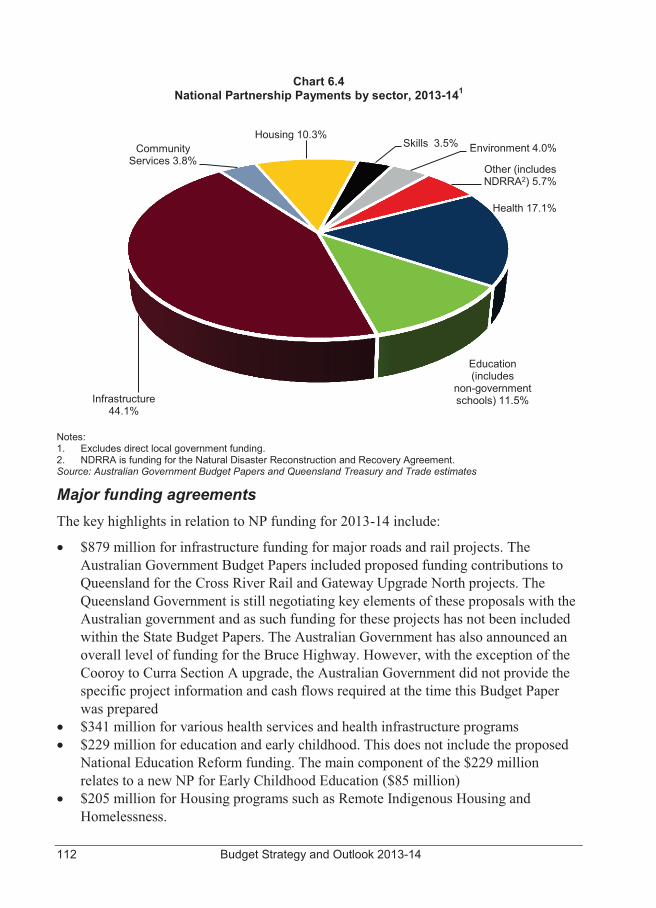
112 Budget Strategy and Outlook 2013-14
Chart 6.4 National Partnership Payments by sector, 2013-141
Notes: 1. Excludes direct local government funding. 2. NDRRA is funding for the Natural Disaster Reconstruction and Recovery Agreement. Source: Australian Government Budget Papers and Queensland Treasury and Trade estimates Major funding agreements The key highlights in relation to NP funding for 2013-14 include:
� $879 million for infrastructure funding for major roads and rail projects. The Australian Government Budget Papers included proposed funding contributions to Queensland for the Cross River Rail and Gateway Upgrade North projects. The Queensland Government is still negotiating key elements of these proposals with the Australian government and as such funding for these projects has not been included within the State Budget Papers. The Australian Government has also announced an overall level of funding for the Bruce Highway. However, with the exception of the Cooroy to Curra Section A upgrade, the Australian Government did not provide the specific project information and cash flows required at the time this Budget Paper was prepared
� $341 million for various health services and health infrastructure programs � $229 million for education and early childhood. This does not include the proposed
National Education Reform funding. The main component of the $229 million relates to a new NP for Early Childhood Education ($85 million)
� $205 million for Housing programs such as Remote Indigenous Housing and Homelessness.
Health 17.1%
Education (includes
non-government schools) 11.5% Infrastructure
44.1%
Community Services 3.8%
Housing 10.3% Skills 3.5% Environment 4.0%
Other (includes NDRRA2) 5.7%
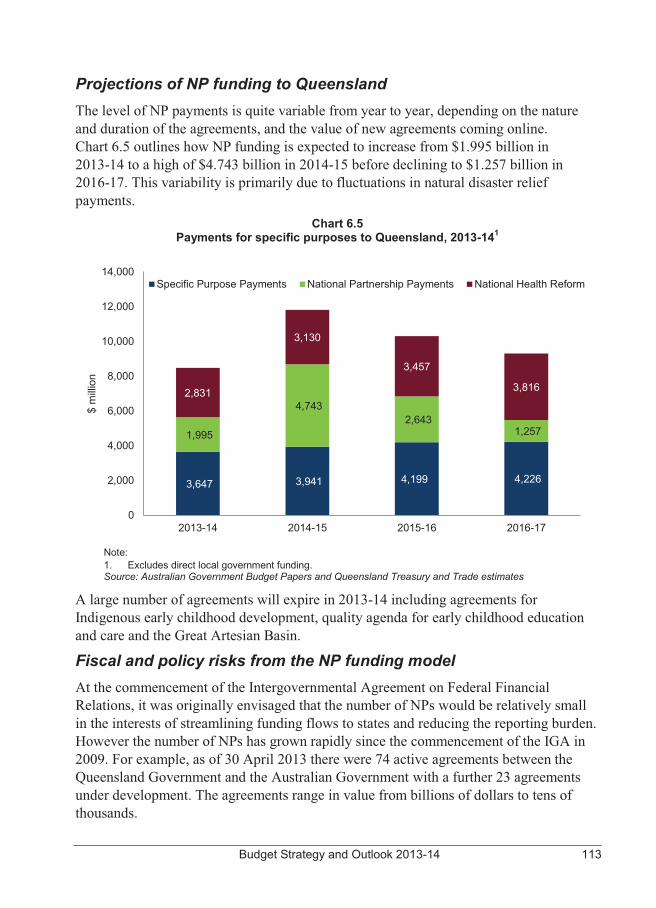
Budget Strategy and Outlook 2013-14 113
Projections of NP funding to Queensland The level of NP payments is quite variable from year to year, depending on the nature and duration of the agreements, and the value of new agreements coming online. Chart 6.5 outlines how NP funding is expected to increase from $1.995 billion in 2013-14 to a high of $4.743 billion in 2014-15 before declining to $1.257 billion in 2016-17. This variability is primarily due to fluctuations in natural disaster relief payments.
Chart 6.5 Payments for specific purposes to Queensland, 2013-141
Note: 1. Excludes direct local government funding. Source: Australian Government Budget Papers and Queensland Treasury and Trade estimates
A large number of agreements will expire in 2013-14 including agreements for Indigenous early childhood development, quality agenda for early childhood education and care and the Great Artesian Basin.
Fiscal and policy risks from the NP funding model At the commencement of the Intergovernmental Agreement on Federal Financial Relations, it was originally envisaged that the number of NPs would be relatively small in the interests of streamlining funding flows to states and reducing the reporting burden. However the number of NPs has grown rapidly since the commencement of the IGA in 2009. For example, as of 30 April 2013 there were 74 active agreements between the Queensland Government and the Australian Government with a further 23 agreements under development. The agreements range in value from billions of dollars to tens of thousands.
3,647 3,941 4,199 4,226
1,995
4,743 2,643
1,257
2,831
3,130
3,457
3,816
0
2,000
4,000
6,000
8,000
10,000
12,000
14,000
2013-14 2014-15 2015-16 2016-17
$ m
illion
Specific Purpose Payments National Partnership Payments National Health Reform
114 Budget Strategy and Outlook 2013-14
The large number of agreements is compromising the integrity of the IGA by maintaining tied funding as a significant part of the federal financial relations framework. More recently, NPs are being used to deliver minor Australian Government initiatives in areas of state service delivery that come with prescriptions about how the project or program is to be delivered.
In addition, administering these numerous agreements is costly, and the reporting burden is growing.
The use of time limited funding agreements particularly where the agreements assist in achieving increased service delivery levels poses an inherent risk for the State as these agreements build capacity and expectations leaving states with a difficult decision if the Australian Government ceases funding. In these cases, states either have to find new funding sources to continue programs, or discontinue services.
There is no constructive process for dealing with expiring NPs and often there is no commitment to ongoing Australian Government funding. Ideally, Queensland’s view is that expiring NPs should be rolled into a relevant SPP or a new SPP should be created.
States have little capacity to influence the continuation of expiring agreements except to provide annual advice to the federal Treasurer. The final decision on expiring agreements is ultimately made through the Australian Government’s budget process and announced with the release of the Australian Government Budget, giving states little advance warning on whether funding will be continued. This flawed process impacts state budget planning and service delivery. The Queensland Government, along with other state and territory governments, will continue to actively work with the Australian Government to improve budget certainty concerning expiring agreements.
States need reliable and unfettered revenue sources for their service delivery responsibilities. NPs too often fail to provide the required funding certainty and frequently include unnecessary prescription, input controls and reporting requirements which can reduce Queensland’s flexibility and resource availability.
Budget Strategy and Outlook 2013-14 115
GST REVENUE PAYMENTS
The Commonwealth Grants Commission (CGC) advises the Australian Government on the distribution of GST revenue among the states. The IGA requires GST revenue to be distributed on the basis of horizontal fiscal equalisation (HFE) principles. Consistent with this, the CGC aims to give all states the same fiscal capacity to deliver services to their populations after the distribution of the GST, taking into account states’ capacities to raise revenue from their own sources, as well as their different expenditure needs.
In March 2011, the Australian Government announced a review of the distribution of GST revenue to the states. The Review’s final report was released in November 2012.
The Review’s final report contains 23 findings and 31 recommendations. The recommendations propose changes to the current CGC processes and governance of HFE arrangements, and the consideration by the CGC of issues in a future methodology review (including the development of a new mining revenue assessment).
The GST Distribution Review’s Final Report also makes a finding about a vision for HFE and federal financial relations in the longer term. More information on the long term vision is provided in Box 6.1.
Federal and State Treasurers have agreed that the CGC would commence a methodology review this year. This review is to report by February 2015, and will incorporate consideration of the recommendations of the GST Distribution Review. More information on the 2015 Review of Methodology is provided in Box 6.2.
In addition, the CGC conducts annual updates of the financial, economic and demographic data that underpin its recommendations. More information on HFE and the GST distribution can be accessed through the CGC website (www.cgc.gov.au).
116 Budget Strategy and Outlook 2013-14
Box 6.1 The Future of Horizontal Fiscal Equalisation
The Australian Government announced a review of the distribution of GST revenue to the states in March 2011, with a final report released in November 2012. The purpose of the GST Distribution Review was to examine the system of distributing the GST revenue to the states, with regard to efficiency, equity, simplicity and stability.
Chapter 12 of the GST Distribution Review Final Report outlines a long term vision for federal financial relations. This deals with a wide range of issues, including roles and responsibilities and vertical fiscal imbalance (VFI), as well as HFE.
The report identifies that states and the Australian Government face long term, underlying economic and demographic pressures, such as an ageing population, higher community expectations for government service delivery and slower revenue growth. To manage long term fiscal pressures, the report finds that federal finances would benefit from:
� tax reform to put greater focus on more efficient taxes
� reducing VFI and states’ reliance on the Australian Government by more closely aligning national tax bases and service responsibilities.
If the above reforms were to be implemented, the report suggests that reforms to HFE could follow. With a reduced level of VFI, transfers from the Australian Government to the states could largely be addressed through untied general revenue assistance, reducing the level of transfers for specific purposes as responsibilities become better aligned with revenue bases.
Rather than implementing HFE by redistributing states’ GST revenue, the Australian Government could take responsibility for funding equalisation payments to states where this is required. In this case, general revenue assistance (such as GST revenue) might most simply be distributed to states on an equal per capita (EPC) basis.
During the GST Distribution Review, New South Wales, Victoria, Queensland and Western Australia made a joint submission advocating the EPC distribution of GST as a long term objective with the Australian Government funding the additional support required for states with lower fiscal capacities so no state is financially worse off.
While welcoming many elements of the Review’s long term vision for federal financial relations, Queensland will continue to vigorously support reform of the mining revenue assessment as a more immediate reform objective (refer Box 6.2), along with greater ongoing Commonwealth action to protect the GST pool, as articulated in the State’s submissions to the GST Distribution Review.
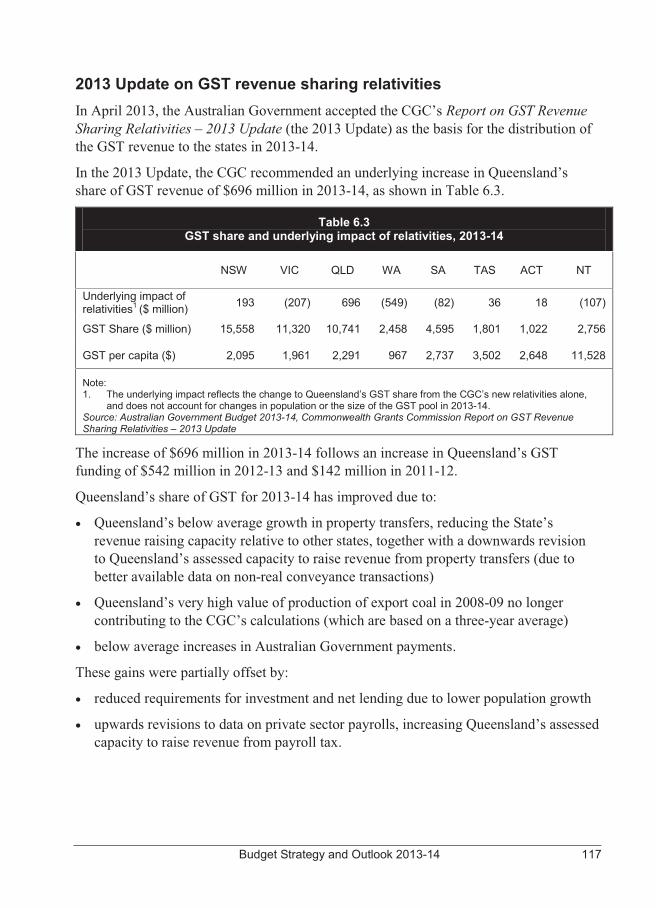
Budget Strategy and Outlook 2013-14 117
2013 Update on GST revenue sharing relativities In April 2013, the Australian Government accepted the CGC’s Report on GST Revenue Sharing Relativities – 2013 Update (the 2013 Update) as the basis for the distribution of the GST revenue to the states in 2013-14.
In the 2013 Update, the CGC recommended an underlying increase in Queensland’s share of GST revenue of $696 million in 2013-14, as shown in Table 6.3.
Table 6.3 GST share and underlying impact of relativities, 2013-14
NSW VIC QLD WA SA TAS ACT NT
Underlying impact of relativities1 ($ million) 193 (207) 696 (549) (82) 36 18 (107)
GST Share ($ million) 15,558 11,320 10,741 2,458 4,595 1,801 1,022 2,756
GST per capita ($) 2,095 1,961 2,291 967 2,737 3,502 2,648 11,528
Note: 1. The underlying impact reflects the change to Queensland’s GST share from the CGC’s new relativities alone,
and does not account for changes in population or the size of the GST pool in 2013-14. Source: Australian Government Budget 2013-14, Commonwealth Grants Commission Report on GST Revenue Sharing Relativities – 2013 Update
The increase of $696 million in 2013-14 follows an increase in Queensland’s GST funding of $542 million in 2012-13 and $142 million in 2011-12.
Queensland’s share of GST for 2013-14 has improved due to:
� Queensland’s below average growth in property transfers, reducing the State’s revenue raising capacity relative to other states, together with a downwards revision to Queensland’s assessed capacity to raise revenue from property transfers (due to better available data on non-real conveyance transactions)
� Queensland’s very high value of production of export coal in 2008-09 no longer contributing to the CGC’s calculations (which are based on a three-year average)
� below average increases in Australian Government payments.
These gains were partially offset by:
� reduced requirements for investment and net lending due to lower population growth
� upwards revisions to data on private sector payrolls, increasing Queensland’s assessed capacity to raise revenue from payroll tax.
118 Budget Strategy and Outlook 2013-14
Box 6.2 2015 Review of CGC Methodology
Federal and State Treasurers have agreed that the CGC would commence a review of the methodology used to determine the distribution of the GST revenue, to report in February 2015.
The 2015 Review will aim to improve the current methodology in the context of:
� the recommendations of the final report of the GST Distribution Review, including the development of a new assessment of mining revenue
� major reforms in federal financial relations that have occurred since the last review of the methodology (2010), including National Health Reform, the National Disability Insurance Scheme and the National Education Reform Agreement
� the ongoing need to ensure that the assessments are as simple and robust as possible, and consistent with the quality and fitness for purpose of the available data.
A key issue for Queensland in this review is the assessment of mining revenue. The GST Distribution Review recommended that a new assessment of mining revenue be developed at the earliest opportunity. It recognised that there are problems with the current assessment; in particular, the division of minerals into two groups (high and low royalty minerals) can produce excessively large GST share effects when a commodity moves between groups. For example, under the current methodology, Western Australia’s decision to increase its royalty rates for iron ore fines would see it lose far more in GST revenue than it gained in additional royalties, were it not for a terms of reference directive to continue assessing iron ore fines as a “low” royalty rate mineral.
Queensland also welcomes the CGC’s consideration of the expenses incurred by states in the development of the mining industry and the provision of economic and social infrastructure. In its final submission to the GST Distribution Review, Queensland documented the significant direct expenditures, opportunity costs and risks associated with the development of mining in Queensland. These costs are not currently recognised in the CGC’s methodology, but at the same time, the royalties resulting from Queensland’s investment in its industry are redistributed to other states through the GST. A new mining assessment must recognise the costs to governments of the mining industry, and restore the appropriate incentives to governments to develop the industry in their states.
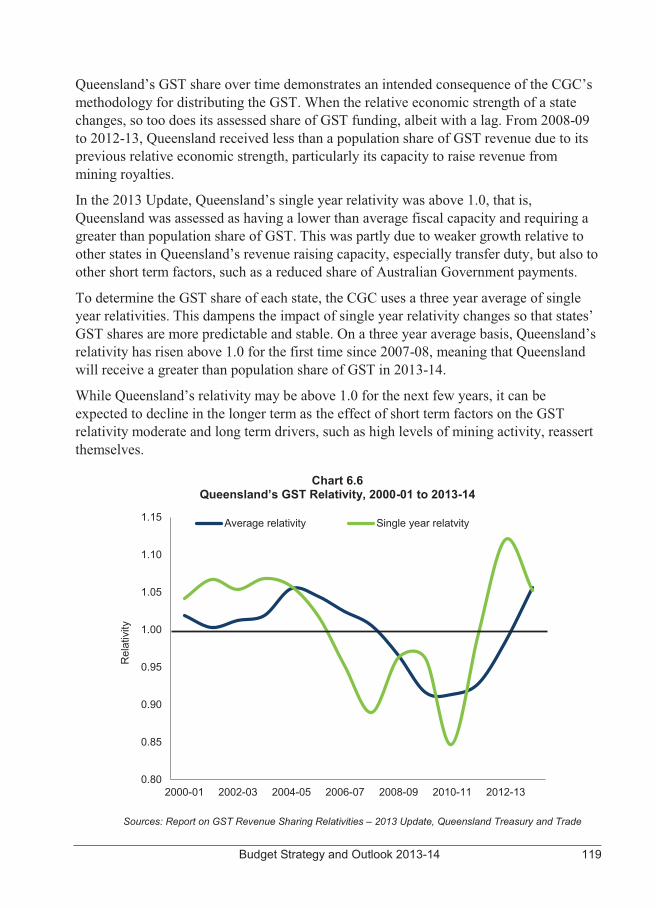
Budget Strategy and Outlook 2013-14 119
Queensland’s GST share over time demonstrates an intended consequence of the CGC’s methodology for distributing the GST. When the relative economic strength of a state changes, so too does its assessed share of GST funding, albeit with a lag. From 2008-09 to 2012-13, Queensland received less than a population share of GST revenue due to its previous relative economic strength, particularly its capacity to raise revenue from mining royalties.
In the 2013 Update, Queensland’s single year relativity was above 1.0, that is, Queensland was assessed as having a lower than average fiscal capacity and requiring a greater than population share of GST. This was partly due to weaker growth relative to other states in Queensland’s revenue raising capacity, especially transfer duty, but also to other short term factors, such as a reduced share of Australian Government payments.
To determine the GST share of each state, the CGC uses a three year average of single year relativities. This dampens the impact of single year relativity changes so that states’ GST shares are more predictable and stable. On a three year average basis, Queensland’s relativity has risen above 1.0 for the first time since 2007-08, meaning that Queensland will receive a greater than population share of GST in 2013-14.
While Queensland’s relativity may be above 1.0 for the next few years, it can be expected to decline in the longer term as the effect of short term factors on the GST relativity moderate and long term drivers, such as high levels of mining activity, reassert themselves.
Chart 6.6 Queensland’s GST Relativity, 2000-01 to 2013-14
Sources: Report on GST Revenue Sharing Relativities – 2013 Update, Queensland Treasury and Trade
0.80
0.85
0.90
0.95
1.00
1.05
1.10
1.15
2000-01 2002-03 2004-05 2006-07 2008-09 2010-11 2012-13
Average relativity Single year relatvity
Rel
ativ
ity
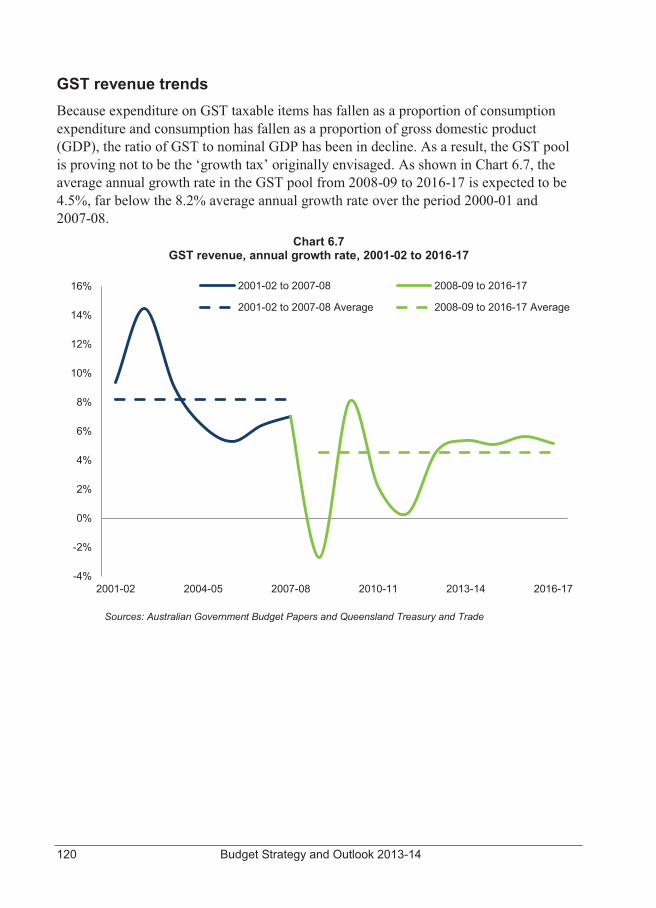
120 Budget Strategy and Outlook 2013-14
GST revenue trends Because expenditure on GST taxable items has fallen as a proportion of consumption expenditure and consumption has fallen as a proportion of gross domestic product (GDP), the ratio of GST to nominal GDP has been in decline. As a result, the GST pool is proving not to be the ‘growth tax’ originally envisaged. As shown in Chart 6.7, the average annual growth rate in the GST pool from 2008-09 to 2016-17 is expected to be 4.5%, far below the 8.2% average annual growth rate over the period 2000-01 and 2007-08.
Chart 6.7 GST revenue, annual growth rate, 2001-02 to 2016-17
Sources: Australian Government Budget Papers and Queensland Treasury and Trade
-4%
-2%
0%
2%
4%
6%
8%
10%
12%
14%
16%
2001-02 2004-05 2007-08 2010-11 2013-14 2016-17
2001-02 to 2007-08 2008-09 to 2016-17
2001-02 to 2007-08 Average 2008-09 to 2016-17 Average
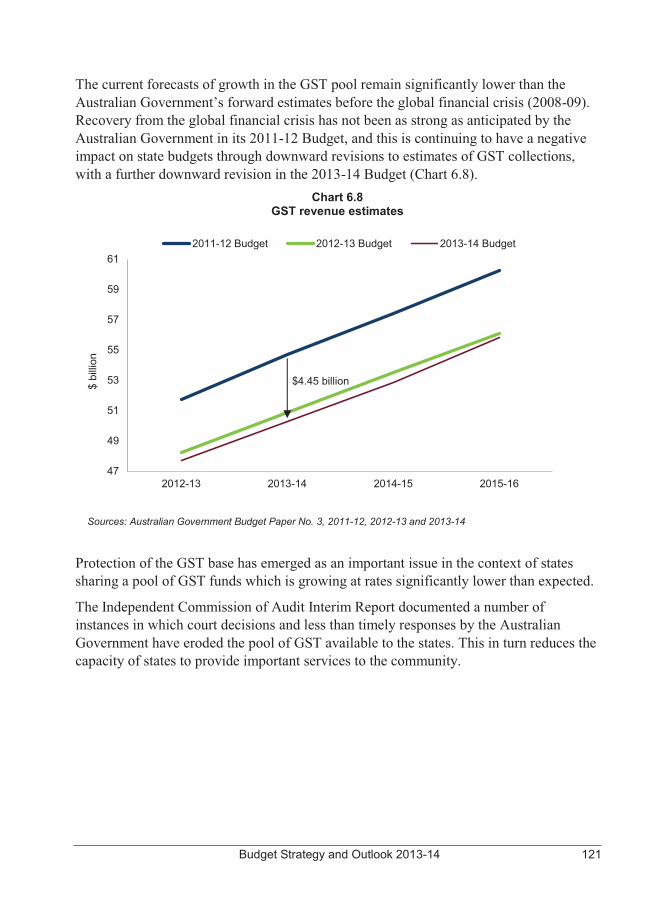
Budget Strategy and Outlook 2013-14 121
The current forecasts of growth in the GST pool remain significantly lower than the Australian Government’s forward estimates before the global financial crisis (2008-09). Recovery from the global financial crisis has not been as strong as anticipated by the Australian Government in its 2011-12 Budget, and this is continuing to have a negative impact on state budgets through downward revisions to estimates of GST collections, with a further downward revision in the 2013-14 Budget (Chart 6.8).
Chart 6.8 GST revenue estimates
Sources: Australian Government Budget Paper No. 3, 2011-12, 2012-13 and 2013-14
Protection of the GST base has emerged as an important issue in the context of states sharing a pool of GST funds which is growing at rates significantly lower than expected.
The Independent Commission of Audit Interim Report documented a number of instances in which court decisions and less than timely responses by the Australian Government have eroded the pool of GST available to the states. This in turn reduces the capacity of states to provide important services to the community.
47
49
51
53
55
57
59
61
2012-13 2013-14 2014-15 2015-16
$ bi
llion
2011-12 Budget 2012-13 Budget 2013-14 Budget
$4.45 billion
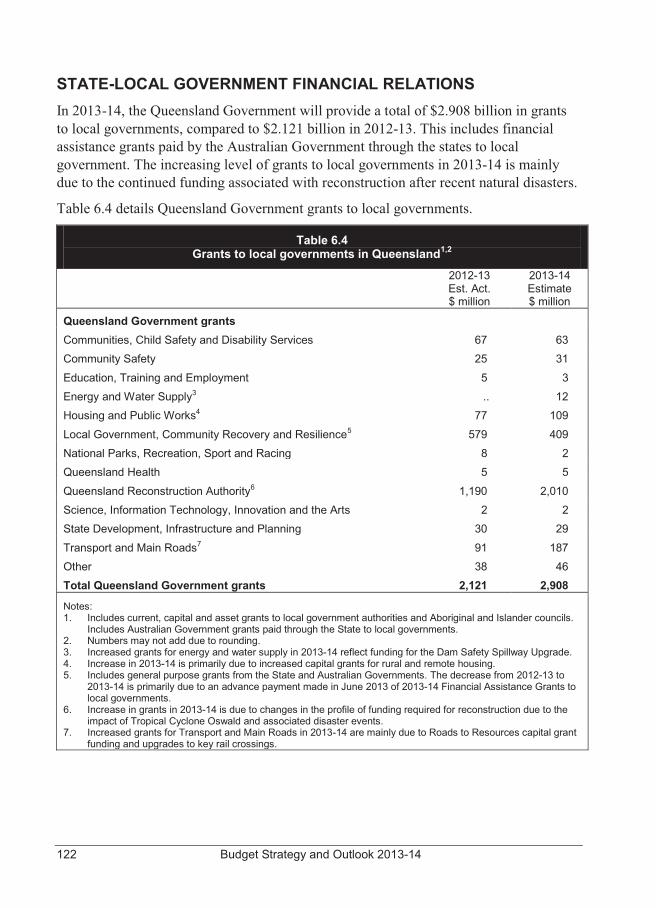
122 Budget Strategy and Outlook 2013-14
STATE-LOCAL GOVERNMENT FINANCIAL RELATIONS In 2013-14, the Queensland Government will provide a total of $2.908 billion in grants to local governments, compared to $2.121 billion in 2012-13. This includes financial assistance grants paid by the Australian Government through the states to local government. The increasing level of grants to local governments in 2013-14 is mainly due to the continued funding associated with reconstruction after recent natural disasters.
Table 6.4 details Queensland Government grants to local governments.
Table 6.4 Grants to local governments in Queensland1,2
2012-13 Est. Act. $ million
2013-14 Estimate $ million
Queensland Government grants Communities, Child Safety and Disability Services 67 63 Community Safety 25 31
Education, Training and Employment 5 3 Energy and Water Supply3 .. 12 Housing and Public Works4 77 109
Local Government, Community Recovery and Resilience5 579 409
National Parks, Recreation, Sport and Racing 8 2 Queensland Health 5 5
Queensland Reconstruction Authority6 1,190 2,010 Science, Information Technology, Innovation and the Arts 2 2 State Development, Infrastructure and Planning 30 29
Transport and Main Roads7 91 187 Other 38 46 Total Queensland Government grants 2,121 2,908
Notes: 1. Includes current, capital and asset grants to local government authorities and Aboriginal and Islander councils.
Includes Australian Government grants paid through the State to local governments. 2. Numbers may not add due to rounding. 3. Increased grants for energy and water supply in 2013-14 reflect funding for the Dam Safety Spillway Upgrade. 4. Increase in 2013-14 is primarily due to increased capital grants for rural and remote housing. 5. Includes general purpose grants from the State and Australian Governments. The decrease from 2012-13 to
2013-14 is primarily due to an advance payment made in June 2013 of 2013-14 Financial Assistance Grants to local governments.
6. Increase in grants in 2013-14 is due to changes in the profile of funding required for reconstruction due to the impact of Tropical Cyclone Oswald and associated disaster events.
7. Increased grants for Transport and Main Roads in 2013-14 are mainly due to Roads to Resources capital grant funding and upgrades to key rail crossings.
Budget Strategy and Outlook 2013-14 123
7 PUBLIC NON-FINANCIAL CORPORATIONS SECTOR
FEATURES � In 2013-14, Public Non-financial Corporations will continue to drive greater
efficiencies across all activities and cut unnecessary expenditure in order to minimise the cost of delivering their services while maintaining reliable performance.
� In 2013-14, the Queensland Bulk Water Supply Authority (Seqwater) will further consolidate improved efficiencies of its bulk water operations and cost reductions expected from the 2012-13 merger of the three former bulk water entities.
� Queensland Rail will continue to implement revised governance arrangements during 2013-14 that respond to the new corporate structure announced on 3 May 2013.
� During 2013-14, a number of Government-owned corporations will work with Government on the implementation of the Queensland Government’s response to the Independent Commission of Audit Final Report.
CONTEXT The entities comprising the Public Non-financial Corporations (PNFC) sector operate across a range of industries including energy, rail, port and water delivery services. A significant part of the PNFC sector is the State’s Government-owned corporations (GOCs) declared by regulation to be GOCs under the Government Owned Corporations Act 1993. This sector does not incorporate QIC Limited as it forms part of the Public Financial Corporations sector. The PNFC sector also includes non-GOC entities including Seqwater, Queensland Rail and some local water boards. A full list of PNFC sector entities is available in Chapter 8.
Under the Government Owned Corporations Act 1993, GOCs are required to operate to realise commercial success and efficiency and are accountable for their performance. GOC business activities target needs identified within their relevant market sector.
Revenues generated by the PNFC sector are predominantly from the sale of services or basic commodities. In more limited cases, part of a PNFC’s revenue may comprise Community Service Obligation payments from the Government. These payments subsidise the provision of a service or commodity supplied on a non-commercial basis in order to deliver the Government’s broader policy objectives.
124 Budget Strategy and Outlook 2013-14
REFORM In 2013-14, the Queensland Government will continue to focus the PNFC sector on driving value for money for Queensland taxpayers, maintaining effective accountability frameworks and the reliable delivery of essential services. This aims to build on the progress and achievements made in 2012-13.
Capital investment GOCs and other major PNFC sector entities will focus on strategies that result in stronger profitability and greater asset efficiency in order to generate improved returns on the State’s substantial equity investment in these businesses. In addition, their future capital programs will continue to be assessed to ensure efficient investment that balances reliability with the lowest long-run cost. The Government is already seeing benefits of this strategy with capital expenditure reducing over the forward estimates.
Water In 2012, the Government began reform of the South East Queensland water entities with the objective of improving the efficiency of water operations and reducing the costs of the South East Queensland Water Grid. A key element of that reform was the merger of the three South East Queensland water entities into one.
On 1 January 2013, the Queensland Bulk Water Transport Authority (LinkWater) and the SEQ Water Grid Manager (WGM) were merged into the existing operations of the Queensland Bulk Water Supply Authority (Seqwater). From this date, Seqwater has taken over all the assets and operations of the three former SEQ water entities (including itself). LinkWater and the WGM ceased trading on 1 January 2013.
The new Seqwater board immediately identified savings of $80 million per annum from the new structure and after a review of the capital and operational budgets, identified a further reduction of $291 million in expenditure over 2013-14 to 2016-17. Overall there is a forecast improvement in the operating position of $333 million by the end of 2016-17 compared to the pre-merger position.
Reviews and reports During 2012-13 the Government released a number of reports that significantly impact the PNFC entities, including the Independent Commission of Audit. Further details on how the Independent Commission’s Final Report impacts the PNFC sector can be found later in this Chapter.
Budget Strategy and Outlook 2013-14 125
The Inter-Departmental Committee on Energy Sector Reform (IDC) was tasked with ensuring:
1. electricity in Queensland is delivered in a cost-effective manner for customers
2. Queensland has a viable, sustainable and competitive electricity industry
3. electricity is delivered in a financially sustainable manner from the Queensland Government’s perspective.
The IDC has undertaken a substantial review of the electricity sector, in consultation with industry, with a view to developing a strategy for reform. Cabinet is yet to consider the IDC final report.
In 2013-14, Government will progress its review of ports’ governance. This review will consider the most appropriate governance model for Queensland ports to ensure efficient and effective delivery of port services. The review will focus on determining an optimal governance model for Queensland ports, addressing improved productivity, minimisation of operational costs, maintaining service levels at the lowest cost and efficient and effective port services.
INDEPENDENT COMMISSION OF AUDIT The Independent Commission of Audit’s Final Report made a series of recommendations relevant to the PNFC sector.
It recommended, when market conditions are favourable, the Government divest its electricity generation assets. The Independent Commission identified a number of factors that would impact the optimal timing of divestment, including the uncertainty regarding the carbon tax and generation capacity in the National Electricity Market.
The Government does not currently have a policy to sell Government businesses, and remains fully committed to seeking a mandate from the Queensland people before divesting itself of any Government business. However, the Government believes such a proposal is worthy of an open and transparent community debate to establish its viability and to inform stakeholders of the costs and benefits of Government owning such businesses, noting these also come with significant financial risks in the context of a modern economy.
Regardless of any consideration of the merits of selling the assets, the Government’s expectation of these operations is they are open for business as usual and the Government will adopt a prudent approach in ensuring decisions are not taken that could erode the value of these assets.
126 Budget Strategy and Outlook 2013-14
The Independent Commission also recommended the electricity distribution and transmission assets be divested. The Government has decided not to seek a mandate to do so at the next election. However, the Government believes that the Independent Commission’s recommendation that residual retail electricity functions be divested warrants further consideration and debate with the community.
The Independent Commission also recommended that the electricity distribution and transmission businesses be required to achieve higher rates of return through increased efficiencies, better capital management and operational cost savings. It also recommends they divest themselves of non-core business where there are significant bring forward benefits for the State from doing so. The 2013-14 Budget reflects the adoption of these recommendations while at the same time ensuring impacts on prices, reliability and standards are minimised.
The Independent Commission made a number of recommendations directly relating to Queensland Rail and the port assets held by GOCs. Of these recommendations, the Government has accepted those relating to increased contestability and competition for services. The Government has also accepted in principle, in part, or for further consideration, a number of other recommendations, acknowledging that these matters will be reviewed as part of the ongoing reform activities being undertaken by the Department of Transport and Main Roads.
Specifically, the Independent Commission recommended that the commercial operations of the Gladstone Ports Corporation Limited (GPC) and Port of Townsville Limited (PoTL) be offered for long term lease to private operators. While the Government does not currently have a policy to sell Government businesses, it believes this proposal is worthy of an open and transparent community debate to establish its viability and to inform stakeholders of the costs and benefits involved. It should also be noted that the offering of a long-term lease for the operation of the commercial enterprises means the Government would still retain ownership of these ports. The Government commits to undertake further detailed investigation of this particular proposal to ensure that the debate is fully informed before making any decision.
The Government has accepted in principle the Independent Commission’s recommendation that ownership and control of remaining government owned, low volume regional ports be offered to local authorities, in view of the significant role they play in their local communities. The Government notes that local authorities are an important stakeholder in ports and will consider each proposal on a case by case basis.
Budget Strategy and Outlook 2013-14 127
The Independent Commission’s report recommended a number of initiatives regarding regional bulk water supply, including the transfer of SunWater Limited’s (SunWater) irrigation channels to private irrigators and offering dedicated water supply infrastructure servicing commercial and industrial clients for private ownership and/or private operation, depending on which solution provides the best value for money outcome for the Government. The Independent Commission also recommended that while SunWater should retain ownership of regional bulk water assets, any new bulk water assets should be privately funded and owned (subject to compelling public benefit or market failure factors).
The Government has accepted the recommendations relating to SunWater, and has initiated an investigation into the divestment and transfer of the irrigation channels to irrigators under local management plans. The Government has also undertaken to evaluate proposals to divest dedicated water infrastructure servicing industrial and commercial clients.
The Government’s response to the Independent Commission report recognised the benefits that flow from a number of recommendations and committed to further work on how to effectively and efficiently capture these benefits. In 2013-14, GOCs affected by these recommendations will work with the Government to ensure the businesses are positioned to meet the expectations of Government in this regard.
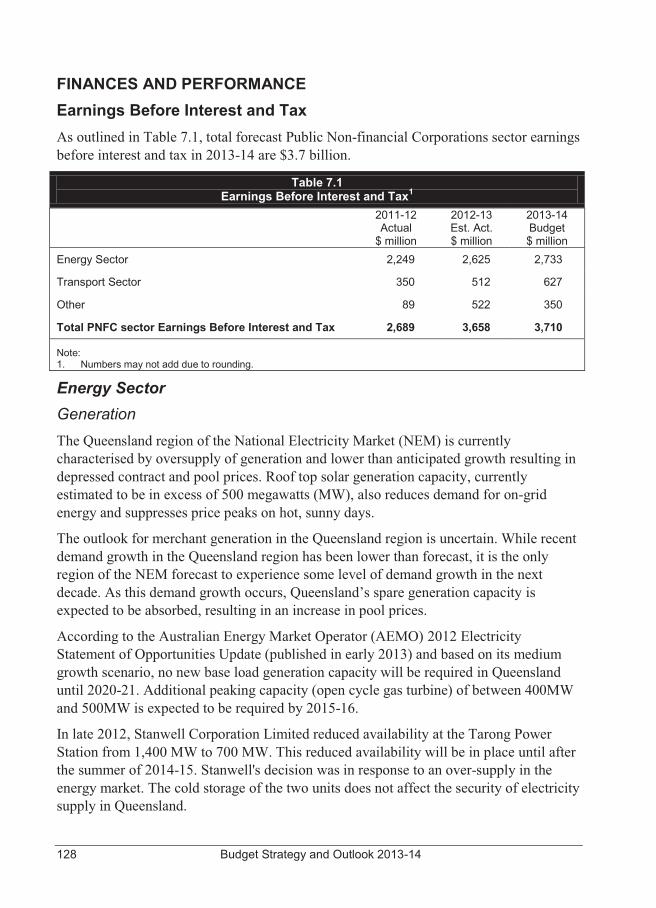
128 Budget Strategy and Outlook 2013-14
FINANCES AND PERFORMANCE
Earnings Before Interest and Tax As outlined in Table 7.1, total forecast Public Non-financial Corporations sector earnings before interest and tax in 2013-14 are $3.7 billion.
Table 7.1 Earnings Before Interest and Tax1
2011-12 Actual
$ million
2012-13 Est. Act. $ million
2013-14 Budget $ million
Energy Sector 2,249 2,625 2,733
Transport Sector 350 512 627
Other 89 522 350
Total PNFC sector Earnings Before Interest and Tax 2,689 3,658 3,710
Note: 1. Numbers may not add due to rounding.
Energy Sector Generation The Queensland region of the National Electricity Market (NEM) is currently characterised by oversupply of generation and lower than anticipated growth resulting in depressed contract and pool prices. Roof top solar generation capacity, currently estimated to be in excess of 500 megawatts (MW), also reduces demand for on-grid energy and suppresses price peaks on hot, sunny days.
The outlook for merchant generation in the Queensland region is uncertain. While recent demand growth in the Queensland region has been lower than forecast, it is the only region of the NEM forecast to experience some level of demand growth in the next decade. As this demand growth occurs, Queensland’s spare generation capacity is expected to be absorbed, resulting in an increase in pool prices.
According to the Australian Energy Market Operator (AEMO) 2012 Electricity Statement of Opportunities Update (published in early 2013) and based on its medium growth scenario, no new base load generation capacity will be required in Queensland until 2020-21. Additional peaking capacity (open cycle gas turbine) of between 400MW and 500MW is expected to be required by 2015-16.
In late 2012, Stanwell Corporation Limited reduced availability at the Tarong Power Station from 1,400 MW to 700 MW. This reduced availability will be in place until after the summer of 2014-15. Stanwell's decision was in response to an over-supply in the energy market. The cold storage of the two units does not affect the security of electricity supply in Queensland.
Budget Strategy and Outlook 2013-14 129
The liquefied natural gas (LNG) industry will be important to any change to market fundamentals in the Queensland region. The LNG industry is expected to create additional base load demand and also move the domestic gas price towards international parity. In these circumstances the competitiveness of coal-fired generation, being the main type of generation within the Queensland government-owned generators, is expected to improve.
Networks The financial positions of the network energy GOCs (Powerlink, Energex and Ergon) continue to reflect the significant amounts of deferred and/or delayed capital investment which have arisen as a result of estimates of ongoing low demand.
All three network entities are undertaking significant cost containment activities which are reflected in the 2013-14 Budget.
The only significant market based change is the completion of Powerlink’s divestment of its equity interest in ElectraNet Pty Ltd, which primarily impacted returns in 2012-13. Although there have been limited changes in the market environment for network energy GOCs, significant risks remain which could impact the forecast outcomes of these entities, including:
� changes to the timing and profile of expected large load projects (such as LNG and other mining and infrastructure projects) which will influence energy growth
� significant changes to forecast electricity demand and volume growth profiles.
However, the most significant risk remains the commencement of the new regulatory period for Energex and Ergon which begins on 1 July 2015. The current regulatory environment presents some uncertainty due to expected significant rule changes and public focus on the decisions of the Australian Energy Regulator making it difficult to estimate the expected financial performance and position of Energex and Ergon post 2015-16.
130 Budget Strategy and Outlook 2013-14
Transport Sector Queensland Rail Queensland Rail (QR) is a provider of rail transport services which are predominantly supported by the Queensland Government through the provision of Community Service Obligation payments. QR maintains a focus on efficient and effective delivery of its services in order to improve its performance and reduce the overall cost of transport services.
The establishment of the QR efficiency program was a key initiative of the 2012-13 Budget. The efficiency program initially estimated a $42 million per annum reduction in consumable spending in addition to a management restructure and Voluntary Redundancy scheme. Total savings of approximately $60 million per annum are expected from these three initiatives. QR has successfully met the forecast cost reduction and continues to progress the efficiency program with further cost savings and efficiency measures identified for implementation in 2013-14.
In 2013-14, the Government will continue to improve the governance arrangements associated with the delivery of rail public transport services following from the recent institutional restructure in which a new statutory authority was created. This restructure is designed to provide an organisational platform for future reforms in rail service delivery. In addition, the contractual arrangements between the Department of Transport and Main Roads as purchaser, and QR as the service provider, are in the process of being renegotiated to ensure the best value outcome for rail commuters in Queensland.
Ports Queensland’s ports service a number of communities and regions and a multi-faceted industry base throughout the State. Other than the Port of Brisbane, all Queensland ports are owned by the Queensland Government with a mixture of both private and public ownership of terminals and berths.
Thermal and metallurgical coals are Queensland’s largest export, and drive profitability at a number of Queensland ports. Nominal port capacity of up to 399 mt is expected by 2017-18 with completion of current and planned port expansion works, including the Wiggins Island Coal Export Terminal Stages 1 and 2 at the Port of Gladstone, Abbot Point Coal Terminal T0 and T3 expansions at the Port of Abbot Point and Hay Point Coal Terminal’s Stage 3 expansion at the Port of Hay Point.
Water Infrastructure SunWater SunWater, in conjunction with the Department of Energy and Water Supply and irrigators, is investigating the viability of local management arrangements of channel irrigation schemes. A final decision is expected to occur in 2013-14.
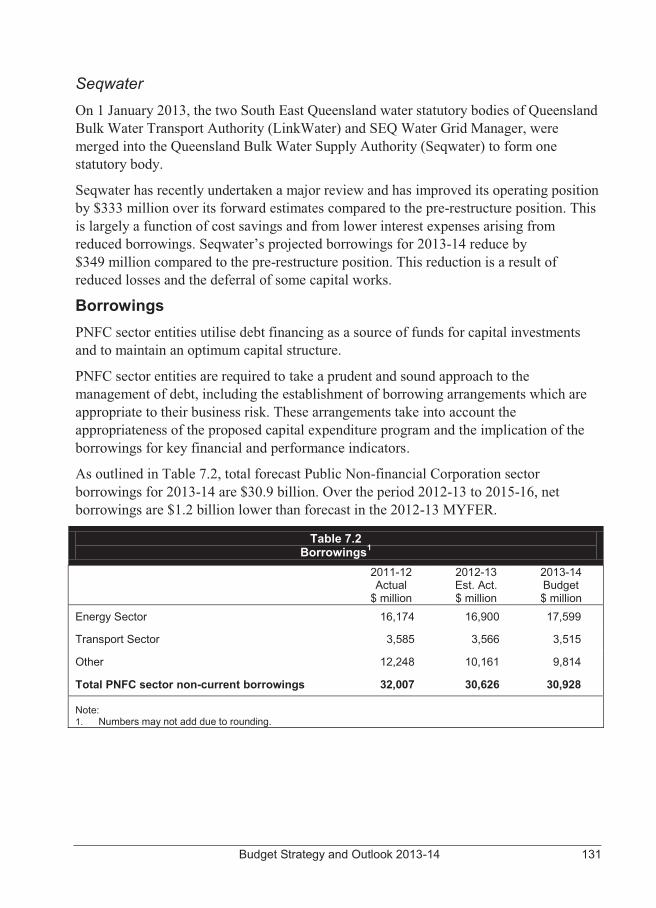
Budget Strategy and Outlook 2013-14 131
Seqwater On 1 January 2013, the two South East Queensland water statutory bodies of Queensland Bulk Water Transport Authority (LinkWater) and SEQ Water Grid Manager, were merged into the Queensland Bulk Water Supply Authority (Seqwater) to form one statutory body.
Seqwater has recently undertaken a major review and has improved its operating position by $333 million over its forward estimates compared to the pre-restructure position. This is largely a function of cost savings and from lower interest expenses arising from reduced borrowings. Seqwater’s projected borrowings for 2013-14 reduce by $349 million compared to the pre-restructure position. This reduction is a result of reduced losses and the deferral of some capital works.
Borrowings PNFC sector entities utilise debt financing as a source of funds for capital investments and to maintain an optimum capital structure.
PNFC sector entities are required to take a prudent and sound approach to the management of debt, including the establishment of borrowing arrangements which are appropriate to their business risk. These arrangements take into account the appropriateness of the proposed capital expenditure program and the implication of the borrowings for key financial and performance indicators.
As outlined in Table 7.2, total forecast Public Non-financial Corporation sector borrowings for 2013-14 are $30.9 billion. Over the period 2012-13 to 2015-16, net borrowings are $1.2 billion lower than forecast in the 2012-13 MYFER.
Table 7.2 Borrowings1
2011-12 Actual
$ million
2012-13 Est. Act. $ million
2013-14 Budget $ million
Energy Sector 16,174 16,900 17,599
Transport Sector 3,585 3,566 3,515
Other 12,248 10,161 9,814
Total PNFC sector non-current borrowings 32,007 30,626 30,928
Note: 1. Numbers may not add due to rounding.
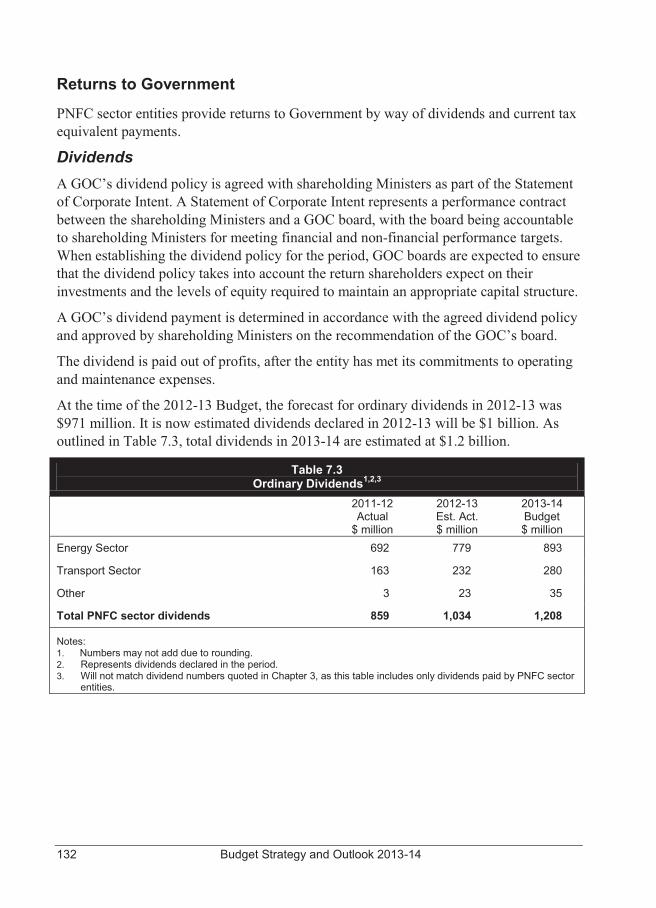
132 Budget Strategy and Outlook 2013-14
Returns to Government
PNFC sector entities provide returns to Government by way of dividends and current tax equivalent payments.
Dividends A GOC’s dividend policy is agreed with shareholding Ministers as part of the Statement of Corporate Intent. A Statement of Corporate Intent represents a performance contract between the shareholding Ministers and a GOC board, with the board being accountable to shareholding Ministers for meeting financial and non-financial performance targets. When establishing the dividend policy for the period, GOC boards are expected to ensure that the dividend policy takes into account the return shareholders expect on their investments and the levels of equity required to maintain an appropriate capital structure.
A GOC’s dividend payment is determined in accordance with the agreed dividend policy and approved by shareholding Ministers on the recommendation of the GOC’s board.
The dividend is paid out of profits, after the entity has met its commitments to operating and maintenance expenses.
At the time of the 2012-13 Budget, the forecast for ordinary dividends in 2012-13 was $971 million. It is now estimated dividends declared in 2012-13 will be $1 billion. As outlined in Table 7.3, total dividends in 2013-14 are estimated at $1.2 billion.
Table 7.3 Ordinary Dividends1,2,3
2011-12 Actual
$ million
2012-13 Est. Act. $ million
2013-14 Budget $ million
Energy Sector 692 779 893
Transport Sector 163 232 280
Other 3 23 35
Total PNFC sector dividends 859 1,034 1,208
Notes: 1. Numbers may not add due to rounding. 2. Represents dividends declared in the period. 3. Will not match dividend numbers quoted in Chapter 3, as this table includes only dividends paid by PNFC sector
entities.
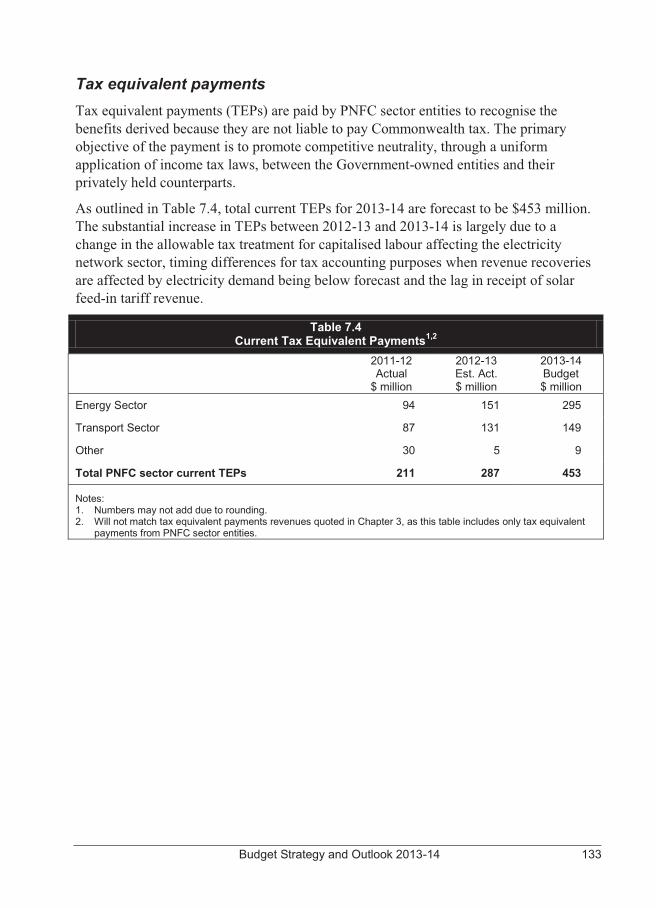
Budget Strategy and Outlook 2013-14 133
Tax equivalent payments Tax equivalent payments (TEPs) are paid by PNFC sector entities to recognise the benefits derived because they are not liable to pay Commonwealth tax. The primary objective of the payment is to promote competitive neutrality, through a uniform application of income tax laws, between the Government-owned entities and their privately held counterparts.
As outlined in Table 7.4, total current TEPs for 2013-14 are forecast to be $453 million. The substantial increase in TEPs between 2012-13 and 2013-14 is largely due to a change in the allowable tax treatment for capitalised labour affecting the electricity network sector, timing differences for tax accounting purposes when revenue recoveries are affected by electricity demand being below forecast and the lag in receipt of solar feed-in tariff revenue.
Table 7.4 Current Tax Equivalent Payments1,2
2011-12 Actual
$ million
2012-13 Est. Act. $ million
2013-14 Budget $ million
Energy Sector 94 151 295
Transport Sector 87 131 149
Other 30 5 9
Total PNFC sector current TEPs 211 287 453
Notes: 1. Numbers may not add due to rounding. 2. Will not match tax equivalent payments revenues quoted in Chapter 3, as this table includes only tax equivalent
payments from PNFC sector entities.
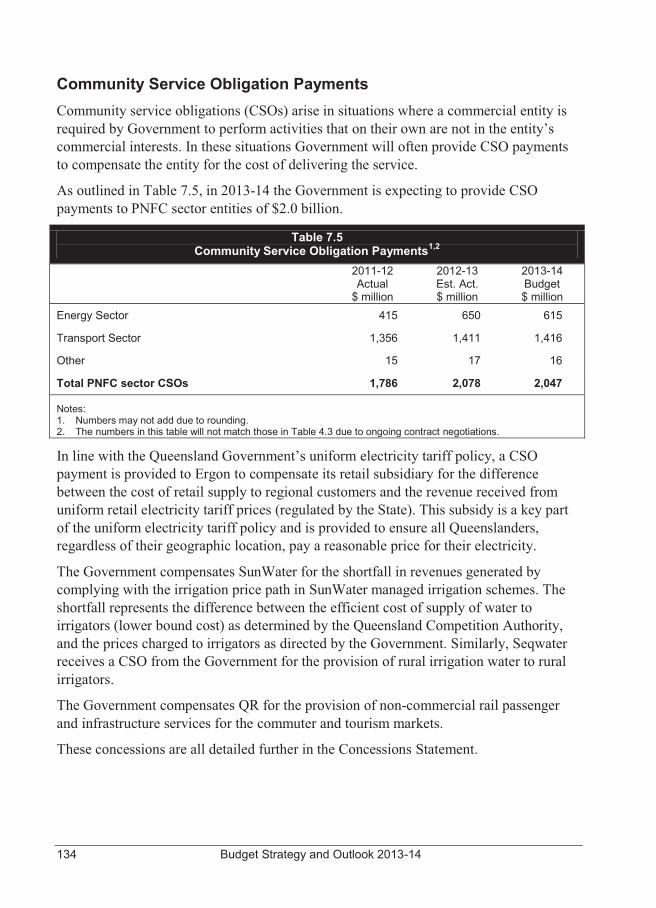
134 Budget Strategy and Outlook 2013-14
Community Service Obligation Payments
Community service obligations (CSOs) arise in situations where a commercial entity is required by Government to perform activities that on their own are not in the entity’s commercial interests. In these situations Government will often provide CSO payments to compensate the entity for the cost of delivering the service.
As outlined in Table 7.5, in 2013-14 the Government is expecting to provide CSO payments to PNFC sector entities of $2.0 billion.
Table 7.5 Community Service Obligation Payments1,2
2011-12 Actual
$ million
2012-13 Est. Act. $ million
2013-14 Budget $ million
Energy Sector 415 650 615
Transport Sector 1,356 1,411 1,416
Other 15 17 16
Total PNFC sector CSOs 1,786 2,078 2,047
Notes: 1. Numbers may not add due to rounding. 2. The numbers in this table will not match those in Table 4.3 due to ongoing contract negotiations.
In line with the Queensland Government’s uniform electricity tariff policy, a CSO payment is provided to Ergon to compensate its retail subsidiary for the difference between the cost of retail supply to regional customers and the revenue received from uniform retail electricity tariff prices (regulated by the State). This subsidy is a key part of the uniform electricity tariff policy and is provided to ensure all Queenslanders, regardless of their geographic location, pay a reasonable price for their electricity.
The Government compensates SunWater for the shortfall in revenues generated by complying with the irrigation price path in SunWater managed irrigation schemes. The shortfall represents the difference between the efficient cost of supply of water to irrigators (lower bound cost) as determined by the Queensland Competition Authority, and the prices charged to irrigators as directed by the Government. Similarly, Seqwater receives a CSO from the Government for the provision of rural irrigation water to rural irrigators.
The Government compensates QR for the provision of non-commercial rail passenger and infrastructure services for the commuter and tourism markets.
These concessions are all detailed further in the Concessions Statement.
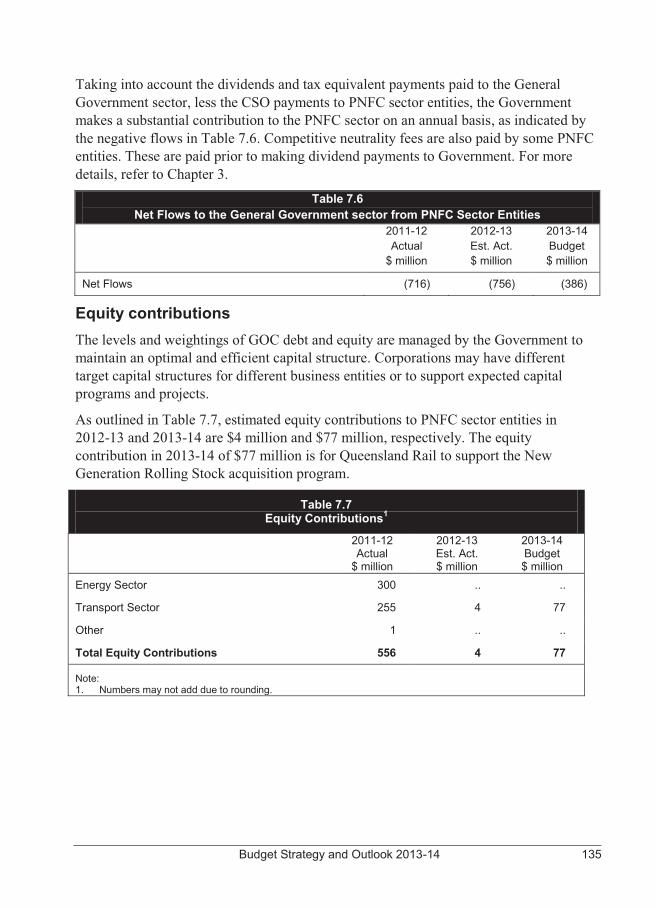
Budget Strategy and Outlook 2013-14 135
Taking into account the dividends and tax equivalent payments paid to the General Government sector, less the CSO payments to PNFC sector entities, the Government makes a substantial contribution to the PNFC sector on an annual basis, as indicated by the negative flows in Table 7.6. Competitive neutrality fees are also paid by some PNFC entities. These are paid prior to making dividend payments to Government. For more details, refer to Chapter 3.
Table 7.6 Net Flows to the General Government sector from PNFC Sector Entities
2011-12 Actual
$ million
2012-13 Est. Act. $ million
2013-14 Budget $ million
Net Flows (716) (756) (386)
Equity contributions The levels and weightings of GOC debt and equity are managed by the Government to maintain an optimal and efficient capital structure. Corporations may have different target capital structures for different business entities or to support expected capital programs and projects.
As outlined in Table 7.7, estimated equity contributions to PNFC sector entities in 2012-13 and 2013-14 are $4 million and $77 million, respectively. The equity contribution in 2013-14 of $77 million is for Queensland Rail to support the New Generation Rolling Stock acquisition program.
Table 7.7 Equity Contributions1
2011-12 Actual
$ million
2012-13 Est. Act. $ million
2013-14 Budget $ million
Energy Sector 300 .. ..
Transport Sector 255 4 77
Other 1 .. ..
Total Equity Contributions 556 4 77
Note: 1. Numbers may not add due to rounding.

136 Budget Strategy and Outlook 2013-14
Budget Strategy and Outlook 2013-14 137
8 UNIFORM PRESENTATION FRAMEWORK
INTRODUCTION This chapter contains detailed financial statements for the Queensland Public Sector prepared under the Uniform Presentation Framework (UPF) of reporting as required under the Australian Loan Council arrangements.
The UPF was reviewed following the release in October 2007 of the Australian Accounting Standards Board’s (AASB) accounting standard, AASB 1049 Whole of Government and General Government Sector Financial Reporting. The standard aims to harmonise Government Finance Statistics (GFS) and Generally Accepted Accounting Principles (GAAP) with the objective of improving the clarity and transparency of government financial statements.
In addition, the chapter provides:
� a reconciliation of the General Government sector net operating balance to the accounting operating result
� a time series for the General Government sector using the revised UPF
� details of General Government grant revenue and expenses
� details of General Government sector dividend and income tax equivalent income
� data on General Government expenses and purchases of non-financial assets by function
� details of taxation revenue collected by the General Government sector
� the State’s revised Loan Council Budget allocation
� details of contingent liabilities
� background information on the revised UPF and disclosure differences arising from it, including the conceptual basis, sector definitions and a list of reporting entities.
UNIFORM PRESENTATION FRAMEWORK FINANCIAL INFORMATION The tables on the following pages present operating statements, balance sheets and cash flow statements prepared on a harmonised basis for the General Government, Public Non-financial Corporations (PNFC) and Non-financial Public sectors.
Under the UPF requirements, budgeted financial information for the Public Financial Corporations sector is not included.
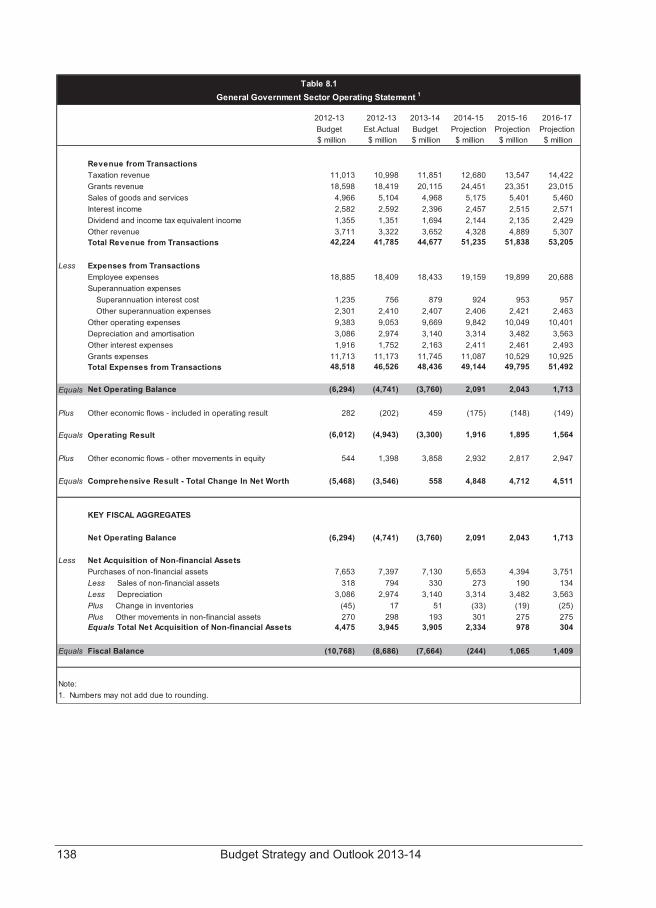
138 Budget Strategy and Outlook 2013-14
2012-13Budget
Revenue from TransactionsTaxation revenue 11,013 10,998 11,851 12,680 13,547 14,422 Grants revenue 18,598 18,419 20,115 24,451 23,351 23,015 Sales of goods and services 4,966 5,104 4,968 5,175 5,401 5,460 Interest income 2,582 2,592 2,396 2,457 2,515 2,571 Dividend and income tax equivalent income 1,355 1,351 1,694 2,144 2,135 2,429 Other revenue 3,711 3,322 3,652 4,328 4,889 5,307 Total Revenue from Transactions 42,224 41,785 44,677 51,235 51,838 53,205
Less Expenses from TransactionsEmployee expenses 18,885 18,409 18,433 19,159 19,899 20,688 Superannuation expenses
Superannuation interest cost 1,235 756 879 924 953 957 Other superannuation expenses 2,301 2,410 2,407 2,406 2,421 2,463
Other operating expenses 9,383 9,053 9,669 9,842 10,049 10,401 Depreciation and amortisation 3,086 2,974 3,140 3,314 3,482 3,563 Other interest expenses 1,916 1,752 2,163 2,411 2,461 2,493 Grants expenses 11,713 11,173 11,745 11,087 10,529 10,925 Total Expenses from Transactions 48,518 46,526 48,436 49,144 49,795 51,492
Equals Net Operating Balance (6,294) (4,741) (3,760) 2,091 2,043 1,713
Plus Other economic flows - included in operating result 282 (202) 459 (175) (148) (149)
Equals Operating Result (6,012) (4,943) (3,300) 1,916 1,895 1,564
Plus Other economic flows - other movements in equity 544 1,398 3,858 2,932 2,817 2,947
Equals Comprehensive Result - Total Change In Net Worth (5,468) (3,546) 558 4,848 4,712 4,511
KEY FISCAL AGGREGATES
Net Operating Balance (6,294) (4,741) (3,760) 2,091 2,043 1,713
Less Net Acquisition of Non-financial AssetsPurchases of non-financial assets 7,653 7,397 7,130 5,653 4,394 3,751 Less Sales of non-financial assets 318 794 330 273 190 134 Less Depreciation 3,086 2,974 3,140 3,314 3,482 3,563 Plus Change in inventories (45) 17 51 (33) (19) (25)Plus Other movements in non-financial assets 270 298 193 301 275 275 Equals Total Net Acquisition of Non-financial Assets 4,475 3,945 3,905 2,334 978 304
Equals Fiscal Balance (10,768) (8,686) (7,664) (244) 1,065 1,409
Note:1. Numbers may not add due to rounding.
Table 8.1
2013-14Budget
2015-16Projection
General Government Sector Operating Statement 1
$ million
2014-15Projection $ million $ million
2012-13Est.Actual $ million $ million
2016-17Projection $ million
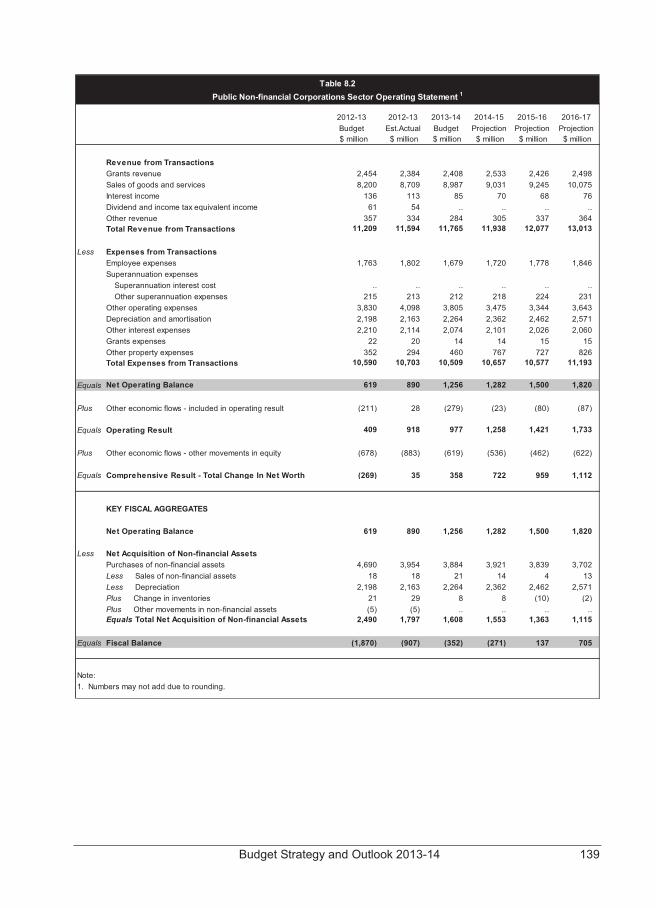
Budget Strategy and Outlook 2013-14 139
2012-13Budget
Revenue from TransactionsGrants revenue 2,454 2,384 2,408 2,533 2,426 2,498 Sales of goods and services 8,200 8,709 8,987 9,031 9,245 10,075 Interest income 136 113 85 70 68 76 Dividend and income tax equivalent income 61 54 .. .. .. .. Other revenue 357 334 284 305 337 364 Total Revenue from Transactions 11,209 11,594 11,765 11,938 12,077 13,013
Less Expenses from TransactionsEmployee expenses 1,763 1,802 1,679 1,720 1,778 1,846 Superannuation expenses
Superannuation interest cost .. .. .. .. .. .. Other superannuation expenses 215 213 212 218 224 231
Other operating expenses 3,830 4,098 3,805 3,475 3,344 3,643 Depreciation and amortisation 2,198 2,163 2,264 2,362 2,462 2,571 Other interest expenses 2,210 2,114 2,074 2,101 2,026 2,060 Grants expenses 22 20 14 14 15 15 Other property expenses 352 294 460 767 727 826 Total Expenses from Transactions 10,590 10,703 10,509 10,657 10,577 11,193
Equals Net Operating Balance 619 890 1,256 1,282 1,500 1,820
Plus Other economic flows - included in operating result (211) 28 (279) (23) (80) (87)
Equals Operating Result 409 918 977 1,258 1,421 1,733
Plus Other economic flows - other movements in equity (678) (883) (619) (536) (462) (622)
Equals Comprehensive Result - Total Change In Net Worth (269) 35 358 722 959 1,112
KEY FISCAL AGGREGATES
Net Operating Balance 619 890 1,256 1,282 1,500 1,820
Less Net Acquisition of Non-financial AssetsPurchases of non-financial assets 4,690 3,954 3,884 3,921 3,839 3,702 Less Sales of non-financial assets 18 18 21 14 4 13 Less Depreciation 2,198 2,163 2,264 2,362 2,462 2,571 Plus Change in inventories 21 29 8 8 (10) (2)Plus Other movements in non-financial assets (5) (5) .. .. .. .. Equals Total Net Acquisition of Non-financial Assets 2,490 1,797 1,608 1,553 1,363 1,115
Equals Fiscal Balance (1,870) (907) (352) (271) 137 705
Note:1. Numbers may not add due to rounding.
$ million
2016-17Projection $ million $ million
2014-15Projection $ million $ million
2012-13Est.Actual $ million
Table 8.2
2013-14Budget
2015-16Projection
Public Non-financial Corporations Sector Operating Statement 1
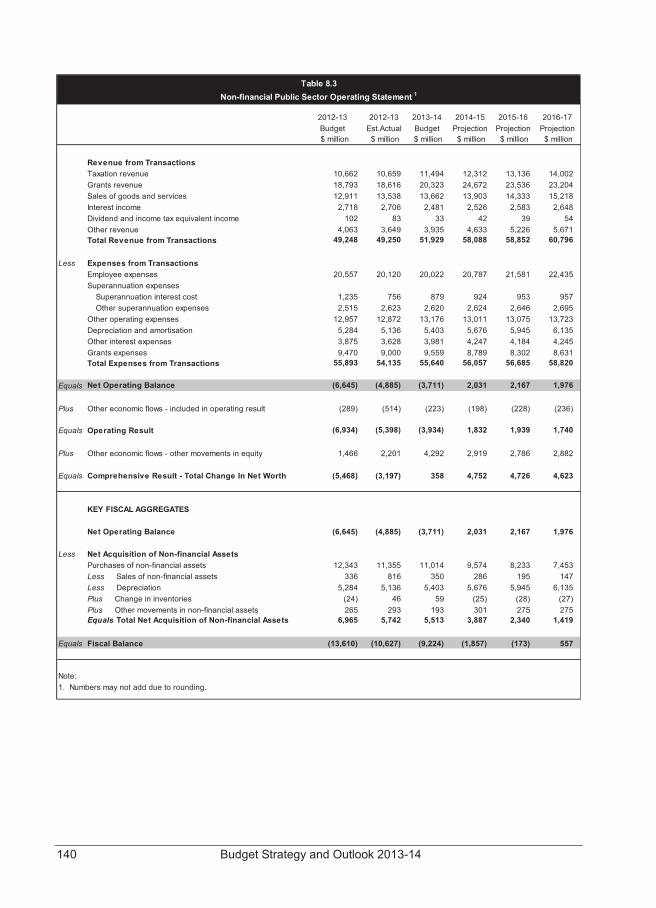
140 Budget Strategy and Outlook 2013-14
2012-13Budget
Revenue from TransactionsTaxation revenue 10,662 10,659 11,494 12,312 13,136 14,002 Grants revenue 18,793 18,616 20,323 24,672 23,536 23,204 Sales of goods and services 12,911 13,538 13,662 13,903 14,333 15,218 Interest income 2,718 2,706 2,481 2,526 2,583 2,648 Dividend and income tax equivalent income 102 83 33 42 39 54 Other revenue 4,063 3,649 3,935 4,633 5,226 5,671 Total Revenue from Transactions 49,248 49,250 51,929 58,088 58,852 60,796
Less Expenses from TransactionsEmployee expenses 20,557 20,120 20,022 20,787 21,581 22,435 Superannuation expenses
Superannuation interest cost 1,235 756 879 924 953 957 Other superannuation expenses 2,515 2,623 2,620 2,624 2,646 2,695
Other operating expenses 12,957 12,872 13,176 13,011 13,075 13,723 Depreciation and amortisation 5,284 5,136 5,403 5,676 5,945 6,135 Other interest expenses 3,875 3,628 3,981 4,247 4,184 4,245 Grants expenses 9,470 9,000 9,559 8,789 8,302 8,631 Total Expenses from Transactions 55,893 54,135 55,640 56,057 56,685 58,820
Equals Net Operating Balance (6,645) (4,885) (3,711) 2,031 2,167 1,976
Plus Other economic flows - included in operating result (289) (514) (223) (198) (228) (236)
Equals Operating Result (6,934) (5,398) (3,934) 1,832 1,939 1,740
Plus Other economic flows - other movements in equity 1,466 2,201 4,292 2,919 2,786 2,882
Equals Comprehensive Result - Total Change In Net Worth (5,468) (3,197) 358 4,752 4,726 4,623
KEY FISCAL AGGREGATES
Net Operating Balance (6,645) (4,885) (3,711) 2,031 2,167 1,976
Less Net Acquisition of Non-financial AssetsPurchases of non-financial assets 12,343 11,355 11,014 9,574 8,233 7,453 Less Sales of non-financial assets 336 816 350 286 195 147 Less Depreciation 5,284 5,136 5,403 5,676 5,945 6,135 Plus Change in inventories (24) 46 59 (25) (28) (27)Plus Other movements in non-financial assets 265 293 193 301 275 275 Equals Total Net Acquisition of Non-financial Assets 6,965 5,742 5,513 3,887 2,340 1,419
Equals Fiscal Balance (13,610) (10,627) (9,224) (1,857) (173) 557
Note:1. Numbers may not add due to rounding.
$ million
2016-17Projection $ million $ million
2014-15Projection $ million $ million
2012-13Est.Actual $ million
Table 8.3
2013-14Budget
2015-16Projection
Non-financial Public Sector Operating Statement 1
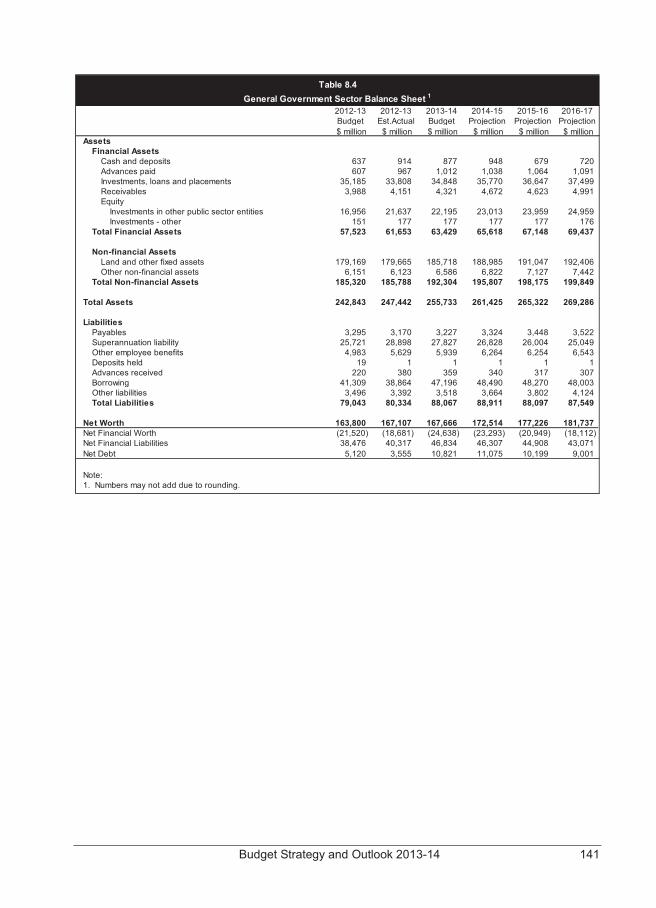
Budget Strategy and Outlook 2013-14 141
Assets Financial Assets
Cash and deposits 637 914 877 948 679 720 Advances paid 607 967 1,012 1,038 1,064 1,091 Investments, loans and placements 35,185 33,808 34,848 35,770 36,647 37,499 Receivables 3,988 4,151 4,321 4,672 4,623 4,991 Equity
Investments in other public sector entities 16,956 21,637 22,195 23,013 23,959 24,959 Investments - other 151 177 177 177 177 176
Total Financial Assets 57,523 61,653 63,429 65,618 67,148 69,437
Non-financial Assets Land and other fixed assets 179,169 179,665 185,718 188,985 191,047 192,406 Other non-financial assets 6,151 6,123 6,586 6,822 7,127 7,442
Total Non-financial Assets 185,320 185,788 192,304 195,807 198,175 199,849
Total Assets 242,843 247,442 255,733 261,425 265,322 269,286
LiabilitiesPayables 3,295 3,170 3,227 3,324 3,448 3,522 Superannuation liability 25,721 28,898 27,827 26,828 26,004 25,049 Other employee benefits 4,983 5,629 5,939 6,264 6,254 6,543 Deposits held 19 1 1 1 1 1 Advances received 220 380 359 340 317 307 Borrowing 41,309 38,864 47,196 48,490 48,270 48,003 Other liabilities 3,496 3,392 3,518 3,664 3,802 4,124 Total Liabilities 79,043 80,334 88,067 88,911 88,097 87,549
Net Worth 163,800 167,107 167,666 172,514 177,226 181,737 Net Financial Worth (21,520) (18,681) (24,638) (23,293) (20,949) (18,112)Net Financial Liabilities 38,476 40,317 46,834 46,307 44,908 43,071 Net Debt 5,120 3,555 10,821 11,075 10,199 9,001
Note:1. Numbers may not add due to rounding.
$ million
2016-17Projection $ million $ million
2014-15Projection $ million $ million
2012-13Est.Actual $ million
Table 8.4General Government Sector Balance Sheet 1
2012-13Budget
2013-14Budget
2015-16Projection
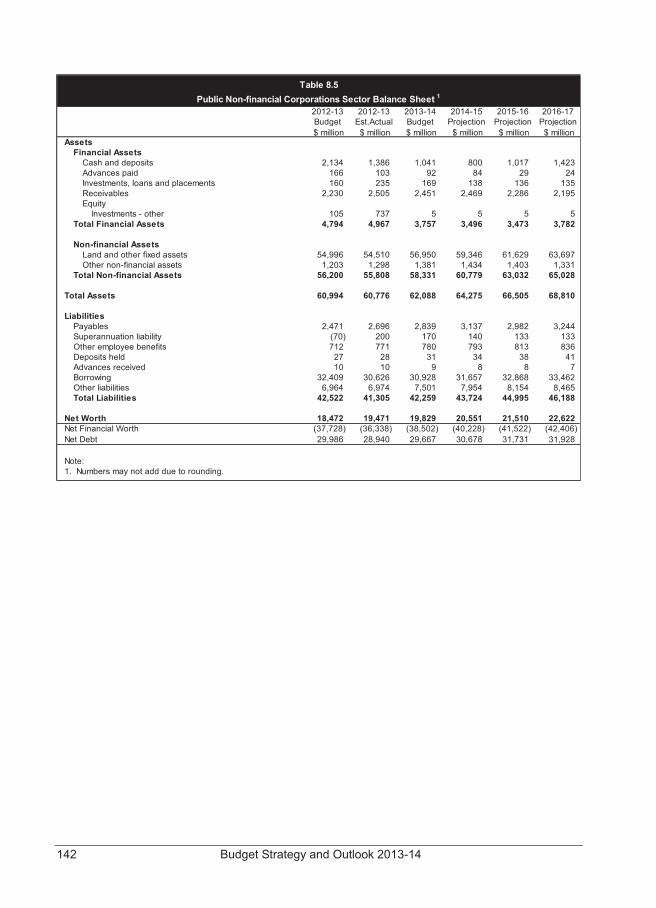
142 Budget Strategy and Outlook 2013-14
Assets Financial Assets
Cash and deposits 2,134 1,386 1,041 800 1,017 1,423 Advances paid 166 103 92 84 29 24 Investments, loans and placements 160 235 169 138 136 135 Receivables 2,230 2,505 2,451 2,469 2,286 2,195 Equity
Investments - other 105 737 5 5 5 5 Total Financial Assets 4,794 4,967 3,757 3,496 3,473 3,782
Non-financial Assets Land and other fixed assets 54,996 54,510 56,950 59,346 61,629 63,697 Other non-financial assets 1,203 1,298 1,381 1,434 1,403 1,331
Total Non-financial Assets 56,200 55,808 58,331 60,779 63,032 65,028
Total Assets 60,994 60,776 62,088 64,275 66,505 68,810
LiabilitiesPayables 2,471 2,696 2,839 3,137 2,982 3,244 Superannuation liability (70) 200 170 140 133 133 Other employee benefits 712 771 780 793 813 836 Deposits held 27 28 31 34 38 41 Advances received 10 10 9 8 8 7 Borrowing 32,409 30,626 30,928 31,657 32,868 33,462 Other liabilities 6,964 6,974 7,501 7,954 8,154 8,465 Total Liabilities 42,522 41,305 42,259 43,724 44,995 46,188
Net Worth 18,472 19,471 19,829 20,551 21,510 22,622 Net Financial Worth (37,728) (36,338) (38,502) (40,228) (41,522) (42,406)Net Debt 29,986 28,940 29,667 30,678 31,731 31,928
Note:1. Numbers may not add due to rounding.
Table 8.5Public Non-financial Corporations Sector Balance Sheet 1
2012-13Budget
2013-14Budget
2015-16Projection
$ million
2014-15Projection $ million $ million
2012-13Est.Actual $ million $ million
2016-17Projection $ million
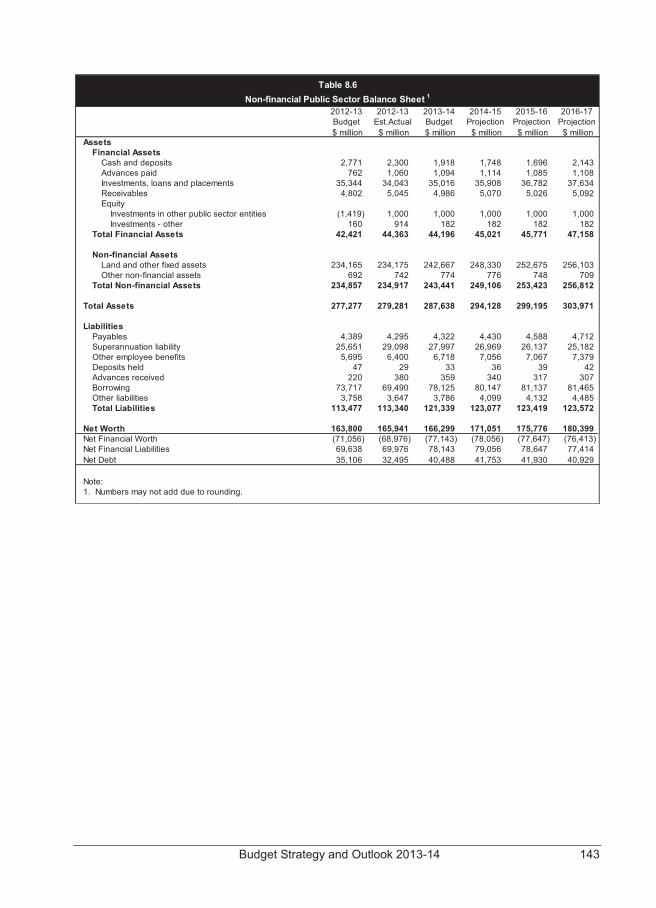
Budget Strategy and Outlook 2013-14 143
Assets Financial Assets
Cash and deposits 2,771 2,300 1,918 1,748 1,696 2,143 Advances paid 762 1,060 1,094 1,114 1,085 1,108 Investments, loans and placements 35,344 34,043 35,016 35,908 36,782 37,634 Receivables 4,802 5,045 4,986 5,070 5,026 5,092 Equity
Investments in other public sector entities (1,419) 1,000 1,000 1,000 1,000 1,000 Investments - other 160 914 182 182 182 182
Total Financial Assets 42,421 44,363 44,196 45,021 45,771 47,158
Non-financial Assets Land and other fixed assets 234,165 234,175 242,667 248,330 252,675 256,103 Other non-financial assets 692 742 774 776 748 709
Total Non-financial Assets 234,857 234,917 243,441 249,106 253,423 256,812
Total Assets 277,277 279,281 287,638 294,128 299,195 303,971
LiabilitiesPayables 4,389 4,295 4,322 4,430 4,588 4,712 Superannuation liability 25,651 29,098 27,997 26,969 26,137 25,182 Other employee benefits 5,695 6,400 6,718 7,056 7,067 7,379 Deposits held 47 29 33 36 39 42 Advances received 220 380 359 340 317 307 Borrowing 73,717 69,490 78,125 80,147 81,137 81,465 Other liabilities 3,758 3,647 3,786 4,099 4,132 4,485 Total Liabilities 113,477 113,340 121,339 123,077 123,419 123,572
Net Worth 163,800 165,941 166,299 171,051 175,776 180,399 Net Financial Worth (71,056) (68,976) (77,143) (78,056) (77,647) (76,413)Net Financial Liabilities 69,638 69,976 78,143 79,056 78,647 77,414 Net Debt 35,106 32,495 40,488 41,753 41,930 40,929
Note:1. Numbers may not add due to rounding.
Table 8.6Non-financial Public Sector Balance Sheet 1
2012-13Budget
2013-14Budget
2015-16Projection
$ million
2014-15Projection $ million $ million
2012-13Est.Actual $ million $ million
2016-17Projection $ million
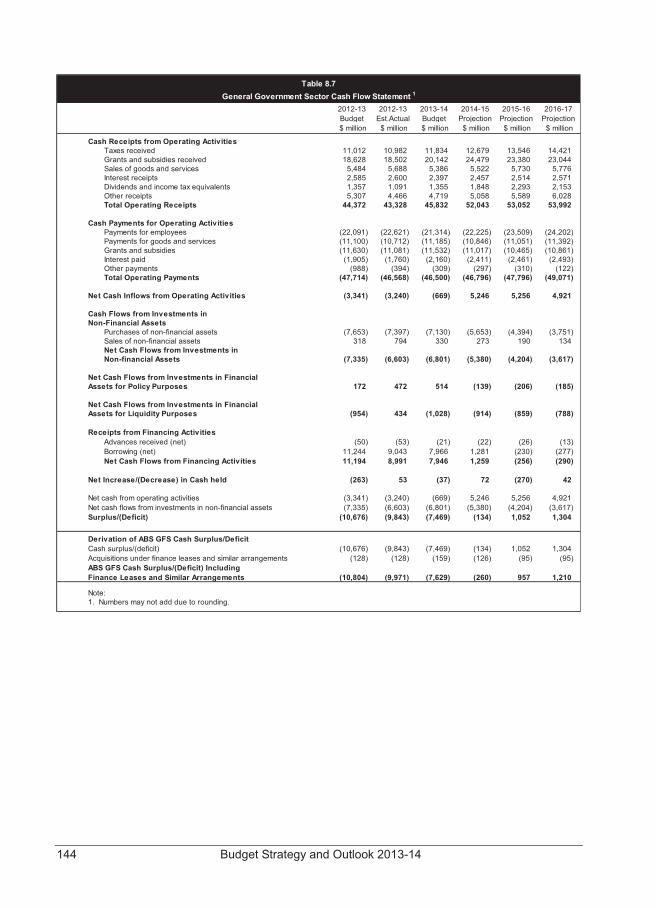
144 Budget Strategy and Outlook 2013-14
Cash Receipts from Operating ActivitiesTaxes received 11,012 10,982 11,834 12,679 13,546 14,421 Grants and subsidies received 18,628 18,502 20,142 24,479 23,380 23,044 Sales of goods and services 5,484 5,688 5,386 5,522 5,730 5,776 Interest receipts 2,585 2,600 2,397 2,457 2,514 2,571 Dividends and income tax equivalents 1,357 1,091 1,355 1,848 2,293 2,153 Other receipts 5,307 4,466 4,719 5,058 5,589 6,028 Total Operating Receipts 44,372 43,328 45,832 52,043 53,052 53,992
Cash Payments for Operating ActivitiesPayments for employees (22,091) (22,621) (21,314) (22,225) (23,509) (24,202)Payments for goods and services (11,100) (10,712) (11,185) (10,846) (11,051) (11,392)Grants and subsidies (11,630) (11,081) (11,532) (11,017) (10,465) (10,861)Interest paid (1,905) (1,760) (2,160) (2,411) (2,461) (2,493)Other payments (988) (394) (309) (297) (310) (122)Total Operating Payments (47,714) (46,568) (46,500) (46,796) (47,796) (49,071)
Net Cash Inflows from Operating Activities (3,341) (3,240) (669) 5,246 5,256 4,921
Cash Flows from Investments in Non-Financial Assets
Purchases of non-financial assets (7,653) (7,397) (7,130) (5,653) (4,394) (3,751)Sales of non-financial assets 318 794 330 273 190 134 Net Cash Flows from Investments in Non-financial Assets (7,335) (6,603) (6,801) (5,380) (4,204) (3,617)
Net Cash Flows from Investments in FinancialAssets for Policy Purposes 172 472 514 (139) (206) (185)
Net Cash Flows from Investments in FinancialAssets for Liquidity Purposes (954) 434 (1,028) (914) (859) (788)
Receipts from Financing ActivitiesAdvances received (net) (50) (53) (21) (22) (26) (13)Borrowing (net) 11,244 9,043 7,966 1,281 (230) (277)Net Cash Flows from Financing Activities 11,194 8,991 7,946 1,259 (256) (290)
Net Increase/(Decrease) in Cash held (263) 53 (37) 72 (270) 42
Net cash from operating activities (3,341) (3,240) (669) 5,246 5,256 4,921 Net cash flows from investments in non-financial assets (7,335) (6,603) (6,801) (5,380) (4,204) (3,617)Surplus/(Deficit) (10,676) (9,843) (7,469) (134) 1,052 1,304
Derivation of ABS GFS Cash Surplus/DeficitCash surplus/(deficit) (10,676) (9,843) (7,469) (134) 1,052 1,304 Acquisitions under finance leases and similar arrangements (128) (128) (159) (126) (95) (95)ABS GFS Cash Surplus/(Deficit) IncludingFinance Leases and Similar Arrangements (10,804) (9,971) (7,629) (260) 957 1,210
Note:1. Numbers may not add due to rounding.
Table 8.7General Government Sector Cash Flow Statement 1
2012-13Budget
2013-14Budget
2015-16Projection
$ million
2014-15Projection $ million $ million
2012-13Est.Actual $ million $ million
2016-17Projection $ million
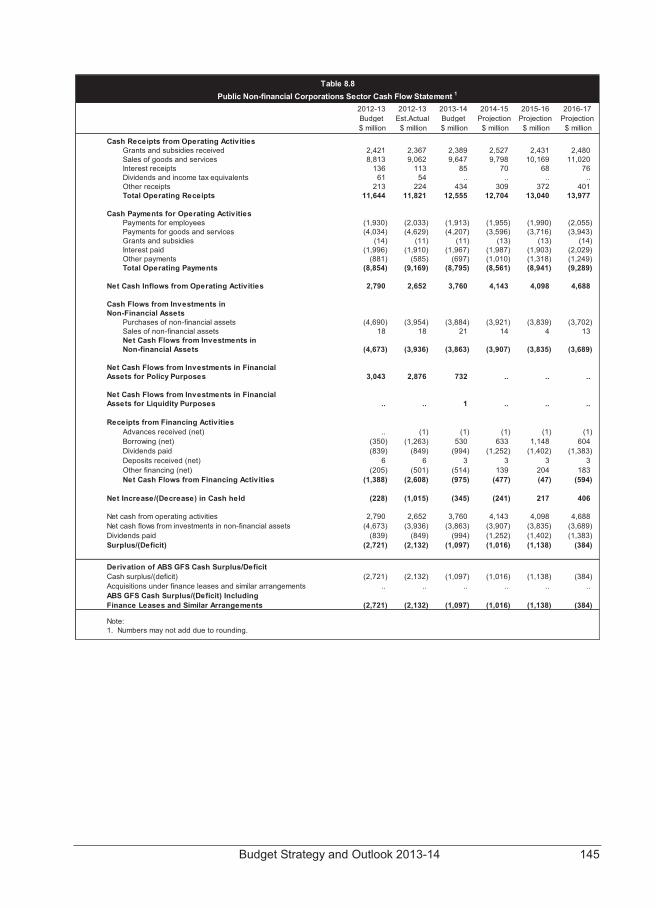
Budget Strategy and Outlook 2013-14 145
Cash Receipts from Operating ActivitiesGrants and subsidies received 2,421 2,367 2,389 2,527 2,431 2,480 Sales of goods and services 8,813 9,062 9,647 9,798 10,169 11,020 Interest receipts 136 113 85 70 68 76 Dividends and income tax equivalents 61 54 .. .. .. .. Other receipts 213 224 434 309 372 401 Total Operating Receipts 11,644 11,821 12,555 12,704 13,040 13,977
Cash Payments for Operating ActivitiesPayments for employees (1,930) (2,033) (1,913) (1,955) (1,990) (2,055)Payments for goods and services (4,034) (4,629) (4,207) (3,596) (3,716) (3,943)Grants and subsidies (14) (11) (11) (13) (13) (14)Interest paid (1,996) (1,910) (1,967) (1,987) (1,903) (2,029)Other payments (881) (585) (697) (1,010) (1,318) (1,249)Total Operating Payments (8,854) (9,169) (8,795) (8,561) (8,941) (9,289)
Net Cash Inflows from Operating Activities 2,790 2,652 3,760 4,143 4,098 4,688
Cash Flows from Investments in Non-Financial Assets
Purchases of non-financial assets (4,690) (3,954) (3,884) (3,921) (3,839) (3,702)Sales of non-financial assets 18 18 21 14 4 13 Net Cash Flows from Investments in Non-financial Assets (4,673) (3,936) (3,863) (3,907) (3,835) (3,689)
Net Cash Flows from Investments in FinancialAssets for Policy Purposes 3,043 2,876 732 .. .. ..
Net Cash Flows from Investments in FinancialAssets for Liquidity Purposes .. .. 1 .. .. ..
Receipts from Financing ActivitiesAdvances received (net) .. (1) (1) (1) (1) (1)Borrowing (net) (350) (1,263) 530 633 1,148 604 Dividends paid (839) (849) (994) (1,252) (1,402) (1,383)Deposits received (net) 6 6 3 3 3 3 Other financing (net) (205) (501) (514) 139 204 183 Net Cash Flows from Financing Activities (1,388) (2,608) (975) (477) (47) (594)
Net Increase/(Decrease) in Cash held (228) (1,015) (345) (241) 217 406
Net cash from operating activities 2,790 2,652 3,760 4,143 4,098 4,688 Net cash flows from investments in non-financial assets (4,673) (3,936) (3,863) (3,907) (3,835) (3,689)Dividends paid (839) (849) (994) (1,252) (1,402) (1,383)Surplus/(Deficit) (2,721) (2,132) (1,097) (1,016) (1,138) (384)
Derivation of ABS GFS Cash Surplus/DeficitCash surplus/(deficit) (2,721) (2,132) (1,097) (1,016) (1,138) (384)Acquisitions under finance leases and similar arrangements .. .. .. .. .. .. ABS GFS Cash Surplus/(Deficit) IncludingFinance Leases and Similar Arrangements (2,721) (2,132) (1,097) (1,016) (1,138) (384)
Note:1. Numbers may not add due to rounding.
$ million
2016-17Projection $ million $ million
2014-15Projection $ million $ million
2012-13Est.Actual $ million
Table 8.8Public Non-financial Corporations Sector Cash Flow Statement 1
2012-13Budget
2013-14Budget
2015-16Projection
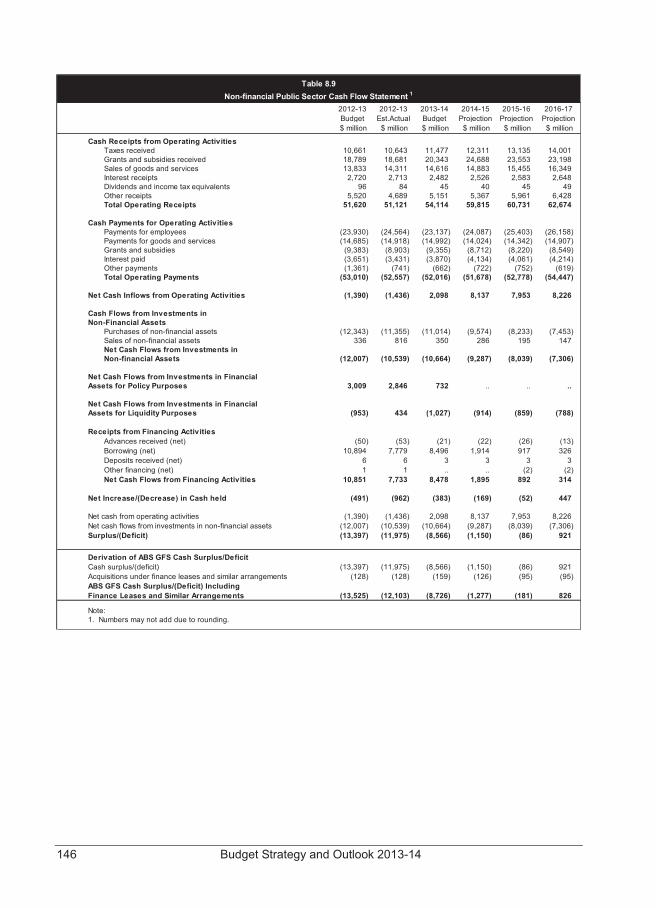
146 Budget Strategy and Outlook 2013-14
Cash Receipts from Operating ActivitiesTaxes received 10,661 10,643 11,477 12,311 13,135 14,001 Grants and subsidies received 18,789 18,681 20,343 24,688 23,553 23,198 Sales of goods and services 13,833 14,311 14,616 14,883 15,455 16,349 Interest receipts 2,720 2,713 2,482 2,526 2,583 2,648 Dividends and income tax equivalents 96 84 45 40 45 49 Other receipts 5,520 4,689 5,151 5,367 5,961 6,428 Total Operating Receipts 51,620 51,121 54,114 59,815 60,731 62,674
Cash Payments for Operating ActivitiesPayments for employees (23,930) (24,564) (23,137) (24,087) (25,403) (26,158)Payments for goods and services (14,685) (14,918) (14,992) (14,024) (14,342) (14,907)Grants and subsidies (9,383) (8,903) (9,355) (8,712) (8,220) (8,549)Interest paid (3,651) (3,431) (3,870) (4,134) (4,061) (4,214)Other payments (1,361) (741) (662) (722) (752) (619)Total Operating Payments (53,010) (52,557) (52,016) (51,678) (52,778) (54,447)
Net Cash Inflows from Operating Activities (1,390) (1,436) 2,098 8,137 7,953 8,226
Cash Flows from Investments in Non-Financial Assets
Purchases of non-financial assets (12,343) (11,355) (11,014) (9,574) (8,233) (7,453)Sales of non-financial assets 336 816 350 286 195 147 Net Cash Flows from Investments in Non-financial Assets (12,007) (10,539) (10,664) (9,287) (8,039) (7,306)
Net Cash Flows from Investments in FinancialAssets for Policy Purposes 3,009 2,846 732 .. .. ..
Net Cash Flows from Investments in FinancialAssets for Liquidity Purposes (953) 434 (1,027) (914) (859) (788)
Receipts from Financing ActivitiesAdvances received (net) (50) (53) (21) (22) (26) (13)Borrowing (net) 10,894 7,779 8,496 1,914 917 326 Deposits received (net) 6 6 3 3 3 3 Other financing (net) 1 1 .. .. (2) (2)Net Cash Flows from Financing Activities 10,851 7,733 8,478 1,895 892 314
Net Increase/(Decrease) in Cash held (491) (962) (383) (169) (52) 447
Net cash from operating activities (1,390) (1,436) 2,098 8,137 7,953 8,226 Net cash flows from investments in non-financial assets (12,007) (10,539) (10,664) (9,287) (8,039) (7,306)Surplus/(Deficit) (13,397) (11,975) (8,566) (1,150) (86) 921
Derivation of ABS GFS Cash Surplus/DeficitCash surplus/(deficit) (13,397) (11,975) (8,566) (1,150) (86) 921 Acquisitions under finance leases and similar arrangements (128) (128) (159) (126) (95) (95)ABS GFS Cash Surplus/(Deficit) IncludingFinance Leases and Similar Arrangements (13,525) (12,103) (8,726) (1,277) (181) 826
Note:1. Numbers may not add due to rounding.
$ million
2016-17Projection $ million $ million
2014-15Projection $ million $ million
2012-13Est.Actual $ million
Table 8.9Non-financial Public Sector Cash Flow Statement 1
2012-13Budget
2013-14Budget
2015-16Projection
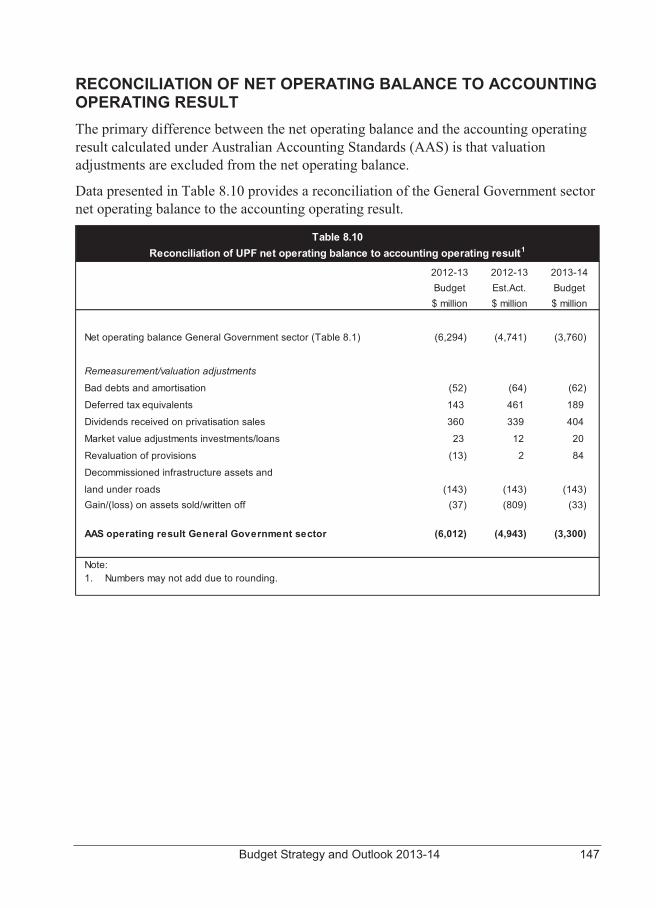
Budget Strategy and Outlook 2013-14 147
RECONCILIATION OF NET OPERATING BALANCE TO ACCOUNTING OPERATING RESULT The primary difference between the net operating balance and the accounting operating result calculated under Australian Accounting Standards (AAS) is that valuation adjustments are excluded from the net operating balance.
Data presented in Table 8.10 provides a reconciliation of the General Government sector net operating balance to the accounting operating result.
2012-13 2012-13 2013-14Budget Est.Act. Budget$ million $ million $ million
Net operating balance General Government sector (Table 8.1) (6,294) (4,741) (3,760)
Remeasurement/valuation adjustments
Bad debts and amortisation (52) (64) (62)
Deferred tax equivalents 143 461 189
Dividends received on privatisation sales 360 339 404
Market value adjustments investments/loans 23 12 20
Revaluation of provisions (13) 2 84
Decommissioned infrastructure assets and
land under roads (143) (143) (143)Gain/(loss) on assets sold/written off (37) (809) (33)
AAS operating result General Government sector (6,012) (4,943) (3,300)
Note:1. Numbers may not add due to rounding.
Table 8.10Reconciliation of UPF net operating balance to accounting operating result1
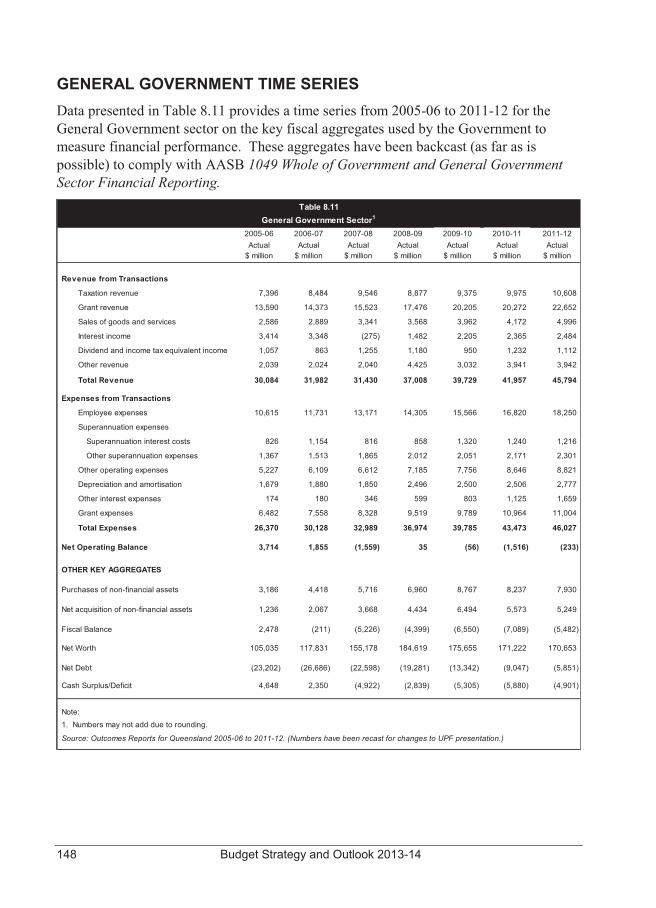
148 Budget Strategy and Outlook 2013-14
GENERAL GOVERNMENT TIME SERIES Data presented in Table 8.11 provides a time series from 2005-06 to 2011-12 for the General Government sector on the key fiscal aggregates used by the Government to measure financial performance. These aggregates have been backcast (as far as is possible) to comply with AASB 1049 Whole of Government and General Government Sector Financial Reporting.
2005-06 2006-07 2007-08 2008-09 2009-10 2010-11 2011-12Actual Actual Actual Actual Actual Actual Actual
$ million $ million $ million $ million $ million $ million $ million
Revenue from Transactions
Taxation revenue 7,396 8,484 9,546 8,877 9,375 9,975 10,608
Grant revenue 13,590 14,373 15,523 17,476 20,205 20,272 22,652
Sales of goods and services 2,586 2,889 3,341 3,568 3,962 4,172 4,996
Interest income 3,414 3,348 (275) 1,482 2,205 2,365 2,484
Dividend and income tax equivalent income 1,057 863 1,255 1,180 950 1,232 1,112
Other revenue 2,039 2,024 2,040 4,425 3,032 3,941 3,942
Total Revenue 30,084 31,982 31,430 37,008 39,729 41,957 45,794
Expenses from Transactions
Employee expenses 10,615 11,731 13,171 14,305 15,566 16,820 18,250
Superannuation expenses
Superannuation interest costs 826 1,154 816 858 1,320 1,240 1,216
Other superannuation expenses 1,367 1,513 1,865 2,012 2,051 2,171 2,301
Other operating expenses 5,227 6,109 6,612 7,185 7,756 8,646 8,821
Depreciation and amortisation 1,679 1,880 1,850 2,496 2,500 2,506 2,777
Other interest expenses 174 180 346 599 803 1,125 1,659
Grant expenses 6,482 7,558 8,328 9,519 9,789 10,964 11,004
Total Expenses 26,370 30,128 32,989 36,974 39,785 43,473 46,027
Net Operating Balance 3,714 1,855 (1,559) 35 (56) (1,516) (233)
OTHER KEY AGGREGATES
Purchases of non-financial assets 3,186 4,418 5,716 6,960 8,767 8,237 7,930
Net acquisition of non-financial assets 1,236 2,067 3,668 4,434 6,494 5,573 5,249
Fiscal Balance 2,478 (211) (5,226) (4,399) (6,550) (7,089) (5,482)
Net Worth 105,035 117,831 155,178 184,619 175,655 171,222 170,653
Net Debt (23,202) (26,686) (22,598) (19,281) (13,342) (9,047) (5,851)
Cash Surplus/Deficit 4,648 2,350 (4,922) (2,839) (5,305) (5,880) (4,901)
Note:1. Numbers may not add due to rounding.
Table 8.11General Government Sector1
Source: Outcomes Reports for Queensland 2005-06 to 2011-12. (Numbers have been recast for changes to UPF presentation.)
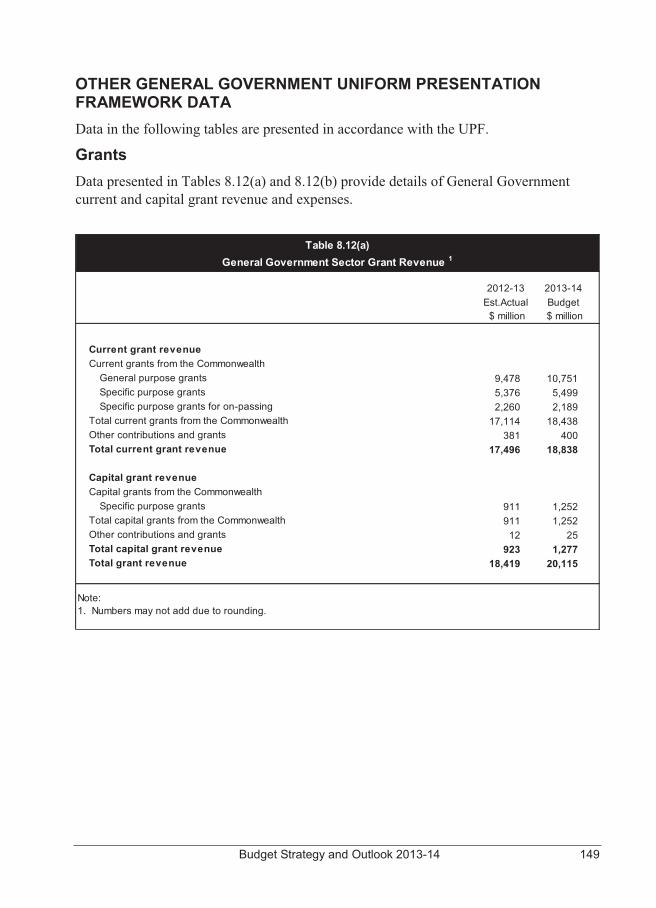
Budget Strategy and Outlook 2013-14 149
OTHER GENERAL GOVERNMENT UNIFORM PRESENTATION FRAMEWORK DATA Data in the following tables are presented in accordance with the UPF.
Grants Data presented in Tables 8.12(a) and 8.12(b) provide details of General Government current and capital grant revenue and expenses.
2012-13 2013-14Est.Actual Budget $ million $ million
Current grant revenueCurrent grants from the Commonwealth
General purpose grants 9,478 10,751 Specific purpose grants 5,376 5,499 Specific purpose grants for on-passing 2,260 2,189
Total current grants from the Commonwealth 17,114 18,438 Other contributions and grants 381 400 Total current grant revenue 17,496 18,838
Capital grant revenueCapital grants from the Commonwealth
Specific purpose grants 911 1,252 Total capital grants from the Commonwealth 911 1,252 Other contributions and grants 12 25 Total capital grant revenue 923 1,277 Total grant revenue 18,419 20,115
Note:1. Numbers may not add due to rounding.
Table 8.12(a)General Government Sector Grant Revenue 1
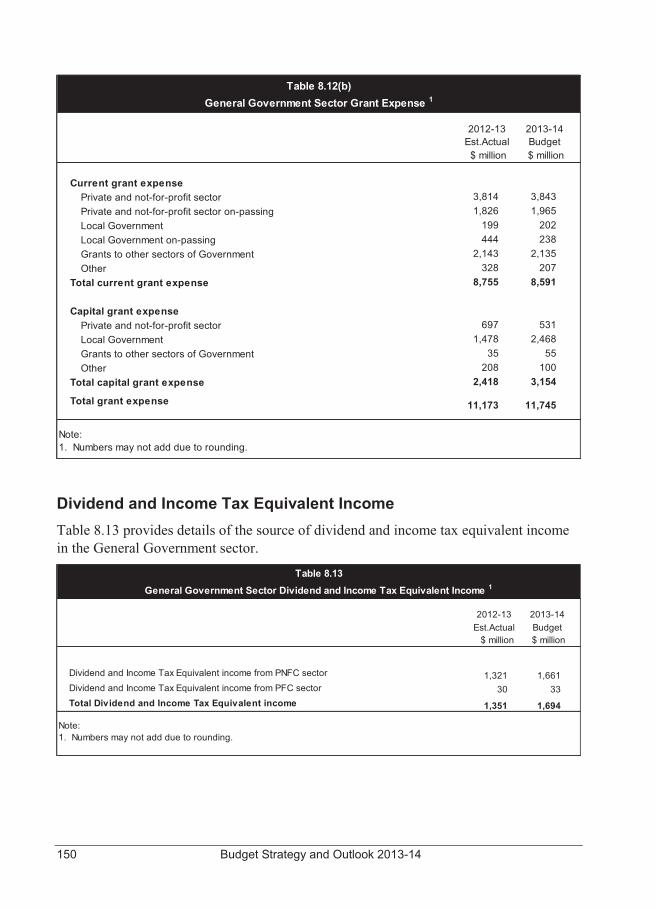
150 Budget Strategy and Outlook 2013-14
Dividend and Income Tax Equivalent Income Table 8.13 provides details of the source of dividend and income tax equivalent income in the General Government sector.
2012-13 2013-14Est.Actual Budget $ million $ million
Current grant expensePrivate and not-for-profit sector 3,814 3,843 Private and not-for-profit sector on-passing 1,826 1,965 Local Government 199 202 Local Government on-passing 444 238 Grants to other sectors of Government 2,143 2,135 Other 328 207
Total current grant expense 8,755 8,591
Capital grant expensePrivate and not-for-profit sector 697 531 Local Government 1,478 2,468 Grants to other sectors of Government 35 55 Other 208 100
Total capital grant expense 2,418 3,154
Total grant expense 11,173 11,745
Note:1. Numbers may not add due to rounding.
Table 8.12(b)General Government Sector Grant Expense 1
Table 8.13General Government Sector Dividend and Income Tax Equivalent Income 1
2012-13 2013-14Est.Actual Budget
$ million
Dividend and Income Tax Equivalent income from PNFC sector 1,321 1,661 Dividend and Income Tax Equivalent income from PFC sector 30 33 Total Dividend and Income Tax Equivalent income 1,351 1,694
Note:1. Numbers may not add due to rounding.
$ million
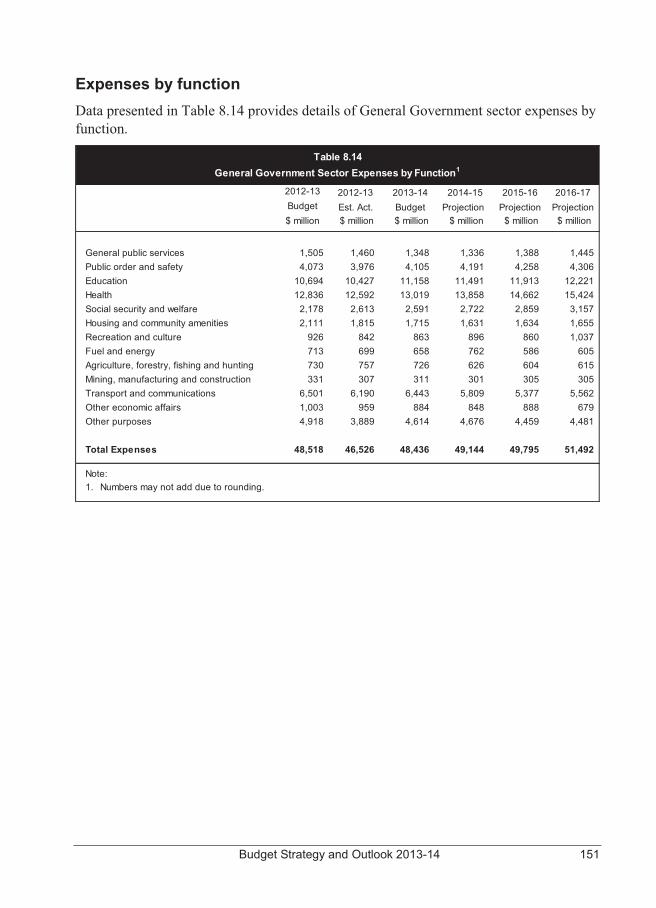
Budget Strategy and Outlook 2013-14 151
Expenses by function Data presented in Table 8.14 provides details of General Government sector expenses by function.
2012-13 2016-17Budget Projection Projection$ million $ million
General public services 1,505 1,460 1,348 1,336 1,388 1,445 Public order and safety 4,073 3,976 4,105 4,191 4,258 4,306 Education 10,694 10,427 11,158 11,491 11,913 12,221 Health 12,836 12,592 13,019 13,858 14,662 15,424 Social security and welfare 2,178 2,613 2,591 2,722 2,859 3,157 Housing and community amenities 2,111 1,815 1,715 1,631 1,634 1,655 Recreation and culture 926 842 863 896 860 1,037 Fuel and energy 713 699 658 762 586 605 Agriculture, forestry, fishing and hunting 730 757 726 626 604 615 Mining, manufacturing and construction 331 307 311 301 305 305 Transport and communications 6,501 6,190 6,443 5,809 5,377 5,562 Other economic affairs 1,003 959 884 848 888 679 Other purposes 4,918 3,889 4,614 4,676 4,459 4,481
Total Expenses 48,518 46,526 48,436 49,144 49,795 51,492
Note:1. Numbers may not add due to rounding.
Table 8.14General Government Sector Expenses by Function1
2012-13 2013-14 2014-15 2015-16
$ millionProjection $ million
Est. Act. $ million
Budget $ million
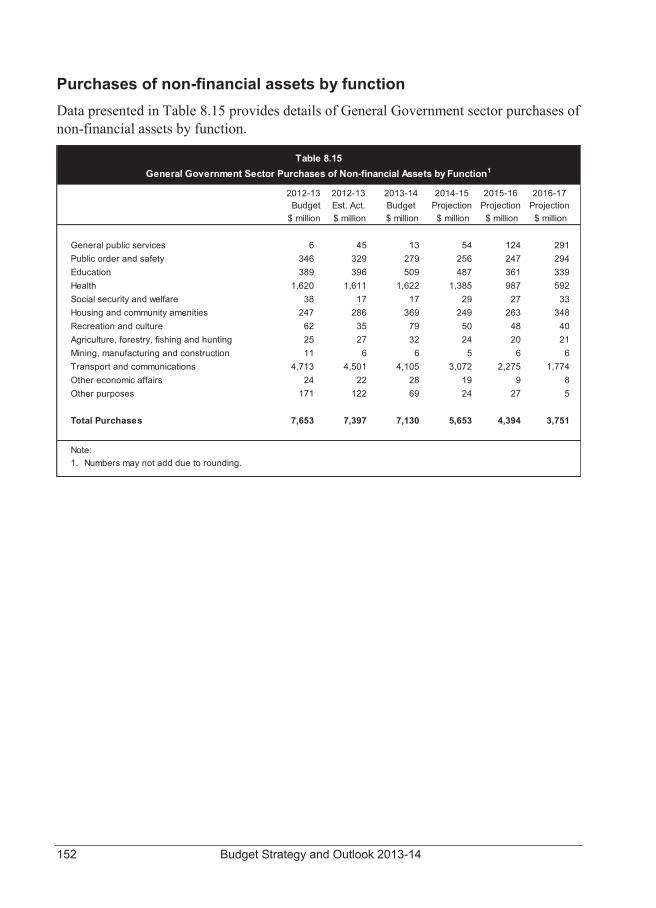
152 Budget Strategy and Outlook 2013-14
Purchases of non-financial assets by function Data presented in Table 8.15 provides details of General Government sector purchases of non-financial assets by function.
2016-17Projection $ million
General public services 6 45 13 54 124 291 Public order and safety 346 329 279 256 247 294 Education 389 396 509 487 361 339 Health 1,620 1,611 1,622 1,385 987 592 Social security and welfare 38 17 17 29 27 33 Housing and community amenities 247 286 369 249 263 348 Recreation and culture 62 35 79 50 48 40 Agriculture, forestry, fishing and hunting 25 27 32 24 20 21 Mining, manufacturing and construction 11 6 6 5 6 6 Transport and communications 4,713 4,501 4,105 3,072 2,275 1,774 Other economic affairs 24 22 28 19 9 8 Other purposes 171 122 69 24 27 5
Total Purchases 7,653 7,397 7,130 5,653 4,394 3,751
Note:1. Numbers may not add due to rounding.
$ million
Table 8.15General Government Sector Purchases of Non-financial Assets by Function1
2012-13Est. Act.
2014-15Projection
2012-13Budget
$ million
2015-16Projection $ million $ million
2013-14Budget
$ million
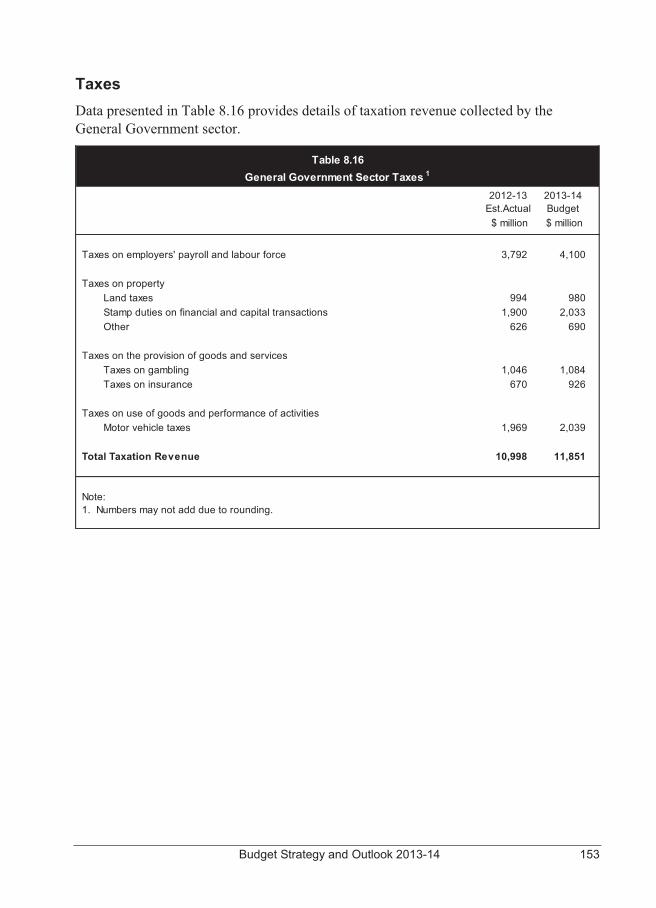
Budget Strategy and Outlook 2013-14 153
Taxes Data presented in Table 8.16 provides details of taxation revenue collected by the General Government sector.
Taxes on employers' payroll and labour force 3,792 4,100
Taxes on property Land taxes 994 980 Stamp duties on financial and capital transactions 1,900 2,033 Other 626 690
Taxes on the provision of goods and services Taxes on gambling 1,046 1,084 Taxes on insurance 670 926
Taxes on use of goods and performance of activities Motor vehicle taxes 1,969 2,039
Total Taxation Revenue 10,998 11,851
Note:1. Numbers may not add due to rounding.
$ million
Table 8.16General Government Sector Taxes 1
2013-14Budget
2012-13Est.Actual
$ million
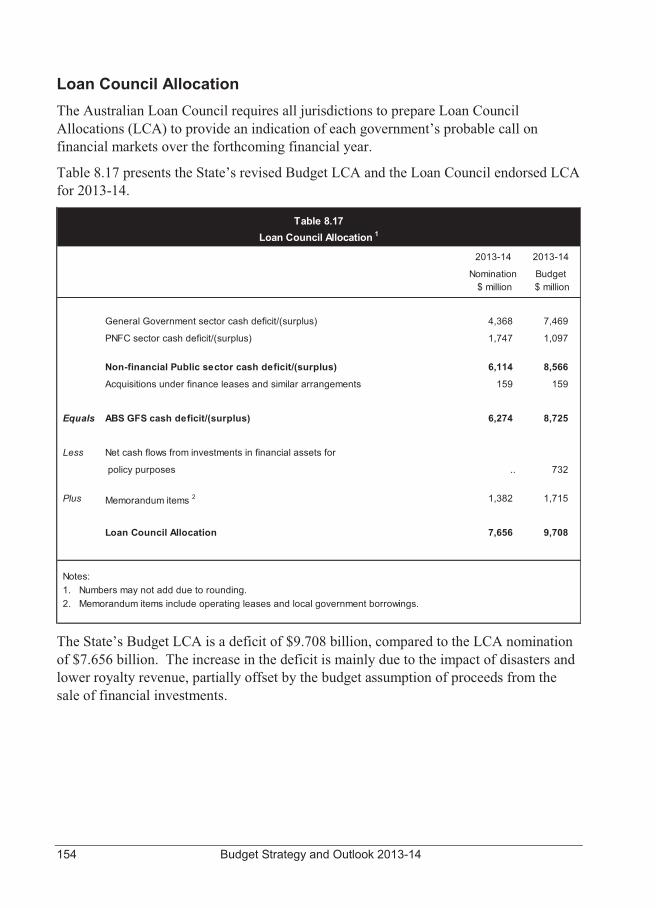
154 Budget Strategy and Outlook 2013-14
Loan Council Allocation The Australian Loan Council requires all jurisdictions to prepare Loan Council Allocations (LCA) to provide an indication of each government’s probable call on financial markets over the forthcoming financial year.
Table 8.17 presents the State’s revised Budget LCA and the Loan Council endorsed LCA for 2013-14.
The State’s Budget LCA is a deficit of $9.708 billion, compared to the LCA nomination of $7.656 billion. The increase in the deficit is mainly due to the impact of disasters and lower royalty revenue, partially offset by the budget assumption of proceeds from the sale of financial investments.
General Government sector cash deficit/(surplus) 4,368 7,469
PNFC sector cash deficit/(surplus) 1,747 1,097
Non-financial Public sector cash deficit/(surplus) 6,114 8,566
Acquisitions under finance leases and similar arrangements 159 159
Equals ABS GFS cash deficit/(surplus) 6,274 8,725
Less Net cash flows from investments in financial assets for
policy purposes .. 732
Plus Memorandum items 2 1,382 1,715
Loan Council Allocation 7,656 9,708
Notes:1. Numbers may not add due to rounding.2. Memorandum items include operating leases and local government borrowings.
$ million
Table 8.17Loan Council Allocation 1
2013-14
Nomination
2013-14
$ millionBudget
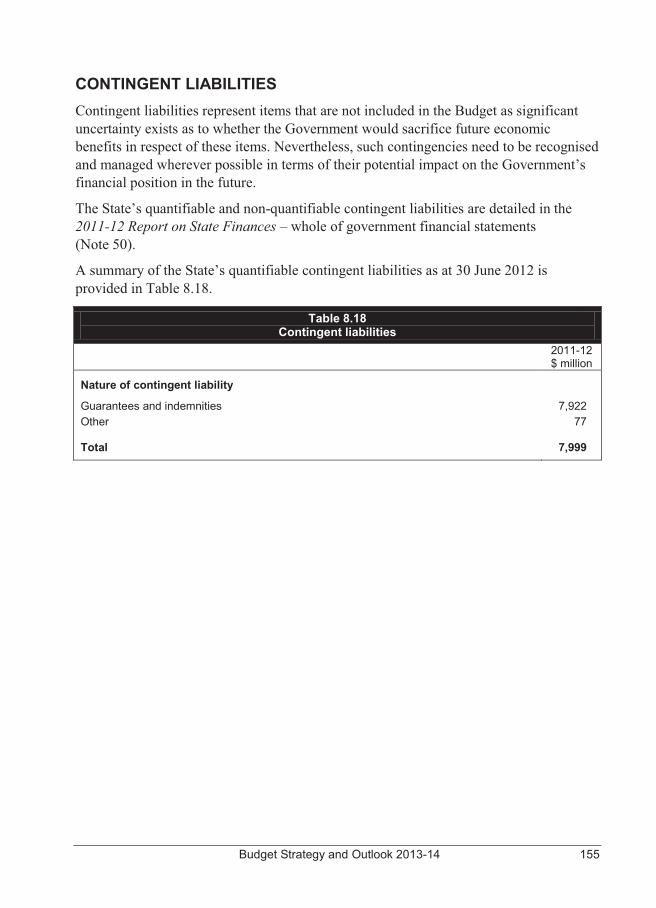
Budget Strategy and Outlook 2013-14 155
CONTINGENT LIABILITIES Contingent liabilities represent items that are not included in the Budget as significant uncertainty exists as to whether the Government would sacrifice future economic benefits in respect of these items. Nevertheless, such contingencies need to be recognised and managed wherever possible in terms of their potential impact on the Government’s financial position in the future.
The State’s quantifiable and non-quantifiable contingent liabilities are detailed in the 2011-12 Report on State Finances – whole of government financial statements (Note 50).
A summary of the State’s quantifiable contingent liabilities as at 30 June 2012 is provided in Table 8.18.
Table 8.18 Contingent liabilities
2011-12 $ million
Nature of contingent liability
Guarantees and indemnities Other
7,922 77
Total 7,999
156 Budget Strategy and Outlook 2013-14
BACKGROUND AND INTERPRETATION OF UNIFORM PRESENTATION FRAMEWORK As mentioned in the introduction to this chapter, the UPF was reviewed in 2007 following the release of the AASB new accounting standard, AASB 1049 Whole of Government and General Government Sector Financial Reporting.
This standard aims to harmonise Government Finance Statistics (GFS) and Generally Accepted Accounting Principles (GAAP) with the objective of improving the clarity and transparency of government financial statements.
Accrual Government Finance Statistics framework The GFS reporting framework, developed by the Australian Bureau of Statistics (ABS), is based on international statistical standards (the International Monetary Fund Manual on Government Finance Statistics and the United Nations System of National Accounts). This allows comprehensive assessments to be made of the economic impact of government.
The accrual GFS framework is based on an integrated recording of stocks and flows. Stocks refer to a unit’s holdings of assets, liabilities and net worth at a point in time, whilst flows represent the movement in the stock of assets and liabilities between two points in time. Flows comprise two separate types, transactions and other economic flows. Transactions come about as a result of mutually agreed interactions between units or within a single unit. Other economic flows would include revaluations and destruction or discovery of assets that do not result from a transaction. In GFS operating statements, other economic flows, being outside of the control of government, are excluded and do not affect the net operating balance or fiscal balance.
Generally Accepted Accounting Principles In addition to the GFS framework, public sector entities were previously required to report at year end against AAS 31 Financial Reporting by Government, which meant complying with the Accounting Standards issued by the AASB.
Budget Strategy and Outlook 2013-14 157
Harmonisation under AASB 1049 This dual reporting regime caused confusion for financial report users and the Financial Reporting Council asked the AASB to develop a framework harmonising GAAP and GFS and to issue an Australian accounting standard for a single set of government reports.
In the development of AASB 1049, the AASB adopted the following approaches:
� adoption of GAAP definition, recognition and measurement principles in almost all cases
� amending presentation requirements to encompass a comprehensive result that retains GAAP classification system but overlays it with a transactions and other economic flows classification system based on GFS
� expanding the disclosure requirements to incorporate key fiscal aggregates required by GFS.
Revisions to the Uniform Presentation Framework Following the introduction of AASB 1049, the Australian, state and territory governments consider that the UPF will continue to be an important framework for ensuring comparability of financial information across jurisdictions. There are a number of important areas where the UPF provides either additional information or clearer guidance on the preparation of government financial statements to that of AASB 1049. For example, the Australian, state and territory governments agree that net debt, a fiscal indicator not required by the standard, continues to be an important indicator in transparent budget reporting and should continue to be presented on the face of the financial statements as a fiscal aggregate. Further, the UPF shall continue to apply to financial statements produced by government in budgets, mid-year budget updates and final budget outcome reports, whereas the accounting standard applies only to outcome reports.
Therefore, rather than replacing the UPF with the accounting standard, the framework was updated to align with AASB 1049. Australian, state and territory governments agreed that the updated framework would continue to provide a common core of comparable financial information in their budget papers and comparable data amongst jurisdictions while maintaining at least the current level of transparency.
Aligning the framework with AASB 1049 was not intended to create a UPF that complies with all the reporting requirements of AASB 1049. For example, the UPF does not include the same level of detail in relation to disclosure requirements as AASB 1049. Instead, the revised UPF allows jurisdictions to utilise the framework as the base set of statements and add additional relevant information in order to comply with AASB 1049.
158 Budget Strategy and Outlook 2013-14
SECTOR CLASSIFICATION
GFS data is presented by institutional sector, distinguishing between the General Government sector and the PNFC sector.
Budget reporting focuses on the General Government sector, which provides regulatory services and goods and services of a non-market nature that are provided at less than cost or at no cost. These services are largely financed by general revenue (Australian Government grants and state taxation). This sector comprises government departments, their commercialised business units/shared service providers and certain statutory bodies.
The PNFC sector comprises bodies that provide mainly market goods and services that are of a non-regulatory and non-financial nature. PNFCs are financed through sales to consumers of their goods and services and may be supplemented by explicit government subsidy to satisfy community service obligations. In general, PNFCs are legally distinguishable from the governments that own them. Examples of PNFCs include the energy entities and Queensland Rail.
Together, the General Government sector and the PNFC sector comprise the Non-financial Public sector.
Further discussion of the GFS framework of reporting, including definitions of GFS terms, can be obtained from the webpage of the Australian Bureau of Statistics at www.abs.gov.au.
Budget Strategy and Outlook 2013-14 159
REPORTING ENTITIES The reporting entities included in the General Government and PNFC sectors in these Budget papers are provided below.
General Government Departments
Aboriginal and Torres Strait Islander and The Public Trustee of Queensland Multicultural Affairs Tourism, Major Events, Small Business and Agriculture, Fisheries and Forestry the Commonwealth Games Communities, Child Safety and Disability Transport and Main Roads Services Community Safety Education, Training and Employment Commercialised Business Units Electoral Commission of Queensland Building and Asset Services (Project Services Energy and Water Supply and QBuild to merge on 30 June 2013) Environment and Heritage Protection CITEC Housing and Public Works Goprint (ceased 28 February 2013) Justice and Attorney-General QFleet Legislative Assembly RoadTek Local Government, Community SDS (ceased 28 February 2013) Recovery and Resilience National Parks, Recreation, Sport and Shared Service Providers Racing Corporate Administration Agency Natural Resources and Mines Queensland Shared Services Office of the Governor Office of the Ombudsman Premier and Cabinet Public Service Commission Queensland Audit Office Queensland Health Queensland Police Service Queensland Treasury and Trade Science, Information Technology, Innovation and the Arts State Development, Infrastructure and Planning
160 Budget Strategy and Outlook 2013-14
Statutory Authorities
Anti-Discrimination Commission Legal Aid Queensland Australian Agricultural College Library Board of Queensland Corporation Motor Accident Insurance Commission Board of the Queensland Museum Nominal Defendant City North Infrastructure Pty Ltd Office of the Information Commissioner Commission for Children and Young People Prostitution Licensing Authority
and Child Guardian Queensland Art Gallery Board of Trustees
Crime and Misconduct Commission Queensland Building Services Authority Economic Development Queensland (Property Queensland Future Growth Corporation Services Group and Urban Land Development Queensland Mental Health Commission Authority merged on 1 February 2013) Queensland Performing Arts Trust Gold Coast 2018 Commonwealth Games Queensland Reconstruction Authority Corporation Queensland Rural Adjustment Authority Gold Coast Institute of TAFE Queensland Studies Authority Gold Coast Waterways Authority Residential Tenancies Authority Health Quality and Complaints Commission South Bank Corporation Hospital and Health Services Southbank Institute of Technology Cairns and Hinterland The Council of the Queensland Institute of Cape York Medical Research Central Queensland Tourism and Events Queensland Central West Translink Transit Authority (ceased 31 Children’s Health Queensland December 2012) Darling Downs Workers’ Compensation Regulatory Gold Coast Authority (Q-Comp) Mackay Metro North Metro South North West South West Sunshine Coast Torres Strait and Northern Peninsula Townsville West Moreton Wide Bay
Budget Strategy and Outlook 2013-14 161
Public Non-financial Corporations Brisbane Port Holdings Pty Ltd CS Energy Ltd DBCT Holdings Pty Ltd Energex Ltd Ergon Energy Corporation Limited Far North Queensland Ports Corporation Limited Gladstone Area Water Board Gladstone Ports Corporation Limited Mount Isa Water Board North Queensland Bulk Ports Corporation Limited Port of Townsville Limited Powerlink Queensland Qld Airport Holdings (Cairns) Pty Ltd Qld Airport Holdings (Mackay) Pty Ltd Queensland Bulk Water Supply Authority (Seqwater) Queensland Bulk Water Transport Authority (ceased 31 December 2012) Queensland Lottery Corporation Pty Ltd Queensland Rail Queensland Treasury Holdings Pty Ltd SEQ Water Grid Manager (ceased 31 December 2012) Stadiums Queensland Stanwell Corporation Limited SunWater Limited The Trustees of Parklands Gold Coast

162 Budget Strategy and Outlook 2013-14
Budget Strategy and Outlook 2013-14 163
APPENDIX A – TAX EXPENDITURE STATEMENT
OVERVIEW Governments employ a range of policy tools to achieve social and economic objectives. These include the use of direct budgetary outlays, regulatory mechanisms and taxation. This Tax Expenditure Statement (TES) details revenue foregone as a result of Government decisions relating to the provision of tax exemptions or concessions. The TES is designed to improve transparency in the use of tax expenditures and increase public understanding of the fiscal process.
Tax expenditures are reductions in tax revenue that result from the use of the taxation system as a policy tool to deliver Government policy objectives. Tax expenditures are provided through a range of measures, including:
� tax exemptions
� the application of reduced tax rates to certain groups or sectors of the community
� tax rebates
� tax deductions
� provisions which defer payment of a tax liability to a future period.
Labelling an exemption or concession as a tax expenditure does not necessarily imply any judgement as to its appropriateness. It merely makes the amount of the exemption or concession explicit and thereby facilitates its scrutiny as part of the annual Budget process.
Methodology Revenue foregone approach The method used almost exclusively by governments to quantify the value of their tax expenditures is the revenue foregone approach. This method estimates the revenue foregone through use of the concession by applying the benchmark rate of taxation to the volume of activities or assets affected by the concession. One of the deficiencies of the revenue foregone approach is that the effect on taxpayer behaviour resulting from the removal of the particular tax expenditure is not factored into the estimate. Consequently, the aggregation of costings for individual tax expenditure items presented in the TES will not necessarily provide an accurate estimate of the total level of assistance provided through tax expenditures.
164 Budget Strategy and Outlook 2013-14
Measuring tax expenditures requires the identification of:
� a benchmark tax base
� concessionally taxed components of the benchmark tax base such as a specific activity or class of taxpayer
� a benchmark tax rate to apply to the concessionally taxed components of the tax base.
Defining the tax benchmark The most important step in the preparation of a TES is the establishment of a benchmark for each tax included in the statement. The benchmark provides a basis against which each tax concession can be evaluated. The aim of the benchmark is to determine which concessions are tax expenditures as opposed to structural elements of the tax. The key features of a tax benchmark are:
� the tax rate structure
� any specific accounting conventions applicable to the tax
� the deductibility of compulsory payments
� any provisions to facilitate administration
� provisions relating to any fiscal obligations.
By definition, tax expenditures are those tax concessions not included as part of the tax benchmark.
Identification of benchmark revenue bases and rates requires a degree of judgement and is not definitive. Furthermore, data limitations mean that the tax expenditures are approximations and are not exhaustive. This statement does not include estimates of revenue foregone from exemptions or concessions provided to Government agencies. Very small exemptions or concessions are also excluded.
THE TAX EXPENDITURE STATEMENT This year’s statement includes estimates of tax expenditures in 2011-12 and 2012-13 for payroll tax, land tax, duties and gambling taxes. A summary of the major tax expenditures valued on the basis of revenue foregone is presented in Table A.1. Not all expenditures can be quantified at this time. Accordingly, the total value of tax expenditures should be considered as indicative only.
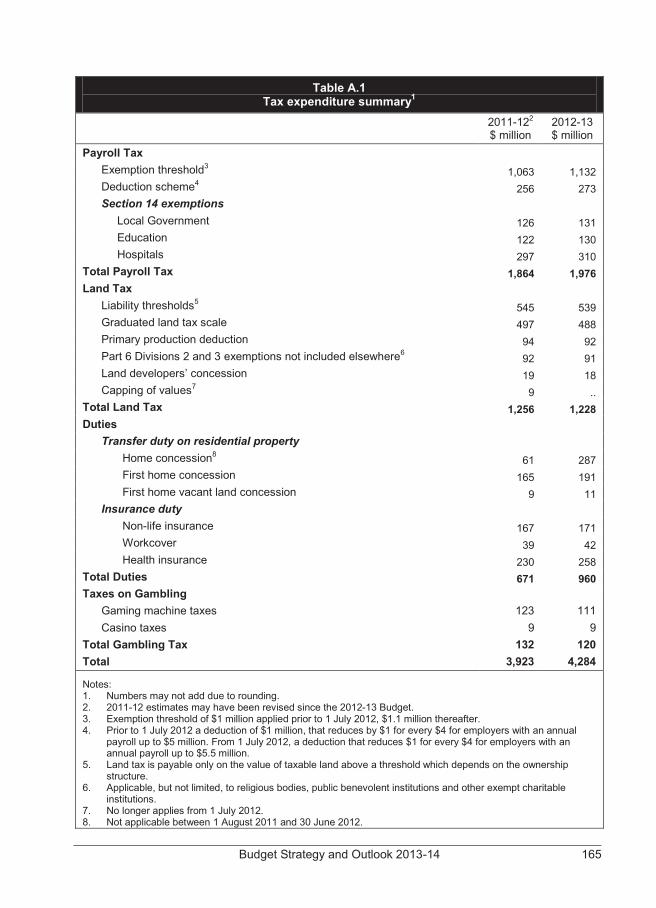
Budget Strategy and Outlook 2013-14 165
Table A.1
Tax expenditure summary1
2011-122 $ million
2012-13 $ million
Payroll Tax Exemption threshold3 1,063 1,132 Deduction scheme4 256 273 Section 14 exemptions Local Government 126 131 Education 122 130 Hospitals 297 310
Total Payroll Tax 1,864 1,976 Land Tax
Liability thresholds5 545 539 Graduated land tax scale 497 488 Primary production deduction 94 92 Part 6 Divisions 2 and 3 exemptions not included elsewhere6 92 91 Land developers’ concession 19 18 Capping of values7 9 ..
Total Land Tax 1,256 1,228 Duties
Transfer duty on residential property Home concession8 61 287 First home concession 165 191 First home vacant land concession 9 11
Insurance duty Non-life insurance 167 171 Workcover 39 42 Health insurance 230 258
Total Duties 671 960 Taxes on Gambling
Gaming machine taxes 123 111 Casino taxes 9 9
Total Gambling Tax 132 120 Total 3,923 4,284
Notes: 1. Numbers may not add due to rounding. 2. 2011-12 estimates may have been revised since the 2012-13 Budget. 3. Exemption threshold of $1 million applied prior to 1 July 2012, $1.1 million thereafter. 4. Prior to 1 July 2012 a deduction of $1 million, that reduces by $1 for every $4 for employers with an annual
payroll up to $5 million. From 1 July 2012, a deduction that reduces $1 for every $4 for employers with an annual payroll up to $5.5 million.
5. Land tax is payable only on the value of taxable land above a threshold which depends on the ownership structure.
6. Applicable, but not limited, to religious bodies, public benevolent institutions and other exempt charitable institutions.
7. No longer applies from 1 July 2012. 8. Not applicable between 1 August 2011 and 30 June 2012.
166 Budget Strategy and Outlook 2013-14
DISCUSSION OF INDIVIDUAL TAXES Payroll tax The benchmark tax base for payroll tax is assumed to be all wages, salaries and supplements (including employer superannuation contributions) paid in Queensland, as defined in the Payroll Tax Act 1971. The benchmark tax rate for payroll tax is assumed to be the statutory rate applying in each financial year.
Payroll tax exemption threshold Employers who employ in Queensland with an annual Australian payroll of $1.1 million or less are exempt from payroll tax ($1 million prior to 1 July 2012). On the basis of 2012-13 average weekly earnings, this threshold corresponded to approximately 15 full-time equivalent employees. This exemption is designed to assist small and medium sized businesses.
Deduction scheme Employers who employed in Queensland with Australian payrolls between $1.1 million and $5.5 million benefited from a deduction of $1.1 million, which reduced by $1 for every $4 by which the annual payroll exceeded $1.1 million. The deduction is pro-rated for interstate wages. There was no deduction for employers or groups that had an annual payroll in excess of $5.5 million.
Section 14 exemptions A number of organisations are provided with exemptions from payroll tax under Section 14 of the Payroll Tax Act 1971. The activities for which estimates have been calculated are wages paid by public hospitals, non-tertiary private educational institutions and local governments (excluding commercial activities).
Land tax The benchmark tax base is assumed to be all freehold land within Queensland, excluding residential land used as a principal place of residence and land owned by individuals with a value for that year below the threshold. The benchmark tax rate for land tax is assumed to be the top rate of land tax applicable in Queensland in each financial year.
Liability thresholds Land tax is payable on the value of taxable land equal to or above a threshold which depends on the land’s ownership. The threshold for companies, trusts and absentees is $350,000 and for resident individuals the threshold is $600,000.
Budget Strategy and Outlook 2013-14 167
Land owned by resident individuals as their principal place of residence is excluded from the estimate. The exemption from paying below a minimum amount is not included as a tax expenditure as it is regarded as the application of an administration threshold.
Graduated land tax scale A graduated (concessional) scale of land tax rates is applicable to land with a taxable value of less than $5 million for resident individuals and companies, trustees and absentees. The benchmark rates used for estimating the tax expenditures were 1.75% for individuals and 2.0% for companies, trustees and absentees.
Primary production deduction The taxable value of land owned by a resident individual, trustee or some absentees and companies does not include all or part of their land that is used for the business of agriculture, pasturage or dairy farming.
Part 6 Divisions 2 and 3 exemptions (not elsewhere included) A number of land tax exemptions are granted in Part 6 Divisions 2 and 3 of the Land Tax Act 2010 to eligible organisations. These include, but are not limited to, public benevolent institutions, religious institutions and other exempt charitable institutions, retirement villages, trade unions and showgrounds.
Land developers’ concession From 1 July 1998, land tax payable by land developers has been worked out on the basis that the unimproved value of (undeveloped) land subdivided in the previous financial year and which remains unsold at 30 June of that year is 60% of the Valuer-General’s value. This concession is outlined in Section 30 of the Land Tax Act 2010.
Land Tax – Capping of Land Values Land tax is levied on the unimproved value of the landowner’s aggregated holdings of freehold land owned in Queensland as at midnight on 30 June each year. A 50% cap on the annual increase in land values used for the purpose of calculating land tax liabilities applied between 1 July 2007 and 30 June 2012.
Transfer duty concession on residential property The benchmark tax base is assumed to be all sales of residential property within Queensland. The benchmark tax scale is assumed to be the scale that actually applied in each financial year.
168 Budget Strategy and Outlook 2013-14
Home concession A concessional rate of duty applies to purchases of a principal place of residence. This concession was not available between 1 August 2011 and 30 June 2012 but was reinstated on 1 July 2012 in accordance with the incoming Government’s election commitment. A 1% concessional rate applies on dutiable values up to $350,000, rather than the normal schedule of rates between 1.5% and 3.5%. For properties valued over $350,000, the scheduled rates of transfer duty apply on the excess.
First home concession Where a purchaser has not previously owned a residence in Queensland or elsewhere, the purchaser of a home receives a more generous concession on duty. This concession comprises a rebate in addition to the home concession on properties (this concession may not be applicable if the purchase price is less than the full market value of the property). The size of the rebate depends on the value of the property. A full concession is provided to purchases of a first principal place of residence valued up to $500,000.
First home vacant land concession A first home concession is available for the purchase of certain vacant land up to the value of $400,000, with a full concession available on certain vacant land up to the value of $250,000.
Insurance duty The benchmark tax base is assumed to be all premiums for general insurance policies (not for life insurance). The benchmark tax scale is assumed to be the scale that actually applied in each financial year.
The rate of duty applicable to most types of general insurance is 7.5%. Concessional rates apply to some other general insurance types (5% for motor vehicle insurance other than compulsory third party (CTP), workers’ compensation and professional indemnity insurance and 10c on a premium for CTP insurance). Data limitations mean that these insurance types are categorised into non-life insurance cover and WorkCover. An exemption from duty is also provided for private health insurance.
The rate of duty applicable to general insurance will increase to 9% from 1 August 2013.
Budget Strategy and Outlook 2013-14 169
Gambling taxes Gaming machine tax concessions for licensed clubs The benchmark tax base is assumed to be all gaming machines operated by licensed clubs and hotels in Queensland. The benchmark tax rate is assumed to be the highest marginal tax rate (as is applied to hotels) that actually applied in each financial year.
A progressive tax rate scale applies to gaming machines operated by licensed clubs. The tax rate is calculated monthly on the gaming machine taxable metered win and the top tax rate is only applied to the portion of gaming machine revenue where the monthly metered win exceeds $1.4 million for any licensed club.
Casino tax concessions The benchmark tax base is assumed to be all casinos operating in Queensland. The benchmark tax rate is assumed to be the highest tax rate that is actually applied in each financial year.
A tax rate of 20% of gross revenue applies for standard transactions in the Brisbane and Gold Coast casinos. A concessional tax rate of 10% applies for gross revenue from standard transactions in the Cairns and Townsville casinos. The tax rate applicable to gaming machines in casinos is 30% of gross revenue in Brisbane and Gold Coast casinos and 20% in the Cairns and Townsville casinos.
In addition concessional rates of 10% also apply for revenue from high rollers in all casinos. A GST credit is provided to casinos that approximates a reduction in the above tax rates of 9.09%.

170 Budget Strategy and Outlook 2013-14
Budget Strategy and Outlook 2013-14 171
APPENDIX B – REVENUE AND EXPENSE ASSUMPTIONS AND SENSITIVITY ANALYSIS
The Queensland Budget, like those of other states, is based in part on assumptions made about future elements of uncertainty, both internal and external to the State, which can impact directly on economic and fiscal forecasts.
This appendix outlines the assumptions underlying the revenue and expense estimates and analyses the sensitivity of the estimates to changes in the economic and other assumptions. This analysis is provided to enhance the level of transparency and accountability of the Government.
The forward estimates in the Budget are framed on a no policy change basis. That is, the expenditure and revenue policies in place at the time of the Budget (including those announced in the Budget) are applied consistently throughout the forward estimates period.
The following discussion provides details of some of the key assumptions, estimates and risks associated with revenue and expenditure and, where a direct link can be established, the indicative impact on forecasts resulting from a movement in those variables.
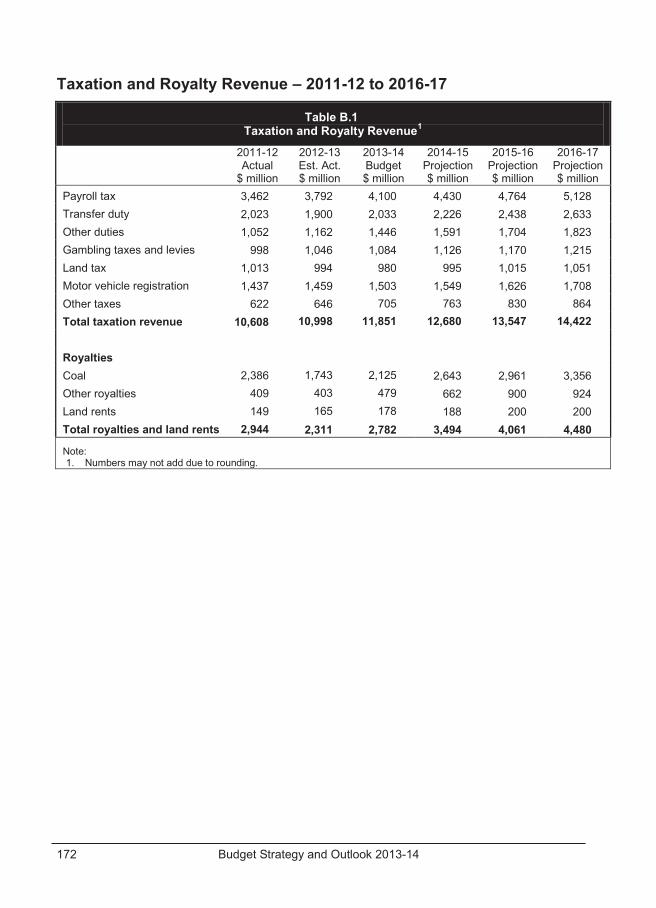
Budget Strategy and Outlook 2013-14 172
Taxation and Royalty Revenue – 2011-12 to 2016-17
Table B.1 Taxation and Royalty Revenue1
2011-12 Actual
$ million
2012-13 Est. Act. $ million
2013-14 Budget $ million
2014-15 Projection $ million
2015-16 Projection $ million
2016-17 Projection $ million
Payroll tax 3,462 3,792 4,100 4,430 4,764 5,128 Transfer duty 2,023 1,900 2,033 2,226 2,438 2,633 Other duties 1,052 1,162 1,446 1,591 1,704 1,823 Gambling taxes and levies 998 1,046 1,084 1,126 1,170 1,215 Land tax 1,013 994 980 995 1,015 1,051 Motor vehicle registration 1,437 1,459 1,503 1,549 1,626 1,708 Other taxes 622 646 705 763 830 864 Total taxation revenue 10,608 10,998 11,851 12,680 13,547 14,422 Royalties Coal 2,386 1,743 2,125 2,643 2,961 3,356 Other royalties 409 403 479 662 900 924 Land rents 149 165 178 188 200 200 Total royalties and land rents 2,944 2,311 2,782 3,494 4,061 4,480
Note: 1. Numbers may not add due to rounding.
Budget Strategy and Outlook 2013-14 173
TAXATION REVENUE ASSUMPTIONS AND REVENUE RISKS The rate of growth in tax revenues is dependent on a range of factors that are linked to the rate of growth in economic activity in the State. Some taxes are closely related to activity in specific sectors of the economy, whilst others are broadly related to the general rate of economic growth, employment, inflation and wages. A change in the level of economic activity, resulting from economic growth differing from forecast levels, would impact upon a broad range of taxation receipts.
Wages and employment growth – payroll tax collections Wages and employment growth have a direct impact on payroll tax collections. The Budget assumptions are for an increase in wages of 3½% and an increase in employment of 2¼% in 2013-14. The composition of the payroll tax base is also important. If sectors that are in the tax base are expected to grow more strongly than the average of the economy this delivers additional revenue.
A one percentage point variation in either Queensland wages growth or employment would change payroll tax collections by approximately $41 million in 2013-14.
Transfer duty estimates For 2013-14, transfer duty collections are expected to grow by approximately 7% on the 2012-13 estimated actual, which is lower than 2011-12 due to the reinstatement of the principal place of residence concession.
This forecast is predicated on a continuation of the increase in residential property market volumes experienced in 2012-13, supported by historically low borrowing costs and a stabilisation in house prices, somewhat moderated by restrained levels of activity in the non-residential property sector. Across the forward estimates period, modest house price growth is expected to provide further support for transfer duty collections, while non-residential sector activity is expected to gradually improve in response to increased levels of employment and economic activity.
A one percentage point variation in either the average value of property transactions or the volume of transactions would change transfer duty collections by approximately $20 million in 2013-14.
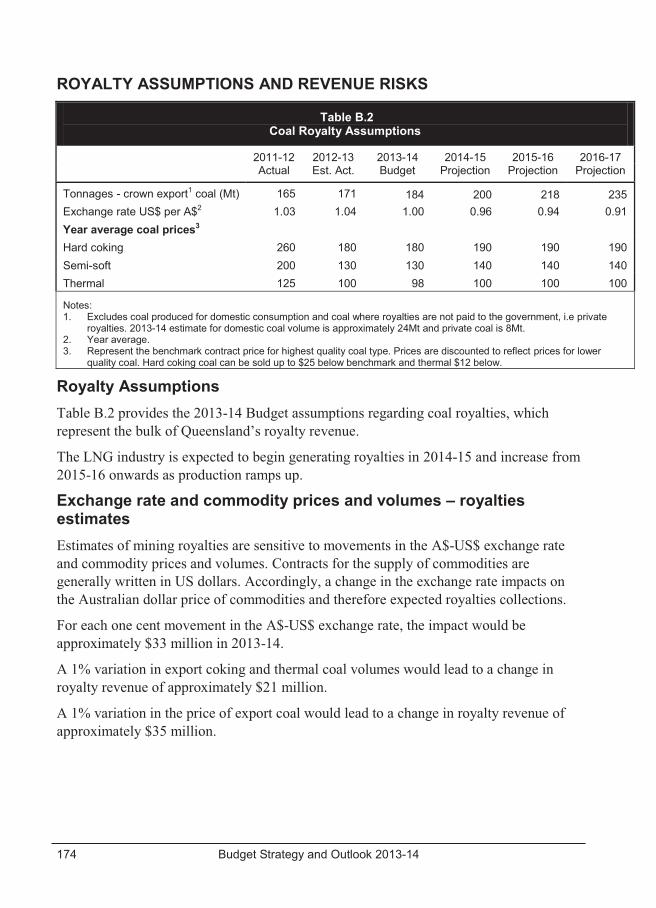
Budget Strategy and Outlook 2013-14 174
ROYALTY ASSUMPTIONS AND REVENUE RISKS
Table B.2 Coal Royalty Assumptions
2011-12 Actual
2012-13 Est. Act.
2013-14 Budget
2014-15 Projection
2015-16 Projection
2016-17 Projection
Tonnages - crown export1 coal (Mt) 165 171 184 200 218 235 Exchange rate US$ per A$2 1.03 1.04 1.00 0.96 0.94 0.91 Year average coal prices3 Hard coking 260 180 180 190 190 190 Semi-soft 200 130 130 140 140 140 Thermal 125 100 98 100 100 100
Notes: 1. Excludes coal produced for domestic consumption and coal where royalties are not paid to the government, i.e private
royalties. 2013-14 estimate for domestic coal volume is approximately 24Mt and private coal is 8Mt. 2. Year average. 3. Represent the benchmark contract price for highest quality coal type. Prices are discounted to reflect prices for lower
quality coal. Hard coking coal can be sold up to $25 below benchmark and thermal $12 below.
Royalty Assumptions Table B.2 provides the 2013-14 Budget assumptions regarding coal royalties, which represent the bulk of Queensland’s royalty revenue.
The LNG industry is expected to begin generating royalties in 2014-15 and increase from 2015-16 onwards as production ramps up.
Exchange rate and commodity prices and volumes – royalties estimates Estimates of mining royalties are sensitive to movements in the A$-US$ exchange rate and commodity prices and volumes. Contracts for the supply of commodities are generally written in US dollars. Accordingly, a change in the exchange rate impacts on the Australian dollar price of commodities and therefore expected royalties collections.
For each one cent movement in the A$-US$ exchange rate, the impact would be approximately $33 million in 2013-14.
A 1% variation in export coking and thermal coal volumes would lead to a change in royalty revenue of approximately $21 million.
A 1% variation in the price of export coal would lead to a change in royalty revenue of approximately $35 million.
Budget Strategy and Outlook 2013-14 175
Parameters influencing Australian Government GST payments to Queensland The Queensland Budget incorporates the estimates of GST revenue grants to Queensland made by the Australian Government, based on its estimates of national GST collections and Queensland’s share. The estimates of collections are primarily determined by the value of consumption subject to GST.
Since the Australian Government payments are based on the amount actually collected, it is Queensland’s Budget that bears the risks of fluctuations in GST collections. As with all other tax estimates, there is a risk of lower collections than estimated if economic growth and consumption are weaker than expected.
Due to the complexities associated with the GST base, the information provided in the Australian Government Budget Papers is not sufficient to prepare indicative forecasts of the sensitivity of GST estimates to key variables.
Budget Strategy and Outlook 2013-14 176
SENSITIVITY OF EXPENDITURE ESTIMATES AND EXPENDITURE RISKS Public sector wage costs Salaries and wages form a large proportion of General Government operating expenses. Increases in salaries and wages are negotiated through enterprise bargaining agreements.
The 2013-14 Budget and forward estimates includes funding for wage increases as per existing agreements and reflect the Government's wages policy where outcomes are yet to be finalised.
A general 1% increase in wage outcomes in a particular year would increase expenses by around $200 million to $250 million per annum.
Interest rates The General Government sector has a total debt servicing cost estimated at $2.2 billion in 2013-14.
The current average duration of General Government debt is between five and six years. The majority of General Government debt is held under fixed interest rates and therefore the impact of interest rate variations on debt servicing costs in 2013-14 would be relatively modest, with the impact occurring progressively across the forward estimates.
Actuarial estimates of superannuation and long service leave Liabilities for superannuation and long service leave are estimated by the State Actuary with reference to, among other things, assumed rates of investment returns, salary growth, inflation and discount rate. These liabilities are therefore subject to changes in these parameters. Similarly, the long service leave liabilities are subject to the risk that the actual rates of employee retention will vary from those assumed in the liability calculation.
While these impacts have been estimated and allowances made in the Budget and forward estimates to accommodate them, the actual outcome may differ from the estimates calculated for the Budget.
Demographic and demand based risks Unforeseen changes in the size, location and composition of Queensland’s population can impact on the demand for goods and services and therefore on the cost of maintaining existing policies. This is particularly evident in the health, education, community services and criminal justice sectors.
Budget Strategy and Outlook 2013-14 177
State government expenditure is often more closely associated with socio-demographic factors, such as the number of school age children or the number of elderly residents, than with economic activity. However, such changes are unlikely to impact significantly in the short term.
For this reason, the composition, size and location of the State’s population are more significant in projecting the State’s expenditure needs across the forward estimates period than for the current or budget year.

Budget Strategy and Outlook 2013-14 178

State Budget 2013–14 Budget Strategy and Outlook Budget Paper No.2 www.budget.qld.gov.au

Great state. Great opportunity.
State Budget 2013-14
Budget Strategy and OutlookBudget Paper No.2
State Budget 2013-14 Budget Strategy and Outlook
Budget Paper No.2
State Budget 2013–14 Budget Strategy and Outlook Budget Paper No.2 www.budget.qld.gov.au