Embed Size (px)
Citation preview
1992MINERAL AND PETROLEUM PRODUCTION: "STATISTICAL DIGEST
Royalties and Policy Development Division
DEPARTMENT OF MINERALS AND ENERGYWESTERN AUSTRALIA

690E EEE 6 [9 :~IVNOI~LVN~t~/3d~690~ EEE (60) :~qll~SDVaI
90[~ EEE 6 [9 :’IVNOIJ,VNEI3J2~90[ ~ EEE (60) :3NOHd3q3~L
~009 VAk HJ~tEfd ASV~t
&EIEt~I&S N[IV’Id 00[
~SFIOH "IV~I~INIIA!
NOISIAI(1 J~N~IIAIdOqRA~IG
hDIqOd GNV SBIJ~qVhO~I
Z66I
NIOI~LDFI(IOHd IAIFIH’-IOH£Xd OhIV
’-IVHXNII~ dO £SHDIO "IVDI£SI£V£S
V I-I VI:118 fi V R 8:118:1~
-101N3~1E~’d3(]
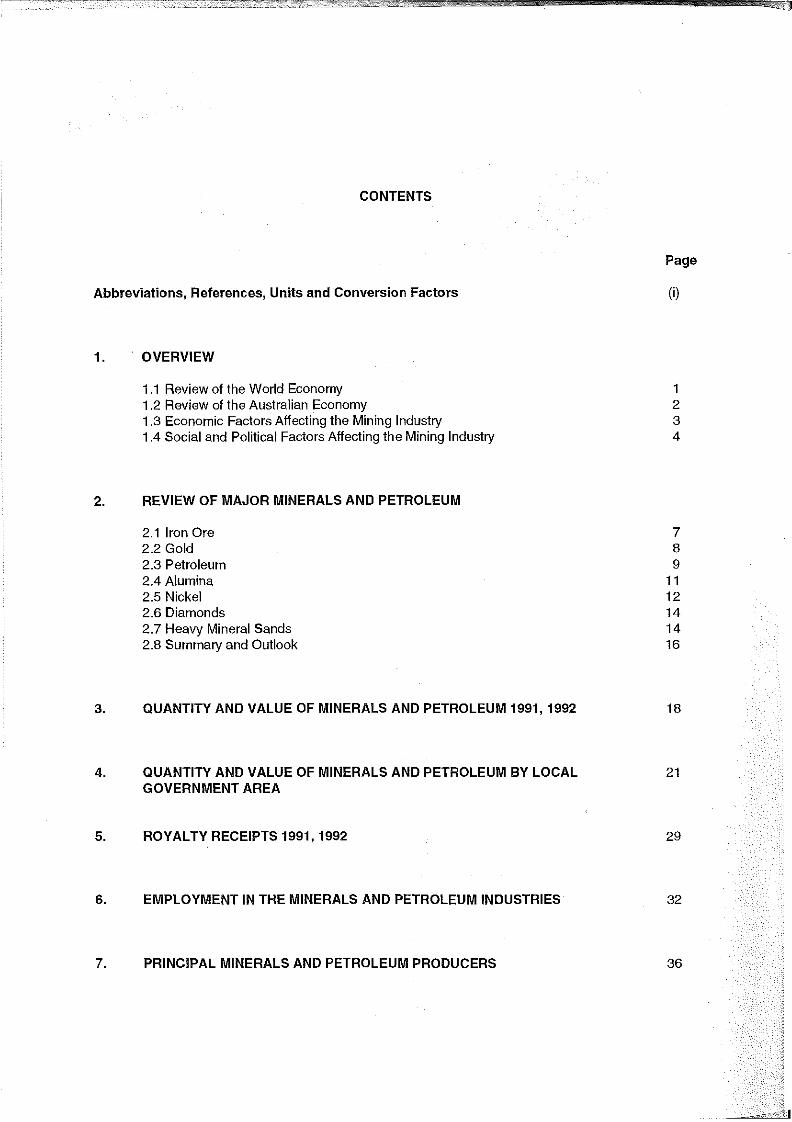
CONTENTS
Abbreviations, References, Units and Conversion Factors
Page
(i)
1. OVERVIEW
1.1 Review of the World Economy1.2 Review of the Australian Economy1.3 Economic Factors Affecting the Mining Industry1.4 Social and Political Factors Affecting the Mining Industry
1234
2= REVIEW OF MAJOR MINERALS AND PETROLEUM
2.1 Iron Ore 72.2 Gold 82.3 Petroleum 92.4 Alumina 112.5 Nickel 122.6 Diamonds 142.7 Heavy Mineral Sands 142.8 Summary and Outlook 16
3= QUANTITY AND VALUE OF MINERALS AND PETROLEUM 1991, 1992
QUANTITY AND VALUE OF MINERALS AND PETROLEUM BY LOCALGOVERNMENT AREA
ROYALTY RECEIPTS 1991, 1992
EMPLOYMENT IN THE MINERALS AND PETROLEUM INDUSTRIES
21
32
7. PRINCIPAL MINERALS AND PETROLEUM PRODUCERS 36

L661- ’986L S..Ldl30=IEI A/’IV).,OEI 3AI.J.VEIVd~O0L’g
;~66L ’L86L NOI/OQ(3OEId 40 3fqqVA =IAIJ.VEIVd~O06L’~
NOI/OIq(3OE~d 9/IN’q ~-118L’Z
X:IaNI :lOl}gd SGN’¢S ’IVEJ3Nli, N ).,AV=IH
3rI-IVA ~’ NOIJ.Of]qOEId AqEr:I/EIVRO :IJ.IN3RIql 91.;;
NOI I OlqaOEId q:blOlN
S:IOIEId I:INOIN
.3/qqVA ~’ NOIJ.OrlaoEIcl AIN3J.EJVIqO q=I~OIN 81-;~
NOI I OIq(3OEIcl VNI~n’IV ~L’~
S:lOIEJd "¢NI~rI’IV I. 1-’~
EinqVA ~ NOIZOnaONd ,kIEI::I/EIVNO VNIV’,In-IV0 I-’~
NOIlOnqo~cl ~n3-1ol:ll:id6~
=:IN-IV^ ~’ NOllOn(]ol:id .,~-l~::lll:ivn~ qJ.V~N=I(]NO0 ~’ -II0J_’~
NOIlOndOEId (3qOE)98
S301EIcl GIOE)£7~
=INqVA ~ NOI/ONC]OEIct A"IEI3/EIVIqO 070~9
NOIJ.OIq(3OE~c1380 NOEJl
S301EIcl 3EIO NOEII
3¢)-1V^ ~ NOI.J.OnaOEId ),-IEI:U.NVIqO 380 NOEII
"�IlVlgJ.Sf]V NEI3..LS3~ NI S.J.OE]POEId Ihln3"lOEJ.J.3cl GNV qVEI3NIIAI EIOI"VlAI~ I-
Stq$/V$ :E]J.VEI 3E)NVHOX3I.’
6~
8L
831EI18fq(]NI ~r1370EI13d GNV S7VEI’=INll/’,,I 3H1 NI/N::IIAI),,O7dlAIE] L’9
;~661-’~-66L SlcIIE]O3EI .,k.J.7V,kOEI
V3EIV 1N’:IIAINEI3^O E)"]VO0"] A8 ~llq370EI13cl (]NV S7VN3NlIAI ::10 3R7VA ON’v" ),,ll/NVIqO L’t~
~66 L ’L66 L Ihllq3"lOEJ£3d GNV $"IVN3NI~ .40 3=q"lVA QNV A£1.LNVRO

ABBREVIATIONS, REFERENCES, UNITS AND CONVERSION FACTORS
As the following document makes use of abbreviations and references, an explanation of each has beenincluded below. A conversion table, relating the units by which various commodities are measured, hasalso been provided.
ABBREVIATIONS
cons concentrates f.o.t, free on truck
f.o.b, free on board n.a. not available
f.o.r, free on rail n.ap. not applicable
REFERENCES
(a)(b)(c)
(d)(e)(f)
(g)(h)(i)(J)(k)
Not available for publication.Estimated f.o.b value.Metallic by-product of nickel mining.Value based on the average Australian Value of Alumina as published by the by the AustralianBureau of Statistics.Value at works.Estimated ex-mine value.Value based on monthly production and average gold price of that month as supplied by theGold Producers’ Association.Estimated f.o.t value.Estimated f.o.b value.Estimated f.o.b value based on the current price of nickel containing products.Delivered value.Metallic by-product of copper mining.
UNITS AND CONVERSION FACTORSConversion factors
Metric Unit Symbol Imperial Unit MultiplyImperialUnit by
Mass gram g troy (fine) ounce (oz) 31.103522kilogram kg pound (Ib) 0.453592
tonne t long ton (2,240 Ibs) 1.016046tonne t short ton (2,000 Ibs) 0.907185
Volume kilolitre kl barrel (bbl) 6.28981
kilolitre kl cubic metre (m3) 1
Energy gigajoule GJ million million British Themal units (mmBTu) 1.055072
Prefix kilo (k) 103mega (M) 106giga (G) 109tera (T) 1012peta (P) 1015
NW Shelf Gas
1 TCF = 1082 petajoules1 Mt = 54 petajoules
MultiplyMetricUnit by
0.0321512.2046240.9842071.102311
0.158987
0.947803

"~O!lod fdeleuouJ uo SLl!eLueJ s!seqdLuaeql q6noql ’6u!sseJ6oJd s! ~Luouooa o!~souJopaql aielnuJ!is o; peu6!sep e6e~loed 6u!puads
leOS!t pouueld V "~uJouooe eql eA!AeJo] ~JoJJe ue u! £66L ~lJea u! se;eJ ]saJe~u!le!O!JJo pesee ~tue8 leJ~ueo esauede~, aq/¯ uo!~eS!leUO!|eJ ]o po!Jed e o6Jepun se!ueduJoose sessoI qo! Jeq~Jnj ~o le!lua~odq]!M ’%£’~ punoJe 1o q]~oJ6/~peals Joj s! 866 ~u! XuJouooe esauede~ eql Joj )tOOl;no oq$
¯ ~uJouooe O!~seLuop oq| Jo o;e]s u!elJaouneql 6u!]oal]aJ u~op a JaM spoo6 JeLUnSUOO puese!l!pouJ~uoo )tlnq jo slJoduJI "popJoooJ set~snldJns s;ueuJ~ed jo eoueleq pJooaJ eeq~ jo enleA q6!q eql pue ~uJouooa o!~sauJops,uedep u! uJn~ui~op eq~ el!dsec] "lueuJ~olduJe6u!Jnloe~nueuJ u! ;no-e)leqS e u! pellnseJpue Jee/~ eq; 6u!Jnp Ile~ ~uebu|se^u! ssau!snqe:le^!sd ~eu ’pueuJep o!~saLuop 6U!lle~
"4o;dns~lueq pug lqap aleJodJoojo SleAeI q6!q /£q peleqsaoexe 6u!eq s!jo IIV ’q~oJ6 ]Jodxe pug sao!Jd eJeqs ’senle^~]JadoJd u! eU!lOep eql 4q pele!;!u! ’eouep!~uoojeuJnsuoo jo >ioeI leJeua6 e /~q pes!JeloeJeqos! duJnls aq.L"s!s!Jo ~6seue ~Z6 I-aqi eou!s ~uJouooe esaued~[, eqi u! uJnl-u~opeJaAes |soLu eq; s! s!q_L "~66~ jo puespJe/~o] ~lqeao!|ou peu!loep/~uJouooe s,ueder,
eq~ uo xel peseq peoJq ~eu e q]!t~ peu!qu~oo
’pasodoJd eJe sexel leUOsJed pue /~ueduJoou! saseeJouI ’d(]~ jo %£’£ Jo uJnuue Jed
UO!ll!q 00S SI35 ~1~ueJJno s! l!o!jep lUOUJUJeAODSIq eq/ "lqap o!lqnd Srl e6nq eql u!-u!oJoi ~6e;eJls uJjal uJn!peuJ e pasodoJd uo]u!lOiuap!seJd ’~O!lod o!uJouooe s,uo!]eJis!u!uJpesno!AeJd eql uJoJ] ~et~e aAOUJ iueo!J!U6!S e uI
¯suo!~e!io6eu .LLVD 6u[o6uo]o punoJ Xen6nJ~ aql o~ uo!snlouoo e jo edoqpet~eueJ s6u!Jq ]ueuJeeJ6e eq.I. ’O:1 aq~ pue
sa]elS pol!ucI ett~ ueei~]eq peqoeeJ ]uoLuee~l~eapeJ] ~eu eqi e;!dsep ’uo!]eJls!u!uJpvuolu!lO aql LUOJ] pe6JeuJe tustuo!loeloJdapeJ~Ja|eaJ6~o su6!s ~lJea euJoS
"sele~S pei!ufq eq] u! eoeld6U!){e:l 3! /£tOAOOOJ Ssalqo[ e leqi aouep!^a6uoJ;s s! eJoq/ "]uo!o!jja oJouJ euJoooqo| JnoAeapue ue u! s~soo ~no se!uedtuooJo[euJ se ]uaLu~oldtuaun jo SlaAeI JeLI6!Llu[ pe]lnseJ 6u!Jn|onJ:lSeJ eq/ ’sa[ueduJooJo[euJ ~q uo!pnpoJ lqap Jo uJeJ6oJde pue 6u!Jnpn,lseJ fdlsnpu! ~o po!Jed ~qi6uaIe Je]Je ~66~- 6u!Jnp su!e6 ’Jelnoepedsunj! ’p!lo$ epeuJ ~Luouooe ,se]e;S pel!ul-I aq±
"uo!feJ eq~ o; :lueuJ],SaAU!pue epeJ~ plJoM p snooJ aql u! ]J!qs lueo!;!u6!se u! peilnseJ s!q_L"q~oJ6 o!uJouooa~o SleAeI q6!q pJooeJ ol penu!luoo AlleJeue6
e!sV ~se3 qlnos jo suo!leu pos!le!J;snpu!~l~aU pue eJnleuJ eql ’~seJluoo uI
l!o!]op leOS!j eqi uo ~toel~eue ]o ]ueuoduJoo e OSle aJe eJni!puedxe o!lqndo] s|no le!~,ue]sqns "slon~ ~o ~ue]uoo ~6Jeua
,’(uJouoo3 Pl,~ONt eq~. =1.o tae[^eN I.’1.
Nt=qAI:I3AO "I.
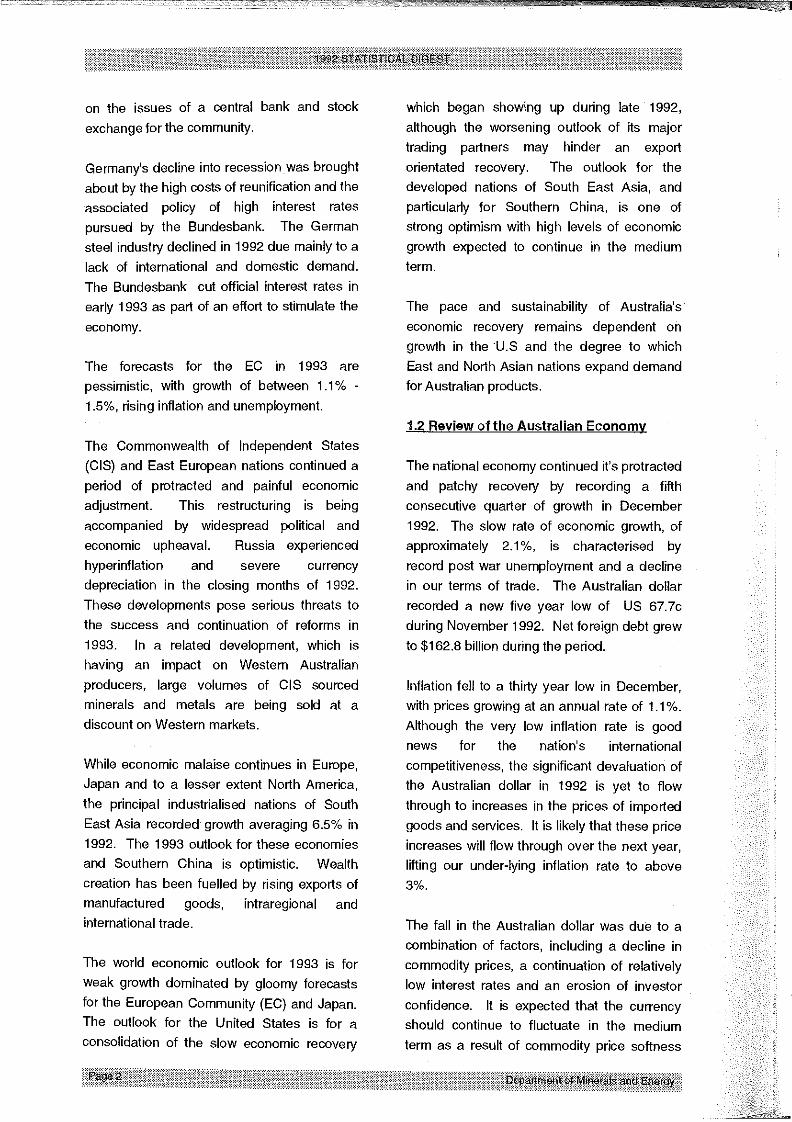
on the issues of a central bank and stockexchange for the community.
Germany’s decline into recession was broughtabout by the high costs of reunification and theassociated policy of high interest ratespursued by the Bundesbank. The Germansteel industry declined in 1992 due mainly to alack of international and domestic demand.The Bundesbank cut official interest rates in
early 1993 as part of an effort to stimulate theeconomy.
The forecasts for the EC in 1993 arepessimistic, with growth of between 1.1% -1.5%, rising inflation and unemployment.
The Commonwealth of Independent States(CIS) and East European nations continued aperiod of protracted and painful economicadjustment. This restructuring is beingaccompanied by widespread political andeconomic upheaval. Russia experiencedhyperinflation and severe currencydepreciation in the closing months of 1992.
These developments pose serious threats tothe success and continuation of reforms in1993: In a related development, which ishaving an impact on Western Australianproducers, large volumes of CIS sourcedminerals and metals are being sold at adiscount on Western markets.
While economic malaise continues in Europe,Japan and to a lesser extent North America,
the principal industrialised nations of SouthEast Asia recorded growth averaging 6.5% in
1992. The 1993 outlook for these economiesand Southern China is optimistic. Wealthcreation has been fuelled by rising exports ofmanufactured goods, intraregional and
international trade.
The world economic outlook for 1993 is forweak growth dominated by gloomy forecastsfor the European Community (EC) and Japan.The outlook for the United States is for aconsolidation of the slow economic recovery
which began showing up during late 1992,although the worsening outlook of its majortrading partners may hinder an exportorientated recovery. The outlook for thedeveloped nations of South East Asia, andparticularly for Southern China, is one ofstrong optimism with high levels of economic
growth expected to continue in the mediumterm.
The pace and sustainability of Australia’seconomic recovery remains dependent ongrowth in the U.S and the degree to which
East and North Asian nations expand demandfor Australian products.
1.2 Review of the Australian Economy
The national economy continued it’s protractedand patchy recovery by recording a fifthconsecutive quarter of growth in December1992. The slow rate of economic growth, of
approximately 2.1%, is characterised byrecord post war unemployment and a declinein our terms of trade. The Australian dollarrecorded a new five year low of US 67.7cduring November 1992. Net foreign debt grewto $162.8 billion during the period.
Inflation fell to a thirty year low in December,with prices growing at an annual rate of 1.1%.Although the very low inflation rate is goodnews for the nation’s internationalcompetitiveness, the significant devaluation ofthe Australian dollar in 1992 is yet to flowthrough to increases in the prices of importedgoods and services. It is likely that these priceincreases will flow through over the next year,lifting our under-lying inflation rate to above3%.
The fall in the Australian dollar was due to acombination of factors, including a decline incommodity prices, a continuation of relativelylow interest rates and an erosion of investorconfidence. It is expected that the currencyshould continue to fluctuate in the mediumterm as a result of commodity price softness

SH/NO~~66Ljt66t
99’0
L’O
8N$/V~ :31V~ 3~NVHOX3
"uo]Jos
oi onu!luoo soo!Jd /q!pOLULUO0 pue ’~oI U!EWaJ~llEJeua6 slonpoJd leJaU!UJ s,e!loJ1snv uJalsa/~A
JOJ puELuap ’~UJOUO0O leUO!IEUJalU!U! luauJaAoJduJ! peoJq ~ue ]o eouasqE e41 uI
Du!u!~ eql bu!loa|tV sJo~,oe-I o!u~ouoo3 8%
¯ ~lU!e~Jaoun O!LUOUOOa puE
contribute to delay any recovery in commodityprices generally.
The year also saw significant changes inforeign ownership in the resources sector.Several long-term players reduced or areplanning to reduce their interest in Australia.Where this is occurring, it is usually as part ofa policy of rationalising investments in noncore areas. Other investors targeted Australiafor new investment. These decisions do notmaterially affect the ability of Australiancompanies to maintain production, to raisecapital, or to invest in new projects.
The world economy is now not expected toexpand significantly before mid 1994, with amajor draw-down on inventories andstockpiles likely to be associated with any
upturn in demand. The current period of belttightening is therefore expected to continue.Producers have managed to cut costs to beable to survive a further period of low cash
flow, and to be able to maintain bothproduction and sales.
The resources sector is a major beneficiary ofsome elements of Commonwealth economicpolicy. A continuation of low exchange rates,low interest rates and low inflation will cushionproducers against further falls in commodityprices. The increased emphasis on workplacebargaining based on cost efficient output andproductivity growth, as a central plank of themicroeconomic reform agenda is alsowelcomed by resource developers.
For the future of the industry, emphasis mustbe placed on fostering the investmentenvironment, especially for greenfieldsprojects, and for increased downstreamprocessing. It ts important to maintain themicroeconomic reform agenda in areas suchas transport and energy supply, initiatives inthis area are keenly awaited by industry.
1.4 Social and Political Factors Affectinqthe Mininq Industry
The result of the "Mabo Decision" is clearly themost significant development of the year, andperhaps for many years to come. Thisdecision by the High Court established thatnative title continues in some form unlessspecifically abrogated by the Crown. The"terra nullius" basis of title as practiced sinceEuropean settlement, and substantially sincefederation, is now subject to unspecifiedrevision.
The way in which this decision will impinge onresource exploration and development
remains unclear. Federal government policyon the issue is for a series of multi lateralconsultations with aboriginal groups combinedwith the funding of strategic test cases. Thisprocess is expected to be protracted.Resource developers face major uncertaintyover "sovereign risk" in areas which they cannot influence by normal commercial or politicalprocesses. The issue is expected to beparticularly relevant to operations in theKimberley.
The spread of the recession to our majormarkets reinforces the need for resourcesproducers to expand the sales in growtheconomies of East Asia and Latin America.There are also limited opportunities to replacethe CIS as a commodity supplier to countries
in Eastern Europe. The former communistblock countries are also markets for expertisein the area of mineral technology,environmental procedures and managementconsulting services.
The Queensland Government, which amongthe other states is showing most concern overthe issue, favours a process of activeconsultation over a relatively short time frameto clarify the implications of the Mabojudgement with individual interested parties.
On other issues, the states and the
Commonwealth have used the ANZMECforum to coordinate legislation in severalresource areas. One is on restrictions to free

"suo[1~!~,o6au
aA!sueqoJduJoo ]o enuaAe o41 46noJql 146nos6u!eq s! snsuosuo0 "sIu!~J~suoo :IUaLUUJOAO6leUO!loes Jo eeJJ £a!]!l[ol~] eu!led!d olpue sooJnosaJ o| sseooe oJe suJoouoo Jo[euJaqJ. "se6 lemleu u! epeJ1 ale~sJa~U! pue eJlU!

FIGURE 1.2
MAJOR MINERAL AND PETROLEUM PROJECTSIN WESTERN AUSTRALIA
WITH AN ANNUAL VALUE OF PRODUCTION IN EXCESS OF $!0 MILLION
300 lira J
Jarrahdal
@ Base metals ,- Iron orez, Bauxite-Alumina v Manganese ore= Coal ~, Nickel* Diamonds m Petroleum~, Gold -k Saltu Heavy mineral sands ~ Tin-Tantalum-LithiumERSl
BOW River
12’2°
e Reedy ¯ GidgeeBig Bell
OM~ McCl~re28°
Laverton/Ashton
MlGibson
122°

ol elqe s! ~! 8Jojoq uo!leS!leUO!leJ JoqMnj
8HINOIN
88"0
:l.!un e_4/V$ :8qOIEI~ 3BO NOBI
"~e~lJeLU le!onJo s!41 u! 4~oJ5pueLuep ~o uJn:leJ e4~ pue uo!pnpoJd laOlS u!punoqeJ pI!LU e ees plnoqs ~LUOUOOO eseuede["
e41 qBnoJ41 6u!peeJ t~ou s! qo!Ll~ ~sooqleOS!J eqi pue ’Jea~ S!LI~ 6u!Jnp Jnooo plnoqsqo!qt~ ’u~op-unJ ~lOOlS eql jo pue eq/eJn6!-I) uo!]onpeJ ~lJee~ eA!lnoesuoo puooese41 set~ 866L JoJ eo!Jd ),oeJ],UOO Jo:leo!pu!uede£-e!l~JIsnv eLI] U! eu!loep % L L dJ~qs eq/
"4ted ql~oJ6 ]snqoJ e uo anu!tuoo
o~ ]as uJeas eaJOM pue ue~!eJ. ’eu!40]o suo!leu 5U!LUnSUOO pue 6u!onpoJd lee~,s aq/¯ JellOp Ue!leJ~snV je>leaM e jo ]lnseJ e ses~d!eoeJ 4|!~A ’~I146!Is eseeJou! pue ’peu!e~U!eLU
eq II!/~ Sla^el uo!1onpoJd lueJJno ’ep!$
aql uo "soJo euH pue duJnI jo seo!Jd apeJlu! 6u!ue>lee~A Jaqpnl e epnlou! II!~ e!leJlsnv
uJe~Sa~A Jo] ~lOOllno uJJO1 uJn!peLu aqJ.
’mad pue l!ZeJ8 u! seu!uJ ~AaU~o 6u!uedo e4~ Alqe~ou ’~!oedeo uo!lonpoJd
U! eseeJou! po)lJeW e 41!~ pep!ou!oo seq oJouoJ! Jol pueuJep e41 u! uJn]U~AOp leJeue6leq] sJeonpoJd s.elel$ 04~ Joj eleunlJo~un $! 11
009
009
OOL
Ia6!~6I
"uedep
’~e>IJeUJ JO!eUJ $,OlE:IS e4~ u! ~lel oq o~ ue6eqse!uJouooe JO[eLU eql 6u!pe~le suo!~!puoooFuouooe penpqns eqi se peloeJ~uoose6euuo| Modx3 ’(L’~ eJn6!:l) llnseJ L66Leq; uo Ile~ ~q6!ls e ’po!Jed ~Ae!AeJ eql 6u!JnppeonpoJd set~ sauuol UO!ll!UJ 80~ Ja^o
"~66~ 6u!Jnp ~16uoJis ~le^!leleJ pawJo]Jedfulsnpu! aJo uoJ! Ue!leJlsnv uJelseAA eq±
eJo UOal I.’~
o!uJouooe u! 6uF~sdn ~xeu 041 dei ~leA!sseJ66e~n37oB13d
QNV S3VI=I3NI~ I=IOPVI~I ~0 Nt31A38 "~

While there will be only limited growth in the
global volume of iron ore traded during 1993,local producers are expected to increaseoutput slightly. The Mt Channar mine is set for
further expansion, as is production fromYandicoogina and the reopenedKoolyanobbing operations. The Yarrie mine,under development in the Goldsworthy region,
is scheduled to begin replacing output fromNimingarra and Sunrise Hill by early 1994.Development work on the massive Marandoo
project will continue through 1993.
As the economic recovery in Australia gainsmomentum, domestic sales of iron ore can beexpected to trend upwards in 1993/94.Western Australia’s comparative advantage in
the production of lump and fine ores is set tocontinue and improve during the outlook
period. In addition to the State’s provenposition as a reliable iron ore exporter, thepossibility also exists for the futuredevelopment of some significant value adding
capacity.
Western Australia continues to be the source
of nearly all of the nation’s iron ore production(Figure 2.3).
2.2 Gold
Output from the State’s mines and estimatedvalue of sales during 1992 were both up
slightly on that recorded in 1991 (Figure 2.4).With total production strong at 181 tonnes thesector is well placed to ride out the current
downturn in demand on world markets.
GoldProduction & Value by Quarter
Quantity t Value SA millions
48 J ................... 75o
|
SOURCE, DOME
IRON ORE PRODUCTION
Mt140 ¯
E~ REST OF AUSTRALIA
lOO4
2O
1950 1955 1960 1965 1970 1975 1980 1985 1990
YEARS
Although the gold price weakened slightly
during the year, the effect on producerreceipts was offset by a devaluation of theAustralian dollar (Figure 2.5). With a risingaverage sale price for the precious metal, the1992 total return to Western Australian minersis estimated to have exceeded $2.7 billion.
The recent world supply growth, generated bystronger than expected mine production andsales by private sector agents, wasexacerbated by some central banks liquidatinga significant proportion of their stocks.Although fabrication demand remained solid.
world economic conditions will need toimprove considerably for growth to besustained. It is estimated that, given asituation of moderate economic expansion, agap should begin to emerge between the

1ndlno Joloos tunoloJlad ii~ jo anleA i~oi"si~OlJqSeO ~peelsio
uo!soJa etuos peJejlns 9N-I pue se6
leJnleu ol 6U!Aldde esoql ’~l|q6!!s esoJ £eo!Jd
I!O apnJo pue alesuapuoo el!qAA "sld!eoeJu! JO pele~lJetu sotunlOA U! luetueAoJdtu!ue 6u!t~oqs slonpoJd iie ql!M ’luep!Aoset~ q~oJ6 ~o eleJ 6u!nu!luoo pue ~peals V
"(L’Z eJn6L-I)¯ po!Jed t~o!^eJ eql JaAO elqels ~lJ!e~ peu!etueJsld!oooJ ’JellOp Ue!leJlsnv oql ]o uo!lenle^apJee~ p!w e ]o esneoe8 "JeoX aql ]o sJelJenb
ate1 leU!] eql u! XleleJepOtu peu!loep plos puepoonpoJd olesuepuoo pue I!O jo etunlOA oq/
"~66 ~ u! uo!lonpoJd ~o enleA u! eseaJou! ileJe^oileLUS e pepJooeJ Joloes LuneloJlod s,alelS aqJ.
NOIIOnC]Olgd 0700
"/~lu!eNooun le>lJeUJ etuos Jo eoej o41 u!ueAe ’anu!luoo iI!t~ /dlsnpu! o41 ~o tunluetuotu
aql ~et~ Jeq]!3 "pauedoap eq ol sl!d MOlleol s)loeqlno eA!suedxe Jo suo!leJedo OU!lOappas!ueqoetu olu! 6u!o6 ueeMleq ap!oepsJeonpoJd a6JeI ~iu!is!xa se ’tuJal tun!paweq] u! anu!iuoa II!M (9"~ eJn6!-I) uo!~onpoJd
leUO!leu ]o eoueu!uJop s,e!leJ|snv ujalSaAA
’uJ~el ~Joqs eql u! 1seeI le ’uo!ldnJs!p le!lueloda41 pue le!Jeletu ~£1oloeJ]eJ leaJ1 ol lueldMeu ’6u!uueld le!Oueuu JeleeJ60^IOAU! ii!t~s6u!~Jot~ 1no uedo 6u!ls!xo tuoJ] seJo ep!qdlnspeleos-daep jo 6u!ssoooe aq.L "suo!leJedopunoJ6Japun ol uo!l!sueJl lue~onlaJ eql6U!;letu eJe sJeonpoJd leOOl atuos seoJnosaJeJo Jaddn op!xo J!aql ~o qontu paleldep6u!^eH "866L 6u!Jnp uo!lonpoJd oLu! atuooaJotu ~uetu leql 1seal le pue JeeX aql 6u!Jnppeuo!ss!tutuoo eJe~ sloe!oJd Jno~t luatuuoJ!AueluetulsaAu! elqeJno^eJ ueql ssaI e el!dseG
’sJoqtuetu ~J1snpu! lie JOj uJoauoo jo Jal~etu6u!o6uo ue s! ~1!^!Ioe uo!leJoldxe spleuueeJl5 u~uo!1onpeJ elqelou V "suo!leJado 6u!lep!losuoo’olq!ssod oJaq~A ’pue slsoo 6u!onpoJjo ~6ele~ls se ql!~ 6u!JeAesJed eJe sJeonpoJd
Ue!leJlsnv uJelSaAA lsotula)lJetu atuos JO uo!lenl!s e 41!M peoed
8HINOI~I
00gv$
"zo/v$ :8301~1d 0709
’uo!pnpoJdeu!tu leUO!lue^uoa o] uo!l!ppe u! ’salespJe~lo; pue deJoS ’luetulso^u!s!p ’salesleu os!~dtuoo ’eseo s!tt~ u! plno~ seoJnos
IIV "seoJnos iie tuoJj ~lddns pue uo!leo!Jqe~~elle~e[ Jo] popuetuep plol~ ~o lunotue
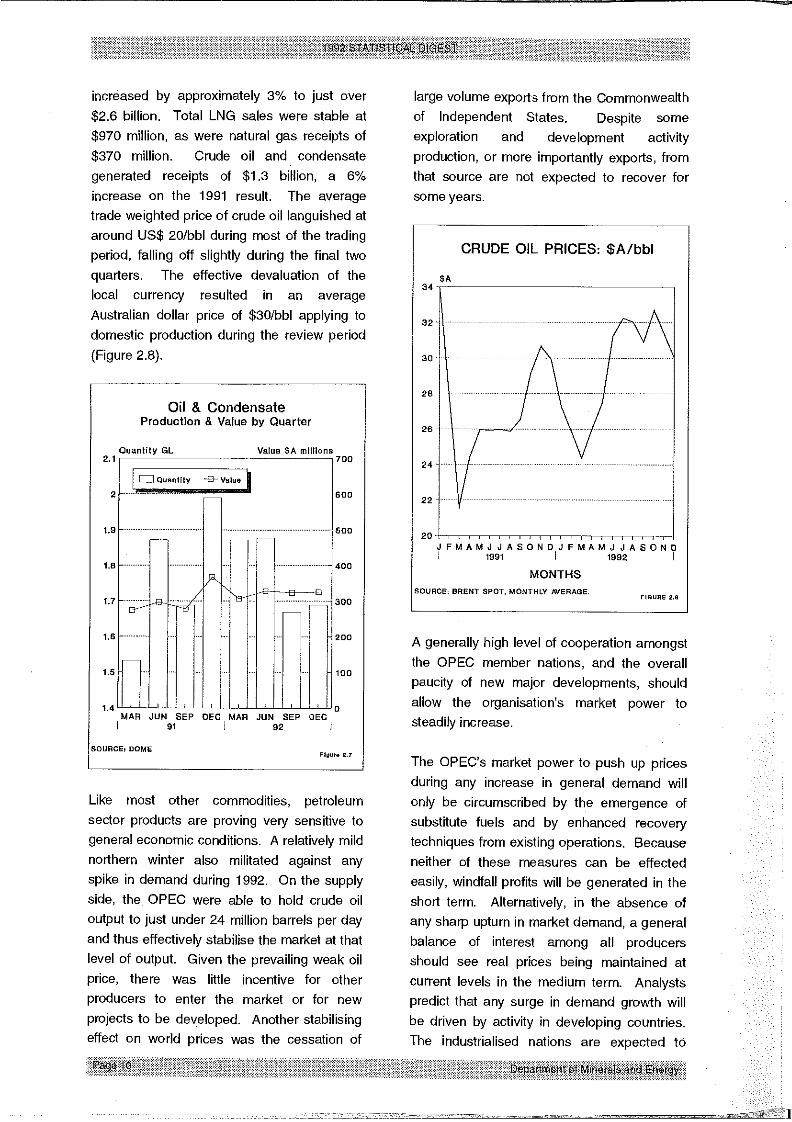
increased by approximately 3% to just over
$2.6 billion. Total LNG sales were stable at$970 million, as were natural gas receipts of
$370 million. Crude oil and condensategenerated receipts of $1.3 biilion, a 6%increase on the 1991 result. The averagetrade weighted price of crude oil languished ataround US$ 20/bbl during most of the tradingperiod, falling off slightly during the final twoquarters. The effective devaluation of thelocal currency resulted in an averageAustralian dollar price of $30ibbl applying todomestic production during the review period(Figure 2.8).
Oil & CondensateProduction & Value by Quarter
Quantity GL Value $A millions2.1 700
MAR JUN SEP DEC MAR JUN SEP DEC
Like most other commodities, petroleumsector products are proving very sensitive togeneral economic conditions. A relatively mildnorthern winter also militated against anyspike in demand during 1992. On the supply
side, the OPEC were able to hold crude oiloutput to just under 24 million barrels per dayand thus effectively stabilise the market at thatlevel of output. Given the prevailing weak oilprice, there was little incentive for otherproducers to enter the market or for new
projects to be developed. Another stabilisingeffect on wodd prices was the cessation of
large volume exports from the Commonwealthof Independent States. Despite someexploration and development activityproduction, or more importantly exports, fromthat source are not expected to recover forsome years.
CRUDE OIL PRICES: $A/bbl
$A34-
J FMAMJ J ASOND J FMAMJ JASON1991 I 1992
MONTHSSOURCE: BRENT SPOT, MONTHLY AVERAGE.
A generally high level of cooperation amongst
the OPEC member nations, and the overallpaucity of new major developments, shouldallow the organisation’s market power tosteadily increase.
The OPEC’s market power to push up pricesduring any increase in general demand willonly be circumscribed by the emergence ofsubstitute fuels and by enhanced recoverytechniques from existing operations. Becauseneither of these measures can be effectedeasily, windfall profits will be generated in theshort term. Alternatively, in the absence ofany sharp upturn in market demand, a generalbalance of interest among all producersshould see real prices being maintained atcurrent levels in the medium term. Analystspredict that any surge in demand growth willbe driven by activity in developing countries.The industrialised nations are expected to

ao!Jd eU!LUnle-Lun!u!uJnle lensn aLII LI]!~uaq~ peJJnooo po!Jed aq~, 6u!Jnp paJe:iLInOOuasppo le uJaas plnoi~ qo!q~ lueLudolo^ap e uIluauJdole^ep i~UOl6eJ el >toeq~,es led!ou!Jd
’(~. L’Z aJna!-I) UO!ll!q L" L$ el %8 &qile~ sld!aoeJ ’JeoA oq] {~u!Jnp souuo| UO!ll!UJ 0"lol &llqlS!lS poseaJou] SOleS ]o oUJnlOA aq~ al!qAA
"(0 L’~ eJn6!=l) qoeoJddes!q~ u! Jo~oeJ 6u!u!uuJa]ap aqi uoeq seq uo!soJaao!Jd ]o po!Jad peu!e:isns V"uo!~onpoJd]o aLunlo^ ii~Ja^o 6u!sEoJou!~q suJn|aJssoJ66u!s!l!qe]s ]o /~6alEJlse penu!iuoosJaonpoJd eU!LUnle s,a]e]S oq~~66~ 6u!Jna
eu!u~nlV
’V/WO3SSales uJje:l 6uoIa:leI 6u!Jnp LUeOJ:ISUO euJEose6 UOSpeH eq.L "ple!~ aJoLis~Jo ~Aau 6u!s!uJoJd:ISOLU aq:l
JO SaAJeseJ pe),ELUgSe q:l!/~ ’~JeAOOS!p oopueAAaq/ "sleJJEq UO!ll!uJ OOL JaAO Jo seAJeSaJsu!e:luoo LIO!LI/~ ple!] e Jo :lueuJdoio^ePaLI:I u! pe:isaAu! eq II!~A UO!II!LU 0/~$pe:leuJ!:ise uV "po!Jad
pa),e!oosse lies I1!/~ qo!Li/a ’]oa!oJd u!J~!JE) eLI/
S~IV=IA
(~]J.VSNBQNO0 6u!pnlou!)NOl±Orlaol=ld
"(6’~ eJn6!=l)leUO!:leu e4:l ~o eJeqs s,e:le~,S a4:1 4:1!~ 8UOlepuedxa o:i onu!:luoo plnoLis :IUoLUdOleAep pus
uogeJoldxo ’),UOUJ:ISeAU! ’S!LI:1 UI "~:l!AgOe IleJaAOu! os~oJOU! /~pee:is e JoJ s! /u),snpu[ uJnaloJ:lad
Ue!leJ:Isnv uJa),Sa/v~ aq), Joj )lOOl~no
"LuJo~leldJo 6U!UO!SS[LULUOO eq:l U! ~elep alqeJep!suooe u! :llnsaJ I1!~ :i! :feLl), po:leLugse s! :ii "LuJoj),eld
V u~pooE) aq), jo uo!:lelle:isu! aq:lsuJelqoJd )lonJ%s S:lued[o!:IJed eJn:lueA :lU[O[
"uo!:iduJnsuoo]o se:leJ IleJe^o e:leJopouJ o), enu!:luoo
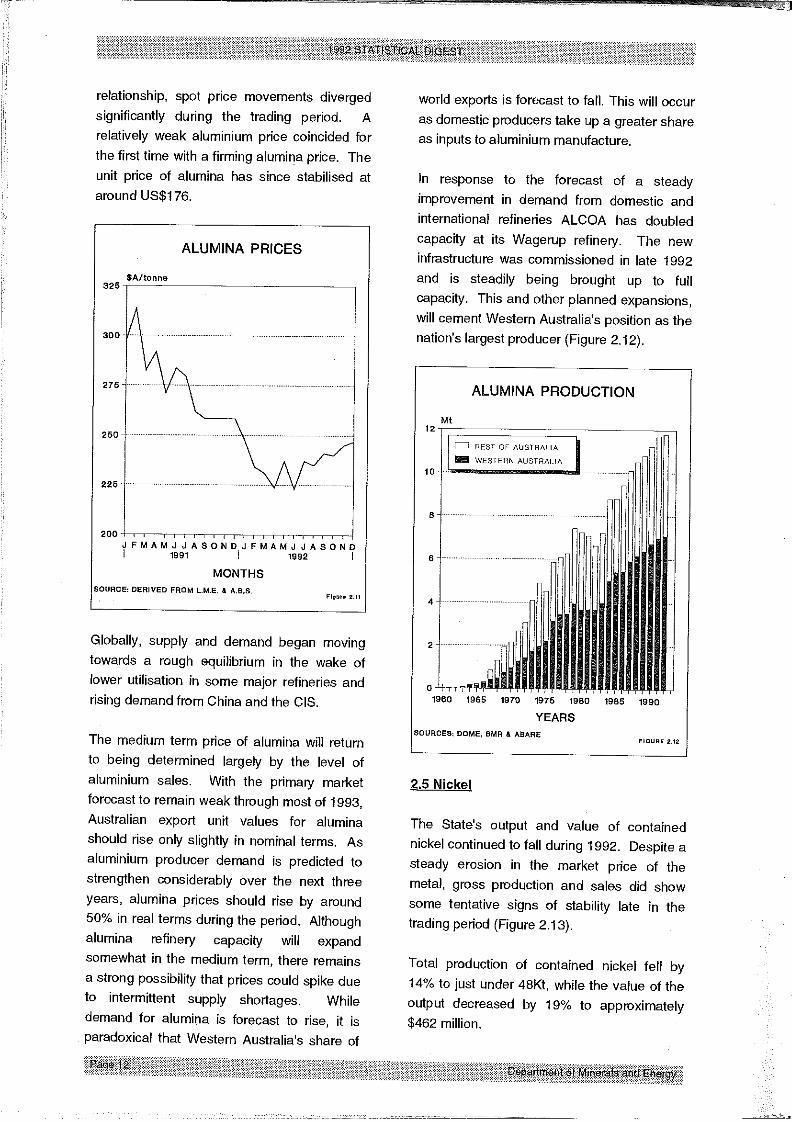
relationship, spot price movements divergedsignificantly during the trading period. Arelatively weak aluminium price coincided forthe first time with a firming alumina price. Theunit price of alumina has since stabilised at
around US$176.
ALUMINA PRICES
SA/tonne
J FMAMJ JASOND J FMAMJ J ASOND
MONTHS
Globally, supply and demand began movingtowards a rough equilibrium in the wake oflower utilisation in some major refineries andrising demand from China and the CIS.
The medium term price of alumina will returnto being determined largely by the level of
aluminium sales. With the primary marketforecast to remain weak through most of 1993,Australian export unit values for aluminashould rise only slightly in nominal terms. Asaluminium producer demand is predicted tostrengthen considerably over the next throeyears, alumina prices should rise by around
50% in real terms during the period. Althoughalumina refinery capacity will expandsomewhat in the medium term, there remainsa strong possibility that prices could spike dueto intermittent supply shortages. While
demand for alumina is forecast to rise, it isparadoxical that Western Australia’s share of
world exports is forecast to fall. This will occuras domestic producers take up a greater shareas inputs to aluminium manufacture.
In response to the forecast of a steadyimprovement in demand from domestic andinternational refineries ALCOA has doubledcapacity at its Wagerup refinery. The newinfrastructure was commissioned in late 1992and is steadily being brought up to fullcapacity. This and other planned expansions,will cement Western Australia’s position as the
nation’s largest producer (Figure 2.12).
ALUMINA PRODUCTION
Mt
[~ REST OF AUSTRALIA
9
0~
1960 1966 1970 1975 1980 1985 1990
YEARS~OURCES~ DOME, BMR & ABARE
2.5 Nicke~l
The State’s output and value of containednickel continued to fall during 1992. Despite a
steady erosion in the market price of themetal, gross production and sales did show
some tentative signs of stability late in thetrading period (Figure 2.13).
Total production of contained nickel fell by14% to just under 48Kt, while the value of the
output decreased by 19% to approximately$462 million.

UO!ll!q L’ ~$ jo ;nd;no leUO!leu eq; jo ~]!JO[eLUeq~ es!JduJoo i1!/~ pue ’sJee~ ~ej lxeu oq] JeAOSUJJO] leeJ u! Xl]UeO!j!u6!s puedxe ol peloo[oJd
OJe S6U!UJee ]Jodxe le)lo!u s,e!leJ]snv UJS:ISe/~
8
6
euuo]/v$ :8:~OIl:ld 7=I)IOIN
"se~nl!1sqn$ q1[~ eA!|!iedwoo seo!Jd/~Olle eseq le)lo!u pue lee%s sselu[els 6UpleUJ~o pe~Jo AJepuooes oq~ 6U!Aeq s! ’6u!oue[Jadxe
Al~ueaJno s! ~snpu! eq~ qo!q/~ ’seo!Jd~oI ~o po!Jed peu!elsns eq$ ’uJJel uJn!pauJ eq;
"lO>lO!U deJos jo ~|!l!qel!e^eu! au!loap 6u!6Jewo ue OSle s! eJe41~lddns ]!W!l I1!~ ’suo!suedxe Jo[ew peoueApepue spe!oJd Spla!~uaaJ6 leiUaUJdole^ep qioq]o )toeI e^!]eleJ eq/ "866 ~ e]el 6u!Jnp spJet~dn
puoJ] oi u!6eq plnoqs seo!Jd pue ~uJel uJn!peuJa4] u! aAoJduJ! o] ]es eJe sle|uauJepunJ le)lJewse lq6!s u! ]a!leJ ewos ’Je^at~oq ’s! eJeql
"(PL’;~ eJn6!:l) SIO eq] uJojj s]Jodxa 6uoJls]o )loeq eqi uo ~66L jo Jauenb ~,seI eq~ u! %0~
~le]eLu!xoJdde Xq peloeJluoo sao!Jd e6ueqoxe
lelew e6eJe^V "le~lO!U deJos ~to ~l!l!qel!e^e./~peeJ eql pue ’puewep )tee/~ ]o eoejeq] u! pau!elu!euJ 6u!oq s! 4o!q~ ’uo!pnpoJd
6uoJ~s ~le^!]eleJ ~q pe|eqJeoexe 6u!eqs! eouelequJ! eq/ "eOUelequJ! pueuJep-~lddnseJeAas e e]!nb jo iunJq eq] Jeeq o] penu!luooeo!Jd iO)lO!U ~JeLU!Jd s,plJO/~ eq~ ’pua s,Jea~ W
gL
Je~Jen~) ,~q enleA ~g uo!~onpoJdle~IO!N peu!e~uoo

per annum by 1997-98 (Figure 2.15).
NICKEL PRODUCTION
1004
REST OF AUSTRALrA ~WESTERN AUSTRALIA
1967 1972 1977 1982 1987 1992
YEARS~OURCES= DOME, BMR & ABARE
2.6 Diamonds
The State’s two producers experienced recordlevels of production, quantity of sales andvalue of sales during 1992. The gross weight
of diamonds sold increased 25% to 41 millioncarats, receipts were about $565 million. Theaverage value per carat was slightly down on1991.
The prolonged recession in the main
industrialised countries, and the onset of theJapanese downturn, resulted in severelyreduced demand for polished stones. Thedecline in business activity forced the CentralSelling Organisation (CSO) to reduce itsannual purchases of rough diamonds by 25%.The measure was introduced in theSeptember quarter in order to protect the costof holding stocks. It has affected bothWestern Australian producers, who sell almostall their production through the CSO. Thealternative point of sale is through the Antwerpopen market, another area of diminishedactivity.
The weakness of the global market wasemphasised by concerns over the continueduncontrolled supply of rough diamonds fromwar ravaged Angola and Zaire. A degree of
uncertainty also exists over the amount andtype of gems flowing out of the
Commonwealth of Independent States. In allcases, economic dislocation and thebreakdown of central government authority arethe principal factors preventing any effective
agreements to control supply in the longerterm.
The CSO is continuing to attempt to negotiatemeaningful agreements with Angola, Zaire andthe CIS which will restrain unauthoriseddiamond exports.
Argyle has made the decision to increase thecapacity of its hard rock processing plant from6 to 8 million tonnes per year. This move isdesigned to maintain production levels in theface of the lower grades encountered as
mining progresses to deeper levels of thepipe. Although nearing the end of its life, theNormandy Poseidon Bow River operation isexpected to maintain production into 1994.
There are some signs that the depressed
diamond market is set to rebound, butanalysts are unable or unprepared to predictwhen an upturn may occur. It is expected that
demand for diamonds will rise rapidly onrecovery of the global economy, but this maynot be during 1993.
Exploration for diamonds in Western Australiacontinues at a high level. Several prospectsare expected to reach the advanced feasibilitystudy level during 1993. with the strongpossibility of increased future production.
~Mineral Sand_s
State production of heavy mineral sands wasagain buffeted by the general state of market
disequilibrium in 1992 Western Australianminers generally followed a strategy of

l~u!~eJedo J!oq] u! qoeoJdde sno!]neo e 6Uple~
~lleJeUa6 eJe sJau!uJ Ue!leJ~snV uJo]seAA
’~]u!eiJaoun alqeJap!suoo euJos jo aoej aq~ uI
"sJeekle~e^as Joj passe Jalap seo!Jd l~u!dao)l ~qeJeLl]
’S)lOotspoet luouJ~!d Joj se lle~ se uoo~z
Joj eOUelequJ! pueuJap/~iddns e u! llnsaJ plnoo
sa!J~unoo Jaq~o jo eSue~ e u! slueuJdoleAOp~eI!LU!$ "~IdJeqs as!J ol petoed×e s! Jelno!Med
u! uo]lonpoJd ueoMjv q~noS "%0~ ol dn ~quooJ!z pue al!~n~ ’ei!ue~ul! ~o uo!]onpoJd plJo~
eseaJou! /~euJ suo!sued×e pue s~oa!oJd
"pued×e o~ enu!luoo II!~ Xlddns ’seo!Jd/~oI ~o
esneo/~JeLU!Jd e 6U!AOI!IaJ snLll ’sJea/~ ot~I l×euell] JaAO ~lqeJep!suoo aAoJdLU! O] pa~oedxe s!
luouJl~!d ep!×o!p Lun!ue1!l Jolt pueuJep aLll el!qAA
"Jee~ aql 6u!Jnp pe:leJalaOOe
ua^a pue penu!|uoo sa!l!pouJuJoo spues
leJeu!uJ Jo; seo!Jd u! eu!loap paqs!lqelse aqj.
¯ so!J:Isnpu] 8u!uJnsuoo l~u.ls.xe u! ]Joddns Salesdn 6u!Joqs u! Jo s]e)~JeuJ htou 6u!qs!lqelso
u! sseoons oi~!i peN sJaonpoJd ]SOFAI
8(3NV8 7V~3NIIAI E~04 X3C]NI ~OIl~d
"4 qeJap!suoo peseaJou~ OSle ]ndlnouooJ!z pue el!]nJ oHell]u~S ’sao!Jd Je~AoI ~os~Jo

TABLE 3.1 QUANTITY AND VALUE OF MINERALS AND PETROLEUM 1991, 1992
1991 1992
MINERAL UNIT QUANTITY VALUE(S) QUANTI’rY VALUE(S)
BASE METALS
Copper Metal
Lead Metal
Zinc Metal
TOTAL BASE METALS
BAUXITE-ALUMINA
Alumina
CLAYS
Attapulgite
Cement Clay
Fire Clay
Kaolin
White Clay
TOTAL CLAYS
t
t
t
t
t
t
t
t
11 793 17 918 620 12 093 18 677 215
10 698 4 348 109 20 964 7429 363
112 015 94 691 818 141 385 132984 006
116 958 547 159 090 584
7 009 184 1 844 032 647 7 082 757 1 689 720 803
17 245 4 617 226 20 697 6 315 851
32 795 234 039 6 940 74 168
0 0 6 508 7 810
3 100 204 400 2 692 172 726
14 611 160 718 22 575 225 745
~’’~ 5 216 383 ~ t.... ~( ~ S 796300
COAL t 5 114 267 228 561 597 5 655 459 251 762 799CONSTRUCTION MATERIALS
Aggregate t 133 683 719 267 148 082 898 292Gravel t 47 361 244 227 121 884 605 423Rock t 44 485 469 114 140 597 428 656Sand t 781 523 (r) 4 121 913 (r) 1 060 968 5 415 512TOTAL CONSTRUCTION MATERIALS 5 554 521 7 347 883
DIAMOND ct 39 358 098 (r) 456 926 660 41 453 238 565 061 845
DIATOMITE t 22 160 169 1 300DIMENSION STONE
Black Granite t ! 086 399 869 5 079 1 673 375Quartz Rock t 362 16 266 974 43 791SpongolJte t 437 35 834 254 16 832TOTAL DIMENSION STONE 451 969 ~=~ ~>’~ 1 733998GEM, SEMI-PRECIOUS & ORNAMENTAL STONE
Agate kg 0 0 10 260 11 286Amethyst kg 24 617 131 426 17 659 127 910Chrysoprase kg ! 800 32 500 37 048 1 163 695Jasper kg 0 0 8 844 7 499Tou n’naline kg 0 0 81 15 713Variscite kg 0 0 1 143 6 680TOTAL GEM SEMI-PRECIOUS & ORNAMENTAL STONE 163 926 1 332 783

/V3d
0~1- I-Og~00lel!tuo{oc]
3NO NONI9~S ZS~ ~£g6 6gZ£3VN3NI~ 311iV~£3d qVINiS~GNI qVlOl
006£8 #~£L#]
87VW3NIR 311!VR£3d 7VIWiSDQNI~8~ 6#6 £#880~ 68~ £z8SONVS 7VN3NI~/AV3H 7V101
££6 ~8 Z$l08# #88(J) LZ8 69L ~9~ (J) 8£6 ZL£;(e) e;~uemll pepgJ6dR

TABLE 3,1 (cont) 1991 1992
MINERAL UNIT QUANTITY VALUE(S) QUANTITY VALUE(S)
PETROLEUM
Condensate kl 1 869 768 913 744 896 2 060 353 366 702 321
Crude Oil kl 5 214 687 901 415 578 5 046 694 917 363 371
LNG MMBtu 204 799 068 957 953 276 237 642 529 966 473 640
Natural Gas ’O00m3 3 738 458 372 203 226 3 776 068 368 955 578
TOTAL PETROLEUM 2 545 316 976 2 619 494 910
SALT t 6 827 230 149 355 769 6 671 678 158 392 954
SILICA-SILICA SAND
Silica t 76 612 782 017 66 253 697 787
Silica Sand t 669 384 6 390 188 519 642 4 973 830TOTAL SILICA-SILICA SAND -f~’-/~ ’~" ~ ~ 7 172 205 5 671 587
SILVER kg 39 306 (r) 5 956 148 (r) 65 929 10 224 887
TALC t 165263 11568410 166574 11712450
TIN-TANTALUM-LITHIUM
Spodurnene t 43 281 7 619 341 39 980 8 095 473Tantalite t 668 18 726 310 925 29 733 847
Tin t ~’: 272 1 268 035 284 1 472 341
TOTAL TIN-TANTALUM-LITHIUM 27 613 686 39 301 661
VERMICULITE t 580 103 018 308 54 754
TOTAL VALUE 12 052 973 067 (r) 12 110 070 551 (e)
Note: Quantities used in this table only apply to Minerals and Petroleum covered by the Mining Act 1978,
the Petroleum Act 1967, the Petroleum (Submerged Lands) Act 1982 and relevant State Agreement Acts,
(a) Also known as synthetic rutile
(e) Estimate
(r) Revised from previous edition

9qVlki3 J.Vl~l NOIJ_Onfd.LSNO0
(o)
eu!tunlV
VNllNf3qV - &LlXrIVi9
#8£ 060 6£ L
(e) 900 ~’86 ~8~.6£~- 96~
% uZ
% qd
SqV±3~ 95V8 lV±O±
ou!z
peo7
Jeddo0 I£1O±
eeleJlueouo0 Jeddo0
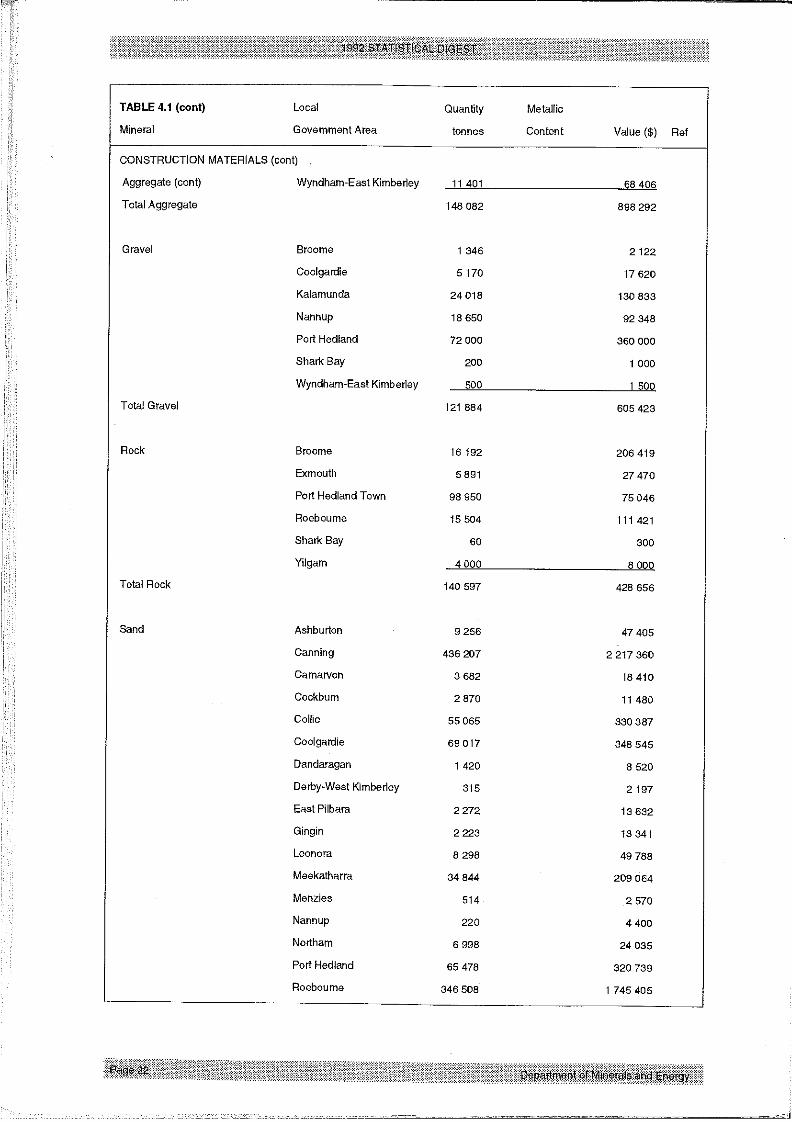
TABLE 4,1 (cont) Local Quantity Meta]lic
Mineral Government Area tonnes Content Value ($) Ref
CONSTRUCTION MATERIALS (cont)
Aggregate (cont) Wyndham-East Kimberley 11 401 68 406
Total Aggregate 148 082 898 292
Gravel Broome 1 346 2 122
Coolgardie 5 170 17 620
Kalamunda 24 018 130 833
Nannup !8 650 92 348
Port Hedland 72 000 360 000
Shark Bay 200 1 000
Wyndham-East Kimberley 500 1 500
Total Gravel 121 884 605 423
Total Rock
Sand
Broome 16 192 206 419
Exmouth 5 894 27 470
Port Hedland Town 98 950 75 046
Roeboume 15 504 111 421
Shark Bay 60 300
Yilgam 4 000 8 000
!40 597 428 656
Ashburton 9 256 47 405
Canning 436 207 2 217 360
Camarvon 3 682 18 410
Cockbum 2 870 1 ~ 480
Collie 55 065 330 387
Coolgardie 69 017 848 545
Dandaragan 1 420 8 520
Derby-West Kimberley 315 2 197
East Pilbara 2 272 13 632
Gingin 2 223 43 341
Leonora 8 298 49 788
Meekatharra 34 844 209 064
Menzies 514 2 570
Nannup 220 4 400
Northam 6 998 24
Port Hedland 65 478 320 739
Roeboume 346 508 1 745 405

3NO19 IVIN3~VNNO GNV $~OlOaNd-1~3S ~3£ lViO£
~JJ~q]~IooR
uJ~61bkou!l~uuno.L
~Jeql!d ]s~3Jods~r
es~Jdo$~40
os~Jdo~qO
6~
uo~a^~7
3N019 9VAN3!AIVNWO ONV 9nolo3}:Ja-1!~39
866 £8/- ~LOg 93NO.LS NOISN3RIC] 9VIO.L
(o) ~g8 9 ~’�~~eue6e]uside~!lOlSuodS(p)L6L ~l,’~Z6u!pnquptn~~ooE] z#eno
(p)
006 6#~ #0£ sepuno
3NO/S NOISN31/IIG
(p) 008 ~69Lue6eJepueo3£11,~ OJ.VlO
(p)£88 Z~8 Z~£5 ~Z~ ~SqVIW31V~ NOIIO~I£NO0 9V£0£
(;uoo) SqVIN3$V~ NOI$ODN$SNO0
o~]]e~o~A;[luenoleoo](~uoo) 1"# 338V£

TABLE 4.1 (cont) Local Quantity Metallic
Mineral Government Area tonnes Content Value ($) Ref
GOLD (cont) Au kg
Cue 11 158.449 168635221
Dundas 1 556,876 23 555 745
East PBbara 12457,186 188334809
Kalg,-E~oulder 45 844.609 692 236 754
Laverton 13 097.064 197 841 133
Leonora 18 200,699 275 313 395
Meekatharra 17 349.473 262 404 210
Menzies 565.056 8 722 369
Mt Magnet 5 314.101 80 403 579
Roeboume 4,762 71 922
Sandstone 3 831.290 57 806 588
Wiluna 3 999,315 60 372 990
Yalgoo 2 004,261 30 206 901
Yilgam 14 049.565 212 281 054
181 285.899 2 789 447 394 (f)
GYPSUM
HEAVY MINERALSANDS
GametSand
Total Gamet Sand
Ilmenite
Total ]]menite
Dalwallinu 25 823 420 002 (d)(e)
Esperance 4 205 24 797 (e)
Irwin 15 423 242 453 (e)
Kellerberrin 1 500 ! 0 500 (e)
Lake Grace 3 943 16 697 (e)
Merredin 1 055 7 385 (e)
Nungarin 22 829 ~33 732 (e)
Ravensthorpe 2 750 16 500 (e)
Wyalkatchem 22 043 12~ 684 (e)
99 071 993 750
Capel 784 62 482 (g)
Northampton 37 856 3 548 792 (e)
38 140 3 61! 274
TiO2 %
Cape] 635 139 54.81)
Camamah 103 478 59,34)
Dandaragan 229 443 62.98)
Waroona 76 801 54.53~
1 044 856 87 296 010

% e4
Jedsle4
seuuo$ ~Z
986 801 ~8999 6#
seuuo$

TABLE 4.1 (cont) Local Quantity Metallic
Mineral Government Area tonnes Content Value ($) Ref
IRON ORE (cont) Fe %
Exported Ore Ashburton 64 254 376 61,45 1 680 457 807
Derby-West Kimberley 2 265 444 64.1 t 56 103 7!3
East Pilbara 35 998 384 62.90 1 026 384 607
Total Exported Ore 102 508 204 2 762 946 127
TOTAL IRON ORE 108 147 133 2 921 975 612 (a)
LIMESAND - LIMESTONE-DOLOMITE
Dolomite Westonia 280 1 120
Umesand - Limestone Cockbum 1 625 529 8 249 003
Dandaragan 2 893 14 445
Dundas 112 281 1 021 539
Gingin 38 572 889 107
Irwin 3 845 17 362
Roeboume 69 345
Wanneroo 300 657 2 864 172
TOTAL LIMESAND-LIMESTONE 2 084 126 13 057 098 (d)
Mn %
MANGANESE ORE East Pilbara 402 844 47.26 72 200 142 (a)
NICKEL INDUSTRY Co Tonnes
Cobalt By-Product Coolgardie 485.055 26 242 055
Roebou me 2.028 142 718
Total Cobalt By-Product 487,083 26 384 773 (a) (b)
Ni%
Nickel Concentrates Coolgardie 241 421 10.62 245 884 562
Kalgoo rlie-Bou~der 35 514 10.49 35 813 722
Leonore 185 851 9.82 175 870 917
Total Nickel Concentrates 462 786 457 569 201
Ni %
Nickel Matte Roeboume ! 056 22.30 2 202 178
Ni%
Nickel Ore Coolgardie 2 892 6.33 1 767 117
TOTAL NICKEL PRODUCTION 461 538 496 (i)
Pd kg
Palladium By-Product Coolgardie 587,065 1 365 088
Roeboume 1,752 6 951
Total Palladium By-Product 538.817 1 872 039 (a) (b)

pue~
(~)
eJO0~
QNVS VOITIS - VO[llS
±qvs
(P)£18898!-6d nuJ![uel~l
£10NC]Oldd ~N370EJ13d 7V10_
see leJn~,eN le;Ol
se~ leJ n]eN
se~ leJnleN pe!l]nb!q
I]0 epruo le;OJ.
I!0 epruo
elesuepuoo le]OL
e;esuepuoo
~970Nlgd

TABLE 4.1 (cont) Local Quantity Metallic
Mineral Government Area tonnes Content Value ($) Ref
SILICA - SILICA SAND (cont) Wanneroo 20 961 133 894 (a)
TOTAL SILICA - SILICA SAND 585 895 5 671 587
SILVER: BY-PRODUCT
Ag kg
Boddington 1 925,490 295 261 (a) (I)
Coolgardie 186.689 30930 (a) (b)
Meekatharra 4680.760 718216 (a) (k)
Roeboume 1 260.903 146 367 (a) (b)
State-Wide 28 444,052 4 416 953
Yalgoo 29431.320 4617160 (a) (I)
65 929,214 10 224 887
TALC Meekatha~Ta 29 239 2 046 730
Three Spdngs 137 335 9 665 720
166 574 11 712 450 (e)
TiN - TANTALUM - LITHIUM Li20%
Spodumene Bddegetown-Greenbushes 39 980 5,61 8 095 473 (a)
Ta205kg
Tantalite Bridegetown-Greenbushes 706 178 735 17 518 847
East Pilbara 219 94 777 12 215 000
Tota~ Tantalite 925 273 512 29 733 847 (a)
Sn Tonnes
Tin Bddegetown-Greenbushes 284 194 1 458 699
East Pilbara 4 13 642
Total Tin 284 198 1 472 341 (a)
VERMICULITE Ravensthorpe 808 54 754 (e)
VALUE OF MINERALS 6 751 128 247
VALUE OF PETROLEUM 2 619 494 910
VALUE OF GOLD 2 739 447 394
TOTAL VALUE 12 110 070 551

(oo~) (00’068 L)oo’o00"098
66"808 g~~’ ~aL’~L ZO~ 9
88L9’890 OgO b88"~.8/. £06 01,~.0’8Z9 988 9
00b’99660’889/0869’8gZ 908
(6)(].8’bL8 8L9 g)1,8’ 1, .!-0 f~80 8ggS’£g8 L69 08
SqVEI3NI~J 3/IJ_V~~qd qV!EJJ.SIqGNI qV/Ol
Jedsle9
SIVN3NI~ 3iliV[~U3d 7Vlt]iSIqflNI
±GNVS 7VN3NIV~ k^V3H 7V10±
uooJ!Z
e;!z~uo~
e:~!ue~ul]
.~euJe9
$(3 N’v’$ qVtl~Nl~ AAV3H
GqOD
3N0!$ qVJ_N3~IVNE]O ~’ SNOIO3EId)I~3S
3N015 NOISN~!~IIG
�3NO~VlG
£qVIN3J.V~ NOIIONNJ_SNO0 ’]VIOl
pues
e~e6oJ66~’
SqVlEI3I’v’I~ NOI±OIqEJ/$NO0
qVO0
SAV]O
~u!uJnl’v’
VNIM r~qv-311x[qv8
87v19~t Bsv8 ]ViOl
ou!z
peaq
Jeddoo
S7’v’19 FJ 39V8
(uMop%) eoue#eAV$V±
dn%V± anitag661.~.66L
g661- ’ !-661- £.l.d I:1038 A I -I’~’AO~V 8 3"] BV.L

TABLE 5.1 (cont) 1991 1992 Value $A %up
Mineral SA SA Variance (%down)
IRON ORE 144 741 902.09 151 445 144.37 6 703 242.28 5
LIMESAND-LIMESTONE-DOLOMITE
Dolomite 0,00 84.00 84.00 n.ap.
Limesand(Limestone 79 082.54 168 173.13 89 090.59 113
TOTAL LIMESAND-L]MESTON E-DOLOMITE 79082,54 168257.13 89174,59 113
MANGANESE 3 138 440,83 4 072 364,00 988 923,17 30
NICKEL
Cobalt by(product 70 309,07 597 484.96 527 175,89 750
Nickel 10 082 057,87 10 846 182,10 764 124.23 8
Palladium by(product 21 328,93 30 054,44 8 725.51 41
Platinum by(product 19 204.60 40 442,19 21 237.59 111
TOTAL NICKEL INDUSTRY 10 192 900.47 11 514 163.69 1 321 263.22 13
PEAT I 0!5.28 1 663.94 648.06 64
PETROLEUM
Condensate 2 892 857.35 3 234 149.45 341 292,10 12
LNG 7 994 621.24 7 979 894.86 (14 726,38) 0
Natural gas 6 059 350.04 5 014 083.88 (1 045 266,16) (17)
Oil 71 344 950.90 66 634 282.69 (4 710 668.21) (7)
TOTAL PETROLEUM 88 291 779.53 82 862 410.88 (5 429 368.65) (6)
SALT 1 313 369.99 1 399 048,10 85 678.11 7
SILICA SAND 335 758.77 341 534.60 5 775.83 2
SILVER 126823.26 144368.49 18045.23 14
TALC 105 300,50 78 2!3.00 (27 087.50) (26)
TIN-TANTALUM-LITHIUM
Spodumene 328 117,34 415 793,00 87 675,66 27
Tantalite 491 799,65 605 907.00 114 107.35 23
Tin 32 144.38 33 089,56 945.18 8
TOTAL TIN-TANTALUM-LITHIU M 852061.37 1 054789.56 202728.19 24
VERMiCULiTE 2 232.17 1 642.25 (589.92) (26)
TOTAL ROYALTIES 326 066 649.30 351 895 983.42 25 829 334.12 8

%8 VNIIAInTv%1~I. 8C]NO~VIC]
%8~ ~0 NOel
%~l,~n 310E~J.3d
N01771~ 61-985 : 7V10181c11303~1 A17VIOEI ~661.
%6 saNO~Vla
%z VNIRn7v
%8 8~H%8 ~H10
%~ 73~OIN
%61 Ihlr1370EI13d
%Zg ::I~0 NOEII
NO1771~ 9"99~$ : 7V10181al:IO3EJ AI7V, ROEI Z86~
81d1303El A17VAO I 3AIIVWVdIAIOO
6.1 Employment in the Minerals and and gas production will all increasePetroleum Industries significantly in the medium term, A steady
growth in production-based long termThe Western Australian minerals and employment can be expected in the immediatepetroleum sector registered a minor fall in future.employment during 1992. Statistics compiled
from industry returns indicated that year’s endemployment in the production phase ofoperations was 34 235. This represented a fallof 1.5 % on year end 1991.
While there were some discreet shifts inemployment representing the closure ofexhausted operations and the opening of newones, most sectors reported little change inemployee numbers. This suggests that therationalisation measures which have beenunderway over the past two years havealready contrasted employment numbers as
far as possible. Further significant cuts inemployment in ongoing operations areunlikely.
The major reduction in full time employeeswas in the iron ore sector. Employment felldue to a winding down of the Goldsworthyoperation, and as a result of reduced volumeof production at Pannawonica. Thecommissioning of small developments in 1992and 1993 will maintain, rather than increase,current production levels. An expansion ofsectional employment is unlikely without a
large new project being developed.
Of heavy minerals sands, alumina and nickel,the commodities most affected by price falls,only the nickel sector showed significant joblosses. This was the result of major
restructuring and the cut back of the lessprofitable operations. Expansions in nickelproduction foreshadowed for 1993 and 1994,especially in the capacity increases forsmelting and refining, will have the longer termpotential to improve employmentopportunities.
Developments in nickel and minerals sandshighlight the general view that as miningcompanies are driven by market pressures toexpand their downstream processing capacity,
most new job growth will be in those areas.
While further aggregate falls in resourcesindustry employment are unlikely, any overallgrowth is expected to be slow. With thespread of enterprise bargaining agreements.the emphasis on improvements to productivitymay limit the taking on of any new workers.Employment in new projects is also expectedto be negotiated on a basis of higherproductivity. This is consistent with anindustry wide emphasis on multi-skilling,general skills development, and a significantinvestment in training.
Note on statistics.
The statistics reported are based onproduction sites, and therefore representemployment in the operational side of themining industry. Figures do not includeemployees in exploration, generaladministration or those working on a contractor ~ub-contract basis.
Petroleum is the only sector with significantplans for expansion in 1993. Crude oil, LNG

91. I.I.866QNO~IVIQ 7V J-01t,8 ~90 I.Je^!~ ~o8p;q uop!e£od~06Z88aI~6JV e)te7P~7 ~d seu!~ puouJ~!G el~6JV
QNOINVIQ
~el~Jo/wuo~6u!ppo8
eleO ~Oll!Nvdrua6~/V~
eJJe!u!d/~ellunH~ed leg
VNIIAIrl7V - 3J.IXnV8 "1V101
P~7 ~ld eu!Lunlv ~elSJON~P;7 ~ld SleMe;elAI pesn4 Ue!le~;snv
P;7 e!le~;snv Jo eoolV
VNIINn7v" =lllXnV8
S::III:IISI’IQN! INR=rlO~J.:]d ~ S’tVI:I~INI~I NVI=IVI:IISnV NI:E]IS:]h~ ::IH1 NI O::l~O’ld~:] SNOSt:I=Id 40 ~d=lBINrlN
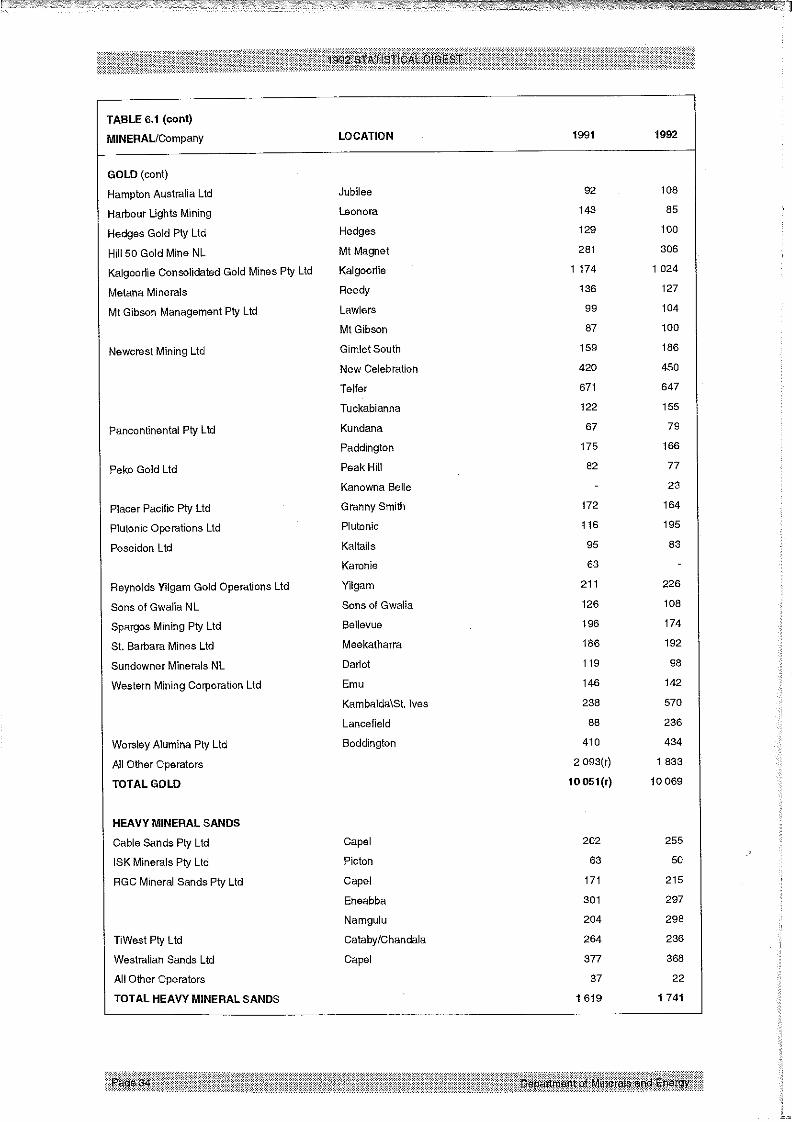
TABLE 6,1 (cont)
MINERAL/Company LOCATION 1991 1992
GOLD (cont)
Hampton Australia Ltd
Harbour Lights Mining
Hedges Gold Pry Ltd
Hill 50 Gold Mine NL
Kalgoodie Consolidated Gold Mines Pry Ltd
~4etana Minerals
Mt Gibson Management Ply Ltd
Newcrest Mining Ltd
~ancontinental Pty Ltd
Peko Gold Ltd
Placer Pacific Pry Ltd
Plutonic Operations Ltd
Poseidon Ltd
Reynolds Yilgam Gold Operations Ltd
Sons of Gwalia NL
Spargos Mining Pty Ltd
St. Barbara Mines Ltd
Sundowner Minerals NL
Western Mining Corporation Ltd
Woraley Alumina Pty Ltd
All Other Operators
TOTAL GOLD
Jubilee 92 108
Leonora 143 85
Hedges 129 100
Mt Magnet 281 306
Kalgooflie 1 174 1 024
Reedy 136 127
Law[ere 99 104
Mt Gibson 87 100
Gimlet South 159 186
New Celebration 420 450
Teller 671 647
Tuckabianna 122 155
Kundana 67 79
Paddington 175 166
Peak Hill 82 77
Kanowna Belle 23
Granny Smith 172 164
Plutonic t 16 195
Kaltails 95 83
Karonie 63
Yilgam 211 226
Sons of Gwalia 126 108
Bellevue 196 174
Meekatharra 186 192
Dadot 119 98
Emu 146 !42
Kambalda\St, ]yes 238 570
Lancefield 88 236
Boddington 410 434
2 093(r) 1 833
10 051(r) 10 069
HEAVY MINERAL SANDS
Cable Sands ply LtdISK Minerals Pry Ltd
RGC Mineral Sands Pry Ltd
TiWest Ply Ltd
Westralian Sands LtdAl! Other Operators
TOTAL HEAVY MINERAL SANDS
Capel 202 255
Picton 63 50
Capel 171 215
Eneabba 301 297
Namgulu 204 298
Cataby/Chandala 264 236
Capel 377 368
37 22
1 619 1 741

098gO6(~epJeno ~ooE] 5u!pnlou!)
s~o~eJedo JeqlO IlV
P;q ~d ~unoloJlad e4°qsJJO ep!spoo~
p]q ~4d LUnaloJ~Od Ue!leJ]snv ~£ei~
P]q ~d/~6Jeu3 uospeH
s£onao~d [~ n:l’lOEl£=ld
"FI~IOIN "Y¢IO.LsJO;eJedo Jeq]O IIV

7.1 PRINCIPAL MINERAL & PETROLEUM PRODUCERS 1992, address, telephone number: minesite.
BASE METALS
Copper
Murchison Zinc Co. Pry Ltd, c/. Normandy Poseidon Ltd, 100 Hutt St, Adelaide, S.A., (08) 303 1700: Golden
Grove.
Newcrest Mining Ltd, 600 St Kilda Rd, Melbourne 3004, (03) 522 5333: New Celebration, Teller.
Western Mining Corp. Ltd, 191 Great Eastern Hwy, Belmont 6104, (09) 479 0711 : Nifty, Kambalda.
Lead - ZincBHP Minerals Ltd, 44 Hamersley St, Broome 6725, (091) 91 0222: Cadjebut.
Murchison Zinc Co. Pty Ltd, c/. Normandy Poseidon Ltd, 100 Hutt St, Adelaide, S.A., (08) 303 1700: Golden
Grove
BAUXITE - ALUMINA
AluminaAtcoa of Australia (WA) Ltd, cnr Davey & Marmion sts Booragoon 6154, (09) 316 5111 : Del Park,
Jarrahdale, Willowdale.
Worsley Alumina Pty Ltd, PO Box 50, Boddington 6390, (097) 34 8311 : Boddington.
CLAYAttapulgiteMallina Holdings Ltd, 249 Stirling Hwy, Claremont 6010, (09) 384 7077: Lake Nerramyne.
Kaolin
Greenbushes Ltd, 16 Parliament PI, West Perth 6005, (09) 481 1988: Greenbushes.
White Clay
Pilsley Investments Pty Ltd, Military Rd, Midland 6056, (09) 250 2111 : Middle Swan.
COAL
Griffin Coal Mining Co. Ltd, 28 The Esplanade, Perth 6000, (09) 325 8155: Collie.
Western Colleries Ltd, 40 The Esplanade, Perth 6000, (09) 327 4511 : Collie.
CONSTRUCTION MATERIALSAggregateThe Readymix Group (WA), 75 Canning Hwy, Victoria Park 6100, (09) 472 2000: Bo0darrie, Boulder, Oscar
Range.
Gravel
Leslie Salt Company (Inc), 225 St Georges Tce, Per~h 6000, (09) 321 1668: Port Hedland.

¯ eu~oose~ :61#L 691~ (60) ’60L9 e^oJD e6ueJ0 ’ld eleQ 9~8 to-1 ’4 qo!ptos
]s4q]euJy
uo!~e~S eUell!Je~ :I~9Z l 898 (60) ’8009 ooe!qns ’ZZ9 xo80d ’osr ’llouue8
e~e6V
~]NOJ.S -W I N~IRVN~IO ~ SnOlO31:l,t-i"=lS ’1N39
Ja)lJe8 1~ :L£L9 q]Jad qlnos ’L69 xo80d ’Pl-] Kid SlUaUJ1se^uI eBp!JqpooAA
e],!lOfiuods
"u!pnqu!~tn~ : L Lt~L ~98 (60) ’90L9 oodqsloN~ ’PEJ uosuqwo/9~ ’Pl7 SleJgu!l~l le!OJOLULUOO
~fooJ ZlJeno
’P~euue7 :~99 £86 (160) ’£~Z9 euJooJ~] ’ ~98 XO~J O’d ’C] !$e!~] e(]
O:l,!UeJ ~) ~lOell~3NOJ.S NOISN31NIQ
"JeA!EJ ~o8 :OOZ L 98~ (80) "V’$ ’aP!elaPV ’IS llnN O0 L ’Plq seu!w puouJe!(3 Je^!Ej Mo~] uop!esod"el/~6JV :99L ~ ZSI~ (60) ’£009 q]Jed ise/w ’PN ~lJed s6u!)t ~ ’sou!~ puouJe!G elX6JV
QNOINVIQ
"eq]loouJe!6p!/w ’eJooJJe/~ ’)te£jO
epue~e~e/V~ ’Je^!Ej JeuJn/’~leeJ0 s,ueA!llnS ’~eajO ~pLleS ,SelOeUU!d ’~e£ iO~lO!N ’ueuJ~eN ’eq~eJJe){
’~leeJo leql~ ’eleA lauJoo :000~ ~ZI, (60) ’00 ~9 ~Pecl e!Jop!A ’h~H 6u!uue0 £Z ’(V/~A) dnoJ£ X!LU~peeEJ eq/
"e!p4e61ooo : ~96 8~Z (060) ’08t,9 e!lJOO6le)t ’PEJ e!P~e61ooo ~H u~else9 leeJ~ 4u0 Z ~ ~ ;oq ’p;q ~]cJ uo~u!no
"lo~epuel" ’e~Je6ueu~ :0808 89~ (60) ’t,O ~9 elep~e){ ’Pld u~nq~AeN ~ ’p~q ~la;euJv
pues
"leBOEJ 1N ’qluoLuJee7:00 L ~ Z98 (60) ’00 ~9 ~lJed e!JO~O!A ’PEJ pooh~sJn8 8~ L ’PI7 ~]d seo!~JeS pe!j!oeds
"uo!le]S epeeA :00~ ~ ~98 (60) ’00~9 ~tJed e!Jolo!A ’P}9 poot~sJn~] 8~ ’seo!AJes pe!~!oodS "/0 "S’£ ~]unoo
"puelpeH Mod :£66£ 0£8 (60) ’ZOO9 uol6u!uueo ’PN ~epIO!~] 89 ’P~7 seoJnoseN leJO8
Hoo~
"~l°°J~] 6u!Ja~to!cl :96Z8 86~ (60) 9Z09 ~looJ8 6uiJe)lo~d. . ’PN ~1ooJI3 6u!Je)lo!cl 8 1o-1 ’PL7 Kid suos pue !OU!A
(:IUO0) le^eJ~
(~,uoo) S-IVIEEIJ.VIN NOI.LOI~EI.I.SNO0
"el!seU!LU :JequJnu euoqdelo1 ’sseJppe ’Z66 ~ SI~ORQOE]~I IRfl3"IOEI/~d ~ "]VEI~NIIN -]VdlONIEId ~’L

7.1 PRINCIPAL MINERAL & PETROLEUM PRODUCERS 1992, address, telephone number: minesite.
GEM, SEMI-PRECIOUS & ORNAMENTAL STONE (cont)JasperThe Gemstone Factory, Lot 325 Dale P~, Orange Grove 6109, (09) 459 4678: Divide Creek.
VarisciteBennett, JSC, PO Box 677, Subiaco 6008, (09) 368 1764: Milgun Station.
GOLD
Asarco Australia Ltd, 10 Oral St West Perth 6005, (09) 481 2050: Jundee, Wiluna.
Ashton Mining Ltd, 24 Outram St, West Perth 6005, (09) 482 4444: Banyego-Duketon, Bardoc-Davyhurst,Harbour Lights, Laverton, Nambi.
Australian Resources & Mining Co. NL, 20 Berry St, North Sydney, NSW 2060, (02) 955 1722: Gidgee, Mt
McClure.
Aztec Mining Company Ltd, 99 Shepperton Rd, Victoria Park 6100, (09) 470 1444: Forrestania-Bounty.
Bellevue Project, c/. Forsayth NL, 221 St Georges Tce, Perth 6000, (09) 322 7211 : Sir Samuel-Bellevue
Big Bell Mines Ltd, PO Box 2135, Geraldton 6530, (099) 63 1144: Big Bell.
Broken Hill Metals Ltd, 28 The Esplanade, Perth 6000, (09) 324 1370: Hopes HilI-Corinthia.
Burmine Ltd, Copperhead Mine, Bullfinch 6484, (090) 49 5066: Frasers, Copperhead.
Centaur Mining and Exploration Ltd, 580 St Kilda Rd, Melbourne Vic. 3004, (03) 276 7888: Lady Bountiful
Extended.
Central Norseman Gold Corp. NL, PO Box 56, Norseman 6443, (090) 39 1101 : Central Norseman.
Coolgardie Gold NL, 56b Bayley St, Coolgardie 6429, (090) 26 6132: Bayley’s Reward-Greenfields.
Croesus Mining NL, 39 Porter St, Kalgoorlie 6430, (090) 91 2222: Mystery Mint.
Dominion Mining Ltd, 10 Richardson St, West Perth 6005, (09) 426 6400: Bannockburn, Beatons Creek,
Gabanintha, Labouchere, Meekatharra, Mt Morgans, Tower Hill.
Eltin Minerals Pty Ltd, PMB 31, Kalgoorlie 6430, (090) 21 4844: Grosmont.
Forsayth Pty Ltd, 221 St George’s Tce, Perth 6000, (09) 322 7211 : Cox’s, Lawlers, McCafferys.
Golden Kilometre Mines JV, 4/100 Hay St, Subiaco 6008, (09) 382 3300: Mt Pleasant, Lady Bountiful South,
Racetrack.
Hampton Australia Ltd, c/. Poseidon Gold Ltd, 100 Hutt St, Adelaide, S.A., (08) 236 1700: Jubilee.
Hedges Gold Pty Ltd, Cnr Davy and Marmion Sts, Booragoon 6153, (09) 364 0111 : Hedges.
Herald Resources Ltd, 45 Richardson St, West Perth 6005, (09) 322 2788: Brilliant-Tindals, Gum Creek-
Montague, Sandstone, Three Mile Hill.
Hill 50 Gold Mine NL, PO Box 83, Mt Magnet 6638, (09) 63 4104: Mt Magnet.
Kalgoorlie Consolidated Gold Mines Pty Ltd, Fimiston, Kalgoorlie 6430, (090) 22 1100: Super Pit, Fimiston,
Mt Charlotte, Mt Percy.
Kitchener Mining NL, Suite 21, Piccadilly Sq, cnr Short St & Nash St, Perth 6000, (09) 325 4997: Bamboo
Creek, Normay.
Metall Mining Aust. Pty Ltd, cnr Throssell & Forrest Sts. Kalgoorlie 6430, (090) 21 1766: Broad Arrow,
Callion, Round Dam, West Black Flag-Broads Dam.
Metana Minerals, 161 Great Eastern Hwy, Belmont 6104, (09) 479 0222: Reedy, Youanmi.

"ledeo : L L H7 L~ ("60) ’0S~9/dnqun8 ’88 L xoE] Ocl ’P;7 ~lct (V/~A) spues elqeO
e:l.!ZeUOl/~ ~, euexoone-I ’uoo.~!Z ’e~!:Inl~ ’ei.!ueu411
’uol6u!ppo8:09~8 88 (860) ’0689 uol6u!ppo~3 ’8"� xo80cl ’Pl-i ~ld eu!tunlV ~elSJO/~A
"ple!~eoue-i’SOAI l$-ePlequJeN ’ntu3 : L ~ZO 6/-’¢ (60) ’lzO L9 luouJle8 ’~t~H uJaise3 leeJE) L6 ~ ’PQ ’dJoo 6u!U!lAI uJalse/~A
";OlJeC] :~ ~Z ~8 (60) ’0009 q~Jad ’eo/s,a6JoaE) iS L~ ’-IN SleJeu!lAI JeUt~opun$
"e!JO^eN :£ L L8 ~8 (60) ’£009 qiJad lseN~ ’iS tueJlno £f~ ’Pl-I sple!JploE) uJeqlno£
"e!let~E) jo suoS ’leoo!uje8:886~ ~8# (60) ’£009 q]Jad lseM ’lcl iuou~e!lJed 9~ ’-iN e!lef~ ~o suoS’ell!^SU!66!H :88Z£ ~8~7 (60) ’0009 q~ed ’epeu~lds3 eq$ 8~ ’-IN plo~9 eqiueuJes
uo! ounrqlnos ’eu!UUeN ’P~!qenl8 :L ~ L8 ~8 (660) ’~t~99 e~Jeqle>leeR ’/£et~q6!H u~eq~JoN
"ssoJo u~eq~nos-qoo-I le~elhl :8~8;" ;~ (60) ’0009 qPecl ’epeueldsE] aq/8~ ’Piq suo!le~a~do RoE) u~e61!A splou~eE~
"II!H e!bufdel&l : ~ ~0~’ ~8 (60) ’0009 q~ecl ’epeueldsE] eq/8~ ’Piq sao~noseEI alnloseE~
ue6uolhl ll~l ’6U!lJeQ eosJ~) : L~SJ~ 888 (60) ’0 L09 IUOUJeJelO ’~et~q6!H 6U!lJ!lS 6~ ’Pl-t seoJnoseEI e~,e6stueEJ’e!uoJeN ’Sl!elle)t ’ut~oj0 ueploE) :00/- ~ 98~ (80) "V’$ eP!elePV ’iS #nil O0 ~ ’Pl-i plOE) uop!esod
"o!uolnlcl : ~0~80Z8 (60) ’~1799 eJJeqle>lOOlAI 9# 81/~c! ’Pl-I seoJnosaEJ
’q!!uJS ~uueJ~ : L ~. L8 L8 (060) ’017t~9 V/~A UO:lJe^e7 ’~8 xo80d ’PiT ~ld (qi!uJs ~uueJE)) JOOeld
"euepunM-6el-4ol!q/V~ ’uol6u!pped :000~ #~ (060) ’081~9 e!lJOO61eN ’ L9~ L xo~] Od ’Pi7 ~lcl (suo!;eJedo) ploE) leiueu!luoouecl
"Je~’S uJe61!A ’e!JOP!A leaJE)-e6p!qJn8 :££88 #98 (60) ’88~9 ssoJoalddv ’iS ssoJpJv Z~, ’7N seoJnoseEI uo!J0"II!H )lead ’eut~oueM :0000 6~8 (80) "cOOS O!A ouJnoqlelAI ’PEI ePl!M iS 9/-# ’Pl-I o)tecl-II!H ue)toJ8 q~JON
"sJelleopl!N~ ’euue!qe~lon± ’JeJla$ ’AP ueqao ’q]nos leFu!E)-epue8 eJO ’uo!leJqaleO
~eN ’saloeuu!d-leLuoo :OZOZ OZ~ (60) ’ ~0~9 luouJIo8 ’/U~H uJe~,se3 lE) 6Z L ’Pi7 6u!u!l~ lseJot~eN"u!]Jelhl l~ : L LO~ 898 (60) ’ ~£ L9 q~led qino$ ’iS ueuJt~o8 6
"uosq!E) |IAI :~ LS~ ;~Z8 (60) ’0009 q~Ject ’epeuelds=l eq± 8;~ ’Piq ~ld luaLue6euelhl uosq!E)
"sII!HJ.O 6u!N-elOOUJJe/’e!UfOloo~i :888~ £#8 (60) ’ ~09 elleOle8 ’PEJ ~e6pe-I 08 ’-IN (isn~’) saU!lAI ploE) uop=l
(luoo) d’lO9

7.1 PRINCIPAL MINERAL & PETROLEUM PRODUCERS 1992, address, telephone number: minesite.
HEAVY MINERAL SANDS (cont)
IImenite, Rutile, Zircon, Leucoxene & Monazite (cont)
ISK Minerals Pty Ltd, PO Picton 6229, (097) 25 4899: Waroona.RGC Mineral Sands, 45 Stirling Hwy, Nedlands 6009, (09) 389 1222: Capel, Eneabba North, Eneabba South
TiWest Pry Ltd, 1 Brodie Hall Dye, Bentley 6102, (09) 365 1390: Cooljarloo.
Westralian Sands Ltd, PO Box 96, Capel 6271, (097) 27 2002: Yoganup.
INDUSTRIAL PEGMATITE MINERALSFelspar
Commercial Minerals Ltd, 26 Tomlinson Rd, Welshpool 6106, (09) 362 1411 : Mukinbudin, Pippingarra.
IRON OREBHP Iron Ore (Goldsworthy) Ltd, 200 St George’s Tce, Perth 6000, (09) 320 4444: Shay Gap.
BHP Iron Ore (Jimblebar) Ltd, 200 St George’s Tce, Perth 6000, (09) 320 4444: McCamey’s.
BHP Iron Ore Ltd, 200 St George’s Tce, Perth 6000, (09) 320 4444: Newman, Yandi.
BHP Minerals Ltd, P.O Koolan Island 6733, (091) 910 575: Koolan Island.Channar Mining Pty Ltd, 191 St George’s Tce, Perth 6000, (09) 327 2327: Channar.
Hamersley Iron Pry Ltd, 191 St George’s Tce, Perth 6000, (09) 327 2327: Tom Price, Paraburdoo,
Brockman.
Robe River Iron Associates, 12 St George’s Tce, Perth 6000, (09) 421 4747: Pannawonica.
LIMESAND - LIMESTONE
Cockburn Cement Ltd, Russell Rd, South Coogee 6166, (09) 410 1988: Cockburn Sound, Coogee.
Limestone Building Blocks Co. Pty Ltd, 41 Spearwood Ave, Bibra Lake 6163, (09) 418 4440: Nowerup.
Loongana Lime Pty Ltd, PO Box 808, Kalgoorlie 6430, (090) 21 8055: Loongana.
Swan Portland Cement Ltd, Burswood Rd, Rivervale 6103, (09) 361 8822: Wanneroo.
Westdeen Holdings Pty Ltd, 7 Armstromg Rd, Applecross 6153, (09) 364 4951: Dandaragan, Gingin, Irwin,
Yanchep.
MANGANESE OREPortman Mining Ltd, Level 13,256 Adelaide Tce, Perth 6000, (09) 268 3333: Woodie Woodie.
NICKEL
Spargoville Nickel Pty Ltd, c\- Alameda Pty Ltd, PO Box 449, Kalgoorlie 6430, (090) 21 8311 : Spargoville.
Western Mining Corp. Ltd, 191 Great Eastern Hwy, Belmont 6104, (09) 478 0711 : Blair, Carnilya Hill,
Kambalda, Leinster.
PEATPeat Resources of Australia Pty Ltd, P.O Box 203, Bentley 6102, (09) 453 3388: Manjimup.

’se4snqueeJ~D :886L 18# (60) ’£009 4]Jed lsaAA ’lcl lueLue!lJed 9L ’Pl7 e!leJlsnv uJn!4!!7
euetunpods
INnlHII-I - INn-IVINV1 - NIJ.
"s6u!Jd£ ca J4/:Z#O£ #£ (660) ’6 L£9 s6u!Jds aaJ4/’9 ~- l xo80d ’Pl-I "dJoo 8U!U![A] UJOlSa
’~tooJqeas llAI :886 L LS# (60) ’£009 q~aacl lse/w ’ld luauJe!lJed 9 L ’-IN SleJeu!lAI
"ooJeleQ :88£ ~-6 (Z60) ’08~9 ~Jnqun8 ’ 688!- xo80"cl ’PCI ~lcl suo!;eJedo eoow!s
eo!l!S
QNVS V3171S - VOITIS
"e>le7>tu!d ’;se3 qeJoqec] e~le7 :£6#£ 08# (60) ’89!-9 II!H UOllFUeH ’P~J uJnq~looo ’R7 ~ld 6u!qqoueXIOO)t lies
’doo7 SSOlOSl3 :L ~8# ;~8 (60) ’0009 q~Jod ’iS luno~ ;~ ’eJnlueA lu!o~’ lies ~e8
poeloe~o)le7 ’Je!duJeo :66~/-~ (60) ’0009 qlJed ’oo/s,et~Joe~) IS ~’ZZ ~- ’PI7 ~lcl (suo!leJedo) lies Je!dweo
"PuelpoH ]Jod :888# £~8 (60) ’0009 q~Jed ’aOl s,a6JooE) IS £~ ’PI7 e!leJlsnv
17VS
¯ ei!seu!uJ :JeqLunu ouoqdeleI ’ssoJppe ’~66 !. S~]3ROOl=ld INl~3701:113d ~ -IVI:I3NI~ -IVdlONISd l’L
7.1 PRINCIPAL MINERAL & PETROLEUM PRODUCERS 1992, address, tel~.~phone number: minesite.
TIN - TANTALUM - LITHIUM (cont)
Tantalite - Tin
Goldrim Mining Australia Ltd, 317 Hunter St, Newcastle NSW 2300, (049) 29 2433: Wodgina.
Greenbushes Ltd, 16 Parliament Place, West Perth 6005, (09) 481 1988: Greenbushes.
Pan West Tantalum Pty Ltd, Gateway, 1 Macquarie Place, Sydney NSW 2000, (02) 256 2000: Wodgina.
VERMICULITEVermiculite Industries Pry Ltd, 15 Spencer St, Jandakot 6164, (09) 417 9900: Young River.