Embed Size (px)
Citation preview

“Our Resources • Our People • Our Future”
Western Australia
Statistics DigestMineral and Petroleum Production
Department of Minerals and Energy
1998
Corporate Policy, Planning and Finance

Department of Minerals and Energy
1998 STATISTICS DIGEST
Page
FOREWORD ...................................................................................................... 1
1. ECONOMIC AND SOCIAL ENVIRONMENT ...................................................... 2
1.1 World Economy Review .................................................................................... 2
1.2 Review of the Western Australian and Australian Economies ......................... 5
1.3 Economic Factors Affecting the Mining Industry ........................................... 7
1.4 Social and Political Factors Affecting the Mining Industry ........................... 10
2. REVIEW OF MAJOR MINERALS AND PETROLEUM IN WA .......................... 16
2.1 Overview and Outlook ................................................................................... 16
2.2 Petroleum ......................................................................................................... 17
2.3 Iron Ore ........................................................................................................... 20
2.4 Gold .................................................................................................................. 23
2.5 Alumina ............................................................................................................ 26
2.6 Nickel ............................................................................................................... 28
2.7 Heavy Mineral Sands ....................................................................................... 30
2.8 Diamonds ......................................................................................................... 33
2.9 Other Minerals ................................................................................................. 34
3. EXPLORATION, INVESTMENT AND EMPLOYMENT ..................................... 38
TABLES
1. Quantity and Value of Minerals and Petroleum ..................................................... 42
2. Quantity and Value of Selected Major Commodities ............................................. 44
3. Quantity and Value of Minerals and Petroleum By Local Government Area ........ 47
4. Royalty Receipts 1997 and 1998 ............................................................................ 54
5. Employment in the Mineral and Petroleum Industries as at December 1998 ..... 57
6. Principal Minerals and Petroleum Producers 1998 ............................................... 61
Abbreviations, References, Units and Conversion Factors ................................... 65
The Statistics Digest has been compiled in good faith by the Department of Minerals and Energy from information
and data gathered in the course of the Digest’s production. The Department believes information contained in
this document is correct and that any opinions and conclusions are reasonably held or made as at the time of
compilation. However, the Department does not warrant their accuracy and undertakes no responsibility to any
person or organisation in respect of this publication.
C O N T E N T S
1998 STATISTICS DIGEST
Department of Minerals and Energy
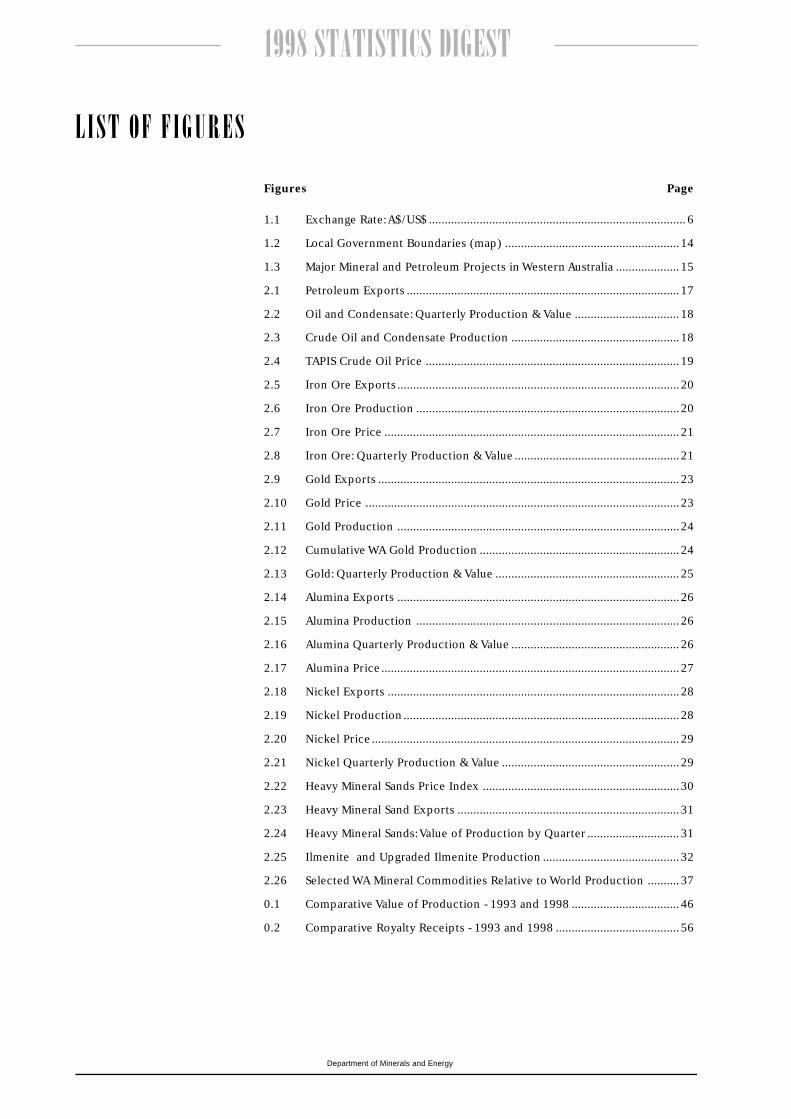
Figures Page
1.1 Exchange Rate: A$/US$ ................................................................................. 6
1.2 Local Government Boundaries (map) .......................................................14
1.3 Major Mineral and Petroleum Projects in Western Australia .................... 15
2.1 Petroleum Exports ......................................................................................17
2.2 Oil and Condensate: Quarterly Production & Value ................................. 18
2.3 Crude Oil and Condensate Production .....................................................18
2.4 TAPIS Crude Oil Price ................................................................................ 19
2.5 Iron Ore Exports .........................................................................................20
2.6 Iron Ore Production ...................................................................................20
2.7 Iron Ore Price .............................................................................................21
2.8 Iron Ore: Quarterly Production & Value ....................................................21
2.9 Gold Exports ...............................................................................................23
2.10 Gold Price ...................................................................................................23
2.11 Gold Production .........................................................................................24
2.12 Cumulative WA Gold Production ...............................................................24
2.13 Gold: Quarterly Production & Value .......................................................... 25
2.14 Alumina Exports .........................................................................................26
2.15 Alumina Production ...................................................................................26
2.16 Alumina Quarterly Production & Value .....................................................26
2.17 Alumina Price ..............................................................................................27
2.18 Nickel Exports ............................................................................................28
2.19 Nickel Production .......................................................................................28
2.20 Nickel Price ................................................................................................. 29
2.21 Nickel Quarterly Production & Value ........................................................ 29
2.22 Heavy Mineral Sands Price Index ..............................................................30
2.23 Heavy Mineral Sand Exports ......................................................................31
2.24 Heavy Mineral Sands: Value of Production by Quarter ............................. 31
2.25 Ilmenite and Upgraded Ilmenite Production ........................................... 32
2.26 Selected WA Mineral Commodities Relative to World Production .......... 37
0.1 Comparative Value of Production - 1993 and 1998 .................................. 46
0.2 Comparative Royalty Receipts - 1993 and 1998 .......................................56
L I S T O F F I G U R E S

Department of Minerals and Energy
1998 STATISTICS DIGEST
F O R E W O R D
L C Ranford
DIRECTOR GENERAL
1
Welcome to the Department of Minerals and Energy's 1998 Statistics Digest.
This publication contains the most comprehensive statistical information
available on the Western Australian resource industry.
The statistics in this Digest show that revenue growth in the Western Australian
minerals and energy industry has slowed with the total value of production in
1998 rising by 3.3% to reach $17.9 billion. This comes after ten years of solid
growth averaging almost 10%.
The total value of production slowed in 1998 due to historically low global
commodity prices and despite the fact that physical output of most mineral
and petroleum products actually increased during the period. The effects of
mineral and energy price cuts were ameliorated by the depreciation of the
Australian dollar during 1998.
The State's resource industry is clearly operating in a challenging period and
the near term outlook is for continued low commodity prices. In addition,
whilst there are indications of stabilisation in parts of the Asian economy, there
is a risk of easing growth in the US and there are concerns that growth in
domestic demand could moderate in Western Europe. These developments do
not bode well for mineral and energy prices in the near term.
Despite the difficult environment, new low cost projects such as those in the
nickel industry are being commissioned and expansion of facilities is taking
place for example, in the alumina and base metals sectors. Western Australia's
fundamental competitive position in the resource industry has not changed
and there is reason to look forward to a recovery gaining momentum in 2000.
The new project developments will prepare the State's industry for a resurgence
as markets recover in the next few years.
It is important to build on the State's advantages with further deregulation and
expansion of the State's energy industry. It also important to reduce
uncertainties in the local operating environment where possible. Native Title
issues are currently of major concern to industry. These and other issues are
discussed in the Digest.
It is not possible to prepare such a comprehensive range of information without
valuable assistance from outside the Department. I would therefore like to
thank all the various resource companies, Australian Bureau of Agricultural and
Resource Economics (ABARE), Australian Bureau of Statistics (ABS) and the
Western Australian Treasury Department for their cooperation and help during
the preparation of the Digest.
1998 STATISTICS DIGEST
Department of Minerals and Energy
1. ECONOMIC AND SOCIAL ENVIRONMENT
Growth in the United States
and Europe offsets Asian
decline.
2
Uncertainty about future
direction of growth in the
United States.
Government policies
attempt to boost economic
activity as Japanese
economy enters recession.
South East Asian economies
remain weak.
1.1 World Economy Review
Despite the Asian economic crisis the world economy overall grew at a robust
rate in 1998. Growth was sustained by strong domestic demand in the United
States and Europe, which more than offset falling activity in countries affected
by the Asian currency crisis. The outlook for 1999, however, is for a decline in
the pace of world growth, due to easing in the United States and Europe only
partially offset by resumption of growth in key Asian economies.
The United States economy is estimated to have grown by 3.5% in 1998, the
seventh consecutive year of expansion. High levels of domestic demand
underpinned growth, while net exports detracted from growth. The drag on
exports over the year was due to the strength of the United States dollar and
the impact of the Asian crisis on US exports, particularly manufacturing exports.
Interest rate cuts in the US in late 1998 were aimed at underpinning US
economic growth. These cuts should also stimulate activity in the second
half of 1999. Overall, the OECD forecasts growth in economic activity for
1999 in the United States of 1.5%. However the downside risks to this include
insecurity in demand from key export markets, namely Brazil and other Latin
American economies, and the possibility of a significant correction in the
United States' stock market. Any correction is likely to have an impact on
wealth and therefore consumption and on confidence generally. A further
risk will be the direction of US interest rates. With the economy running at
full employment any increase in labour costs may feed through to potential
inflation and prompt the Federal Reserve to increase interest rates.
The Japanese economy contracted in 1998 and was labelled as “officially” in
recession. An already poor economic situation, compounded by weakness of
the Japanese financial system, was aggravated by the Asian crisis. Activity
continued to decline despite continued efforts to stimulate activity through
fiscal initiatives and financial sector reform. The impetus from these initiatives
was insufficient to offset weak domestic demand due to bank balance sheet
and corporate restructuring combined with further declines in land and equity
prices which lead to a deterioration in credit conditions, rising unemployment,
a decline in consumer confidence and an increase in saving. This was
exacerbated by weak external demand, particularly from Japan's East Asian
trading partners.
The outlook for Japan is for a continuation of subdued conditions, with growth
forecast to resume, albeit at a rate of just 0.2%, in 1999.
Most South East Asian economies experienced a decline in economic activity
in 1998. The fall in activity reflects the impact of the Asian financial crisis on
real economic activity in the region.
Investor confidence in the Indonesian economy remained very weak due to
substantial structural difficulties. Indonesia's economy is not expected to
recover appreciably in the near term. While the large depreciation of the
currency should stimulate exports, particularly labour-intensive goods, a

Department of Minerals and Energy
1998 STATISTICS DIGEST
Brazil devalues currency
but negotiates agreement
with the IMF.
3
Structural reform crucial
for economic growth.
shortage of working capital is limiting the economy's ability to trade out of its
problems.
Malaysia has also experienced deterioration in economic and financial
conditions. In September 1998 the Malaysian government stopped foreign
dealings in the ringgit after an attempt to stimulate domestic demand via interest
rate cuts whilst maintaining the value of its currency.
South Korea, after suffering considerable currency depreciation, continued to
experience severe economic problems over the first half of 1998. These
problems necessitated IMF involvement in an appropriate structural adjustment
program for South Korea. There are now signs that the economy has stabilised
and of some restoration of investor confidence.
The resumption in growth should be strongest in those countries most active
in implementing structural initiatives to address the crisis, namely South Korea
and Thailand. Although reform has a long way to go, there are signs of resumption
in growth in these economies in 1999. In contrast, those economies less active
in implementing reform, most notably Indonesia and Malaysia are expected to
continue to experience difficulties.
Taiwan and Singapore have managed to escape the worst of the crisis, although
economic activity in Singapore is expected to fall in 1999 by a modest 0.5%.
This is a relatively remarkable achievement given the downturn in the region.
By comparison, Hong Kong, which experienced an estimated 4.8% decline in
activity, is expected to decline by a further 0.8% in 1999. Growth in Taiwan is
expected to ease slightly to 4.6% in 1999, down from 4.9% in 1998.
Economic growth in China remains robust. This growth is supported by relatively
strong domestic demand since there has been a weakening in the external
sector, with China facing increased competition from its Asian neighbours. The
maintenance of the US$ peg has meant that Chinese exports have become
much less competitive vis-a-vis those from other Asian nations. However,
authorities have managed to offset this through a substantial program of
investment in infrastructure. Importantly, China has so far resisted pressure to
devalue its currency.
At the beginning of 1998-99 the international financial crisis that began in Asia
spread to Latin America, with regional currencies under intense pressure as
foreign and domestic investors panicked to remove their capital in the wake of
problems in other economies (e.g. Russia). Brazil, which accounts for nearly
half of the output in the region and is the world's second-biggest recipient,
after China, of emerging market foreign investment, was significantly affected.
Brazil's Cardoso Government which had successfully, until October 1998, tamed
the country's once runaway inflation (down to 4%), attempted to defend its
currency, the real, with 40% interest rates. In spite of winning an IMF
international support package to defend the real, Brazil had to admit defeat on
13 January 1999 when Gustavo Franco, Brazil's central bank governor, resigned
and his successor allowed the real to devalue 8% against the US dollar. However
it appears that the risk of spreading financial crisis in the wake of the devaluation
has lessened with the IMF and Brazil coming to a new agreement. Latin America's

1998 STATISTICS DIGEST
Department of Minerals and Energy
4
Challenges for monetary
and fiscal policies in the
euro area.
biggest economy will be able to draw on US dollars to shore up the real. The
IMF will provide the much needed currency injection in exchange for the
Brazilian Government to restore a sustainable budgetary position.
With the treaty on European Union, signed in 1992, the Union set itself the
objective of establishing the European Economic and Monetary Union (EMU),
ultimately based on a single currency. Convergence towards low rates of
inflation and a sound fiscal position were the two most important criteria to
be fulfilled before countries could join the monetary union. By mid-1998,
eleven out of the fifteen member countries had qualified and agreed to
participate from the outset in the project (Germany, France, Italy, Spain, the
Netherlands, Belgium, Austria, Finland, Portugal, Ireland and Luxembourg). The
single currency of the EMU, the euro, was launched on 4 January 1999.
Introduction of the single currency was accompanied by the creation of a
European Central Bank (ECB). Virtually all fiscal competencies are to remain
at the national level, but the ECB will set monetary policy for the area as a
whole. This raises familiar issues in a new context, namely the challenges of
safeguarding monetary policy credibility while simultaneously ensuring fiscal
prudence.
Instability in Russian financial markets evolved into a full-blown financial crisis
by mid-1998. The approval of an IMF aid package in July 1998, worth more
than US$22 billion, proved insufficient to restore investor confidence or bring
interest rates down to levels consistent with Russia's emergency fiscal
consolidation program. On 17 August 1998, after repeated struggles to defend
the rouble and manage government debt, the Russian government and central
bank succumbed to market pressure and allowed for the depreciation of the
rouble and effective default on domestic government debt. Russia has since
entered a period of very high political and economic uncertainty and instability.
A new government and central bank management took power in September
1998. The overall chaotic environment was the main cause of the decline of
GDP in the second half of 1998.
The Russian economic crisis is being felt in the Baltic countries (Estonia, Latvia
and Lithuania), which face large trade exposure to the CIS and in particular to
Russia, which absorbs 20-25% of their exports. Of the CIS, Ukraine has been
under particularly strong pressure and has also taken measures to devalue its
currency. In Eastern Europe in general there have been sharp differences in
transition experiences. Output growth in 1998 was negative in Romania,
sluggish in Bulgaria and positive in Slovakia and Slovenia.
The Russian crisis impacted
on the Baltic countries and
the Commonwealth
Independent States (CIS).

Department of Minerals and Energy
1998 STATISTICS DIGEST
1.2 Review of the Western Australian and AustralianEconomies
5
The pace of growth in the Western Australian domestic economy has begun to
ease, following strong growth in 1997. State final demand grew by 5.2% in the
year to the September quarter 1998, down from growth of 9.9% in 1997.
Despite the slowing growth, the Western Australian economy continues to be
stronger than that of any other State. Demand from Western Australia's
industrialised export markets has been particularly strong and has more than
offset weaker demand from East Asia.
Growth in private consumption expenditure on trend has stabilised at around
1.0% per quarter, slightly stronger than nationally and a similar rate to that
achieved during the sustained expansion in consumer spending of the early-
mid 1990s.
Although consumer spending as a whole is growing at a similar pace to the
early-mid 1990s, the pattern of consumption growth has been different. In
particular, there was a switch from purchases of retail items to purchases of
motor vehicles in 1998. This was probably due to a decline in the relative price
of new motor vehicles assisted by the appreciation of the Australian dollar
relative to East Asian currencies.
Following steady growth through 1997 and early 1998, dwelling investment
has eased since June 1998. Over 1998 there was a slowing in the growth of
business investment, from the record rates in 1997-98. However the level of
business investment is expected to be more than double (120%) than at the
trough in 1991-92 and 61% above the most recent peak in 1989-90.
Strong growth in international demand for Western Australia's exports, despite
the slump in Asia, has meant that Western Australia's trade surplus has continued
to rise.
Export growth began to slow in 1998, after exceptional growth in 1997-98,
from 17.9% in the year to June 1998 to 12.5% in the year to December 1998.
Nevertheless, this remains a very healthy rate of growth and compares with
6.2% growth in exports nationally over the same period (and nearly four times
the figure for the rest of Australia of 3.6% i.e. excluding Western Australia).
Following trends evident since the Asian downturn began, exports growth to
G-7 countries (Japan, US, UK, Germany, Canada, France and Italy) continue to
underpin overall export growth.
As economic prospects for East Asian countries improve over the medium term,
Western Australia's exports to these markets are likely to resume.
Employment grew by 2.9% (or 24,900 persons) in 1998, the second strongest
rate of growth after Queensland. Despite this strong growth in employment
the unemployment rate remained at around 7%, (the lowest of all States),
reflecting an increase in labour market participation. Employment grew by
1.9% nationally with Western Australia accounting for 15% of this increase.
As expected, growth in the
Western Australian
economy is beginning to
slow, following
exceptionally strong gains
in 1997.
The pace of private
investment growth slows
but levels remain high.
Western Australia’s
overseas trade surplus
continues to grow, despite
significant increases in
imports.
WA retains strong labour
market
1998 STATISTICS DIGEST
Department of Minerals and Energy
6
Prices continued to increase at a modest pace in the December quarter with
the consumer price index (CPI) for Perth increasing by 0.5%. This follows an
unprecedented decline in the CPI in 1997-98.
Increased consumer spending has yet to flow through to significant price
pressure. This may reflect competition from cheaper imports of consumer goods
from Asia, since although the Australian dollar depreciated against most
currencies, it appreciated against some South East Asian currencies. The
appreciation resulted in decreases in the Australian dollar price of some imports
(notably motor vehicles).
Wages growth, also a significant determinant of inflation, has been relatively
subdued in recent quarters.
There was an easing of monetary policy by the Reserve Bank of Australia (RBA)
in early December when the Bank announced a 25 point cut in the cash rate to
4.75% - the lowest since 1994.
Long term interest rates fell sharply from mid-November onwards, culminating
in 10 year bond yields posting a low of 4.7% on 11 December, the lowest yield
since regular bond tenders began in 1982.
The fall in Australian bond yields during the latter part of 1998 in part reflected
the official statement accompanying the monetary policy easing, in which the
RBA forecast a much shallower upswing in inflation than it had previously
considered. The fall is also part of a trend towards historically low bond yields
in the US and record low yields in Germany and Japan.
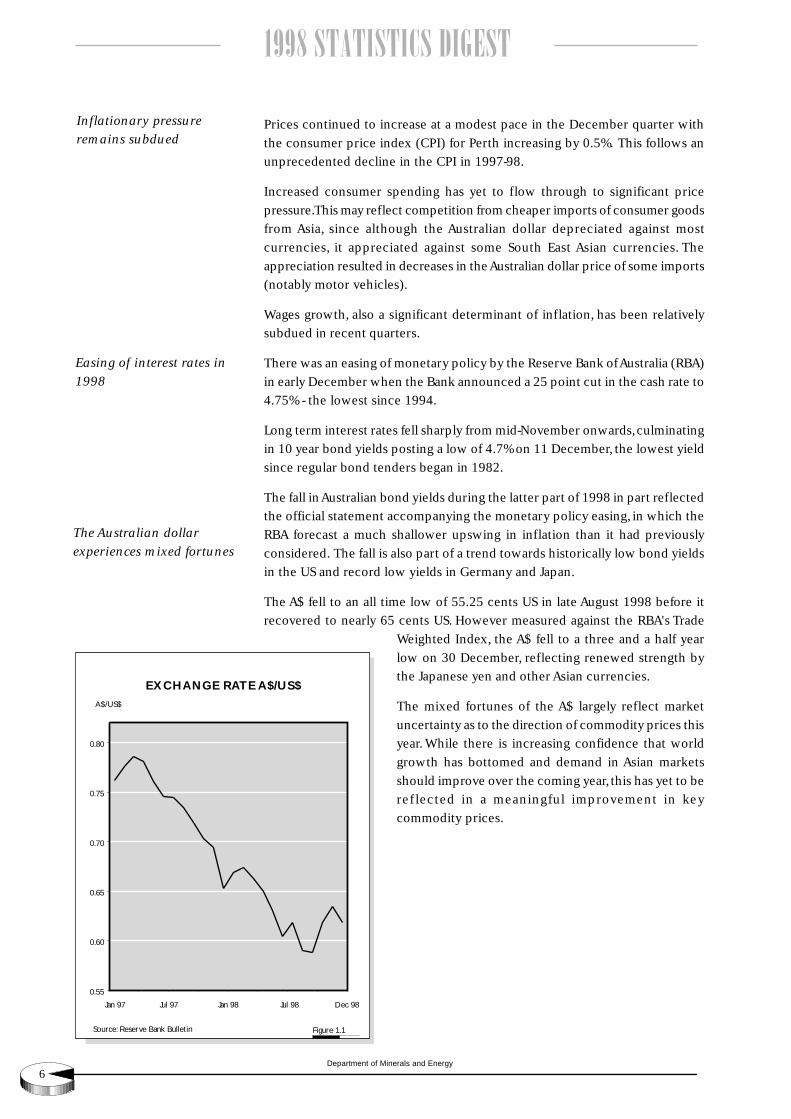
The A$ fell to an all time low of 55.25 cents US in late August 1998 before it
recovered to nearly 65 cents US. However measured against the RBA's Trade
Weighted Index, the A$ fell to a three and a half year
low on 30 December, reflecting renewed strength by
the Japanese yen and other Asian currencies.
The mixed fortunes of the A$ largely reflect market
uncertainty as to the direction of commodity prices this
year. While there is increasing confidence that world
growth has bottomed and demand in Asian markets
should improve over the coming year, this has yet to be
ref lected in a meaningful improvement in key
commodity prices.
Inflationary pressure
remains subdued
Easing of interest rates in
1998
The Australian dollar
experiences mixed fortunes
Figure 1.1Source: Reserve Bank Bulletin
Jan 97 Jul 97 Jan 98 Jul 98 Dec 98
EXCHANGE RATE A$/US$A$/US$
0.80
0.75
0.70
0.65
0.60
0.55

Department of Minerals and Energy
1998 STATISTICS DIGEST
1.3 Economic Factors Affecting the Mining Industry
7
The downward pressure on world mineral and energy commodity prices that
began in 1997 with the East Asian financial crisis continued throughout 1998.
The Asian crisis represented the most significant shock to commodity markets
since the dissolution of the Soviet Union and the global economic slowdown
in the early 1990s. Japan's poor economic performance also continued to
undermine commodity markets. Commodity markets were also adversely
affected by developments in Russia. Hopes of a recovery in Russia were dashed
in mid 1998 by a sharp rise in interest rates from around 20% to 150% before
settling at around 80% in an effort by the government to support the rouble.
The longer term effect of this is uncertain. Russia may attempt to increase its
foreign exchange reserves by increasing its commodity exports. However,
Russia's economic difficulties may restrict credit to its metal producers, thereby
reducing output. These are disturbing developments, occurring at a time of
subdued demand in international commodity markets.
Despite the ongoing turmoil in international commodity markets the State
Treasury reports that the world price of Western Australia's major commodity
exports in US$ terms appears to have stabilised, after having fallen substantially
since mid-1996. However the stabilisation in overall prices masks changes in
individual commodity prices. Prices of alumina, gold, ilmenite and rutile have
all risen in recent months, albeit modestly. The increase in these prices has
more than offset the impact of falls in the price of oil, LNG, and nickel, on the
commodity price index.
Oil prices continued to fall in 1998 in response to decreasing world demand
and increasing world supply. Demand for oil in general was down due to both
slow demand from industry, particularly in Asia, and from households in the
northern hemisphere, where there was a relatively mild winter. On the supply
side, downward pressure on oil prices was exacerbated over 1998 by the failure
of OPEC to restrict supply from its members and by the return of oil production
from Iraq. As a result of these market forces oil prices fell to a 23 year low.
International demand and supply conditions in 1998 resulted in world nickel
prices being down about a third compared with 1997. Demand for nickel from
Asian stainless steel producers was sluggish in response to the depressed
economic conditions experienced by the Asian area. On the supply side there
was the ready availability of nickel and stainless steel scrap from Russia plus
the expectation of significant additions to world nickel supply from Western
Australia's new low-cost lateritic nickel producers.
The outlook for commodity prices in the immediate future is extremely
uncertain. Market sentiment is likely to be the main determinant of price
movements in the short term. Market sentiment, however, will not sustain the
lift in prices. This will depend on an increase in world consumption of
commodities, which in turn depends on the timing of the resumption of growth
in the East Asian economies and the strength of economic growth in the United
States and Europe.
There are tentative signs that growth in East Asia has bottomed. However, it is
too early to conclude that the recovery has commenced. There is, nevertheless,
The downward pressure on
world mineral and energy
commodity prices that
began in 1997 with the
East Asian financial crisis
continued throughout
1998
Western Australia’s Export
Commodity Price Index
begins to stabilise
Commodity price outlook
uncertain

1998 STATISTICS DIGEST
Department of Minerals and Energy
8
a general consensus that the recovery will resume late in 2000. This may
underpin commodity analysts' expectations of an improvement in prices of
most commodity prices in the medium term.
As many export contracts are written in US$, the US$ -A$ exchange rate is a
significant economic determinant affecting the State's minerals and energy
industry. Due to ongoing uncertainty about the outlook for commodity prices,
in 1998 the value of the A$ relative to the US$ fell 15% averaging 63 US cents.
This was the most significant factor contributing to the growth in the value
of Western Australia's minerals and energy industry in 1998.
The competitiveness of Western Australia's mining industry continued to
improve with the ongoing deregulation and expansion of the State's energy
industry. The government owned AlintaGas continues to control Western
Australia’s gas infrastructure, however, since 1 January 1998 gas customers
taking at least 250 TJ per annum through a single connection have been able
to contract directly with the supplier of their choice. Under the State's
deregulation policy this threshold is decreasing every year and by 2000 all
householders will be able to buy gas from the supplier of their choice. Further
microeconomic reform of the State's gas industry is proposed with the possible
sale of AlintaGas. The State Government has undertaken the first step in the
proposed privatisation by setting up a Steering Committee which is scheduled
to report to Cabinet on privatisation options early in the 1999-2000 financial
year.
In March 1998 the Dampier to Bunbury gas pipeline was sold to Epic Energy
Australia. At $2.4 billion the privatisation was the largest in the State's history,
surpassing the $900 million sale of BankWest two years ago. Epic Energy
Australia immediately announced it will reduce transportation costs by 20%
by 2000, with a further commitment to double the capacity of the pipeline by
2007.
In mid 1998 the State Government announced its intention to privatise the
freight business of Westrail. State Cabinet approved the sale in March 1999
and accepted the recommendation from the Westrail Taskforce that the freight
section be sold as a fully integrated business, incorporating both rolling stock
and track. The business will not be sold to another government operator and
the private operator will be required to comply with the State rail access
regime. This regime provides a guaranteed right for other operators to
negotiate track access on fair terms and conditions. The privatisation and
track access offers the potential to enhance the efficiency of rail operations
which in turn will be beneficial to those industries that use the State's rail
services. These include the resources industry.
Another rail transport competition issue that has implications for the mining
industry is the rail access dispute between iron ore producers North and Rio
Tinto. In September 1998 North's subsidiary, Robe River Associates, applied
to the National Competition Council (NCC) for access to Hamersley Iron's
railway in the Pilbara. The application was made under Part IIIA of the Trade
Practices Act. In response to this, Rio Tinto's subsidiary, Hamersley, made an
application to the Federal Court disputing the NCC's jurisdiction over the
matter. The Federal Court began hearing the case in April 1999.
The mining and energy
industry continues to reap
the benefits of a lower
Australian dollar.
Microeconomic reform of
major State utilities
continues to benefit the
mining industry

Department of Minerals and Energy
1998 STATISTICS DIGEST
9
In August 1998 the Federal Coalition released its proposed tax reform package.
If the tax reform package is passed by both Houses of Parliament in the form
proposed by the Federal Government then there would be several benefits to
the mineral and energy industry. These benefits include:
• Exports being GST free, thus enabling tax credits to be claimed on all
inputs used to produce the final good or service;
• Extension of the exemption from Fringe Benefits Tax to remote area housing
(currently only applicable to primary producers) provided by the mining
industry for its employees. This should work towards equalising the options
between fly-in fly-out arrangements versus constructing residences in
regional mining areas;
• Proposed removal of a range of State taxes, many of which affect the mining
industry, in exchange for the States receiving GST revenue as of 1 July
2000. The details regarding the removal of these taxes are yet to be finalised;
and
• Introduction of a new diesel fuel credit scheme which will effectively
reduce the diesel excise from 43c per litre to zero, and for larger transport
users (including rail) from 43c per litre to 18c per litre. This is in addition
to savings of 7c per litre for business users of petrol and diesel through
their access to a refund of the GST paid on fuel.
The Review of Business Taxation (better known as the Ralph Review) instigated
by the Federal Government has thus far focused on reducing the company
marginal tax rate, (from 36% to 30%), in exchange for the removal of other
taxation concessions currently applicable to certain businesses. The Ralph
Review is basing its work on the premise that all businesses, regardless of
different circumstances pertaining to various industry groups, should be treated
equally. The minerals and energy industry is particularly concerned about the
possible removal of tax concessions such as accelerated depreciation
allowances, exploration write-offs and tax deductions for research and
development.
Federal Government
proposal to introduce a
Goods and Services Tax
(GST).
Concerns about proposed
trade-offs to achieve lower
company tax rate

1998 STATISTICS DIGEST
Department of Minerals and Energy
10
1.4 Social and Political Factors Affecting the Mining Industry
The Western Australian Government has been abiding by the future act
procedures of the Native Title Act (NTA) since the High Court Decision of 16
March 1995 found the State's Land (Titles and Traditional Usage) Act 1993 to
be inoperative. Native Title claims covering over 82% of the State had been
registered with the National Native Title Tribunal (NNTT) by the end of
December 1998. Claims often overlap and instances where up to 12 or more
separate parties have claimed title to the same land have been recorded. The
distribution of these claims is such that about 98% of all mineral title
applications in Western Australia must now be processed via the future act
regime of the NTA.
The impact of the NTA procedures has been to severely delay processing of
mineral title applications. Exploration Licences are fast tracked using the
‘expedited procedure'. Nevertheless to December 1998, the impact of the
NTA procedures has been to delay the grant of Exploration Licences by about
six months. Delays in the granting of Mining Leases have been much greater
than those associated with Exploration Licences. This is because all Mining
Lease applications over areas subject to registered Native Title claim must
undergo the ‘right to negotiate procedure'. To the end of 1998, over 2,600
applications for Mining Leases had become subject to ‘right to negotiate
procedures' and 333 agreements had been finalised involving 235 Mining
Leases.
In October 1996 the Prime Minister announced a number of proposed
amendments to the Native Title Act 1993. The amendments aimed to streamline
the NTA to make it more workable.
In December 1996 the High Court ruled in the Wik case that pastoral leases
did not extinguish Native Title but the rights of pastoralists and of Native
Title-holders could co-exist.
In response to this ruling the Commonwealth Government announced, in
April 1997, a 10 point strategy. The major aim of the strategy was to clarify the
conditions under which native title and pastoral leases could co-exist.
In September 1997 the Native Title Act Amendment Bill 1997 was introduced
to the Commonwealth Parliament. This Bill incorporated the 1996 proposed
NTA amendments and the Wik 10 point strategy. In December 1997 the Senate
made significant changes to the Bill. The changes were debated fiercely and a
compromise was reached culminating in a modified version of the NTA
Amendment Bill being passed through the Senate in July 1998.
This Commonwealth legislation enables the States and Territories to establish
procedures to deal with Native Title issues at the State level. The state based
legislative procedures must be consistent with the amended NTA and be
approved by the Federal Government.
On 15 October 1998 State Native Title legislation was introduced into the
Western Australian Parliament. The legislation comprised three Bills: i) The
Titles Validation Amendment Bill 1998; ii) The Native Title (State Provisions)
Bill 1997; and iii) The Acts Amendment (Land Administration, Mining and
Petroleum) Bill 1998.
Native Title continues to be
a major issue impacting on
the industry.
Western Australia is yet to
pass its Native Title
legislation.

Department of Minerals and Energy
1998 STATISTICS DIGEST
11
The Validation Bill aims to ensure ongoing security of titles issued under the
State Government's previous land titles regime. The Provisions Bill includes
provision to establish a State Native Title Commission that would assume the
functions of the National Native Title Tribunal. The Acts Amendment Bill provides
consequential amendments to existing State Acts and imposes native title liability
compensation obligations for future acts on industry.
The Acts Amendment Bill 1998 was passed by Parliament and assented to in
December 1998. However the Legislative Council did not pass both the Titles
Validation Bill and the State Provisions Bill. The failure to pass the State Provisions
Bill resulted in Native Title remaining under Federal Control.
In April 1999 the Premier told the Legislative Assembly that he would agree to
pass the significantly amended Titles Validation Bill and to this end he would
introduce new legislation covering the Labor amendments in the spring session
of Parliament. The Government's Titles Validation Bill aims to extinguish Native
Title over most types of rural land tenures. The Labor amendments to the
Government's Validation Bill aim to decrease the area of land over which Native
Title would be extinguished.
On 24 November 1998 the Federal Court confirmed that Native Title could co-
exist with other forms of land tenure. The Native Title claim by the Miriuwung
and Gajerrong people covered 7 thousand square kilometres of the East
Kimberley, including Lake Argyle and the Ord River. The claim also extended
into the Northern Territory.
Virtually all the area claimed was allowed with a few exceptions. The Court’s
decision may have ramifications for the State’s proposed Titles Validation
Amendment Bill 1998. To the extent that the Bill aims to extinguish Native
Title over most types of rural land tenures the State could become subject to
compensation claims.
Furthermore the Federal Court's decision may have significant implications
for the resources sector since the Court also ruled that Native Title holders
had the right to trade in resources and to receive a portion of the resources
removed from the area claimed.
The Western Australian Premier has indicated that he will appeal the Federal
Court’s decision.
The Framework Convention on Climate Change (FCCC) established the
mechanisms for international co-operative action on greenhouse. The
Convention sets out a broad framework and initiated a process covering all
aspects of climate change. The international commitments under the FCCC
were concluded at the Third Conference of the Parties held at Kyoto, Japan in
December 1997.
In the Kyoto discussions Australia was able to successfully lobby support for
the concept of differentiation. Differentiation means that the FCCC greenhouse
gas emissions outcomes should take into consideration the individual
circumstances of each participating country. The Kyoto outcome was favourable
in that Australia was one of three countries permitted to marginally increase
emissions by 8% vis-a-vis 1990 levels.
Miriuwung and Gajerrong
Federal Court decision may
have implications for the
State's resources sector.
The Framework Convention
on Climate Change (FCCC)
established the mechanisms
for international co-
operative action on
greenhouse gases.
Kyoto outcome favourable
for Australia.

1998 STATISTICS DIGEST
Department of Minerals and Energy
In 1992 a National Greenhouse Response Strategy (NGRS) was adopted by
Australian governments. Following a 1996 review of the strategy it was
concluded that governments, stakeholders groups and the community need
to do more to reduce Australia's greenhouse gas emissions and to prepare for
the potential impacts of climate change.
All States and Territories are currently in the process of inputting into the
National Greenhouse Response Strategy (NGRS). The NGRS will indicate the
manner in which Australia will constrain its growth in emissions to the 8%
increase negotiated under the Kyoto Agreement.
The first stage of the process (now completed) was for the Commonwealth,
States and Territories to agree to the principles which should underlie the
NGRS. The second stage (currently underway) is for the Commonwealth, States
and Territories to develop “Action Plans” for implementation of the NGRS.
In developing State “Action Plans” Western Australia is pursuing the concept
of differentiation within the national context. The State’s belief is that it should
not be unduly penalised because its export goods have high domestic
greenhouse emissions, particularly as some help abate emissions abroad.
Western Australia is currently in the process of developing the State's Action
Plan.
The Federal Environment Protection and Biodiversity Bill 1998 was drafted to
replace the existing Commonwealth environmental laws. The Bill enhances
the Commonwealth's ability to accredit State environmental procedures and
to delegate authority to the State. It therefore removes the Commonwealth
from many State and local environment issues. The Federal Bill and the
associated streamlined State-Commonwealth environmental approval process
have not yet been finalised.
In May 1998 the joint Western Australian - Commonwealth public consultation
paper, “Towards a Regional Forest Agreement” was released, outlining a range
of possible approaches to a long-term Regional Forest Agreement (RFA)
between Western Australia and the Commonwealth. The release of the
document marked the final phase in the RFA's development, which
commenced in 1992, when Commonwealth, State and Territory governments
signed the National Forest Policy Statement.
The RFA for Western Australia encompasses most of the State's Southwest
region. It is an agreement between the State and Commonwealth governments
on the future use and management (including exploration and mining) of the
forests of Western Australia’s south-west. The Agreement will be in place for
20 years, subject to five-yearly reviews.
The last stage of the RFA process entailed considering comments on the
consultation paper and development of a preferred approach for submission
to the Commonwealth and State governments. It was signed by the Prime
Minister and the Premier in May 1999.
With the new Ministerial arrangements following the federal election in
October 1998 the resources and energy portfolio was amalgamated with
industry and science to form the new ‘megaportfolio' of Industry, Science
Regional Forest Agreement
public consultation paper
released.
New Commonwealth Bill
streamlines the State/
Commonwealth
environmental approvals
process.
New Federal Government
administrative
arrangements for energy
and resources
12

Department of Minerals and Energy
1998 STATISTICS DIGEST
and Resources. The whole Resources and Energy Group of the former
Department of Primary Industries and Energy (DPIE) has gone over to the
Department of Industry, Science and Resources (DISR). The former DPIE also
had charge of the Australian Geological Survey Organisation (AGSO), the
Australian Bureau of Agricultural and Resource Economics (ABARE) and the
Bureau of Resources Sciences (BRS). Except for its former hydrogeological
section and the mineral and petroleum resources part of BRS, AGSO is are
now within DISR. ABARE and the former hydrogeological section of BRS have
gone to the department of Agriculture, Fisheries and Forestry Australia (AFFA)
which is the new version of DPIE.
13

1998 STATISTICS DIGEST
Department of Minerals and Energy
14
Figure 1.2
NORTHAMPTON (S)
MULLEWA (S)
CHAPMANVALLEY (S)
Kalbarri
GREEN-OUGH (S)
Dongara
MORAWA (S)
PERENJORI (S)
MIN
GENEWIrwin (S)
THREE SPRINGS
(S)
CARNAMAH (S)
MOUNT MARSHALL (S)
YILGARN (S)
DALWALLINU (S)
COOROW (S)
DANDARAGAN (S) Moora (S)
MU
KIN
BUD
IN (S
)
WESTONIA (S)
KOORDA (S) BencubbinWONGAN -
BALLIDU (S)
VICTORIA PLAINS (S)
WonganHills
DO
WE
RIN
(S)
Gingin (S)
NUNGARIN (S)
TRAYNING (S)
WYALKA-TCHEM (S)
GO
OM
ALL
ING
(S)
CH
ITTE
RIN
G (S
)
MERREDIN (S)
TOODYAY (S)
Bindoon
ABSDEFINEDMETRO AREA
KELLER-BERRIN (S)
TA
MM
IN (
S)
CUNDERDIN (S)
NORTHAM (S)
Northam (T)
YORK (S) BRUCE ROCK (S)
NAREMBEEN (S)
QUAIRADING (S)PERTH (C)
1
2
3
4
BEVERLEY (S)
CORRIGIN (S)
KONDININ (S)
BROOKTON (S)
WANDERING (S)PINGELLY (S)
MURRAY (S)
PinjarraMandurah (C)
KULIN (S)
BODDINGTON (S)
WICKERPIN (S)CUBALLING (S)
LAKE GRACE (S)
WAROONA (S)
WILLIAMS (S)
NARROGIN (S)
Narrogin (T)
HARVEY (S)
DUMBLEYUNG (S)
COLLIE (S)WAGIN (S)
WEST ARTHUR (S)KENT (S)
Dardanup (S)
Bunbury (C)
CAPEL (S) WOODANILLING (S)
Nyabing
Balingup
Donnybrook KATANNING (S)
BOYUP BROOK (S)
JERRAMUNGUP (S)
BUSSELTON (S)
Darkin
KOJONUP (S) GNOWANGERUP (S)
BROOMEHILL (S)
Dardanup (S)Donnybrook - Bridgetown -Greenbushes (S)Augusta - Margaret River (S)
123
4 LOCAL GOVERNMENT BOUNDARIES (S)TOWN OR CITYLOCAL GOVERNMENT STATUS
(S) -SHIRE(T) -TOWN(C) -CITY
LEGEND
NANNUP (S)
Margaret River (S)
Augusta
TAMBELLUP (S)
CRANBROOK (S)
MANJIMUP (S)
ALBANY (S)
PLANTAGENET (S)
Mt. Barker
DENMARK (S)
Albany (T)
Jurien
Lancelin
Guilderton
Southern Cross
Geraldton (C)
Nabawa
0 100 200 300 400
SCALE
MAP 1
ASHBURTON (S)
ROEBOURNE (S)
PORT HEDLAND (T)
BROOME (S)
WYNDHAM-EAST KIMBERLEY (S)
KununurraWyndham
DERBYWEST KIMBERLEY (S)
Broome (S)
Derby (S)
HALLS CREEK (S)
EAST PILBARA (S)
Port Hedland
Roebourne
Karratha
Marble Bar
OnslowExm
outh
(S)
EXMOUTH (S)
CARNARVON (S)
MEEKATHARRA (S) WILUNA (S) NGAANYATJARRAKU (S)
UPPER GASCOYNE (S)
SHARK BAY (S)MURCHISON (S)
CUE (S)
LAVERTON (S)
YALGOO (S)
SANDSTONE (S)LEONORA (S)
MOUNT MAGNET (S)
MENZIES (S)
Norseman (S)
KALGOORLIE / BOULDER (C)
COOLGARDIE (S)
DUNDAS (S)
ESPERANCE (S)
RAVENSTHORPE (S)
Albany
Wittenoom
Tom Price
Newman
Carnarvon
Geraldton
Jurien
PERTHSEE MAP 2
Mandurah
Bunbury
Augusta
Paraburdoo
Gascoyne Junction
kms
LOCAL GOVERNMENT BOUNDARIES

Department of Minerals and Energy
1998 STATISTICS DIGEST
15
Figure 1.3
Cockatoo I.
Argyle
PillaraCossack
Wanaea
300 km
North Rankin
WandooHarriet
Barrow I .Griff in
Saladin
YarrieNifty
Telfer
Lynas FindCrest
TubridgiRobe River - Deepdale
Dampier
Tom PriceParaburdoo
Channar
YandiJimblebar
Newman
PlutonicFortnum
Lake Mcleod
Peak Hill
Shark Bay
Eneabba
Dongara
Beharra SpringsThree Springs
Cooljarloo
JarrahdalePinjarra
WagerupCapel
Capel South
HuntlyBoddington/HedgesCollie / WesternCollie / Griffin
Jangardup
SEE ENLARGEMENT
Bluebird WilunaNimary Jundee
Gidgee
Golden Crown
Gum CreekMt Keith
Mt McClureBig Bell
Bronzewing
DarlotLeinsterLawlers
Emu
Hill 50Bannockburn
Barnicoat
Granny SmithMt MorgansTarmoola
Sons of Gwalia
Ora Banda - Gimlet South
Bardoc - DavyhurstPaddington
Kanowna BelleGolden Mile / KCGMKaltails
BlairCarnilya Hill
New Celebration
Higginsville
Central NorsemanBounty
Mt PleasantKundana
Three Mile Hill
BinduliJubilee
Kambalda St Ives
Chalice
Copperhead
Nevoria
Koolyanobbing
Marvel Loch
Yilgarn Star
Forrestania
100 km
122o120o118o
32o
30o
28o
122o120o118o
28o
30o
32o
Base MetalsBauxite - Alumina
CoalDiamondsGoldHeavy Mineral Sands
Iron Ore
NickelPetroleum
SaltTalc
Dalgaranga
Beenup
Silver Swan
Two Boys
Yoganup
Sunrise Dam
Nimingarra
❖ Gypsum
❖
Port Gregory
Woodada
Worsley
✧ Tin-Tantalum-Lithium
✧ Greenbushes
Hermes
Goodwin
StagRadio Hil l
Roller/Skate
East Spar
S.Pepper/M.Herrald/Chervil l
Mt. Horner
Port Hedland
Golden Grove
MAJOR MINERAL AND PETROLEUM PROJECTSIN WESTERN AUSTRALIA

1998 STATISTICS DIGEST
Department of Minerals and Energy
2. REVIEW OF MAJOR MINERALS AND PETROLEUM IN WA
16
2.1 Overview and Outlook
In 1998 the total value of Western Australia's minerals
and energy production grew by 3.3% to reach $17.9
billion. This amounts to ten years of compound growth
averaging almost 10% per annum. The slowing growth
was due to low global commodity prices. Physical
output of most mineral and petroleum products
actually increased and in many instances reached
record levels. Falls in commodity prices were so severe
in some instances that both rises in quantity and
depreciation of the Australian dollar over 1998 were
unable to maintain revenues.
Overall growth of the resource sector, albeit at a
subdued rate was facilitated by a 15% depreciation of
the Australian dollar during 1998. This helped
ameliorate price cuts over the year and boosted the
few price increases that some commodity suppliers
experienced.
With world oil prices falling to their lowest level in
23 years, petroleum was particularly hurt by adverse
price conditions. Whilst the output of almost all
petroleum products increased with record levels
reached for liquefied natural gas (LNG) and
condensate, the total value of petroleum production
fell by 10% to $4,646 million. This was the first drop
in four years.
In contrast to what was experienced in most other
sectors, iron ore production actually fell in 1998 by
6% to 143 million tonnes, but the value of production
increased by 13% to reach a record $4,097 million.
This outcome was achieved through a combination
of higher prices attained at a previous round of
negotiations in early 1998 and the lower value of the
Australian dollar.
Depressed international gold prices continued to place
pressure on the gold industry to rationalise production
with the State's overall gold output dropping in 1998
by 3% to 231 tonnes (7,423 thousand ounces). Thanks
to the devaluation of the Australian dollar though, the
value of gold output still managed to rise marginally
by 2% to $3,469 million.
Western Australia's alumina output continued to
increase, rising by 2% on the previous year to reach a
record high of 8.6 million tonnes. Favourable prices
received by local producers resulting from Australian
currency devaluation was chiefly responsible for the
value of production soaring by 15%, to hit a record
$2,397 million.
Similarly, the State's nickel output also greatly
increased, attaining a new record high of 143 thousand
tonnes. This was the industry's sixth successive annual
output increase. However, the world average nickel
price was down by a third compared to the previous
year, reaching a 10 year low. Consequently, the value
of production suffered a 9% drop to $1,039 million in
1998.
The heavy mineral sands industry continued to grow
for the fifth successive year with the value of
production up 9% to $691 million. This was
attributable to increased production of most mineral
sand products, local producers receiving favourable
contract prices and a weakened Australian dollar. A
significant contribution to the industry's growth came
from the upgraded ilmenite sector, where the value
of production rose 19% to $283 million.
Both sales value and volume records were broken by
the Western Australian diamond industry in 1998.
Western Australian diamond sales in 1998 were up by
a dramatic 48% to $622 million. Factors responsible
for this were the higher average prices received on
sales, mix of diamonds marketed and the depreciation
of the Australian dollar. In addition, volume of sales
was up in 1998 by over 29% to 52 million carats with
a portion of these sales emanating from stocks.
Another sector that experienced growth over 1998
was the salt industry which increased its value of
production by over $38 million to $210 million. Other
sectors helping the resource industry grow were the
State's lead and zinc producers who increased
production by 35% to over 189 thousand tonnes of
combined metals in concentrates. This plus the
favourable movement in the exchange rate helped
overcome lower prices to see total lead and zinc
revenue go up by $13 million to $141 million.
Despite overall slower growth of the Western
Australian mineral and petroleum industry in 1998, it
is noteworthy that the current level is almost 2.5 times
higher compared to the value of mineral and
petroleum production ten years ago. This is a solid
average compound growth rate of 9.6% per annum

Department of Minerals and Energy
1998 STATISTICS DIGEST
17
and represents a doubling of the value of production
every eight years, outstripping growth of the economy
in general.
As discussed earlier, world economic conditions are
such that the outlook for commodity prices at least in
the near term is not good. A critical issue at this stage
is how long commodity prices will remain low. As
pointed out by ABARE at its March 1999 Outlook
Conference, economic conditions in Asia are of critical
importance to world commodity prices and the
economic recovery in Japan, South Korea and South
East Asia is likely to take several years. In China
meanwhile, significant reforms are needed to sustain
economic growth. Combining this with an assumed
weak world economic outlook, the potential of
increased commodity supplies is likely to continue to
place downward pressure on world prices over the
next few years.
However, at the Outlook Conference it was also
pointed out that in the longer term a modest recovery
in world economic growth is assumed later in 2000
with a strengthening beyond that. This should provide
a source of relief for low commodity prices which will
be dictated more by the degree to which new mineral
and energy supply capacity is brought into production.
2.2 Petroleum
The value of Western Australia's petroleum production
fell 10% to $4,646 million. This comes after four
successive years of increases. Physical output of
almost all petroleum products increased, with for
example, liquefied natural gas (LNG) and condensate
rising to new record highs. However, even with the
benefit of the depreciated Australian dollar the
increased output, was insufficient to counteract world
oil prices which fell to their lowest level in 23 years.
In 1998 the State exported $3,235 million, or 70% by
value, of its petroleum production. The major
destinations were Japan (67%), Taiwan (8%) and the
US (7%).
1998 Petroleum Industry Highlights
LNG is Western Australia's most significant petroleum
product. Output of LNG in 1998 increased 3% to a
new record high of 7.5 million tonnes. Poor oil prices
however, caused the value of this production to drop
2% to $1,562 million.
Western Australia accounts for approximately 10% of
world LNG trade and is the third largest exporter in
the Asia Pacific region behind Indonesia and Malaysia.
Having become a significant supplier in the world
market, Perth hosted the world's premier LNG
conference in May 1998, attended by the world's
major LNG producers and consumers.
A total of 129 LNG shipments to Japan were made in
1998 plus four to the US. The spot sales to the US
were made possible by the North West Shelf Gas
Figure 2.1Source: DME
PETROLEUM EXPORTSTOTAL VALUE : A$3.24 Billion
Japan67%
Other8%
New Zealand2%
Taiwan8%
S Korea6%
USA7%Indonesia
2%

1998 STATISTICS DIGEST
Department of Minerals and Energy
18
Figure 2.3Source: DME & ABARE
CRUDE OIL & CONDENSATE PRODUCTION
GL
35
30
25
20
15
10
5
01965 1970 1975 1980 1985 1990 1995
Rest of Australia
Western Australia
Project (NWSGP) having capacity installed beyond
that required to meet the current level of firm long-
term contract sales to Japan. Capacity could indeed
be increased further if plans to construct two
additional LNG trains reach fruition. The NWSGP's
expansion plans involve adding two more processing
trains to the three that have been operating since the
mid 1980s, six extra LNG carriers, a fractionation plant,
two additional power generation units, an extra LNG
jetty berth, an extra LNG storage tank and a utilities
upgrade. This would double LNG production capacity
to almost 14.5 million tonnes per annum.
At this stage a front end engineering design for the
proposed expansion of the LNG project is being
carried out. It is expected to be completed by mid
1999. This is a preliminary step before the calling of
final tender contracts for procurement and
construction of the proposed expansion. Expenditure
on the final tender contracts is conditional upon the
NWSGP joint-venture partners securing long term
LNG sales contracts with their Japanese customers.
Crude oil production increased 15% to 69 million
barrels. A major contribution to this increase came
from the State's largest oilfield, Wanaea -Cossack, which
despite a temporary shutdown of the Wanaea floating
production, storage and off-loading (FPSO) facility in
April 1998, overall recorded much higher output
during the year. Production in 1998 was also boosted
due to higher output from the Griffin project which
recommenced production in January 1998 after being
shutdown for repairs over the previous three months.
Additional contributions to increases in the State's oil
output came from the commencement of production
from the Stag field in May 1998 plus the first full year
of production from the Wandoo ‘B' platform, the
Agincourt field and the Lambert -Hermes project.
Oil prices halved over the last two years as the Asian
economic crisis crushed demand and global
inventories ballooned. OPEC production controls have
also met with little success resulting in severe oil price
drops over 1998. Consequently, despite the State's
crude oil output increasing 15%, the low prices
converted this into the overall value of crude oil
production actually being down 15% to $1,459
million.
Condensate production increased 9% to reach a new
record high of 44 million barrels. This was chiefly
due to greater output from the North West Shelf
Project, particularly North Rankin and Goodwyn.
Again, lower oil prices resulted in the actual value of
condensate production being down in 1998 by over
13% to $956 million. Future output of condensate
may increase further, particularly if the NWSGP's
Figure 2.2Source: DME
OIL & CONDENSATEProduction and Value by Quarter
$A MillionGL
5.0
4.5
4.0
3.5
3.0
2.5
2.0
1.5
1.0
0.5
0.0
800
700
600
500
400
300
200
100
0
Mar 97 Jun 97 Sep 97 Dec 97 Mar 98 Jun 98 Sept 98 Dec 98
Quantity
Value

Department of Minerals and Energy
1998 STATISTICS DIGEST
19
TAPIS CRUDE OIL PRICE : US$/bblUS$
Figure 2.4Source: WA Treasury Corp.
28
26
24
22
20
18
16
14
12
10Jan 97 Jul 97 Jan 98 Jul 98
liquids expansion program reaches fruition. This
program is part of the NWSGP's expansion plans
mentioned earlier and would lift NWSGP condensate
production from its present rate of about 115 thousand
to 130 thousand barrels a day.
Decreased sale contract volumes and lower realised
prices resulted in the value of Western Australian
natural gas production in 1998 falling 8% to $527
million. 1998 was also the second full year of
production from Woodside Petroleum's liquefied
petroleum gas (LPG) plant. Whilst most exported LPG
production continued to go to Japan, new export
destinations were China, the Philippines and Lebanon.
The new export markets facilitated a 13% increase in
production to over 648 thousand tonnes of LPG butane
and propane products. However, low prices for
petroleum products meant that the total value of
production for LPG was down in 1998 by 15% to $142
million.
World Oil Market and Outlook
Oil prices fell heavily in 1998, being 38% down on
average compared to the previous year. A particularly
steep decline in oil prices occurred in the closing
months of the year with the price of West Texas
Intermediate for example, dropping to US$10.35 per
barrel - its lowest level in 23 years. Several factors
have been responsible for this including the failure
of OPEC's proposed production cuts in late March
1998 to materialise to the extent promised. A major
hindrance to the effectiveness of OPEC controls on
output has been the extent of non compliance by
OPEC members. Further discussions by OPEC
regarding production cuts have been mooted in March
of this year, but until the issue of compliance is
resolved, it is unlikely they will be carried out.
An additional factor the depressed oil market needs
to deal with is the return of Iraq to the market. Oil
production from Iraq has been surging with the
country currently producing 2.7 million barrels a day,
its highest output since the end of the Gulf War in
1991. New production has also entered the market
from countries such as Russia, Norway, Mexico and
Venezuela.
Compounding depressed prices caused by
overproduction has been slow demand in Asia, a
relatively warm northern hemisphere winter and high
global stock levels. The oil price outlook therefore
remains weak, with most analysts expecting prices
to remain around the US$13.00 to US$15.00 per barrel
mark over 1999.
State Outlook
Given the depressed oil price outlook, the short term
prognosis for the State's petroleum sector over the
coming year is subdued. Significantly, in January 1999
Woodside commenced a major shutdown of the
Cossack Pioneer offshore oil and gas production
facility for maintenance. The maintenance program
is expected to take around six months. This will lower
the State's crude oil output at least over the first half
of 1999. However, completion of the maintenance
program will see oil production from the Wanaea/
Cossack field increase from the current output of 90
thousand barrels per day to 115 thousand barrels per
day. Gas production from the field is also expected
to increase.
In the longer term, current forecasts indicate total
condensate and crude oil production will decline after
2002 unless there is a significant increase in successful
exploration activity over the next few years.
Undermining the exploration effort however has been
the global oil price slump. This is forcing companies
to cut their exploration budgets, particularly outside
the low cost production areas.

1998 STATISTICS DIGEST
Department of Minerals and Energy
20
Figure 2.6Source: DME & ABARE
IRON ORE PRODUCTION
Mt
160
140
120
100
80
60
40
20
01950 1955 1960 1965 1970 1975 1980 1985 1990 1995
Rest of Australia
Western Australia
Low oil prices and the economic downturn in Asia has
also led to uncertainty in the LNG industry. Up until
the middle of 1997 demand forecasts were universally
confident of continually increasing demand. However,
the Asian downturn has put in question the LNG
industry's expansion plans. It is almost certain that
new LNG projects such as the NWSGP expansion plans
mentioned earlier will proceed, the question is when.
This similarly applies to greenfield developments such
as the Gorgon, North Gorgon, Spar, West Tryal Rocks,
Chryasor and Dionysus gas fields. So despite the short-
term drop in confidence, the long-term outlook is still
good as LNG projects are based on long-term
commitments between buyers and sellers and the
current downturn is likely to have little effect beyond
a delay in start up dates.
With the availability of significant resources, Western
Australia's gas production is very much dictated by
demand which shows steady growth, not only from
existing, but also potential new customers. In
particular, strong increases in industrial sector demand
are expected. In relation to the chemical sector, of
particular relevance was the announcement by the
State Government on 10 June 1998 that the Dow
Chemical Company and Shell Chemicals Limited had
won the right to develop proposals for the construction
of a $3 billion integrated petrochemical plant either
on the Burrup Peninsula or Maitland industrial estate
near Karratha. The first stage of Dow/Shell's feasibility
study was to be completed by the end of 1998 with a
view to begin physical implementation of the project
in 2000.
2.3 Iron Ore
Unseasonably wet weather in the middle of the year
and contracting steel production led to iron ore output
falling in 1998 by 6% to 143 million tonnes. However,
the value of production of Western Australia's iron ore
industry increased by 13% to reach a record amount
of $4,097 million. This outcome was achieved through
a combination of two favourable factors, namely higher
prices attained at a previous round of negotiations in
early 1998 and the depreciation of the Australian dollar.
Over 95% of Western Australia's iron ore production
was exported overseas, with the State being the
world's leading iron ore exporter. Almost half of the
exported iron ore went to Japan, a quarter to China
and the remainder mostly split up between South
Korea, Europe and Taiwan.
1998 Iron Ore Industry Highlights
The15% devaluation of the A$ relative to the US$
during 1998 was the most significant contributor to
the increased value of production. However, slightly
higher prices also helped. For the Japanese fiscal year
(JFY), April 1998 to March 1999, Western Australia's
three major producers secured from Japanese buyers
price increases of 2.9% and 2.8% for lump and fine
ore respectively.
Figure 2.5Source: DME
IRON ORE EXPORTSTOTAL VALUE : A$3.90 billion
Japan45%
S. Korea13%
Other1%
Taiwan7%
Europe13%
China21%

Department of Minerals and Energy
1998 STATISTICS DIGEST
21
Figure 2.7Source: Tex Report, High Grade Fine Ore Prices
IRON ORE PRICE : A$/Fe unitA$
0.50
0.46
0.42
0.38
0.34
Jan 97 Jul 97 Jan 98 Jul 98 Dec 98
Figure 2.8Source: DME
IRON OREProduction and Value by Quarter
$A MillionMt
50
40
30
20
10
0
1250
1000
750
500
250
0
Mar 97 Jun 97 Sep 97 Dec 97 Mar 98 Jun 98 Sep 98 Dec 98
QuantityValue
Price increases were nevertheless achieved under
difficult negotiating circumstances. In 1998 iron ore
markets began to come under increasing downward
pressure from collapsing steel and pig iron production
which fell around 2% and 1% respectively in 1998.
Japan's steel and pig iron production however,
underwent greater decreases of around 11% and 4%
respectively. Overall, including Japan and China, Asian
steel production fell around 2% in 1998, while pig iron
production was only down marginally. The overall
Asian outcome was not as severe as Japan's due to
China in 1998 recording an estimated 5% and 2%
growth in its steel and pig iron output respectively.
Locally, the most significant development in the iron
ore industry during 1998 was Hamersley Iron's
completion of its Yandicoogina (HiYandi) iron ore
project. This greenfield project is the second major
iron ore development (after BHP's Yandicoogina) in
the region east of the Karijini National Park.
Hamersley's Yandi mine is located approximately 90km
north west of Newman, in close proximity to BHP's
Yandi mine. Hamersley commenced mining at Yandi
in August 1998 with the first shipment being loaded
in January 1999. At full production the mine will
produce up to 15 million tonnes per annum of sinter
fines material.
Development of HiYandi involved improving and
expanding Hamersley's Dampier port facilities to
increase its capacity by some 10 million tonnes per
annum. The expansion entailed maximising utilisation
of existing equipment and infrastructure, installation
of new equipment, construction of a lay-by berth at
East Intercourse Island and dredging of loading basins
at Parker Point. A railway line linking HiYandi to
existing rail facilities also needed to be constructed.
Nearby, BHP's Yandi mine also reached a significant
milestone in 1998 by having crushed 100 million
tonnes of iron ore since the mine commenced
production in 1992. This was achieved after only six
years of operation during which Yandi has become
one of the worlds top six iron ore mines.
BHP also mostly completed its iron ore capacity
expansion at Nelson Point in Port Hedland in 1998.
Since late 1996, the upgrading of ore handling facilities
at Nelson Point has included the installation of a third
ore car dumper, crushing and screening plant upgrades,
new marshalling yard facilities and rail line
debottlenecking. All up, these upgrades have enabled
BHP to lift ore handling capacity at Nelson Point from
44 million to 66 million tonnes per annum.
However, the economic turmoil in Asia forced BHP
to suspend mine development of its Mining Area C
(MAC) and Newman Orebody 18, even though the
1998 STATISTICS DIGEST
Department of Minerals and Energy22
latter already had railroad formation earthworks in
place and a power line under construction.
Outlook
Prospects of the iron ore industry are of course reliant
on the fortunes of the steel making industry which in
turn depend on world growth. After slowing from
4.1% in 1997 to 2.3% in 1998, ABARE has tipped
another fall in global economic growth to 1.9% in
1999. This does not bode well for steel demand. Steel
consumption in the US and Western Europe is forecast
to slow in line with slowing industrial production
growth in those regions. Of particular concern has
been the accelerated rate at which steel and pig iron
production began to fall in Europe and the US towards
the end of 1998. Up to now weakness in the steel
market was restricted to Asia. Analysts now predict a
contraction in global iron ore trade of over 3% in 1999.
Of special relevance to the local iron ore industry is
the predicted continuity of depressed steel production
in the recession hit Japanese steel making industry.
Japanese crude steel production has been depressed
and unfortunately suffered greater production cuts as
1998 drew to a close. A collapse in demand at home
and abroad has seen Japanese steel production tipped
to fall in 1999 to its lowest level in 27 years, with
Japanese steel makers suggesting that their output
could be down 8% to 84 million tonnes in the coming
year.
Consequently, in February 1999 Western Australian
iron ore producers had to accept much lower than
expected prices for the Japanese fiscal year (JFY), April
1999 to March 2000. BHP and Hamersley Iron both
settled for an 11.0% cut in their fine ore price to
US26.63cents per dry long ton unit (about US$17 per
tonne) and a 10.2% cut in the lump ore price to
US34.83 cents per dry long ton unit (about US$22
per tonne). North Ltd's Robe River joint venture had
to accept a 13.4% cut for its lesser quality fines
product. BHP suffered a double blow insofar it also
had to drop agreed deliveries by some 8%.
Hamersley's tonnage was cut back by a smaller 4%.
It is unclear as to the direction in which Chinese steel
production is headed. The Chinese Government's
announcement that it would spend more on building
roads, highways and telecommunications networks
has been interpreted by some as meaning that China's
steel requirements and hence iron ore imports will
rise. However, China's steel inventories are believed
to have increased markedly in 1998 and this has
prompted Chinese authorities to slash the country's
steel output in 1999 by 10% in an effort to curb the
slide in price and ease domestic oversupply. Chinese
steel makers have also remarked that they are
experiencing profit drops or losses. A similar picture
is emerging for another major importer, South Korea.
In late 1998, South Korea's main steel producer, Posco,
announced that steel production and exports would
be temporarily cut in response to the low level of
international demand. This is interrelated with the
increased difficulties Asian countries in general are
now experiencing in exporting steel to Europe and
the US. Steel producers in both these regions (plus to
a lesser extent Brazil, Mexico and Thailand) believe
their countries are importing cut price ‘dumped' steel
and are calling on their respective governments to
restrict foreign access to their domestic markets.
In total, global economic and steel industry
developments do not augur well for Western Australian
iron ore producers. Global economic developments,
particularly in Asia, have also enforced a more critical
consideration of new iron ore projects and in
particular, moves towards downstream processing. A
plethora of iron ore processing projects remain simply
‘under consideration’. Western Australia has a ready
availability low cost iron ore and natural gas resources,
close proximity to Asia and sophisticated
infrastructure. Unfortunately, the Asian economic
slowdown now looms as the major hurdle, posing not
only marketing difficulties for potential new DRI
projects but also initial financing hindrances.
Significantly though, after 40 months BHP completed
construction of its direct reduced iron (DRI) plant in
Port Hedland. This is Western Australia's first new
downstream iron ore processing facility. Though
commissioning of the project is still underway, the first
briquettes from this plant were produced in late
February 1999 and the first shipment of briquettes in
April 1999.

Department of Minerals and Energy
1998 STATISTICS DIGEST
23
2.4 Gold
Depressed international gold prices have continued
to place pressure on the industry to rationalise
production. Closure of gold projects resulted in the
State's overall gold production dropping in 1998 by
3% to 231 tonnes (7,423 thousand ounces).
Nevertheless, thanks to the devaluation of the
Australian dollar in 1998, the value of the State's gold
output still managed to rise, albeit by a small 2% to
$3,469 million.
The international gold price averaged US$294 per oz
in 1998. This was 11% lower compared to the average
price in 1997. Local producers were sheltered from
the full effect of the lower gold price thanks to a
depreciated Australian currency. This converted the
international price decrease to a 5% average increase
in Australian prices over 1998. Local producers were
also assisted by maintaining extensive gold hedging
positions.
In 1998 the State's gold exports amounted to $4,089
million. This exceeded the value of production
because previously stockpiled refined gold stocks
were included in exports. Predominant gold export
markets were the UK (24%), South Korea (17%),
Singapore (12%), Switzerland (11%) and the US (10%).
Gold Industry Highlights
Low gold prices have inevitably seen the gold mining
industry in Western Australia undergo some
rationalisation. This has manifested itself through
tenement or lease rationalisation, closures,
Figure 2.9Source: DME
GOLD EXPORTSTOTAL VALUE : A$4.09 billion
Singapore12%
Japan5%
USA10%
UK24%Switzerland
11%
S. Korea17% Hong Kong
8%
Other13%
Figure 2.10Source: Perth Mint
GOLD PRICE : A$/ozA$
495
480
465
450
435
Jan97 Jul 97 Jan 98 Jul 98 Dec 98
consolidation of operations and also expansion of
some mining companies via corporate takeovers and
acquisitions to reap economies of scale in an effort
to reduce costs. An example of this was Great Central
Mines (GCM) twin takeover of Wiluna Mines and Eagle
Mining Corporation. This was part of a strategy by
GCM to rationalise and consolidate properties in the
Yandal and adjacent Milrose and Wiluna Belts in
Western Australia. Also, Normandy as part of its
Boddington joint venture in late 1998 purchased the
resources of the nearby Hedges gold mine. Normandy
has since figured again in the ownership change stakes
by taking up a significant share in GCM.
Weakness in the A$ has also increased the
attractiveness of local companies to overseas gold
mining companies, particularly from North America.
This was exemplified earlier in 1998 by Homestake
Mining Company's acquisition of Plutonic Resources,
where not only a large production base was absorbed
but also a substantial tenement position in the Yandal
Belt.
Over half (52%) of Western Australia's gold output in
1998 was accounted for by the following 11 projects:
• Golden Mile (Normandy, Homestake) — 24.3
tonnes
• Granny Smith (Placer, Delta) — 16.9 tonnes

1998 STATISTICS DIGEST
Department of Minerals and Energy
24
Figure 2.12Source: DME
CUMULATIVE WA GOLDPRODUCTION BY MAJOR PROJECTS
0 5 10 15 20 25 30 35 40 45 50 55 60
Number of Projects
tonnes
250
200
150
100
50
0
Figure 2.11Source: DME & ABARE
GOLD PRODUCTIONtonnes
350
300
250
200
150
100
50
0
1898 1918 1938 1958 1978 1998
Rest of Australia
Western Australia
• Kambalda St Ives (WMC) — 13.2 tonnes
• Telfer (Newcrest) — 10.6 tonnes
• Jundee-Nimary (Great Central Mines) — 9.8 tonnes
• Kanowna Belle (North, Delta) — 9.3 tonnes
• Plutonic (Homestake) — 8.1 tonnes
• Bronzewing (Great Central Mines) — 7.9 tonnes
• Boddington (Newcrest, Normandy, Acacia) — 7.9
tonnes
• Paddington (Goldfields Kalgoorlie) — 6.5 tonnes
• Sunrise Dam (Acacia) — 5.9 tonnes
Notably, ownership of the above list of 11 projects is
relatively concentrated amongst several significant
mining companies. Rationalisation also meant that
1998 saw a number of relatively large gold mines cease
operation and reconfiguration of some operations.
Sons of Gwalia for example, as part of its rationalisation
of operations closed down its Nevoria and Laverton
mines and St Barbara ceased open pit mining in
Meekatharra. Mine closures in 1998 also included
Bullabulling, Mt Gibson, Mt Morgans, Marymia, Lynas
Find, Bannockburn, Reedy and Two Boys. These
operations in total produced approximately 17 tonnes
of gold in the previous year.
Decreases in Western Australia's gold output due to
closures was made up for by increased output from
some existing projects plus the start up of new mining
operations such as Golden Feather, Paraburdoo,
Cornishman and Karonie.
Takeovers and amalgamations also extended to the
gold refining business. In October 1998 the Western
Australian Government's Gold Corporation
(GoldCorp) and Golden West Refining Corporation
reached an agreement to establish one of Australia's
largest refiners of gold and silver. The new joint
venture company, headquartered in Perth utilises all
the assets of Golden West and the Indonesian, Thai,
Hong Kong and Australian assets of GoldCorp, with
the exception of its coin and minting business.
On a national scale, the low gold price motivated the
Australian gold industry in October to band together
to form the Australian Gold Council (AGC). The
council's aim is to raise the profile of the gold industry
on the national and international stage. It also planned
to, among other, to facilitate research into the
economic and social contribution of the gold industry,
address specific tax issues, produce publications,
generate education initiatives and lobby the ASX to
develop a world class gold index.

Department of Minerals and Energy
1998 STATISTICS DIGEST
25
Figure 2.13Source: DME
GOLDProduction and Value by Quarter
$A Milliontonnes
80
70
60
50
40
30
20
10
0
900
750
600
450
300
150
0
Mar 97 Jun 97 Sep 97 Dec 97 Mar 98 Jun 98 Sep 98 Dec 98
Quantity
Value
World Gold Market
The year started badly for gold prices, hitting an 18-
year low of US$280 per oz in January 1998. Prices
subsequently moved upward to a high of US$314 per oz
in April, but a weaker yen prompted fears of a further
slowdown in demand for gold from Asia. Hence, by
August prices had fallen again to near US$270 per oz..
Prices subsequently managed to scramble up to
average around US$291 per oz for the remainder of
the year. Overall, the international gold price averaged
US$294 per oz in 1998, 11% down compared to the
average price in 1997. This was the lowest average
annual gold price since 1978.
A major feature of 1998 was the failure of gold to
respond in any way that suggested a ‘safe haven’ role
for the metal. Many analysts pointed to the numerous
events in 1998 that might have attracted funds into
gold but failed to do so, including diverse events as US
presidential impeachment proceedings, Wall Street
stock market shocks, events in Iraq and Russia's debt
problem. These exemplified that gold has in recent
years been increasingly acquiring the status of a
commodity, rather than that of a financial vehicle.
Gold Market Outlook
Low global growth, modest inflation outlook and an
unchanged fundamental picture point to gold trading
little changed during the coming year. At ABARE's
Outlook Conference in March 1999 the gold price
was forecast to remain subdued in 1999 (averaging
US$295 per oz). This forecast was based on the
expectation that world gold fabrication demand will
remain weak in 1999 despite some recovery in Asia.
Gold used for fabrication purposes in India, China,
and the Middle East was forecast to decline by around
6%, while growth in gold fabrication use in Europe
and US was expected to slow. Beyond 2000, ABARE
saw the most positive fundamental influences on the
gold price to be an expected slight decline in mine
production and recovery in fabrication demand.
The most unpredictable element however is the
extent to which official and private sector above
ground stocks were available to fill any gaps between
mine supply and fabrication demand. Most analysts
predict that high levels of official sector sales and
lending, producer hedging and private disinvestment
will lead to real gold prices continuing their easing
downward trend of the past two decades.

1998 STATISTICS DIGEST
Department of Minerals and Energy
26
Figure 2.14Source: DME
ALUMINA EXPORTSTOTAL VALUE : A$2.17 billion
Canada14%
Indonesia2%
Russia2%
Eygpt5%
Other3%
USA26%
UAE9%
China8%
Bahrain13%
South Africa18%
Figure 2.15Source: DME & ABARE
ALUMINA PRODUCTIONMt
14
12
10
8
6
4
2
01960 1965 1970 1975 1980 1985 1990 1995 1998
Rest of Australia
Western Australia
2.5 Alumina
Western Australia's alumina output continued to
increase, up by 2% on the previous year to reach a
new record high of 8.6 million tonnes. The value of
this production also soared, by 15%, to hit a record
$2,397 million. Favourable prices received by local
producers resulting from Australian currency
devaluation was chiefly responsible for the increased
value of production.
Over 90% of the State's alumina production was
exported overseas. Over a quarter went to the US
(26%), with other significant destinations being South
Africa (18%), Canada (14%) and Bahrain (13%).
1998 Alumina Industry Highlights
After rising in1997, spot prices for alumina fell in 1998,
particularly in the later half of the year. Overall, the
world alumina spot price averaged US$192 per tonne
in 1998 which was 11% down on the previous year.
Several factors contributed to the price fall. Firstly,
approximately 90% of the western world's aluminium
producers source some of their alumina via contracts
which are based on the LME aluminium price. Hence,
alumina prices fell as the aluminium price decreased.
Secondly, the consumption of alumina by primary
aluminium smelters increased by less than 1% in 1998.
This weak demand largely ref lected production
problems that beset numerous aluminium producers
in 1998. Combined with a 2% increase in world
alumina production, these factors placed downward
pressure on prices.
In 1998 work on the Worsley Alumina refinery
expansion continued. In December 1998 the
Figure 2.16Source: DME
ALUMINAProduction and Value by Quarter
Mar 97 Jun 97 Sep 97 Dec 97 Mar 98 Jun 98 Sep 98 Dec 98
$A MillionMt
2.5
2.0
1.5
1.0
0.5
0.0
600
500
400
300
200
100
0
Quantity
Value
engineering component of the project was about 70%
finished with the construction phase about 15 %
complete. This is the largest resource development
project in the State's South West region for over a
decade. Completion of the Worsley refinery is forecast
to increase alumina production from the present level

Department of Minerals and Energy
1998 STATISTICS DIGEST
27
of 1.75 million tonnes per annum to 3.1 million tonnes
per annum by the first quarter of 2000. Worsley also
expects to reduce its operating costs by at least 10%
to US$92 per tonne as a result of the expansion. This
should position it as the world's lowest cost alumina
producer.
The State's other alumina producer, Alcoa, also
continued work on its Wagerup refinery expansion.
The Wagerup refinery is the third of Alcoa's three
refineries in Western Australia. The Wagerup refinery’s
current capacity is 1.75 million tonnes a year and the
expansion will take the refinery’s capacity to 2.19
million tonnes per year. Completion is expected by
mid 1999. The expansion is the first stage of an overall
program to enhance the Wagerup refinery's capacity
to 3.3 million tonnes per annum. Alcoa's other two
refineries in Western Australia are Pinjarra and Kwinana
(capacity of 3.1 and 1.9 million tonnes respectively).
In 1998 mining was concluded at Alcoa's Jarrahdale
operation. Started in 1963, Jarrahdale was the oldest
bauxite mine operated by Alcoa in Western Australia.
Closure took place as the technology at Jarrahdale
lacked the flexibility and economies of scale at Alcoa's
two other bauxite mines at Huntly and Willowdale. It
is planned that Alcoa's Huntly mine east of Pinjarra
will be expanded to become a 20 million tonne per
annum operation effectively absorbing Jarrahdale's
output of 7 million tonnes per annum.
In other developments, Alichem continued work on
its plans to establish Australia's first aluminium fluoride
plant at Kwinana. A pre-feasibility study for processing
alumina hydrate to produce 40 thousand tonnes per
annum of aluminium fluoride has been completed.
Outlook
At ABARE's Outlook 99 Conference aluminium stockswere expected to rise as production exceededconsumption. Consequently, an approximate 13%decrease in spot aluminium prices during 1999 wasforecast. However, it was cautioned that there wereseveral uncertainties regarding the final price outcomesuch as the timing and extent of economic recoveryin Asia, producers shutting down high cost capacityin response to falling prices and the extent to whichhedging activity will drive short term pricemovements.
Alumina prices were therefore projected to weakenfurther in 1999 and 2000, in line with the predictedfall in aluminium prices, to average around US$140per tonne. This is based on new alumina refining
Figure 2.17Source: ABARE
ALUMINA PRICE : A$/tonne$A
320
300
280
260
240
220
Jan 97 Jul 97 Jan 98 Jul 98 Dec 98
capacity anticipated to commence production in thenext two years including the aforementioned Wagerupand Worsley refinery expansions, a 400 thousandtonne a year expansion at Nalco's Damanioli refineryin India; and a new refinery being built in Iran with
an expected capacity of 280 thousand tonnes a year.

1998 STATISTICS DIGEST
Department of Minerals and Energy
28
Figure 2.19Source: DME & ABARE
NICKEL PRODUCTIONkt
140
120
100
80
60
40
20
01965 1970 1975 1980 1985 1990 1995 1998
Rest of Australia
Western Australia
2.6 Nickel
Western Australia's nickel output underwent its sixth
successive annual increase in 1998. Output of matte,
metal and concentrate nickel products in 1998 was
up by 14% to reach a new record high of 143 thousand
tonnes of contained metal. However, the higher
output was insufficient to counteract very low nickel
prices in 1998. International nickel prices were down
on average in 1998 by a third compared to the
previous year. As a result, the value of the State's
production was down 9% to $1,039 million.
Western Australia accounted for around 99% of
Australia's nickel production, with almost all
production exported overseas. The dominant export
destination was Europe, with over half of production
shipped to that region.
1998 Nickel Industry Highlights
Western Australia's nickel production continued to
climb in 1998. This was due to increased production
levels from WMC's Mt Keith and Kambalda operations
along with higher output from the company's
Kalgoorlie smelter and Kwinana refinery. New nickel
operations also helped boost output.
A new project which added to output in 1998 was
Black Swan Nickel's underground mine at Silver Swan
near Kalgoorlie. This operation commenced shipping
concentrates from Esperance in 1997. A full year's
production from the project in 1998 saw it contribute
over 12 thousand tonnes of contained nickel to the
State's output of various nickel products in 1998. On
Figure 2.18Source: DME
NICKEL EXPORTSTOTAL VALUE : A$ 1.02 Billion
Europe54%
Taiwan6%
Other5%
Japan20%
NorthAmerica
15%
a smaller scale, in April 1998 Titan Resources began
production from the resurrected Radio Hill nickel
mine, 30 km south of Karratha. Concentrates from
Radio Hill are delivered to WMC's drying plant in
Kambalda via a 1,900 km inland transport route,
believed to be the longest road haul for a resource
product anywhere in the State, if not Australia.
In other developments, Dominion Mining finally sold
its dormant Yakabindie nickel project to North Ltd.
Yakabindie is one of the world's largest undeveloped
nickel projects and the sale to North included a licence
for the use of the innovative activox processing
technology.
The nickel market has been in poor condition due to
surplus stocks, lacklustre demand from stainless steel
producers, the ready availability of nickel and steel
scrap from Russia plus the imminent start up of new,
low-cost nickel supplies. Of particular note in 1998,
nickel demand was hurt by falls in stainless steel
demand in Asia. Japan's stainless steel output fell 17%
in 1998 as a result of reduced export opportunities in
Asia and a marked slump in demand in its domestic
economy. After relative buoyancy in the first half of
the year, stainless steel consumption in the rest of Asia
also fell dramatically in line with contraction in
industrial activity in the region. This region's stainless

Department of Minerals and Energy
1998 STATISTICS DIGEST
29
Figure 2.20Source: LME Cash, Monthly Average
NICKEL PRICE : A$/tonne
$A 000’s
11
10
9
8
7
6
Jan 97 Jul 97 Jan 98 Jul 98 Dec 98
steel output and thus nickel demand was supported
in the first half of the year by increased export of
stainless steel to Europe and the US. But opportunities
to export to these sources and exploit Asia's weakened
currencies diminished in the latter half of 1998 as anti
dumping barriers began to be raised.
A positive factor in 1998 was growing industrial
production in Western Europe and the US which
supported increased stainless steel production.
However, this was insufficient to halt the downward
slide in the nickel price over the last two years. It
culminated in December 1998 with nickel hitting a
15 year low of US$3,726 per tonne (US$1.69 per lb)
based on fears of world oversupply because of new
nickel projects coming on stream. Overall, nickel
prices were down on average in 1998 by 33%
compared to the previous year.
The significant fall in the price of nickel and poor
outlook led WMC to announce in September 1998 the
closure of three high-cost mines at its Kambalda nickel
operation (Wannaway, Blair and Otter-Juan). These
closures alone represent a cut in WMC's production
of about 10,000 tonnes a year, or approximately 10%.
Further cutbacks in WMC's Kambalda operations were
announced in March 1999 with the closure of the Long-
Victor and Mariners underground mines. This will cut
another 10,000 tonnes of nickel from WMC's output.
These cuts leave the Lanfranchi/Schmitz and Coronet
sites as the last two producing nickel mines in WMC's
Kambalda operations.
Outlook
The market outlook is for nickel prices to initially rise
in the first half of 1999 and then to subsequently ease
as additional low cost capacity comes into production
in Western Australia. Initial price increases have
already been realised in the first quarter of 1999 as
nickel output has been cut. In addition to the
aforementioned Kambalda mine closures by WMC, the
company also temporarily shutdown its Kalgoorlie
smelter in January 1999 for a major maintenance
program following the detection of a furnace leak.
Operations have since returned to normal but it has
been estimated that WMC's refined nickel metal
output for 1999 could have been cut down by up to
15%.
Other nickel production cuts have also been
announced from further afield, by Inco of Canada,
Norilsk of Russia and Larco of Greece. However, whilst
the cuts have come as a welcome reprieve for the
battered nickel price, any gains may be short lived.
Most of the capacity can be brought back into
production relatively quickly and pressure on prices
Figure 2.21Source: DME
NICKEL METALProduction and Value by Quarter
$A Millionkt
Mar 97 Jun 97 Sep 97 Dec 97 Mar 98 Jun 98 Sep 98 Dec98
35
30
25
20
15
10
5
0
350
300
250
200
150
100
50
0
Quantity
Value

1998 STATISTICS DIGEST
Department of Minerals and Energy
30
to go down and established producers to reduce
output will be exacerbated if new producers (with
potentially much lower production costs) succeed in
quickly moving to rated capacity.
The new producers are namely Western Australia's
three new lateritic nickel projects - Cawse, Bulong and
Murrin Murrin which all entered the final stages of
commissioning in the first quarter of 1999. These
projects utilise new high pressure acid leach
technology to extract nickel. Centaur Mining's Cawse
nickel project has been the first of the new operations
in the State to deliver product to the market. Notably,
Cawse is the first plant worldwide to produce
commercial quantities of nickel metal using an
integrated process plant incorporating the pressure
acid leach, solvent extraction and electrowinning
process to treat lateritic ores.
The Cawse operation has a designed annual capacity
of around 9,000 tonnes of nickel and 2,000 tonnes of
cobalt. The first shipment of cobalt was despatched
from the Cawse plant in January 1999. Nickel
production started in January 1999 with the first
commercial shipment of nickel cathodes despatched
from the site in February. The cobalt sulphide product
contains about 40% cobalt and the nickel cathode
contains 99.8% nickel.
Preston Resource's Bulong operation is of similar
capacity to Cawse, with an annual capacity of 9,000
tonnes of nickel and around 1,000 tonnes of cobalt.
However, it produces nickel metal directly from high
pressure acid leaching by hydrometallurgical
processing without generating, unlike Cawse and
Murrin Murrin, an intermediate solid product. At the
time of writing, the first commercial production was
expected to begin in March 1999.
Anaconda-Glencore's Murrin Murrin facility near
Leonora is the largest of the new lateritic nickel
operations, with annual capacity of 45,000 tonnes of
nickel and 3,000 tonnes of cobalt. Anaconda reported
in early 1999 that the project was 70% complete.
Shipment of the first metal was expected in April. The
project proponent's ambitions are to later expand
production to produce around 70,000 tonnes of
contained nickel per annum. There are also plans to
expand to a second stage reaching 115,000 tonnes
per annum. This is almost equivalent to the entire
current State output.
Figure 2.22Source: WA Treasury
HEAVY MINERAL SANDS PRICE INDEX
INDEX (June 1990=100)
130
120
110
100Jan 97 Jul 97 Jan 98 Jul 98 Dec 98
2.7 Heavy Mineral Sands
The heavy mineral sands industry continued to grow
for the fifth successive year with the value of
production up by 9% to $691 million. This was
attributable to increased production of most mineral
sand products and local producers receiving
favourable contract prices thanks to a weakened
Australian dollar.
The total value of exported mineral sands reached
$606 million. Significantly, well over 60% of heavy
mineral sands exports went to destinations outside
Asia such as Europe and the US which alone accounted
for 36% and 28% respectively (Figure 2.23). It is not
surprising therefore that the heavy mineral sands
industry has weathered the Asian economic crisis
relatively unscathed compared to other mineral
sectors.
1998 Heavy Mineral Sands IndustryHighlights
A significant contribution to the industry's growth
came from the upgraded ilmenite sector, where the
value of production rose 19% to $283 million. This
was the result of local producers receiving higher
prices, principally through the devaluation of the A$

Department of Minerals and Energy
1998 STATISTICS DIGEST
31
Figure 2.23Source: DME
HEAVY MINERAL SANDS EXPORTSTOTAL VALUE : A$606 million
Taiwan6%
Spain3%
Japan14%
Other13%
USA28%
UK12%
China3%
Singapore2%
Italy6%
Netherlands13%
Figure 2.24Source: DME
HEAVY MINERAL SANDSValue of Production by Quarter
$A Million
200
180
160
140
120
100
80
60
40
20
0
Mar 97 Jun 97 Sep 97 Dec 97 Mar 98 Jun 98 Sep 98 Dec 98
and an 11% increase in output of upgraded ilmenite to
524 thousand tonnes. Output of upgraded ilmenite
(or synthetic rutile) rose in 1998 due to a full year's
production from Westralian Sands new synthetic rutile
plant. This is Westralian Sands' second plant at North
Capel and has more than doubled the company's
upgraded ilmenite production. In Western Australia
upgraded ilmenite is also produced by RGC Mineral
Sands at Capel and Narngulu, and TiWest which has a
plant at Chandala.
Ilmenite output increased over 4% in 1998 to reach
1.3 million tonnes. Devaluation of the A$ helped
the value of this production to increase by 13% to
$151 million. Increases in output were facilitated by
additional output from Cable Sands' new Yarloop
mining operation and BHP's new Beenup project.
Whilst BHP's Beenup project contributed to the State's
growth in mineral sands output, it was nevertheless
plagued with problems and only able to operate at
around 40% of its capacity. Principal troubles related
to the design and performance of the floating mineral
extraction plant, dredge and tailings disposal. This led
to BHP to announce in February 1999 the closure of
its Beenup operation.
Another operation which ceased activity was
Westralian Sands’ Yoganup North mine at Boyanup.
After having produced over 20 million tonnes of ore
over its 11 year life, in October 1998 the mine was
closed after having exhausted its resource.
Rutile production fell 15 thousand tonnes or 13% to
97 thousand tonnes. However, as the average price of
rutile received by producers was 17% higher in 1998
(thanks largely to the depreciation of the A$), value
of the State's rutile output only decreased by 3% to
$76 million.
Zircon production in 1998 was up 3% to 300,467
tonnes. This was despite declining grades from RGC's
Eneabba operation. Zircon prices have experienced
a downturn which has been somewhat inevitable after
a period of very strong demand and high prices. This
product is traditionally in heavy demand in the Asian
ceramics industry, but prices were cut by a price war
between suppliers and further damage was done by
the Asian downturn, economic upheavals in Russia
and China's higher production levels. Despite
devaluation of the A$, overall average zircon prices
received by Western Australian producers were
therefore down by 6%. Consequently, the value of
the State's production did not follow physical output,
with the total value of zircon production down 4% to
$154 million.
On the corporate front, the make up of the Western
Australian mineral sands industry changed at the end
of 1998 with the merger between RGC and Westralian
Sands. The merged entity will dominate the State's
mineral sands industry and in production terms is
expected to rank amongst the world's larger
producers accounting for approximately a third of

1998 STATISTICS DIGEST
Department of Minerals and Energy
Figure 2.25Source: DME & ABARE
ILMENITE & UPGRADEDILMENITE PRODUCTION
Mt
2.5
2.0
1.5
1.0
0.5
0.01957 1962 1967 1972 1977 1982 1987 1992 1997
Rest of Australia
Western Australia
the global titanium dioxide market. The merger brings
not only increased market power but also a range of
rationalisation measures including the closure of RGC's
Sydney office and downsizing of its Geraldton office.
RGC also closed the Eneabba dry separation plant with
an increased amount of shipment contracts expected
to be met through the consolidation of minable
reserves at RGC's and Westralian's Capel operations.
Outlook
Mineral sands have comparatively high technology end
use, chiefly in paint pigment and titanium metal
products such as sporting goods, aircraft and military
hardware. Therefore, prices for the titanium group of
mineral sand products (ilmenite, rutile and leucoxene)
have been relatively robust during the economic crisis
that swept through Asia, Eastern Europe and Latin
America. This is partly due to the high intensity of
usage in the strong US economy and the fact that global
capacity has quite a high concentration of ownership,
hence limiting the periodic ‘dumping' that affects so
many other resources.
Not surprisingly, ABARE has consequently predicted
that titanium based mineral sand prices are expected
to ease over 1999. This is based on an expectation of
slowing titanium dioxide pigment demand in line with
assumed lower economic growth in Europe and the
US. There has already been evidence of this at the
end of 1998 and early 1999 with downward ‘price
corrections' for ilmenite and in particular, rutile.
However, price decreases should be moderated by
supply which to some extent is restricted. As an
example, in Western Australia, Westralian Sands/RGC’s
high grade deposits at Capel and Eneabba are largely
depleted and BHP's Beenup operation has closed. Also,
whilst substantial exploration activity is taking place
in the Murray Basin mineral province, encompassing
South Australia, New South Wales and Victoria,
production would appear to be limited to rutile and
zircon because of the distance to the nearest shipping
port. Further afield, the most significant new source
of supply, Sierra Rutile's mine in Sierra Leone has
remained closed. The future of mining activities in
Sierra Leone remain uncertain following persistent
political unrest which led to the mine's closure in
1995.
The price situation for zircon is similar with downward
price movement already experienced in early 1999.
This has been due to increased output from two South
African suppliers which may have been short lived.
Prices should remain subdued due to weak demand
in Asia, particularly Japan.
Uncertainty generated by world economic upheavals,
particularly those in Asian markets and/or
environmental factors have put on hold several new
Western Australian mineral sands projects. These
include Cable Sands' Jangardup South and Kemerton
mines, Millennium Inorganic Chemicals' titanium
dioxide pigment plant expansion at Kemerton and
Tiwest's Kwinana pigment plant expansion.
32

Department of Minerals and Energy
1998 STATISTICS DIGEST
2.8 Diamonds
Both sales value and volume record were broken by
the Western Australian diamond industry in 1998. The
volume of diamonds sold in 1998 was up by over 29%
to 52 million carats. A large portion of this increase
was accounted for by the sales from stocks. Thanks
in large part to the devaluation of the Australian dollar
the value of sales in 1998 was also up by a dramatic
48% to $622 million. This outcome was particularly
noteworthy given that US$ prices were down on
average over the year. All Western Australian
production was from the Argyle operation, the world’s
biggest individual diamond mine.
1998 Diamond Industry Highlights
In 1998 the increased sales volume and 15%
depreciation of the Australian currency both played
significant roles in boosting the value of the State’s
output, counteracting slightly lower average US$
diamond prices. Another beneficial factor in the
pricing equation however was the adjustment made
to the sales mix of goods to help maintain higher
prices and sales during what was otherwise another
difficult year.
The type of diamonds marketed by the Argyle
operation played an important role in boosting
physical sale quantities. Ironically, market
developments stemming from the economic
downturn in Asia have been a factor in the strong
growth in demand for lower value diamond products.
While strong demand continued from the US, a key
market for the Argyle product, benefits have also arisen
from ‘trading down’ evident in the traditionally higher
value markets of Japan, India and parts of South East
and East Asia. Basically, gem buyers in Asia are opting
to buy lower quality diamonds to help overcome the
weaker purchasing power of their own currencies.
Argyle was able to capitalise on this demand by
offering better assortments to customers.
The sale of a greater proportion of higher-grade
diamonds (gem and near gem) was also enabled by
more selective production and improved processing
techniques. This vastly improved the presentation of
rough diamonds. Combined, these aided in
maximising the run of mine price.
In 1998 Argyle diamond mine partners, Ashton Mining
and Rio Tinto finally revealed plans as to Argyle's
future. In June 1998 it was announced that
underground mining plans at the Argyle operation
were dropped in favour of a major expansion of the
existing open pit operations. The first stage of the
expansion involves a substantial cutback of an existing
pit wall which will sustain the mine for an extra 18
months. In addition, if given the go ahead, a second
phase expansion of the pit will expose enough new
ore to keep the mine operational for another seven
to 10 years. The second phase expansion, upon
completion still provides for the possibility of an
underground operation. Prior to these expansion
plans, ore reserves in the Argyle operation were
scheduled for depletion in 2003.
Outlook
The World Diamond Conference was held in Perth in
October 1998. It pointed out that demand in the US
and Europe was relatively buoyant, taking up some of
the slack from a lacklustre Asian market. World
production had also dropped and the CSO was
restraining sales, so it appeared as if there was at least
some degree of broad balance between overall
production and retail demand. However, inventories
were still high and production cuts may be insufficient
to ward off the effects of the Asian crisis and downturn
in the Japanese economy. The Diamond Conference
also did not appear to reach a consensus as to the
supply side of the equation. From one perspective,
the supply side was seen as more comfortable insofar
Russian output of diamonds was drying up and amidst
the economic and political turmoil of that country, it
was difficult, if not impossible to refinance and
develop Russia’s diamond operations. Similar
scenarios were unveiled for Angola, the Democratic
Republic of Congo and Sierra Leone.
A supply side factor which could compound diamond
marketing difficulties is the ever growing supply from
new and potential projects. The strategy of the CSO
is to maintain a tight rein on supply, but this is an
increasingly difficult task. Argyle has already
abandoned the cartel and the CSO has weathered
competition from this source by virtue of Argyle
output, albeit huge, being of comparatively low value.
However, two new mines have been of greater
concern to the cartel.
The two new mines of particular significance are Rio
Tinto’s Diavik and BHP’s Ekati (Lac de Gras)
operations, both in Canada. Combined, these two
operations could account for about 10% of future
33

1998 STATISTICS DIGEST
Department of Minerals and Energy
2.9 Other Minerals
Coal
Western Australian overall coal production from its
Griffin and Wesfarmers operations in Collie was
marginally down by 1% to 5.6 million tonnes in 1998.
Ref lecting lower energy prices, the value of
production dropped by 4% to $249 million.
Operations at Wesfarmers' Premier Mine continued
to see the consolidation of pits and the introduction
of new coal handling equipment. Coal production
from the Premier Mine will play an integral part in
providing feedstock for the 300MW coal fired power
station in Collie. Wesfarmers' seven year contract to
supply the new Collie power station is to commence
from July 1999.
Salt
Salt production increased by 4% to 8.5 million tonnes
and thanks to favourable prices and devaluation of
the Australian dollar, the value of this production
increased by 22% to $210 million. In 1998 the
expansion of Dampier Salt's operations near Karratha
was completed. This boosted salt production capacity
at Dampier from 2.5 million to 4 million tonnes per
annum. In combination with the use of bigger vessels,
it is hoped by Dampier Salt that competitiveness of
the State's product will increase. Shark Bay Salt also
started expansion of its primary ponds to increase
production capacity and 1998 also saw construction
of the new Onslow salt project. Approximately $100
million has been invested in the Onslow Salt project
by the Dutch company Akzo Nobel. It is expected to
produce 2.5 million tonnes of salt per annum with
first production expected in late 1999.
Base Metals
Total value of base metals production increased only
4% to $199 million. The chief contributors to this
were increases in zinc and lead production. Zinc
output was up by 32 thousand tonnes, or 27% to 149
thousand tonnes. Zinc prices continued to fall during
1998, being on average down by some 22% compared
to the previous year. Overall therefore, the growth in
the value of zinc production lagged physical output
growth, with total value up 7% or $8 million to
$126 million.
Western Australia's zinc production continued to
come from two sources, Normandy's Scuddles
operation and Western Metals' Lennard Shelf mining
world supply. In the case of BHP’s Ekati mine, the
first parcel of diamonds from the project was sold at
the end of 1998. Importantly for the CSO, in January
this year BHP and its partner Dia Met Minerals signed
a memorandum of understanding with the CSO
specifying that 35% of all diamonds produced from
the Ekati mine will be sold to the CSO.
As for the Diavik project, it is not expected to begin
production until at least 2001. Diavik is co-owned by
Rio Tinto and Aber Resources. At this stage the project
participants are still considering whether they will
be marketing part of the mine’s production through
the CSO.
Whatever arrangements are put in place, care will have
to be taken to maintain confidence in what is now a
fragile market. The emphasis will need to be on
continuing to strengthen prices rather than just
volumes. Clearly, global economic conditions are
creating a very challenging diamond marketing
environment.
34
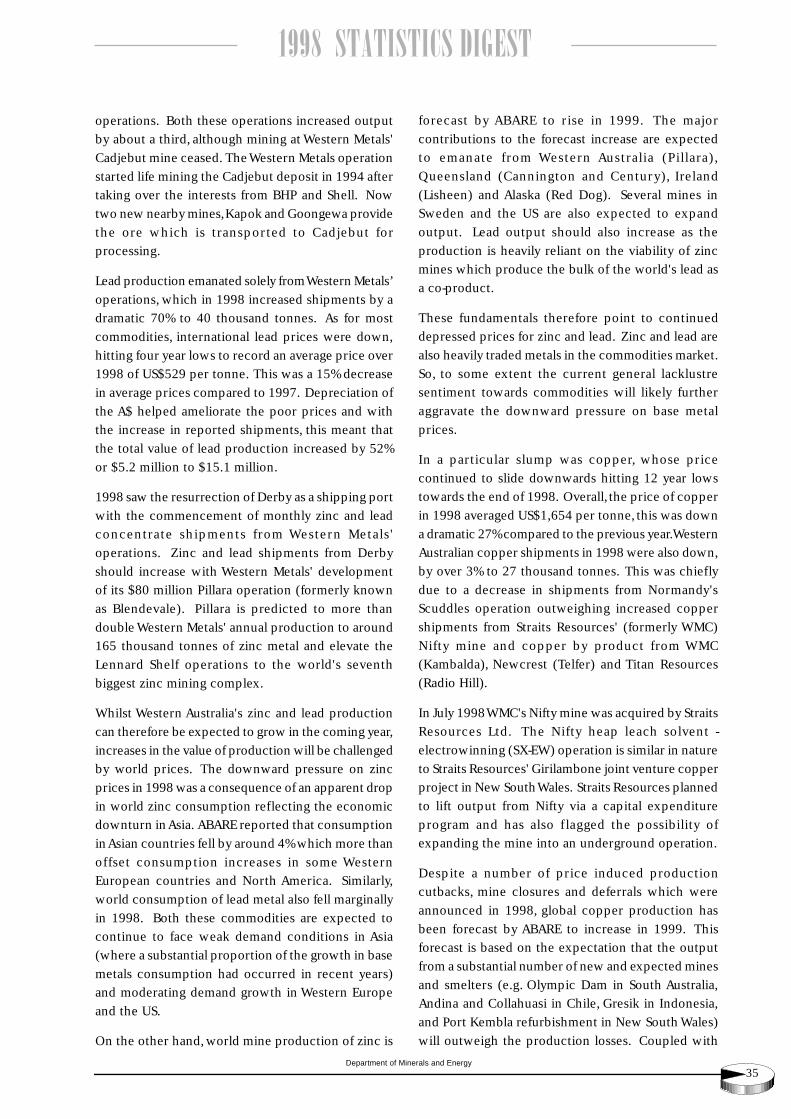
Department of Minerals and Energy
1998 STATISTICS DIGEST
operations. Both these operations increased output
by about a third, although mining at Western Metals'
Cadjebut mine ceased. The Western Metals operation
started life mining the Cadjebut deposit in 1994 after
taking over the interests from BHP and Shell. Now
two new nearby mines, Kapok and Goongewa provide
the ore which is transported to Cadjebut for
processing.
Lead production emanated solely from Western Metals’
operations, which in 1998 increased shipments by a
dramatic 70% to 40 thousand tonnes. As for most
commodities, international lead prices were down,
hitting four year lows to record an average price over
1998 of US$529 per tonne. This was a 15% decrease
in average prices compared to 1997. Depreciation of
the A$ helped ameliorate the poor prices and with
the increase in reported shipments, this meant that
the total value of lead production increased by 52%
or $5.2 million to $15.1 million.
1998 saw the resurrection of Derby as a shipping port
with the commencement of monthly zinc and lead
concentrate shipments from Western Metals'
operations. Zinc and lead shipments from Derby
should increase with Western Metals' development
of its $80 million Pillara operation (formerly known
as Blendevale). Pillara is predicted to more than
double Western Metals' annual production to around
165 thousand tonnes of zinc metal and elevate the
Lennard Shelf operations to the world's seventh
biggest zinc mining complex.
Whilst Western Australia's zinc and lead production
can therefore be expected to grow in the coming year,
increases in the value of production will be challenged
by world prices. The downward pressure on zinc
prices in 1998 was a consequence of an apparent drop
in world zinc consumption reflecting the economic
downturn in Asia. ABARE reported that consumption
in Asian countries fell by around 4% which more than
offset consumption increases in some Western
European countries and North America. Similarly,
world consumption of lead metal also fell marginally
in 1998. Both these commodities are expected to
continue to face weak demand conditions in Asia
(where a substantial proportion of the growth in base
metals consumption had occurred in recent years)
and moderating demand growth in Western Europe
and the US.
On the other hand, world mine production of zinc is
35
forecast by ABARE to rise in 1999. The major
contributions to the forecast increase are expected
to emanate from Western Australia (Pillara),
Queensland (Cannington and Century), Ireland
(Lisheen) and Alaska (Red Dog). Several mines in
Sweden and the US are also expected to expand
output. Lead output should also increase as the
production is heavily reliant on the viability of zinc
mines which produce the bulk of the world's lead as
a co-product.
These fundamentals therefore point to continued
depressed prices for zinc and lead. Zinc and lead are
also heavily traded metals in the commodities market.
So, to some extent the current general lacklustre
sentiment towards commodities will likely further
aggravate the downward pressure on base metal
prices.
In a particular slump was copper, whose price
continued to slide downwards hitting 12 year lows
towards the end of 1998. Overall, the price of copper
in 1998 averaged US$1,654 per tonne, this was down
a dramatic 27% compared to the previous year. Western
Australian copper shipments in 1998 were also down,
by over 3% to 27 thousand tonnes. This was chiefly
due to a decrease in shipments from Normandy's
Scuddles operation outweighing increased copper
shipments from Straits Resources' (formerly WMC)
Nifty mine and copper by product from WMC
(Kambalda), Newcrest (Telfer) and Titan Resources
(Radio Hill).
In July 1998 WMC's Nifty mine was acquired by Straits
Resources Ltd. The Nifty heap leach solvent -
electrowinning (SX-EW) operation is similar in nature
to Straits Resources' Girilambone joint venture copper
project in New South Wales. Straits Resources planned
to lift output from Nifty via a capital expenditure
program and has also f lagged the possibility of
expanding the mine into an underground operation.
Despite a number of price induced production
cutbacks, mine closures and deferrals which were
announced in 1998, global copper production has
been forecast by ABARE to increase in 1999. This
forecast is based on the expectation that the output
from a substantial number of new and expected mines
and smelters (e.g. Olympic Dam in South Australia,
Andina and Collahuasi in Chile, Gresik in Indonesia,
and Port Kembla refurbishment in New South Wales)
will outweigh the production losses. Coupled with

1998 STATISTICS DIGEST
Department of Minerals and Energy
continued weak copper consumption in parts of Asia
and rising stocks, the prognosis is for copper prices
to remain low.
Other
Tantalite production increased significantly, by 34%
to 400 tonnes. Tantalite has relatively specialised uses
in the electronics industry, and is also used in tool
steel, super alloys in the aviation industry and in the
chemicals industry. Tantalite prices have therefore not
followed the downward trend displayed by most
heavily traded mineral commodities in general. Whilst
tantalite prices achieved in the past have been high,
they have also displayed a certain degree of fluctuation.
In 1998 however, prices achieved for various sales
were remarkable in being consistently higher. In
combination with the depreciation of the A$, this
translated to the value of sales in 1998 increasing by a
dramatic 91% to $59 million.
Tantalite is chiefly sourced from Gwalia Consolidated's
Greenbushes mine, as is spodumene, the production
of which totalled 42 thousand tonnes worth $10
million in 1998. The Greenbushes mine is reportedly
the world's largest hard rock tantalum resource and
Gwalia also operates Australia's only tin smelter at
Greenbushes. Tin production reached 588 tonnes
worth $4.9 million in 1998.
The value of Western Australian gypsum production
jumped almost fivefold to $18.3 million in 1998. This
was due to the first full year of shipments from Lake
MacLeod Gypsum. Lake MacLeod Gypsum is 68%
owned by Rio Tinto and is an offshoot of the parent
company, Dampier Salt. The gypsum and salt projects
share an operational base and shipping port facilities
at Lake MacLeod north of Carnarvon. Western
Australia's total gypsum output in 1998 was over one
million tonnes. Lake MacLeod Gypsum accounted for
well over 70% of this output, making it Australia's
largest producer.
Although the State's sole manganese operation, at
Woodie Woodie in the Pilbara, has been closed since
early 1997, the State still recorded shipments in 1998
totalling 79 thousand tonnes worth over $8 million.
These shipments were from stockpiles. However, it is
expected that mining at Woodie Woodie will
commence again in 1999 by Consolidated Minerals.
36

Department of Minerals and Energy
1998 STATISTICS DIGEST
The latest comparable data shows that the Western Australian share (by quantity) of theworld’s output of the following products was: diamonds 34%, zircon 29%, rutile 27%,alumina 14%, iron ore 15%, ilmenite 15%, gold 11%, nickel 12%, LNG 9% and salt 4%.
Source: Crowson (1996-97) DRD, USGS and DME
SELECTED WA COMMODITIES (BY QUANTITY)RELATIVE TO WORLD PRODUCTION
Figure 2.26
Western Australia Rest of Australia Rest of World
Alumina
Diamond
Gold
Ilmenite
Iron ore
LNG
Nickel
Rutile
Salt
Zircon
0% 10% 20% 30% 40% 50% 60% 70% 80% 90% 100%
37

1998 STATISTICS DIGEST
Department of Minerals and Energy
Another relatively small exploration expenditure
sector is diamonds, where in 1998 expenditure totalled
$36 million, down from the 1997 level of $37 million.
Nevertheless, Western Australia accounted for nearly
80% of Australia's total diamond exploration effort.
Petroleum Exploration
ABS data showed a record level of petroleum
exploration expenditure in Western Australia of $550
million (this figure includes expenditure on Western
Australian leases in the Timor Gap Zone of
Cooperation, Area B). Calendar 1998 exhibited a
continued long-term rise in petroleum exploration in
Western Australia to new record levels. Western
Australia is perceived to be one of the most attractive
exploration areas in the world and this has been
ref lected in the number of new international
companies applying for acreage and the high level of
work programs proposed. Not surprisingly therefore,
the State's share of Australia's petroleum exploration
($1,047 million) passed the half way mark, with
expenditure increasing from 42% in 1997 to 53% in
1998.
In total, Western Australia had 44 new field wildcat
wells drilled in 1998 compared to 34 in 1997.
Exploration drilling offshore continued at increasingly
high levels with 35 new field wildcat wells drilled
during the year, compared to 24 in 1997. Drilling effort
was again concentrated in the offshore Carnarvon
Basin (20 exploration wells). There was also an
increase in activity in the Browse and Bonaparte
Basins.
Offshore seismic activity increased dramatically in
1998 with a total of 64,478 line kilometres of new 2D
and 13,053 square kilometres of 3D data acquired
compared to 27,756 line kilometres and 12,811 square
kilometres respectively in 1997.
Onshore, only 9 new field wildcat wells were drilled
compared to 10 in 1997 and seismic activity was also
little changed. Onshore exploration drilling continues
to be relatively active, but the level of activity is broadly
unchanged to that of five years ago and there are signs
that the interest in onshore exploration is starting to
wane. A major factor is Native Title, with its lengthy
Right-to-Negotiate process and the accompanying
uncertain outcomes.
Mineral Exploration
According to the Australian Bureau of Statistics (ABS),
mineral exploration expenditure in Western Australia
reached $616 million in 1998. This was down by 12%
based on the 1997 record level of $699 million. This
is still a solid performance given the depressed state
of commodity prices during 1998 and the uncertain
economic outlook. Given these factors it will probably
prove difficult to maintain exploration at record levels
in 1999.
Western Australia received approximately 64% of total
Australian mineral exploration expenditure in 1998.
This was up from 60% in 1997.
Depressed gold prices made themselves felt with
exploration expenditure in that sector falling from
$511 million in 1997 to $400 million in 1998. The
decrease in gold exploration was the chief factor
behind the overall fall in the State's exploration
expenditure during the year. Gold nevertheless
continued to dominate the State's exploration effort
accounting for nearly 65% of all Western Australian
expenditure in 1998. This represented 71% of
Australia's total gold exploration funds.
Exploration for base metals (i.e. ABS definition - copper,
silver-lead-zinc, nickel and cobalt) in Western Australia
increased from $104 million in 1997 to $112 million
in 1998. The 1998 expenditure accounted for 55% of
Australia's total base metal exploration expenditure,
up from 45% in 1997. Most of this expenditure was
on lateritic nickel prospects (particularly in the first
half of the year), with copper-lead-zinc exploration
believed to be stagnant or falling.
Expenditure on iron ore exploration increased 68% in
1998 to $44 million. This was mainly ‘brownfields'
activity, representing the ‘proving up' of resources. It
accounted for almost all of Australia's iron ore
exploration expenditure. However, with cuts in
contract iron ore prices, producers are under extreme
pressure to reduce costs and remain competitive with
development by BHP of the iron ore mines at Mining
Area C and Orebody 18 for example, now being put
on hold.
Heavy mineral sands exploration also increased
significantly, by 59% in 1998 to $12 million. Whilst
this accounts for 50% of total Australian expenditure
for mineral sands, it represents only 2% of Western
Australia's total exploration expenditure.
3. EXPLORATION, INVESTMENT AND EMPLOYMENT
38

Department of Minerals and Energy
1998 STATISTICS DIGEST
In an effort to assist in redressing the unequal attention
of industry between onshore and offshore exploration,
DME's Geological Survey Division has been running
the Petroleum Exploration Initiative. Introduced in
1994-95, this is a $17 million, 6-year program, mainly
directed at enhancing petroleum prospectivity
through the study of the onshore sedimentary basins
of Western Australia.
Mining Investment
ABS private new capital expenditure statistics for 1998
indicate that mining accounted for nearly 60% of
Western Australia's total investment, compared to 66%
in 1997. Total State investment increased by just over
14%, from the 1997 level of $7,494 million to $8,553
million. The actual level of mining investment in
Western Australia was $5,092 million in 1998, nearly
4% above the 1997 amount of $4,908 million. This
accounted for approximately half of national mining
investment.
ABS mining investment figures, however, need to be
treated carefully as they do not capture all mining
investments. Investment in downstream processing
and some mineral projects (such as mineral sands and
alumina) are categorised by the ABS as manufacturing
investment. A breakdown of the manufacturing figures
into resource processing and other categories is not
available.
The Delta Electricity and Access Economics Investment
Monitor for December 1998, indicated that there was
approximately $37 billion worth of mining projects
in Western Australia either under construction,
committed, considered or possible. When including
projects with linkages to mining such as further
processing and infrastructure to service the industry,
the Western Australian investment figure increases to
well over $50 billion.
Focusing on the value of mining and petroleum
projects under construction or committed, the
Investment Monitor for December 1998 showed this
to total over $4 billion. Some of the more notable
projects include:
• The $800 million expansion of the Worsley alumina
refinery;
• Alcoa's $260 million expansion of its Wagerup
refinery;
• Precious Metals Australia's $200 million Windimurra
vanadium operation;
• $190 million refit of the Cossack Pioneer floating
petroleum production vessel;
• Anaconda Nickel/Glencore International's $1,000
million Murrin Murrin nickel mine which is due
to commence production in 1999; and
• The $874 million doubling of the capacity of the
Dampier to Bunbury gas pipeline.
Mining Employment
The Department of Minerals and Energy's official
employment statistics are compiled from monthly
industry returns and include contract labour working
on the mine sites.
In 1998 employment in the State's mineral and
petroleum industries increased 2% from 40,488 in
1997 to 41,302 persons. Overall, the decreases in
employment by specific sector were offset by the
increases in others.
The most significant increase in employment 26%,
occurred in the nickel sector. This was a result of the
Murrin Murrin and Cawse projects being under
construction or on the verge of commissioning.
Employment growth was also substantial in the base
metals sector with an increase of 18%. The most
notable increases in this sector occurred at Western
Metals' Pillara mine and Normandy Mining's Scuddles
(Golden Grove) mine.
In addition bauxite-alumina employment was up by
16% due mainly to expansion of the Worsley and
Wagerup alumina refineries.
The most significant decrease in employment
occurred in the heavy mineral sands sector, which
was down by 19%. This was mainly due to the closure
of RGC Mineral Sands' Eneabba mine. The gold sector
also experienced a decrease in employment with an
overall fall of 5%. This fall came from the scaling down
of large mines like Bronzewing, the closure of Centaur
Mining's Ora Banda and closures of other small mines.
In 1997 there were 12,806 people employed at the
sites and in 1998 this fell to 12,145.
Other sectors with decreases in employment were
coal down 6%, iron ore down 3% and salt down 1%.
39

1998 STATISTICS DIGEST
Department of Minerals and Energy
NOTE
The petroleum employment statistics shown in the
1997 Statistics Digest and prior volumes cannot be
directly compared to those published in this and future
issues. Previous statistics for the petroleum sector did
not include contract employees. The employment
statistics published in this issue for the petroleum
sector in 1997 and 1998 are comparable.
40

Department of Minerals and Energy
1998 STATISTICS DIGEST
41
TABLES
1. Quantity and Value of Minerals and Petroleum ............................................................ 42
2. Quantity and Value of Selected Major Commodities ................................................... 44
3. Quantity and Value of Minerals and Petroleum By Local Government Area .............. 47
4. Royalty Receipts 1997 and 1998 ................................................................................... 54
5. Employment in the Mineral and Petroleum Industries as at December 1998 ........... 57
6. Principal Minerals and Petroleum Producers 1998 ..................................................... 61
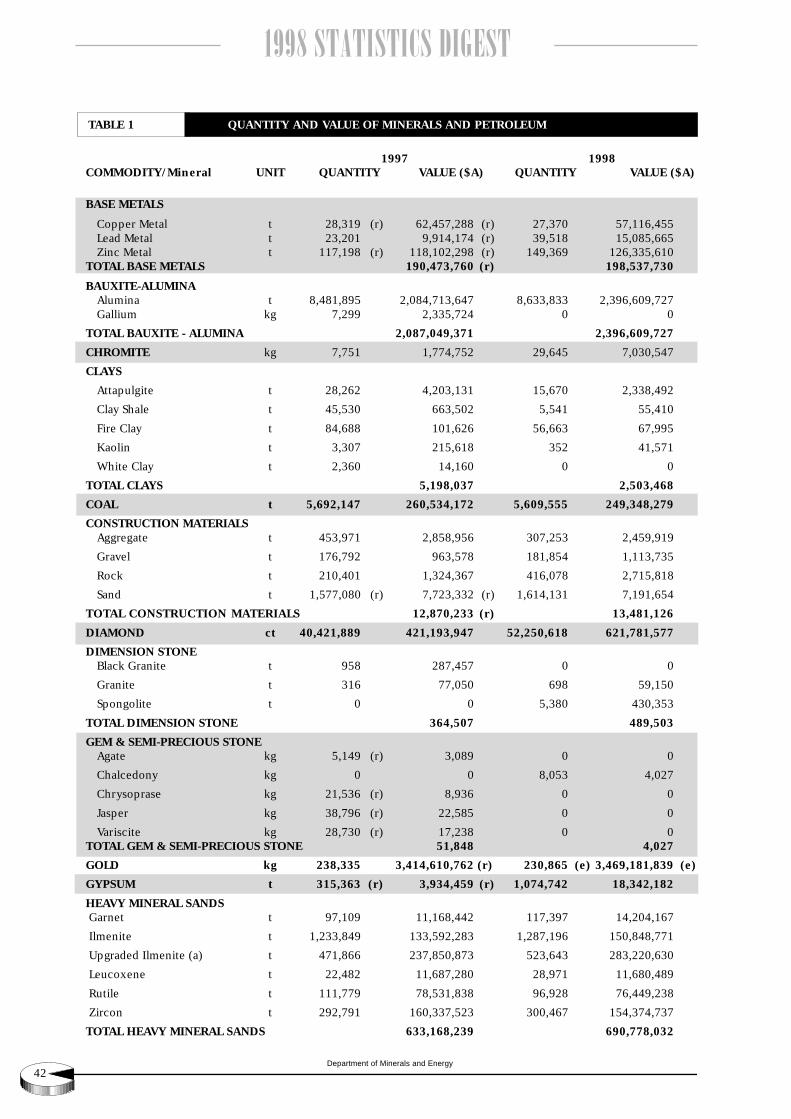
1998 STATISTICS DIGEST
Department of Minerals and Energy42
1997 1998COMMODITY/Mineral UNIT QUANTITY VALUE ($A) QUANTITY VALUE ($A)
BASE METALS
Copper Metal t 28,319 (r) 62,457,288 (r) 27,370 57,116,455Lead Metal t 23,201 9,914,174 (r) 39,518 15,085,665Zinc Metal t 117,198 (r) 118,102,298 (r) 149,369 126,335,610
TOTAL BASE METALS 190,473,760 (r) 198,537,730
BAUXITE-ALUMINAAlumina t 8,481,895 2,084,713,647 8,633,833 2,396,609,727Gallium kg 7,299 2,335,724 0 0
TOTAL BAUXITE - ALUMINA 2,087,049,371 2,396,609,727
CHROMITE kg 7,751 1,774,752 29,645 7,030,547
CLAYS
Attapulgite t 28,262 4,203,131 15,670 2,338,492
Clay Shale t 45,530 663,502 5,541 55,410
Fire Clay t 84,688 101,626 56,663 67,995
Kaolin t 3,307 215,618 352 41,571
White Clay t 2,360 14,160 0 0
TOTAL CLAYS 5,198,037 2,503,468
COAL t 5,692,147 260,534,172 5,609,555 249,348,279
CONSTRUCTION MATERIALSAggregate t 453,971 2,858,956 307,253 2,459,919
Gravel t 176,792 963,578 181,854 1,113,735
Rock t 210,401 1,324,367 416,078 2,715,818
Sand t 1,577,080 (r) 7,723,332 (r) 1,614,131 7,191,654
TOTAL CONSTRUCTION MATERIALS 12,870,233 (r) 13,481,126
DIAMOND ct 40,421,889 421,193,947 52,250,618 621,781,577
DIMENSION STONEBlack Granite t 958 287,457 0 0
Granite t 316 77,050 698 59,150
Spongolite t 0 0 5,380 430,353
TOTAL DIMENSION STONE 364,507 489,503
GEM & SEMI-PRECIOUS STONEAgate kg 5,149 (r) 3,089 0 0
Chalcedony kg 0 0 8,053 4,027
Chrysoprase kg 21,536 (r) 8,936 0 0
Jasper kg 38,796 (r) 22,585 0 0
Variscite kg 28,730 (r) 17,238 0 0TOTAL GEM & SEMI-PRECIOUS STONE 51,848 4,027
GOLD kg 238,335 3,414,610,762 (r) 230,865 (e) 3,469,181,839 (e)
GYPSUM t 315,363 (r) 3,934,459 (r) 1,074,742 18,342,182
HEAVY MINERAL SANDS Garnet t 97,109 11,168,442 117,397 14,204,167
Ilmenite t 1,233,849 133,592,283 1,287,196 150,848,771
Upgraded Ilmenite (a) t 471,866 237,850,873 523,643 283,220,630
Leucoxene t 22,482 11,687,280 28,971 11,680,489
Rutile t 111,779 78,531,838 96,928 76,449,238
Zircon t 292,791 160,337,523 300,467 154,374,737
TOTAL HEAVY MINERAL SANDS 633,168,239 690,778,032
TABLE 1 QUANTITY AND VALUE OF MINERALS AND PETROLEUM

Department of Minerals and Energy
1998 STATISTICS DIGEST
43
1997 1998COMMODITY/Mineral UNIT QUANTITY VALUE ($A) QUANTITY VALUE ($A)
INDUSTRIAL PEGMATITE MINERALSFelspar t 65,818 3,043,804 (r) 624 13,843
IRON OREDomestic t 7,413,286 183,370,087 6,565,620 194,596,981
Exported t 144,305,307 3,449,970,594 136,765,690 3,901,941,811
TOTAL IRON ORE 151,718,593 3,633,340,681 143,331,310 4,096,538,792
LIMESAND-LIMESTONE-DOLOMITEDolomite t 4,387 126,045 3,624 86,372
Limesand-Limestone t 2,277,880 13,685,622 2,953,291 11,945,601
TOTAL LIMESAND-LIMESTONE-DOLOMITE 13,811,667 12,031,973
MANGANESE ORE t 176,990 22,153,201 79,430 8,129,205
NICKEL INDUSTRYCobalt by-product t 1,219 58,771,721 1,269 84,579,343
Nickel Concentrate t 873,119 1,136,002,794 952,901 1,039,024,976
Palladium by-product kg 429 3,227,915 2,042 10,096,972
Platinum by-product kg 315 2,419,386 209 2,852,073
TOTAL NICKEL INDUSTRY 1,200,421,816 1,136,553,364
PETROLEUMCondensate kl 6,436,741 1,103,314,266 (r) 6,988,530 955,825,928
Crude Oil kl 9,539,869 1,719,801,811 10,994,007 1,459,341,583
LNG Btu 106 375,600,011 1,595,472,848 386,848,099 1,561,708,998
LPG - Butane t 320,425 93,168,890 384,543 86,580,631
LPG - Propane t 253,817 73,825,137 263,815 55,771,778
Natural Gas ‘000m3 7,331,730 571,510,516 6,328,079 526,529,148
TOTAL PETROLEUM 5,157,093,469 (r) 4,645,758,066
PIGMENTSRed Oxide t 5,340 1,014,600 1,570 298,300
SALT t 8,115,941 172,120,951 8,477,019 210,172,594
SILICA-SILICA SANDSilica t 84,582 845,819 91,821 918,215
Silica Sand t 720,155 7,199,961 654,451 6,262,395
TOTAL SILICA-SILICA SAND 8,045,780 7,180,610
SILVER kg 51,252 9,546,962 52,355 12,967,881
TALC t 188,835 14,971,392 164,072 13,040,168
TIN-TANTALUM-LITHIUMSpodumene t 56,567 10,701,568 42,337 10,243,876
Tantalite t 299 30,550,308 400 58,503,807
Tin Metal t 523 3,637,931 588 4,894,812
TOTAL TIN-TANTALUM-LITHIUM 44,889,807 73,642,495
TOTAL VALUE 17,311,678,216 (r) 17,884,415,326(e)
Note: Quantities used in this table only apply to Minerals and Petroleum covered by the Mining Act 1978, thePetroleum Act 1967, the Petroleum (Submerged Lands) Act 1982 and relevant State Agreement Acts.
(a) Also known as synthetic rutile(e) Estimate(r) Revised from previous edition
TABLE 1 (Cont.) QUANTITY AND VALUE OF MINERALS AND PETROLEUM

1998 STATISTICS DIGEST
Department of Minerals and Energy44
TABLE 2 QUANTITY AND VALUE OF SELECTED MAJOR COMMODITIES
Unit 1989 1990 1991 1992
Quantity Value $m Quantity Value $m Quantity Value $m Quantity Value $m
ALUMINA Mt 6.38 2,096.79 6.72 2,358.95 7.01 1,844.03 7.08 1,689.72
BASE METALS
copper metal kt 19.04 40.70 14.96 22.55 11.79 17.92 12.09 18.68
lead metal kt 7.85 4.42 13.61 7.18 10.70 4.35 20.96 7.43
zinc metal kt 38.06 48.15 51.70 61.55 112.01 94.69 141.39 132.98
TOTAL BASE METALS 93.27 91.28 116.96 159.09
COAL Mt 3.83 166.80 4.83 214.25 5.11 228.56 5.66 251.76
DIAMOND M ct 37.51 427.45 31.18 429.93 33.36 456.93 41.15 565.06
GOLD tonnes 147.28 2,295.58 176.35 2,794.00 186.34 2,800.18 182.10 2,751.38
HEAVY MINERAL SANDS
ilmenite Mt 0.96 77.07 0.99 86.20 0.94 81.50 1.04 87.30
rutile kt 88.97 58.36 76.07 57.91 59.13 39.66 68.96 39.05
upgraded ilmenite
(synthetic rutile) kt 261.60 115.53 249.27 120.77 317.96 162.17 334.48 157.88
zircon kt 343.82 187.95 224.46 126.68 204.33 79.16 265.17 51.46
other HMS 10.12 9.37 5.14 10.26
TOTAL HEAVY MINERAL SANDS 449.03 400.93 367.63 345.95
IRON ORE Mt 106.47 2,122.07 103.85 2,426.81 114.17 2,978.72 108.15 2,921.98
MANGANESE ORE kt 11.74 0.05 364.58 57.93 209.64 37.77 402.84 72.20
NICKEL METAL kt 42.79 688.85 50.91 557.97 55.76 569.24 48.04 461.54
PETROLEUM
condensate Gl 1.35 197.16 1.72 333.90 1.87 313.74 2.06 366.70
crude oil Gl 2.51 369.85 5.20 1,023.22 5.21 901.42 5.05 917.36
lng btu 1012 37.68 113.43 153.14 508.10 204.80 957.95 237.64 966.47
lpg - butane kt 0 0 0 0 0 0 0 0
lpg - propane kt 0 0 0 0 0 0 0 0
natural gas Gm3 3.74 321.73 3.70 366.43 3.74 372.20 3.78 368.96
TOTAL PETROLEUM 1,002.17 2,231.65 2,545.31 2,619.49
SALT Mt 5.90 112.38 6.12 130.77 6.83 149.36 6.67 155.39
OTHER 88.68 99.56 91.69 132.36
TOTAL 9,543.12 11,794.03 12,186.38 12,125.92

Department of Minerals and Energy
1998 STATISTICS DIGEST
45
1993 1994 1995 1996 1997 1998
Quantity Value $m Quantity Value $m Quantity Value $m Quantity Value $m Quantity Value $m Quantity Value $m
7.80 1,891.86 7.93 1,684.58 8.07 1,757.36 8.25 1,967.81 8.48 2,084.71 8.63 2,396.61
28.98 30.21 35.11 68.13 24.31 73.29 23.07 51.28 28.32 62.46 27.37 57.12
32.28 7.84 20.29 7.32 15.64 8.25 17.08 9.90 23.20 9.91 39.52 15.09
141.10 87.02 123.62 85.14 126.34 87.73 106.86 71.28 117.20 118.10 149.37 126.34
125.07 160.59 169.27 132.46 190.47 198.54
5.47 248.44 5.03 234.02 6.06 280.66 5.81 268.38 5.69 260.53 5.61 249.35
22.65 486.77 27.72 470.34 23.45 480.15 47.43 442.01 40.42 421.19 52.25 621.78
183.47 3,139.61 192.98 3,265.93 189.48 3,163.66 221.18 3,528.64 238.34 3,414.61 230.86 3,469.18
1.01 85.40 1.08 93.52 1.00 96.27 1.08 114.29 1.23 133.59 1.29 150.85
56.60 29.97 87.16 44.46 124.87 68.14 110.65 79.17 111.78 78.53 96.93 76.45
308.60 143.53 357.53 164.53 452.74 215.43 367.53 181.81 471.87 237.85 523.64 283.22
299.76 46.26 444.26 99.00 458.44 152.54 372.70 197.54 292.79 160.34 277.35 154.37
6.49 6.62 8.07 25.26 22.86 25.88
311.65 408.13 540.45 598.07 633.17 690.78
116.34 2,996.73 124.26 2,630.61 135.97 2,980.69 133.65 2,924.48 151.72 3,633.34 143.33 4,096.54
247.86 43.40 202.52 22.74 227.90 28.42 296.81 32.67 176.99 22.15 79.43 8.13
55.46 437.74 77.00 630.13 101.36 1,094.17 108.38 1,033.88 122.99 1,136.00 143.08 1,039.02
2.17 359.86 2.34 331.19 3.83 564.91 4.97 773.72 6.44 1,103.31 6.99 955.83
4.05 709.32 8.75 1,299.75 8.68 1,384.83 11.26 1,958.82 9.54 1,719.80 10.99 1,459.34
264.75 997.88 335.11 1,080.17 375.37 1,390.75 377.82 1,391.20 375.60 1,595.47 386.85 1,561.71
0 0 0 0 19.42 4.73 158.96 37.44 320.43 93.17 384.54 86.58
0 0 0 0 14.14 3.44 150.84 36.93 253.82 73.83 263.82 55.77
4.21 422.96 4.92 441.96 5.83 421.92 6.62 494.68 7.33 571.51 6.33 526.53
2,490.02 3,153.07 3,770.58 4,692.80 5,157.09 4,645.76
6.53 159.57 6.86 153.49 7.29 155.81 7.21 143.61 8.12 172.12 8.48 210.17
112.77 149.67 182.81 207.71 186.27 258.20
12,443.63 12,963.30 14,604.03 15,972.52 17,311.68 17,884.42

1998 STATISTICS DIGEST
Department of Minerals and Energy46
1998 Total : A$17.88 billion
Source : DME Figure 0.1
Iron Ore23%
Nickel6%
Heavy Mineral Sands4%
Petroleum27%
Alumina13%
Others5%
Diamonds3%
Gold19%
COMPARATIVE VALUE OF PRODUCTION1993 Total : A$12.44 billion
Iron Ore24%
Nickel4%
Heavy Mineral Sands3%
Petroleum20%
Alumina15%
Others5%
Diamonds4%
Gold25%

Department of Minerals and Energy
1998 STATISTICS DIGEST
TABLE 3 QUANTITY & VALUE OF MINERALS & PETROLEUM BY LOCAL GOVERNMENT AREA
MINERAL LOCAL QUANTITY METALLIC VALUE Ref.GOVERNMENT AREA TONNES CONTENT $A (p.65)
BASE METALS Cu Tonnes
Copper By-Product Coolgardie 5,037.671 8,074,909(a),(b)
West Pilbara 767.162 1,016,944
Total Copper By-Products 5,804.833 9,091,853
Copper Concentrates Cu %
East Pilbara 12,737 20.02 4,329,830
Yalgoo 21,529 18.37 4,848,735
Total Copper Concentrates 34,266 9,178,565 (a)
Copper Cathode Cu Tonnes
East Pilbara 15,059.65 38,846,037 (a)
Total Copper 57,116,455
Lead Pb %
Derby-West Kimberley 54,373 72.68 15,085,665 (a)
Zinc Zn %
Derby-West Kimberley 140,035 51.26 64,718,463
Yalgoo 184,806 41.98 61,617,147
324,841 126,335,610 (a)
TOTAL BASE METALS 198,537,730
BAUXITE - ALUMINA
Alumina Boddington 1,709,596 462,694,141
Murray 3,193,914 892,043,879
Serpentine-Jarrahdale 1,947,509 543,967,229
Waroona 1,782,814 497,904,478
TOTAL BAUXITE - ALUMINA 8,633,833 2,396,609,727(c),(j)
CHROMITE - PLATINOIDS Cr2O
3 %
Chromite Ore Meekatharra 72.496 40.89 7,030,547
CLAYS
Attapulgite Mullewa 15,670 2,338,492 (a)
Clay Shale Collie 5,541 55,410 (a)
Fire Clay Chittering 56,663 67,995 (d)
Kaolin Bridegetown-Greenbushes 352 41,571 (d)
TOTAL CLAYS 78,226 2,503,468
COAL Collie 5,609,555 249,348,279 (e)
CONSTRUCTION MATERIALS
Aggregate Broome 4,612 94,486
Exmouth 91,890 1,096,649
Nannup 441 4,860
Port Hedland Town 79,979 479,741
Roebourne 67,867 432,776
Wyndham-East Kimberley 62,464 351,407
Total Aggregate 307,253 2,459,919
47

1998 STATISTICS DIGEST
Department of Minerals and Energy
MINERAL LOCAL QUANTITY METALLIC VALUE Ref.GOVERNMENT AREA TONNES CONTENT $A (p.65)
Gravel Broome 7,663 30,945
Coolgardie 45,592 260,926
Exmouth 1,600 9,600
Kalamunda 101,861 652,884
Kalgoorlie-Boulder 395 4,530
Port Hedland Town 5,457 45,000
W. Kimberley 11,870 90,860
Wyndham-East Kimberley 7,416 18,990
Total Gravel 181,854 1,113,735
Rock Broome 5,803 257,039
Derby-West Kimberley 678 4,070
East Pilbara 54,784 328,704
Kalgoorlie-Boulder 351,957 2,111,737
Wyndham-East Kimberley 2,856 14,268
Total Rock 416,078 2,715,818
Sand Ashburton 69 1,665
Broome 20,177 151,395
Collie 70,637 423,820
Coolgardie 164,353 925,723
Coorow 910 4,550
Dandaragan 5,102 28,612
Derby-West Kimberley 5,991 30,636
Exmouth 141 846
Kalgoorlie-Boulder 12,817 73,823
Leonora 23,688 118,440
Meekatharra 31,196 187,175
Menzies 6,310 31,548
Northam 16,372 49,116
Port Hedland Town 53,501 275,186
Roebourne 23,025 144,747
Wanneroo 1,160,281 4,641,124
Wyndham-East Kimberley 15,915 85,019
Yilgarn 3,646 18,229
Total Sand 1,614,131 7,191,654
TOTAL CONSTRUCTION MATERIALS 13,481,126 (d)
Carats
DIAMOND Wyndham-East Kimberley 52,250,618 621,781,577 (a)
DIMENSION STONE
Granite Ashburton 485 48,500
Roebourne 213 10,650
Total Granite 698 59,150
Spongolite Plantagenet 5,380 430,353
TOTAL DIMENSION STONE 489,503 (d)
48
TABLE 3 (cont.) QUANTITY & VALUE OF MINERALS & PETROLEUM BY LOCAL GOVERNMENT AREA

Department of Minerals and Energy
1998 STATISTICS DIGEST
TABLE 3 (cont.) QUANTITY & VALUE OF MINERALS & PETROLEUM BY LOCAL GOVERNMENT AREA
MINERAL LOCAL QUANTITY METALLIC VALUE Ref.GOVERNMENT AREA TONNES CONTENT $A (p.65)
GEM & SEMI-PRECIOUS STONE kgChalcedony Carnarvon 8,053 4,027
TOTAL GEM & SEMI-PRECIOUS STONE 4,027
Au kg
GOLD Boddington 11,217.210 168,308,656
Coolgardie 27,299.638 409,116,030
Cue 6,424.278 96,346,986
Dundas 3,651.650 54,963,488
East Pilbara 12,300.597 185,070,645
Kalgoorlie-Boulder 53,303.996 802,152,983
Laverton 17,958.612 269,558,295
Leonora 42,871.944 644,287,415
Meekatharra 14,480.552 217,230,525
Menzies 1,374.836 21,097,900
Mt Magnet 6,325.856 95,304,133
Sandstone 3,937.141 59,104,119
Wiluna 14,964.058 225,108,804
Yalgoo 756.237 11,302,519
Yilgarn 13,998.241 210,229,341
TOTAL GOLD 230,864.846 3,469,181,839 (f)
GYPSUM Bruce Rock 980 7,840 (e)
Carnarvon 792,852 15,248,845 (e)
Dalwallinu 75,432 1,545,608 (e)
Dandaragan 10,530 105,300 (e)
Dundas 12,342 74,051 (e)
Esperance 17,509 105,054 (e)
Kondinin 2,375 23,750 (d)
Koorda 300 3,600 (e)
Lake Grace 45,251 347,482 (e)
Merredin 2,000 12,000 (e)
Mt Marshall 3,480 27,840 (e)
Nungarin 26,358 158,148 (e)
Ravensthorpe 17,325 138,600 (d)
Wyalkatchem 61,323 490,584 (e)
Yilgarn 6,685 53,480 (e)
TOTAL GYPSUM 1,074,742 18,342,182
HEAVY MINERAL SANDS
Garnet Sand Bunbury City 43 5,160 (g)
Northampton 117,354 14,199,007 (e)
Total Garnet Sand 117,397 14,204,167
49

1998 STATISTICS DIGEST
Department of Minerals and Energy
TABLE 3 (cont.) QUANTITY & VALUE OF MINERALS & PETROLEUM BY LOCAL GOVERNMENT AREA
MINERAL LOCAL QUANTITY METALLIC VALUE Ref.GOVERNMENT AREA TONNES CONTENT $A (P.65)
TiO2 %
Ilmenite Augusta-Margaret River 101,303 55.87 11,599,430
Bunbury City 498,199 56.20 70,036,962
Capel 378,108 55.43 43,064,656
Carnamah 292,718 57.87 24,264,917
Northampton 16,868 40.08 1,882,806
Total Ilmenite 1,287,196 150,848,771 (a)
TiO2 %
Upgraded Ilmenite Capel 289,163 92.48 148,990,132
Carnamah 174,333 92.63 94,307,428
Dandaragan 60,147 92.00 39,923,070
Total Upgraded Ilmenite 523,643 283,220,630 (a)
TiO2 Tonnes
Leucoxene Bunbury City 4,279 1,787.400 3,218,700
Capel 4,018 3,024.600 2,779,582
Dandaragan 20,674 9,899.200 5,682,207
Total Leucoxene 28,971 14,711.200 11,680,489 (a)
TiO2 Tonnes
Rutile Bunbury City 7,077 6,595.675 6,030,090
Carnamah 74,216 69,915.180 59,954,237
Dandaragan 15,635 8,227.960 10,464,911
Total Rutile 96,928 84,738.815 76,449,238 (a)
ZrO2 Tonnes
Zircon Augusta-Margaret River 20 13.000 12,298
Bunbury City 32,960 15,745.939 17,043,084
Capel 57,702 30,817.050 29,051,914
Carnamah 145,158 78,977.950 73,167,764
Dandaragan 64,627 35,630.650 35,099,677
Total Zircon 300,467 161,184.589 154,374,737 (a)
TOTAL HEAVY MINERAL SANDS 690,778,032
INDUSTRIAL PEGMATITE MINERALS
Felspar Mukinbudin 624 13,843
TOTAL INDUSTRIAL PEGMATITE MINERALS 13,843
IRON ORE
Fe%
Domestic Ore East Pilbara 6,565,620 62.72 194,596,981
Fe%
Exported Ore Ashburton 78,057,341 61.68 2,170,487,907
Derby-West Kimberley 822,821 76.55 20,110,258
East Pilbara 56,208,946 61.82 1,673,959,369
Yilgarn 1,676,582 38.07 37,384,277
Total Exported Ore 136,765,690 3,901,941,811 (a)
TOTAL IRON ORE 143,331,310 4,096,538,792
50

Department of Minerals and Energy
1998 STATISTICS DIGEST
TABLE 3 (cont.) QUANTITY & VALUE OF MINERALS & PETROLEUM BY LOCAL GOVERNMENT AREA
MINERAL LOCAL QUANTITY METALLIC VALUE Ref.GOVERNMENT AREA TONNES CONTENT $A (P.65)
LIMESAND - LIMESTONE-DOLOMITEDolomite Lake Grace 3,414 81,122
Yilgarn 210 5,250
Total Dolomite 3,624 86,372
Limesand - Limestone Carnamah 8,035 32,140
Cockburn 1,880,791 4,673,639
Coorow 15,569 77,846
Dandaragan 28,019 161,791
Dundas 116,843 1,752,645
Exmouth 103,797 433,705
Gingin 127,072 1,254,526
Irwin 150,174 462,309
Kwinana 398,139 1,194,417
Manjimup 5,579 83,685
Wanneroo 119,273 1,818,898
Total Limesand-Limestone 2,953,291 11,945,601
TOTAL LIMESAND-LIMESTONE-DOLOMITE 12,031,973 (d)
MANGANESE ORE Mn %
East Pilbara 79,430 49.23 8,129,205 (a)
NICKEL INDUSTRY
Cobalt By-Product Co Tonnes
Coolgardie 1,227.48 81,785,613(a),(b)
Kalgoorlie-Boulder 1.34 70,410
Roebourne 40.49 2,723,320
Total Cobalt By-Product 84,579,343
Nickel Concentrates Ni %
Coolgardie 254,567 12.84 238,554,241
Kalgoorlie-Boulder 84,399 17.80 107,817,958
Kondinin 42,524 15.26 48,150,759
Leonora 336,519 13.23 320,982,332
Roebourne 25,487 10.00 17,642,284
Wiluna 209,405 19.98 305,877,402
Total Nickel Concentrates 952,901 1,039,024,976 (i)
Pd kg
Palladium By-Product Coolgardie 2,042.499 10,096,972(a),(b)
Pt kg
Platinum By-Product Coolgardie 209.483 2,852,073(a),(b)
TOTAL NICKEL INDUSTRY 1,136,553,364
PETROLEUM
Kilolitres
Condensate Ashburton 160,371 22,435,526 (d)
Carnamah 238 8,151 (d)
Irwin 1,007 212,666 (d)
Roebourne 6,826,914 933,169,585 (a)
Total Condensate 6,988,530 955,825,928
51

1998 STATISTICS DIGEST
Department of Minerals and Energy
TABLE 3 (cont.) QUANTITY & VALUE OF MINERALS & PETROLEUM BY LOCAL GOVERNMENT AREA
MINERAL LOCAL QUANTITY METALLIC VALUE Ref.GOVERNMENT AREA TONNES CONTENT $A (P.65)
Kilolitres
Crude Oil Ashburton 4,638,645 627,067,496
Derby-West Kimberley 9,102 1,087,393
Irwin 10,692 1,184,625
Roebourne 6,335,568 830,002,069
Total Crude Oil 10,994,007 1,459,341,583 (a)
Btu 106
Liquified Natural Gas Roebourne 386,848,099 1,561,708,998
Tonnes
LPG - Butane Roebourne 384,543 86,580,631 (j)
Tonnes
LPG - Propane Roebourne 263,815 55,771,778 (j)
‘000 m3
Natural Gas Ashburton 898,218 72,221,306 (j)
Carnamah 45,765 6,500,523 (j)
Irwin 138,939 17,829,166 (j)
Roebourne 5,245,157 429,978,154 (d)
Total Natural Gas 6,328,079 526,529,148
TOTAL PETROLEUM PRODUCTS 4,645,758,066
PIGMENTS
Red Oxide Cue 1,570 298,300
SALT
Carnarvon 1,255,079 33,079,948
Dalwallinu 6 20
Esperance 15,258 538,919
Port Hedland Town 2,761,727 69,150,011
Roebourne 3,644,596 89,122,989
Shark Bay 685,268 13,348,093
Wyalkatchem 105 6,800
Yilgarn 114,980 4,925,815
TOTAL SALT 8,477,019 210,172,594 (a)
SILICA-SILICA SAND
Silica Moora 91,821 918,215 (a)
Silica Sand Albany 89,145 1,337,205 (a)
Cockburn 132,348 1,455,828 (a)
Coolgardie 148,082 362,800
Swan 284,876 3,106,562 (a)
Total Silica Sand 654,451 6,262,395
TOTAL SILICA-SILICA SAND 7,180,610
SILVER BY-PRODUCT Ag kg
Coolgardie 194 51,143
Derby-West Kimberley 5,487 1,086,050(a),(b)
East Pilbara 1,260 314,085(a),(l)
Statewide 25,846 6,157,409
Yalgoo 19,568 5,359,193(a),(l)
TOTAL SILVER BY-PRODUCT 52,355 12,967,881
52

Department of Minerals and Energy
1998 STATISTICS DIGEST
TABLE 3 (cont.) QUANTITY & VALUE OF MINERALS & PETROLEUM BY LOCAL GOVERNMENT AREA
MINERAL LOCAL QUANTITY METALLIC VALUE Ref.GOVERNMENT AREA TONNES CONTENT $A (P.65)
TALC
Meekatharra 23,770 1,795,732
Three Springs 140,302 11,244,436
TOTAL TALC 164,072 13,040,168 (e)
TIN-TANTALUM-LITHIUM
Li2O
5 %
Spodumene Bridgetown-Greenbushes 42,337 5.62 10,243,876 (a)
Ta2O
5 kg
Tantalite Bridgetown-Greenbushes 400 210,000 58,503,807
Sn Tonnes
Tin Bridgetown-Greenbushes 588 4,894,812 (a)
TOTAL TIN-TANTALUM-LITHIUM 73,642,495
VALUE OF MINERALS 9,769,475,422
VALUE OF PETROLEUM 4,645,758,066
VALUE OF GOLD 3,469,181,839
TOTAL VALUE 17,884,415,326
53

1998 STATISTICS DIGEST
Department of Minerals and Energy
1997 1998 1998 GROWTHMINERAL $A $A $A %
BASE METALS
Copper 2,810,095 1,849,497 -960,598 (34)
Lead 627,517 584,181 -43,336 (7)
Zinc 5,550,953 6,401,076 850,123 15
TOTAL BASE METALS 8,988,566 8,834,754 -153,811 (2)
BAUXITE-ALUMINA
Alumina 34,465,299 38,281,457 3,816,158 11
Gallium 102,900 0 -102,900 (100)
TOTAL BAUXITE-ALUMINA 34,568,199 38,281,457 3,713,258 11
CHROMITE - PLATINOIDS
Chromite 0 332,544 332,544 n/a
CLAYS 198,150 226,754 28,604 14
COAL 11,397,218 13,339,498 1,942,280 17
CONSTRUCTION MATERIALS
Aggregate 133,856 65,610 -68,246 (51)
Gravel 71,236 50,683 -20,553 (28)
Rock 60,224 133,418 73,194 122
Sand 474,850 480,626 5,776 1
TOTAL CONSTRUCTION MATERIALS 740,165 730,337 -9,829 (1)
DIAMOND 36,098,081 45,192,711 9,094,630 25
DIMENSION STONE 534 477 -57 (11)
GEM & SEMI-PRECIOUS STONE 7,054 1,610 -5,444 (77)
GOLD 436,012 9,270,938 8,834,926 2,026
GYPSUM 107,853 376,626 268,773 249
HEAVY MINERAL SANDS
Garnet 548,410 647,689 99,279 18
Ilmenite 7,617,419 9,461,924 1,844,505 24
Leucoxene 677,780 512,940 -164,840 (24)
Rutile 3,813,218 3,970,639 157,421 4
Zircon 8,401,130 7,838,210 -562,921 (7)
TOTAL HEAVY MINERAL SANDS 21,057,957 22,431,401 1,373,444 7
INDUSTRIAL PEGMATITE MINERALS
Felspar 139,920 89,593 -50,326 (36)
IRON ORE 181,589,062 208,334,420 26,745,358 15
LIMESAND-LIMESTONE-DOLOMITE
Dolomite 1,316 1,087 -229 (17)
Limesand-Limestone 320,702 636,869 316,167 99
TOTAL LIMESAND-LIMESTONE-DOLOMITE 322,019 637,957 315,938 98
TABLE 4 ROYALTY RECEIPTS 1997, 1998
54

Department of Minerals and Energy
1998 STATISTICS DIGEST
TABLE 4 (cont.) ROYALTY RECEIPTS 1997, 1998
55
1997 1998 1998 GROWTHMINERALS $A $A $A %
MANGANESE 81,723 1,176,647 1,094,925 1,340
NICKEL INDUSTRY
Cobalt by-product 1,079,863 1,810,637 730,773 68
Nickel 21,581,045 24,603,510 3,022,465 14
Palladium by-product 60,102 184,818 124,717 208
Platinum by-product 118,594 94,660 -23,934 (20)
TOTAL NICKEL INDUSTRY 22,839,604 26,693,625 3,854,021 17
OTHER MINERALS
Spongolite 0 90,624 90,624 n/a
PETROLEUM
Condensate 44,490,818 53,529,490 9,038,672 20
Liquified Natural Gas 80,761,811 88,846,086 8,084,275 10
LPG - Butane 3,650,015 4,412,447 762,431 21
LPG - Propane 3,173,541 3,251,059 77,518 2
Natural gas 28,489,289 26,284,039 -2,205,250 (8)
Oil 76,270,007 52,451,819 -23,818,188 (31)
TOTAL PETROLEUM 236,835,483 228,774,940 -8,060,543 (3)
PIGMENTS
Red oxide 0 65,645 65,645 n/a
SALT 1,815,898 1,933,821 117,924 7
SILICA SAND 373,697 337,193 -36,504 (10)
SILVER 260,278 366,831 106,553 41
TALC 77,664 107,549 29,885 39
TIN-TANTALUM-LITHIUM
Spodumene 791,751 521,677 -270,074 (34)
Tantalite 736,206 1,295,490 559,284 76
Tin 87,792 110,504 22,712 26
TOTAL TIN-TANTALUM-LITHIUM 1,615,749 1,927,671 311,922 19
TOTAL ROYALTY RECEIPTS 559,550,883 609,555,622 49,914,115 9
IRON ORE ADDITIONAL RENTAL 25,398,812 26,729,017 1,330,205 5
TOTAL REVENUE 584,949,695 636,284,639 51,244,320 9

1998 STATISTICS DIGEST
Department of Minerals and Energy56
Source : DME Figure 0.2
COMPARATIVE ROYALTY RECEIPTS1993 Total : A$373.80 million
1998 Total : A$636. 28 million
Alumina6%
Iron Ore37%
Nickel4%
Heavy Mineral Sands4%
Petroleum36%
Others6%
Diamonds7%
Others7%
Iron Ore49%
Nickel2%
Heavy Mineral Sands2%
Petroleum21%
Alumina8%
Diamonds11%

Department of Minerals and Energy
1998 STATISTICS DIGEST
TABLE 5 PERSONS EMPLOYED IN THE W.A. MINERALS & PETROLEUM INDUSTRIES AS AT 31 DECEMBER 1998
57
MINERAL/Company Operating Site 1997 1998
BASE METALS
Normandy Mining Ltd Scuddles 279 361
Straits Resources Ltd Nifty 327 281
Western Metals Ltd Cadjebut 419 0
Pillara 0 568
TOTAL BASE METALS 1,025 1,210
BAUXITE - ALUMINA
Alcoa of Australia Ltd Del Park 331 410
Jarrahdale 260 186
Kwinana Alumina Refinery 1,387 1,416
Pinjarra Refinery 1,405 1,430
Wagerup Alumina Refinery 902 1,255
Willowdale 179 182
Australian Fused Materials Pty Ltd Rockingham Fused Alumina Plant 73 75
Worsley Alumina Pty Ltd Worsley - includes Mount Saddleback 155 170
Worsley Refinery 1,085 1,594
TOTAL BAUXITE - ALUMINA 5,777 6,718
COAL
Griffin Coal Mining Co. Pty Ltd Muja 360 344
Wesfarmers Coal Ltd Central Services 53 0
Premier/WCL 126 349
Western No. 5 201 0
TOTAL COAL 740 693
DIAMOND
Argyle Diamond Mines Pty Ltd Lake Argyle 1,003 1,003
GOLD
Australian Resources Pty Ltd Gidgee 156 170
Mt McLure 134 158
Australian Gold Fields NL Bannockburn 118 2
Australian Gold Resources Ltd Perth Mint 77 66
Barminco Pty Ltd Two Boys 78 0
Border Gold NL Karonie 0 13
Camelot Resources NL Mt Gibson 58 0
Tarmoola 231 321
Centaur Mining & Exploration Ltd Mt Pleasant 378 497
Ora Banda 222 0
Central Norseman Group Norseman 217 266
Como Engineers O’Conner - Carbon Stripping Plant 0 3
Consolidated Gold NL Bardoc - Davyhurst 116 55
Miranda 55 0
Croesus Mining NL Binduli 26 56
Dalrymple Resources NL Sandstone 1 0
Delta Gold NL Golden Feather Group 0 226

1998 STATISTICS DIGEST
Department of Minerals and Energy
TABLE 5 (cont.) PERSONS EMPLOYED IN THE W.A. MINERALS & PETROLEUM INDUSTRIES AS AT 31 DECEMBER 1998
58
MINERAL/Company Operating Site 1997 1998
GOLD (Continued)
Equigold NL Dalgaranga 81 135
Goldfields Kalgoorlie Ltd Kundana 253 262
Paddington 365 216
Golden West Refining Corporation Ltd Kewdale - Golden West Refinery 33 26
Great Central Mines NL Bronzewing 333 223
Jundee 519 542
Wiluna 464 368
Hedges Gold Pty Ltd Hedges 127 67
Herald Resources Ltd Sandstone 39 33
Three Mile Hill 149 63
Hill 50 Gold NL Hill 50 255 314
Homestake Mining Company Darlot 460 482
Lawlers 194 194
Mt Morgans 176 0
Plutonic 389 382
Kalgoorlie Consolidated Gold Mines Pty Ltd Golden Mile - Super pit 1,241 1,228
Lionore Australia Pty Ltd Bounty 227 262
Lynas Gold NL Lynas Find 51 0
Mt Olympus 0 34
Morning Star Mines NL Hannan South 23 17
Mount Mine Joint Venture Mount Group 0 3
Mt Lyell Mining Company Ltd Reedy 75 0
New Hampton Goldfields NL Dawns Hope 217 245
Newcrest Mining Ltd New Celebration 219 206
Telfer 523 609
Normandy Mining Ltd Big Bell 330 397
Kaltails 86 107
North Gold (WA) Ltd Kanowna Belle 303 360
Peak Hill 33 35
Perilya Mines NL Fortnum 74 85
Placer Dome Inc Granny Smith 327 328
Resolute Ltd Chalice 152 113
Marymia 96 0
Sons of Gwalia NL Barnicoat 86 0
Copperhead 106 56
Cornishman 0 75
Golden Pig and Frasers 61 49
Marvel Loch 141 216
Sons of Gwalia 168 234
Yilgarn Star 322 170
St. Barbara Mines Ltd Bluebird 340 134
Stockdale Prospecting Ltd Sunrise Dam 143 125
WMC Resources Ltd Emu 248 588
Kambalda/St. Ives 1,078 756
Worsley Alumina Pty Ltd Boddington 432 573
TOTAL GOLD 12,806 12,145
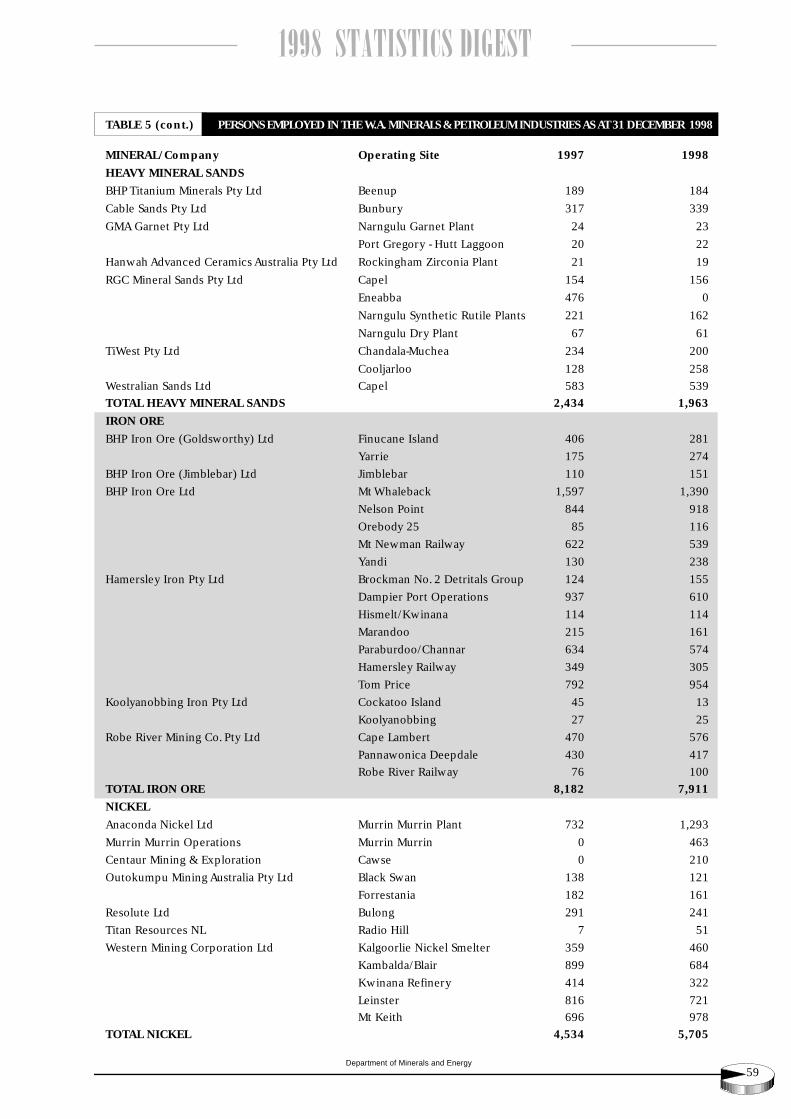
Department of Minerals and Energy
1998 STATISTICS DIGEST
TABLE 5 (cont.) PERSONS EMPLOYED IN THE W.A. MINERALS & PETROLEUM INDUSTRIES AS AT 31 DECEMBER 1998
MINERAL/Company Operating Site 1997 1998
HEAVY MINERAL SANDS
BHP Titanium Minerals Pty Ltd Beenup 189 184
Cable Sands Pty Ltd Bunbury 317 339
GMA Garnet Pty Ltd Narngulu Garnet Plant 24 23
Port Gregory - Hutt Laggoon 20 22
Hanwah Advanced Ceramics Australia Pty Ltd Rockingham Zirconia Plant 21 19
RGC Mineral Sands Pty Ltd Capel 154 156
Eneabba 476 0
Narngulu Synthetic Rutile Plants 221 162
Narngulu Dry Plant 67 61
TiWest Pty Ltd Chandala-Muchea 234 200
Cooljarloo 128 258
Westralian Sands Ltd Capel 583 539
TOTAL HEAVY MINERAL SANDS 2,434 1,963
IRON ORE
BHP Iron Ore (Goldsworthy) Ltd Finucane Island 406 281
Yarrie 175 274
BHP Iron Ore (Jimblebar) Ltd Jimblebar 110 151
BHP Iron Ore Ltd Mt Whaleback 1,597 1,390
Nelson Point 844 918
Orebody 25 85 116
Mt Newman Railway 622 539
Yandi 130 238
Hamersley Iron Pty Ltd Brockman No. 2 Detritals Group 124 155
Dampier Port Operations 937 610
Hismelt/Kwinana 114 114
Marandoo 215 161
Paraburdoo/Channar 634 574
Hamersley Railway 349 305
Tom Price 792 954
Koolyanobbing Iron Pty Ltd Cockatoo Island 45 13
Koolyanobbing 27 25
Robe River Mining Co. Pty Ltd Cape Lambert 470 576
Pannawonica Deepdale 430 417
Robe River Railway 76 100
TOTAL IRON ORE 8,182 7,911
NICKEL
Anaconda Nickel Ltd Murrin Murrin Plant 732 1,293
Murrin Murrin Operations Murrin Murrin 0 463
Centaur Mining & Exploration Cawse 0 210
Outokumpu Mining Australia Pty Ltd Black Swan 138 121
Forrestania 182 161
Resolute Ltd Bulong 291 241
Titan Resources NL Radio Hill 7 51
Western Mining Corporation Ltd Kalgoorlie Nickel Smelter 359 460
Kambalda/Blair 899 684
Kwinana Refinery 414 322
Leinster 816 721
Mt Keith 696 978
TOTAL NICKEL 4,534 5,705
59

1998 STATISTICS DIGEST
Department of Minerals and Energy
MINERAL/Company Operating Site 1997 1998
PETROLEUM PRODUCTSApache Energy Ltd Campbell, Agincourt, East Spar,
Harriet, Rosette, Sinbad, Tanami, Stag 131 147
ARC Dongara 6 6
BHP Petroleum (Australia) Pty Ltd Griffin 58 (e) 71
Tubridgi 0 28
Boral Beharra Springs, Tubridgi 12 12
Capital Blina, Boundary, Lloyd, Sundown,West Terrace 4 4
Mobil Exploration & Producing Australia Pty Ltd Wandoo 36 36
Novus Chervil, North Herald, South Pepper,Airlie Island 6 4
Phoenix Woodada 12 12
Premier Oil Australia Pty Ltd Mt Horner 6 7
West Australian Petroleum Pty Ltd (WAPET) Barrow Island, Cowle, Crest,Roller-Skate, Saladin, Yammaderry 218 202
Woodside Energy Ltd Cossack, Goodwyn, Hermes,North Rankin, Wanaea 1,334 1,291
TOTAL PETROLEUM PRODUCTS 1,823 1,820
SALT
Cargill Salt Co. Port Hedland 111 112
Dampier Salt Ltd Dampier 229 212
Lake MacLeod 139 163
Onslow Solar Salt Pty Ltd Onslow 86 117
Shark Bay Salt JV Useless Loop 121 73
TOTAL SALT 686 677
TOTAL CLAYS 62 55
TOTAL CONSTRUCTION MATERIALS 329 347
TOTAL DIMENSION STONE 71 30
TOTAL INDUSTRIAL PEGMATITE MINERALS 32 30
TOTAL LIMESTONE - LIMESAND 208 156
TOTAL MANGANESE ORE 0 6
TOTAL SILICA - SILICA SAND 241 207
TOTAL TALC 37 37
TOTAL TIN - TANTALUM - LITHIUM 273 255
ALL OTHER MATERIALS 225 334
TOTAL 40,488 41,302
(SOURCE: AXTAT REPORTING SYSTEM, MINING OPERATIONS DIVISION),
TABLE 5 (cont.) PERSONS EMPLOYED IN THE W.A. MINERALS & PETROLEUM INDUSTRIES AS AT 31 DECEMBER 1998
60

Department of Minerals and Energy
1998 STATISTICS DIGEST
TABLE 6 PRINCIPAL MINERALS AND PETROLEUM PRODUCERS 1998
61
BASE METALS
Copper
Murchison Zinc Co. Pty Ltd, 100 Hutt Street, Adelaide SA 5000, (08) 8303 1700: Golden Grove.
Newcrest Mining Ltd, 600 St Kilda Road, Melbourne Vic, 3004, (03) 9522 5333: Telfer.
Straits Resources Ltd, 1 Alfred Street, Sydney NSW 2000, (02) 9252 2011: Nifty.
WMC Ltd, 250 St George’s Terrace, Perth WA 6000, (08) 9442 2000: Kambalda
Lead – Zinc
Murchison Zinc Co. Pty Ltd, 100 Hutt Street, Adelaide SA 5000, (08) 8303 1700: Golden Grove.
Western Metals Ltd, 263 Adelaide Terrace, Perth WA 6000, (08) 9221 2555: Cadjebut.
BAUXITE – ALUMINA
AluminaAlcoa of Australia (WA) Ltd, cnr Davey and Marmion Streets, Booragoon WA 6154, (08) 9316 5111:Del Park, Jarrahdale, Willowdale.
Worsley Alumina Pty Ltd, PO Box 344, Boddington WA 6225, (08) 9734 8311: Boddington.
CHROMITE
Chromite OreDanelagh Resources Pty Ltd, 32 Kings Park Rd, West Perth WA 6005, (08) 9486 7640: Coobina.
CLAY
AttapulgiteHudson Resources Ltd, James St Narngulu, Geraldton WA 6530, (08) 9923 3604: Lake Nerramyne.
Fire ClayMidland Brick Co. Pty Ltd, Bassett Rd, Middle Swan WA 6056, (08) 9273 5522: Bullsbrook.
COAL
Griffin Coal Mining Co. Ltd, 28 The Esplanade, Perth WA 6000, (08) 9325 8155: Collie.
Wesfarmers Coal Ltd, 276 Leach Highway, Myaree WA 6153, (08) 9333 0391: Collie.
CONSTRUCTION MATERIALS
AggregatePioneer Concrete (WA) Pty Ltd: 123 Burswood Rd, Victoria Park WA 6100, (08) 9311 8811: Learmonth.
The Readymix Group (WA), 75 Canning Highway, Victoria Park WA 6100, (08) 9472 2000: Boodarrie,Burrup-Dampier.
GravelBoral Resources (WA) Ltd, 63 Abernethy Road, Belmont WA 6104, (08) 9333 3400: Grosmont.
WA Limestone Co, 41 Spearwood Ave, Bibra Lake WA 6163, (08) 9434 2299: Pickering.
RockThe Readymix Group (WA), 75 Canning Highway, Victoria Park WA 6100, (08) 9472 2000: Kalgoorlie.
SandBoral Resources (WA) Ltd, 63 Abernethy Rd, Belmont WA 6104, (08) 9333 3400: Gnarlbine, Grosmont.
Rocla Quarry Products, 1 Newburn Road, Kewdale WA 6105, (08) 9353 3030: Gnangarra.
The Readymix Group (WA), 75 Canning Highway, Victoria Park WA 6100, (08) 9472 2000: Comet Vale,Pinnacles, Sandy Creek, Sandy Hill, Sullivan’s Creek, Turner River, Warrawanda, Widgiemooltha.
DIAMOND
Argyle Diamond Mines, 2 Kings Park Road, West Perth WA 6005, (08) 9482 1166: Argyle.

1998 STATISTICS DIGEST
Department of Minerals and Energy
TABLE 6 (cont.) PRINCIPAL MINERALS AND PETROLEUM PRODUCERS 1998
62
GOLD
Acacia Resources Ltd, 60 City Road, South Melbourne VIC 3006, (03) 9684 4999: Sunrise Dam.
Australian Resources Ltd, 100 Williams Street, East Sydney NSW 2010, (02) 9326 9277: Gidgee,
Mt McClure.
Barminco Pty Ltd, 9 Bowman Street, South Perth WA 6151, (08) 9474 1340: Karonie.
Centaur Mining & Exploration Ltd, 210 Kings Way, South Melbourne VIC 3205, (03) 9234 1122:
Mt Pleasant-Golden Kilometre, Ora Banda.
Central Norseman Gold Corp. NL, 60 City Road, Southbank VIC 3006, (03) 9685 6000: Central Norseman.
Croesus Mining NL, 39 Porter Street, Kalgoorlie WA 6430, (08) 9091 2222: Binduli.
Davyhurst Project Pty Ltd, PMB 14, Kalgoorlie WA 6430, (08) 9269 1800: Davyhurst.
Delta Gold NL, 99 Walker Street, North Sydney NSW 2060, (02) 9903 4000: Golden Feather.
Equigold NL, 7 Sleat Street, Applecross WA 6153, (08) 9316 3661: Dalgaranga.
Goldfields Kalgoorlie Ltd, 1 Alfred Street, Sydney NSW 2000, (02) 9934 8800: Kundana, Paddington.
Great Central Mines NL, 210 Kings Way, Sth Melbourne VIC 3205, (03) 9234 1111: Bronzewing, Jundee-
Nimary, Wiluna.
Hedges Gold Pty Ltd, Pinjarra - Williams Road, Boddington WA 6390, (08) 9538 4500: Hedges.
Herald Resources Ltd, 40 Kings’ Park Road, West Perth WA 6005, (08) 9322 2788: Sandstone, Coolgardie.
Hill 50 Gold NL, 10 Ord Street, West Perth WA 6005, (08) 9485 0070: Hill 50 Mt Magnet.
Homestake Mining Company, 2 Mill Street, Perth WA 6000, (08) 9212 5777: Darlot, Lawlers, Plutonic.
Kalgoorlie Consolidated Gold Mines Pty Ltd, Private Bag 27, Kalgoorlie WA 6430, (08) 9022 1100: Golden
Mile.
Lionore Australia Pty Ltd, 15 Ord Street, West Perth WA 6005, (08) 9481 5656: Bounty.
Lynas Gold NL, 50 Colin St, West Perth WA 6005, (08) 9481 3400: Paraburdoo.
Newcrest Mining Ltd, 600 St Kilda Road, Melbourne VIC 3004, (03) 9522 5333: New Celebration, Telfer.
New Hampton Goldfields NL, 9 Havelock Street, West Perth WA 6005, (08) 9321 0611: Jubilee
Normandy Mining Ltd, 100 Hutt Street, Adelaide SA 5000, (08) 8303 1700: Big Bell, Golden Crown, Kaltails.
North Ltd, 476 St Kilda Road, Melbourne VIC 3004, (03) 9207 5111: Kanowna Belle, Peak Hill.
Pacific Mining Corporation Ltd, 35 Ventnor Ave, West Perth WA 6005, (08) 9321 0616: Tarmoola.
Perilya Mines NL, 31 Ventnor Avenue, West Perth WA 6005, (08) 9423 1700: Fortnum.
Placer Dome Inc, 1 Alfred Street, Sydney Cove NSW 2000 (02) 9256 3800: Granny Smith.
Resolute Ltd, 28 The Esplanade, Perth WA 6000, (08) 9261 6100: Chalice.
Sons of Gwalia NL, 16 Parliament Place, West Perth WA 6005, (08) 9263 5555: Bullfinch, Marvel Loch-
Southern Cross, Sons of Gwalia, Yilgarn Star.
St Barbara Mines Ltd, 2 The Esplanade, Perth WA 6000, (08) 9323 3333: Bluebird.
WMC Ltd, 250 St George’s Terrace, Perth WA 6000, (08) 9442 2000: Agnew, Kambalda-St Ives.
Worsley Alumina Pty Ltd, PO Box 48, Boddington WA 6390, (08) 9883 8260: Boddington.
GYPSUM
Dampier Salt (Operations) Pty Ltd, 152 St George’s Terrace, Perth WA 6000, (08) 9327 2257: Lake Macleod.
Swan Cement Ltd, PO Box 528, Kwinana WA 6966, (08) 9499 2222: Lake Hillman.
Westdeen Holdings Pty Ltd, 7 Armstrong Rd, Applecross WA 6153 (08) 9364 4951: Lake Cowcowing.

Department of Minerals and Energy
1998 STATISTICS DIGEST
TABLE 6 (cont.) PRINCIPAL MINERALS AND PETROLEUM PRODUCERS 1998
63
HEAVY MINERAL SANDS
Garnet Sand
GMA Garnet Pty Ltd, PO Box 188, Geraldton WA 6530, (08) 9923 3644: Port Gregory.
Ilmenite, Leucoxene, Rutile and Zircon
BHP Titanium Minerals Pty Ltd, PO Box 22, Karridale WA 6288, (08) 9758 2500: Beenup.
Cable Sands (WA) Pty Ltd, PO Box 133, Bunbury WA 6230, (08) 9721 4111: Busselton, Jangardup, Waroona,Sandalwood.
RGC Mineral Sands, PO Box 84, Geraldton WA 6530, (08) 9956 8222: Capel, Eneabba.
TiWest Pty Ltd, 1 Brodie-Hall Drive, Bentley WA 6102, (08) 9365 1333: Cooljarloo.
Westralian Sands Ltd, PO Box 96, Capel WA 6271, (08) 9780 3200: Busselton, Capel, Yoganup.
IRON ORE
BHP Iron Ore (Goldsworthy) Ltd, 200 St George’s Terrace, Perth WA 6000, (08) 9320 4444: Nimingarra.
BHP Iron Ore (Jimblebar) Ltd, 200 St George’s Terrace, Perth WA 6000, (08) 9320 4444: Jimblebar.
BHP Iron Ore Ltd, 200 St George’s Terrace, Perth WA 6000, (08) 9320 4444: Newman, Yandicoogina.
Channar Mining Pty Ltd, 152 St George’s Tce, Perth WA 6000, (08) 9327 2327: Channar.
Hamersley Iron Pty Ltd, 152 St George’s Terrace, Perth WA 6000, (08) 9327 2327: Brockman, Marandoo,
Paraburdoo, Tom Price.
Koolyanobbing Iron Pty Ltd, 1 William St, Perth WA 6000, (08) 9426 3388: Cockatoo Island,
Koolyanobbing.
Robe River Iron Associates, 12 St George’s Terrace, Perth WA 6000, (08) 9421 4747: Pannawonica.
LIMESAND - LIMESTONE
Cockburn Cement Ltd, Russell Road, East Munster WA 6166, (08) 9411 1000: Cockburn Sound, Dongara.
Limestone Resources Australia Pty Ltd, Parkland Road (cnr Hasler Road) Osborne Park WA 6017,
(08) 944 4244: Moore River, Wanneroo.
Loongana Lime Pty Ltd, PO Box 808, Kalgoorlie WA 6430, (08) 9021 8055: Loongana.
WA Limestone Co, 41 Spearwood Ave, Bibra Lake WA 6163, (08) 9434 2299: Postans.
Westdeen Holdings Pty Ltd, 7 Armstrong Rd, Applecross WA 6153 (08) 9364 4951: Dongara-Denison,
Cervantes, Lancelin, Yanchep.
MANGANESE
Consolidated Minerals Ltd, Level 1, 88 Colin St, West Perth 6005 (08) 9321 3633: Woodie Woodie.
NICKEL
Australian Nickel Mines, 1st Floor, 24 Outram St, West Perth WA 6005, (08) 9481 6040: Radio Hill.
Black Swan Nickel Pty Ltd, Locked Bag 50, Kalgoorlie Business Centre, Kalgoorlie WA 6430
(08) 9024 0240: Black Swan, Silver Swan.
Outokumpu Australia Pty Ltd, 141 Burswood Road, Burswood WA 6100, (08) 9472 3144: Forrestania.
WMC Ltd, 250 St George’s Terrace, Perth WA 6000, (08) 9442 2000: Kambalda/Blair, Leinster, Mt Keith,
Carnilya Hill.
PETROLEUM
Apache Energy Ltd, Level 3, 256 St George’s Terrace, Perth WA 6000, (08) 9422 7222: East Spar, Harriet,
Stag, Airlie Island.
ARC Energy NL, 35 Ventnor Avenue, West Perth WA 6005, (08) 9486 7333: Dongara.
BHP Petroleum Pty Ltd, Central Park, 152-158 St George’s Terrace, Perth WA 6000, (08) 9278 4888: Griffin

1998 STATISTICS DIGEST
Department of Minerals and Energy
TABLE 6 (cont.) PRINCIPAL MINERALS AND PETROLEUM PRODUCERS 1998
64
PETROLEUM (Continued)
Boral Energy Resources Ltd, 339 Coronation Drive, Milton QLD 4064, (07) 3858 0257: Beharra Springs,Tubridgi.
Capital Energy NL, Level 7, The Landmark, 345 George Street, Sydney NSW 2000, (02) 9262 6833:Blina-Lloyd, Sundown.
Mobil Exploration & Producing Australia Pty Ltd, Level 29, QV1 Building, 250 St George’s Terrace, PerthWA 6000, (08) 9424 9200: Wandoo
Phoenix Energy Pty Ltd, 10th Floor, The Griffin Centre, 28 The Esplanade, Perth WA 6000, (08) 9261 2800:Woodada.
Premier Oil Australia Pty Ltd, Level 3, 31 Ventnor Ave, West Perth 6005, (08) 9480 4100: Mt Horner.
West Australian Petroleum Pty Ltd (WAPET), Level 24, QV1 Building, 250 St George’s Terrace, Perth WA6000, (08) 9263 6000: Barrow Island, Crest, Roller-Skate, Saladin.
Woodside Energy Ltd, 1 Adelaide Terrace, Perth WA 6000, (08) 9224 4111: Cossack, Goodwyn, Hermes,North Rankin, Wanaea.
PLATINUM
WMC Ltd, 250 St George’s Terrace, Perth WA 6000, (08) 9442 2000: Kambalda
PALADIUM
WMC Ltd, 250 St George’s Terrace, Perth WA 6000, (08) 9442 2000: Kambalda
SALT
Cargill Salt, North West Coastal Hwy, Port Hedland WA 6721, (08) 9173 0200: Port Hedland.
Dampier Salt (Operations) Pty Ltd, 152-158 St George’s Terrace, Perth WA 6000, (08) 9327 2299: Dampier,Lake Macleod.
Shark Bay Salt Joint Venture, 22 Mount Street, Perth WA 6000, (08) 9322 4811: Useless Loop.
WA Salt Koolyanobbing Pty Ltd, Cockburn Road, Hamilton Hill WA 6163, (08) 9430 5495: Lake DeborahEast, Pink Lake.
SILICA - SILICA SAND
Silica
Simcoa Operations Pty Ltd, PO Box 1389, Bunbury WA 6231, (08) 9791 2588: Dalaroo.
Silica Sand
Rocla Quarry Products, 1 Newburn Road, Kewdale WA 6105, (08) 9353 3030: Jandakot.
The Readymix Group (WA), 75 Canning Highway, Victoria Park WA 6100, (08) 9472 2000: Jandakot.
TT Sand Pty Ltd, 55 St George’s Tce, Perth WA 6000, (08) 9221 2304: Mindijup.
WMC Ltd, 251 St George’s Terrace, Perth WA 6000, (08) 9442 2000: Mt Burgess.
TALC
Commercial Minerals Ltd, 26 Tomlinson Rd, Welshpool WA 6106, (08) 9362 1411: Mt Seabrook.
WMC Ltd, PO Box 116, Three Springs WA 6519, (08) 9954 5047: Three Springs.
TIN - TANTALUM - LITHIUM
Spodumene
Sons of Gwalia Ltd, 16 Parliament Place, West Perth WA 6005, (08) 9263 5555: Greenbushes, Wodgina.
Tantalite - Tin
Sons of Gwalia Ltd, 16 Parliament Place, West Perth WA 6005, (08) 9263 5555: Greenbushes, Wodgina.

Department of Minerals and Energy
1998 STATISTICS DIGEST
65
ABBREVIATIONS, REFERENCES, UNITS AND CONVERSION FACTORSAs the document makes use of abbreviations and references, an explanation of each has been included below. A conversion
table, relating the units by which various commodities are measured, has also been provided.
ABBREVIATIONScons concentrates n/a not applicable
f.o.t. free on truck f.o.b. free on board
f.o.r. free on rail ¥ Japanese Yen
A$ Australian Dollar US$ United States Dollar
ABS Australian Bureau of Statistics GDP Gross Domestic Product
AFR Australian Financial Review BMR Bureau of Mineral Resources
CSO Central Selling Organisation HBI Hot Briquetted Iron
DRI Direct Reduced Iron IMF International Monetary Fund
RBA Reserve Bank of Australia
ABARE Australian Bureau of Agricultural and Resource Economics
REFERENCES(a) Estimated f.o.b. value.
(b) Metallic by-product of nickel mining.
(c) Value based on the average Australian Value of Alumina as published by the ABS.
(d) Value at works.
(e) Estimated ex-mine value.
(f) Value based on monthly production and average gold price of that month as supplied by GoldCorp.
(g) Estimated f.o.t. value.
(h) Estimated f.o.r.value.
(i) Estimated f.o.b.value based on the current price of nickel containing products.
(j) Delivered value.
(k) Metallic by-product of copper mining.
(l) By-products of gold mining
(r) Revised from previous edition.
UNITS AND CONVERSION FACTORSMetric Unit Symbol Imperial Unit
Mass 1 gram (g) = 0.032151 troy (fine) ounce (oz)
1 kilogram (kg) = 2.204624 pounds (lbs)
1 tonne (t) = 1.10231 United States short ton [1 US short ton =2,000 lbs]
1 tonne (t) = 0.98421 United Kingdom long ton [1 UK long ton = 2,240 lbs]
Volume 1 kilolitre (kl) = 6.28981 barrels (bbls)
1 cubic metre (m3) = 35.3147 cubic feet (ft3) [1 kilolitre (kl) = 1 cubic metre (m3)]
Energy 1 kilojoule (kj) = 0.94781 British Thermal Units (Btu)
Energy Content Prefix
Coal 19.7 GJ/t kilo (k) 103
Condensate 32.0 MJ/L mega (M) 106
Crude oil 37.0 MJ/L giga (G) 109
LNG 25.0 MJ/L tera (T) 1012
Natural gas 38.2 MJ/m3 peta (P) 1015
LPG-butane 28.7 MJ/L (1tonne LPG-butane = 1,720 litres)
LPG-propane 25.4 MJ/L (1tonne LPG-propane = 1,960 litres)

1998 STATISTICS DIGEST
Department of Minerals and Energy62

Corporate policy, Planning and Finance
Mineral HouseDepartment of Minerals and Energy100 Plain StreetEast Perth WA 6004
Telephone local: (08) 9222 3410International: 61 8 9222 3106
Facsimile local: (08) 9222 3410International: 61 8 9222 3410
Email: [email protected]
http://www.dme.wa.gov.au
“Our Resources • Our People • Our Future”
For further information on the Mineral andPetroleum Resources of Western Australia tocompliment this publication please refer to:
• Mineral and Petroleum Exploration and Development
• Atlas of Mineral Deposits and Petroleum Fields


![[2005] WAMW 5 - dmp.wa.gov.au](https://img.pdfslide.us/doc/110x75/622d500291bca001047fa3a9/2005-wamw-5-dmpwagovau.jpg)