Embed Size (px)
Citation preview
Department of Industrial and Systems Engineering IE3100 System Design Project
Wafer Profile Indicator Team Composition: CHEN Xiao Yang, CHENG Lei, GU Shimin, LI Xiayu, TAY Choon Wee
Current process monitoring tools :
X-bar chart & Sigma Chart
• Detect abnormalities in the mean and the variance of a particular layer of the sample wafer in-line
• Unable to detect abnormalities in the profile of the layer in-line.
• Abnormalities only discovered near the end of the manufacturing process
Improve performance of the process by introducing a profile indicator that
• Detects wafers with profile issue in-line
• Utilizes the readily available data
• Minimizes “false-alarm”
Industrial Supervisor: Mr LEE Koong Leng Supervisors: Associate Professor NG Szu Hui, Dr CHEN Nan
0
0.1
0.2
0.3
0.4
0.5
0.6
0.7
0.8
0.9
1
1
16
31
46
61
76
91
10
6
12
1
13
6
15
1
16
6
18
1
19
6
21
1
22
6
24
1
25
6
27
1
28
6
30
1
31
6
33
1
34
6
36
1
37
6
39
1
40
6
42
1
43
6
45
1
46
6
48
1
49
6
51
1
52
6
54
1
55
6
57
1
58
6
60
1
61
6
63
1
Prob
Cutoff
Alarm
LR
at
wo
rk
LR is a predictive statistical model that aims to construct a parametric curve which best fits the observations. LR transforms the dependent variable, i.e. the probability of a wafer having issue, to its logit function (Logit function is the inverse of the sigmoidal logistic function). A suitable threshold can be drawn, above which an “issue detected” alarm will be triggered.
SVM classify the data by recognizing patterns and separating the defected units from the non-defect units.
A hyperplane is generated such that the distance between the hyperplane and the nearest data point on both sides is maximized.
Misclassification of points is inevitable. By adjusting both the degree of model separator and the cost constraint value, C, will affect the values of alpha- and beta-errors.
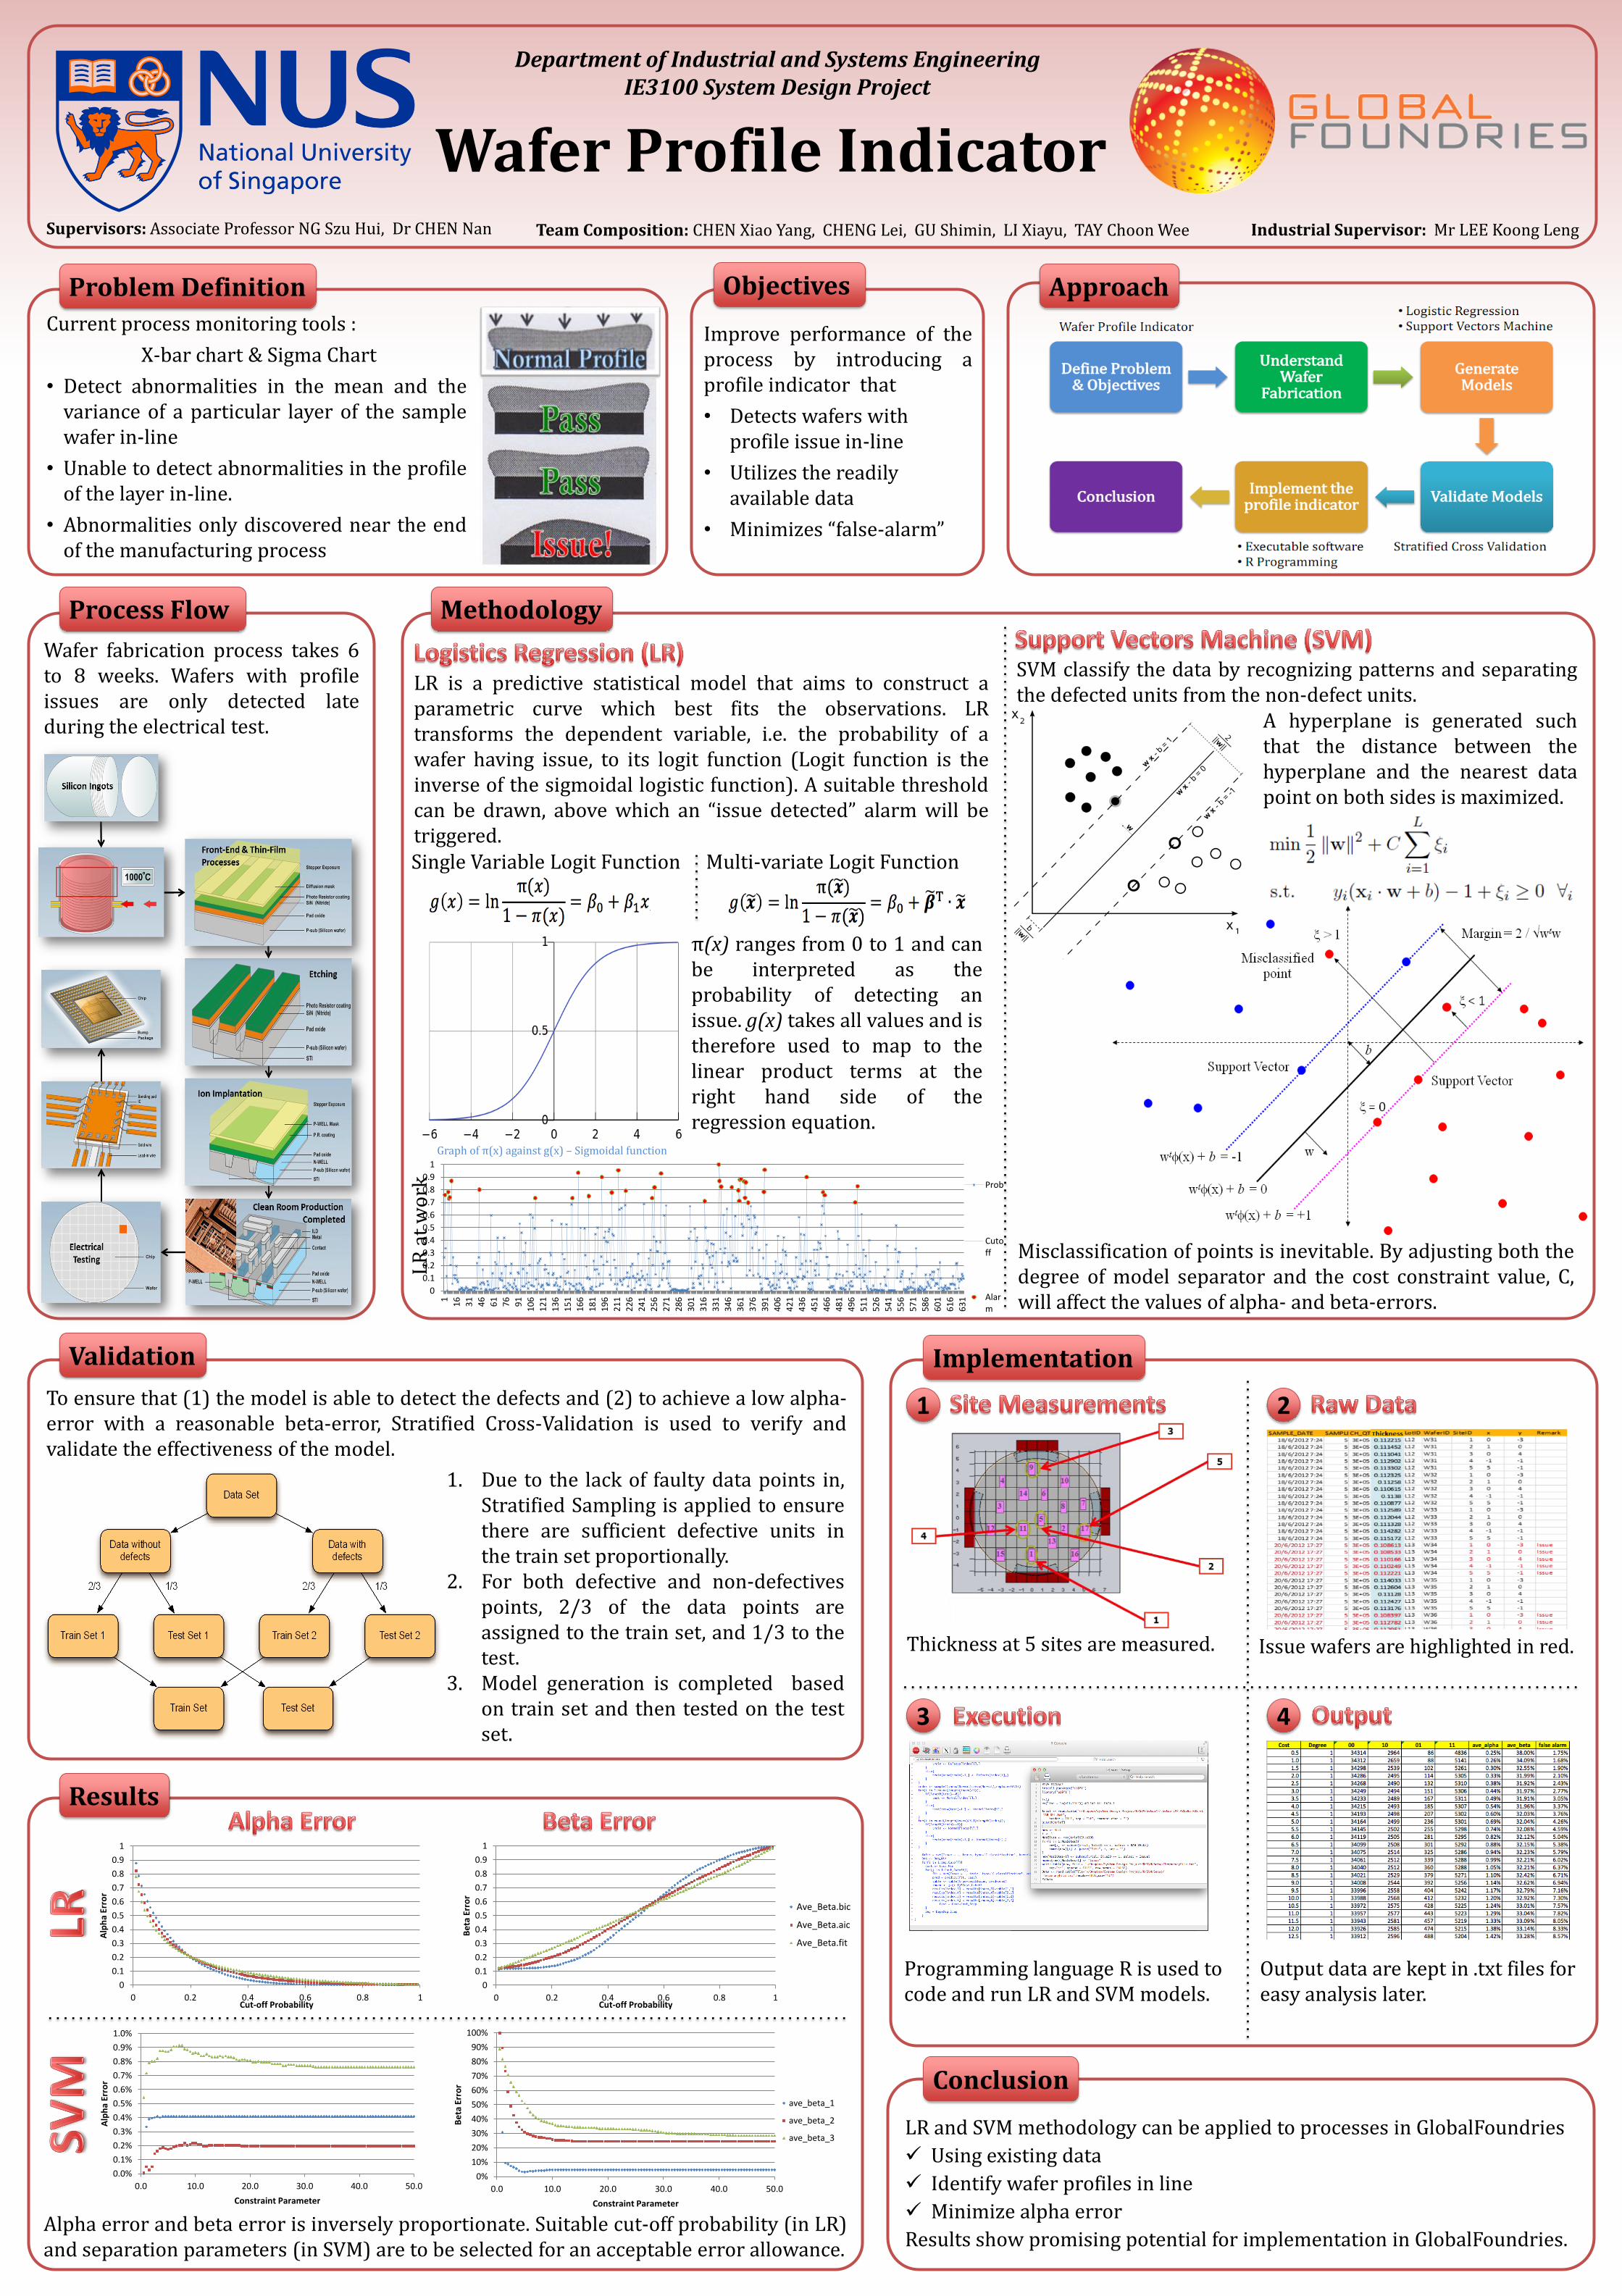
1. Due to the lack of faulty data points in, Stratified Sampling is applied to ensure there are sufficient defective units in the train set proportionally.
2. For both defective and non-defectives points, 2/3 of the data points are assigned to the train set, and 1/3 to the test.
3. Model generation is completed based on train set and then tested on the test set.
To ensure that (1) the model is able to detect the defects and (2) to achieve a low alpha-error with a reasonable beta-error, Stratified Cross-Validation is used to verify and validate the effectiveness of the model.
Alpha error and beta error is inversely proportionate. Suitable cut-off probability (in LR) and separation parameters (in SVM) are to be selected for an acceptable error allowance.
0
0.1
0.2
0.3
0.4
0.5
0.6
0.7
0.8
0.9
1
0 0.2 0.4 0.6 0.8 1
Alp
ha
Erro
r
Cut-off Probability
0
0.1
0.2
0.3
0.4
0.5
0.6
0.7
0.8
0.9
1
0 0.2 0.4 0.6 0.8 1
Be
ta E
rro
r
Cut-off Probability
Ave_Beta.bic
Ave_Beta.aic
Ave_Beta.fit
Problem Definition Objectives
Methodology
π(x) ranges from 0 to 1 and can be interpreted as the probability of detecting an issue. g(x) takes all values and is therefore used to map to the linear product terms at the right hand side of the regression equation.
Single Variable Logit Function Multi-variate Logit Function
Graph of π(x) against g(x) – Sigmoidal function
Validation
Results
Implementation
Conclusion
0.0%
0.1%
0.2%
0.3%
0.4%
0.5%
0.6%
0.7%
0.8%
0.9%
1.0%
0.0 10.0 20.0 30.0 40.0 50.0
Alp
ha
Erro
r
Constraint Parameter
0%
10%
20%
30%
40%
50%
60%
70%
80%
90%
100%
0.0 10.0 20.0 30.0 40.0 50.0
Be
ta E
rro
r
Constraint Parameter
ave_beta_1
ave_beta_2
ave_beta_3
Process Flow
Wafer fabrication process takes 6 to 8 weeks. Wafers with profile issues are only detected late during the electrical test.
LR and SVM methodology can be applied to processes in GlobalFoundries
Using existing data
Identify wafer profiles in line
Minimize alpha error
Results show promising potential for implementation in GlobalFoundries.
Approach
1 2
3 4
Thickness at 5 sites are measured. Issue wafers are highlighted in red.
Programming language R is used to code and run LR and SVM models.
Output data are kept in .txt files for easy analysis later.