Embed Size (px)
Citation preview
Department of Geo-information Processing
possibilities & pitfalls of web sites possibilities & pitfalls of web sites for spatial data disseminationfor spatial data dissemination
Barend KöbbenInternational Institute for Geo-information Science
and Earth Observation (ITC)
Department of Geo-information Processing
Setting the stageSetting the stage
Barend Köbben<[email protected]>
Department of Geo-information Processing
OverviewOverview
• Why use maps?• Changing Cartography
• Why use the Web?
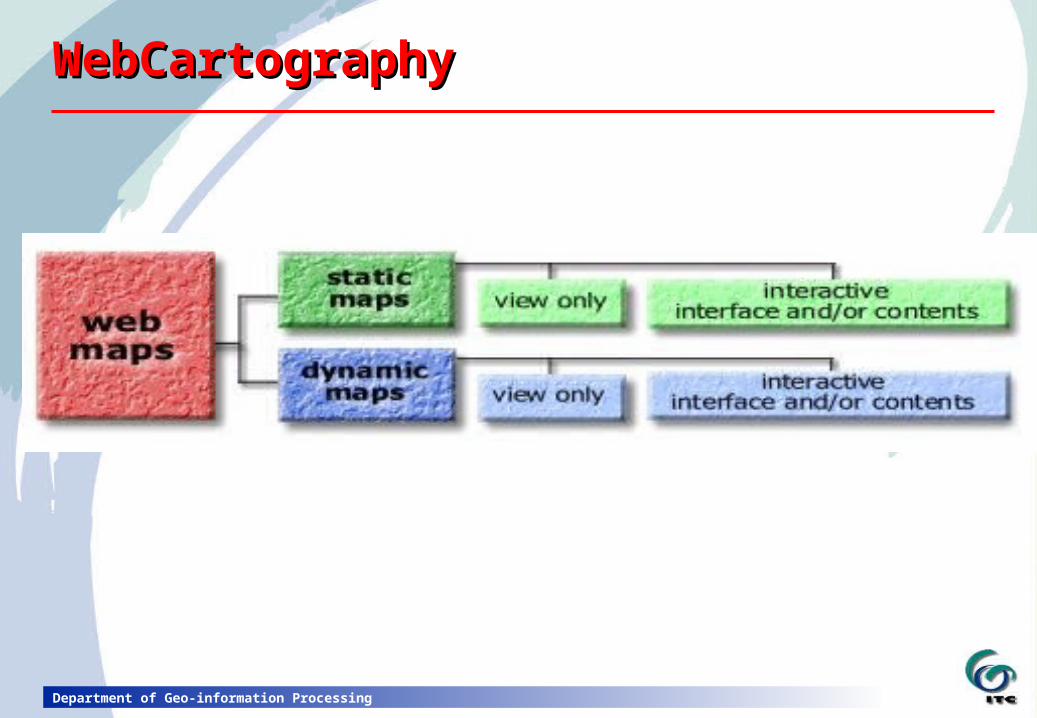
• WebCartography: static ‘view-only’ web-maps static ‘interactive’ web-maps dynamic ‘view-only’ web-maps dynamic ‘interactive’ web-maps
• How the Web works
Department of Geo-information Processing
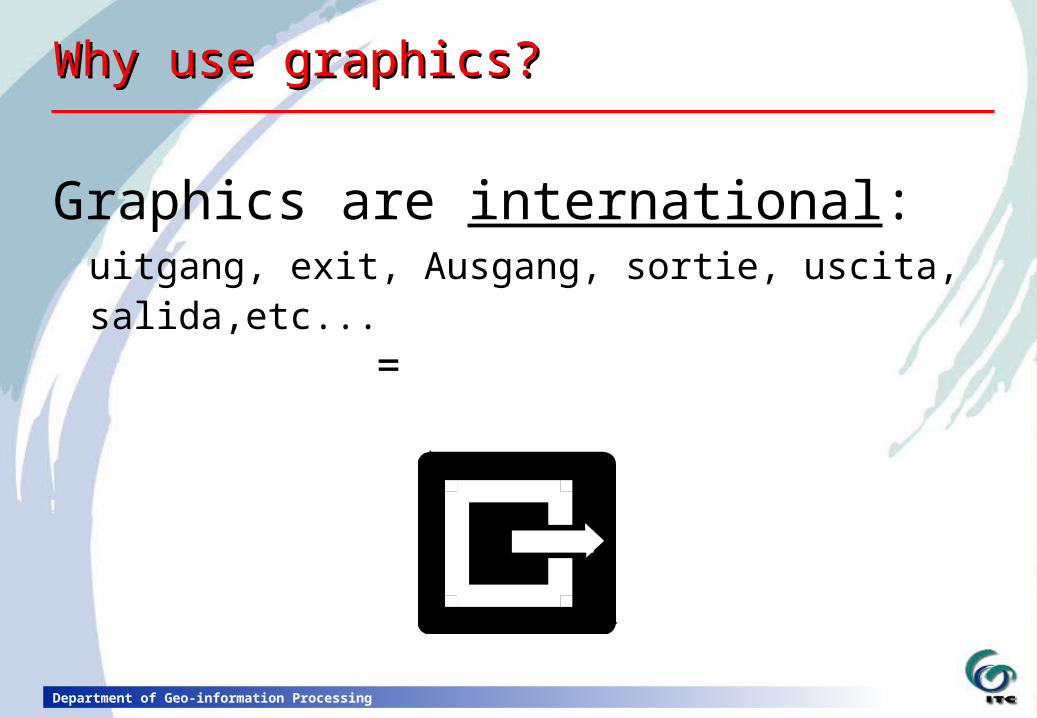
Why use graphics?Why use graphics?
Graphics are international:uitgang, exit, Ausgang, sortie, uscita, salida,etc...
=
Department of Geo-information Processing
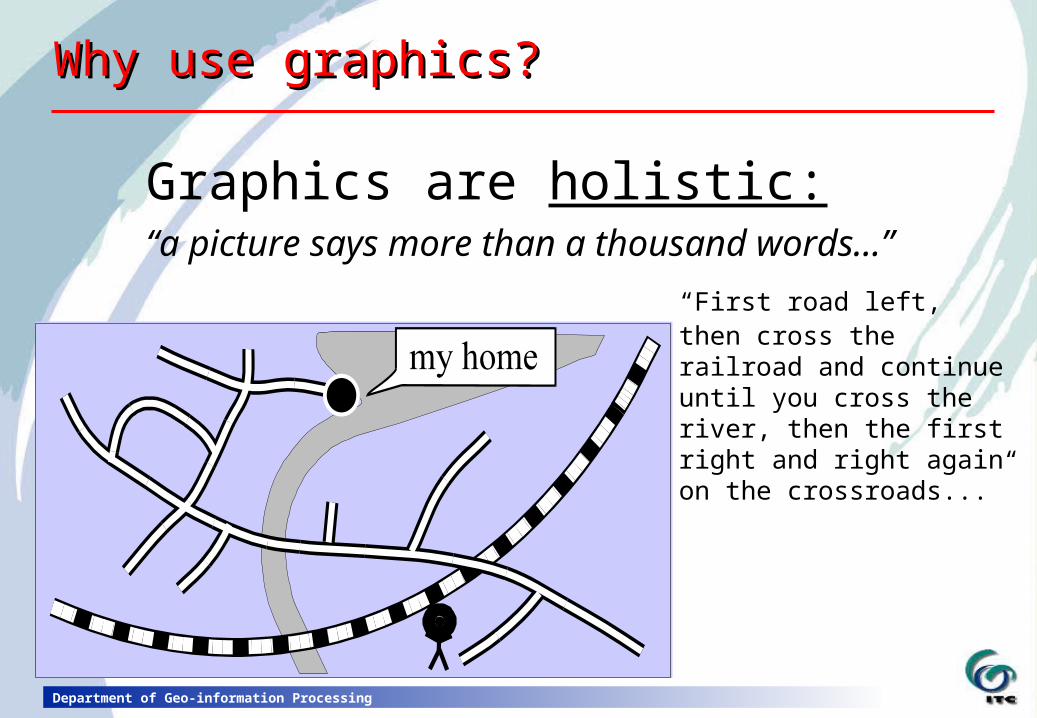
Why use graphics?Why use graphics?
Graphics are holistic:“a picture says more than a thousand words...”
“First road left, then cross the railroad and continue until you cross the river, then the first right and right again on the crossroads...”
Department of Geo-information Processing
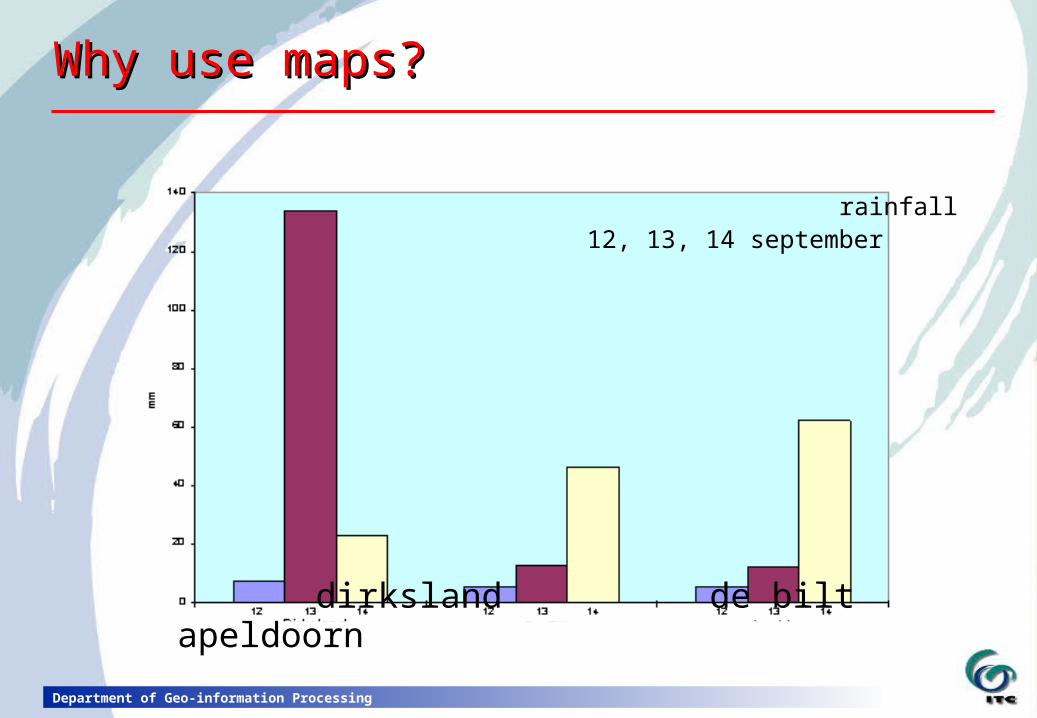
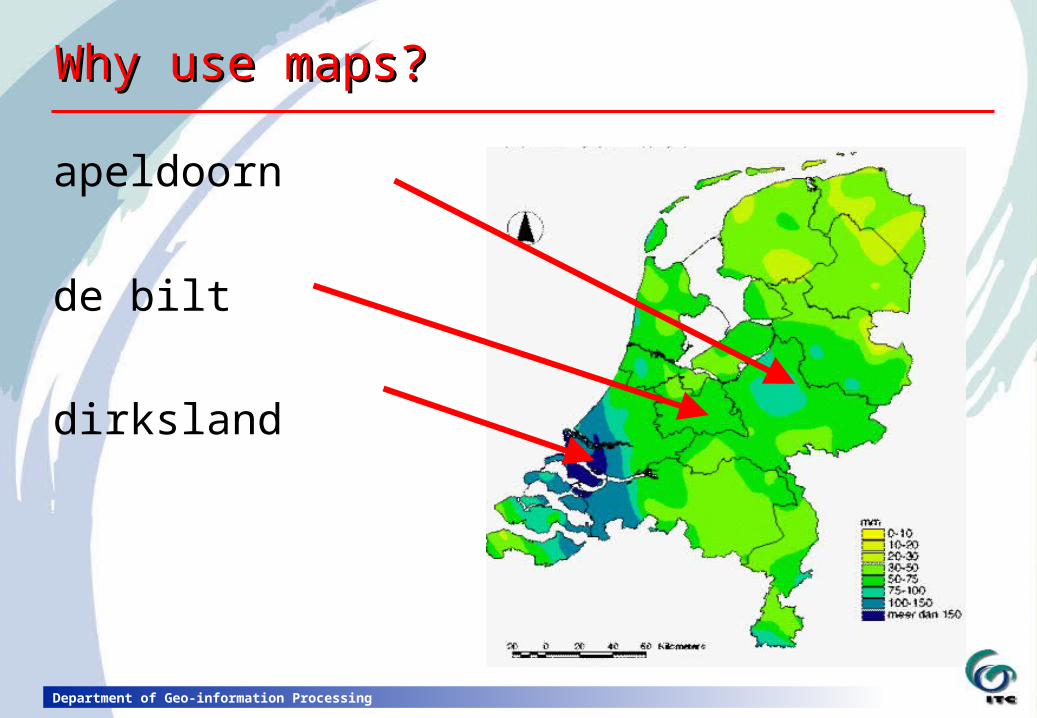
Why use maps?Why use maps?
rainfall 12, 13, 14 september
dirksland de bilt apeldoorn
Department of Geo-information Processing
Why use maps?Why use maps?
apeldoorn
de bilt
dirksland
Department of Geo-information Processing
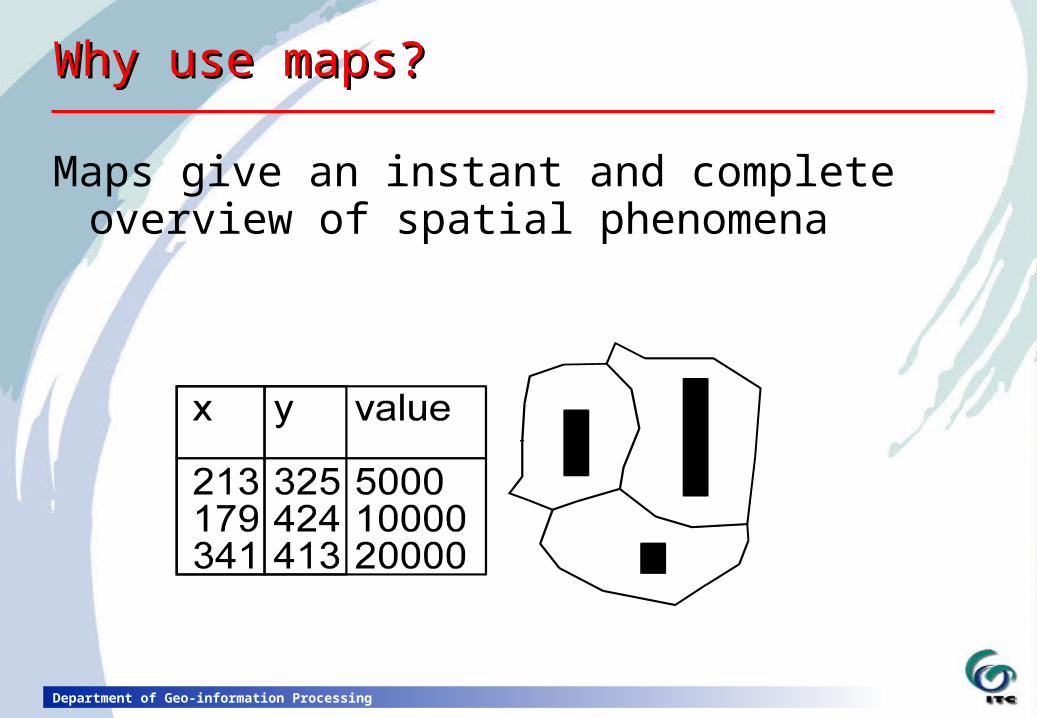
Why use maps?Why use maps?
Maps give an instant and complete overview of spatial phenomena

Department of Geo-information Processing
Developments in cartographyDevelopments in cartography
1950’sfirst computer maps
1960’s / 1970’sautomation of existing tasks (line drawings)
1980’scomputer-assisted map production
1990’sfull integration of maps in GI
(scientific) visualization from supply to ‘demand’ driven mapping Internet / Web environments
2000’slocation-based services in mobile environments
Department of Geo-information Processing
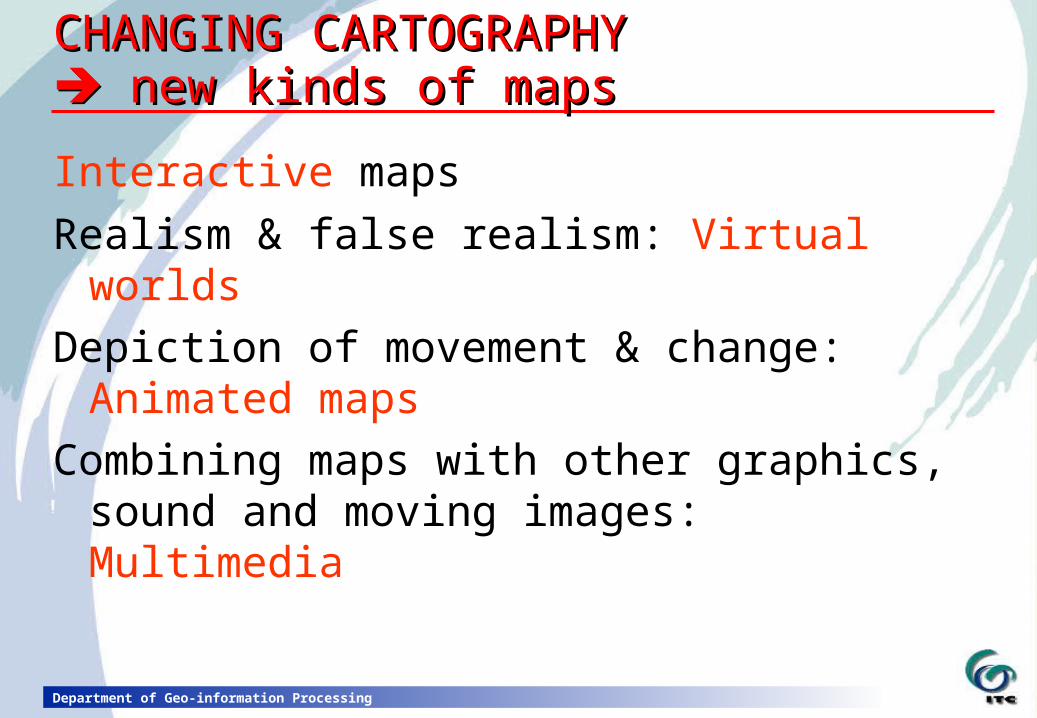
CHANGING CARTOGRAPHY CHANGING CARTOGRAPHY new kinds of maps new kinds of maps
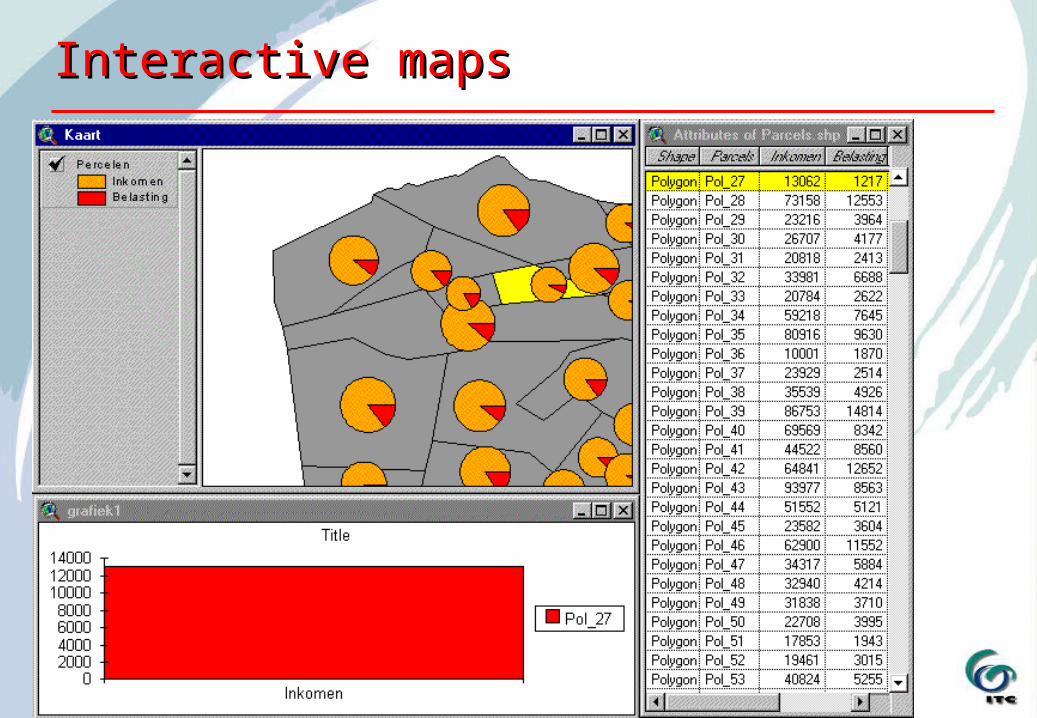
Interactive maps
Realism & false realism: Virtual worlds
Depiction of movement & change: Animated maps
Combining maps with other graphics, sound and moving images: Multimedia
Department of Geo-information Processing
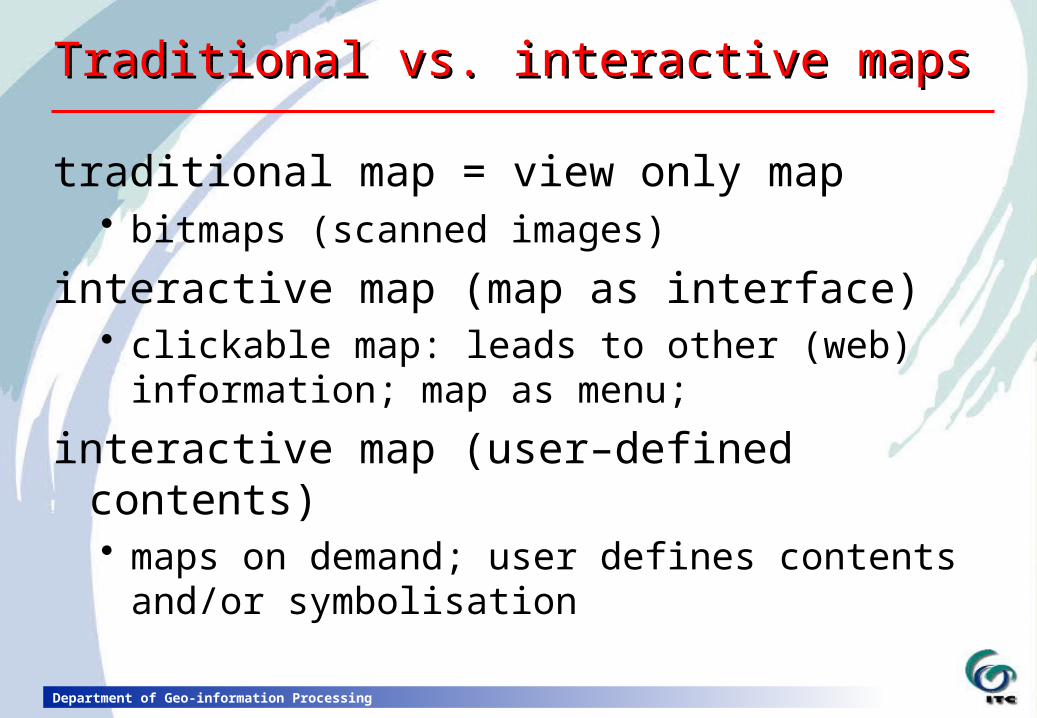
Traditional vs. interactive mapsTraditional vs. interactive maps
traditional map = view only map bitmaps (scanned images)
interactive map (map as interface) clickable map: leads to other (web) information;
map as menu;
interactive map (user–defined contents) maps on demand; user defines contents and/or
symbolisation
Department of Geo-information Processing
Interactive mapsInteractive maps
Department of Geo-information Processing
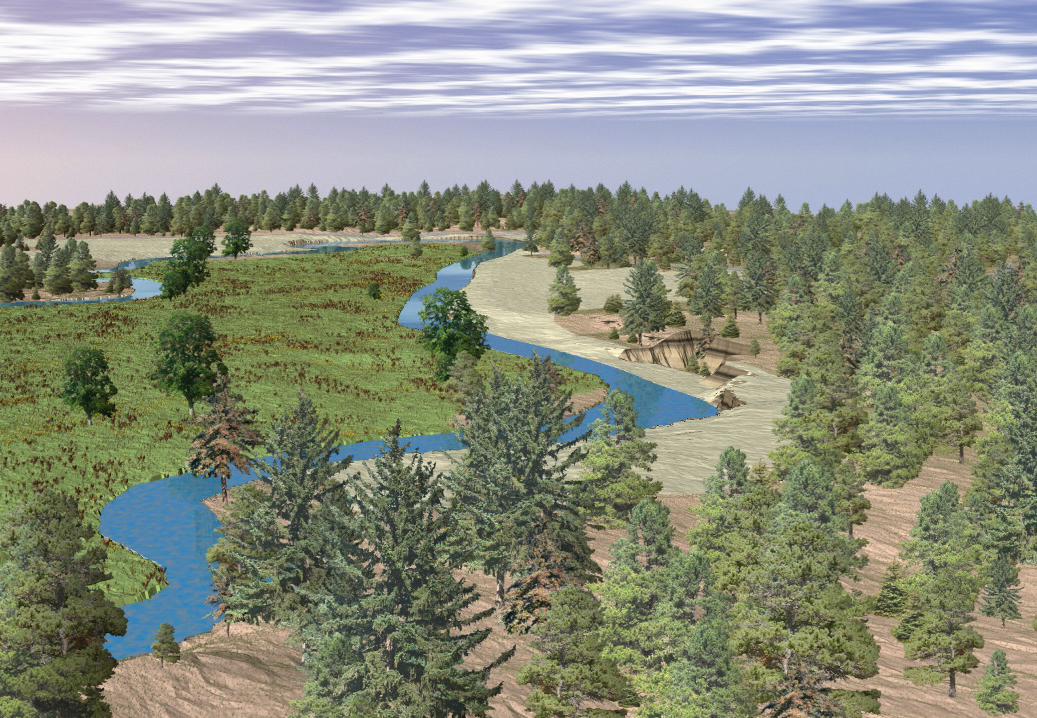
The world mapped “as it is”
Perspective view (instead of orthogonal)
Complete (not generalised)
Realistic (not symbolised)
Photo–realism (or pseudo–realism)
Virtual worldsVirtual worlds
Department of Geo-information Processing
Virtual Worlds Virtual Worlds
Department of Geo-information Processing
Animated mapsAnimated maps
For showing dynamic phenomena As animated maps (“movies”)
As dynamic real-time images (dynamic webpages)
For moving through Virtual Worlds As animations (eg. animatedGIF, Quicktime movies)
With interactive contents (modelled worlds, eg. games, VRML)
Department of Geo-information Processing
Multimedia definitionMultimedia definition
“The combination of various media parts into a coherent whole”
Media parts: maps, graphics, text, moving images, sound, text,
etc...
Coherent whole: The whole is more than the sum of the parts
Department of Geo-information Processing
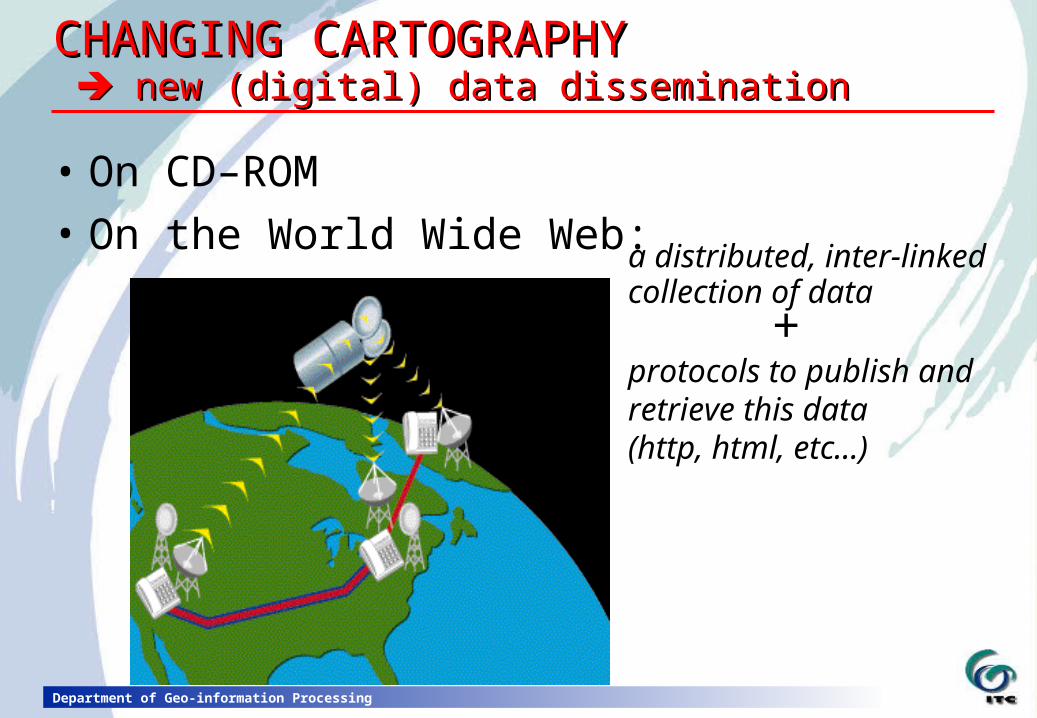
• On CD–ROM
• On the World Wide Web:a distributed, inter-linked collection of data
+protocols to publish and retrieve this data(http, html, etc...)
CHANGING CARTOGRAPHY CHANGING CARTOGRAPHY new (digital) data dissemination new (digital) data dissemination
Department of Geo-information Processing
Why use the Web?Why use the Web?
• WWW information is virtually platform-independent
• unrivalled in its capacity to reach many users at minimal costs
• easy to update frequently
• the WWW allows for a dynamic and interactive dissemination of spatial data: New map types
Department of Geo-information Processing
DisadvantagesDisadvantages
• Potential user group is limited (though growing fast) and skewed (computer- literate and connected people)
• Difficult to charge for use
• Fast-moving: Information is time-sensitive Interactivity is a must
Department of Geo-information Processing
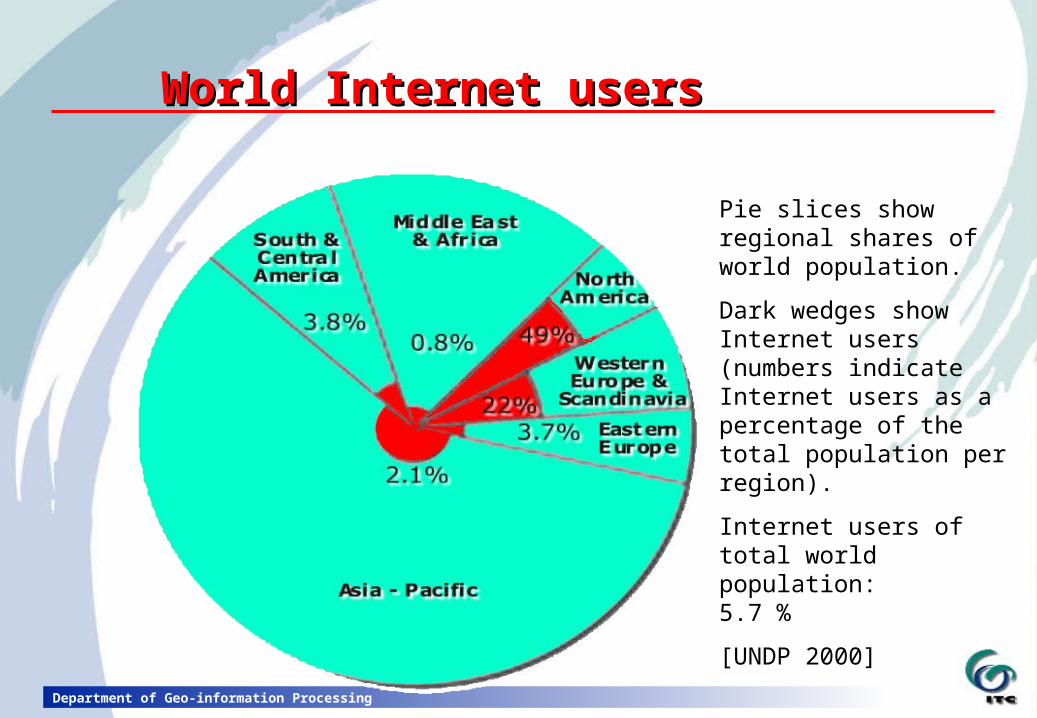
World Internet usersWorld Internet users
Pie slices show regional shares of world population.
Dark wedges show Internet users (numbers indicate Internet users as a percentage of the total population per region).
Internet users of total world population: 5.7 %
[UNDP 2000]
Department of Geo-information Processing
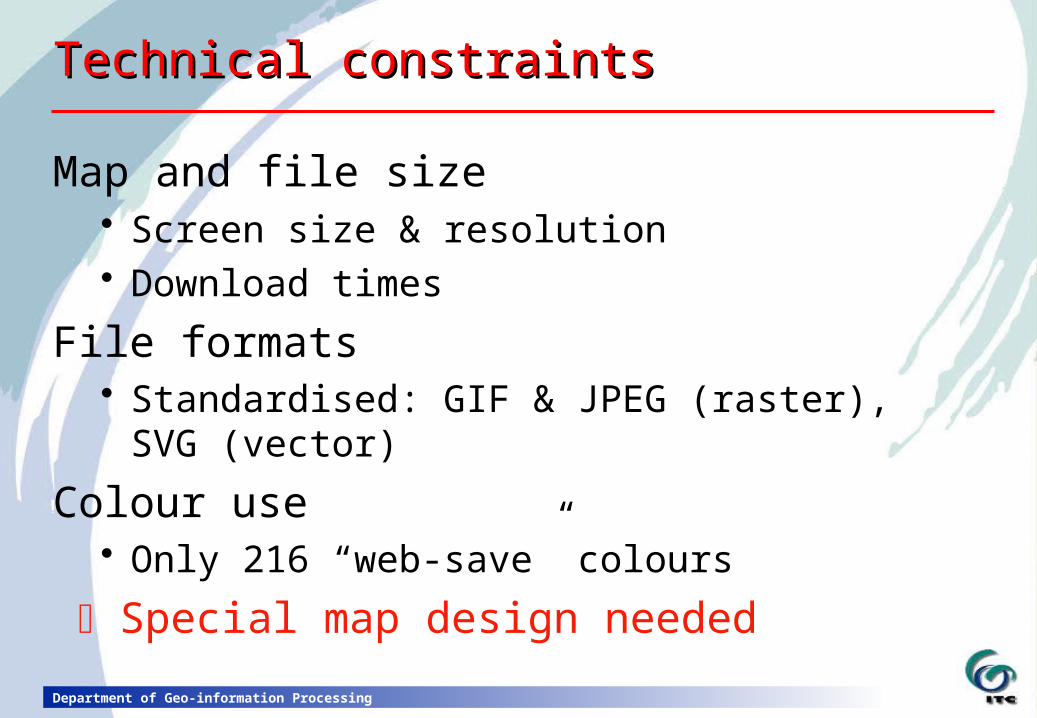
Technical constraintsTechnical constraints
Map and file size Screen size & resolution Download times
File formats Standardised: GIF & JPEG (raster), SVG (vector)
Colour use Only 216 “web-save” colours
Special map design needed
Department of Geo-information Processing
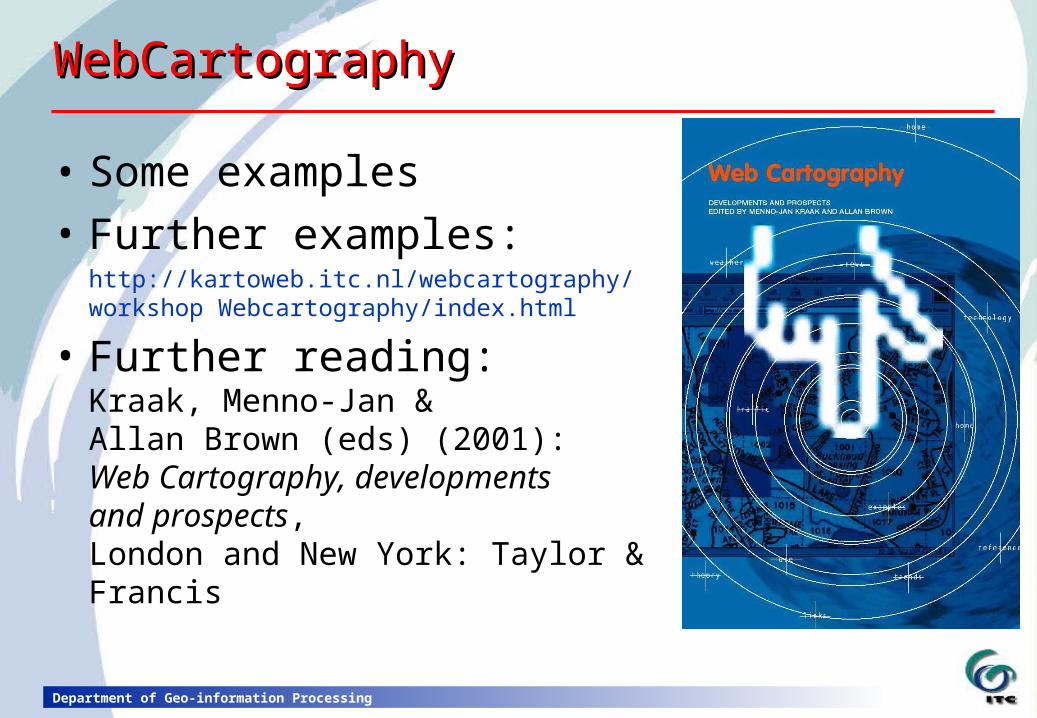
WebCartographyWebCartography
• Some examples
• Further examples:http://kartoweb.itc.nl/webcartography/workshop Webcartography/index.html
• Further reading: Kraak, Menno-Jan & Allan Brown (eds) (2001):Web Cartography, developmentsand prospects, London and New York: Taylor & Francis
Department of Geo-information Processing
WebCartographyWebCartography
Department of Geo-information Processing
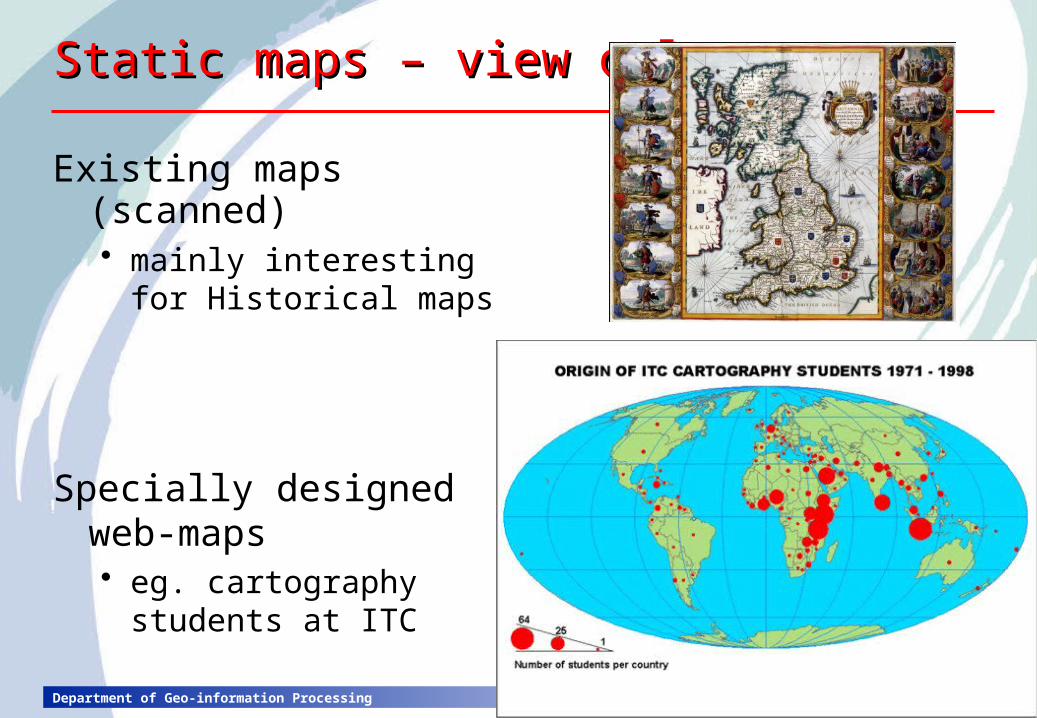
Static maps – view onlyStatic maps – view only
Existing maps (scanned) mainly interesting for
Historical maps
Specially designed web-maps eg. cartography students
at ITC
Department of Geo-information Processing
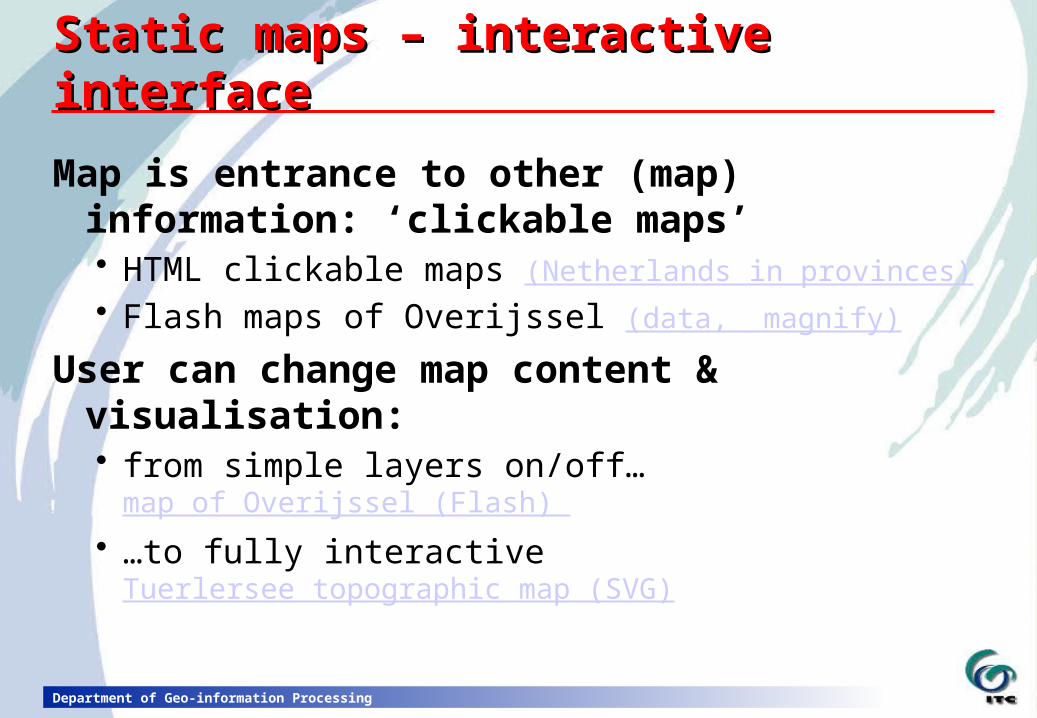
Static maps – interactive interfaceStatic maps – interactive interface
Map is entrance to other (map) information: ‘clickable maps’ HTML clickable maps (Netherlands in provinces)
Flash maps of Overijssel (data, magnify)
User can change map content & visualisation: from simple layers on/off… map of Overijssel (Flash)
…to fully interactive Tuerlersee topographic map (SVG)

Department of Geo-information Processing
WebCartographyWebCartography
Department of Geo-information Processing
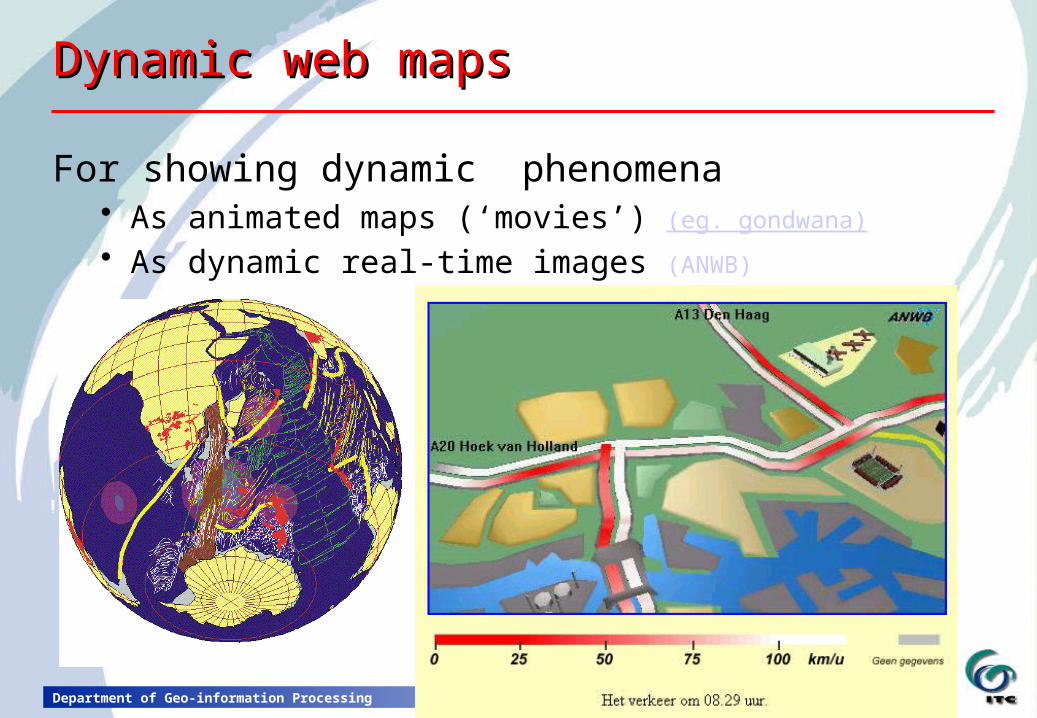
Dynamic web mapsDynamic web maps
For showing dynamic phenomena As animated maps (‘movies’) (eg. gondwana)
As dynamic real-time images (ANWB)
Department of Geo-information Processing
Dynamic web mapsDynamic web maps
For moving through Virtual Worlds As a view-only animation
(eg. animated GIF)
With an interactive interface (“movie”) (eg. quicktime)
With interactive contents (modelled) (eg. games, VRML)
Department of Geo-information Processing
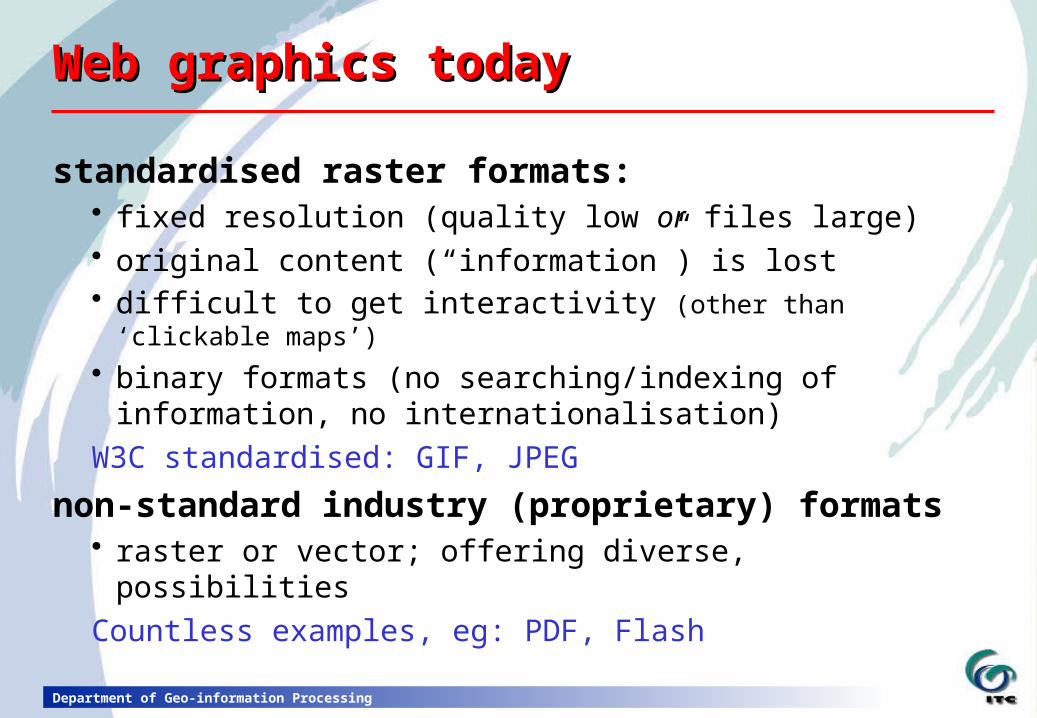
Web graphics todayWeb graphics today
standardised raster formats: fixed resolution (quality low or files large) original content (“information”) is lost difficult to get interactivity (other than ‘clickable maps’)
binary formats (no searching/indexing of information, no internationalisation)
W3C standardised: GIF, JPEG
non-standard industry (proprietary) formats raster or vector; offering diverse, possibilities
Countless examples, eg: PDF, Flash
Department of Geo-information Processing
Web graphics of the future:Web graphics of the future:
• vector graphics, resolution-independent
• "content" of information saved
• client-side ‘rendering’ -> customisable for viewing environment
• XML-based W3C’s designated backbone for the future Web
Department of Geo-information Processing
XML (eXtensible Markup Language)XML (eXtensible Markup Language)
not a fixed format, but a ‘metalanguage’ —a language for describing other languages—
lets you design your own customized markup languages for limitless different types of documents eg. Geographic Markup Language (GML) - OpenGIS
standard for geographical information written in SGML (the international standard metalanguage for text
markup systems; ISO 8879)
much more than a webpage language useable for storing and exchanging any kind of structured
data
Department of Geo-information Processing
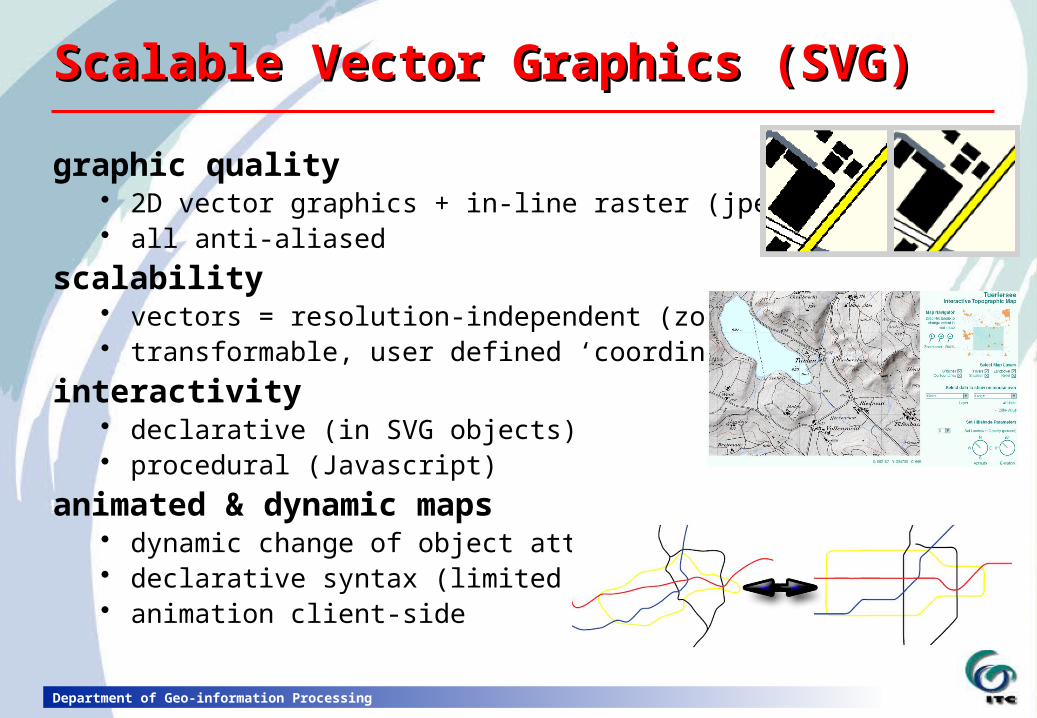
Scalable Vector Graphics (SVG)Scalable Vector Graphics (SVG)
graphic quality 2D vector graphics + in-line raster (jpeg, gif, png) all anti-aliased
scalability vectors = resolution-independent (zoom, pan) transformable, user defined ‘coordinate-spaces’
interactivity declarative (in SVG objects) procedural (Javascript)
animated & dynamic maps dynamic change of object attributes declarative syntax (limited file size) animation client-side
Department of Geo-information Processing
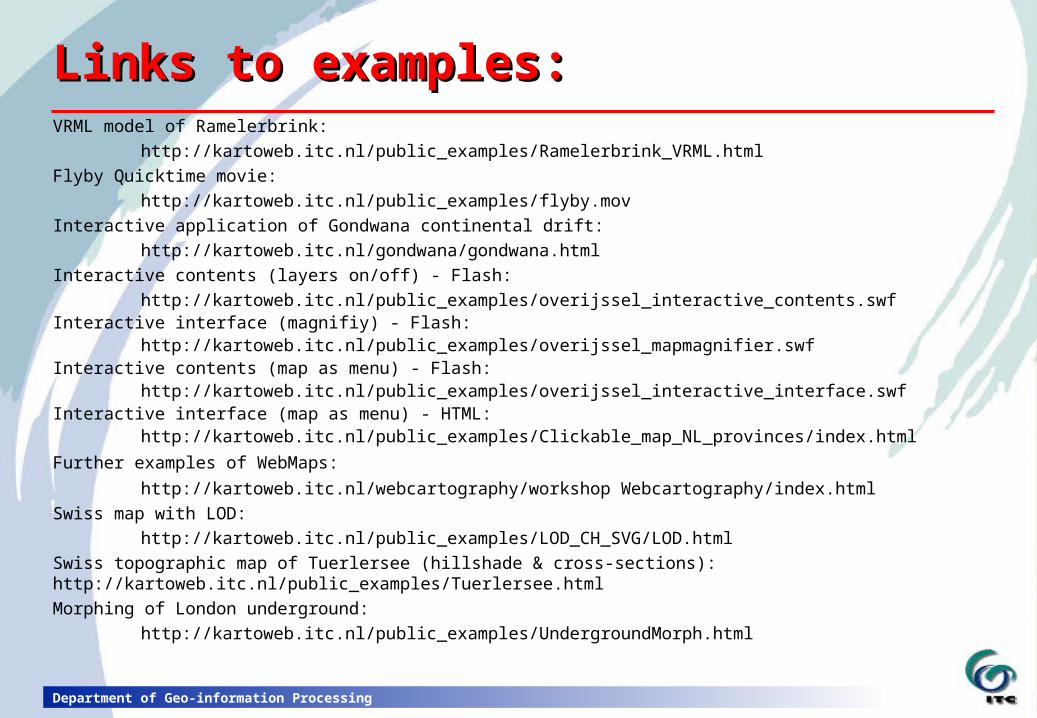
Links to examples:Links to examples:VRML model of Ramelerbrink:
http://kartoweb.itc.nl/public_examples/Ramelerbrink_VRML.html
Flyby Quicktime movie:
http://kartoweb.itc.nl/public_examples/flyby.mov
Interactive application of Gondwana continental drift:
http://kartoweb.itc.nl/gondwana/gondwana.html
Interactive contents (layers on/off) - Flash:
http://kartoweb.itc.nl/public_examples/overijssel_interactive_contents.swfInteractive interface (magnifiy) - Flash:
http://kartoweb.itc.nl/public_examples/overijssel_mapmagnifier.swfInteractive contents (map as menu) - Flash:
http://kartoweb.itc.nl/public_examples/overijssel_interactive_interface.swfInteractive interface (map as menu) - HTML:
http://kartoweb.itc.nl/public_examples/Clickable_map_NL_provinces/index.html
Further examples of WebMaps:
http://kartoweb.itc.nl/webcartography/workshop Webcartography/index.html
Swiss map with LOD:
http://kartoweb.itc.nl/public_examples/LOD_CH_SVG/LOD.html
Swiss topographic map of Tuerlersee (hillshade & cross-sections): http://kartoweb.itc.nl/public_examples/Tuerlersee.html
Morphing of London underground:
http://kartoweb.itc.nl/public_examples/UndergroundMorph.html