Embed Size (px)
Citation preview

Department of Education
STUDENT FINANCIAL ASSISTANCE
Fiscal Year 2015 Budget Request
CONTENTS
Page
Appropriations Language .................................................................................................. Q-1 Analysis of Language Provisions and Changes................................................................. Q-2 Appropriation, Adjustments and Transfers ........................................................................ Q-3 Summary of Changes ....................................................................................................... Q-4 Authorizing Legislation ...................................................................................................... Q-5 Appropriations History ....................................................................................................... Q-7 Significant Items in FY 2014 Appropriations Reports......................................................... Q-8 Summary of Request ........................................................................................................ Q-8 Activities:
Federal Pell grants ........................................................................................................ Q-12 Federal supplemental educational opportunity grants .................................................... Q-26 Federal work-study ........................................................................................................ Q-31 Federal Perkins loans .................................................................................................... Q-38 Iraq and Afghanistan service grants............................................................................... Q-46

Q-1
STUDENT FINANCIAL ASSISTANCE
Appropriations Language
For carrying out subparts 1, 3, and 10 of part A, and part C of title IV of the HEA,
$24,486,210,000, which shall remain available through September 30, 2016:1 Provided, That, of
amounts provided under this heading, $1,438,000,000 shall also be available for Pell Grants for
award year 2016-2017.2
The maximum Pell Grant for which a student shall be eligible during award year 2015-20163
shall be $4,860. (Department of Education Appropriations Act, 2014).
NOTE
Each language provision that is followed by a footnote reference is explained in the Analysis of Language Provisions and Changes document which follows the appropriation language.

Q-2
STUDENT FINANCIAL ASSISTANCE
Analysis of Language Provisions and Changes
Language Provision Explanation
1 … which shall remain available through September 30, 2016:
This language sets the availability of funds provided under the account through the end of fiscal year 2016.
2 Provided, That, of amounts provided under this heading, $1,438,000,000 shall also be available for Pell Grants for award year 2016-2017.
This language recognizes that the funds specified, appropriated in 2015, are available for award year 2016-2017.
3 The maximum Pell Grant for which a student shall be eligible during award year 2015-2016 shall be $4,860.
This language sets the maximum Pell Grant award for award year 2015-2016.
Q-3
STUDENT FINANCIAL ASSISTANCE
Appropriation, Adjustments and Transfers (dollars in thousands)
Appropriations/Adjustments/Transfers 2013 2014 2015
Discretionary: Appropriation..................................................... $24,535,281 $24,486,210 $24,486,210 Across-the-board reduction (P.L. 113-6) ........... -49,071 0 0 Sequester (P.L. 112-25) .................................... -86,088 0 0 Total, adjusted discretionary appropriation .... 24,400,122 24,486,210 24,486,210
Mandatory: Appropriation ..................................................... 12,441,415 6,167,285 6,397,355 Total, discretionary and mandatory appropriation .............................................. 36,841,537 30,653,495 30,883,565

Q-4
STUDENT FINANCIAL ASSISTANCE
Summary of Changes (dollars in thousands)
2014 ................................................................................. $30,653,495 2015 ................................................................................. 30,883,565
Net change ...................................... +230,070
Mandatory
Increases: 2014 base Change from base Program:
Increase in mandatory funding provided to support the Pell Grant program.
$6,167,000 +$230,000
Increase in mandatory funding to support Iraq and Afghanistan Service Grants.
285 +70
Net change +230,070

STUDENT FINANCIAL ASSISTANCE
Authorizing Legislation
(dollars in thousands)
Activity 2014 Authorized
2014 Estimate
2015 Authorized
2015 Request
Federal Pell grants (HEA-IV-A-1): Federal Pell grants (HEA-IV-A-1) (discretionary) Indefinite $22,778,352 Indefinite $22,778,352 Federal Pell grants (mandatory) Indefinite 5,579,000 Indefinite 6,397,000 Federal Pell grants (mandatory) 1 Indefinite 588,000 Indefinite 0 Federal supplemental educational opportunity grants (HEA-IV-A-3) Indefinite 733,130 Indefinite 733,130 Institutional payments (HEA-IV-G-489) 2 Indefinite Indefinite Federal work-study (HEA-IV-C) Indefinite 974,728 Indefinite 974,728 Institutional payments (HEA-IV-G-489) 2 Indefinite Indefinite Institutional payments for Job Location and Development centers (HEA-IV-C-446) 3 Indefinite
Indefinite
Work colleges (HEA-IV-C-448) Indefinite Indefinite Iraq and Afghanistan Service Grants (HEA-IV-A-1) Indefinite 285 Indefinite 355 Federal Perkins loans (HEA-IV-E) 4 Federal Perkins loans (Proposed legislation) 0 0 To be determined 0 Federal capital contributions Indefinite 0 Indefinite 0 Loan cancellations (HEA-IV-E) Indefinite 0 Indefinite 0 Institutional payments (HEA-IV-G-489) 2 Indefinite 0 Indefinite 0
Unfunded authorizations:
Academic achievement incentive scholarships (HEA-IV-A, Chapter 3) Indefinite 0 Indefinite 0
Total definite authorization 0 0
Q-5

STUDENT FINANCIAL ASSISTANCE
Authorizing Legislation -- continued (dollars in thousands)
Activity 2014 Authorized
2014 Estimate
2015 Authorized
2015 Request
Total discretionary appropriation $24,486,210 $24,486,210
Total mandatory appropriation 6,167,285 6,397,355
Total appropriation 30,653,495 30,883,565
Note: HEA refers to the Higher Education Act of 1965, as amended. 1 Mandatory funding provided for discretionary program costs. 2 Institutions are authorized to use up to 5 percent of the first $2,750 thousand of expenditures for the Supplemental Educational Opportunity Grant, Work-
Study, and Perkins Loan programs for administrative expenses; plus 4 percent of expenses in excess of this amount but less than $5,500 thousand; plus 3 percent of expenses above $5,500 thousand.
3 Institutions are authorized to use not more than 10 percent, or $50 thousand, of their Work-Study allocations for the cost of establishing or expanding programs to locate or develop jobs, including community service jobs, for currently enrolled students. The Federal share cannot exceed 90 percent.
4 Legislation is sought in 2015 to reform the Perkins Loans program. New loan subsidies would be appropriated through a new, separate Unsubsidized Perkins Loan program account. The current Perkins Loan program is authorized through September 30, 2014. If Congress doesn’t enact legislation extending or repealing the authorization of the program before that date, the program would be eligible for a 1-year extension, through September 30, 2015, under section 422(a) of the General Education Provisions Act (GEPA).
Q-6

Q-7
STUDENT FINANCIAL ASSISTANCE
Appropriations History (dollars in thousands)
Year
Budget Estimate to Congress
House Allowance
Senate Allowance Appropriation
2006 $19,771,798 $19,583,752 $19,403,795 $19,255,404 1
2007 14,490,057 N/A 2 N/A 2 14,487,735 2
2008 16,419,492 17,464,883 18,409,883 18,122,136 3
2009 19,921,551 21,291,136 4, 5 20,851,809 4, 5 21,246,973 4 Recovery Act Supplemental (P.L. 111-5)
0 17,600,000 13,930,000 17,314,000
2010 1,801,809 6 19,634,905 19,296,809 7 19,296,809
2011 1,737,957 6 18,475,492 8 24,899,957 7 24,670,517
2012 30,338,016 22,367,521 9 24,670,517 9 24,535,281
2013 24,685,281 24,535,281 10 24,535,281 10 24,400,122
2014 24,685,281 N/A11 24,536,210 7 24,486,210
2015 24,486,210 1 Includes a reapportionment of $28 million that expired at the end of fiscal year 2005. Pursuant to Section 2(c) of the National Disaster Student Aid Fairness Act (P.L. 109-86), these funds were made available for an additional fiscal year ending September 30, 2006. Reflects a rescission of $131,770 million (P.L. 109-149). Includes $4,300 million in mandatory funds to retire the projected funding shortfall.
2 This account operated under a full-year continuing resolution (P.L. 110-5). House and Senate Allowance amounts are shown as N/A (Not Available) because neither body passed a separate appropriations bill. 3 Includes $2.011 million in mandatory funding for Pell Grants pursuant to the College Cost Reduction and Access Act of 2007 (P.L. 109-084). 4 Includes $2.090 million in mandatory funding for Pell Grants pursuant to the College Cost Reduction and Access Act of 2007 (P.L. 109-084). 5 The levels for the House and Senate allowances reflect action on the regular annual 2009 appropriations bill, which proceeded in the 110th Congress only through the House Subcommittee and the Senate Committee. 6 Reflects Budget proposal to shift funding for Pell Grants and Perkins Loans to their own, separate accounts. 7 The level for the Senate allowance reflects Committee action only. 8 The level for the House allowance reflects the House-passed full-year continuing resolution. 9 The level for the House allowance reflects an introduced bill; the level for the Senate allowance reflects Senate Committee action only. 10 The level for the House and Senate allowances reflect action on the regular annual 2013 appropriations bill, which proceeded in the 112th Congress only through the House Subcommittee and the Senate Committee. 11 The House allowance is shown as N/A because there was no Subcommittee action.

Q-8
STUDENT FINANCIAL ASSISTANCE
Significant Items in FY 2014 Appropriations Reports Foster Youth and Financial Aid Senate: Report 113-71: The Committee directs the Secretary to submit a report no later
than 120 days after enactment of this act detailing its outreach efforts to foster youth who may be eligible for additional Federal financial aid programs and ways in which modifications to the Free Application for Federal Student Aid could assist in these efforts.
Response: The Secretary has shared with several members of Congress, in writing, the
details of the Department’s outreach efforts, and the Department’s expected inclusion of a question for students to self-identify as a foster youth on the
2015-2016 Free Application for Federal Student Aid. The Department has made, or has plans to make in the immediate future, outreach efforts directed to numerous audiences, including college financial aid administrators, students, mentoring organizations, staff from the TRIO and GEAR UP programs, and high school counselors and advisors.
Pell Grant Program Senate: Report 113-71: The Department is directed to submit a report to the House and
Senate Appropriations Committees, no later than 120 days after the enactment of this act, on enrollment and graduation information for Pell Grant recipients for the 2012-2013 Pell Grant Award Year. The Department is also directed to continue to provide enrollment and graduation information to the House and Senate Appropriations Committees in the future as more robust and useful information becomes available. Additionally, while understanding the limitation of the data as the Department will only be able to report on student enrollment and graduation information for the 2012-2013 Pell Grant Award Year, the report should include enrollment and graduation information for Pell Grant recipients included in the NSLDS Enrollment Reporting roster files by each institution of higher education. The report should also include a plan to minimize the burden of these recent changes on institutions of higher education, a proposal to improve the tracking of enrollment and graduation rates for students that transfer and nontraditional students, and strategies to increase enrollment rates and improve graduation rates for Pell Grant recipients.
Response: The Department plans on continuing its discussions with Congress to determine
the best method to deliver this data when it becomes available.

Q-9
Summary of R equest
DEPARTMENT OF EDUCATION FISCAL YEAR 2015 PRESIDENT'S BUDGET
Click here for accessible version
(in thousands of dollars) 2015Category 2013 2014 President's
Account, Program and Activity Code Appropriation Appropriation Budget Amount Percent
Student Financial Assistance
1. Federal Pell grants (HEA IV-A-1):(a) Discretionary Pell grants D 22,778,352 22,778,352 22,778,352 0 0.000%(b) Mandatory Pell grants M 4,854,184 5,579,000 6,397,000 818,000 14.662%(c) Mandatory Funding for Discretionary Program Costs M 7,587,000 588,000 0 (588,000) -100.000%
Subtotal, Federal Pell grants 35,219,536 28,945,352 29,175,352 230,000 0.795%Discretionary D 22,778,352 22,778,352 22,778,352 0 0.000%Mandatory M 12,441,184 6,167,000 6,397,000 230,000 3.730%
Federal Pell Grants Program Information (memorandum entry):Discretionary appropriation D 22,778,352 22,778,352 22,778,352 0 0.000%
Prior year surplus/(shortfall) D 7,085,937 10,241,289 6,184,641 (4,056,648) -39.611%Mandatory appropriation M 4,854,184 5,579,000 6,397,000 818,000 14.662%
Prior year surplus/(shortfall) M 668,816 0 0 0 ---SAFRA Funding M 7,587,000 588,000 0 (588,000) -100.000%
Total resources 42,974,289 39,186,641 35,359,993 (3,826,648) -9.765%
Discretionary program costs D 27,210,000 27,423,000 27,524,000 101,000 0.368%Mandatory program costs M 5,186,000 5,579,000 6,397,000 818,000 14.662%
Total, program costs 32,396,000 33,002,000 33,921,000 919,000 2.785%
Discretionary program current year surplus/(shortfall) D 10,241,289 6,184,641 1,438,993 (4,745,648) -76.733%Mandatory program current year surplus/(shortfall) M 337,000 0 0 0 ---
Total, surplus/(shortfall) 10,578,289 6,184,641 1,438,993 (4,745,648) -76.733%
Maximum award (in whole dollars)Base award $4,860 $4,860 $4,860 0 0.000%Mandatory add-on $785 $870 $970 100 11.494%
Total maximum award $5,645 $5,730 $5,830 100 1.745%
Recipients (in thousands) 8,861 8,711 8,854 143 1.642%
NOTES: D = discretionary program; M = mandatory program; FY= fiscal year
Detail may not add to totals due to rounding.
Compared to 2014 Appropriation2015 President's Budget

Q-10
DEPARTMENT OF EDUCATION FISCAL YEAR 2015 PRESIDENT'S BUDGET
(in thousands of dollars) 2015Category 2013 2014 President's
Account, Program and Activity Code Appropriation Appropriation Budget Amount Percent
Student Financial Assistance (continued)
2. Campus-based programs:(a) Federal supplemental educational opportunity grants (HEA IV-A-3) D 696,175 733,130 733,130 0 0.000%(b) Federal work-study (HEA IV-C) D 925,595 974,728 974,728 0 0.000%
Subtotal, Campus-based programs 1,621,770 1,707,858 1,707,858 0 0.000%
3. Iraq and Afghanistan Service Grants (P.L. 111-39) M 236 285 355 70 24.561%
Total 36,841,542 30,653,495 30,883,565 230,070 0.751%Discretionary D 24,400,122 24,486,210 24,486,210 0 0.000%Mandatory M 12,441,420 6,167,285 6,397,355 230,070 3.730%
Federal Perkins Loan Program
1. New loan subsidies (proposed legislation) M 0 0 0 0 ---2. New net loan subsidies (non-add) M 0 0 (827,674) (827,674) ---
Total, Federal Perkins loan program amount 0 0 0 0 ---
NOTES: D = discretionary program; M = mandatory program; FY= fiscal year
Detail may not add to totals due to rounding.
2015 President's Budget Compared to 2014 Appropriation

Q-11
STUDENT FINANCIAL ASSISTANCE
Summary of Request
The United States has long been a global leader in postsecondary education, but this advantage has slipped. While the U.S. ranks 5th in terms of the proportion of 25-64 year olds with a postsecondary education, it ranks 12th in attainment among those aged 25-34. There is an opportunity gap as well. Today, high-school graduates from the wealthiest families are virtually certain to pursue higher education, while just over half of the bottom quartile attend. Even when high-school graduates can afford to begin higher education, they all too often fail to complete postsecondary education. Only about 6 in 10 college students at 4-year schools graduate within 6 years.
The President’s fiscal year 2015 Budget focuses on college affordability and completion, in accordance with the President’s vision of leading the world in college attainment by 2020. The Budget outlines a path for reforming campus-based aid programs by distributing Federal funds to colleges that provide the best value to students – not only by enrolling financially-needy students, but ensuring they persist to completion and at a reasonable cost.
The total fiscal year 2015 Budget proposed for the Student Financial Assistance (SFA) account is $30.9 billion, $230 million higher than the fiscal year 2014 level. The budget request includes a discretionary request of $24.5 billion: $22.8 billion for Pell grants, with the remainder of the request for Supplemental Educational Opportunity Grants and Work-Study. $6.4 billion in mandatory funds are presented in the 2015 Budget for the Pell Grant program, as well as $355,000 in mandatory funding for grants under the Iraq and Afghanistan Service Grants program.
The 2015 Budget provides access to additional campus-based funds through an expanded Federal Perkins Loan program. This expansion and reform of the current program means more students will be able to receive Perkins Loans, as the program will expand to serve a greater number of institutions (up to 2,700 more than the existing program). The expanded program also will provide additional funds at eight and a half times the current volume.
Funds requested for all programs in the Student Financial Assistance account would provide almost $37.0 billion in aid to help students pursue a postsecondary education. (Total aid available is based on new budget authority and any required matching funds, less allowable administrative costs.) Taken together, these programs would provide student aid awards to nearly 11.7 million students. In addition, the request would provide $4.1 billion in aid in 2015 to an estimated 766,000 students through an expanded Perkins loan program.
The fiscal year 2015 budget request for programs in the Student Financial Assistance account is best understood in the context of the Administration’s proposals for the student aid programs as a whole. Accordingly, program-specific funding information and policy proposals, as well as program performance information that applies to all student assistance programs, are discussed in the Student Aid Overview, beginning on page P-1.

Q-12
STUDENT FINANCIAL ASSISTANCE
Federal Pell grants (Higher Education Act of 1965, Title IV, Part A, Subpart 1)
(dollars in thousands)
FY 2015 Authorization: Indefinite
Budget Authority:1
Pell program funding source 2014 2015 Change
Program funds: Discretionary appropriation $22,778,352 $22,778,352 0 Mandatory appropriation 5,579,000 6,397,000 +$818,000 Mandatory funding for discretionary program costs 588,000 0 -588,000
Subtotal, current year funding 28,945,352 29,175,352 -230,000
Pell Grant program costs 33,002,000 33,921,000 +919,000 1 Table reflects discretionary budget appropriations and mandatory budget authority in support of program costs for each fiscal year.
PROGRAM DESCRIPTION
The Federal Pell Grant program helps ensure access to postsecondary education for low- and moderate-income undergraduate students by providing grants that help meet postsecondary education costs. The program also promotes lifelong learning by providing resources for low-income adults now in the workplace to return to school to upgrade their skills.
The Department provides funds to participating institutions to pay all students at the institution who are eligible for a Pell Grant – a student’s eligibility is not dependent on the availability of funds awarded to the institution as in the Campus-Based Programs: Supplemental Education Opportunity Grants, Work-Study, and Perkins Loans.
A Pell Grant is generally considered to be the foundation of a student’s financial aid package, to which other forms of aid are added. The amount of a student’s Pell Grant is dependent on the student’s “expected family contribution” (EFC), cost of education, whether the student attends school full-time or part-time, and whether the students’ program is a full academic year in length or less. Pell Grant disbursements are made to students at least once every term during the award year or at the beginning and mid-point for programs without terms.
Budget authority in the Pell Grant program is available for 2 fiscal years; for example, funds become available for obligation on October 1 of the fiscal year in which they are appropriated and remain available through September 30 of the following fiscal year. Funds proposed for

Q-13
STUDENT FINANCIAL ASSISTANCE
Federal Pell grants
fiscal year 2015 would be used for grants in the 2015-2016 award year, which runs from July 1, 2015, through June 30, 2016. If Pell Grant costs for a given academic year exceed the corresponding appropriation, the Department uses the next fiscal year’s appropriation to cover the full cost.
Recent and projected funding: The Pell Grant program is the single largest source of grant aid for postsecondary education – the centerpiece of President Obama’s strategy to ensure that students can afford to seek higher education and successfully complete a postsecondary credential. Thanks to the landmark investments in Pell Grants since the beginning of the Administration, in 2014 nearly 8.7 million students will receive Pell Grants worth up to $5,730. The program operates as an entitlement to eligible students once the maximum grant, award rules, and payment schedule are established. The Higher Education Act does not provide for the denial of an award to any student who meets the qualifying conditions, nor does it allow the Secretary to reduce any student’s award level.
As of July 1, 2012, several statutory changes to the Pell Grant program went into effect, including:
• Changing the EFC determination by decreasing the income threshold at which students receive an automatic zero EFC from $32,000 to $23,000;
• Restricting Pell eligibility to individuals who have a high school diploma, GED, or are home schooled, and denying eligibility to those students who previously would have qualified by passing an Ability to Benefit test (students enrolled prior to July 1, 2012 are grandfathered in);
• Reducing the maximum duration for which students are eligible for Pell Grants from 18 full-time semesters, or its equivalent, to 12 semesters, or its equivalent; and,
• Requiring students be eligible for 10 percent of the maximum grant (up from 5 percent) to earn the minimum award.
Mandatory funding: The College Cost Reduction and Access Act (CCRAA) authorized mandatory funding to support increases to the Pell maximum award set in each fiscal year’s appropriations act. The Health Care and Education Reconciliation Act (HCERA) amended that provision and increased the maximum award by $690 for award years 2010-2011 through 2012-2013, and by the Consumer Price Index (CPI) from 2013 to 2017. The maximum Pell Grant is expected to increase from the 2014-2015 award year level of $5,730 to $5,830 for the 2015-2016 award year, as a result of the CPI provision.
Pell Grant program scoring rule: The congressional budget resolution for fiscal year 2006 included a rule under which appropriations bills for the Pell Grant program are scored by the Congressional Budget Office for the estimated cost of the program for that year, regardless of the amount actually appropriated. In years where the appropriation exceeds the program cost as estimated at the beginning of the subsequent fiscal year, any surplus is available to reduce the appropriation needed to support that subsequent year’s program costs. Conversely, in

Q-14
STUDENT FINANCIAL ASSISTANCE
Federal Pell grants
years where the appropriation is lower than the updated estimated program cost, the difference is automatically scored against the subsequent year’s appropriation.
Given the nature of the program, it is reasonable to consider Pell Grants an individual entitlement for purposes of budget analysis and enforcement. Congress has chosen to continue treating the portion funded in annual appropriations acts as discretionary, continuing the scoring of budget authority for Pell Grants against the appropriations allocations established annually under §302 of the Congressional Budget Act. Like the 2014 Budget, this Budget maintains this treatment.
Need analysis formula: The need analysis formula for the Title IV need-based student aid programs, stipulated in the Higher Education Act, determines financial eligibility for Pell Grants and is applied uniformly to all applicants. This formula determines a student’s EFC. The fundamental elements in the formula are the student’s (and in the case of dependent students, their parents’) income and assets (excluding the value of the family’s home or farm), the family’s household size, and the number of family members (excluding the student’s parents) attending postsecondary institutions. The EFC is the sum of (1) a percentage of net income (remaining income after subtracting allowances for taxes and basic living expenses), and (2) a percentage of net assets (assets remaining after subtracting an asset protection allowance). Different assessment rates and allowances are used for dependent students, independent students, and independent students with dependents. The CCRAA made a number of changes to the need analysis rules that have the effect of broadening program eligibility and increasing program cost.
Institutional participation: Approximately 5,400 postsecondary institutions currently participate in the Pell Grant program. Institutions that lose their eligibility to participate in the loan programs due to high default rates are also precluded from participation in the Pell Grant program.
Student participation: Students may use their grants at any participating postsecondary institution. Pell Grants are disbursed to the student through the institution. The Pell Grant program is the largest source of grant aid to students under the Higher Education Act, with approximately 41 percent of all undergraduates receiving a Pell Grant.
Recipients must be undergraduates and cannot have received a bachelor’s degree previously (with the exception of certain teacher certificate programs), and must be enrolled with the purpose of obtaining a degree or certificate at an eligible institution. Students must also have a high school diploma (or its equivalent). Less than full-time students are eligible for pro rata awards based on their enrollment status. As of July 1, 2012, students are only eligible for Pell Grants for 12 semesters of full-time enrollment.
A student in default on a loan made under any Title IV HEA loan program, or who owes an overpayment on any other previously received Federal student aid, may not receive additional funds under the program unless he or she repays the debt in full, or makes satisfactory repayment arrangements with the holder of the debt.

Q-15
STUDENT FINANCIAL ASSISTANCE
Federal Pell grants
Annual award amount: The annual award amount may vary from the statutory minimum payment up to the maximum authorized by statute for the academic year. The Higher Education Opportunity Act of 2008 (HEOA) enacted a minimum payment of 10 percent of the appropriated maximum award. For example, in award year (AY) 2013-2014, the minimum is $565. Students who do not qualify for the 10 percent minimum grant do not receive a Pell award. Appropriations acts set annual maximum award levels. The fiscal year 2014 appropriation act set the maximum award supported by discretionary funds for the 2014-2015 award year at $4,860. With the CPI provision established by the HCERA, the 2014 maximum award rose to $5,645. The total maximum Pell Grant award will be $5,730 for the 2014-2015 award year as a result of the CPI provision, and the total 2015-2016 maximum award is projected to be $5,830.
The aggregate Pell Grant award is the lessor of:
• The maximum award (as set in annual appropriations acts) plus the additional amount provided by mandatory funds, minus the EFC, or
• The student’s cost of attendance minus the EFC.
Cost of attendance: For purposes of determining the Pell Grant award, the postsecondary institution establishes the cost of attendance, using the following cost items:
• Tuition and fees;
• An allowance for books, supplies, transportation, dependent care, and miscellaneous expenses, including a reasonable allowance for the documented rental or purchase of a personal computer;
• Living allowances of:
• the actual amount charged by the institution for room and board for students living at school,
• an amount determined by the institution for students without dependents living at home with parents, and
• for all other students, an amount based on the expenses reasonably incurred for room and board.
The cost of attendance for less-than-half-time students includes: tuition and fees; an allowance for books, supplies and transportation; and dependent care.
Financial aid administrator discretion: The Higher Education Act stipulates financial aid administrators may, on the basis of adequate documentation and on a case-by-case basis, adjust a student’s Pell Grant award by changing the cost of attendance or the value of data elements used to calculate the EFC to reflect “special circumstances,” such as the following:

Q-16
STUDENT FINANCIAL ASSISTANCE
Federal Pell grants
• Tuition expenses at an elementary or secondary school;
• Medical or dental expenses not covered by insurance;
• Unusually high child care costs;
• Recent unemployment of an independent student or a family member;
• Changes in a student’s housing status resulting in homelessness;
• The number of parents enrolled at least half-time in a degree or certificate or other program leading to a recognized educational credential at an institution participating in any of the Title IV programs; or
• Other changes in a family’s income, assets, or a student’s status.
Institutional payments: The HEA provides for payment to institutions of $5 per Pell Grant recipient to reimburse institutions for a share of the cost of administering the Pell Grant program. Funds for these payments are paid from the Pell Grant appropriation. In 2014-2015, these payments will total $44 million.
Because of the structure of the Pell Grant program, annual funding levels might not equal annual expenditures. Funding levels for the past 5 fiscal years were:
(dollars in thousands) 2010 ........................................ $22,794,816 1
2011 ........................................ 42,015,996 2
2012 ........................................ 41,569,000 3
2013 ........................................ 35,219,536 4 2014 ........................................ 28,945,352 5
1 Includes $5,300 million in mandatory funds to increase maximum award by $690. 2 Includes $5,560 million in mandatory funds to increase maximum award by $690 and $13,500 million in HCERA
funds. 3 Includes $4,950 million in mandatory funds to increase maximum award by $690 and $13,795 million in
additional mandatory funds provided in legislation to reduce discretionary need. 4 Includes $4,854 million in mandatory funds to increase maximum award by $785 and $7,587 million in
additional mandatory funds provided in legislation to reduce discretionary need. 5 Includes $5,579 million in mandatory funds to increase maximum award by $870 and $588 million in additional
mandatory funds provided in legislation to reduce discretionary need.

Q-17
STUDENT FINANCIAL ASSISTANCE
Federal Pell grants
FY 2015 BUDGET REQUEST
Since taking office, this Administration has repeatedly fought for higher Pell Grant funding, and its efforts have increased the Pell maximum award, and provided grants to an additional 3 million students. In its continued support of the program, the Administration requests $22.8 billion in discretionary funding, the same level as 2014. This discretionary request, plus $6.4 billion in mandatory funding, establishes the total 2015 Pell funding level at $29.2 billion. The mandatory request supports an increase in the add-on to the base maximum award of $4,860, raising the discretionary plus mandatory maximum award to a new high of $5,830.
The 2015 Budget proposes to make two small, but important, reforms to the Pell Grant program. The first reform strengthens academic progress requirements in the Pell Grant program, to encourage students to complete their studies on time. Second, it would reinstate the Ability to Benefit provision for students enrolled in eligible career pathways programs, enabling adults without a high school diploma to gain the knowledge and skills they need to secure a good job. In addition, the GPRA Data/HEA Program Evaluation request would support pilot and demonstration programs and evaluations of alternative strategies relating to programs under the HEA, including the Pell Grant program, in ways that promote student persistence and academic success and could accelerate progress toward an affordable high-quality postsecondary degree or certificate.
In addition, the 2015 Budget proposes to reform and expand the existing Perkins Loan program, which is described in greater detail later in this document, and the Student Aid Overview, beginning on page P-1. Savings resulting from this reform will be redirected to the Pell Grant program, which, when added to surplus Pell Grant discretionary budget authority from the prior year, are sufficient to fund the program through the 2016-2017 award year, averting an otherwise $3.5 billion shortfall. The Administration believes preemptory action must be taken to keep the Pell Grant program on a sound footing, and that reforms such as those included in the Budget are necessary to maintain this critical investment in opening the doors of opportunity to all Americans and strengthening our Nation’s competitiveness.
The fiscal year 2015 Budget request for this program is best understood in the context of the Administration’s proposals for the student aid programs as a whole. Accordingly, program specific funding information and policy proposals are discussed in the Student Aid Overview.
PELL GRANT PROGRAM HISTORICAL DATA
Applicant and Recipient Growth:
The graphs on the following pages show applicant, recipient, and aid available trends since the inception of the Pell Grant program. Applicants are estimated at 17.9 million for award year 2013-2014; recipients at 8.9 million.
Many factors affect applicant growth, including demographic trends and changes in economic conditions, such as labor market demands. Factors affecting recipient growth include family incomes, need analysis, college costs, the level of the maximum Pell Grant award, and changes in applicant levels.

Q-18
STUDENT FINANCIAL ASSISTANCE
Federal Pell grants
The following tables show program information consistent with actual, predicted, or requested funding levels.
Federal Pell Grants Applicant Trends
Award Year Valid Applicants
Applicant Growth: Number
Applicant Growth:
Percent Change 2001-02 9,505,099 759,515 8.68% 2002-03 10,354,525 849,426 8.94% 2003-04 11,093,506 738,981 7.14% 2004-05 11,539,497 445,991 4.02% 2005-06 11,611,388 71,891 0.62% 2006-07 11,811,911 200,523 1.73% 2007-08 12,299,232 487,321 4.13% 2008-09 13,883,288 1,584,056 12.88% 2009-10 16,482,495 2,599,207 18.72% 2010-11 17,625,778 1,143,283 6.94% 2011-12 18,458,701 832,923 4.73% 2012-13 18,294,947 -163,754 -0.89% 2013-14 17,919,903 -375,044 -2.05% 2014-15 17,562,308 -357,595 -2.00% 2015-16 17,910,627 348,319 1.98%
Sources: Through 2012-13, Award Year 2011-12 Pell Grant EOY Report and Final ELI-10 Reports. Notes: Award Years 2013-14 through 2015-16 are estimates. A valid applicant is an undergraduate student who submits an application with sufficient data to calculate an EFC and determine Pell Grant eligibility.

Q-19
STUDENT FINANCIAL ASSISTANCE
Federal Pell grants
Pell Historical Data (continued):
1 Applicants reflect those applying for all Federal student financial assistance, including those receiving only non-need based student loans.
Number of Recipients:
Under current estimates, the 2015 level would support Pell Grant awards to 8.9 million recipients.
*
Applicants1
Recipients

Q-20
STUDENT FINANCIAL ASSISTANCE
Federal Pell grants
Pell Historical Data (continued):
Aid Available:
Under current estimates, the Department’s fiscal year 2015 proposal would provide $33.9 billion in Pell Grants to students.
Maximum award:
The Department proposes to maintain the base maximum award at $4,860 for award year 2015-2016 through discretionary and mandatory funding. The cost of providing the mandatory add-on that increases the maximum award to $5,730 in the 2014-2015 award year (and in award year 2015-2016, a $5,830 maximum award) are funded by permanent mandatory indefinite funding as provided through HCERA.
Award Year
Maximum Award
Aid Available (dollars in millions) Recipients
2010-11 $5,550 $35,658 9,303,991 2011-12 5,550 33,562 9,439,578 2012-13 5,550 32,048 8,956,000 2013-14 5,645 32,352 8,861,000 2014-15 5,730 32,958 8,711,000 2015-16 5,830 33,877 8,854,000
$ in Billions

Q-21
STUDENT FINANCIAL ASSISTANCE
Federal Pell grants
Pell Historical Data (continued):
Pell Maximum Award, Budget Authority and Program Costs
Fiscal Year
Maximum Award
Budget Authority (dollars in thousands)
Program Costs (dollars in thousands)
2006 $4,050 $17,345,230 $12,825,000 2007 4,310 13,660,711 14,699,000 2008 4,731 16,245,000 1 18,310,000 2009 5,350 35,661,000 2 29,996,000 2010 5,550 22,794,816 3 35,705,000 2011 2012
5,550 5,550
42,015,996 4 41,569,000 6
33,609,000 5 32,093,000 5
2013 5,645 35,219,536 7 33,396,000 5 2014 5,730 28,945,352 8 33,002,000 5 2015 5,830 29,175,352 9 33,921,000 5
1 Budget Authority for FY 2008 includes $14,215 million in discretionary funds and $2,030 million in mandatory
funds provided by the College Cost Reduction and Access Act (CCRAA) for use as an add-on to the maximum award.
2 Budget Authority for FY 2009 includes $15,640 million in American Recovery and Reinvestment Act of 2009 (ARRA) funds, and $2,733 million in mandatory funds for use as an add-on to the maximum Pell Grant award.
3 Budget Authority for FY 2010 includes $17,495 million in discretionary funds and $5,300 million in mandatory funds to increase the maximum grant.
4 Budget Authority for FY 2011 includes $23,162 million in discretionary funds, $13,500 million in mandatory funds for discretionary program costs, and $5,560 million in mandatory funds to increase the maximum grant.
5 Estimate. 6 Budget Authority for FY 2012 includes $22,824 million in discretionary funds, $4,950 million in mandatory
funding to increase the maximum grant, and $13,795 million in mandatory funds to reduce discretionary need as provided in the Budget Control Act of 2011.
7 Budget Authority requested for FY 2013 includes $22,778 million in discretionary funding, $4,854 million in mandatory funding to increase the maximum grant, and $7,587 million in mandatory funds for discretionary purposes.
8 Budget Authority requested for FY 2014 includes $22,778 million in discretionary funding, $5,579 million in mandatory funding to increase the maximum grant, and $588 million in mandatory funds for discretionary purposes.
9 Budget Authority requested for FY 2015 includes $22,778 million in discretionary funding, and $6,397 million in mandatory funding to increase the maximum grant.

Q-22
STUDENT FINANCIAL ASSISTANCE
Federal Pell grants
Distribution of Pell Grants by Student Status and Income Level:
The tables below illustrate the distribution of Pell Grant funds to dependent and independent students at various income levels. In 2012-13, approximately 74 percent of all Pell Grant recipients (including independent students) had incomes less than or equal to $30,000.
Distribution of Pell Grants in Academic Year 2012-2013
Income Level Recipients Available Aid Average Award
Dependent: 0 - $ 6,000 548,843 $2,339,067,217 $4,262
$6,001 - $ 9,000 133,810 584,670,729 4,369 $9,001 - $20,000 834,913 3,681,510,454 4,409 $20,001 - $30,000 748,216 3,212,352,346 4,293 $30,001 + 1,467,945 4,232,931,036 2,884 Subtotal -
3,733,727 14,050,531,782 3,763 Dependent Subtotal Independent 5,222,343 17,997,649,008 3,446
TOTAL 8,956,070 32,048,180,790 3,578
Independent students make up more than half of the students receiving assistance under the Pell Grant program. These recipients tend to be in the lowest income groups, as shown below.
Distribution of Pell Grants to Independent Undergraduates in Academic Year 2012-2013
Income Level Recipients Available Aid Average Award
0 - $ 1,000 982,266 $3,665,817,686 $3,732 $1,001 - $ 3,000 265,614 1,008,212,560 3,796 $3,001 - $ 6,000 386,255 1,477,424,278 3,825 $6,001 - $ 9,000 423,373 1,598,178,998 3,775 $9,001 - $15,000 916,052 3,265,560,115 3,565 $15,001 - $20,000 643,821 1,962,555,939 3,048 $20,001 - $30,000 702,370 2,305,765,672 3,283 $30,001 + 902,592 2,714,133,760 3,007 TOTAL 5,222,343 17,997,649,008 3,446

Q-23
STUDENT FINANCIAL ASSISTANCE
Federal Pell grants
Distribution of Pell Grants by Type of Institution:
The table below shows the distribution of Pell Grants to students attending different types of institutions. In 2012-2013, approximately 30 percent of the total aid available for Pell Grants went to students attending Public 4-Year schools, and approximately 35 percent went to students attending Public 2-Year schools.
Over the last 15 years, the grant distribution has changed most noticeably with proprietary schools. In the 1997-1998 award year, approximately 13 percent of total Pell Grant aid available went to students at proprietary institutions; in the 2012-2013 award year that figure was 21 percent.
Distribution of Pell Grants by Type of Institution in Academic Year 2012-2013
Institution Type
Percent of Pell Aid Available Aid
Recipients Average Award
Public 4-Year 30.2% $9,680,359,789 2,658,048 $3,642 Public 2-Year 35.0% 11,220,112,906 3,271,627 3.430 Private 13.7% 4,380,773,905 1,136,302 3,855 Proprietary 21.1% 6,766,934,190 1,890,093 3,580
TOTAL 100.0% 32,048,180,790 8,956,070 3,578

Q-24
STUDENT FINANCIAL ASSISTANCE
Federal Pell grants
The following two charts show, for the years 2000-2012, total Pell recipients (in thousands) by type and control of institution; and the institutional share (percentage) of total Pell recipients.
Thousands
Q-25
STUDENT FINANCIAL ASSISTANCE
Federal Pell grants
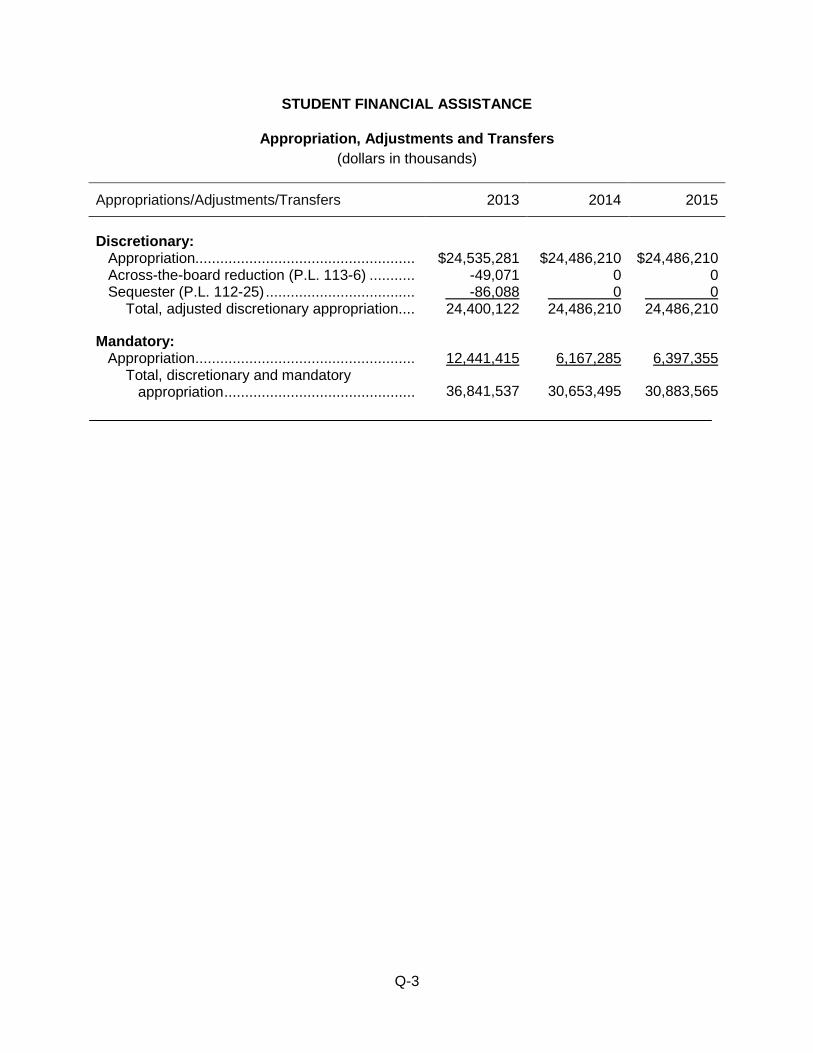
PROGRAM OUTPUT MEASURES (dollars in thousands)
Measures Program output measures 2013 2014 2015
Recipients 8,861,000 8,711,000 8,854,000
Aid available to students 1 $32,351,695 $32,958,445 $33,876,730
Maximum grant (in whole dollars) $5,645 $5,730 $5,830 Minimum grant (in whole dollars) $565 $573 $583 Average grant (in whole dollars) $3,651 $3,784 $3,826
1 Overall aid available reflects the estimated cost of the program minus administrative costs of $5 per recipient.
PROGRAM PERFORMANCE INFORMATION
This section presents selected program performance information, including, for example, GPRA goals, objectives, indicators and performance data and targets; and an assessment of the progress made toward achieving program results. Achievement of program results is based on the cumulative effect of the resources provided in previous years and those requested in fiscal year 2015 and future years, as well as the resources and efforts invested by those served by this program.
Because the Federal Pell Grant program account relies on the same performance measures, strategies and program improvement activities that apply to all the student financial assistance grant programs, Pell program performance is discussed in the Student Aid Overview and is not repeated here.

Q-26
STUDENT FINANCIAL ASSISTANCE
Federal supplemental educational opportunity grants (Higher Education Act of 1965, Title IV, Part A, Subpart 3)
(dollars in thousands)
FY 2015 Authorization: Indefinite
Budget Authority:
SEOG budget authority 2014 2015 Change
$733,130 $733,130 0
PROGRAM DESCRIPTION
The Federal Supplemental Educational Opportunity Grant (SEOG) program provides need-based grant aid to eligible undergraduate students to help reduce financial barriers to postsecondary education. Federal funding allocations for this purpose are awarded to qualifying postsecondary institutions under a statutory formula. Unlike the Pell Grant program, the SEOG program is administered by institutional financial aid administrators who have substantial flexibility in determining student awards.
The funding provided for the SEOG program is available for 2 years. Funds become available for obligation on October 1 of the fiscal year in which they are appropriated and remain available through September 30 of the following fiscal year. Funds proposed for fiscal year 2015 would be used for the 2015-2016 award year, which runs from July 1, 2015, through June 30, 2016.
Institutional participation: Roughly 3,800 postsecondary institutions receive funds under the SEOG program. As mandated by statute, funds are distributed to institutions first on the basis of the institution's fiscal year 1999 SEOG program base guarantee and pro rata share (a hold harmless basis), and then on the basis of the aggregate need of the eligible undergraduate students in attendance. The current hold harmless provision distorts the allocation of funding among institutions so that institutions receive more funds than if the funds were solely distributed to institutions based on student financial need.
Institutional matching: Participating institutions are required by statute to contribute at least 25 percent of the SEOG award amounts. In other words, the institution provides one dollar for every three Federal dollars. The institutional share can be met using the institution's own resources, State grants, or funds from foundations or other charitable organizations.
Student participation: Students qualify for grants of up to $4,000 by demonstrating financial need under a statutory need analysis system. By statute, institutions must give first priority for awards to students with demonstrated “exceptional need” (students with the lowest EFCs at the institution) who are also Pell Grant recipients. Remaining awards are then available for students with exceptional need who are not Pell Grant recipients. Approximately 9 percent of undergraduates receive SEOG awards.

Q-27
STUDENT FINANCIAL ASSISTANCE
Federal supplemental educational opportunity grants
In addition, if any part of the institution’s SEOG allocation determination to students is based in part on the financial need demonstrated by students who are independent students or attending the institution less-than-full-time, then a reasonable portion of the allocation must be made available to such students.
Recipients must be undergraduates and cannot have received a bachelor’s degree and must be enrolled with the purpose of obtaining a degree or certificate at an eligible institution. Students must also have: (1) a high school diploma (or its equivalent), or, (2) for students enrolled prior to July 1, 2012, a demonstrated ability to benefit from the training offered by the institution (as shown by a passing score on a test approved by the Department), or, (3) have successfully completed six credits. A student already in default on a loan made under any Title IV, HEA loan program, however, or who owes an overpayment on any other previously received Federal student aid, may not receive additional funds under the program unless he or she repays the debt in full, or makes satisfactory repayment arrangements with the holder of the debt.
Institutional administrative provisions:
• Administrative costs. Each institution’s administrative cost allowance is based upon its expenditures for all three campus-based programs, excluding the amount of Perkins loans assigned to the Department. Under a statutory formula, an institution may use up to 5 percent of the first $2.75 million of its program expenditures; plus up to 4 percent of expenditures greater than $2.75 million but less than $5.5 million; and up to 3 percent of expenditures greater than $5.5 million during an award year to meet administrative costs associated with the SEOG, Work-Study, and Perkins loan programs.
• Transferability of funds. An institution may transfer up to 25 percent of its allotment from Perkins loans Federal capital contributions to SEOG or Work-Study (or both) and up to 25 percent of Work-Study to SEOG. Up to 10 percent of an institution’s SEOG funds may, at the discretion of the institution, be used for expenditures for the preceding fiscal year, and up to 10 percent of an institution’s SEOG funds may remain available for the next fiscal year.
• Reallocation of funds. Excess funds available because of under-utilization by institutions are reallocated to other institutions in accordance with program regulations. An institution returning more than 10 percent of its allocation will have its subsequent allocation reduced by the same amount.
Funding levels for the past 5 fiscal years were: (dollars in thousands)
2010 ........................................ $757,465 2011 ........................................ 735,990 2012 ........................................ 734,599 2013 ........................................ 696,175 2014 ........................................ 733,130

Q-28
STUDENT FINANCIAL ASSISTANCE
Federal supplemental educational opportunity grants
FY 2015 BUDGET REQUEST
The Administration requests $733.1 million for the SEOG program in fiscal year 2015, the same level as in fiscal year 2014. The 2015 Budget additionally proposes to alter the allocation formula to target those institutions that enroll and graduate higher numbers of Pell-eligible students, offer affordable education, and offer quality education and training such that graduates obtain employment and repay their educational debt. Allocations to participating institutions that fail to maintain these commitments would be redirected to better-performing institutions.
The fiscal year 2015 budget request for this program is best understood in the context of the Administration’s proposals for the student aid programs as a whole. Accordingly, student assistance policy proposals are discussed in greater detail in the Student Aid Overview, beginning on page P-1.
The fiscal year 2015 request, in conjunction with institutional matching funds, would generate $975 million in available aid for an estimated 1.6 million awards.
PROGRAM OUTPUT MEASURES (dollars in thousands)
Measures Program output measures 2013 2014 2015
Recipients 1,545,035 1,627,050 1,627,050 Aid available to students 1 $926,107 $975,268 $975,268 Average award (whole dollars) $599 $599 $599 1 Aid available includes budget authority, institutional matching funds, transfers from Perkins Loans and Federal Work-Study, minus administrative costs.
PROGRAM PERFORMANCE INFORMATION
This section presents selected program performance information, including, for example, GPRA goals, objectives, measures, and performance targets and data, and an assessment of the progress made toward achieving program results. Achievement of results is based on the cumulative effect of the resources provided in previous years and those requested in fiscal year 2015 and future years, as well as the resources and efforts invested by those served by this program.
Because the programs in the Student Financial Assistance account rely on the same performance data, the performance measures, strategies, and program improvement activities that apply to all of the programs are discussed in the Student Aid Overview and are not repeated here.

Q-29
STUDENT FINANCIAL ASSISTANCE
Federal supplemental educational opportunity grants
Distribution of SEOG Funds by Student Status and Income Level:
The following tables (structured to provide a common basis of comparison among the programs in the SFA account) show the distribution of SEOG funds to dependent and independent students at various income levels in 2011-2012. These tables include the most recent distributional data available, which may not match directly with the data provided in the Program Output Measures section.
In 2011-2012, 68 percent of dependent SEOG recipients had family income levels under $30,000 and 78 percent of independent SEOG recipients had family income levels under $20,000.
Distribution of SEOG in Academic Year 2011-2012
Income Level Recipients Available Aid Average Award
Dependent: 0 - $ 5,999 110,087 $76,690,365 $697 $6,000 - $11,999 70,610 50,710,242 718 $12,000 - $23,999 207,089 153,560,816 742 $24,000 - $29,999 105,660 81,043,526 767 $30,000 + 234,415 191,385,570 823 Subtotal – Dependent 727,861 553,390,519 770
Independent 918,125 414,089,835 451
TOTAL 1,645,986 967,480,354 588

Q-30
STUDENT FINANCIAL ASSISTANCE
Federal supplemental educational opportunity grants
Distribution of SEOG to Independent Undergraduates in Academic Year 2011-2012
Income Level Recipients Available Aid Average Award 0 - $ 1,999 249,677 $116,952,934 $468 $2,000 - $ 3,999 62,293 30,270,760 486 $4,000 - $ 7,999 126,628 58,691,609 463 $8,000 - $11,999 111,930 50,074,056 447 $12,000 - $15,999 92,463 39,453,379 427 $16,000 - $19,999 73,187 30,894,459 422 $20,000 + 201,947 87,752,638 435
TOTAL 918,125 414,089,835 451
Distribution of SEOG Funds by Type of Institution:
The distribution of SEOG assistance to institutions is controlled by a statutory distribution formula. The distribution of SEOG among different types of institutions has remained relatively constant over time due to this formula and the base guarantee, with the majority of funding going to students attending public institutions. The distribution of aid by institution type has remained relatively constant over the last 5 years; proprietary institutions have seen the most growth in their share, but despite growing enrollments, their share has grown by only 2.9 percentage points over that time.
The following table shows the distribution of SEOG to students attending different types of institutions in 2011-2012.
Distribution of SEOG by Type of Institution in Academic Year 2011-2012
Institution Type Percent of SEOG Aid Available Aid Recipients Average Award
Public 4-Year 30.7% $296,924,166 418,932 $709
Public 2-Year 16.6% 160,654,054 390,241 412 Private 35.3% 341,141,415 349,789 739
Proprietary 17.4% 168,760,719 487,024 396
TOTAL 100.0% 967,480,354 1,645,986 588 Note: Percentages may not total to 100% due to rounding.

Q-31
STUDENT FINANCIAL ASSISTANCE
Federal work-study (Higher Education Act of 1965, Title IV, Part C)
(dollars in thousands)
FY 2015 Authorization: Indefinite
Budget Authority:
Work-study budget authority 2014 2015 Change
$974,728 $974,728 0
PROGRAM DESCRIPTION
The Federal Work-Study program ensures access to postsecondary education and lifelong learning by assisting needy undergraduate and graduate students in financing postsecondary education costs through part-time employment. Federal funds for this purpose are distributed to qualifying institutions whose financial aid administrators select qualified needy students for employment. Students may be employed by the institution; by a Federal, State, or local public agency or private nonprofit organization; or by a private for-profit organization.
The funding for the Work-Study program is available for 2 fiscal years. Funds become available for obligation on October 1 of the fiscal year in which they are appropriated and remain available through September 30 of the following fiscal year. Funds requested for fiscal year 2015 would be used for the 2015-2016 award year, which runs from July 1, 2015 through June 30, 2016.
Institutional participation: Roughly 3,400 institutions participate in the Work-Study program. As mandated by statute, funds are distributed to institutions first on the basis of the institution's fiscal year 1999 Work-Study program base guarantee and pro rata share, and then on the basis of the aggregate need of the eligible undergraduate students in attendance. The Work-Study program is administered by institutional financial aid administrators who have substantial flexibility in determining student awards.
If an institution is a proprietary school employing its own students, this employment must be: (1) on campus, except that at least 7 percent of the total funds granted must be used to compensate students employed in community service activities; (2) related, to the maximum extent practicable, to the student’s educational objectives; and (3) related to providing student services. The employment tasks of Work-Study students, however, must not involve the solicitation of potential students to enroll in the school.
Institutional matching: In general, participating institutions or other employers must contribute at least 25 percent of a student’s part-time earnings (or 50 percent in the case of private-for-profit employers). The Federal share may be up to 90 percent for students employed at a private nonprofit organization or a Federal, State, or local public agency that would otherwise be unable to afford the costs of employing those students. The 90 percent Federal share is limited to no more than 10 percent of the students paid under the Federal Work-Study Program.

Q-32
STUDENT FINANCIAL ASSISTANCE
Federal work-study
Employment at the school itself is not eligible for the 90 percent match. In addition, the Secretary may authorize through regulations a Federal share in excess of 75 percent based on the determination that it is necessary for the advancement of the program.
Student participation: Students qualify for Work-Study awards by demonstrating financial need under the general statutory need analysis system for the Federal student financial assistance programs. Hourly earnings must not be less than the current Federal minimum wage. Approximately 7 percent of undergraduates participate in Work-Study.
In addition, if the institution’s allocation is based in part on the financial need demonstrated by independent students or students attending the institution less-than-full-time, then a reasonable portion of the allocation must be made available to such students. Recipients must be enrolled with the purpose of obtaining a degree or certificate at an eligible institution, and must also have a high school diploma (or its equivalent) or, for students enrolled prior to July 1, 2012, a demonstrated ability to benefit from the training offered by the institution (as shown by a passing score on a test approved by the Department of Education or the successful completion of six academic program credits).
A student already in default on a loan made under any Title IV, HEA loan program, or who owes an overpayment on any other previously received Federal student aid, however, may not receive additional funds under the program unless he or she repays the debt in full, or makes satisfactory repayment arrangements with the holder of the debt.
Institutional administrative provisions: Institutions may use their allocations to support a variety of Work-Study activities, as described below:
• Community service. An institution must use at least 7 percent of its Federal allocation for payments to students employed in community service activities. Other Work-Study jobs that qualify as community service activities include community-accessible childcare and assistance for disabled students. The HEOA expanded the definition of community service to include emergency preparedness and response. The eligible institution, at its discretion, may count any contribution made by the employer toward the non-Federal share of the student’s compensation.
• Tutoring and literacy activities. An institution must include at least one tutoring or family literacy project as part of its community service activities. Under this requirement, priority is to be given to the employment of Work-Study recipients as reading tutors in schools that are participating in a reading reform project designed to train teachers to teach reading on the basis of scientifically-based research on reading, and which is funded under the Elementary and Secondary Education Act of 1965, as amended. In 2010-11, the last year data was collected, almost 39,000 Work-Study students were employed as reading tutors.
• Private sector. An institution may use up to 25 percent of its Work-Study allocation to match earnings of students working for private for-profit organizations. Students must, to the maximum extent practicable, be placed in jobs that are academically relevant to

Q-33
STUDENT FINANCIAL ASSISTANCE
Federal work-study
their course of study. Work-Study funds may not be used to pay any employee who would otherwise be employed by the private organization.
• Job Location and Development. An institution may use not more than 10 percent, or $50,000, of its Work-Study allocation, for the administrative expenses associated with the establishment or expansion of a Job Location and Development (JLD) program, which locates and develops off-campus full- or part-time jobs or community service jobs for currently enrolled students. The Federal share of the JLD program costs cannot exceed 80 percent.
• Work Colleges. A “Work College” is an institution that requires all resident students to participate in a work-learning program as an integral part of the institution’s educational philosophy. These colleges are authorized to receive special awards in addition to their regular Work-Study allocations to support such programs. Work Colleges must match Federal allocations on a dollar-for-dollar basis. In addition, Work Colleges may transfer all of their regular Work-Study, and Perkins Federal Capital Contribution allotments for use under the Work Colleges program.
• Administrative costs. Each institution’s administrative cost allowance is based upon its expenditures for all three campus-based programs, excluding the amount of Perkins loans assigned to the Department. Under a statutory formula, an institution may use up to 5 percent of the first $2.75 million of its program expenditures; plus up to 4 percent of expenditures greater than $2.75 million but less than $5.5 million; and up to 3 percent of expenditures greater than $5.5 million during an award year to meet administrative costs associated with the SEOG, Work-Study, and Perkins Loan programs.
• Transferability of funds. An institution may transfer up to 25 percent of its allocation from Perkins Loans Federal Capital Contributions to SEOG or Work-Study (or both) and up to 25 percent of Work-Study to SEOG. Up to 10 percent of an institution’s Work-Study funds may, at the discretion of the institution, be used for expenditures for the preceding fiscal year. In addition, up to 10 percent of an institution’s Work-Study funds may, at the discretion of the institution, remain available for the next fiscal year.
• Reallocation. If funds become available because of under-utilization by institutions, excess funds are reallocated only to other institutions that used at least 5 percent of their Work-Study allocations to compensate students employed in tutoring in reading and family literacy activities in the preceding year. Reallocated funds must be used to support student employment in community service activities.
• Disasters. The HEOA added a provision under which an eligible institution located in an area affected by a major disaster, as determined by the Secretary, may make Work-Study payments to disaster-affected students, for the period of time (not to exceed one academic year) in which the students were prevented from fulfilling their Work-Study obligations due to the disaster. Payment may be made in an amount equal to or less than the amount a student would have been paid had the student been able to complete the work obligation necessary to receive Work-Study funds.

Q-34
STUDENT FINANCIAL ASSISTANCE
Federal work-study
Funding levels for the past 5 fiscal years were:
(dollars in thousands) 2010 ......................................... $980,492 2011 ......................................... 978,531 2012 ......................................... 976,682 2013 ......................................... 925,595 2014 ......................................... 974,728
FY 2015 BUDGET REQUEST
As with the SEOG and Perkins Loan programs, the 2015 Budget proposes to reform the Federal Work-Study allocation formula to target those institutions that enroll and graduate higher numbers of Pell-eligible students, and offer affordable and quality education and training such that graduates can obtain employment and repay their educational debt.
The fiscal year 2015 budget requests $974.7 million for the Work-Study program, level with the fiscal year 2014 amount. The request will generate nearly $1.16 billion in available aid to support more than 690,000 part-time jobs for students, helping to meet the educational costs of undergraduate and graduate students and to expand their future employment prospects.
The fiscal year 2015 budget request for this program is best understood in the context of the Administration’s proposals for the student aid programs as a whole. Accordingly, policy proposals are discussed in greater detail in the Student Aid Overview, beginning on page P-1.
PROGRAM OUTPUT MEASURES (dollars in thousands)
Measures Program output measures 2013 2014 2015
Recipients 655,626 690,428 690,428 Aid available to students 1 $1,100,271 $1,158,676 $1,158,676 Average award (whole dollars) $1,678 $1,678 $1,678
1 Aid available includes budget authority and employer-matching funds, minus administrative costs, transfers to SEOG, or reservations of funds for the next year.

Q-35
STUDENT FINANCIAL ASSISTANCE
Federal work-study
PROGRAM PERFORMANCE INFORMATION
This section presents selected program performance information, including, for example, GPRA goals, objectives, measures, and performance targets and data, and an assessment of the progress made toward achieving program results. Achievement of results is based on the cumulative effect of the resources provided in previous years and those requested in fiscal year 2015 and future years, as well as the resources and efforts invested by those served by this program.
Because the programs in the Student Financial Assistance account rely on the same performance data, the performance measures, strategies, and program improvement activities that apply to all of the programs are discussed in the Student Aid Overview and are not repeated here.
Distribution of Work-Study Funds by Student Status and Income Level:
The following tables (structured to provide a common basis of comparison among the programs in the SFA account) illustrate the distribution of Work-Study funds to dependent students and the distribution to independent students at various income levels for 2011-2012. These tables include the most recent distributional data available, which may not correspond directly with the data provided in the Program Output Measures section.
Distribution of Work-Study in Academic Year 2011-2012
Income Level Recipients Available Aid Average Award
Dependent: 0 - $ 5,999 36,471 $59,766,212 $1,639 $6,000 - $11,999 24,388 41,723,624 1,711 $12,000 - $23,999 73,387 123,346,816 1,681 $24,000 - $29,999 39,524 64,926,359 1,643 $30,000 + 353,298 519,720,716 1,521 Subtotal - Dependent 527,068 809,483,745 1,605 Independent:
Undergraduate 126,069 240,925,935 1,911
Graduate 51,074 125,567,203 2,459
TOTAL 704,211 1,175,976,883 1,670

Q-36
STUDENT FINANCIAL ASSISTANCE
Federal work-study
Distribution of Work-Study to Independent Undergraduates in Academic Year 2011-2012
Income Level Recipients Available Aid Average Award
0 - $ 1,999 37,933 $67,949,689 $1,791
$2,000 - $ 3,999 12,278 23,019,228 1,875 $4,000 - $ 7,999 21,243 42,272,008 1,990 $8,000 - $11,999 15,997 32,939,419 2,059 $12,000 - $15,999 11,442 22,962,892 2,007 $16,000 - $19,999 7,402 14,631,709 1,977 $20,000 + 19,774 37,150,990 1,879
TOTAL 126,069 240,925,935 1,911
Distribution of Work-Study Funds by Type of Institution:
The Work-Study program is a campus-based program and the distribution of funds to institutions is controlled by a statutory distribution formula. As a result, the distribution of Work-Study assistance among different types of institutions has remained relatively constant over time, varying by no greater than plus or minus 1.4 percent for each category over the last 5 years. The table below shows the distribution of Work-Study to students attending different types of institutions in 2011-2012.
Distribution of Work-Study by Type of Institution in Academic Year 2011-2012
Institution Type Percent of Work-Study Aid Available Aid Recipients Average Award
Public 4-Year 34.2% $402,693,340 226,991 $1,774 Public 2-Year 13.0% 153,050,239 79,695 1,920 Private 47.1% 554,085,497 369,157 1,365 Proprietary 5.6% 66,147,807 28,368 2,249
TOTAL 100.0% 1,175,976,883 704,211 1,670

Q-37
STUDENT FINANCIAL ASSISTANCE
Federal work-study
Community Service Activities:
The Work-Study program has a long tradition of providing opportunities for students to perform community service activities—supporting an important cooperative link between students, colleges and the local community. At least 7 percent of an institution's Work-Study allotment must be used to pay students employed in community service jobs, unless the institution obtains a waiver from the Department. Nationally, 15 percent of Work-Study funds are used for community service.
Participating colleges and universities are to ensure that at least one project provides services to both children and their parents. Allowable activities, such as family literacy programs, emphasize preparing parents to read to their own children.
The Department has waived the usual 25 percent institutional contribution, allowing Work-Study funds to pay up to 100 percent of the wages to support students who tutor children in mathematics, or reading, or who serve in family literacy programs.
Distribution of Work-Study Funds to Students in Community Service Activities:
The table below shows the distribution of Work-Study assistance to students employed in community service activities in 2011-2012.
Distribution of Work-Study to Students in Community Service Activities in Academic Year 2011-2012
Type of Institution Recipients Available Aid Average Award
Public 4-Year 43,496 $76,073,525 $1,749
Public 2-Year 14,544 28,576,899 1,965 Private 59,010 87,816,458 1,250 Proprietary 5,107 11,770,238 2,258
TOTAL 122,157 204,237,120 1,672

Q-38
STUDENT FINANCIAL ASSISTANCE
Federal Perkins loans (Higher Education Act of 1965, Title IV, Part E)
(dollars in thousands)
FY 2015 Authorization: (Proposed legislation)
Mandatory Budget Authority:
Perkins loans budget authority 2014 2015 Change
Federal Perkins loans: (a) Capital contributions 0 0 0 (b) Loan cancellations 0 0 0
New loan subsidies 1 0 -$827,674 -$827,674
Perkins Total Net Subsidy 0 -827,674 -827,674
1 Legislation is sought for 2015 to shift Perkins Loans to a mandatory credit program. (Institutions would continue to be compensated for Perkins Loan cancellations, but from Federal collections on outstanding Perkins Loans rather than discretionary appropriations.) New loan subsidies, which would be appropriated through a new Federal Perkins Loan Program account, reflect the net present value of estimated Federal non-administrative lifetime costs for loans made in a given fiscal year. A negative number indicates estimated revenues exceed estimated costs.
PROGRAM DESCRIPTION
The Federal Perkins Loan program provides long-term, low-interest loans to financially needy undergraduate and graduate students to help meet their higher education costs. Loans are made from Federal revolving funds held at institutions composed of: (1) newly appropriated Federal capital contributions (FCC); (2) institutional matching funds equaling at least one-third of the FCC; (3) payments on prior-year student loans; and (4) reimbursements for loans cancelled in exchange for specific types of teaching, or military or public service.
The funding for the Perkins Loan program is available for 2 fiscal years. Funds become available for obligation on October 1 of the fiscal year in which they are appropriated and remain available through September 30 of the following fiscal year. The Administration’s 2015 Budget proposes new legislation to reform and expand the Perkins Loan program as a mandatory credit program to replace the current program as of July 1, 2015. Funds available in fiscal year 2014 would be used for the 2014-2015 award year, which runs from July 1, 2014 to June 30, 2015. The Perkins Loan program is authorized through September 30, 2014. If Congress doesn’t enact legislation extending or repealing the authorization of the program before that date, the program would be eligible for a 1-year extension, through September 30, 2015, under section 422(a) of the General Education Provisions Act (GEPA). Starting in 2016, the remaining institutional funds will revert to the Federal Government.

Q-39
STUDENT FINANCIAL ASSISTANCE
Federal Perkins loans
Institutional participation: Roughly 1,700 postsecondary institutions make loans under the current Perkins Loan program. As mandated by statute, funds are distributed to institutions first on the basis of the institution's fiscal year 1999 Perkins Loan program FCC base guarantee and pro rata share, and, secondly, on the basis of the aggregate need of the eligible students in attendance. However, no Federal Capital Contributions have been made since 2006. The Perkins Loan program is administered by institutional financial aid administrators who have substantial flexibility in determining student awards.
Institutional matching: Institutions contribute one-third of the FCC in institutional matching funds.
Default rate provisions: A school’s FCC allocation is reduced to zero when the institution’s cohort default rate reaches 25 percent. If a school’s cohort default rate is less than 25 percent, it qualifies for the full allocation amount pursuant to the statutory formula. In general, a school’s participation in the program is terminated if its default rate exceeds 50 percent for 3 consecutive years. As of September 2013, the latest data available, the fiscal year 2011 national cohort default rate is 10.0 percent.
Institutional administrative provisions:
• Loan Servicing and collections. Schools are responsible for making loans, servicing, and collections; including the establishment of repayment schedules and borrower counseling. Most servicing and collection activities are performed by private contractors employed by the schools. Collections on existing loans are estimated to be $1 billion in award year 2013-2014.
• Loan Rehabilitation. Institutions participating in the Perkins Loan program are required to establish a loan rehabilitation program for all defaulted borrowers. Loan rehabilitation allows the institution to eliminate the loan from default rate calculations. In order to rehabilitate a defaulted loan, borrowers are required to make 9 consecutive on-time monthly payments to the institution. A loan can only be rehabilitated once. The first payment of the dictated 9-month cycle is considered the first payment of a new 10-year payment cycle. Once the loan is rehabilitated, the institution must update the borrower’s loan status with any credit reporting agency to which the default was reported.
• Administrative costs. Each institution’s administrative cost allowance is based upon its expenditures for all three campus-based programs, excluding the amount of Perkins loans assigned to the Department. Under a statutory formula, an institution may use up to 5 percent of the first $2.75 million of its program expenditures; plus up to 4 percent of expenditures greater than $2.75 million but less than $5.5 million; and up to 3 percent of expenditures greater than $5.5 million during an award year to meet administrative costs associated with the SEOG, Work-Study, and Perkins Loan programs.
• Transferability of funds. An institution may transfer up to 25 percent of its FCC allotment from Perkins loans to SEOG or Work-Study, or both.

Q-40
STUDENT FINANCIAL ASSISTANCE
Federal Perkins loans
• Reallocation of funds. If funds become available because of under-utilization by institutions, excess funds are reallocated to other institutions based on a statutory formula. If an institution returns more than 10 percent of its allocation, that institution’s allocation is reduced by that same amount the next year.
Student participation: Students qualify for loans by demonstrating financial need under the statutory Federal student aid need analysis system. An eligible borrower is an undergraduate, graduate, or professional student with demonstrated financial need enrolled at an eligible postsecondary institution. In addition, if the institution’s Perkins loan allocation is based in part on the financial need demonstrated by students who are independent students or attending the institution less-than-full-time, then a reasonable portion of the allocation must be made available to such students. However, a student already in default on a loan made under any Title IV, HEA loan program, or who owes an overpayment on any other previously received Federal student aid, may not borrow under the program unless he or she repays the debt in full, or makes satisfactory repayment arrangements with the holder of the debt.
A borrower makes no principal repayments during in-school, grace, and deferment periods, and interest is neither paid nor accrued during these periods. During the repayment period (which normally may not exceed 10 years), interest is charged at a 5 percent annual rate. Maximum loan amounts were increased by the HEOA. The maximum annual amount a student can borrow under the Perkins Loan program is $5,500 for undergraduates and $8,000 for graduate and professional students; $60,000 for the combination of undergraduate and graduate study; $27,500 for students who have completed 2 years of undergraduate education, but have not received a bachelor's degree; and $11,000 for all other students.
Loan cancellations: In order to reduce the loan burden on Perkins loan borrowers who enter certain fields of public service, all or a portion of the repayment obligation on Perkins loans is canceled in exchange for specified periods of such service. Perkins loan balances are also canceled in the event of a borrower's death, or total and permanent disability.
Since October 8, 1998 (the date of enactment of the Higher Education Amendments of 1998), Perkins loan holders qualify for public service cancellation benefits for service on or after that date, regardless of whether these terms were included in their original promissory notes.
In general, the schools’ share of their revolving funds are reimbursed for 100 percent of the principal and accrued interest of the loan canceled.
The areas of public service that qualify for cancellation include:
• Teaching in low-income areas and in special education, math, science, foreign language, bilingual education, and any other fields where State education agencies determine a shortage of qualified teachers exists, or serve full-time on the faculty at a tribal college or university.
• Full-time staff work in a preschool program under the Head Start Act.
Q-41
STUDENT FINANCIAL ASSISTANCE
Federal Perkins loans
• Military service in areas of hostilities and imminent danger.
• Peace Corps and VISTA service.
• Service as a law enforcement/corrections officer, firefighter, or public defender.
• Nurses and medical technicians providing health care services, professional providers of qualified early intervention services, and employees of qualified child/family service in low-income communities.
Funding levels for the past 5 fiscal years were as follows:
(dollars in thousands) Fiscal year Federal Capital
Contributions1 Loan
Cancellations 2010 .................................. 0 0 2011 .................................. 0 0 2012 .................................. 0 0 2013 .................................. 0 0 2014 .................................. 0 0
1 Federal Capital Contributions were last funded in fiscal year 2004.
FY 2015 BUDGET PROPOSAL
The Administration proposes to expand and reform the Perkins Loan program. This legislative proposal will not only improve the existing Perkins Loan program, it will replace the current program which is authorized through September 30, 2014, and in which Perkins funds will be recalled to the Federal Government in 2016. If Congress doesn’t enact legislation extending or repealing the authorization of the program before the end of fiscal year 2014, the program would be eligible for a 1-year extension, through September 30, 2015, under section 422(a) of the General Education Provisions Act (GEPA). Consequently, it is critically important that a new and reformed Perkins loan program be enacted.
The new Perkins Loan program, when fully implemented, would support $8.5 billion a year in new loan volume – eight and a half times the current Perkins volume and expand institutional participation by up to an additional 2,700 postsecondary education institutions. The savings generated from this proposal would be dedicated to the Pell Grant program to maintain the maximum award.
Rather than operating through institutional revolving funds, Perkins Loans would be originated and serviced by the Federal Government, beginning July 1, 2015. Under the Administration’s proposal, Unsubsidized Perkins Loans would carry the same annually-determined, fixed interest rate as Unsubsidized Stafford Loans and would accrue interest as other Unsubsidized loans do. Loan limits for both undergraduate and graduate students would remain the same as in the current Perkins program.
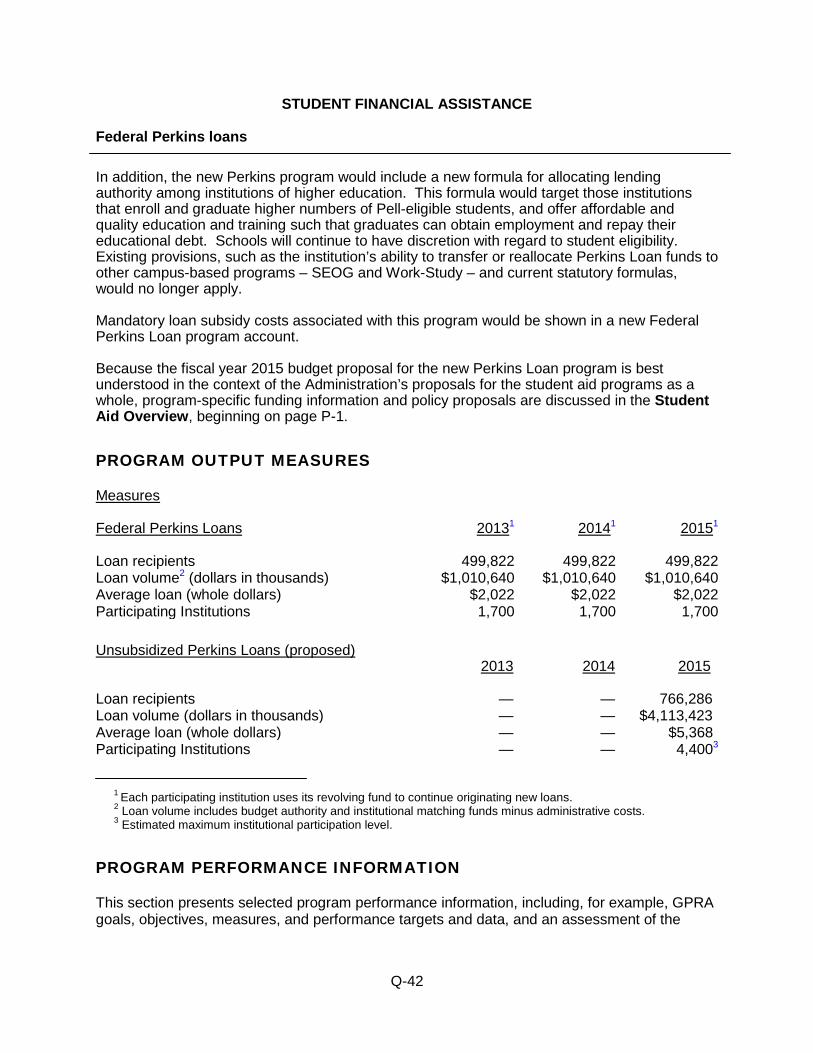
Q-42
STUDENT FINANCIAL ASSISTANCE
Federal Perkins loans
In addition, the new Perkins program would include a new formula for allocating lending authority among institutions of higher education. This formula would target those institutions that enroll and graduate higher numbers of Pell-eligible students, and offer affordable and quality education and training such that graduates can obtain employment and repay their educational debt. Schools will continue to have discretion with regard to student eligibility. Existing provisions, such as the institution’s ability to transfer or reallocate Perkins Loan funds to other campus-based programs – SEOG and Work-Study – and current statutory formulas, would no longer apply.
Mandatory loan subsidy costs associated with this program would be shown in a new Federal Perkins Loan program account.
Because the fiscal year 2015 budget proposal for the new Perkins Loan program is best understood in the context of the Administration’s proposals for the student aid programs as a whole, program-specific funding information and policy proposals are discussed in the Student Aid Overview, beginning on page P-1.
PROGRAM OUTPUT MEASURES
Measures
Federal Perkins Loans 20131 20141 20151
Loan recipients 499,822 499,822 499,822 Loan volume2 (dollars in thousands) $1,010,640 $1,010,640 $1,010,640 Average loan (whole dollars) $2,022 $2,022 $2,022 Participating Institutions 1,700 1,700 1,700
Unsubsidized Perkins Loans (proposed) 2013 2014 2015
Loan recipients — — 766,286 Loan volume (dollars in thousands) — — $4,113,423 Average loan (whole dollars) — — $5,368 Participating Institutions — — 4,4003
1 Each participating institution uses its revolving fund to continue originating new loans. 2 Loan volume includes budget authority and institutional matching funds minus administrative costs. 3 Estimated maximum institutional participation level.
PROGRAM PERFORMANCE INFORMATION
This section presents selected program performance information, including, for example, GPRA goals, objectives, measures, and performance targets and data, and an assessment of the

Q-43
progress made toward achieving program results. Achievement of results is based on the cumulative effect of the resources provided in previous years and those requested in fiscal year

Q-44
STUDENT FINANCIAL ASSISTANCE
Federal Perkins loans
2015 and future years, as well as the resources and efforts invested by those served by this program.
Because the programs in the Student Financial Assistance account rely on the same performance data, the performance measures, strategies, and program improvement activities that apply to all of the programs are discussed in the Student Aid Overview and are not repeated here.
Distribution of Perkins Loans by Student Status and Income Levels:
The tables below (structured to provide a common basis of comparison among the programs in the SFA account) show the distribution of Perkins loans to dependent students and the distribution of Perkins loans to independent students – both undergraduate and graduate – at various income levels in 2011-2012. These tables include the most recent distributional data available, which may not correspond directly with the data provided in the Program Output Measures section.
Distribution of Perkins in Academic Year 2011-2012
Income Level Recipients Loan Volume Average Loan
Dependent: 0 - $ 5,999 21,457 $39,613,867 $1,846 $6,000 - $11,999 14,627 26,614,867 1,820 $12,000 - $23,999 46,392 83,662,730 1,803 $24,000 - $29,999 27,290 48,823,622 1,789 $30,000 + 213,322 382,165,379 1,782
Subtotal – Dependent 323,088 580,880,465 1,808 Independent:
Undergraduate 95,890 171,519,981 1,789
Graduate 65,678 196,112,495 2,953 TOTAL 484,656 948,512,941 1,957

Q-45
STUDENT FINANCIAL ASSISTANCE
Federal Perkins loans
Distribution of Perkins to Independent Undergraduates in Academic Year 2011-2012
Income Level Recipients Available Aid Average Loan
0 - $ 1,999 23,224 $41,894,456 $1,804 $2,000 - $ 3,999 7,148 12,963,524 1,814 $4,000 - $ 7,999 13,435 23,886,677 1,778 $8,000 - $11,999 11,284 20,056,445 1,777 $12,000 - $15,999 8,924 15,594,579 1,747 $16,000 - $19,999 6,801 12,144,847 1,786 $20,000 + 25,074 44,979,453 1,794 TOTAL 95,890 171,519,981 1,789
Distribution of Perkins Loans by Type of Institution:
The Perkins Loan program is a campus-based program and distribution of new capital funds to institutions is controlled by a statutory formula. The distribution of Perkins Loan assistance among different types of institutions has remained relatively constant over time, increasing by less than 2 percent for each category over the last 5 years.
The table below illustrates the sector distribution of Perkins loans to students in 2011-2012:
Distribution of Perkins by Type of Institution Academic Year 2011-2012
Institution Type Percent of Perkins Aid Loan Volume Recipients Average Loan Public 4-Year 45.4% $430,363,832 244,209 $1,762 Public 2-Year 0.5% 4,927,453 2,448 2,013 Private 51.5% 488,358,348 221,589 2,096 Proprietary 2.6% 24,863,308 16,410 1,900 TOTAL 100.0% 948,512,941 484,656 1,957 Note: Percentages may not total to 100% due to rounding.

Q-46
STUDENT FINANCIAL ASSISTANCE
Iraq and Afghanistan service grants (Higher Education Act of 1965, Title IV, Part A, Subpart 1)
(dollars in thousands)
FY 2015 Authorization: Indefinite
Mandatory Budget Authority:
Iraq and Afghanistan service grants budget authority 2014 2015 Change
$285 $355 +$70
PROGRAM DESCRIPTION
The Iraq and Afghanistan Service Grants program provides non-need-based grants to students whose parent or guardian was a member of the Armed Forces who died in Iraq or Afghanistan as a result of performing military service after September 11, 2001. Students are not required to be eligible for a Pell Grant in order to receive a Service Grant; however, the student must be 24 years old or younger; or, if older than 24, must have been enrolled in an institution of higher education at the time of the parent or guardian’s death.
Service Grants are equal to the maximum Pell Grant for a given award year, which is projected to be $5,830 for the 2015-2016 award year. Service Grants are excluded from the total “estimated financial assistance” used to determine a student’s eligibility for other Title IV Federal financial aid. In combination with other student aid, however, the Service Grant may not result in a student’s awards exceeding their cost of attendance. As with Pell Grant eligibility, students are limited to 12 semesters of full-time enrollment.
Funding levels for the past 5 fiscal years were as follows: (dollars in thousands)
2010 ............................................... $15 2011 ............................................... 183 2012 ............................................... 180 2013 ............................................... 236 2014 ............................................... 285
FY 2015 BUDGET PROPOSAL
The Administration’s 2015 budget includes mandatory funding for Iraq and Afghanistan Service Grants (IASG) in the amount of $355,000, an increase of $70,000 from fiscal year 2014. The first Service Grants were made in award year 2010-2011. Fewer than 1,000 awards are expected to be made with fiscal year 2015 funds during academic year 2015-2016.

Q-47
STUDENT FINANCIAL ASSISTANCE
Iraq and Afghanistan service grants
PROGRAM OUTPUT MEASURES Measures Program output measures 2013 2014 2015
Recipients 1 1 1 Aid Available to students (dollars in thousands)2 $273 $341 $418 Maximum grant (whole dollars) $5,645 $5,730 $5,830 Average grant (whole dollars) $5,056 $5,328 $5,726
1 Recipients estimated to number fewer than 1,000. 2 Aid available is the amount of funding available for new IASG awards to students in any single academic year.
This amount differs from budget authority because 1 fiscal year spans across 2 academic years. For instance, total aid available in fiscal year 2013 is comprised of portions of both academic year 2012-2013 (ending June 30) and 2013-2014 (beginning July 1).
PROGRAM PERFORMANCE INFORMATION
This section presents selected program performance information, including, for example, GPRA goals, objectives, measures, and performance targets and data, and an assessment of the progress made toward achieving program results. Achievement of results is based on the cumulative effect of the resources provided in previous years and those requested in fiscal year 2015 and future years, as well as the resources and efforts invested by those served by this program.
Because the programs in the Student Financial Assistance account rely on the same performance data, when available, the Iraq and Afghanistan Service Grants performance measures, strategies, and program improvement activities will be discussed in the Student Aid Overview and not repeated here. Distribution of Iraq and Afghanistan Service Grant Funds by Type of Institution:
The data provided in the table below shows the distribution of Iraq and Afghanistan service grants to students attending different types of institutions in award year 2012-2013.
Distribution of IASG by Type of Institution 2012-2013
Institution Type Percent of IASG Aid Available Aid Recipients Average Award Public 4-Year 72.7% $165,926 34 $4,880 Public 2-Year 6.4% 14,571 4 3,643 Private 18.0% 41,070 8 5,134 Proprietary 2.9% 6,660 2 3,330 TOTAL 100.0% 228,227 48 4,755 Note: Percents may not total to 100% due to rounding.