Embed Size (px)
Citation preview
DEPARTMENT OF COMMERCEBUREAU OF STANDARDSGeorge K. Burgess, Director
TECHNOLOGIC PAPERS OF THE BUREAU OF STANDARDS, No. 313
[Part of Vol. 20]
SOME CHARACTERISTICS OFQUENCHING CURVES
BY
H. J. FRENCH, Senior Metallurgist
O. Z. KLOPSCH, Assistant Metallurgist
Bureau cf Standards
March 25, 1926
PRICE, 10 CENTS$1.25 Per volume on Subscription
Sold only by the Superintendent of Documents, Government Printing Office
Washington, D. C.
WASHINGTONGOVERNMENT PRINTING OFFICE
1926
T313
SOME CHARACTERISTICS OF QUENCHING CURVES
By H. J. French and O. Z. Klopsch
ABSTRACT
In this report is given a discussion of time-temperature cooling curves at the
center of steel samples of various sizes and shapes quenched into ordinary coolants,
such as water, a commercial quenching oil, and air. Based on the described
experiments a method is outlined by which cooling curves for various sizes andshapes quenched from various temperatures can be derived, provided the curve
for one size from one quenching temperature is available and one constant is knownfor the coolant. Typical examples are given.
CONTENTSPage
I. Introduction 365
II. Materials and test methods used 367
III. Experimental results 367
1. Cooling from a fixed temperature 367
2. Relation of cooling times to steels and shapes quenched 368
3. Data showing that in a given coolant the center of a given
steel sample cools in equal times to equal proportions of the
cooling range 369
4. Evaluation of the "time-constant " 374
IV. General discussion and summary 381
V. Acknowledgments 385
I. INTRODUCTION
In a recent report on mass effects in quenching x certain definite
relations were developed by the authors between the size and shape
of steel quenched and the center cooling velocity taken at 720° C.
For rounds, spheres, and plates this cooling velocity was propor-
tional to the surface per unit of volume raised to some power greater
than 1 and less than 2. If V represents the center cooling velocity,
taken at 720°C, S is the surface area, W is the volume, n and C2
are constants depending upon the coolant, etc., these relations maybe represented by the equation
V- (5)"
«
(1)
It was also demonstrated that the cooling time for certain inter-
vals for small samples was inversely proportional to the designated
cooling velocity. Thus, if Tis the cooling time for a given tempera-
i B. S. Tech. Paper No. 295.
365
366 Technologic Papers of'the Bureau of Standards [Voi.to
ture change, C and Cx are constants, the relations referred to may be
represented by the equation
t-2ft (2)
It may naturally be inferred from equations (1) and (2) that somevery general relations exist between cooling times at the center of
various sizes of the simple shapes (rounds, spheres, and plates),
but in the report already referred to attention was largely directed
to the cooling velocity taken at 720° C, as this had previously been
shown 2 to be the best single factor from time-temperature cooling
curves to represent the hardening produced in small or moderate
size sections of carbon steels. While such cooling velocity relations
are of general interest from several viewpoints,, trequently questions
arise regarding the cooling at lower temperatures and comparisons
are desired of the greater part of the cooling range from the quench-
ing to the final temperatures.
For example, the center temperatures may be desired in the forg-
ing of large masses, or the exact time required at which steel samples
may be removed to avoid cracking without danger of reducing the
center hardness, or otherwise modifying those properties which are
dependent upon the manner of cooling through the hardening trans-
formations.
Such cooling curves are also useful in comparisons of various
coolants and particularly in determining what sizes of the simple
shapes may be fully hardened to the center when made from steels
for which the critical cooling velocities are known. Again they will
show, at least in a general way, the range in sizes of the simple shapes
which may be quenched to advantage in special coolants.
Aside from this, however, center cooling curves form the basis of
comparison for a study of cooling at the surface and other portions
of steel samples of various sizes and shapes, a subject which it is
hoped may be considered at a later date.
It is the purpose of this report to summarize experiments already
reported, together with results of additional tests in such a waythat it will be possible to construct, by simple calculations, practi-
cally the entire time-temperature cooling curves (from the quench-
ing temperature to about 200 to 250° C.) for the center of various
sizes of the simple shapes when quenched from any temperature at
or above 720° C. into typical coolants, such as water, an oil, and air.
In the discussion of data the similarities and salient features of the
quenching curves will, of course, be developed and will facilitate
making similar compilations for other of the many coolants nowused industrially or for experimental work.
2 H. J. French and O. Z. Klopsch, " Quenching diagrams for carbon steels in relation to some quenching
media for heat treatment," Trans. A. S. S. T., 6, p. 251; September, 1924.
xiTpsch] Quenching Curve Characteristics 367
II. MATERIALS AND TEST METHODS USED
As in previous cases, carbon or carbon-chromium steel samples
of different sizes and shapes were quenched from various tempera-
tures into motionless water, a commercial quenching oil (called No. 2
oil), or air, each at 18 to 23° C. A description of equipment andmethods of procedure employed has already been given.3
It should be pointed out that in both the previous report and the
tests now to be discussed, thermal effects of transformation were
disregarded. Smooth curves were drawn from points above the
transformations to points below and therefore cooling at intermediate
temperatures in the neighborhood of 500 to 650° C. was approximated.
Despite objections which may be raised to such procedure, it seems
preferable to the use of a transformation-free metal. The thermal
properties of all such metals as have been used or suggested for this
purpose are quite different from those of ordinary steels, at least in
some portions of the cooling range, and will not yield results closely
approaching those obtained with the ordinary steels to which such
treatments as are here considered are ordinarily applied and of most
importance.
III. EXPERIMENTAL RESULTS
1. COOLING FROM A FIXED TEMPERATURE
If in equation (2) there is substituted the value of V given byequation (1) the following is obtained:
-t(?ySince C, &, and C2 are constants the product of C and d divided byC2 will also be a constant. Equation (3) may then be rewritten as
follows
:
•=«© (4)
This shows that the cooling time for a given temperature change at
the center of small sizes of the simple shapes is proportional to the
reciprocal of the surface per unit of volume raised to some power"n." The numerical values of this exponent have already been deter-
mined for a number of coolants and found to vary between 1 and 2
;
methods for determining the value of "n" for other coolants havealso been outlined. To apply equation (4) it is then only necessary
to evaluate the constant C3 and determine upon what variables in
quenching it is dependent in addition to the cooling range considered.
3 See footnotes 1 and 2, pp. 365 and 366.
368 Technologic Papers of the Bureau of Standards [ vol. so
With, the evaluation of the constant C3 it should be possible to con-
struct the complete time-temperature cooling curve for various sizes
and shapes.
2. RELATION OF COOLING TIMES TO STEELS AND SHAPESQUENCHED
In the experimental work to be described all small samples were
made of either high-carbon or high carbon-chromium steels, whereas
the largest sections were prepared from commercial low-carbon steels.
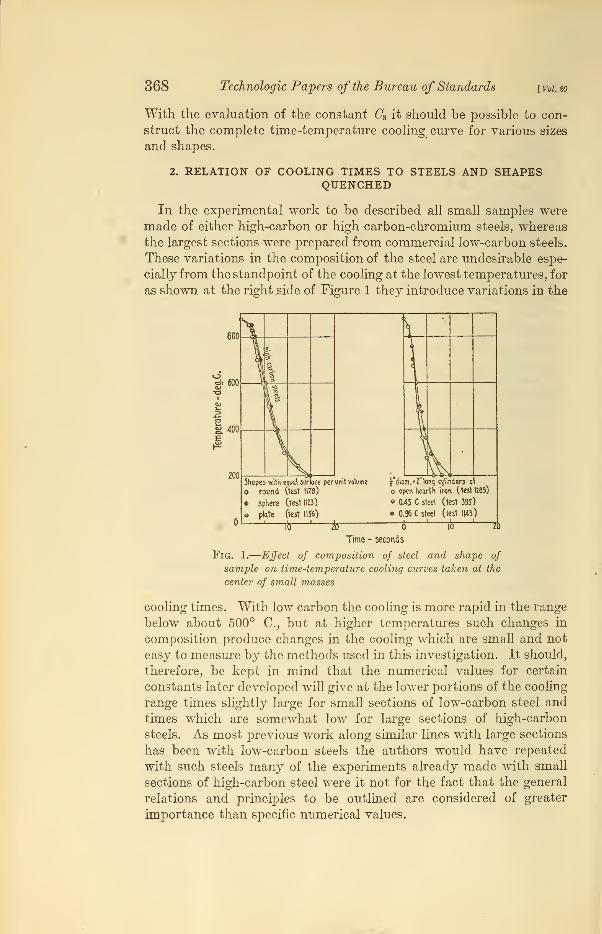
These variations in the composition of the steel are undesirable espe-
cially from the standpoint of the cooling at the lowest temperatures, for
as shown at the right .side of Figure 1 they introduce variations in the
Shopes viith equal surface per unit volume
o round (test IIT8)
• sphere (test 1123)
o plate (test 1156)
^"diam.»2"lonq cylinders ot
o open hearth iron (test tt69)
«M5C steel (test 395)
• 0.96 C steel (test m)-rtr * 6 io &
Time - seconds
Fig. 1.
—
Effect of composition of steel and shape of
sample on time-temperature cooling curves taken at the
center of small masses
cooling times. With low carbon the cooling is more rapid in the range
below about 500° C, but at higher temperatures such changes in
composition produce changes in the cooling which are small and not
easy to measure by the methods used in this investigation. It should,
therefore, be kept in mind that the numerical values for certain
constants later developed will gh?e at the lower portions of the cooling
range times slightly large for small sections of low-carbon steel and
times which are somewhat low for large sections of high-carbon
steels. As most previous work along similar lines with large sections
has been with low-carbon steels the authors would have repeated
with such steels many of the experiments already made with small
sections of high-carbon steel were it not for the fact that the general
relations and principles to be outlined are considered of greater
importance than specific numerical values.
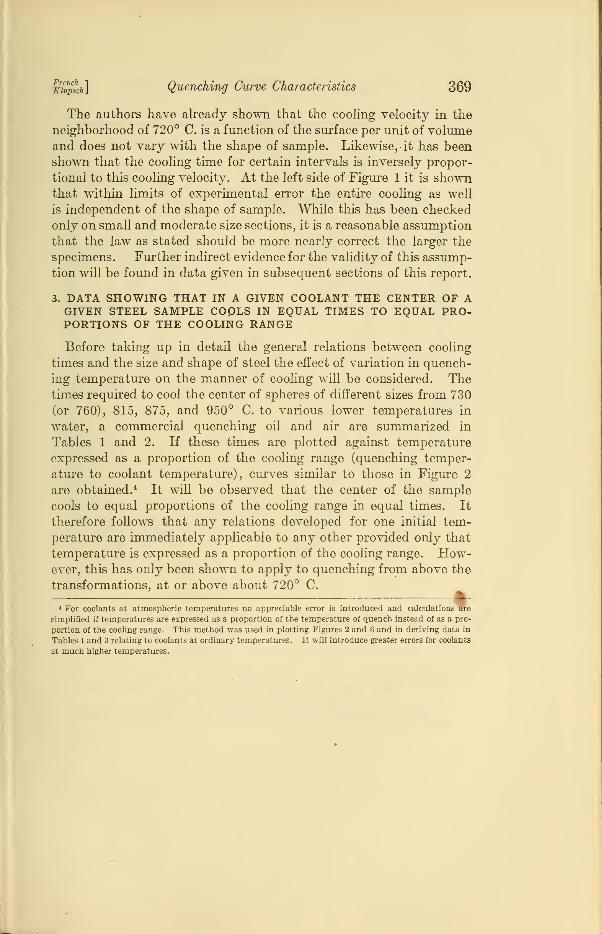
Kiopsch] Quenching Curve Characteristics 369
The authors have already shown that the cooling velocity in the
neighborhood of 720° C. is a function of the surface per unit of volumeand does not vary with the shape of sample. Likewise, it has beenshown that the cooling time for certain intervals is inversely propor-
tional to this cooling velocity. At the left side of Figure 1 it is shownthat within limits of experimental error the entire cooling as well
is independent of the shape of sample. While this has been checked
only on small and moderate size sections, it is a reasonable assumption
that the law as stated should be more nearly correct the larger the
specimens. Further indirect evidence for the validity of this assump-
tion will be found in data given in subsequent sections of this report.
3. DATA SHOWING THAT IN A GIVEN COOLANT THE CENTER OF AGIVEN STEEL SAMPLE COpLS IN EQUAL TIMES TO EQUAL PRO-PORTIONS OF THE COOLING RANGE
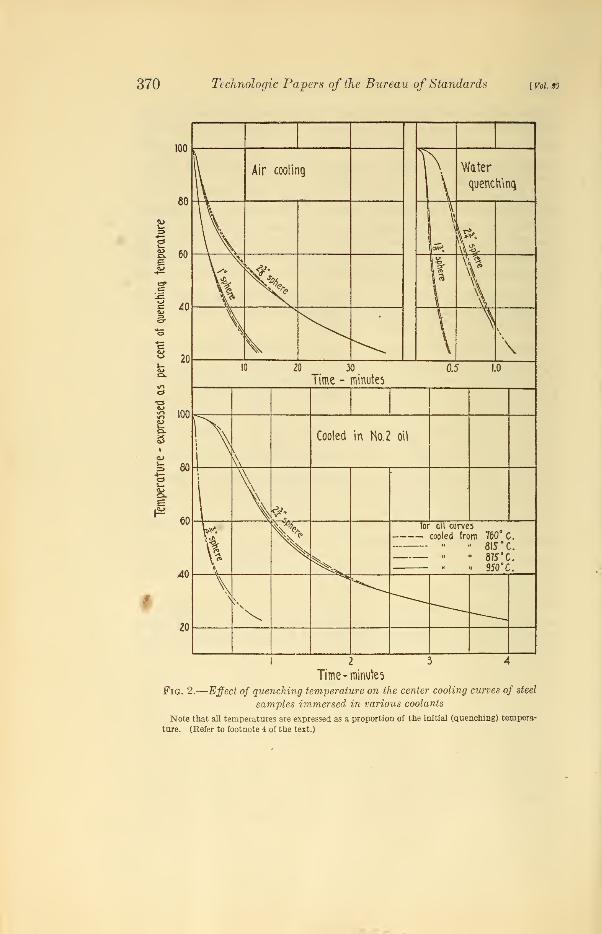
Before taking up in detail the general relations between cooling
times and the size and shape of steel the erfect of variation in quench-
ing temperature on the manner of cooling will be considered. Thetimes required to cool the center of spheres of different sizes from 730
(or 760), 815, 875, and 950° C. to various lower temperatures in
water, a commercial quenching oil and air are summarized in
Tables 1 and 2. If these times are plotted against temperature
expressed as a proportion of the cooling range (quenching temper-
ature to coolant temperature), curves similar to those in Figure 2
are obtained.4 It will be observed that the center of the sample
cools to equal proportions of the cooling range in equal times. It
therefore follows that any relations developed for one initial tem-
perature are immediately applicable to any other provided only that
temperature is expressed as a proportion of the cooling range. How-ever, this has only been shown to apply to quenching from above the
transformations, at or above about 720° C.-^
4 For coolants at atmospheric temperatures no appreciable error is introduced and calculations are
simplified if temperatures are expressed as a proportion of the temperature of quench instead of as a pro-
portion of the cooling range. This method was used in plotting Figures 2 and 6 and in deriving data in
Tables 1 and 3 relating to coolants at ordinary temperatures. It will introduce greater errors for coolants
at much higher temperatures.
370 Technologic Papers of the Bureau of Standards [ Vol. HO
12 3 4
Time- minutes
Fig. 2.
—
Effect of quenching temperature on the center cooling curves of steel
samples immersed in various coolants
Note that all temperatures are expressed as a proportion of the initial (quenching) tempera-
ture. (Refer to footnote 4 of the text.)
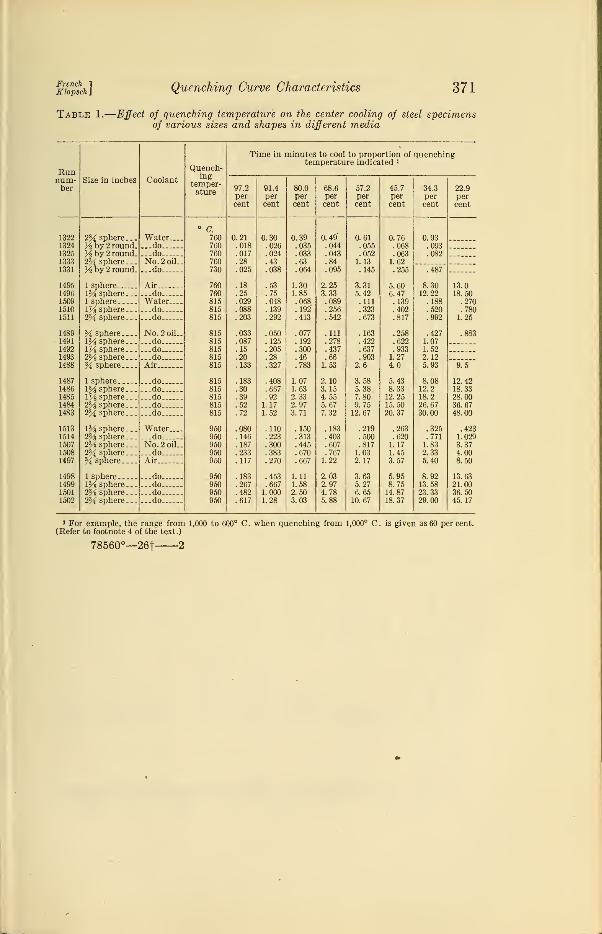
FrenchKlopsch. Quenching Curve Characteristics 371
Table 1.
—
Effect of quenching temperature on the center cooling of steel specimensof various sizes and shapes in different media
Runnum-ber
Size in inches Coolant
Quench-ing
temper-ature
Time in minutes to cool to proportion of quenchingtemperature indicated 1
97.2
percent
91.4
percent
80.0percent
68.6percent
57.2
percent
45.7percent
34.3
percent
22.9
percent
13221324132513331331
14951496150915101511
14891491149214931488
14871486148514841483
15131514150715081497
1498149915011502
2% sphere...Vi by 2 round.H by 2 round.2% sphere...Vi by 2 round.
1 sphere...1% sphere.1 sphere...
Wz sphere.2% sphere.
%A sphere..1% sphere.V/s sphere.
2H sphere.% sphere..
1 sphere. ..
W% sphere.
1J4 sphere.2% sphere.2% sphere
.
\Y% sphere.
2Y% sphere.2% sphere.2% sphere.% sphere..
1 sphere. ..
\y% sphere.2% sphere.2% sphere.
Water......do...doNo. 2 oil.
...do
Air...doWater......do...do
No. 2 oil.
...do
...do—doAir
...do
...do
...do—do...do
Water......doNo. 2 oil.
...doAir
... do.....
...do
...do
...do
a760760760760730
760760815815815
815815815815815
815815815815815
950950950950950
950950950950
0.21.018.017.28.025
.18
.25
.029
.088
.203
.033
.087
.15
.20
.133
.183
.30
.39
.52
.72
.080
.146
.187
.233
.117
.183
.267
.482
.617
0.30.026.024.43.038
.53
.75
.048
.139
.292
.050
.125
.205
.28
.327
.667
.921.171.52
.110
.223
.300
.383
.270
.453
.6671.0001.28
0.39.035.033
1.301.85.068.192.413
.077
.192
.300
.46
.783
1.071.632.332.973.71
.150
.313
.445
.670
.667
1.111.582.503.03
0.49.044.043.84.095
2.253.33.089.256.542
.111
.278
.437
.661.53
2.103.154.555.677.32
.183
.403
.607
.7671.22
2.032.974.785.88
0.61.055.052
1.13.145
3.315.42.111.323.673
.163
.422
.637
.9032.6
3.585.387.809.7512.67
.219
.500
.8171.032.17
3.635.276.6510.67
0.76.068.063
1.62.255
6.47.139.402.817
.258
.622
.9331.274.0
5.438.3312.2515.5020.37
.263
.6201.171.453.57
5.958.7514.8718.37
0.93.093.082
487
8.3012.22
.4271.071.522.125.93
8.0812.218.226.6730.00
.325
.7711.832.335.40
8.9213.5823.3329.00
13.018.50
.270
.7801.25
12.4218.3328.0036.6748.00
.4231.0293.374.008.50
13.6321.0036.5045.17
1 For example, the range from 1,000 to 600° C. when quenching from 1,000° C. is given as 60 percent.(Refer to footnote 4 of the text.)
78560°—26f 2
372 Technologic Papers of the Bureau of Standards Vol. 20
«!
»o m co eoCOCOCO00l>- (NtONHMlOCCHTlllO!
,gS§!
O<»
a,aCO
'a
a
=0 3Qi 50}
a
8 .a
§§ Eh
;§8o
ON MNOSOO
;g3g
OO CN CO <N 00OCOONOOt SCO OCO COrf C©CHHOON OH ©<rH >* lO Ttl 00 rH rH i-H i
0000 OO »C «5 t^ICO i-H OON^INOI <N * MOOOIO
rH CO 00 OS rHOOMHOMt»>00<NCOTt<<0 00 rH
NiONINNWOMMiOiO MNNOMCONCOOOON00 001<NCOC0 50lOCM050>
O i-H CM CO "2 t~ (
lO Oi O CO 00OCMC0C0>0
OCO »OTt< CO K3(NIM«NlOOM00OHNN^COOO®tDON
»o 00 «£ CO 00QOOfflOlONO —I CS (M * iO iO
•OCMOCO^*ON00OCMCOCM-*
COMN^iOONOOINCqNOffl"O00 00O)HOTll'>f <o©OOOOOrHrHrHrHIN iNMOOOO'
HO * Tj< N rH I
OJtJUOMN® COCMCOt-WNOOHNM M»T«rHO>O rH rH CM CO «# <N © rH CM IN CO OOOOOOOOrHrHCM00 t^ © CO CO
Ohhnh!
MOHOOOOOONHiONN OOHOiOOOlONNNNCCHNSONOOOHHiNNMCOHH
OOrH rH rH
^ooi<5"*>(;oonooooorHrHrH(MCS)CM<MTt<CO-#0OOOOOOOOOOrH
IOON00iwococom-^iO'OMiolOOOOHHHNMO
ml^»oto
00 *' CO CO <N CM rH © CO CO CO IN OOOOOOCC^OCO'O'O-^'-^CO OOOCO-^'^COCOCOfNrH " cootHco
o^3
rSrSrS >CM<NINCM
«\m\m\(N CM IN (M N CN <N
^SSSe, ^^^^^^H2-|5r«rt5d ^rn'rn
l\H( ,Q jQ >»-"
»\m\t--\t-\t~\«\co\ rH V*« m\
COOS^iOCOt^OOTttKlCOCO ' © ' H00C^?q«C4C<5'*'*C<3O»lNl0iOHNHN'-INC0!0KlO«NT(<CPINCMINNlNINTHrg-rtHr^COr^Ttl ••0000©00©vO00*O©C0O (1)H HtDN NOOH H-*M^'* ffl|0'*iHlNrHrHrHrHrHO g H H OS H » CgOOrHOrHrHOrHrHrHrH (h<NCM<NCNININCM<N(N»010 g IN IN IN CM
French"
Klopscfi.
Quenching Curve Characteristics 373
looqio oo«OHHrtNcoo 00 000cooir>: •dHiO
xoo !oi- itiit!HOtH 1 1 I I 1 1 d 00 Q coco ! d
0010cot^x
10000 '
cs
~H<N«8
(NH 1
Tf O 1
8
ooo !©<£> 1 1 1 1 1
lt~Tj< 1 1 1 I I 1 O coo1
t^. IQ 1 de»o»d(NO-*
iOO 1
IN
o-*o» 00 1^
c3
c?S;
X•oCO
i©X "5 igg<M !!:'!!: d HO d MOO dcoooCM-»i< C*
1 IQ >C 1
I
Q
ICOC5-*
1
OCi COCO^£ I 10
woo iO^ 1 1 %> HO 0;. 00100l-O
£
l-0-1<NiHCOOO
• COCO 1
a1
I^O
l_
HMCOco-o <N
10 CO
iooo0006
cs »o
liOCO 1 1 1 1 1
ioico 1 1 1 1
1 c4 c^5 1 8
11
too 'c
«
Vi©
1C
MOOx'id(N*es co Tt<
"3c
w
d
§es
wooid —5
.-C-^l
'Xt-1 cq «o £'5
©eEh
TjiO
1-1 "0
c
1a©cEh"
»co>oIOoSiHM <N O
5a
2
Eh
>-oX>-0
cocoOOOOiO
COMN-Hi-iO0"5 r^ 10(SOOHO^O^N 0"
sCO-*
cs
OOSO<N CO -*'
IN (NO ©idNUSO 1-1 rt 1-1 T-| N CO
»oco c(MX O CO
C3
<N(NCO-<»<-«*<iCt^CiH
00
COOON
a
(NXOr-' r-l idHHM
d10
r(«N
00 C(SOW IH
CO r-OCNHOlOrtOWOOrtr-Ir-I>-ICN1CO-*I1^
06 X
t^oococdi-i— 1-1 cs
l>
<N
CO
X**1-lO
ss§ 1010(00 <N
CO CO COCO CO COCO CO CO
COXCi c OiOOOC^MMIM
0000000000"Ofl'O'O'CiC'C'C'S'O
£<
±B(N CNI <N (N CO CO
>> >> >> >. >> >>?",0,0,0.0,0,0 >>
s I
, X — UO -j: ~ -~z O -1 X CO <
lCC'*MT;XMN'*TfTfTfi'^'*iOIrtrti-l |=cOi-lrti-li-lrtrti-(i-li-<
Eho o
~ pa
©K
o
374 Technologic Papers of the Bureau of Standards [Voito
4. EVALUATION OF THE "TIME-CONSTANT"
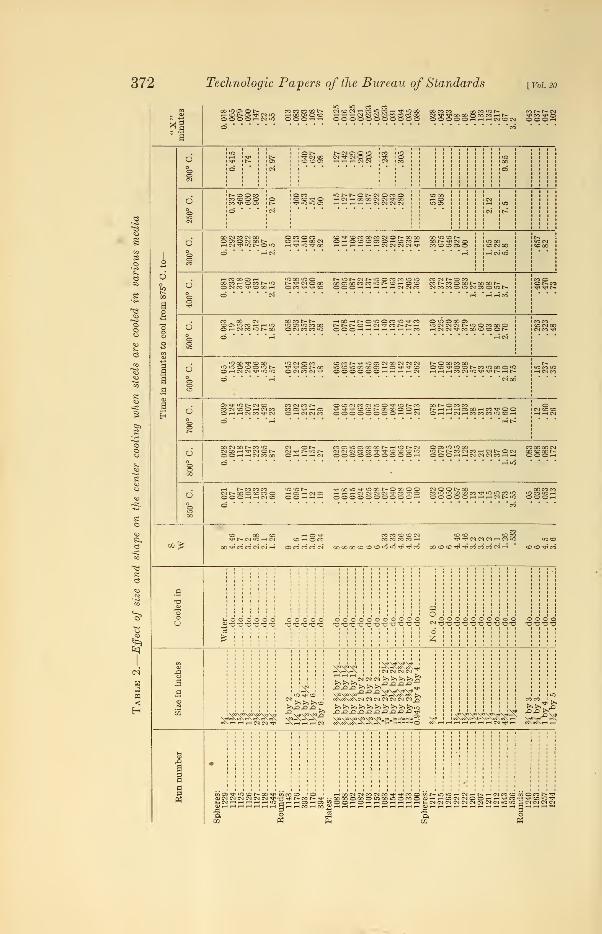
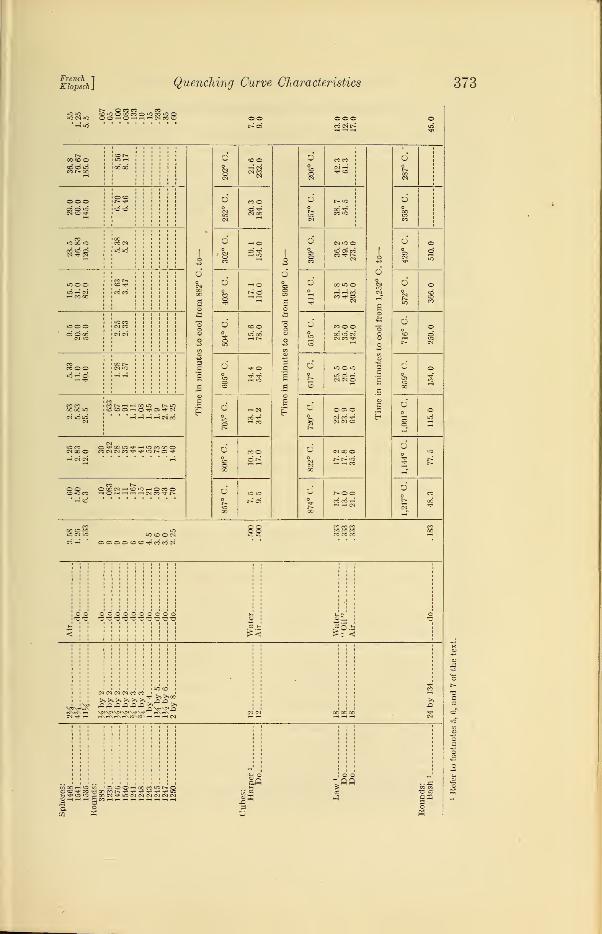
• In Table 2 are tabulated the times required for cooling from 875° C.
to various lower temperatures. These numerical values were secured
from a large number of cooling curves taken when quenching the
specified sizes and shapes into water, No. 2 oil, and air. Included
also are values taken from curves for large sections published by Law 5
and Bash; 6 Harper's data have not yet been published. 7 Fromthese data the values of C3 in equation (4) were calculated and it
was found that its numerical value depended not only upon the
coolant and the cooling interval, but also upon the surface per unit
of volume. Under such conditions the direct evaluation of this
constant for even one coolant involves a great deal of work, including
such extensive experiments that when completed they make the
evaluation unnecessary for there have been obtained experimentally
all required data. For this reason the results of the calculations
referred to are not here included.
Obviously what is needed is to evaluate C3 in terms of readily
determinable factors associated with the surface per unit of volumeand the coolant so that with a cooling curve for the center of one
size of the simple shapes immersed in a given coolant, curves can be
derived by means of simple calculations for various sizes and shapes
when quenched into the same coolant.
Without giving in detail the mechanism by which these relations
were developed, one feature should be mentioned. With the excep-
tion of the first drop in temperature, say, for an interval of 20° C,the cooling curves for various sizes appeared to closely follow the
relations represented by equation (4). More specifically, whenderiving time-temperature cooling curves for the center of large
sections from constants determined from experiments on small
samples it was found that the derived curves were in most cases
generally parallel to but offset at some distance from curves deter-
mined experimentally. The derived curves in practically all cases
showed more rapid cooling than was observed directly by experiment,
and the magnitude of this difference appeared to increase with the
section, and hence with decrease in the surface per unit of volume.
Consider for a moment that heat is first taken away from the
surface and an appreciable time elapses before there can be an
appreciable drop in temperature at the center. In small sizes
( high values of ^) where most rapid cooling is obtained this dif-
5 E. F. Law, "Effect of mass on heat treatment," Jour. Iron and Steel Inst., 97, p. 333; 1918.
6 F. E. Bash, "Forging temperature and rate of heating and cooling of large ingots," Trans. Am. Inst.
of Min. and Met. Engrs., "pyromefcry volume," p. 614; 1920.
7 The cooling curves at the center of the 12-inch cube quenched in water and also cooled in air were taken
from experiments recently carried out by J. F. Harper, Allis-Chalmers Manufacturing Co., Milwaukee,
Wis.
xiopsch] Quenching Curve Characteristics 375
ference will be very small, whereas in the relatively large sections
f small values of — \ when the surface is far removed from the center,
it will be large.
It is extremely difficult to determine the time required for the
first very small temperature drop at the center. Therefore, this
factor, which will hereafter be called "lag," will be denned for the
purpose of this report as the time required to drop a number of
degrees equal to 2 per cent of the cooling ranges (equals 17.1° C. for
a quenching temperature of 875° C. when the coolant is at 20° C).
Actually the "lag" increases with decrease in the surface per unit of
volume, and hence with increase in size of any one of the simple
shapes. (See fig. 3.)
Based on reasoning along this line and a study of the experimental
data summarized in the various tables and charts in this report the
following emperical relation was developed
:
T-x =y(JJ (5)
in which
T is the cooling time from the quenching temperature to anylower temperature (in this report expressed in minutes),
x is the "lag" in minutes; represents the cooling time for an
initial drop in temperature equal to 2 per cent of the cooling
range,
y is the "time constant."
S is the surface area (in this report given in square inches),
W is the volume (in this report given in cubic inches)
,
71 is the exponent depending only on the coolant; its numerical
values are the same as in all previous equations in this and
the preceding report on mass effects, already referred to in
the text.
With this equation the time-temperature cooling curves for the
center of various sizes of the simple shapes may be derived when the
steel is quenched into any ordinary coolant provided only two pieces
of information are available: (1) the exponent "n" must be knownfor the particular coolant under consideration; and (2) there must be
available an accurate center cooling curve for some one size of the
simple shapes when quenched from any temperature at or above
about 720° C. into this coolant. In other words, if this exponent
and one good cooling curve are available, curves can be derived for
the whole ranges of sizes and shapes quenched from temperatures
at or above 720° C.
Time-temperature cooling curves are not exceedingly difficult to
obtain for even with so-called drastic coolants, good results may be
376 Technologic Papers of the Bureau of Standards [ Vol. to
secured with ordinary pyrometer equipment and stop watches if the
experiment is carried out with moderately large sections which keep
down the center cooling velocities. The value of the exponent "n"can be determined, if not now known, by methods already described, 8
and when once obtained for a given coolant is fixed for the various
sizes and shapes and independent of the quenching temperature.
There then remain the "lag," x, and the " time-constant," y, for
evaluation before the time, T, from the quenching temperature to anylower temperature can be directly determined from equation (5).
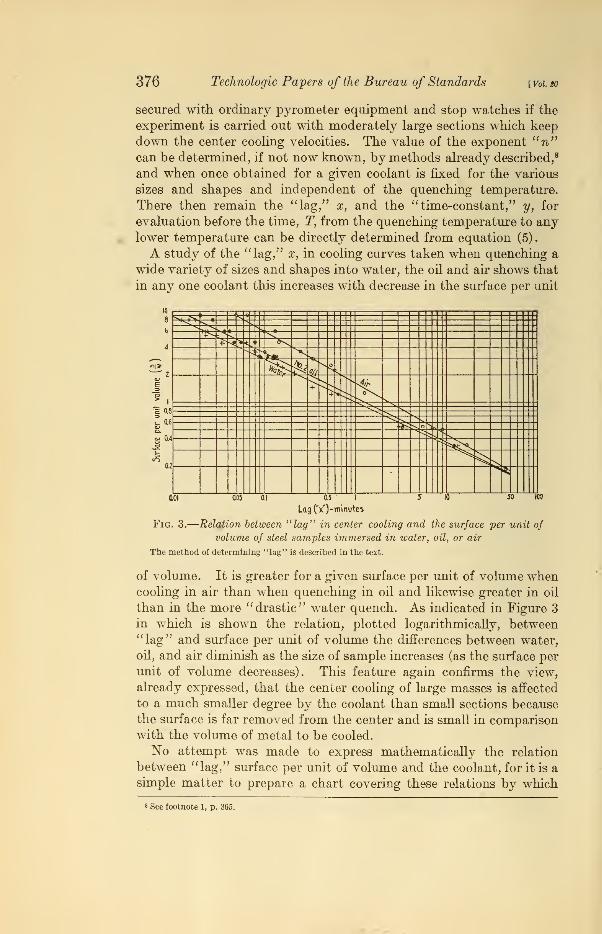
A study of the "lag," x, in cooling curves taken when quenching a
wide variety of sizes and shapes into water, the oil and air shows that
in any one coolant this increases with decrease in the surface per unit
0.5 I
Lag (Y)-minute^
Fig. 3.
—
Relation between "lag" in center cooling and the surface per unit of
volume of steel samples immersed in water, oil, or air
The method of determining "lag" is described in the text.
of volume. It is greater for a given surface per unit of volume whencooling in air than when quenching in oil and likewise greater in oil
than in the more "drastic" water quench. As indicated in Figure 3
in which is shown the relation, plotted logarithmically, between"lag" and surface per unit of volume the differences between water,
oil, and air diminish as the size of sample increases (as the surface per
unit of volume decreases). This feature again confirms the view,
already expressed, that the center cooling of large masses is affected
to a much smaller degree by the coolant than small sections because
the surface is far removed from the center and is small in comparisonwith the volume of metal to be cooled.
No attempt was made to express mathematically the relation
between "lag," surface per unit of volume and the coolant, for it is a
simple matter to prepare a chart covering these relations by which
8 See footnote 1, p. 365.
French]
Klopsch JQuenching Curve Characteristics 377
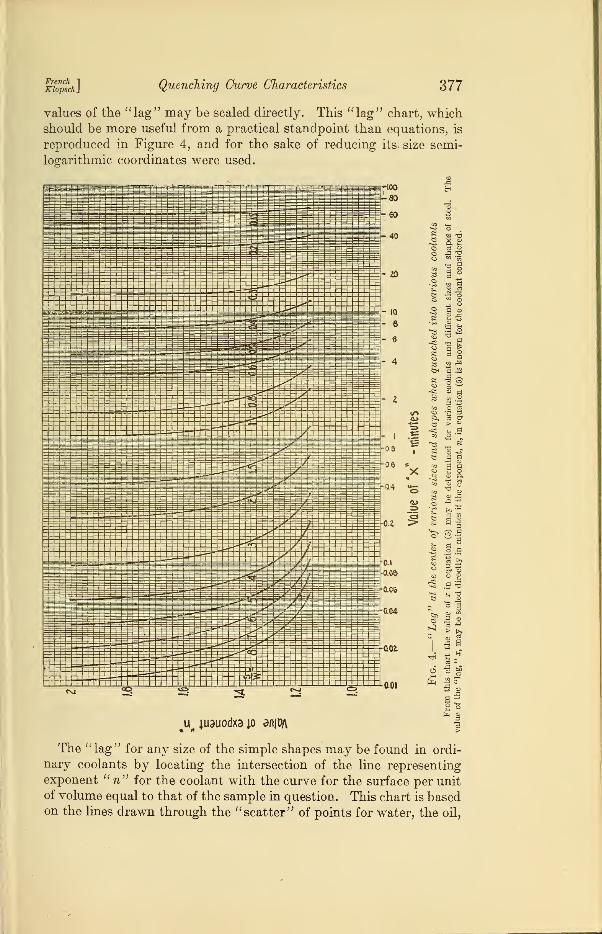
values of the "lag" may be scaled directly. This "lag" chart, whichshould be more useful from a practical standpoint than equations, is
reproduced in Figure 4, and for the sake of reducing its* size semi-
logarithmic coordinates were used.
o a <o
54,
^- | ,»r °=
u |U3uodxaio aniryv
c3 _O 3o
.2 ga g<D ft
"S s
a|
.2 -9
oCD M
-a *> &
1?
The "lag" for any size of the simple shapes may be found in ordi-
nary coolants by locating the intersection of the line representing
exponent "n" for the coolant with the curve for the surface per unit
of volume equal to that of the sample in question. This chart is basedon the lines drawn through the "scatter" of points for water, the oil,
378 Technologic Payers of the Bureau of Standards I Vol. so
and air in Figure 3. Each of the lines representing surface per unit
of volume in Figure 4 are therefore based on three points, those,
respectively, for water (n = 1.75), the oil (n—\A), and air (n,= 1.15).
Their exact curvature may, therefore, not have been obtained, butundoubtedly they are drawn very close to proper form because with
very slow cooling (n = approximately 1) the lag would be very large
so that each of the curves must bend sharply in the direction shown.
However, the principles involved in the preparation of this chart
are considered of more importance than the numerical values whichwill change for different metals.
Since x of equation (5) is now known for any ordinary coolant for
which the value, of the exponent "n" is available only the " time-
constant" y must be secured. The solution of equation (5) for y,
based on experiments with a variety of sizes and shapes, was carried
out and as shown in Figure 5, this is dependent only upon the cooling
interval, provided the final temperature is expressed as a proportion
of the initial (quenching) temperature. Average values for y are given
in Table 3. The direct application of equation (5) may now be con-
sidered as all terms except the time T have been evaluated.
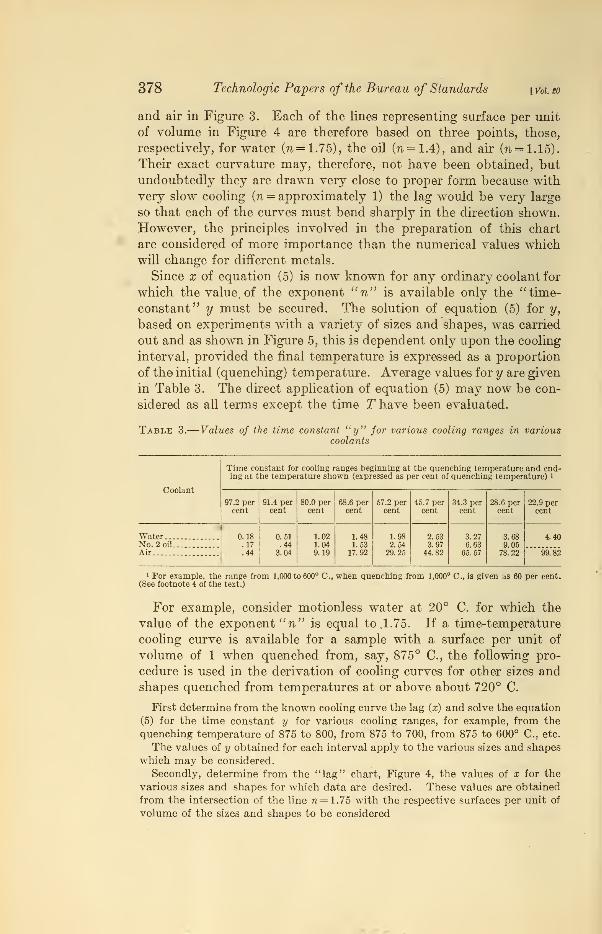
Table 3. Values of the time constant "y" for various cooling ranges in variouscoolants
Coolant
Time constant for cooling ranges beginning at the quenching temperature and end-ing at the temperature shown (expressed as per cent of quenching temperature) *
97.2 percent
91.4 percent
80.0 percent
68.6 percent
57.2 percent
45.7 percent
34.3 percent
28.6 percent
22.9 percent
Water. 0.18.17.44
0.51.44
3.04
1.021.049.19
1.481.53
17.92
1.982.5429.25
2.533.97
44.82
3.276.6365.57
3.689.0578.22
4.40No. 2 oil
Air.. 99.82
1 For example, the range from 1,000 to l
(See footnote 4 of the text.)
)° C, when quenching from 1,000° C, is given as 60 per cent.
For example, consider motionless water at 20° C. for which the
value of the exponent u n" is equal to .1.75. If a time-temperature
cooling curve is available for a sample with a surface per unit of
volume of 1 when quenched from, say, 875° C, the following pro-
cedure is used in the derivation of cooling curves for other sizes andshapes quenched from temperatures at or above about 720° C.
First determine from the known cooling curve the lag (x) and solve the equation
(5) for the time constant y for various cooling ranges, for example, from the
quenching temperature of 875 to 800, from 875 to 700, from 875 to 600° C, etc.
The values of y obtained for each interval apply to the various sizes and shapes
which may be considered.
Secondly, determine from the "lag" chart, Figure 4, the values of x for the
various sizes and shapes for which data are desired. These values are obtained
from the intersection of the line n=1.75 with the respective surfaces per unit of
volume of the sizes and shapes to be considered
French "j
Klopsch} Quenching Curve Characteristics 379
Third, to locate the cooling curve, substitute in equation (5) the proper value
of x for the size considered, the proper value of surface per unit of volume, and the
value of y for each of the cooling intervals desired and solve in each case for the
cooling time T.
If these values of T are plotted against the final temperature expressed as a
proportion of the cooling range a time-temperature cooling curve will be obtained
which will represent the cooling of the particular size and shape considered whenquenched from any temperature at or above about 720° C.
10
E
I 6
1& A
Water quench
1 » » < i ) 3 C)
5In
5 SIn
1 5 St
In n
l
!
1
i
)
) >
II
( I
i
II
V <
C
o >
l
i
]
1
»
>
1
<>
U
i!
II
!!
1
1
(
\
i
1
i
\
411
i
i
C c
)
> > 3 D
T
3
ho. 2 oil cvench
) ) > >
<J>
In
sD
m3
. i
5 v
?
In
CD
1 > > ii <> il
> I > <
r
>
V ) ii c o05050505050505050505 10 10 10 10 Wo n o to o io o io
Time -constant (V)
Air cool
i II < 1 i n (> 3 3
KIn
5 3 S -
In Vn hi
<6JJ
1 I
>
>
1
)
(
) C I J : O O
\ \ }
c* °°!f>°IS
o ( ) < )
60 100
Time -constant (V)
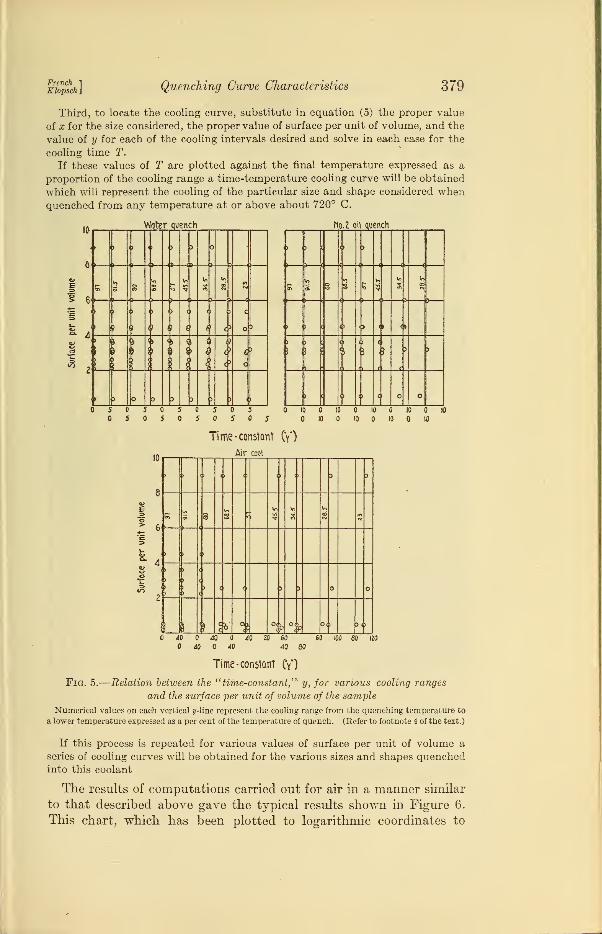
Fig. 5.
—
Relation between the "time-constant,"' y, for various cooling ranges
and the surface per unit of volume of the sample
Numerical values on each vertical y-line represent the cooling range from the quenching temperature to
a lower temperature expressed as a per cent of the temperature of quench. (Refer to footnote 4 of the text.)
If this process is repeated for various values of surface per unit of volume a
series of cooling curves will be obtained for the various sizes and shapes quenchedinto this coolant
The results of computations carried out for air in a manner similar
to that described above gave the typical results shown in Figure 6.
This chart, which has been plotted to logarithmic coordinates to
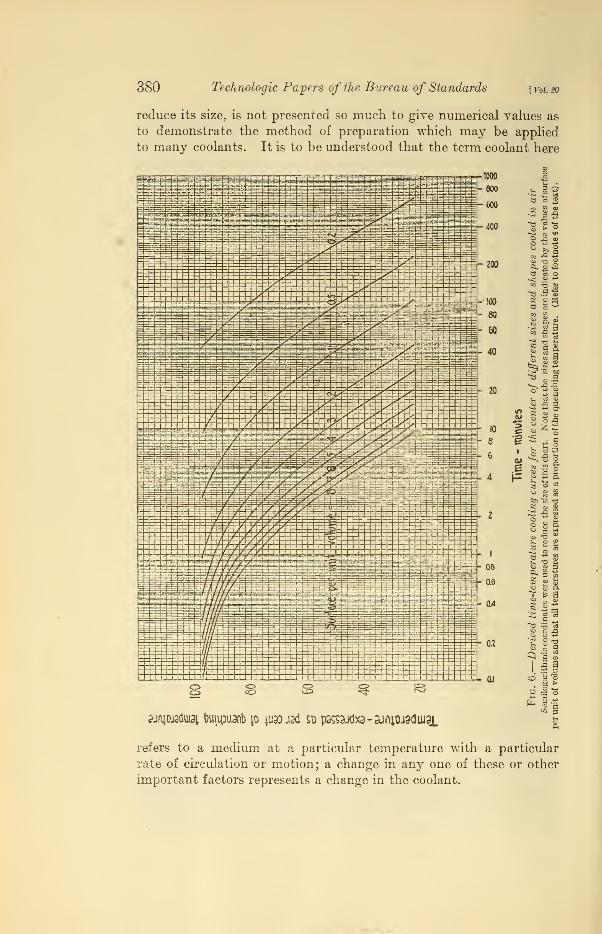
380 Technologic Papers of the Bureau of Standards [ Vol. 20
reduce its size, is not presented so much to give numerical values as
to demonstrate the method of preparation which may be applied
to many coolants. It is to be understood that the term coolant here
ajfyiuaduiai bu\ipu3f\b p \\m jiad sb p3£3Jdx3-3afuai9diu9i
refers to a medium at a particular temperature with a particular
rate of circulation or motion; a change in any one of these or other
important factors represents a change in the coolant.
French '
Elopsch .
Quenching Curve Characteristics
IV. GENERAL DISCUSSION AND SUMMARY
381
Admittedly, the described methods and relations are empirical
for they are not based on the fundamental constants of materials,
but upon direct experimental determination of cooling times under
a variety of conditions. Their accuracy or that of similar computa-
tions for other coolants depends upon the accuracy attained in the
experiments upon which they are based. For this reason it would
be unwise, under ordinary conditions, to base calculations for a given
coolant on a single cooling curve. A safer course would be to secure
curves for at least two widely different sizes and shapes and in both
cases to demand at least two consistent experiments.
100 200 300
Time - minutes
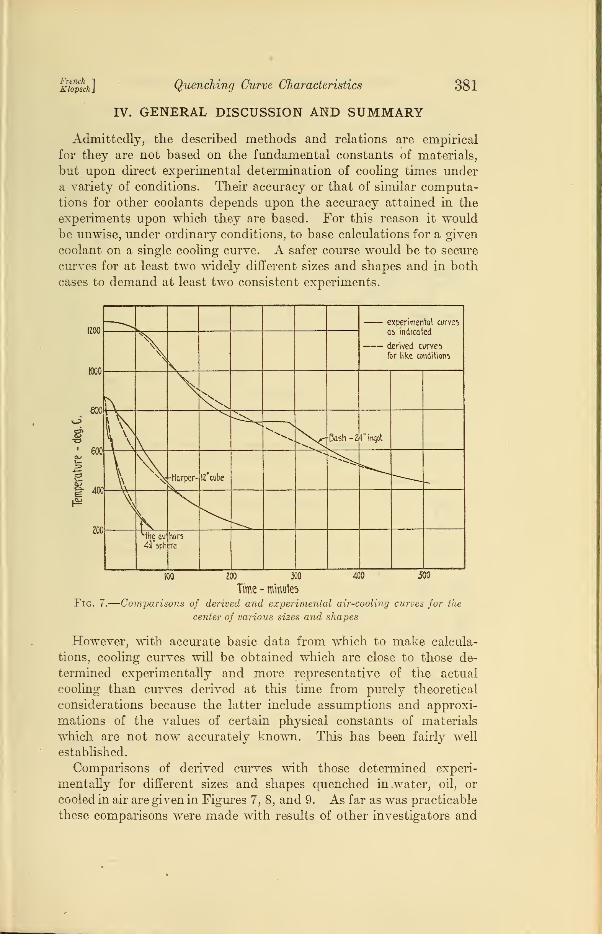
Fig. 7.
—
Comparisons of derived and experimental air-cooling curves for the
center of various sizes and shapes
However, with accurate basic data from which to make calcula-
tions, cooling curves will be obtained which are close to those de-
termined experimentally and more representative of the actual
cooling than curves derived at this time from purely theoretical
considerations because the latter include assumptions and approxi-
mations of the values of certain physical constants of materials
which are not now accurately known. This has been fairly well
established.
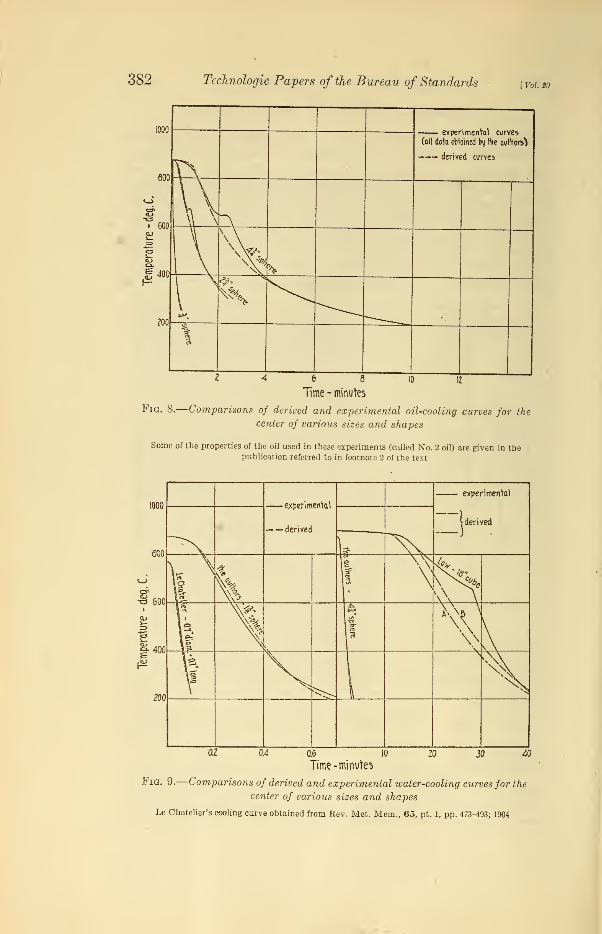
Comparisons of derived curves with those determined experi-
mentally for different sizes and shapes quenched in .water, oil, or
cooled in air are given in Figures 7, 8, and 9. As far as was practicable
these comparisons were made with results of other investigators and
382 Technologic Papers of the Bureau of Standards \ Vol. 20
Fig. 8.
6 6
Time - minutes
-Comparisons of derived and experimental oil-cooling curves for the
center of various sizes and shapes
Some of the properties of the oil used in these experiments (called No. 2 oil) are given in thepublication referred to in footnote 2 of the text
0.6 JO
Time -minutes
Fig. 9.
—
Comparisons of derived and experimental vmter-cooling curves for the
center of various sizes and shapes
Le Chatelier's cooling curve obtained from Rev. Met. Mem., 65, pt. 1, pp. 473-493; 1904
xi^sch] Quenching Curve Characteristics 383
show that direct experimental confirmation is available for the
described empirical relations covering a wide range in conditions.
Naturally the derived values do not closely check all published
results for like quenching conditions, but agreement is obtained
with representative experimental data other than that obtained bythe authors.
It will be observed in Figures 7, 8, and 9 that there may be ap-
preciable variations between the derived and experimental cooling
curves in the zones of thermal effects of transformations. There is
no reason why these thermal effects should not be taken into account
in determining the time-constants for a given coolant so that a
closer approximation will be obtained throughout the entire cooling
range, particularly for large masses. This was not done by the
authors because the magnitude and position of the transformations
vary with different steels, and as already stated in this report there
were variations in composition of the steels from which the large
and small specimens were prepared. The important feature to beemphasized is the similarity in a given coolant between the center
cooling for various sizes and shapes which enables a resolution of
cooling curves into two major components both related to the surface
per unit of volume of the sample (1) an initial period called "lag"
which represents 2 per cent of the cooling range and (2) thereafter
the typical time-temperature changes characteristic of the particular
coolant.
Attention should be called to Law's water-cooling curve for an
18-inch cube in Figure 9. The derived cooling curve for such a cube,
based on the average "lag" from Figure 3, is shown by the dotted
line A in Figure 9, which is generally parallel to but offset from the
experimental curve given by Law. In other words, the major dif-
ference between the two is due entirely to the initial period or howsoon after immersion in the wate** an appreciable center cooling begins.
Comparison of Law's water-cooling and oil-cooling curves for the
same cube shows the "lag" to be greater in water than in the less
"drastic" oil quench. There is considerable evidence from various
sources that this is improbable or at least associated with someunusual or not fully defined conditions in his experiments. If the
actual "lag" scaled from Law's curve is used in place of the average
lag for this size of cube given in Figure 3, the dotted line B in Figure 9
is obtained and closely agrees with the experimental values.
It should, perhaps, be pointed out that for large masses small
differences in the surface per unit of volume result in relatively large
changes in the "lag" due to the fact that the relation between these
two factors is such that when plotted to logarithmic coordinates a
straight line is obtained as in Figure 3. In other words, a super-
sensitive set of conditions are encountered, and unless these are
384 Technologic Papers of the Bureau of Standards [Vol.20
accurately defined when experimenting with large masses appreciable
variations are to be expected in duplicate cooling curves, which may be
generally parallel to but offset at some distance from each other.
Special attention should be called to the fact that the values of the
exponent "n" of equation (5) are the same as, and apply equally well
to, the relations between mass and cooling velocity previously
described 9 as to the time-temperature relations dealt with in this
report. This adds material weight to the validity of the described
relations.
Another feature of interest lies in the relation between this coolant
coustant, n, and the "lag." Were it not for the fact that it is im-
practicable at this time to attain the desired degree of accuracy in
the experimental work, the value of "n" for a coolant might be
determined directly from Figure 4 after measuring the lag in the man-ner described when cooling some one size of the simple shapes in that
coolant.
Aside from the determination of cooling times in typical coolants,
the methods outlined make possible a correlation of data irrespective
of size (of the simple shapes) and quenching temperature (when at
or above about 720° C.) which heretofore has been exceedingly
difficult if not impracticable.
There follows a summary of the main features of the described
experiments.
1. In a given coolant the center of a sample of given size and shape
cools in equal times to equal proportions of the cooling range. Thus,
if temperatures are expressed as a proportion of the interval between
the quenching and coolant temperatures, results obtained are directly
applicable to any quenching temperature (when above the trans-
formations) .
2. When quenching various sizes of the simple shapes into a
given coolant, the center cooling time minus a factor called "lag,"
is inversely proportional to the surface per unit of volume raised to
some power greater than 1 and less than 2. If T= cooling time,
S= surface area, W= volume, n = & constant, depending upon the
coolant, y= the "time-constant" which, for a given coolant depends
only on the cooling interval considered, expressed as a proportion of
the cooling range, and cc = "lag," which is the time required for the
center to fall 2 per cent of the cooling range, then these relations
may be represented by the equation
» See footnote 1, p. 365.
xiopsch] Quenching Curve Characteristics 385
3. "Lag," which refers to the time required for the temperature
at the center to drop 2 per cent of the cooling range, increases with
the size of sample and hence with decrease in the surface per unit
of volume. It is greater for a given size and shape of > sample in
slow coolants such as air than in oil, and likewise greater in oil than
in the more "drastic" water quench. While an equation can be
derived giving "lag" in terms of the coolant exponent n and the
surface per unit of volume this has not been included in this report;
instead a "lag chart" (fig. 4) was prepared from which values may be
scaled directly for various sizes and shapes quenched into various
coolants, provided only the coolant-constant n is known.4. From this chart and equation (5), above, time-temperature
cooling curves may be derived for the center of various sizes and
shapes quenched from various temperatures into ordinary coolants,
provided only the coolant constant is known and there is available
a cooling curve on some one size quenched into this coolant from
some one temperature. It is, however, generally safer to base such
calculations on determinations from several sizes if reasonably good
accuracy is to be obtained.
V. ACKNOWLEDGMENTS
Acknowledgment is made to T. E. Hamill, laboratory assistant,
for his assistance in carrying out the experimental work, and to
J. Fletcher Harper, of the Allis-Chalmers Manufacturing Co., Mil-
waukee, Wis., for supplying prior to publication the cooling curves
on the 12-inch cube.
Washington, December 4, 1925.