Embed Size (px)
Citation preview
Department of Chemical Engineering, Budapest University of Technology and Economics, H-1521
Budapest, Hungary
Research activities
CAPE-Forum, Veszprem, 2004

• DISTILLATION AND ABSORPTION• Determination of Vapour-Liquid Equilibria and design of Packed Columns.• Development on distillation and absorption technologies• Modelling and calculation of thermodynamic properties• Modelling of batch and continuous countercurrent separation processes
• EXTRACTION AND LEACHING• Kinetics of Soxhlet-type and Supercritical Solid-Liquid Extraction of Natural
Products. Mathematical modelling and optimization of the process.• Supercritical fluid extraction equipment and R&D capabilities
• REACTIONS• Mathematical modelling of residence time distribution and chemical reactions
• MIXING OF LIQUIDS

• PROCESS DESIGN AND INTEGRATION
• Feasibility of distillation for non/ideal systems• Hybrid separation systems• Reactive distillation• Design of Energy Efficient Distillation Processes• Energy integrated distillation system design enhanced by heat
pumping and dividing wall columns• Energy recovery systems• A global approach to the synthesis and preliminary design of• integrated total flow-sheets• Process Integration in Refineries for Energy and Environmental
Management

• CONTROL AND OPERABILITY• Assessing plant operability during process design• Transformation of Distillation Control Structures• Control of units in recycle
• ENVIRONMENTALS• Waste reduction in the Chemical Industry
• CLEAN TECHNOLOGIES• Membrane separations• Cleaning of waste water with physico-chemical tools.• Solvent recovery• Synthesis of mass exchange networks with mixed integer
nonlinear programming • Economic and controllability study of energy integrated separation
schemes• Process synthesis of chemical plants
Department of Chemical Engineering, Budapest University of Technology and Economics, H-1521 Budapest, Hungary
Selected topics of our CAPE activities:Analysis of energy integrated separations
and Synthesis of mass exchange networks
Mizsey, P., Z. Szitkai, Z. Fonyo
CAPE Forum 2004Challenges for East-West European Cooperation in
Process Modelling, Control, Synthesis and Optimization13-14 February 2004, Veszprém, Hungary

• Posters:

Integrated process design
• Challenge in chemical engineering
• Economical and environmental aspects
• Heat integration (HEN) & mass integration (MEN)
• Several synthesis strategies
• The design needs CAPE

Analysis of energy integrated separations(distillation based)
Budapest University of Technology and EconomicsDepartment of Chemical Engineering
CAPE Forum 2004Challenges for East-West European Cooperation in
Process Modelling, Control, Synthesis and Optimization13-14 February 2004, Veszprém, Hungary

Classical distillation schemes for ternary mixture
Col.1ABC
Col.2
A B
C
BC
L1 D1 L2 D2
Q2
B2
Figure 1. Direct sequence (D)
Col.1
ABC
Col.2
A
BC
AB
Figure 2. Indirect sequence (I)
Direct sequence
Indirect sequence
Base case
for comparison

Heat integration
Forward heat integrationdirect sequence (DQF)
Backward heat integrationdirect sequence (DQB)
Col.1`ABC
Col.2
A B
C
BC
L1 D1 L2 D2
Q2
B2
Figure 3. Direct sequence withforward heat integration (DQF)
Col.1
ABCCol.2
A B
CBC
L1 D1 L2 D2
Q2
B2
R1=L1/D1
V2
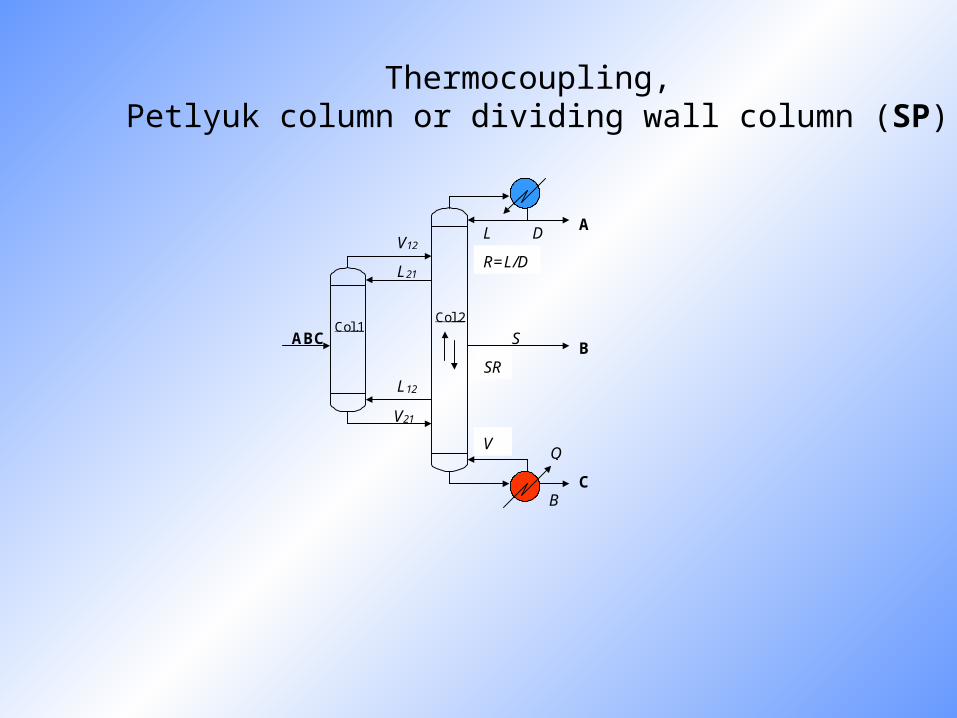
Thermocoupling, Petlyuk column or dividing wall column (SP)
Col.1Col.2
ABC
A
B
C
V12
V21
L21
L12
S
Q
B
L D
V
R=L/D
SR

Sloppy separation sequences
Col.1
ABC
Col.2
A
B
C
AB
BC
B
L D
S
Q
Forward heat integration (SQF)

Col.1
ABC
Col.2
A
B
C
AB
BC
L D
S
Q
B
Sloppy separation sequence, backward heat integration (SQB)

Mixture: ethanoln-propanoln-butanol
Equimolar feed composition (0.333, 0.333, 0,333)
Product purity specification: 99 m%
Case study

-20
-10
0
10
20
30
40%
D base case
I
DQF DQB SP SQF SQB
Comparison of TAC savings (%)

Controllability study
•steady state indices: Niederlinski index, Morari index, condition number, relative gain array
•Selection of controlled variables & manipulated variables,
•degrees of freedom analysis
•dynamic evaluation: open-loop & closed-loop

Studied Schemes NI MRI CN 11 22 33
D-(D1-L2-B2) 1.137 0.099 8.890 1.000 0.880 0.880
D-(L1-D2-Q2) 1.995 0.065 32.113 1.000 0.500 0.500
D-(L1-D2-B2) 1.865 0.234 4.934 0.580 0.540 0.920
DQF-(D1-L2-B2) 1.136 0.024 36.320 1.000 0.880 0.880
DQF-(L1-D2-Q2) 1.890 0.033 21.290 1.000 0.530 0.530
DQF-(L1-D2-B2) 1.678 0.226 5.240 0.586 0.595 1.020
DQB-(D1-L2-B2) 1.093 0.023 39.660 1.000 0.910 0.910
DQB-(L1-D2-Q2) 2.283 0.040 18.110 1.000 0.440 0.440
DQB-(L1-D2-B2) 1.540 0.246 5.040 0.647 0.645 1.000
SP-(D-S-Q) 3.515 0.182 6.890 1.000 0.320 0.280
SP-(L-S-B) 7.438 0.089 14.380 0.130 0.570 0.990
SQF-(D-S-Q) 6.470 0.010 137.400 1.000 0.250 0.150
SQF-(L-S-B) 4.030 0.008 158.100 0.250 0.250 0.998
SQB-(D-S-Q) 5.080 0.038 33.310 0.997 0.470 0.196
SQB-(L-S-B) 1.287 0.022 64.388 0.770 0.827 1.000
Steady state controllability indices

• base case (D) and heat-integrated schemes (DQF and DQB) show less interactions,
• (D1-L2-B2) manipulated set proves to be better than (L1-D2-Q2) and (L1-D2-B2) for D, DQF and DQB
Evaluation of steady state indices
• serious interactions can be expected for the sloppy schemes (SQF & SQB) and for the Petlyuk column (SP)

Dynamic simulations
Open composition control loops:
• quite similar dynamic behaviour but
• sloppy backward heat integrated (SQB) is the slowest scheme

0.975
0.980
0.985
0.990
0.995
0 10 20 30 40 50 60 70
Time (unit)
Pro
duct
mol
e fr
actio
n
99.5
100.5
101.5
102.5
103.5
104.5
Fee
d ra
te (
kmol
/hr)
Ethanol (A)Propanol (B)Butanol (C)
A
B
C
Feed rate disturbance
Open loop transient behaviour of Petlyuk column for feed rate disturbance
Petlyuk column, open loop, feed rate

0.977
0.981
0.985
0.989
0.993
0 10 20 30 40 50 60 70 80 90
Time (unit)
Pro
duct
mol
e fr
actio
n
99.5
100.5
101.5
102.5
103.5
104.5
105.5
Fee
d ra
te (
kmol
/h)
Ethanol (A)Propanol (B)Butanol (C)
A
B
C
Feed rate disturbance
Open loop transient behaviour of DQB scheme for feed rate disturbance
Heat integrated (DQB) column, open loop, feed rate
Evaluation of closed composition control loops:
overshoot, settling time, and their product are evaluated

0.9897
0.9898
0.9899
0.9900
0.9901
0.9902
0 5 10 15 20 25 30 35 40
Time (unit)
Prod
uct m
ole
frac
tion
99
102
105
108
Feed
rate
(km
ol/h
r)
Ethanol(A)Propanol(B)Butanol(C)
Feed rate disturbance
Closed-loop transient behaviour of Petlyuk column for feed rate disturbance(L-S-B )
Petlyuk column, closed loop (L-S-B), feed rate

0.9895
0.9898
0.9900
0.9903
0 5 10 15 20 25 30 35 40 45 50 55
Time (unit)
Pro
duct
mol
e fr
actio
n
99.5
101.5
103.5
105.5
Fee
d ra
te (
kmol
/h)
Ethanol (A)Propanol (B)Butanol (C)
Feed rate disturbance
Closed-loop transient behaviour of DQB scheme for feed rate disturbance(D1-L2-B2 )
Heat integrated (DQB) column, closed loop (D-L-B), feed rate

Closed loop dynamic simulations
•Simple energy integration (heat integration) doesn’t influence dynamic behaviour compared to the non-integrated base case
•The cases, where material and energy flows (energy integration) go into the same direction (DQF, SQF), are better than the opposite
•more complicated systems: higher detuning factor is needed due to stronger interactions (they became slower in closed loop)

Conclusions
•with energy integration about 35% TAC saving can be realised
•simple heat integration shows the best economic and controllability features
•sloppy schemes show good economic features but the selection is made according to their different controllability features (SQF,SQB)
•example also for the complexity of the process design: economic and controllability features are to be simultaneously handled
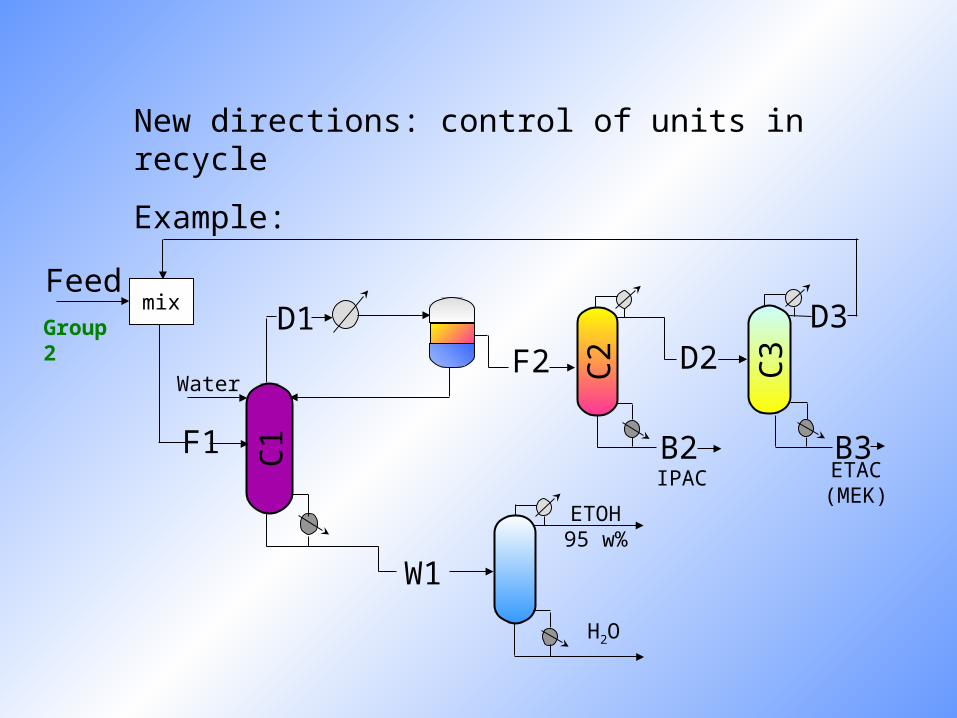
New directions: control of units in recycle
Example:
Water C2
IPAC
D2
B2
C3
ETAC(MEK)
B3
D3
ETOH95 w%
H2O
Feedmix
C1F1
W1
D1F2
Group 2

Synthesis of Mass Exchange NetworksUsing Mathematical Programming
Budapest University of Technology and EconomicsDepartment of Chemical Engineering
CAPE Forum 2004Challenges for East-West European Cooperation in
Process Modelling, Control, Synthesis and Optimization13-14 February 2004, Veszprém, Hungary

Outline
I. Mass Exchange Network Synthesis (MENS)
A Extension of the MINLP model of Papalexandri et al. (1994)
B Comparison of the advanced pinch method of Hallale and Fraser (2000) and the extended model of Papalexandri et al.
C New, fairly linear MINLP model for MENS
Approach:Mixed Integer Nonlinear Programming (MINLP)optimisation software: GAMS / DICOPT
II. Rigorous MINLP model for the design ofdistillation-pervaporation systems
III. Rigorous MINLP model for thedesign of wastewater strippers

I. Mass Exchange Network SynthesisEl-Halwagi and Manousiouthakis, AIChE Journal, Vol 35, No.8, pp. 1233-1244
21
NR
ysi
2
NS=NSE+NSP
yti
xsj
xtj
1
RICH
STR
EAM
S
LEAN STREAMS
MASS EXCHANGENETWORK
. . .
.
.
.
Gi
yi=f(xj)
Mass integration for the analogy of the concept of heat integration. Absorber, extractor etc. network synthesis
(MSAs)
The synthesis task:Stream data + equipment data +equilibrium data + costing
Network structurelean stream flow ratesmin (Total Annual Cost, TAC)
Previous work:early pinch methods (no supertargeting)Water pinch: Wang & Smith (1994, 1995), Kuo & Smith (1998)El-Halwagi & Manousiouthakis (1989a)El-Halwagi (1997)
advanced pinch method (includes supertargeting)
Hallale & Fraser (1998, 2000)
sequential mathematical programming methodsEl-Halwagi (1997), Garrison et al. (1995)Alva-Argaez et al. (1999)
simultaneous mathematical programming modelsPapalexandri et al. (1994)Papalexandri & Pistikopoulos (1995, 1996)Comeaux (2000); Wastewater: Benkő, Rév & Fonyó (2000)
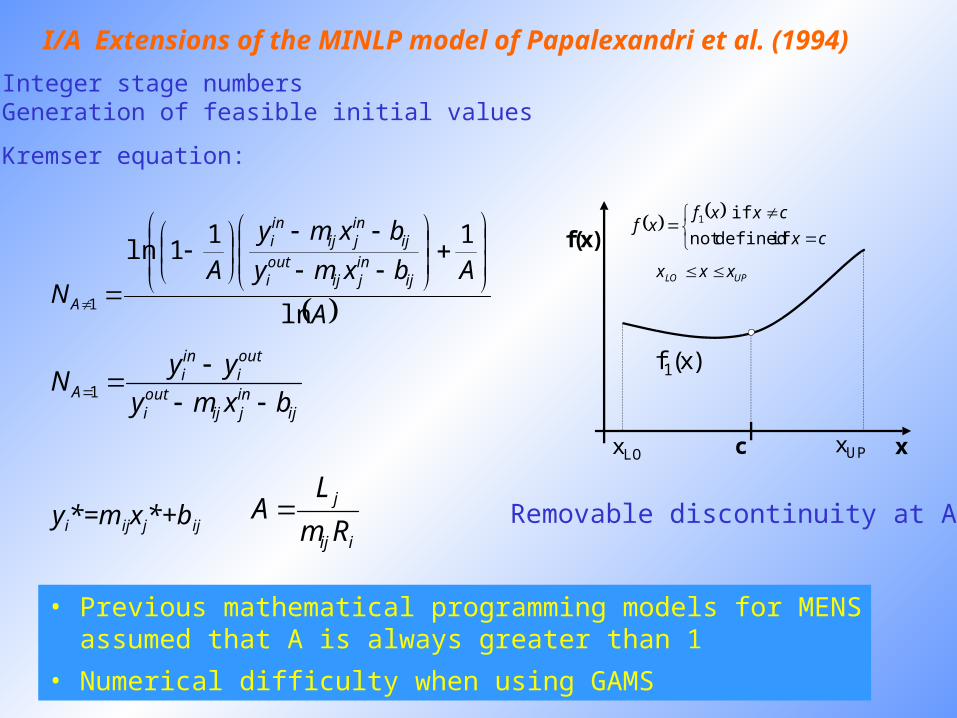
I/A Extensions of the MINLP model of Papalexandri et al. (1994)
• Integer stage numbers• Generation of feasible initial values
• Kremser equation:
A
Abxmy
bxmy
AN
ijinjij
outi
ijinjij
ini
A ln
111ln
1
iij
j
Rm
LA
ijinjij
outi
outi
ini
A bxmy
yyN
1
yi*=mijxj*+bij Removable discontinuity at A=1
cx
cxxfxf
if definednot
if 1
UPLO xxx
f(x)
xc
f1(x)
xLO xUP
• Previous mathematical programming models for MENS assumed that A is always greater than 1
• Numerical difficulty when using GAMS

Adopted literature methods
New method
(the models are nonconvex anyway)
11 1 AA NYNYN
y1 y2 y3
0.01 1000.99 1.010
yVcA 2)(
UPLO AAA
UPLO VVV
A U PA = 1
y = 0 y = 1y = 1
A L O
LOLO VAA 1 UPLO AAV 1
are linear but use 3 binary variables
nonlinear but uses 1 binary variable only
• Big-M formulation• Multi-M formulation• a Convex-hull like formulation• Raman & Grossmann (1991)• Simple logic formulation
Advantages:1. faster2. larger problems can be solved
Large nonconvex MINLP problems solved by DICOPT++:There exists a critical upper limit of the number of binary variables

Example Objective
function
Pinch solution of
Nick Hallale
Target / Design
MINLP
Solution
(CMINLP-CPinch) /
CMINLP *100
3.1 CAP 830 000 / 860 000 1 044 285 +17.6 %
3.2 CAP 448 000 / 455 000 453 302 -0.4 %
3.3 CAP 819 000 / 751 000 637 280 -17.8 %
3.4 CAP 591 760 / 637 000 637 000 0.0 %
4.1 CAP 296 000 / 298 000 255 068 -16.8 %
5.1 TAC 226 000 / 228 000 226 000 -0.9 %
5.2 TAC 226 000 / 228 000 226 000 -0.9 %
5.3 TAC 226 000 / 228 000 226 000 -0.9 %
5.4 TAC 49 000 / 49 000 50 279 +2.5 %
5.5 TAC 524 000 / 526 000 527 000 +0.2 %
6.1 TAC 692 000 / 706 000 720 000 +1.9 %
6.2 TAC 28 000 / 28 000 32 000 +12.5 %
6.3 CAP 591 000 / 539 000 536 000 -0.6 %
TAC-total annual cost in USD/yr, CAP–annualised capital cost in USD, C - cost
I/B Comparison of the advanced pinch method ofHallale and Fraser (2000)and the extended model of Papalexandri et al. (1994)
13 exampleproblems
have been solved
The two methods perform more or less the same.Why are the MINLP solutions not always better? The MINLP model is nonconvex.

I/C New, fairly linear MINLP model for MENS
The stagewise superstructure enables almost linear mass balance formulation
L1
R1
k=1 k=2concentrationlocation 1
concentrationlocation 2
concentrationlocation 3
R1-L1
R1-L2
R1-L1
R1-L2
L2
R2
R2-L1
R2-L2
R2-L1
R2-L2
y 1,T
x 1,S
y 2,S
y 1,S
y 2,T
x 2,T x 2,S
x 1,T x 1,1
x 2,1
y 1,1
y 2,1
x 1,2
x 2,2
y 1,2
y 2,2
x 1,3
x 2,3
y 1,3
y 2,3
Similar to the HEN superstructure of Yee & Grossmann (1990)

j
kjime
kiy
kiy
iR
,,1,,
stjstji
melasti
ysi
yi
R,
,,,
i
kjime
kjx
kjx
jL
,,1,,
stistji
mesj
xfirstj
xj
L,
,,,
1,, ki
yki
y
1,, kj
xkj
x
Ti
Ylasti
y ,
Tj
Xfirstj
x ,
si
Yfirsti
y ,
sj
Xlastj
x ,
0,,,,,
kji
zjikji
me
kjiz
kjijib
kjx
jim
kiy
kjidy
,,1
,,,,,,,,
kji
zkjiji
bkj
xji
mki
ykji
dy,,
1,,,1,,1,1,,
kji
kjiz
,,
maxU,,
kji
kjizU
,,,,
min
3/1
2/1,,,,1,,,,,,
kji
dykji
dykji
dykji
dykji
lmcd
kjime
kjilmcdK
kjimass W ,,,,,,
jj
Lj
ckji
kjimassfTAC
,,,,
Model equationsminimise s.t.
mass balances
concentration constraints
big-M constraints for the existenxe of the units
driving force constraints
constraints on the number of existing units
Chen’s approximation for the log mean conc differences
calculation of the mass of the exchangers
Only the lean stream mass balances are bilinear

Example problems
Extensions: stagewise exchangers, multiple components
Example 4.1 (Hallale, 1998)
S3
R1
S1
R2
Capital cost, based on exchanger mass: 284,440 USD
S2
4.08e-3
1e-3
7.1e-3
2.5e-3
5e-3
1 kg/s
2.48 kg/s
8e-3
4.05e-3
9.16e-3
5e-3
3.66e-32.5e-3 1.059e-2
3.26e-3
R3
R4
R5
0
2.5e-3 5e-3
1e-2
0.01
1.8 kg/s
2 kg/s
2.5e-3
1.7e-3 3.63e-3
8.48e-35.82e-33.86e-3
1.64e-3 3.77e-3 7.79e-3 1.7e-2
4 kg/s
0.5kg/s
1.5kg/s
3.5kg/s
S1
R1
S2
N=4.23
R2
2.169 kg/s
0.9 kg/s
0.1 kg/s
0.566 kg/s
0.487 kg/s
N=2.73
N=4.93
N=3.25
N=2.88
TAC=436,289 USD/yr
1.752 kg/s
0.022 kg/s 0.062 kg/s
Two component exampleThe new model is most suitable for solving single component
MENS problems, where packed columns are used exclusively.In this case, no special initialization is needed.

II. Rigorous MINLP model for the design of distillation-pervaporation systems
Vacuum vessel
retentate(dehydratedethanol)
permeate(mainly water)
Inlet ethanol~80 m/m% EtOH
Pervaporationunit
Distillationcolumn The synthesis task
is to determine:
• Nth of the column• feed tray position• reflux ratio• membrane structure• reflux scheme
Rigorous modelling: Dist. Column: 1 bar, MESH equations, tray by tray, Margules activity coeff. for the liquid phase, ideal vapour phase, latent heat enthalpy
Membrane unit: transport calculation is based on experimental data 1/3 m2 flat membranes, costing - industrial practice
Adequate costing equations, utility prices

Superstructure
Distillation column superstructure:Viswanathan & Grossmann (1993)
Membrane superstructure: new
N-1
N
bui
P2
refi
P1
ifeed
ibmax
imin
12
feed
column bottomproduct
columnfeed
mixer
RFF
P4recycledpermeate
P3
1
2
n
pump
to the vacuum pump
con-denser
heatexchanger
feed pump
i=1…m
ethanolproduct
to the nextsection of
membranes
recycledpermeate
distillatefrom thecolumn
max n pieces ofmembranemodules
permeate
retentate
max m sectionslike this
permeatesplitter
permeatecondensate
1/3 m2 flatPVA membranes
in blocks
The blocks (or modules)can be connected in both
series or parallel
Multiple level optimisation (successive refinement)enables reducing the number of binary model variables
Modelling of the membranes is based on experimental data

Industrial example
80theor.stages
reflux ratio:3.262
retentate (product): 920.7 kg/hr99.7 mass % EtOH
1175kg/hr
4
1
TAC=373,820 USD/yr
feed80 mass%
EtOH
992.7 kg/hr 94.56 mass%
D=0.875 m
72 kg/hr28.96 mass% EtOH
recycled permeate bottom product254.3 kg/hr
0.087 mass% EtOH
12 x 81 piecesof 1/3 m2 flat membranes
=324 m2 total(fixed industrial configuration)
total permeate recycling
membrane capital investment : 52,362 USDmembrane replacement : 83,936 USDcolumn capital investment : 18,05 USDcolumn operating cost : 219,472 USD
min=97.5%
Base case
84theor.stages
reflux ratio:1.38
retentate (product): 920.7 kg/hr99.7 mass % EtOH
1175kg/hr
7
1
TAC=328,124 USD/yr
feed80 mass%
EtOH
1046.3 kg/hr 91.44 mass%
D=0.679 m
125.6 kg/hr30.86 mass% EtOH
recycled permeate bottom product 254.3 kg/hr
0.087 mass% EtOH
12 x 107 piecesof 1/3 m2 flat membranes
= 428 m2 total
total permeate recycling
membrane capital investment : 69,058 USDmembrane replacement : 110,758 USDcolumn capital investment : 13,931 USDcolumn operating cost : 134,377 USD
min=97.5%
Optimised12% savings in the TAC
0
50
100
150
200
250
300
350
400
300 350 400 450 500
overall membrane surface in square meters
TAC
(tho
usan
d U
SD
/yr)
0,5
1
1,5
2
2,5
3
3,5
reflu
x ra
tio
membrane capital investment
membrane replacement
column capital investment
column operational cost
TAC
reflux ratio
base case optimally designedsystem
Membrane surface - TAC
100
150
200
250
300
350
400
94,5 95 95,5 96 96,5 97 97,5 98 98,5 99 99,5
specified ethanol yield (%)
TAC
(th
ou
sa
nd
US
D/y
r)
plant membrane cost
plant TAC
optimised membrane cost
optimised TAC
optimised column cost
plant column cost
Ethanol yield - TAC
Other calculationsusing the MINLPmodel

III. Rigorous MINLP model for the design ofwastewater strippers
1
20
18
2
3
17
.
.
.
feedtop product
bottom product
boil-up vapour
5 mol/sxacetone = 0.05xmethanol= 0.04xwater = 0.90xethanol = 0.01
Xwater0.999
water85%
Nth=?19
total condenser
Wilson binary interactionsIdeal vapour phaseTheoretical stages1 barLatent heat enthalpyAntoine vapour pressure
Wastewater cleaning by stripping
VLE calculation
Superstructure
Similar to the distillation columnsuperstructure of Viswanathan &Grossmann (1993)
Minor quantities of acetone,methanol, and ethanol in water

Conclusions:Complex evaluation of distillation based heat integrated separation schemes is presented. Beside the heat integration the new sloppy structures proved to be competitive.
New, fairly linear, MINLP modell for MENS is developed and succesfully tested for literature examples and industrial case studies.
Thank you for your attention.

Utility Temperature
level (ºC)
Price
($/ton, kWh)
Low pressure steam 160 17.7
Middle pressure steam 184 21.8
Cooling water 30-45 0.0272
Electricity -------- 0.1 $
Utility prices

Controllability investigations, design
– interactive and challenging part of process design or development.
Control structure synthesis* control targets are defined, * the sets of controlled variables and possible manipulated
variables are determined (degrees of freedom)* pairing of the controlled and manipulated variables: steady
state control indices, dynamic behaviours in the cases of open and closed control loops of the promising control structures.

Demonstration of interaction between design and control
• comprehensive design of five energy integrated separation schemes
• three-component-alcohol-mixture is separated in five distillation based energy integrated two-column separation systems:– two heat integrated distillation schemes
– fully thermally coupled distillation column (Petlyuk, Kaibel)
– sloppy separation sequences

Table 3. Results of the economic optimizationD I DQF DQB SP SQF SQBDescription
Col.1 Col.2 Col.1 Col.2 Col.1 Col.2 Col.1 Col.2 Col. 1 Col.2 Col. 1 Col.2 Col. 1 Col.2Bottom temperature (oC) 102.32 117.22 117.19 96.93 153.60 117.21 102.32 134.11 102.37 117.19 150.45 117.24 103.82 158.77Column pressure (kPa) 101.33 101.33 101.33 101.33 511.00 101.33 101.33 178.50 101.33 101.33 451.00 101.33 101.33 367.00Column diameter (m) 0.84 0.82 0.96 0.78 0.76 0.87 0.84 0.85 0.72 0.98 0.65 0.74 0.71 0.71
Reflux ratio 2.25 1.67 0.90 1.87 2.56 2.38 2.25 2.20 0.67 2.99 0.82 1.92 0.67 1.61Overall column efficiency 0.52 0.49 0.46 0.49 0.63 0.49 0.52 0.53 0.51 0.49 0.59 0.48 0.49 0.56
Actual number of trays 91 98 93 88 93 55 92 61 87 145 57 147 79 143Total actual trays 189 181 148 153 232 204 223
Heating rate (kJ/hr) 8.01E+06 8.99E+06 5.19E+06 4.56E+06 5.28E+06 3.91E+06 3.94E+06Cooling rate (kJ/hr) 7.88E+06 8.85E+06 4.78E+06 4.19E+06 5.15E+06 3.78E+06 3.00E+06
Main HX duty (kJ/hr) ………….. ………….. 3.94E+06 4.26E+06 ………….. 2.89E+06 3.07E+06Auxiliary heat exchanger ………….. ………….. TC,MP TR,LP LP TC,MP TC,MP
Steam cost ($/yr) 5.45E+05 6.11E+05 4.52E+05 3.10E+05 3.59E+05 3.41E+05 3.43E+05C.W cost ($/yr) 2.73E+04 3.07E+04 1.66E+04 1.45E+04 1.79E+04 1.31E+04 1.04E+04
Operating cost ($/yr) 5.72E+05 6.41E+05 4.69E+05 3.25E+05 3.77E+05 3.54E+05 3.54E+05Capital cost ($/yr) 7.54E+04 7.85E+04 7.80E+04 8.14E+04 8.18E+04 7.62E+04 7.98E+04
TAC ($/yr) 6.48E+05 7.20E+05 5.47E+05 4.06E+05 4.59E+05 4.30E+05 4.33E+05Capital cost saving (%) 0 -4 -3 -8 -8 -1 -6
Operating cost saving (%) 0 -12 18 43 34 38 38TAC saving (%) 0 -11 16 37 29 34 33
Detailed results of economic studies

Estimation of capital cost
Douglas, J. M., Conceptual design of chemical processes, McGraw-Hill Book Company
Marshall & Swift index: 1056.8/280 Project life: 10years
Major sizes are estimated byHYSYS flowsheet simulator
(Feed: 100 kmol/h)

0.97
0.974
0.978
0.982
0.986
0.99
0.994
0 10 20 30 40 50 60 70 80
Time (unit)
Pro
duct
mol
e fr
actio
n
0.31
0.34
0.37
0.4
0.43
Fee
d m
ole
frac
tion
Ethanol (A)Propanol (B)Butanol (C)
A
B
C
Feed composition disturbance
Open loop transient behaviour of Petlyuk column for feed composition disturbance
Petlyuk column, open loop, feed composition

Open loop transient behaviour of DQB scheme for feed composition disturbance
0.97
0.975
0.98
0.985
0.99
0.995
0 10 20 30 40 50 60 70
Time (unit)
Pro
duct
mol
e fr
actio
n
0.31
0.34
0.37
0.4
0.43
Fee
d m
ole
frac
tion
Ethanol (A)Propanol (B)Butanol (C)
A
B
C
Feed composition disturbance
Heat integrated (DQB) column, open loop, feed composition
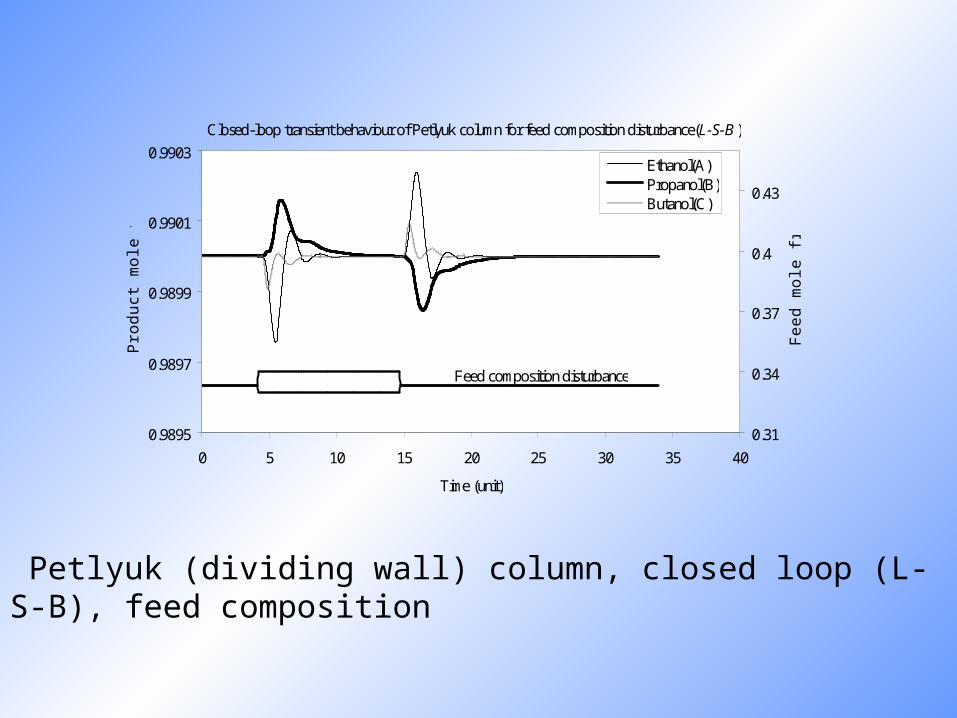
0.9895
0.9897
0.9899
0.9901
0.9903
0 5 10 15 20 25 30 35 40
Time (unit)
Pro
duct
mol
e fr
actio
n
0.31
0.34
0.37
0.4
0.43
Fee
d m
ole
frac
tion
Ethanol(A)Propanol(B)Butanol(C)
Feed composition disturbance
Closed-loop transient behaviour of Petlyuk column for feed composition disturbance(L-S-B )
Petlyuk (dividing wall) column, closed loop (L-S-B), feed composition

0.9894
0.9896
0.9898
0.9900
0.9902
0 5 10 15 20 25 30 35
Time (unit)
Pro
duct
mol
e fr
actio
n
0.31
0.34
0.37
0.4
0.43
Fee
d m
ole
frac
tion
Ethanol (A)Propanol (B)Butanol (C)
Feed composition disturbance
Closed-loop transient behaviour of DQB scheme for feed composition disturbance(D1-L2-B2 )
Heat integrated (DQB) column, closed loop (D-L-B), feed composition