Embed Size (px)
Citation preview

Department of Aviation
Fiscal Year 2015 Budget BookDepartment of Accounting and Finance


Table of Contents
Page | i
Table of Contents
General Manager’s Message .................................................................................................. 1
Executive Summary ............................................................................................................... 3
Airport Overview ......................................................................................................................... 3
Airline Service ............................................................................................................................. 4
Airport Facilities .......................................................................................................................... 5
Vision, Mission, and Strategic Priorities ..................................................................................... 9
Organizational Structure ........................................................................................................... 10
FY15 Budget Highlights ............................................................................................................. 11
Industry Overview ..................................................................................................................... 12
Financial Summary .................................................................................................................... 14
Financial Structure............................................................................................................... 17
Overview ................................................................................................................................... 17
Sources of Revenue .................................................................................................................. 18
Expense Structure ..................................................................................................................... 22
Airline Use and Lease Agreements ........................................................................................... 24
Budget Process Overview ......................................................................................................... 25
Operating Budget ................................................................................................................ 28
Operating Revenue Budget ....................................................................................................... 28
Operating Expense Budget ....................................................................................................... 31
Personnel .................................................................................................................................. 33
Cost Per Enplaned Passenger ................................................................................................... 34
Long-Term Debt................................................................................................................... 35
Overview ................................................................................................................................... 35
Capital Finance .......................................................................................................................... 35
Debt Service Coverage .............................................................................................................. 37
Capital Budget ..................................................................................................................... 41
Overview ................................................................................................................................... 41
Capital Budget ........................................................................................................................... 42


GENERAL MANAGER’S MESSAGE


General Manager’s Message
Page | 1
General Manager’s Message
It is an honor for me to take the helm as Hartsfield-Jackson
Atlanta International Airport’s (ATL) new general manager
just as we embark on a new fiscal year. FY15 promises to be
an exciting yet challenging year, but the Department of
Aviation (Department) team is up to the challenge.
I am excited and privileged to lead the creation and
execution of a full agenda of priorities and initiatives that
will enhance and fortify ATL’s position as metro Atlanta’s
chief economic development tool.
In FY15 we will focus on fulfilling Mayor Reed’s vision of
expanding ATL cargo operations. We will complete and
introduce the Airport Master Plan which will move us along
the path to modernizing the existing 30-year-old terminal
complex. A new agreement will be negotiated with our
airline partners. We will dramatically enhance the guest experience at ATL, and we will build a
robust, job-creating, international air service development program that will further link Atlanta
by non-stop flights to fast growing global economies in Asia, Africa, Eastern Europe and Latin
America.
These priorities are part of a sweeping, comprehensive Department Strategic Plan. FY15 will
mark the introduction of what will be the blueprint that guides us toward developing detailed,
actionable objectives to ensure we achieve our goals. I envision this plan will enable the
effective channeling of resources, the accurate measuring of results and the meticulous
monitoring of our success.
In addition to launching new projects in FY15, this new fiscal year will see the completion of
several existing initiatives.
We will complete our expansion of the Concourse C midpoint, which will provide our guests additional seating areas and create space for additional food & beverage and retail locations.
ATL’s concessions expansion will be complete, with the anticipated opening of all 152 new
locations. The inbound roadway project to improve the efficiency and safety of domestic
terminal entrance roads will be finished, and as part of our cargo expansion, we will open a new
100,000 square foot cargo facility.
In closing, I must extend my gratitude to the Department’s employees for their service and
commitment. Additionally, my thanks go to the Department’s Accounting and Finance division
for their dedication and hard work to prepare the FY15 Budget Book and their enduring focus
on maintaining ATL’s financial health.

General Manager’s Message
Page | 2
Finally, I extend special acknowledgement to Mayor Kasim Reed, Michael Geisler, Chief
Operating Officer, the Atlanta City Council and the members of the Transportation and Finance
Executive committees, for their continued leadership in enabling the Department to fulfill its
role.

EXECUTIVE SUMMARY


Executive Summary
Page | 3
Top 10 Passenger Airports
Worldwide
(Calendar Year 2013)
RANK AIRPORT
1 Atlanta
2 Beijing
3 London Heathrow
4 Tokyo Haneda
5 Chicago O'Hare
6 Los Angeles
7 Dubai International
8 Jakarta Soekamo-Hatta
9 Paris Charles de Gaulle
10 Dallas/ Fort Worth
Source: Aviation Media Airport World
Executive Summary
Airport Overview
Hartsfield-Jackson Atlanta International Airport (ATL, the
Airport) is owned by the City of Atlanta (City) and
operated by the Department of Aviation (Department) as
an enterprise fund using only its funds for operations
and capital development. ATL occupies a 4,750 acre site
in Clayton and Fulton counties about ten miles south of
downtown Atlanta. It is classified as a large hub by the
Federal Aviation Administration (FAA) and is the principal
air carrier airport serving Georgia and the southeastern
United States. ATL serves as a primary transfer point in
the national air transportation system and is the world’s
busiest airport handling more than 94.4 million
passengers and just over 911,000 aircraft operations in
Calendar Year 2013.
This has resulted in a large number of destination
offerings from metro Atlanta compared with similarly-
sized metropolitan areas. With an annual economic impact of more than $32.6 billion on metro
Atlanta, ATL is one of the largest economic generators in the Southeast. Each day about 11.4%
of the nation’s air travelers utilize ATL, leading many experts to consider ATL the most
important transportation node in the U.S. and perhaps the world. The continued safe and
efficient functioning of ATL is critically important to city, state, and national interests. ATL
operates to ensure maximum efficiency and the best possible experience for travelers. ATL's
mission is to "provide the Atlanta region a safe, secure and cost-competitive gateway to the
world that drives economic development, operates with the highest level of customer service
and efficiency, and exercises fiscal and environmental responsibility."
ATL operates 24 hours per day, 365 days per year. The Department employs 613 full-time
employees, as well as 246 firefighting personnel and 216 police personnel. This represents a
small portion of the more than 58,000 airline employees, concessionaires, contractors, and
other professionals whose expertise and professionalism facilitate an average of nearly 2,500
aircraft operations per day. So effective are these collective efforts that for 11 consecutive
years, ATL has been recognized for excellence in efficiency by the Air Transport Research
Society. In 2014, ATL was named the most efficient airport in the world.

Executive Summary
Page | 4
Airline Service
An airport’s originating and destination passenger volumes are determined by the population
and economy of its service region. Connecting passenger numbers are determined primarily by
airline decisions to provide connecting service at an airport. Approximately 32% of ATL’s
enplaned passengers are originating passengers; the remaining 68% are passengers connecting
between flights.
Scheduled air carriers operating at ATL are:
Mainline Passenger Airlines (associated regional airlines not shown)
AirTran Airways
Delta Air Lines
Spirit Airlines
Alaska Airlines
Frontier Airlines
United Airlines
American Airlines
Southwest Airlines
US Airways
Regional Airlines
Air Wisconsin
ExpressJet Airlines
Shuttle America
American Eagle
GoJet Airlines
Silver Airways
Chautauqua Airlines
Mesa Airlines
SkyWest Airlines
Compass Airlines
Republic Airlines
Endeavor Air
Foreign Flag Airlines
Aeromexico
British Airways
Korean Air
Air Canada Jazz
KLM Royal Dutch Airlines
Lufthansa German Airlines
Air France
All-Cargo Airlines
ABX Air
Cathay Pacific Airways
Lufthansa Cargo
Air France/KLM Cargo
China Airlines Cargo
Mountain Air Cargo
Asiana Cargo
DHL Express
Polar Air Cargo Worldwide
Atlas Air
EVA Air Cargo
Qatar Airways Cargo
British Airways Cargo
FedEx
Singapore Airlines Cargo
Cargolux Airlines
Korean Air Cargo
UPS Air Cargo

Executive Summary
Page | 5
Airport Facilities
The design and location of ATL has made it an ideal facility for large volumes of passengers and
aircraft operations since the current design was opened in 1980. Since that time, various
airlines have used ATL as a major hub. Approximately eighty percent (80%) of the U.S.
population resides within a two hour flight from Atlanta, making it a great location for airline
operations. Two major airlines use ATL as a major airport for their operations, Delta Air Lines
and Southwest Airlines. While Delta Air Lines operates in a traditional hub-and-spoke model
and Southwest Airlines operates using a point-to-point transit model, the design and location of
ATL gives it the flexibility to enhance travel via either model.
ATL consists of five parallel runways, multiple associated taxiways, a domestic terminal with
five concourses and an international terminal with two concourses. Additionally, ATL has
extensive parking facilities, a state-of-the-art rental car center, a ground transportation center,
three airfield complexes, a Metropolitan Atlanta Rapid Transit Authority (MARTA) station, and
other facilities that one would expect to find at a world-class airport of its size.
Runways & Taxiways
The efficiency in ATL’s design rests, in large part, in its five parallel east-west oriented runways.
This runway design allows five different aircraft to land and/or take-off nearly simultaneously.
Additionally, ATL’s seven concourses are oriented north-south with ample ramp space in
between them to allow for rapid aircraft movement between the runways and the gates.

Executive Summary
Page | 6
Central Passenger Terminal Complex
The Central Passenger Terminal Complex (CPTC) measures approximately 7 million square feet,
or 160 acres. The CPTC includes a domestic terminal and an international terminal that houses
all airline check-in facilities, ground transportation facilities, administrative offices, access to
parking facilities, concessions, and security checkpoints. The domestic terminal includes five
domestic concourses (T, A, B, C, and D), and a three story atrium. The international terminal
includes two international concourses (E and F), with concourse F serving as the primary
originating and destination terminal for international flights. Within these seven concourses,
there are a total of 202 gates, including 162 domestic and 40 international. The entire complex
is connected via an underground tunnel system which houses both moving sidewalks and a
train system called The Plane Train. The Plane Train operates on a 3.5 mile loop track which
runs underneath the terminals, the concourses, and the ramp. On average, The Plane Train
transports more than 250,000 passengers per day, including airline passengers and airport
employees. Both the terminal buildings and the concourses are free of any architectural
barriers to people with disabilities.
Metropolitan Atlanta Rapid Transit Authority
MARTA provides train and bus service to and from the metro Atlanta area. MARTA’s airport
station connects to ATL at the west end of the domestic terminal atrium between the North
and South baggage claim areas.
Cargo and Airfield Complexes
The airfield is generally considered to have three main complexes which are located North,
South, and Midfield. These three complexes occupy 7.5 million square feet spread over 198
acres. The key airport assets situated among the three complexes include cargo facilities,
airline support and maintenance facilities, fixed base operations, and fuel farms. Cargo facility
assets include cargo operations in all 3 complexes, including ATL cargo warehouse facilities in
the North and South complex, a USDA propagated plant inspection station, a perishables
complex, and 28 parking positions for cargo aircraft to include 19 at the north complex and 9 at
the south complex. Other airfield assets include airline maintenance hangars, a blast fence,
flight support services (provisional, cleaning, GSE repair & storage), fuel tanks and pipelines,
and a fixed base operator to facilitate private and charter flights.
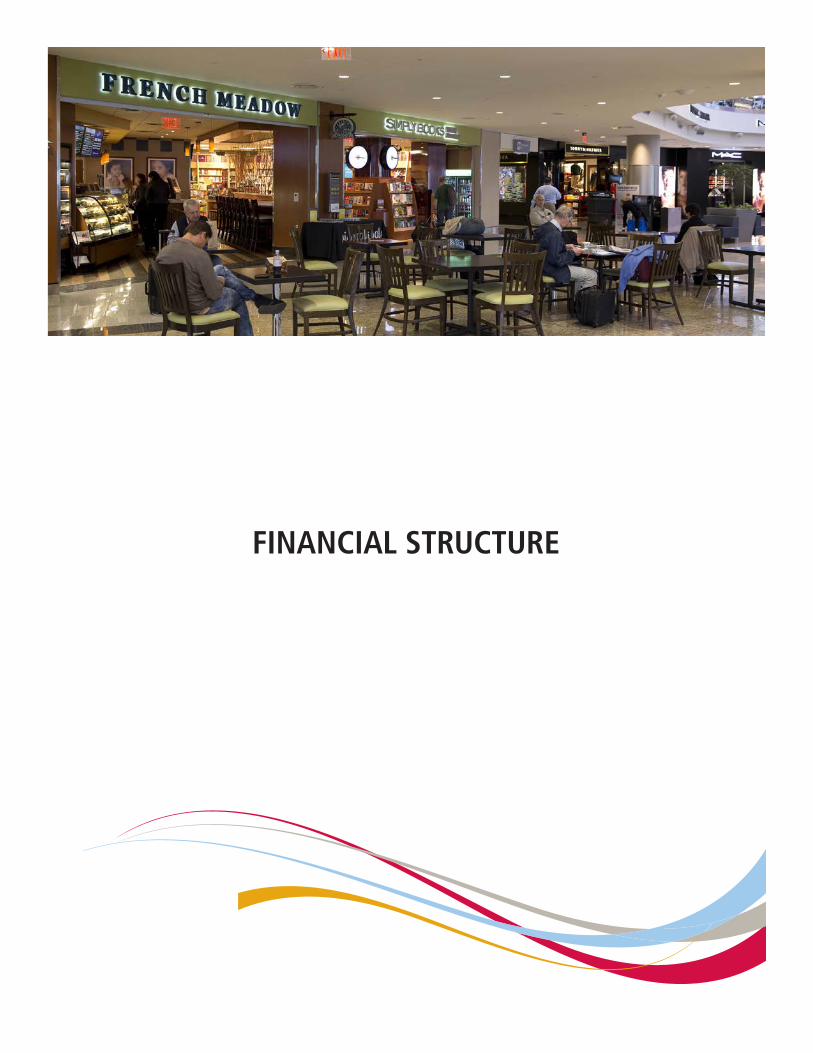
Concessions
There are 308 concession outlets throughout ATL, including kiosks. These consist of 138 food
and beverage locations (including 5 food courts), 136 retail and convenience outlets, duty-free
stores, and 34 service locations. These service locations include a banking center, Georgia
Lottery outlets, shoe shine booths, ATMs, vending machines and spas. Concessions space within
ATL covers approximately 306,000 square feet.

Executive Summary
Page | 7
Ground Transportation Center
The ground transportation center is located at the west end of the terminal and offers the
following services:
1. Shuttle bus services with door-to-door and on-demand pickup service from ATL to
the metro Atlanta area and bordering states. These depart every 15 minutes within
the Atlanta metro area and every 30 minutes for all other areas
2. Taxi, limo and sedan services
3. Area hotel and off-site parking shuttle buses
Rental Car Center
The Rental Car Center (RCC) is a convenient, state-
of-the-art, 67.5-acre facility that houses all rental
car company operations and vehicles. The RCC
includes two four-story parking decks, more than
8,700 parking spaces, and a 137,000 square foot
customer service center. The RCC features 13
rental car brands - Advantage, ACE/Airport, Avis,
Budget, Dollar, Enterprise, EZ, Hertz, National,
Payless, SIXT, Thrifty, and Vanguard. Connecting
customers to the RCC is an elevated train, called the ATL SkyTrain. In five minutes, passengers
are connected from the Airport station at the CPTC to the RCC, the Georgia International
Convention Center (GICC), multiple hotels and office buildings. The train operates six two-car
trains which can carry 100 passengers and their baggage.

Executive Summary
Page | 8
Parking Facilities
There are over 34,000 public and employee parking spaces at ATL, including:

Executive Summary
Page | 9
Vision, Mission, and Strategic Priorities
ATL takes great pride in its strategic planning process. This process enables management to
collectively define, develop, and update its strategy. Further, it provides a framework which
facilitates the organization’s decision making process. In order to determine the direction of
the organization, it is necessary to understand its current position and the possible avenues
through which it can pursue a particular course of action.
Vision
To be the global leader in airport efficiency and customer service excellence.
Mission
To provide the Atlanta region a safe, secure and cost-competitive gateway to the world that
drives economic development, operates with the highest level of customer service and
efficiency, and exercises fiscal and environmental responsibility.
Strategic Priorities
To support the vision and mission, the strategic plan has five strategic priorities. These
priorities directly affect ATL’s ability to serve its customers (including the airlines and their
passengers), be a critical regional economic generator, and support the people working at ATL.
1. Employees – Employee Engagement & Satisfaction
2. Customers – Enhance & Deliver Best-In-Class Customer Experience
3. Finance – Preserve Airport’s Financial Health
4. Environment – Promote Environmental Stewardship
5. Economic Generator – Focus on Our Role as Economic Engine
These five specific strategic priorities are the distinct building blocks of the strategic plan. Each
of these strategic priorities is supported by objectives and initiatives that directly support the
priority. Each strategic priority has simple, high-level metrics that help measure performance.
By categorizing our objectives and initiatives by priority, it allows our employees to best see
how their efforts support the vision and mission.

Executive Summary
Page | 10
Organizational Structure
CHIEF OPERATING
OFFICERCITY ATTORNEY
CHIEF OF
STAFF
Department of
Aviation
CHIEF FINANCIAL
OFFICER
MAYOR
General Manager
HR &
Organizational
Development
DIT - AviationDepartment of
Law - Aviation
Deputy GM
Operations
Deputy GM
Commercial
Development
Deputy GM Finance
& Administration
Marketing &
Stakeholder
Engagement
Assistant General
Manager Finance/
Accounting
Procurement
Assistant General
Manager Commercial
Development
Assistant General
Manager Operations,
Maintenance &
Transportation
Assistant General
Manager Public
Safety & Security
Assistant General
Manager Planning &
Development
Internal Audit
Support
Functions

Executive Summary
Page | 11
FY15 Budget Highlights
Listed below are some of the initiatives that directly support the five strategic priorities of ATL,
which are part of the FY15 budget.
Employee Engagement and Satisfaction
Host the annual conference of Airports Council International – North America
Establish an emergency management program
Initiate the roll-out of the succession planning program
Enhance & Deliver Best in Class Customer Service
Complete expansion of Concourses C center point and T North concessions
Install additional customer service enhancements at the west crossover to better assist “meeters & greeters”
Install a closed circuit television (CCTV) camera system on board 12 ATL SkyTrain vehicles with remote monitoring to enhance public safety
Increase staffing level for customer service representatives
Preserve the Airport’s Financial Health
Install six In Car Orientation/Navigation Systems with HD/LCD displays in each car of The
Plane Train to enhance passenger way finding and revenue opportunities
Procure and implement new advertising agreement for internal and external advertising
Install surface parking for parking operator employees adjacent to rear of international
park ride deck for up to 75 spaces to maximize use of revenue spaces
Promote Environmental Stewardship
Complete zero waste plans which will provide guidance on management of recyclables,
compostables, grease, wood pallets, and construction debris. The plan will help ATL
divert 90% of generated waste away from landfills.
Replace all airfield lights with LED lights
Focus on Our Role as Economic Engine
Construct a new cargo building
Implement an air service incentive program to attract new routes to ATL

Executive Summary
Page | 12
Industry Overview
The global airport services industry is comprised of airport operators and companies providing
support such as landing and take-off services, operation of fueling, runway maintenance,
hangar rental, duty-free shops, security, baggage handling services, and cargo handling services.
The global airport services industry, which reached $123.6 billion in 2012, is forecast to reach
an estimated $157.2 billion in 2018 with a compound annual growth rate of 4.1% over the next
four years. The North American region dominates the industry and represents the largest
industry share, however, Asia, Africa and South America are all expected to show significant
growth in the coming years. A combination of factors such as air traffic rates and the
emergence of low-cost carriers affect market dynamics significantly. The airport services
industry registered dynamic growth in the last couple of years because of the growth in the
passenger and cargo movement and ground handling services. Increasing traffic of air
transportation services of passengers and cargo, strong demand of low-cost carriers especially
in emerging nations, and implementation of open skies policies are some of the growth drivers
of this industry. Development of infrastructure in emerging nations also provides an additional
impetus to the growth of global airport services industry.
Airports, like other enterprises and corporations are increasingly driven by the bottom line.
Airports are in the service industry and provide services to travelling passengers. Airports that
are designed to effectively accommodate passenger needs and habits are likely to succeed far
beyond those that do not. Ultimately, all airport revenue is derived from the people who use
airports: from airline and concessionaire fees, passenger facility charges (PFC), and even federal
funding itself derived from passenger ticket fees. Airports that are designed to respond to
human needs, capabilities, culture, desires and aspirations can find both happy users and
prosperous tenants.
In order to provide services that satisfactorily accommodate both passengers and tenants,
airports must recognize and deal with the following key factors in the industry:
Economic and political conditions
Financial health of the airline industry
Airline service and routes
Airline competition and airfares
Airline consolidation and alliances
Availability and price of aviation fuel
Aviation safety and security concerns
Capacity of the national air traffic control system
Capacity of the airport
In today’s environment these factors also highlight challenges facing the industry. Some key
challenges include the economy, establishing a safe and secure environment, and providing a

Executive Summary
Page | 13
pleasing variety of retail & restaurant offerings for those travelling through the airport.
Particularly in today’s time the chief challenge is the state of the economy which is intertwined
with economic and political conditions. The economy certainly is a chief component in the
success of the airline industry’s financial health. The volume of passenger travel, aircraft
operations, and cargo movement is largely dependent upon the state of the economy.
The U.S. airport sector is stable due to projected modest economic growth in the U.S. and
global economies that should support enplanement and subsequent revenue increases. Most
bond rated U.S. airports are regaining financial resiliency, as demonstrated in Moody's Airport
Medians report. Profitable airline partners that maintain rational route networks support
stable financial performance given the residual rate making structure of a large portion of U.S.
rated airports. While the baseline expectation is for slow, stable growth, the industry remains
below levels seen pre-recession and sensitive to downside. Lingering downside risks for the
economy are joined by potential Federal funding cuts for aviation activities that could affect
airport operations and long term grant funding.
However, in stable to good economic times some airports' passenger travel, aircraft operations,
and cargo still experience growth. In fact, a few airports realize growth even in a slowed
economy. Airports must be ready to successfully plan and achieve levels of capacity that
accommodate the growth of passenger travel and cargo. This not only includes acreage/
square footage but also abundant airport support services. Some of these services include the
following:
Counter services
Aircraft ramp handling
Fuel systems
Baggage systems
Cargo aircraft handling
Cargo warehousing
Ramp tower control operations
Flight supervision and coordination
Appropriate levels of security personnel
ATL has positioned itself such that it successfully handles its service region, passenger and cargo
growth. As a longtime industry leader in passengers handled and aircraft operations, ATL has
demonstrated its ability to plan and execute strategies and projects that keep it at the forefront
of the industry. Plans are also ongoing at ATL to better facilitate cargo operations which is
meant to drive increases in future cargo weights. ATL has included in its FY15 capital plan a
new cargo facility ($36.9 million) to further enhance and support the City’s priority of driving
cargo business throughout the region. During FY15, ATL will complete its new master plan,
providing a clear roadmap for the future.

Executive Summary
Page | 14
Financial Summary
Operating Revenue
ATL anticipates total operating revenues for FY15 to be $489.3 million, which represents a $4.0
million, or -1.0% decrease from the projected revenues of $493.3 million for FY14. ATL
revenues are classified in two major categories (aeronautical and non-aeronautical). Below is a
chart illustrating the breakdown of the two categories utilizing FY15 and FY14 data.
Aeronautical revenues are expected to reach $203.8 million representing an $195 thousand
decrease from FY14 projected actual. Landing fees, CPTC rentals and cost recoveries are
reflecting an aggregate decrease of $4.2 million. Concessions credit, as a result of concessions
revenue, is showing a greater credit in FY15 by $.6 million. Countering these reductions is an
increase in airside rentals of $4.5 million. This increase is the result of classification changes,
which most of the offset can be found in landside rentals.
Non-aeronautical revenues are expected to decrease by $3.8 million, or -1.3% from the
projected revenues for FY14. Several account categories will experience growth in FY15 most
notably parking with a $1.5 million increase and inside concessions with a $4 million increase.
The projected increase in parking is based upon the anticipated growth in originating
passengers. The projected increase in inside concessions is based on the anticipated
FY2014 FY2015 Projected Budget
Aeronautical Revenues:
Landing Fees 48,022,849$ 47,044,419$
CPTC Rentals 146,084,322 144,358,892
Concessions Credit (50,569,912) (51,129,964)
Airside Rentals 23,286,338 27,829,658
Cost Recoveries 37,164,266 35,689,597
Total Aeronautical Revenues 203,987,863 203,792,602
Non Aeronautical Revenues:
Landside Rentals 16,438,294 12,042,327
Commercial Revenues
Public Parking 118,476,402 120,007,258
Inside Concessions 96,000,000 100,254,832
Rental Car 32,500,000 32,321,969
Ground Transportation 1,842,190 2,039,300
Other 3,281,060 2,171,600
Non Airline Cost Recoveries 10,725,000 11,937,924
Other Revenues 10,055,290 4,763,202
Total Non Aeronautical Revenues 289,318,236 285,538,412
Total Operating Revenues 493,306,099$ 489,331,014$

Executive Summary
Page | 15
enplanement growth along with additional concession locations, and concession agreements
with higher rents. Non-airline cost recoveries are expected to increase by $1.2 million. This
increase is attributable to the operation and maintenance cost for the international shuttle,
SkyTrain and the Rental Car Center. The $4.4 million decrease in landside rentals is due to the
realignment of several agreements noted above. The expected change in rental car, ground
transportation, and other revenues are nominal. The $5.3 million decrease in other revenues is
primarily attributable to a one-time adjustment to the allowance for uncollectible accounts
reflected in the FY14 projection.
Operating Expenses
Operating expenses for FY15 are budgeted at $257.9 million which represents a $10.6 million,
or 4.3%, increase over FY14 projected expenses of $247.3 million. We capture our expenses in
six basic categories: personnel, contract services, supply accounts, capital expenses, interfund
charges, and other operating costs. A more detailed discussion of each category can be found
in the Financial Structure section of the book.
FY2014 FY2015
Projected Budget
EXPENSES:
Salaries & Benefits 85,591,113$ 92,018,206$
3rd Party Operating & Maintenance Contracts:
Parking Operations 31,133,532 29,155,033
Security (Access Control/Gate Guard/Fingerprints) 7,023,195 7,002,384
AGTS System/ ATL Sky Train 23,713,033 24,768,000
Customer Service 3,000,000 3,000,000
Rental Car Center Operations (180601) 3,100,000 3,050,000
CPTC Maintenance 2,900,000 2,900,000
Total 3rd Party Op. & Maint. Contracts 70,869,760 69,875,417
Other Contract Services 30,017,290 47,706,181
Total Contract Services 100,887,050 117,581,598
Supply Accounts (excluding Utilities) 5,061,724 5,989,676
Utilities 8,583,194 8,952,974
Total Supply Accounts 13,644,918 14,942,650
Capital Expenses 440,961 280,958
Interfund Charges 12,853,002 13,223,833
Other Operating Costs 13,884,479 4,821,167
Total Operating Fund Expense Budget 227,301,523 242,868,412
(+) Operating Expense Projects (5502 Fund) 20,000,000 15,000,000
Total Operating Expenses 247,301,523$ 257,868,412$

Executive Summary
Page | 16
Salaries and benefits reflect an increase of $6.4 million in FY15 over the FY14 projection. The
change covers salary increases for police officers, fire fighters and other aviation employees.
This increase also anticipates salary and benefits for 12 new employees for FY15 and accounts
for vacancies that are fully budgeted in FY15, but do not have actual costs in FY14.
Total contract services reflects an increase of $16.7 million over the FY14 projection. The 3rd
Party Operating & Maintenance contracts reflect a slight decrease of $995 thousand. Parking
will decrease by $1.9 million due to the domestic to international shuttle service being captured
in other contract services in FY15. This will be partially offset by FY14 savings with the Standard
Parking contract due to personnel costs lower than anticipated, which are anticipated as
expenses in FY15. The SkyTrain agreement will increase by $1.6 million in FY15 due to built-in
contract escalations for spare parts coverage and increases in personnel expenses.
Other contract services reflects an increase of $17.7 million over its FY14 projected expenses.
The FY14 projected actual assumes certain contracts budgeted for in the FY14 budget which
were not needed in FY14. Based on project needs and contracts in place, these same type
expenses are being budgeted in FY15. These expenses cover a number of areas including
planning & development, legal, finance, information technology, new business development,
fuel farm and customer service.
Supplies reflects an increase of $1.3 million over the FY14 projected expenses. The
combination of an increased need in consumable supplies, non-consumable supplies and
utilities account for this increase.
Interfund charges reflects an increase of $371k primarily due to anticipated increases in City
services ranging from fuel and vehicle repair costs to indirect cost charges.
Other operating costs reflect a decrease of $9.1 million from the FY14 projected expenses. The
primary driver of this decrease is due to a one-time charge of $12 million; the Department
cancelled the supplemental rent agreement with the airlines in FY14 and this charge reflects
reimbursement for amounts collected in prior years. This is being offset by $3.5 million
budgeted for property tax which was not included in FY14 projected actual. The property tax
due for FY14 was offset against amounts due to the Airport from Clayton County.
FINANCIAL STRUCTURE


Financial Structure
Page | 17
Financial Structure
Overview
ATL's financial activities can be classified into two categories: operating and non-operating.
Operating activities include those revenues and expenses which are directly related to
operating and maintaining ATL and its related facilities. Non-operating activities include the
collection of certain fees and charges used to fund the development of ATL’s capital assets,
costs incurred in the planning and construction of such capital assets, as well as the interest
income collected from ATL’s invested cash. In most cases, the non-operating revenues are
restricted, by law, only to certain applications that enhance safety, security, or capacity; reduce
noise; increase air carrier competition; or, in the case of customer facility charges (CFC),
continue the upkeep of specifically designated facilities such as the RCC.
As required by City ordinances, the financial activities of the Department are accounted for in
separate funds which were established for various purposes. For financial reporting purposes,
however, the activities in each of these funds are combined into consolidated financial
statements. These financial statements represent the Department as a single enterprise in
order that its financial performance may be evaluated as a single entity.

Financial Structure
Page | 18
Sources of Revenue
S
Operating Revenues
Operating revenues are categorized as either being aeronautical or non-aeronautical in nature.
Aeronautical revenues are those revenues which are directly attributable to airline or airline-
related activities, such as fees paid for the landing of aircraft or rents paid for the airlines’
occupation of ATL facilities. Non-aeronautical revenues, are those which are not directly
attributable to airline activities such as parking revenues, concessions revenues, or car rental
revenues. Passenger traffic from origination & destination and connecting passengers are key
drivers of these revenue sources. These revenues represent additional income to ATL that is
not paid directly by the airlines. The significance in this distinction is that non-aeronautical
revenues represent additional income to ATL that does not impose additional cost burdens to
the airlines.
Aeronautical Revenues
Landing Fees - ATL collects two different types of landing fees: basic landing fees and Airfield
Improvement Program (AIP) landing fees. Basic landing fees are charged to the airlines at $0.16
per 1,000 pounds of maximum certificated gross aircraft landed weight. The intent of this basic
fee is to recover the cost of operating and maintaining ATL’s runways, taxiways, and other areas
of the airfield. AIP landing fees are charged to the airlines at a fixed rate, proportional to their
respective airfield usages, and are intended to recover the cost of capital improvements made
to the airfield. The rates established for these AIP landing fees include a 20% coverage factor
and are for a fixed duration.
Operating Revenues Non-Operating Revenues
Aeronautical Revenues Passenger Facility Charges (PFCs)
Landing Fees Customer Facility Charges (CFCs)
CPTC Rentals Grants (or Capital Contributions)
Airside Rentals Investment Income
CPTC Cost Recoveries Other
Non-Aeronautical Revenues
Landside Rentals
Parking Revenues
Inside Concessions Revenues
Ground Transportation & Other
Financial Structure
Page | 19
CPTC Rentals – These are charges imposed on the airlines for occupying space within ATL’s
CPTC. These charges are apportioned to the airlines based on the actual square footage
occupied within the facilities. The rates established for these charges are based on full cost
recovery for both the construction of these facilities and any periodic capital upgrades made to
them. Under the terms of the CPTC leases, the contracting airlines pay terminal facilities
rentals, on a modified commercial compensatory basis, to allow ATL to recover the amortized
capital costs, plus 20% coverage, of facilities financed with unrestricted airport revenues,
including general airport revenue bonds (GARBs). Generally, 100% of the capital costs of
terminal facilities are recoverable. Although shown separately, the inside concessions credit
provided to the airlines is reflected as a reduction of overall CPTC charges.
Airside Rentals – Airside ground and building rentals consist of rentals for fixed base operator’s
facilities and for cargo buildings in the north complex, south complex, and the Central Terminal
Support Area (CTSA).
CPTC Cost Recoveries - Under the terms of the CPTC leases, the contracting airlines pay
operations charges to reimburse ATL for certain expenses related to:
1. The Plane Train operations and maintenance
2. Fire protection services
3. Police protection services
4. Security checkpoint services
5. A pre-determined percentage of ATL’s liability insurance premiums
6. The management fee associated with a 3rd party maintenance agreement for
certain common use areas within the CPTC
7. Certain operating and maintenance expenses associated with the International
Terminal
Non-Aeronautical Revenues
Landside Rentals – ATL receives rental revenue from the lease of over 100 acres of land. Such
leased properties include land occupied by Delta’s corporate headquarters, Delta’s technical
operations center, certain cargo storage facilities, and various other facilities in the Central
Terminal Support Area. It also includes rental revenue received from certain non-aeronautical
tenants such as rental car companies.
Parking Revenues – These include all revenues generated from ATL’s parking facilities which
includes over 33,000 available spaces for passenger parking. These include covered and
uncovered parking options. ATL’s parking facilities are operated by a third party entity whose
expenses are paid through ATL's operating expenses. All parking revenues are reported gross
with the appropriate third-party expenses being reflected in the operating expense budget.
Inside Concessions Revenues – ATL maintains 308 concessions and service outlets from which it
collects fees and charges based on each concessionaire’s gross revenues. These
concessionaires pay ATL a percentage of their gross sales, based on their individual contracts, in

Financial Structure
Page | 20
return for occupying space within the CPTC. In order to ensure adequate revenue performance,
each concessionaire contract includes a minimum annual guarantee (MAG). Rent paid by most
concessionaires is the greater of the MAG or percentage rent of gross receipts per category.
The percentage rent calculation is trued up monthly and at the end of the lease year.
Rental Car Revenues – The RCC houses 13 rental car brands and 8,700 parking spaces. Each of
the rental car companies pays ATL 10% of annual gross sales in return for occupying RCC space.
Like ATL’s concessionaires, the rental car companies are subject to a MAG which is reconciled
on a monthly basis to ensure a minimum level of revenue performance. The reconciliation is
also done at the end of the lease year.
Ground Transportation Revenues – These include fees and charges received from taxicab,
limousine, hotel shuttles, off-airport parking shuttles, and other commercial ground
transportation services.
Other Concession Revenues – ATL has historically received revenues for services provided
through its Wi-Fi providers, and budgeted an amount based on Wi-Fi becoming free during
FY15. ATL is now offering free Wi-Fi to customers through the “Wi-Fi Before You Fly” program,
the project being completed ahead of the anticipated schedule in FY14.
Non-Airline Cost Recoveries – ATL incurs annual expenses for the operation and maintenance of
the RCC, both from maintaining the facility itself as well as operating the SkyTrain that connects
the RCC to the CPTC. Through its agreements with the rental car companies, ATL recovers
100% of these operating expenses on a monthly basis. Because all of the RCC operating
expenses are passed through to the rental car companies, ATL maintains this facility at
essentially zero cost.
Other Revenues – This category is relatively small and contains various revenue streams
including fees collected for the issuance of security badges, the sale of timber from ATL owned
properties, and other sources which may or may not be recurring from year to year.
Non-Operating Revenues
ATL generates non-operating revenue from four main sources: interest earned from invested
cash, PFCs, CFCs, and capital contributions in the form of grants. These revenues are not
classified as operating because they either are not generated from operating activity, or are
restricted in their use such that they cannot be used to pay for operating expenses. A
description of each non-operating revenue source is contained below:
Investment Income – ATL continues to maximize investment income within the constraints
imposed by State of Georgia statutes and City Ordinances. Wherever legal requirements
permit, cash is pooled in order to achieve maximum cash yields on short-term investments of
otherwise idle cash. These investments are highly liquid, usually with maturities of three
months or less.

Financial Structure
Page | 21
Passenger Facility Charges – In 1990, the U.S. Congress established PFCs as part of the Aviation
Safety and Capacity Expansion Act of 1990 (Act). The Act states that an airport may collect PFCs
from passengers in order to pay for the cost of designing and constructing eligible airport
capital projects or to repay debt service issued to build such projects. PFCs are collected by the
air carriers when passengers purchase their tickets and are remitted to ATL on a monthly basis.
PFCs are a major source of funding for ATL’s capital improvement program. ATL currently
collects a $4.50 PFC per enplaned passenger, which amounts to nearly $180 million a year. ATL
currently has FAA approval to use PFCs on projects totaling more than $3.9 billion. Through
March, 2014, ATL collected $2.6 billion of which $2.1 billion has been expended. Pay as you go
projects absorbed $1.4 billion and $700k was spent on principal, interest, and other financing
expenses.
Customer Facility Charges – ATL collects CFCs as a means to fund the debt service and certain
operations associated with the RCC. These CFCs are collected by the rental car tenants and
remitted to ATL on a monthly basis. ATL collects $5.00 for each transaction day.
Capital Contributions (Grants) – ATL receives AIP and other grants through the FAA,
Transportation Security Administration (TSA) and other federal and state agencies in order to
support its capital program and operations.

Financial Structure
Page | 22
Expense Structure
In accordance with generally accepted accounting principles (GAAP), ATL classifies its expenses
as either operating, non-operating or capital in nature. Generally, all expenses which are
operating in nature are budgeted in the revenue fund (5501). There are a few exceptions which
include projects that were previously budgeted and funded in a capital fund (5502-5532) but
are later either written off or deemed to be operating in nature. Any activities related to these
projects are expensed at the time of project close-out or at the time the project is discontinued.
ATL includes a placeholder for these types of projects when it does its annual financial planning.
Operating Expenses
In accordance with City code, ATL budgets its operating expenses in one of six general
categories:
Account Code Expense Type
51xxxxx Personnel & employee benefits
52xxxxx Purchased & contracted services
53xxxxx Supplies
54xxxxx Capital planning
55xxxxx Interfund charges
57xxxxx Other costs
Within each of these categories, however, there are subcategories which provide greater detail
to ATL’s budgeted operating expenses. It is useful to provide further description for these
subcategories in order to gain a clearer understanding of how the Airport operates. A
description of each expense category is contained below:
Salaries & Benefits – Included in this category are all costs associated with ATL’s full-time
employees. These include salaries, overtime, insurance benefits, payroll taxes, pension and
retirement plan contributions, and other miscellaneous personnel related expenses. It does not
include any of the personnel expenses related to contracted employees.
3rd Party Operating & Maintenance Contracts – This category contains budgeted costs
associated with the major contracts ATL has procured to operate various portions of the
airport. These contracted services include parking operations, control of access to the airfield,
various security-related operations, operation of The Plane Train, operation of the SkyTrain,
customer service operations, operation and maintenance of ATL's common use facilities, and
the operation and maintenance of the RCC.
Consulting & Other Contracted Services – Expenses in this category include those services
offered by consultants and other entities which provide assistance to ATL in its planning,
operations, and other supporting activities. Examples of such services include, but are not
limited to, lobbyist support, employee support programs, training support, internal audit

Financial Structure
Page | 23
support, software and network support, external legal support, and various other activities
which support the technical aspects of ATL’s operations and maintenance.
Expense Type Projects – Earlier it was mentioned that a portion of ATL’s operating expenses are
sourced from funds other than the revenue fund (5501). The majority of these expenses are
classified as expense type projects. These expenses represent costs associated with large scale
projects that involve major repair and maintenance to ATL’s infrastructure, and are most often
funded through ATL’s renewal & extension fund (5502). These projects require resources that
are beyond those organic to ATL’s maintenance division, and thus are managed through the
planning & development division. Because many of these projects are not planned or routine
their costs are expensed as they are incurred in order to ensure that they are captured as
operating expenses and not capital outlays.
Indirect Costs from the City – ATL is a government enterprise wholly owned by the City.
Although the City maintains ownership, it is restricted by law from diverting any of the
revenues earned at ATL to pay for other City expenses. It is recognized, though, that the City
does commit a sizeable amount of resources in support of ATL for which it deserves
compensation. Periodically, the City conducts a formal analysis to determine the annual
amount of resources that it contributes to support ATL and charges this amount to ATL as
indirect costs. Examples of these costs are:
a. The cost of the City’s consolidated annual financial audit
b. The allocation of certain City maintained software and network resources
that are shared between the City and ATL
c. City executives’ time and resources devoted to ATL affairs
d. Time and resources expended by City Council in deliberating over ATL
related issues
Utilities – This category represents the amount budgeted for ATL’s use of water, sewer,
electricity, and natural gas.
Other Expenses – This category contains all other expenses budgeted to operate ATL on an
annual basis. Included are such costs as insurance premiums, supplies, fuel, vehicle
maintenance, property taxes, pensioners’ benefits expense, employee training, and other
miscellaneous costs.

Financial Structure
Page | 24
Airline Use and Lease Agreements
The City has landing agreements with most of the airlines serving the Airport. These airlines are
considered signatory air carriers. These agreements are referred to as airport use agreements
(AUA). In general, AUAs state that the city will maintain and operate ATL and grant the
signatory air carriers the right in common with others to use ATL together with all its facilities
and services not exclusively leased to others. The provisions of this agreement govern the use
of the airfield stipulating that the signatory airlines pay landing fees which are calculated to
recover certain airfield costs. These costs include airfield operating and maintenance expenses
as well as amounts to recover the amortized capital costs (including a 20% coverage) of
approved airfield improvements financed with GARBs. Landing fees are paid per 1,000 pounds
of maximum certificated gross aircraft landed weight. The fees payable are the sum of a basic
landing fee and landing fees for successive AIPs.
The AUA is an agreement that has governed the operation of ATL dating back to 1980.
However, since 2001, the City has not entered into AUAs with new entrant carriers. Instead, it
has entered into an airport use license agreement (AULA). This agreement allows for the
payment of landing fees at the signatory airline rate. The AULA has a term of five years and
may be terminated by the City or the airline with 30 days advance notice.
The City also contracts with airlines via a CPTC lease. This agreement governs the lease and
occupancy of the CPTC. The contracting airlines agree to pay rentals and other charges
calculated to recover certain CPTC costs. These costs include CPTC operating and maintenance
expenses as well as amounts that recover amortized capital costs (including a 20% coverage) of
approved terminal improvements financed with GARBs or ATL funds.

Financial Structure
Page | 25
Budget Process Overview
For operating expenses, ATL has developed a budget process that seeks to maximize small unit
managers’ ingenuity and resourcefulness while also ensuring that ATL administration’s strategic
goals are met with the utmost fiscal responsibility. A diagram of this process is included below:
As demonstrated in the preceding diagram, the budgeting process occurs on two separate but
concurrent tracks during the early phases of planning. The track on the left side involves the
strategic and business planning for ATL and its various business units. This process produces a
collection of business plans that seek to actualize ATL’s long term strategic vision. The track on
BUDGET
EXCEEDS
TARGETS
YES
YES
NO
NO
BU
SIN
ESS
UN
IT R
E-E
VA
LUA
TES
PR
IOR
ITIE
S &
AD
JUST
S
BU
SIN
ESS
PLA
N
MAYOR’S
OFFICE
APPROVAL
CITY COUNCIL
ADOPTS
BUDGET
GENERAL
MANAGER’S
APPROVAL
BUSINESS
UNIT
BUDGETS
AGM
APPROV
BUSINESS
PLANS
STRATEGIC
PLAN
VALIDATION
LRFP
VALIDATION
NEXT-FY
REVENUE
FORECAST
DERIVE MAX
OPERATING
EXPENSES
UNIT-LEVEL
BUDGET
TARGETS
: Department of Aviation Operational Units
: Department of Aviation Finance & Budget
: Department of Aviation & City Executives

Financial Structure
Page | 26
the right side involves tracking ATL’s current financial performance, forecasting future
performance, and creating a long-range financial plan that ensures that ATL’s strategic plan can
be achieved while maintaining sound financial performance.
1. Strategic Plan Validation – Each year prior to the budgeting process, ATL’s executive
staff reviews the strategic plan in order to ensure that it still adequately addresses both
the vision and the current challenges and opportunities that face ATL. At the conclusion
of this process, ATL’s strategic plan is presented to business unit managers so that they
can begin their business planning for the next fiscal year.
2. Long Range Financial Plan (LRFP) Validation – The LRFP is a financial model that
integrates ATL’s revenue forecasts, expense forecasts, capital improvement plan, and
capital financing structure into one cohesive long-range plan.
3. Business Plans – Using the strategic plan as a guide, the individual business units create
annual business plans which provide a roadmap on how each unit will execute its
assigned mission. The business plans tie each proposed initiative or activity to one or
more of ATL’s strategic priorities contained within the strategic plan. Each business plan
contains the business unit’s proposed budget.
4. Next-FY Revenue Forecast – Contained within the LRFP is the revenue forecast for the
next fiscal year. This revenue forecast is referred to by the City as an anticipations
budget and is eventually voted on and officially adopted by the City Council.
5. AGM Approval – Each individual business unit budget is approved by the appropriate
assistant general manager (AGM) prior to being submitted to ATL’s budget group.
6. Business Unit Budgets – After each business plan is approved by the appropriate AGM,
the proposed budgets are submitted to ATL’s budget group for inclusion in the
consolidated budget.
7. Budget Exceeds Targets – ATL’s budget group will validate the business units’ proposed
budgets to ensure they align with the business plan of the business unit, and with the
overall strategic objectives of ATL. Once validated, the budgets are included in the
consolidated budget. Additionally, an analysis is done to ensure all budgeted revenues
and expenses result in the financial performance as set by executive management.
Adjustments are made, if necessary, to ensure the performance is met or exceeded.
8. General Manager’s Approval – The general manager (GM) of ATL is presented with ATL's
budget and is able to review the individual units’ business plans with the appropriate
managers and AGMs.
9. Mayor’s Office Approval – Once approved by the GM, ATL's budget is submitted to the
Mayor’s office for review and approval.
10. City Council Adopts Budget – Before the beginning of the fiscal year, City Council
formally approves ATL's operating budget. The City formally refers to expenses as
appropriations.
In an effort to maintain the utmost financial health, ATL strives to maintain a high level of debt
service coverage (DSC), meaning the number of times its operating income (operating revenues

Financial Structure
Page | 27
– operating expenses) will cover its annual debt service. By law, ATL must adhere to its master
bond ordinance (MBO) and bond covenant. An excerpt from the ordinance/covenant states:
The City has covenanted and agreed that at all times while bonds are
outstanding and unpaid to prescribe, fix, maintain, and collect rates, fees, and
other charges for the services and facilities of the Airport to: (a) provide for 100%
of the Operating Expenses of the airport (except for certain specific facilities) and
for the accumulation in the Revenue Fund of a reasonable reserve therefore, and
(b) produce Net General Revenues in each fiscal year which will: (i) equal at least
120%”.
Thus, in order to comply with the MBO and the bond covenant, ATL must have a DSC of at least
120% of its operating income, or 1.2 times. The formula for DSC is:
In order to balance the budget, the City requires that each department place into its annual
budget a reserve which is equal to the total operating revenues minus all operating expenses
and debt service. The term reserve is somewhat misleading, as this amount is best interpreted
as an expected end of year net income (less principle payment on the debt service). It
represents all of the expected cash which, at the end of the fiscal year, will be transferred to
the renewal & extension fund for use on capital improvements, upgrades, or renovations. ATL’s
budget formula can be displayed as follows:
Operating Revenues – Operating Expenses – Annual GARB Debt Service = Reserves


OPERATING BUDGET


Operating Budget
Page | 28
Operating Budget
Operating Revenue Budget
FY2013 FY2015
Actual Budget Projected Budget
Aeronautical Revenues
Landing Fees
Signatory Landing Fees 12,715,773$ 13,362,099$ 12,159,510$ 11,429,818$
AIP Landing Fees 34,429,093 34,296,070 35,504,003 35,356,051
Non-Signatory, Itinerant, & Charter Landing Fees 271,297 318,495 359,336 258,550
Total Landing Fees 47,416,163 47,976,664 48,022,849 47,044,419
CPTC Rentals
CPTC Building & Rental 65,614,802 66,528,287 65,860,000 64,095,382
CPTC Tenant Finishes 75,739,178 75,634,322 80,224,322 80,263,510
Supplemental Rentals 12,000,000 8,000,000 - -
Total CPTC Rentals 153,353,980 150,162,609 146,084,322 144,358,892
Concessions Credits (49,146,522) (47,155,254) (50,569,912) (51,129,964)
Airside Rentals
Ground Rentals 15,855,103 16,574,840 16,500,000 19,373,423
Other Building Rentals - Airlines 6,743,503 6,986,338 6,786,338 8,456,235
Total Airside Rentals 22,598,606 23,561,178 23,286,338 27,829,658
Cost Recoveries
Operations Charges 18,493,194 17,044,447 14,800,669 17,376,865
AGTS Charges 14,462,924 15,799,001 18,207,605 15,458,609
Insurance Charges 611,551 680,559 920,889 744,599
MHJIT O&M 1,962,227 1,400,248 1,735,103 609,524
3rd Party Common-Use Agreement 256,298 1,500,000 1,500,000 1,500,000
Total Cost Recoveries 35,786,194 36,424,255 37,164,266 35,689,597
Total Aeronautical Revenues 210,008,421 210,969,452 203,987,863 203,792,602
Non-Aeronautical Revenues
Landside Rentals
Land Rentals 6,761,840 11,579,223 11,014,952 6,948,598
Other Building Rentals 9,324,744 5,285,599 5,423,342 5,093,729
Total Landside Rentals 16,086,584 16,864,822 16,438,294 12,042,327
Commercial Revenues
Public Parking 117,424,935 118,476,402 118,476,402 120,007,258
Inside Concessions 93,189,492 94,310,508 96,000,000 100,254,832
Rental Car 31,765,198 32,922,484 32,500,000 32,321,969
Ground Transportation 1,856,246 1,992,190 1,842,190 2,039,300
Public Telephone 37,413 - 11,060 -
WIFI Wireless 2,320,197 2,541,000 3,270,000 2,171,600
Total Commercial Revenues 246,593,481 250,242,584 252,099,652 256,794,959
Non-Airline Cost Recoveries
RCC APM 4,727,642 7,376,620 5,225,000 5,035,776
RCC O&M 4,410,203 5,100,546 5,500,000 6,902,148
Total Non-Airline Cost Recoveries 9,137,845 12,477,166 10,725,000 11,937,924
Other Revenues 8,561,997 7,140,000 10,055,290 4,763,202
Total Non-Aeronautical Revenues 280,379,907 286,724,572 289,318,236 285,538,412
Total Operating Revenues 490,388,328$ 497,694,024$ 493,306,099$ 489,331,014$
FY2014

Operating Budget
Page | 29
Breakdown of Landing Fee Revenue
The following table depicts a more detail view of ATL landing fees:
FY2013 FY2015
Actual Budget Projected Budget
Signatory Landing Fees 12,715,773$ 13,362,099$ 12,159,510$ 11,429,818$
AIP Landing Fees
AIP 3 1,126,457 1,123,402 1,168,338 1,182,761
AIP 5 1,568,895 1,577,541 1,640,643 1,655,799
AIP 6 264,068 263,896 274,452 278,193
AIP 7 288,480 289,772 301,363 305,441
AIP 8 284,544 283,859 295,213 299,192
AIP 9 142,856 142,505 148,205 150,194
AIP 10 46,635 46,455 48,313 48,910
AIP 11 27,220,221 27,068,658 28,097,212 28,498,930
AIP 12 749,197 745,026 774,827 784,392
AIP 13 172,066 171,108 177,952 180,149
AIP 14 180,978 179,970 187,169 189,480
AIP 15 145,742 144,931 150,728 152,588
AIP 16 806,491 802,000 830,151 70,365
AIP 17 496,774 495,765 511,505 520,270
AIP 18 935,689 961,182 897,932 1,039,387
Total AIP Landing Fees 34,429,093 34,296,070 35,504,003 35,356,051
Non-Signatory Landing Fees 271,297 318,495 359,336 258,550
Total Landing Fees 47,416,163$ 47,976,664$ 48,022,849$ 47,044,419$
FY2014

Operating Budget
Page | 30
Parking Rates
The following table depicts the most current parking rates at ATL:
Ground Transportation Rates
The following table depicts the most current ground transportation fees at ATL:
Hourly Rate Max. Daily Rate
Parking Rates
Hourly Parking (Domestic/ International) $2.00/$3.00 $32.00/$36.00
Daily Parking (Domestic) $3.00 $16.00
Economy Parking - West (Domestic) $3.00 $12.00
Economy Parking - North & South (Domestic) $3.00 $12.00
Park-Ride Lots - Domestic $3.00 $9.00/$12.00
Park-Ride Lots - International $3.00 $12.00
Ground Transportation Fees
Taxi 1.50 per trip
Off-Airport Parking $360 annually per vehicle + $10 per space
Hotel $360 annually per vehicle + $10 per room
Limousine $100 annually per vehicle + parking fees
Shared Ride 5 - 7% of gross sales
Charter $0.10 per seat per trip

Operating Budget
Page | 31
Operating Expense Budget
The following two tables depict the operating expense budget in two separate views, by
account group and by department.
Operating Expense Budget by Account Group
FY2013 FY2015
Actual Budget Projected Budget
Salaries & Benefits:
Salaries 47,850,615$ 56,948,740$ 53,122,333$ 58,387,248$
Overtime & Extra Help 4,905,950 6,540,957 6,071,299 6,010,463
Benefits 19,585,985 20,839,605 22,311,847 23,421,512
Other 4,637,273 4,601,505 4,085,635 4,198,983
Total Salaries & Benefits 76,979,824 88,930,807 85,591,113 92,018,206
3rd Party Operating & Maintenance Contracts:
Parking Operations 29,159,094 32,211,167 31,133,532 29,155,033
Security (Access Control & Gate Guard) 2,765,437 7,599,340 6,465,662 6,302,384
Security Operations (Fingerprints & STA) 540,000 625,000 557,533 700,000
AGTS System 17,292,375 19,545,000 19,107,929 18,915,000
ATL SkyTrain (180602) 5,659,016 4,660,000 4,605,104 5,853,000
Customer Service 2,077,166 3,000,000 3,000,000 3,000,000
Rental Car Center Operations (180601) 2,718,065 3,150,337 3,100,000 3,050,000
CPTC Maintenance 2,413,182 2,900,000 2,900,000 2,900,000
Total 3rd Party Op. & Maint. Contracts 62,624,335 73,690,844 70,869,760 69,875,417
Other Contract Services:
Consulting Professional Services 19,113,109 22,886,175 16,522,697 27,166,779
Repair & Maintenance (Bldg. & Equip.) 1,520,647 2,702,082 1,750,547 3,411,057
Training Travel per Diem & Registration 697,060 1,037,499 865,483 322,685
Insurance 3,858,660 4,105,547 1,695,674 4,096,547
Other Purchased Contracted Services 11,595,662 11,990,156 9,182,889 12,709,113
Total Purchased Contract Services 99,409,473 116,412,303 100,887,050 117,581,598
Supplies Consumable & Non Consumable 3,314,134 4,655,227 3,367,682 4,009,474
Utilities 8,698,402 9,474,900 8,583,194 8,952,974
Other Supply accounts 1,550,393 2,098,819 1,694,042 1,980,202
Total Supply Accounts 13,562,929 16,228,946 13,644,918 14,942,650
Capital Expenses 456,244 622,700 440,961 280,958
Interfund Charges:
Indirect Costs 11,708,423 9,903,960 10,149,248 9,999,089
Motor Fuel/ Repair & Data Processing 2,326,140 2,994,519 2,703,754 3,224,744
Total Interfund Charges 14,034,563 12,898,479 12,853,002 13,223,833
Other Costs:
Property Taxes 1,509,279 4,165,452 1,533,778 4,100,000
Other & Contingency 475,643 822,371 12,350,701 721,167
Total Other Operating Costs 1,984,922 4,987,823 13,884,479 4,821,167
Subtotal 206,427,955 240,081,058 227,301,523 242,868,412
OPER TRANSF OUT TO 5502 15,982,296 15,000,000 20,000,000 15,000,000
Total Operating Fund Expense Budget (5501) 222,410,251$ 255,081,058$ 247,301,523$ 257,868,412$
FY2014

Operating Budget
Page | 32
Operating Expense Budget by Department
FY2013 FY2015
Actual Budget Projected Budget
Office of the GM 1,377,549$ 1,282,923$ 13,126,842$ 2,194,124$
Office of Deputy GM - 260,773 259,788 304,947 Internal Audit 441,973 843,675 409,620 764,761
1,819,522 2,387,371 13,796,250 3,263,832
Human Resources 285,343 554,327 358,274 574,815 Training & Safety 689,851 1,033,002 851,598 1,154,320
975,194 1,587,329 1,209,872 1,729,135
Marketing & SHE 1,681,525 2,307,890 2,121,133 2,513,583
DIT - Aviation 7,181,329 10,804,045 8,260,307 11,504,712
CFO Executive 329,386 580,280 349,626 367,344
Accounting 3,065,647 1,010,741 710,442 883,342
Budgeting, Financial Analysis & Risk Mgmt 4,628,464 5,575,261 2,591,338 5,659,423
Procurement 519,677 635,674 470,317 657,122 Treasury 105,091 479,416 367,944 552,155
Total CFO 8,648,265 8,281,372 4,489,667 8,119,386
Executive 726,680 525,144 766,239 713,009
Asset Management & Sustainability 2,189,556 3,414,124 2,948,368 3,786,207
Project Development 834,969 2,581,648 1,759,599 1,303,669
Facilities Management 7,925,313 8,329,529 6,999,539 6,802,021 Environmental & Planning 1,849,574 2,962,685 2,135,954 3,071,565
13,526,092 17,813,130 14,609,699 15,676,471
AGM Ops. Maint. & Trans. - - 240,572 269,338
AGM Public Safety - - 385,003 495,456
Maintenance 24,687,313 29,313,014 28,563,966 29,578,742
Parking 30,398,759 33,634,131 32,243,842 30,489,503
Operations 11,377,930 12,502,123 12,595,100 12,952,657
Security 9,993,568 12,871,781 10,627,983 11,909,333
APM Systems 25,440,132 26,915,115 26,051,919 27,290,334
Ground Transportation 2,189,375 2,555,371 2,281,370 7,030,709
C4 1,310,313 1,689,606 1,640,556 1,913,105
Airport Fire 22,098,843 23,778,928 24,355,048 23,801,815 Airport Police 17,100,739 18,499,280 17,582,341 18,459,919
144,596,972 161,759,349 156,567,700 164,190,911
Commercial Development Executive 242,540 572,606 144,714 380,808
Concessions 792,444 1,392,873 934,767 1,713,602
Properties 1,455,910 4,150,493 1,580,835 4,401,995
Dawson County 399,100 505,452 165,320 480,000
Paulding County 399,255 400,000 399,451 400,000
New Business Development 807,715 1,955,922 1,184,319 2,261,925 Customer Service 547,012 560,104 322,868 1,015,201
4,643,976 9,537,450 4,732,274 10,653,531
Mayors Office 329,809 688,202 867,713 875,473
Department of Information Technology 434,813 633,871 649,104 559,720
Law 3,650,526 5,915,180 3,685,551 5,018,923
Department of Finance 210,142 516,265 215,274 506,191
Procurement 739,995 783,438 876,292 791,203
Human Resources Administration 1,339,367 1,591,122 1,392,563 1,945,081
Audit 688,775 916,576 476,113 988,898
Pensioners & Dependent Exp 4,258,221 4,321,218 3,085,978 4,198,983 Other City Departments 11,703,432 10,237,250 10,266,036 10,332,379
Total City of Atlanta Cost Centers 23,355,080 25,603,122 21,514,624 25,216,851
Total DOA Operating Expense 206,427,955$ 240,081,058$ 227,301,523$ 242,868,412$
City of Atlanta Cost Centers
Planning & Development
Total Planning & Development
Operations, Maintenance & Security
Total Operations, Maintenance & Security
Commercial Development
Total Commercial Development
CFO
FY2014
DOA Executive
Total DOA Executive
Human Resources/TSOD
Total Human Resources/TSOD

Operating Budget
Page | 33
Personnel
The following table depicts the headcount by department for personnel included in the
operating budget presented in the previous tables:
FY 2013 FY 2014 FY 2015
DOA Executive & Internal Audit 13 16 17
Human Resources/Training, Safety, & Organizational Development 4 5 5
Marketing & Stakholder Engagement 14 14 15
ISD 39 41 45
CFO 43 43 44
Planning & Development 114 111 109
Commercial Development 34 35 38
Operations, Maintenance, & Transportation:
Maintenance 179 181 186
Operations 57 58 54
APM Systems 3 3 3
Ground Transportation 9 14 14
Parking Operations 5 6 6
Total Operations, Maintenance & Transportation 253 262 263
Public Safety:
Centralized Command & Control Center 22 25 27
Security 46 49 50
Airport Firefighting & EMS 243 246 246
Airport Police 183 216 216
Total Public Safety 494 536 539
City of Atlanta Cost Centers 62 68 70
Total DOA Anticipated Staffing Levels 1070 1131 1145
Total DOA Internal Operating Positions 523 549 559
Total DOA Capital Positions (R&E Fund) 59 52 54
Total Police & Fire Positions 426 462 462
Total DOA-Funded City Positions 62 68 70
Total DOA-Funded Positions 1070 1131 1145
Operating Budget
Page | 34
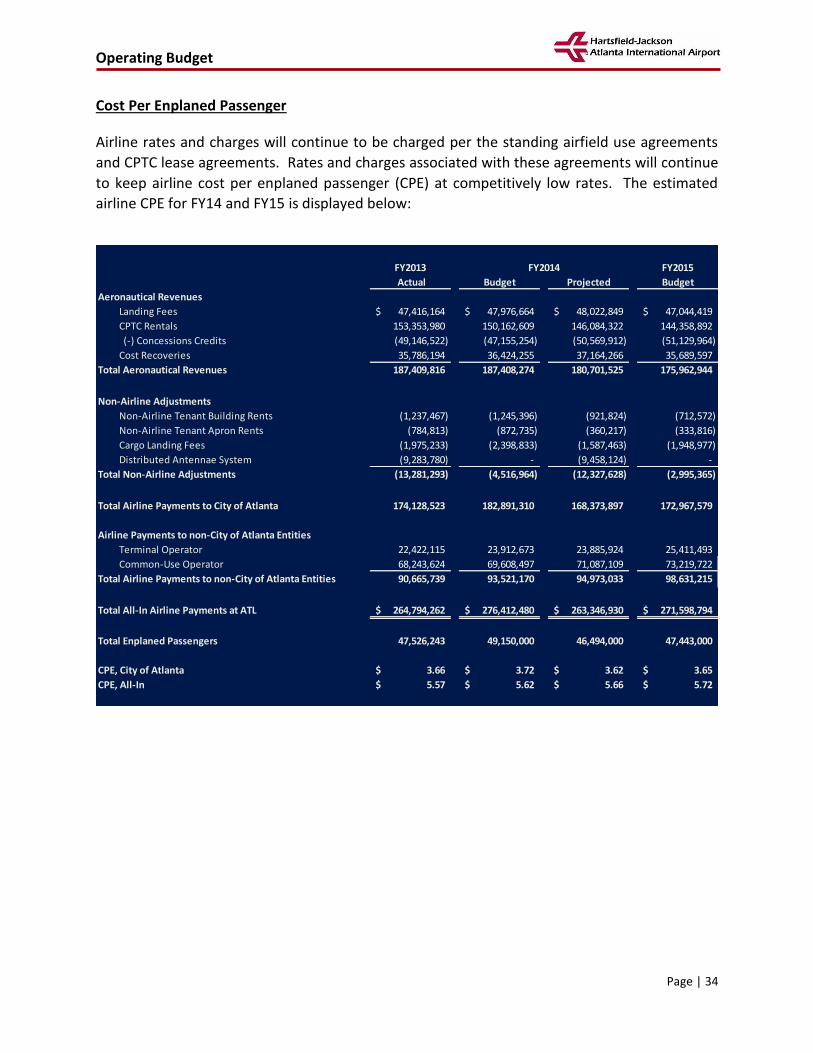
Cost Per Enplaned Passenger
Airline rates and charges will continue to be charged per the standing airfield use agreements
and CPTC lease agreements. Rates and charges associated with these agreements will continue
to keep airline cost per enplaned passenger (CPE) at competitively low rates. The estimated
airline CPE for FY14 and FY15 is displayed below:
FY2013 FY2015
Actual Budget Projected Budget
Aeronautical Revenues
Landing Fees 47,416,164$ 47,976,664$ 48,022,849$ 47,044,419$
CPTC Rentals 153,353,980 150,162,609 146,084,322 144,358,892
(-) Concessions Credits (49,146,522) (47,155,254) (50,569,912) (51,129,964)
Cost Recoveries 35,786,194 36,424,255 37,164,266 35,689,597
Total Aeronautical Revenues 187,409,816 187,408,274 180,701,525 175,962,944
Non-Airline Adjustments
Non-Airline Tenant Building Rents (1,237,467) (1,245,396) (921,824) (712,572)
Non-Airline Tenant Apron Rents (784,813) (872,735) (360,217) (333,816)
Cargo Landing Fees (1,975,233) (2,398,833) (1,587,463) (1,948,977)
Distributed Antennae System (9,283,780) - (9,458,124) -
Total Non-Airline Adjustments (13,281,293) (4,516,964) (12,327,628) (2,995,365)
Total Airline Payments to City of Atlanta 174,128,523 182,891,310 168,373,897 172,967,579
Airline Payments to non-City of Atlanta Entities
Terminal Operator 22,422,115 23,912,673 23,885,924 25,411,493
Common-Use Operator 68,243,624 69,608,497 71,087,109 73,219,722
Total Airline Payments to non-City of Atlanta Entities 90,665,739 93,521,170 94,973,033 98,631,215
Total All-In Airline Payments at ATL 264,794,262$ 276,412,480$ 263,346,930$ 271,598,794$
Total Enplaned Passengers 47,526,243 49,150,000 46,494,000 47,443,000
CPE, City of Atlanta 3.66$ 3.72$ 3.62$ 3.65$
CPE, All-In 5.57$ 5.62$ 5.66$ 5.72$
FY2014


LONG-TERM DEBT


Long-Term Debt
Page | 35
Long-Term Debt
Overview
The City has issued various types of bonds on behalf of ATL which have been used to finance
portions of ATL’s capital improvement plan (CIP). The various types of bonds outstanding
include GARBs, PFC subordinate revenue bonds, and CFC bonds. ATL’s debt program is guided
by the City’s Master Bond Ordinance which authorizes the issuance of bonds and stipulates the
conditions and requirements for these funds’ administration and use.
In addition to this, governing language is included in each bond issue’s official statement which
establishes the use of all funds generated by each issue. Specifically for GARBs, these official
statements contain provisions which state how much of the funds raised are apportioned to:
(1) payment of project costs (deposits to the construction funds, reimbursements to the
renewal and extension fund, and refunding of any outstanding notes), (2) deposits to the
capitalized interest accounts to pay interest during construction; (3) payment of any bond
insurance premiums; (4) deposits to the debt service reserve account (or payment of the costs
of sureties) to meet debt service requirements; and (5) payment of underwriters’ discount,
financing, legal, and other issuance costs.
Capital Finance
At the start of FY15, ATL’s debt consists of the following:
Government Airport Revenue Bonds
$1,847,745,000
Passenger Facility Charge Hybrid Bonds
$883,455,000
Customer Facility Charge Bonds
$192,125,000
Total Debt Outstanding
$2,923,325,000
ATL’s PFC bonds are secured by a senior lien on PFC revenues. In general, the purpose of the
PFC is to develop additional capital funding sources to provide for the expansion and
improvements of the national airport system. The proceeds from PFCs must be used to finance
eligible airport related projects as prescribed by the FAA.
ATL engages in the use of hybrid bonds as a source of capital funding. Hybrid bonds are those
that are not subordinate lien bonds and either (a) have no senior lien on any revenues, (b) have
no lien on any revenues, or (c) have a senior on some revenues in addition to a subordinate lien
on some revenues. The latter is the case for ATL. All of ATL’s PFC bonds were issued as hybrid
bonds secured by a senior lien on PFC revenues and a subordinate lien on general revenues.
The PFC revenue hybrid bonds were issued in 2010 and 2014 for: (1) payment of project costs –
deposits to the construction funds and reimbursements to the renewal & extension fund, (2)
payment of bond insurance premiums, (3) payment of the cost of sureties to meet debt service

Long-Term Debt
Page | 36
reserve requirements, (4) payment of bond discount, financing, legal, and other issuance
expenses.
Another capital financing vehicle is that of the CFC bonds. ATL issued such bonds in 2006,
utilizing the proceeds to fund the construction of the RCC and SkyTrain maintenance facility.
The debt service period on the bonds is 25 years ending in 2031. Prior to the issuance of these
bonds, the City of Atlanta adopted an ordinance (12/6/04) that required all rental car
companies that rent passenger vehicles to customers at ATL to collect and remit a CFC. In
September 2005 the Atlanta City Council adopted an ordinance that established the CFC at
$4.00 per rental car transaction day ($5.00 beginning in FY11). The rental car companies are
required to add the CFC to each rental contract and hold the CFC collections in trust and remit
them to ATL.
As a part of the CFC bond offering, the City entered into a purchase agreement. The purchase
agreement constituted a released revenue bond. Released revenue bonds are bonds secured
by a senior lien on released revenues which are excluded from ATL’s general revenues. The City
has pledged (11th Supplemental Bond Ordinance) all CFC revenues for the payment of its
installment obligations pursuant to the purchase agreement. The City’s Supplemental Bond
Ordinance contains a provision known as the “Rate Covenant”, which states that as long as any
released CFC bonds remain outstanding, the City is required to set the CFC, and adjust annually
if necessary to generate CFC coverage revenues in each fiscal year equal to at least 125% of the
annual debt service requirement on all released CFC bonds. Any CFC revenues remaining after
the completion of all the deposits required under the provisions of the City’s Supplemental
Bond Ordinance are to be deposited into the CFC surplus fund (5512). All moneys retained in
the CFC surplus fund shall be used to prevent payment defaults on ATL’s Series 2006A and
2006B bonds.
Another source of capital financing for ATL is commercial paper. Commercial paper is a money
market security issued and sold by large banks and corporations to get money to meet short
term debt obligations. Commercial paper is only backed by an issuing bank or corporation’s
promise to pay the face amount on the maturity date specified on the note. For FY15, ATL did
not budget for any costs associated with a commercial paper program.
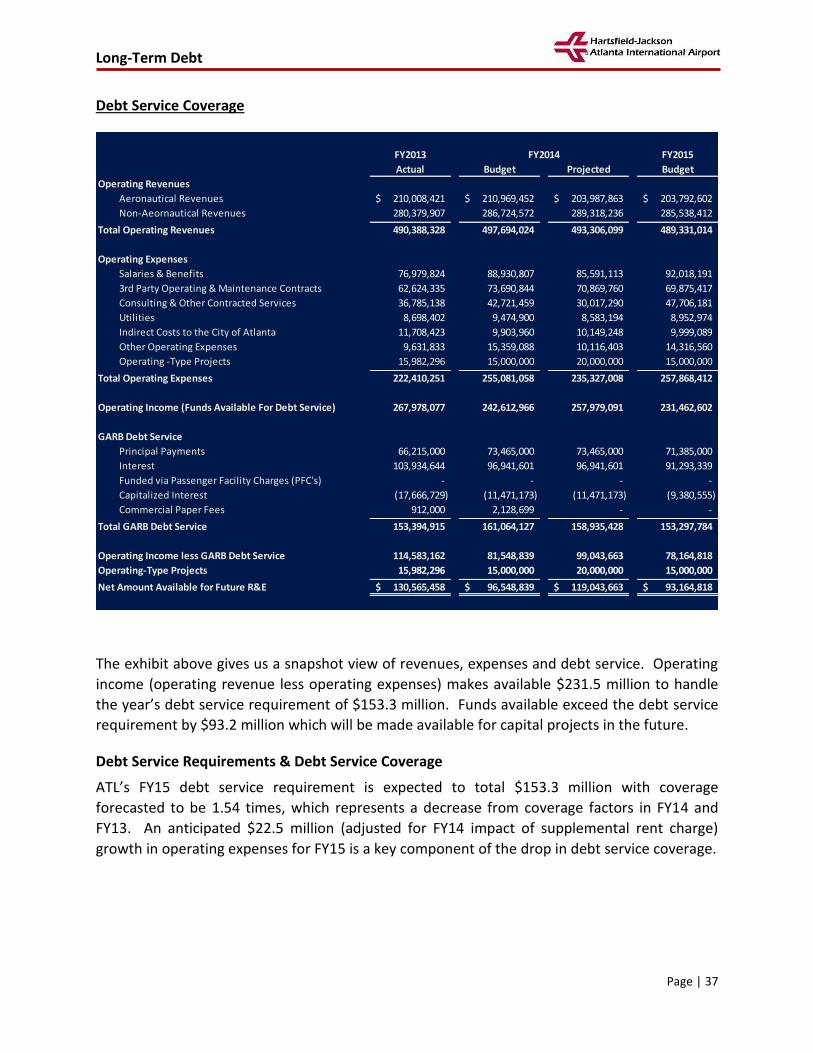
Long-Term Debt
Page | 37
Debt Service Coverage
The exhibit above gives us a snapshot view of revenues, expenses and debt service. Operating
income (operating revenue less operating expenses) makes available $231.5 million to handle
the year’s debt service requirement of $153.3 million. Funds available exceed the debt service
requirement by $93.2 million which will be made available for capital projects in the future.
Debt Service Requirements & Debt Service Coverage
ATL’s FY15 debt service requirement is expected to total $153.3 million with coverage
forecasted to be 1.54 times, which represents a decrease from coverage factors in FY14 and
FY13. An anticipated $22.5 million (adjusted for FY14 impact of supplemental rent charge)
growth in operating expenses for FY15 is a key component of the drop in debt service coverage.
FY2013 FY2015
Actual Budget Projected Budget
Operating Revenues
Aeronautical Revenues 210,008,421$ 210,969,452$ 203,987,863$ 203,792,602$
Non-Aeornautical Revenues 280,379,907 286,724,572 289,318,236 285,538,412
Total Operating Revenues 490,388,328 497,694,024 493,306,099 489,331,014
Operating Expenses
Salaries & Benefits 76,979,824 88,930,807 85,591,113 92,018,191
3rd Party Operating & Maintenance Contracts 62,624,335 73,690,844 70,869,760 69,875,417
Consulting & Other Contracted Services 36,785,138 42,721,459 30,017,290 47,706,181
Utilities 8,698,402 9,474,900 8,583,194 8,952,974
Indirect Costs to the City of Atlanta 11,708,423 9,903,960 10,149,248 9,999,089
Other Operating Expenses 9,631,833 15,359,088 10,116,403 14,316,560
Operating -Type Projects 15,982,296 15,000,000 20,000,000 15,000,000
Total Operating Expenses 222,410,251 255,081,058 235,327,008 257,868,412
Operating Income (Funds Available For Debt Service) 267,978,077 242,612,966 257,979,091 231,462,602
GARB Debt Service
Principal Payments 66,215,000 73,465,000 73,465,000 71,385,000
Interest 103,934,644 96,941,601 96,941,601 91,293,339
Funded via Passenger Facility Charges (PFC's) - - - -
Capitalized Interest (17,666,729) (11,471,173) (11,471,173) (9,380,555)
Commercial Paper Fees 912,000 2,128,699 - -
Total GARB Debt Service 153,394,915 161,064,127 158,935,428 153,297,784
Operating Income less GARB Debt Service 114,583,162 81,548,839 99,043,663 78,164,818
Operating-Type Projects 15,982,296 15,000,000 20,000,000 15,000,000
Net Amount Available for Future R&E 130,565,458$ 96,548,839$ 119,043,663$ 93,164,818$
FY2014

Long-Term Debt
Page | 38
FY13 FY15
Actuals Budget Projection Budget
Operating Revenue 484.90 497.70 493.30 486.23
(+) Investment Income 12.20 8.00 8.00 8.00
(-) Operating Expenses 230.40 254.30 247.30 257.86
(=) Operating Income 266.70 251.40 254.00 236.37
(/) GARB Debt Service 157.20 161.10 161.10 153.30
GARB Debt Service Coverage 1.70 1.56 1.58 1.54
Note: In March 2014, ATL refunded several outstanding bond issuances. The FY15 debt
service calculation includes the decrease in revenue and debt service payments associated
with the 2014 refunding.
FY14
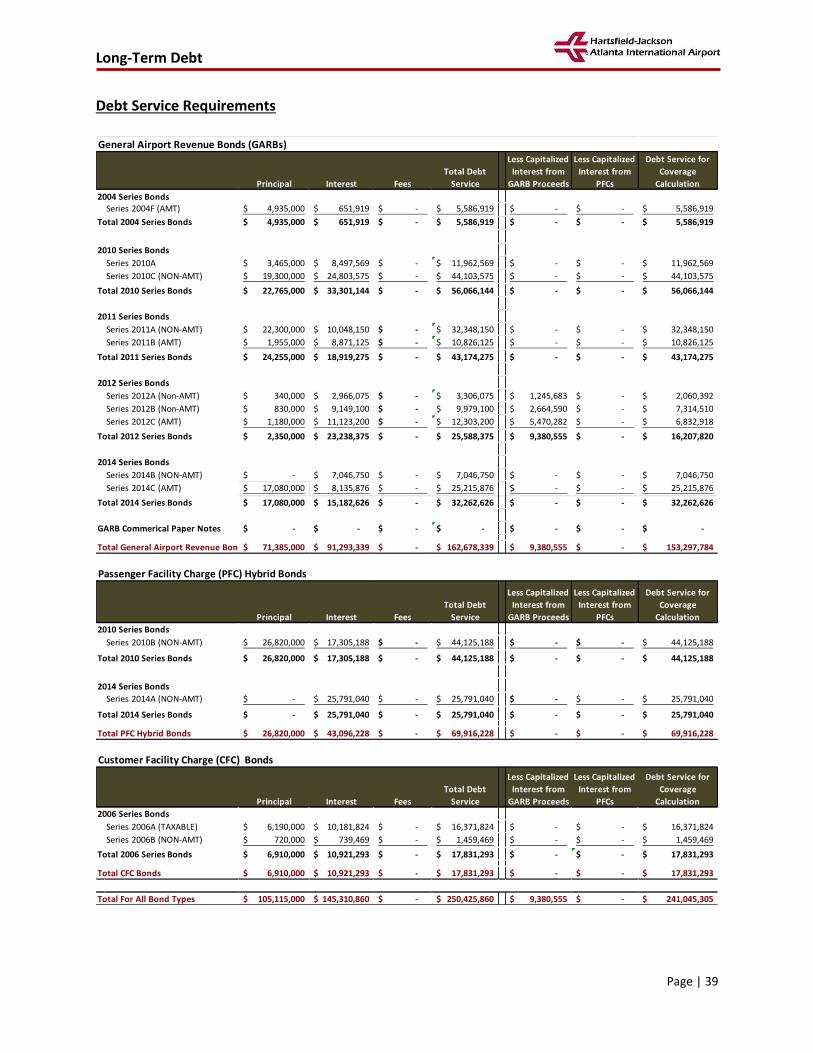
Long-Term Debt
Page | 39
Debt Service Requirements
General Airport Revenue Bonds (GARBs)
2004 Series Bonds
Series 2004F (AMT) 4,935,000$ 651,919$ -$ 5,586,919$ -$ -$ 5,586,919$
Total 2004 Series Bonds 4,935,000$ 651,919$ -$ 5,586,919$ -$ -$ 5,586,919$
2010 Series Bonds
Series 2010A 3,465,000$ 8,497,569$ -$ 11,962,569$ -$ -$ 11,962,569$
Series 2010C (NON-AMT) 19,300,000$ 24,803,575$ -$ 44,103,575$ -$ -$ 44,103,575$
Total 2010 Series Bonds 22,765,000$ 33,301,144$ -$ 56,066,144$ -$ -$ 56,066,144$
2011 Series Bonds
Series 2011A (NON-AMT) 22,300,000$ 10,048,150$ -$ 32,348,150$ -$ -$ 32,348,150$
Series 2011B (AMT) 1,955,000$ 8,871,125$ -$ 10,826,125$ -$ -$ 10,826,125$
Total 2011 Series Bonds 24,255,000$ 18,919,275$ -$ 43,174,275$ -$ -$ 43,174,275$
2012 Series Bonds
Series 2012A (Non-AMT) 340,000$ 2,966,075$ -$ 3,306,075$ 1,245,683$ -$ 2,060,392$
Series 2012B (Non-AMT) 830,000$ 9,149,100$ -$ 9,979,100$ 2,664,590$ -$ 7,314,510$
Series 2012C (AMT) 1,180,000$ 11,123,200$ -$ 12,303,200$ 5,470,282$ -$ 6,832,918$
Total 2012 Series Bonds 2,350,000$ 23,238,375$ -$ 25,588,375$ 9,380,555$ -$ 16,207,820$
2014 Series Bonds
Series 2014B (NON-AMT) -$ 7,046,750$ -$ 7,046,750$ -$ -$ 7,046,750$
Series 2014C (AMT) 17,080,000$ 8,135,876$ -$ 25,215,876$ -$ -$ 25,215,876$
Total 2014 Series Bonds 17,080,000$ 15,182,626$ -$ 32,262,626$ -$ -$ 32,262,626$
GARB Commerical Paper Notes -$ -$ -$ -$ -$ -$ -$
Total General Airport Revenue Bonds 71,385,000$ 91,293,339$ -$ 162,678,339$ 9,380,555$ -$ 153,297,784$
Passenger Facility Charge (PFC) Hybrid Bonds
2010 Series Bonds
Series 2010B (NON-AMT) 26,820,000$ 17,305,188$ -$ 44,125,188$ -$ -$ 44,125,188$
Total 2010 Series Bonds 26,820,000$ 17,305,188$ -$ 44,125,188$ -$ -$ 44,125,188$
2014 Series Bonds
Series 2014A (NON-AMT) -$ 25,791,040$ -$ 25,791,040$ -$ -$ 25,791,040$
Total 2014 Series Bonds -$ 25,791,040$ -$ 25,791,040$ -$ -$ 25,791,040$
Total PFC Hybrid Bonds 26,820,000$ 43,096,228$ -$ 69,916,228$ -$ -$ 69,916,228$
Customer Facility Charge (CFC) Bonds
2006 Series Bonds
Series 2006A (TAXABLE) 6,190,000$ 10,181,824$ -$ 16,371,824$ -$ -$ 16,371,824$
Series 2006B (NON-AMT) 720,000$ 739,469$ -$ 1,459,469$ -$ -$ 1,459,469$
Total 2006 Series Bonds 6,910,000$ 10,921,293$ -$ 17,831,293$ -$ -$ 17,831,293$
Total CFC Bonds 6,910,000$ 10,921,293$ -$ 17,831,293$ -$ -$ 17,831,293$
Total For All Bond Types 105,115,000$ 145,310,860$ -$ 250,425,860$ 9,380,555$ -$ 241,045,305$
Principal
Total Debt
Service
Less Capitalized
Interest from
PFCs
Debt Service for
Coverage
Calculation
Less Capitalized
Interest from
GARB ProceedsFeesInterest
Less Capitalized
Interest from
PFCs
Debt Service for
Coverage
Calculation
Less Capitalized
Interest from
PFCs
Debt Service for
Coverage
CalculationPrincipal Interest Fees
Principal Interest Fees
Total Debt
Service
Less Capitalized
Interest from
GARB Proceeds
Total Debt
Service
Less Capitalized
Interest from
GARB Proceeds

Long-Term Debt
Page | 40
Outstanding Debt as of July 1, 2014
General Airport Revenue Bonds (GARBs)2010 2012 2014 Balance
Refunding Refunding Redunding Outstanding
2003RF Series Bonds
Series 2003RF-A (NON-AMT) 86,055,000$ 86,055,000$ -$ -$ -$ -$
Series 2003RF-B/C (NON-AMT) 490,170,000$ 17,666,000$ -$ 472,504,000$ -$ -$
Series 2003RF-D (AMT) 118,270,000$ 68,315,000$ -$ -$ -$ 49,955,000$ -$
Total 2003RF Series Bonds 694,495,000$ 172,036,000$ -$ 472,504,000$ -$ 49,955,000$ -$
2004 Series Bonds
Series 2004A (AMT) 164,165,000$ 20,850,000$ -$ -$ -$ 143,315,000$ -$
Series 2004B (NON-AMT) 58,655,000$ -$ -$ -$ -$ 58,655,000$ -$
Series 2004F (AMT) 32,290,000$ 17,405,000$ -$ -$ -$ -$ 14,885,000$
Series 2004G (NON-AMT) 96,175,000$ -$ -$ -$ -$ 96,175,000$ -$
Total 2004 Series Bonds 351,285,000$ 38,255,000$ -$ -$ -$ 298,145,000$ 14,885,000$
2010 Series Bonds
Series 2010A 177,990,000$ 3,320,000$ -$ -$ -$ -$ 174,670,000$
Series 2010C (NON-AMT) 524,045,000$ 53,715,000$ -$ -$ -$ -$ 470,330,000$
Total 2010 Series Bonds 702,035,000$ 57,035,000$ -$ -$ -$ -$ 645,000,000$
2011 Series Bonds
Series 2011A (NON-AMT) 224,195,000$ 9,650,000$ -$ -$ -$ -$ 214,545,000$
Series 2011B (AMT) 216,195,000$ 36,510,000$ -$ -$ -$ -$ 179,685,000$
Total 2011 Series Bonds 440,390,000$ 46,160,000$ -$ -$ -$ -$ 394,230,000$
2012 Series Bonds
Series 2012A (Non-AMT) 63,695,000$ 510,000$ -$ -$ -$ -$ 63,185,000$
Series 2012B (Non-AMT) 184,660,000$ 1,180,000$ -$ -$ -$ -$ 183,480,000$
Series 2012C (AMT) 225,740,000$ 1,655,000$ -$ -$ -$ -$ 224,085,000$
Total 2012 Series Bonds 474,095,000$ 3,345,000$ -$ -$ -$ -$ 470,750,000$
2014 Series Bonds
Series 2014B (NON-AMT) 141,005,000$ -$ -$ -$ -$ -$ 141,005,000$
Series 2014C (AMT) 181,875,000$ -$ -$ -$ -$ -$ 181,875,000$
Total 2014 Series Bonds 322,880,000$ -$ -$ -$ -$ -$ 322,880,000$
Total General Airport Revenue Bonds 2,985,180,000$ 316,831,000$ -$ 472,504,000$ -$ 348,100,000$ 1,847,745,000$
Passenger Facility Charge (PFC) Hybrid Bonds2010 2012 2014 Balance
Refunding Refunding Redunding Outstanding
2004 Series Bonds
Series 2004C (NON-AMT) 293,070,000$ -$ -$ -$ -$ 293,070,000$ -$
Series 2004E (NON-AMT) 146,550,000$ 146,550,000$ -$ -$ -$ -$ -$
Series 2004J (NON-AMT) 235,860,000$ -$ -$ -$ -$ 235,860,000$ -$
Total 2004 Series Bonds 675,480,000$ 146,550,000$ -$ -$ -$ 528,930,000$ -$
2010 Series Bonds
Series 2010B (NON-AMT) 409,810,000$ 49,960,000$ -$ -$ -$ -$ 359,850,000$
Total 2010 Series Bonds 409,810,000$ 49,960,000$ -$ -$ -$ -$ 359,850,000$
2014 Series Bonds
Series 2010A (NON-AMT) 523,605,000$ -$ -$ -$ -$ -$ 523,605,000$
Total 2014 Series Bonds 523,605,000$ -$ -$ -$ -$ -$ 523,605,000$
Total PFC Hybrid Bonds 1,608,895,000$ 196,510,000$ -$ -$ -$ 528,930,000$ 883,455,000$
Customer Facility Charge (CFC) Bonds2010 2012 Balance
Refunding Refunding Outstanding
2006 Series Bonds
Series 2006A (TAXABLE) 211,880,000$ 37,140,000$ -$ -$ -$ 174,740,000$
Series 2006B (NON-AMT) 21,980,000$ 4,595,000$ -$ -$ -$ 17,385,000$
Total 2006 Series Bonds 233,860,000$ 41,735,000$ -$ -$ -$ 192,125,000$
Total CFC Bonds 233,860,000$ 41,735,000$ -$ -$ -$ 192,125,000$
Total For All Bond Types 4,827,935,000$ 555,076,000$ -$ 472,504,000$ 2,923,325,000$
Authorized Retired Refunding
Authorized Retired Refunding
Authorized Retired Refunding

CAPITAL BUDGET


Capital Budget
Page | 41
Capital Budget
Overview
ATL is currently executing its capital improvement plan (CIP), which was originally created in
1999 and is nearing completion. During FY15, ATL will be finalizing a new Master Plan which is
intended to identify capital needs through 2030. The current plan is being funded through a
combination of proceeds including GARBs, PFC hybrid revenue bonds, federal grants-in-aid, PFC
pay-as-you-go revenues, CFC revenues, and other airport renewal & extension funds.
The CIP includes several major projects which have already been completed including runway
10/28 (the 5th runway), the RCC and the completion and opening of the Maynard H. Jackson Jr.
International Terminal. Other projects, completed or on-going, include runway/taxiway
extensions, Concourse C and D midpoint expansions, Concourse A electrical equipment
renovations, life safety upgrades in the terminal and concourses, and airfield pavement repairs.
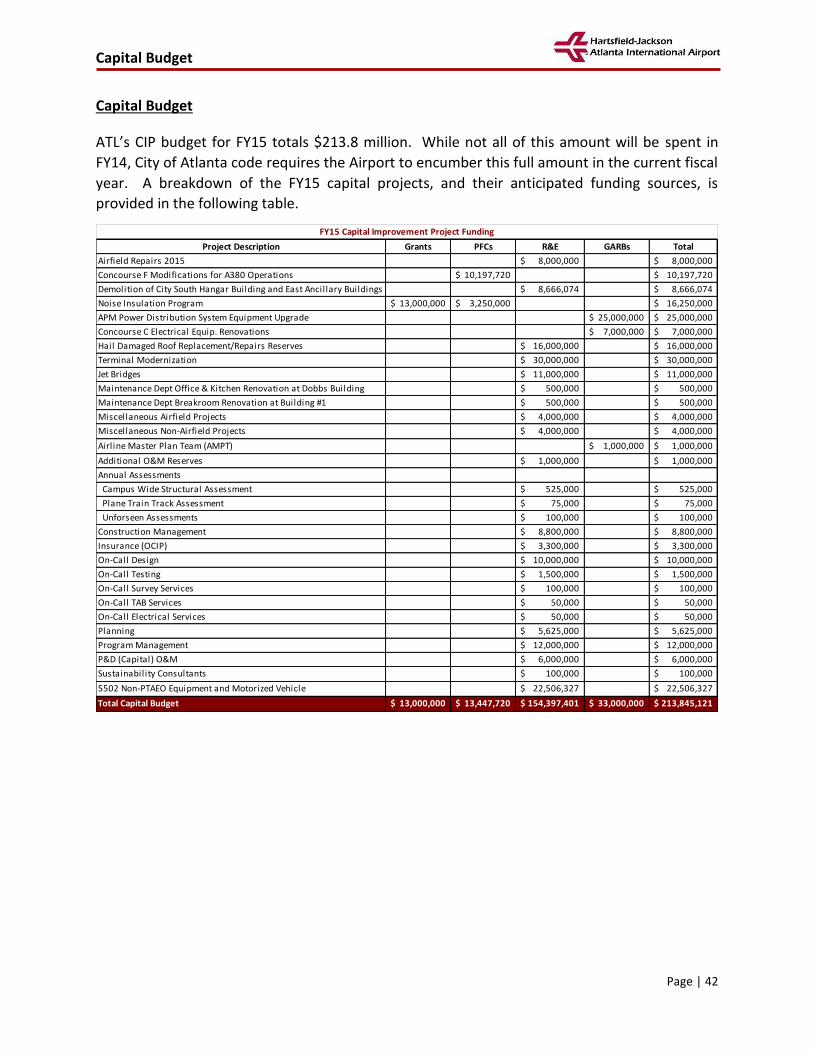
Capital Budget
Page | 42
Capital Budget
ATL’s CIP budget for FY15 totals $213.8 million. While not all of this amount will be spent in
FY14, City of Atlanta code requires the Airport to encumber this full amount in the current fiscal
year. A breakdown of the FY15 capital projects, and their anticipated funding sources, is
provided in the following table.
Project Description Grants PFCs R&E GARBs Total
Airfield Repairs 2015 8,000,000$ 8,000,000$
Concourse F Modifications for A380 Operations 10,197,720$ 10,197,720$
Demolition of City South Hangar Building and East Ancillary Buildings 8,666,074$ 8,666,074$
Noise Insulation Program 13,000,000$ 3,250,000$ 16,250,000$
APM Power Distribution System Equipment Upgrade 25,000,000$ 25,000,000$
Concourse C Electrical Equip. Renovations 7,000,000$ 7,000,000$
Hail Damaged Roof Replacement/Repairs Reserves 16,000,000$ 16,000,000$
Terminal Modernization 30,000,000$ 30,000,000$
Jet Bridges 11,000,000$ 11,000,000$
Maintenance Dept Office & Kitchen Renovation at Dobbs Building 500,000$ 500,000$
Maintenance Dept Breakroom Renovation at Building #1 500,000$ 500,000$
Miscellaneous Airfield Projects 4,000,000$ 4,000,000$
Miscellaneous Non-Airfield Projects 4,000,000$ 4,000,000$
Airline Master Plan Team (AMPT) 1,000,000$ 1,000,000$
Additional O&M Reserves 1,000,000$ 1,000,000$
Annual Assessments
Campus Wide Structural Assessment 525,000$ 525,000$
Plane Train Track Assessment 75,000$ 75,000$
Unforseen Assessments 100,000$ 100,000$
Construction Management 8,800,000$ 8,800,000$
Insurance (OCIP) 3,300,000$ 3,300,000$
On-Call Design 10,000,000$ 10,000,000$
On-Call Testing 1,500,000$ 1,500,000$
On-Call Survey Services 100,000$ 100,000$
On-Call TAB Services 50,000$ 50,000$
On-Call Electrical Services 50,000$ 50,000$
Planning 5,625,000$ 5,625,000$
Program Management 12,000,000$ 12,000,000$
P&D (Capital) O&M 6,000,000$ 6,000,000$
Sustainability Consultants 100,000$ 100,000$
5502 Non-PTAEO Equipment and Motorized Vehicle 22,506,327$ 22,506,327$
Total Capital Budget 13,000,000$ 13,447,720$ 154,397,401$ 33,000,000$ 213,845,121$
FY15 Capital Improvement Project Funding