Embed Size (px)
Citation preview

The spatial effect of intra-metropolitan agglomeration economies
Miguel Ángel García LópezIvan Muñiz
05.13
Facultat de Ciències Econòmiques i Empresarials
Departament d'Economia Aplicada

Aquest document pertany al Departament d'Economia Aplicada.
Data de publicació :
Departament d'Economia AplicadaEdifici BCampus de Bellaterra08193 Bellaterra
Telèfon: (93) 581 1680Fax:(93) 581 2292E-mail: [email protected]://www.ecap.uab.es
Juny 2005

The spatial effect of intra-metropolitan agglomeration economies
Miguel Ángel García*
Ivan Muñiz
Departament d’Economia Aplicada, Universitat Autònoma de Barcelona,
Edifici B, Facultat de Ciències Econòmiques, 08193 Bellaterra, Espanya
[email protected] [email protected]
This study deals with the role of spatial accessibility to agglomeration economies in the change in
spatial structure of industrial employment for the case of the Barcelona Metropolitan Region of
Barcelona (BMR). Using the growth in gross density of municipal employment between 1986 and
1996 for seven manufacturing industries as an indicator of changes in the spatial structure of
employment, an exploration is made of the spatial impact of agglomeration economies operating
on a local scale – the municipality and three areas 5, 8 and 12 kilometres away surrounding the
municipality itself - , agglomeration economies emerging from CBD and the main specialised
subcentres in the region, and the network economies associated with the total jobs in the region,
access to which depends on the distance from the main transport infrastructures.
JEL: R11, R12, R14, R30, L60
Keywords: Agglomeration economies, industrial employment growth, intra-metropolitan
localisation, spatial structure.
* We are grateful to José Luis Roig, Daniel P. McMillen, José Luis Raymond, Anna Matas and Joan Trullénfor helpful suggestions.
2
1 INTRODUCTION
Most metropolitan areas belonging to industrialised countries are undergoing a process of
decentralisation of employment characterised by the abandonment of the densest, most
congested areas in favour of locations relatively distant from the traditional centres of
activity. In the case of industrial activity, there are different factors that can explain this
trend. Firstly, location decisions are not usually left entirely in the hands of the free market.
Instead, they are strongly conditioned by zoning, particularly for sectors whose activity can
generate negative external effects on the population. Secondly, it can be a response to
agglomeration diseconomies – congestion, land prices, etc -. Thirdly, the fall in transport
costs allows access to the agglomeration economies emerging from the employment
centres of the urban region for locations that are further away. The expected impacts of the
three groups of factors considered go in the same direction. The trend is that industry
locates outside the regional centre. However, the decentralisation of industrial employment
does not usually occur following a completely dispersed model. Instead, many relocations
and new industrial investments are made in areas near employment centres and subcentres,
or end up forming new employment subcentres, which indicates that agglomeration
economies continues to have an important influence on job location decisions.
The debate about the changing shape of cities as a consequence of the gradual reduction in
transport costs has led some authors to prophesy the end of cities understood as compact,
dense environments (Gordon and Richardson, 1996). Other more cautious researchers
have tried to put on the same plane the centrifugal (congestion, reduction in transport
costs) and centripetal (agglomeration economies) forces that would act simultaneously
when faced with changes to the communication system, stating that the balance seems to
tip towards dispersion or towards polycentrism (Bly, 1985). It is undoubtedly a
controversial issue, which authors like Richardson have classified as a particularly
interesting area of research: “(…) I find the more promising areas of research are (i) the links between
agglomeration economies /congestion costs and changes in metropolitan spatial structure, and (ii) the debate
about the possible elimination of agglomeration economies (…)” (Richardson, p.149, 1995).
A key element in the above debate is the spatial impact of the different types of
agglomeration economies occurring in metropolitan environments. However, the fact is
that until not too long ago the studies attempting to measure the impact of agglomeration
3
economies have not adopted an intra-metropolitan perspective but rather an inter-
metropolitan one, which has led to a line of work characterised by measuring the impact of
the average density of an urban area on productivity, salaries or the growth of employment,
using a broad enough sample of cities. The problem with this kind of approach is that,
using a sample of metropolises in which each of them is understood as a single point, it is
not possible to study the impact of changes caused by agglomeration economies on the
urban structure. Only recently has a still small number of studies tackled this issue,
including the particularly important one carried out by Rosenthal and Strange (2001, 2003),
and others like Matas and Roig (2004) and Holl (2004). These authors have measured the
spatial impact of static-type agglomeration economies – location and urbanisation –
(Rosenthal and Strange (2001, 2003) and dynamic-type (Holl, 2004) using new investments
in industrial sectors as a dependent variable and employment indicators in a series of
concentric rings around the area where the new investment occurs as explanatory variables,
confirming that the impact of agglomeration economies reduces with distance.
The study presented here basically shares the same approach as that by Rosenthal and
Strange, although it shows some new features. Firstly, instead of using new investments as
a dependent variable, we use changes in employment and the rise or fall in gross density
they bring with them. This means not paying so much attention to the impact of
agglomeration economies on job creation but rather concentrating on the net result
associated with employment growth. Secondly, possible dynamic agglomeration economies
and congestion effects are included as explanatory variables. Finally, one of the
contributions of this study is to include the role of employment poles (CBD and specialised
subcentres) in the model as generators or diffusers of agglomeration economies.
The study is organised as follows: in section 2 there is a review of the development of the
theoretical and applied studies that have dealt with the spatial impact of agglomeration
economies; the study area is characterised in Section 3; in Section 4, the empirical model,
the database and the variables considered are presented; finally the results and main
conclusions are presented in sections 5 and 6 respectively.
4
2 CHANGES IN THE INTRA-URBAN LOCATION OF EMPLOYMENT AND
ACCESS TO AGGLOMERATION ECONOMIES
The changes in the intra-metropolitan location of employment and its effect on spatial
structure have been tackled from a theoretical perspective within the framework of the
Bmonocentric City Model reformulated by New Urban Economy (NUE) and in New
Economic Geography (NEG) studies1 in order to capture a new increasingly decentralised
and polycentric situation.
In the NUE's endogenous theoretical models, activity subcentres emerge as a response to
the various centripetal and centrifugal forces (Fujita and Ogawa, 1982; Palivos and Wang,
1996; Berliant et al., 2002). Congestion costs and the high cost of land and employment
expel activity from the centre towards the periphery. Their relocation, concentrated in
emerging or dispersed subcentres, will depend, among other factors, on the balance
between transport costs and the external economies associated with concentration. From
New Economic Geography (NEG) the possibility that subcentres of activity might also
appear has also been incorporated, using a monopolistic competition framework (Fujita,
1988; Liu and Fujita, 1991; Krugman, 1993; Fujita and Krugman, 1995; Tabuchi, 1998). An
interesting consideration that emerges from the literature is that firms may not actually
locate in an efficient land use pattern because individual firms consider the costs of locating
in a dense location, but they ignore their effect on agglomeration economies creation
(White, 1999).
The case studies seem to confirm the idea that there is no single decentralising pattern. The
studies by McMillen and McDonald for the city of Chicago (McDonald and Prather, 1994;
McMillen and McDonald, 1998; McMillen, 1996, 2003; McMillen and Lester, 2003) clearly
show how the decentralisation of economic activity has been accompanied by the
formation of employment subcentres. Unlike the results obtained for the case of Chicago,
studies like those of Gordon and Richardson (1996) show how, in the city of Los Angeles,
jobs increasingly tend to be dispersed, partly following the behaviour of the population.
Focusing on the European case, from the results obtained in a recent study still in progress
financed by the European Commission and called Scatter, in which the mechanisms leading
1 The theoretical approach used in the NUE enables the presence of subcentres to be introduced into the BidRent Model. The label NEG includes studies using a monopolistic competence and product differentiationframework

5
to urban dispersal in six urban regions (Bristol, Brussels, Helsinki, Milan, Rennes and
Stuttgart) have found that the decentralisation of employment, although it is a general
phenomenon, has taken on different patterns depending on the planning carried out and
the pre-industrial urban fabric.
2.1 The scope and microeconomic nature of agglomeration economies
Agglomeration economies conditioning changes in the urban structure include phenomena
of different kinds depending on the role played by markets, their effect over time and the
sectorial and spatial area they act on. One of the main effects of agglomeration economies
is their positive impact on firm productivity. This effect may be due to a pure externality –
technology – or to a pecuniary externality. Pecuniary externalities originate from a technology
subject to the presence of internal economies of scale in a firm supplying intermediate
goods or services whose appearance therefore depends on the size of the market.2 (Fujita
and Ogawa, 1982; Hotelling, 1929; Krugman, 1991)3. By contrast, technological
externalities do not act through the price system but rather have a direct impact on firm
productivity.
The sectorial scope of the externalities generated by agglomeration economies, whether
they are technological or pecuniary, may be just one sector or all sectors. In the first case,
we are looking at what has been classified as a location economy, that is, the advantages firms
belonging to the same sector have through being spatially concentrated; while in the second
case it is an urbanisation economy; that is, the advantages involved in locating in a place where
there are many companies, regardless of the sector of activity considered, consumers, and
communication infrastructures (Moomaw, 1983; Nakamura, 1985; Henderson, 1986;
Sveikauskas, 1988; etc)4. However, there is no clear consensus over whether these
economies correspond to a scale phenomenon measurable by using the number of firms or
workers, to a composition effect that can be captured using a relative specialisation or
diversity index, or both things at the same time.
2 For firms producing final goods, the existence of an intermediary company adds efficiency to the processso, for the purposes of the firm operating in the final market, it works in the same way as a pure technologicalexternality.3 See the study by Combes (2000) for a review of the literature on the subject.4 See the study by Rosenthal and Strange (2004) for an exhaustive bibliographical review of the subject.

6
In terms of time, agglomeration economies may have simultaneous (static) or inertia
(dynamic) effects. A dynamic or inertia effect is characterised by the fact that it affects firms'
productivity levels, and therefore growth in employment, during more than one period
thanks to the action of cumulative, irreversible elements depending on how that scale has
been achieved over time. The studies by Glaeser et al. (1992), Henderson et al. (1995),
Henderson (1997) and Combes (2000) adopt a dynamic approach to studying the
importance of the sectorial composition of the economic base of a city and company size
in a base year to the subsequent growth in employment. On the other hand, the studies
previously mentioned for the cases of location and urbanisation economies have normally
used a static approach.
Recent studies have classified agglomeration externalities into three categories according to
their microeconomic nature5: a) knowledge externalities (learning), b) job market (matching),
and c) the existence of intermediate services (sharing)6.
2.2 The geographical scope of agglomeration economies
Adopting an intra-metropolitan approach makes it possible to raise an important question:
what is the spatial impact of the different agglomeration economies that come into play?
The results found in the few studies (Rosenthal and Strange, 2001, 2003; Henderson, 2003;
Ellison and Glaeser, 1997; Duranton and Overmans, 2002) that have tackled the question
indicate that agglomeration economies have a different spatial effect depending on whether
they are learning, sharing or matching economies. Rosenthal's and Strange's (2001) study
suggests that learning externalities have a more limited geographical impact7 than job
market ones and that these in turn have a more localised effect than those related to the
use of intermediate goods. Without looking at the microeconomic models that could give
theoretical validity to these results in depth, intuitively they appear quite reasonable, given
that learning normally requires continuing face-to-face contact and a sense of local
collectiveness making possible the free circulation of ideas. The area of externalities
associated with the job market goes beyond a strictly local environment, although probably
5 The three sources of agglomeration economies mentioned go back to Marshall's (1890) study of industrialdistricts and increasing returns to scale.6 See the study by Duranton and Puga (2004) for an extensive review of the microeconomic basis ofagglomeration economies.7 This result is consistent with the studies by Jaffe et al. (1993), Acs et al. (1992) and Almeida and Kogut(1999).

7
does not reach metropolitan geographical scale. Within a metropolis, there are usually
different, relatively self-contained job submarkets, a spatial scale more in accordance with
the presumed geographical impact of these economies. Finally, the use of intermediate
goods or services can be considerably more sporadic than the daily mobility associated with
integration into job and housing markets, so its spatial effect would be larger, probably the
metropolis as a whole.
Directly related to the above, it appears clear that one of the elements conditioning
industrial location is proximity to the employment centre and subcentres. The main
objective of this study is to analyse the effect of the agglomeration economies emerging
from different metropolitan spheres on an environment characterised by a decentralising
tendency set off by congestion costs and the reduction in transport costs.
3 CHANGE IN THE SPATIAL STRUCTURE OF INDUSTRIAL
EMPLOYMENT IN BARCELONA: 1986-1996
3.1 Characterisation of the area of study
The Metropolitan Region of Barcelona (MRB) is a multinuclear, discontinuous and partially
dispersed urban region. It includes a primary city with more than a million and a half
inhabitants – the municipality of Barcelona – and a constellation of population and
employment subcentres8. The MRB has a radial transport network in which the main
agglomerations and corridors are connected with the city centre via various railway lines
and metropolitan motorways. This infrastructure has had a considerable influence on the
pattern of urbanisation (Miralles, 1997, Muñiz et al., 2003b).
3.2 Industrial employment in the Metropolitan Region of Barcelona: 1986 – 1996
The beginning of the period, 1986, coincides with Spain joining what was then the
European Economic Community and with the beginning of a stage of strong economic
growth lasting until the end of 1992, although a slowdown in growth is observed from
8 In Muñiz et al. (2003a) is the first which, recognising Barcelona's role as CBD, employment subcentres areidentified by combining different widely accepted methodologies. As a first stage, they identify subcentrecandidates by combining the criteria developed by McDonald (1987), Giuliano and Small (1991) and

8
1991. This stage is deeply important for the Metropolitan Region of Barcelona, which
benefits from the arrival of European industrial companies and from a strong growth in
industrial employment. Between 1992 and 1993 there is a short but deep economic crisis
which, for the industry of the MRB, means the destruction of a large number of jobs. The
recovery starts from 1994 onwards and is consolidated by the end of 1996. The ten years
covered by this study therefore include a full economic cycle in which manufacturing
industry as a whole grows, creating 9.6% more jobs, although it behaves differently
depending on the subsector under consideration9.
3.3 Specialised subcentres
To identify subcentres, a threshold-based methodology has been adopted where, instead of
specifying fixed numerical values that are the same for each sector – the most usual
technique when subcentres are identified using total employment data – some fixed
statistical values have been defined adapted numerically to the conditions of each
subsector.
After some tests, it was decided to define as subcentres municipalities with an employment
density10 in sector s ( ,i sD ) greater than or equal to the BMR average in 1986 ( , ,1986RMB sD )
and with an employment level ( ,i sE ) equal to or 1% greater than the total for the MRB in
1986 ( , ,1986RMB sE ):
, , ,1986
, , ,19861%i s RMB s
i s RMB s
D DE E
≥
≥
where i and s refer to the municipality11 and the sector respectively12.
McDonald and Prather (1994). At a second stage, they choose as subcentres candidates that affect the spatialdistribution of population density patterns, as Dowall and Treffeisen (1991) do.9 In this sense, the most dynamic sectors in terms of employment generation are Food (68.8%), Graphic Arts(24.4%), Metalwork and Electrical Materials (20.5%) and Transport Materials (15.6%). The Chemical Industrybehaves in a similar way to manufacturing as a whole, with a growth in employment of 10.3%. Finally, twosectors go into crisis, the Timber and Furniture industry, which loses 33.2% of its employment, and Textiles,where 25.1% of jobs are destroyed. In this sense, the latter subsector is particularly important as it is atraditional sector in the MRB concentrating a high proportion of manufacturing employment (24.8% in1986).10 Following McDonald's (1987) contribution, the employment density used is a gross density showing thenumber of jobs per hectare in the municipality.11 Of the 162 municipalities in the MRB in 1986, 12 municipalities which form the spatial continuum ofBarcelona are excluded. According to Hall et al. (1973) these municipalities cannot be considered subcentres,

9
TABLE 1. Specialised subcentres, 1986Number
ofsubcentres
Municipalities
Chemical Industry 11Granollers, Martorell, Mataró, Mollet del Vallès, Montcada i Reixac,Parets del Vallès, Polinyà, Rubí, Sabadell, Sant Andreu de la Barca,
Santa Perpètua de Mogoda
Metallurgy, Electrical Equipment 10Granollers, Mataró, Montcada i Reixac, Parets del Vallès, Rubí,Sabadell, Barberà del Vallès, Terrassa, Viladecans, Vilanova i la
Geltrú
Production of Transport Material 3 Martorell, Martorelles, Rubí
Food Industry 12Granollers, Martorell, Mataró, Mollet del Vallès, Montcada i Reixac,Montmeló, Parets del Vallès, Sabadell, Sant Sadurní d’Anoia, Santa
Perpètua de Mogoda, Viladecans, Vilafranca del Penedès
Textile, Leather, and Dressmaking 8 Granollers, Mataró, Mollet del Vallès, Olesa de Montserrat, Pinedade Mar, Rubí, Sabadell, Terrassa
Timber and Furniture 7 Esparreguera, Gallifa, Granollers, Martorell, Mataró, Ripollet,Sabadell
Paper, Graphic Arts and Edition 8 Castellbisbal, Mataró, Parets del Vallès, Rubí, Sabadell, SantaPerpètua de Mogoda, Sant Vicenç dels Horts, Terrassa
Source: García and Muñiz (2004)
4 DATA AND EMPIRICAL MODEL
4.1 Data and variables
Data
The level of sectoral disaggregation has been conditioned by the fact that, in 1986, the 1974
National Classification of Economic Activities used in Spain (CNAE74) was in force. For
this reason, it has not been possible to use a higher a level of disaggregation as would have
been desirable. For 1996, the CNAE93 provides correspondence with the CNAE74. Data
relating to employment comes from the population censuses of 1986 and 1996.
Dependent variable
The dependent variable used is growth between 1986 and 1996 in gross employment
density of the sector s located in the municipality i with respect to growth in the gross
employment density in the same sector in the Metropolitan Region of Barcelona as a
whole.
but rather are the periphery of a centre going beyond the administrative boundaries of the municipality ofBarcelona.12 For a more exhaustive review of the method used, see García and Muñiz (2005).
10
, ,1996 , ,1986
,1996 ,1986
ln i s i s
s s
D DD D
⎛ ⎞⎜ ⎟⎜ ⎟⎝ ⎠
where the density is the quotient between employment and the area of the spatial unit
considered.
As Combes (2000) indicates, by using this dependent variable an attempt is made to explain
why growth in employment density for a sector is z% more or less in the municipal area
compared with the metropolitan area13.
Explanatory variables
The explanatory variables used can be grouped into three categories: a) proximity to the
CBD and subcentres, b) access to the road network, c) sectorial composition, and
congestion effects.
The first type of variable attempts to capture proximity with respect to agglomeration
economies operating in the whole metropolitan area and which emerge from the main
employment agglomerations: the CBD and specialised subcentres. For the case of the
distances associated with the subcentres, following the studies by McMillen and McDonald
(1998), McDonald and McMillen (2000), McMillen and Lester (2003) and McMillen (2004),
among others, we use a single variable covering the distance of each municipality from the
nearest specialised subcentre. By using this synthetic variable we manage to reduce the problems
of multi-colinearity between the two distance variables and between these and the other
explanatory variables.
Two distance variables are therefore included for each municipality-sector: the distance
between the centre of the municipality and the CBD and the inverse of the distance
between the centre of the municipality and the nearest specialised subcentre identified in
1986.
CBDd , 1986
1SBDd −
13 In fact, as the areas of the spatial units considered are constants over time, this dependent variable isexactly the same as the one used by Combes (2000).

11
These distances attempt to capture the effect on the growth in density associated with
proximity to the main employment concentrations. For the case of distance from Barcelona
(CBD), the effect is associated with the existence of urbanisation economies as the municipality
of Barcelona is a centre agglomerating a large number of jobs in all sectors and with a
massive presence of specialised services. By contrast, by working with employment
subcentres identified by sector, the effect deriving from proximity to subcentres is associated
with the existence of localisation economies.
Finally, it must be borne in mind that working with a direct distance for the case of the
CBD (Barcelona) and an inverted distance for the case of the subcentres implies
recognition that the spatial influence of the CBD is greater than that of the subcentres for
long distances14. In addition, while the interpretation of the coefficient for distance from
the CBD can be made directly, that of the estimated coefficient for the inverse of the
distance to the nearest subcentre is inverse; that is, a positive (negative) coefficient indicates
that the growth of employment density is lower (higher) the further we move away from
the employment subcentre considered.
A second factor determining location is the accessibility of transport infrastructures,
especially the road network. Greater proximity to the city's road network can provide
location advantages (McMillen and McDonald, 1998) as it allows good access for products to
markets (accessibility with respect to demand) and/or agglomeration economies not
depending on a particular municipality but rather on the region as a whole – network
economies – (accessibility with respect to supply) (Trullén et al., 2002; Boix, 2004).
Following McMillen and McDonald (1998), a variable is included to cover the access time
to the nearest good road.
1986INFRt
In a similar way to distance from the CBD, a negative (positive) coefficient indicates that
growth in employment density is lower (higher) as the distance from the good road,
measured in time, increases.
A third group of variables attempts to capture the effects of agglomeration economies of the local
(municipal) area depending on sectorial composition. The presence of agglomeration economies
14 While the distance from Barcelona is assumed to have a linear effect, that from the subcentres is not.

12
associated with a specialised production structure is controlled for using the ratio between the
employment share for the sector s in the municipality i divided by the sector's share at a
metropolitan level. The greater the ratio value, the greater the degree of specialisation for
the municipality under consideration.
, ,1986 ,1986, ,1986
, ,1986 ,1986
ln _ ln i s ii s
RMB s RMB
Emp EmpSpe loc
Emp Emp=
Concerning agglomeration economies related to a diversified production structure we use the
diversity index which, following the calculation procedure proposed by Combes (2000),
directly captures the municipality's level of diversification. This index is calculated for each
municipality-sector using the quotient between the inverse of the quotas in the
employment table representing the rest of the sectors in the municipality with respect to
the inverse of these ratios calculated at a metropolitan level. The greater the value of the
ratio, the greater the relative production diversity.2
, ,1986
1 ,1986 , ,1986
, ,1986 2
, ,1986
1 ,1986 , ,1986
1
ln _ ln
1
Si s
s i i ss s
i sS
BMR s
s BMR BMR ss s
EmpEmp Emp
Div locEmp
Emp Emp
′
′=′≠
′
′=′≠
⎛ ⎞⎜ ⎟⎜ ⎟−⎝ ⎠
=⎛ ⎞⎜ ⎟⎜ ⎟−⎝ ⎠
∑
∑
where S is the total number of sectors including manufacturing and services; s is the
industrial sector on which the indicator is calculated and s′ the other sectors.
The last variable considered – total employment density present in each municipality at the
beginning of the period – attempts to capture congestion effects.
,1986,1986ln _ ln i
ii
EmpD loc
AreaU=
Obtaining a significant, negative coefficient would show the existence of agglomeration
diseconomies associated with congestion (Combes, 2000). On the other hand, a significant
coefficient with a positive sign can be interpreted as evidence pointing to the existence of
dynamic urbanisation economies at a municipal level (Combes, 2000).
13
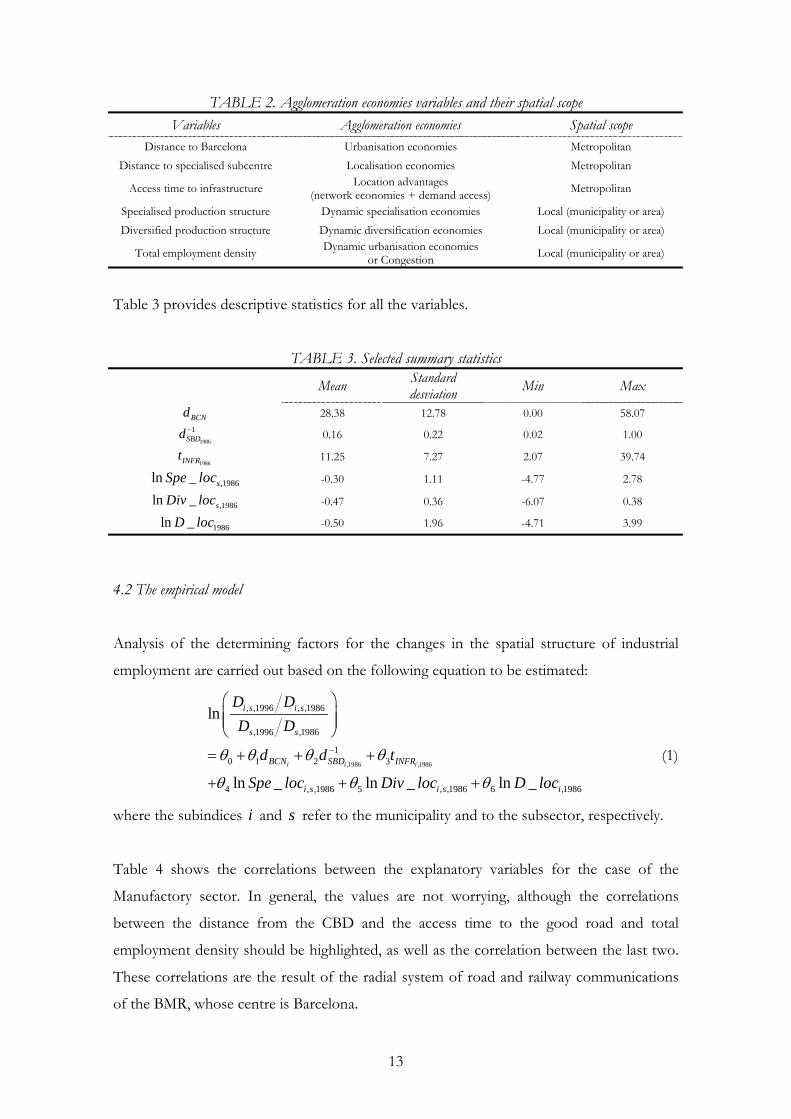
TABLE 2. Agglomeration economies variables and their spatial scopeVariables Agglomeration economies Spatial scope
Distance to Barcelona Urbanisation economies MetropolitanDistance to specialised subcentre Localisation economies Metropolitan
Access time to infrastructure Location advantages(network economies + demand access) Metropolitan
Specialised production structure Dynamic specialisation economies Local (municipality or area)Diversified production structure Dynamic diversification economies Local (municipality or area)
Total employment density Dynamic urbanisation economiesor Congestion Local (municipality or area)
Table 3 provides descriptive statistics for all the variables.
TABLE 3. Selected summary statistics
Mean Standarddesviation Min Max
BCNd 28.38 12.78 0.00 58.07
1986
1SBDd − 0.16 0.22 0.02 1.00
1986INFRt 11.25 7.27 2.07 39.74
,1986ln _ sSpe loc -0.30 1.11 -4.77 2.78
,1986ln _ sDiv loc -0.47 0.36 -6.07 0.38
1986ln _D loc -0.50 1.96 -4.71 3.99
4.2 The empirical model
Analysis of the determining factors for the changes in the spatial structure of industrial
employment are carried out based on the following equation to be estimated:
,1986 ,1986
, ,1996 , ,1986
,1996 ,1986
10 1 2 3
4 , ,1986 5 , ,1986 6 ,1986
ln
ln _ ln _ ln _i i i
i s i s
s s
BCN SBD INFR
i s i s i
D DD D
d d t
Spe loc Div loc D loc
θ θ θ θ
θ θ θ
−
⎛ ⎞⎜ ⎟⎜ ⎟⎝ ⎠
= + + +
+ + +
(1)
where the subindices i and s refer to the municipality and to the subsector, respectively.
Table 4 shows the correlations between the explanatory variables for the case of the
Manufactory sector. In general, the values are not worrying, although the correlations
between the distance from the CBD and the access time to the good road and total
employment density should be highlighted, as well as the correlation between the last two.
These correlations are the result of the radial system of road and railway communications
of the BMR, whose centre is Barcelona.

14
TABLE 4. Explanatory variables correlationsBCNd
1986
1SBDd −
1986INFRt ,1986ln _ sSpe loc ,1986ln _ sDiv loc 1986ln _D loc
BCNd 1.00
1986
1SBDd − -0.27 1.00
1986INFRt 0.50 -0.21 1.00
,1986ln _ sSpe loc -0.14 0.27 -0.15 1.00
,1986ln _ sDiv loc -0.18 0.00 -0.10 0.10 1.00
1986ln _D loc -0.55 0.35 -0.49 0.10 0.11 1.00
The equation (1) is estimated using Ordinary Least Squares where, to correct for the
presence of heteroscedasticity in the cross-section sample, the standard errors and
covariance matrix are calculated using the White (1980) method.
5 RESULTS
Table 5 shows the results of the estimates considering only the municipal variables for the
manufacturing total employment and for each of the seven industries.
TABLE 5. OLS estimated coefficients for equation (1) – Local effects
Man
ufactu
re Po
ol
Chem
ical I
ndus
try
Meta
llurgy
,E
lectri
cal E
quip.
Prod
uctio
n of
Tran
spor
t Mat
erial
Foo
d In
dustr
y
Text
ile, E
láter
and
Dres
smak
ing
Timb
er an
dFu
rnitu
re
Pape
r, G
raph
icA
rts a
nd E
dition
Constant 0.71**(7.88)
0.584*(1.94)
0.790**(3.56)
0.864**(3.11)
0.534**(2.50)
0.562**(2.44)
0.812**(3.44)
1.018**(4.50)
BCNd -0.012**(-4.92)
-0.011(-1.20)
-0.014**(-1.95)
-0.016**(-2.12)
-0.006(-1.17)
-0.014*(-1.97)
-0.004(-0.72)
-0.027**(-4.32)
1986
1SBDd − 2.025**
(6.53)2.955**(2.89)
1.893**(2.47)
1.510*(1.79)
1.591**(2.49)
3.146**(3.06)
2.218**(2.83)
1.568**(2.58)
1986INFRt -0.039**(-7.16)
-0.049**(-3.76)
-0.045**(-2.89)
-0.052**(-3.78)
-0.039**(-2.84)
-0.037**(-2.21)
-0.028**(-2.92)
-0.035**(-2.16)
,1986ln _ sSpe loc -0.497**(-17.70)
-0.689**(-7.46)
-0.369**(-4.10)
-0.624**(-7.29)
-0.581**(-9.77)
-0.471**(-5.55)
-0.654**(-5.99)
-0.522**(-6.85)
,1986ln _ sDiv loc -0.001(-0.01)
0.277(0.92)
-0.008(-0.09)
-0.124(-0.45)
-0.116(-0.51)
0.210(0.76)
0.200(0.82)
0.062(0.25)
1986ln _D loc -0.248**(-10.14)
-0.229**(-3.05)
-0.300**(-4.33)
-0.225**(-3.77)
-0.236**(-3.93)
-0.271**(-3.56)
-0.275**(-4.63)
-0.280**(-4.63)
2 Adjusted R 0.3436 0.3961 0.2662 0.3259 0.3587 0.3324 0.3188 0.3676
Observations 1068 150 151 158 149 153 154 153
**, *: significant at 5% and 10% levels, respectively.
15
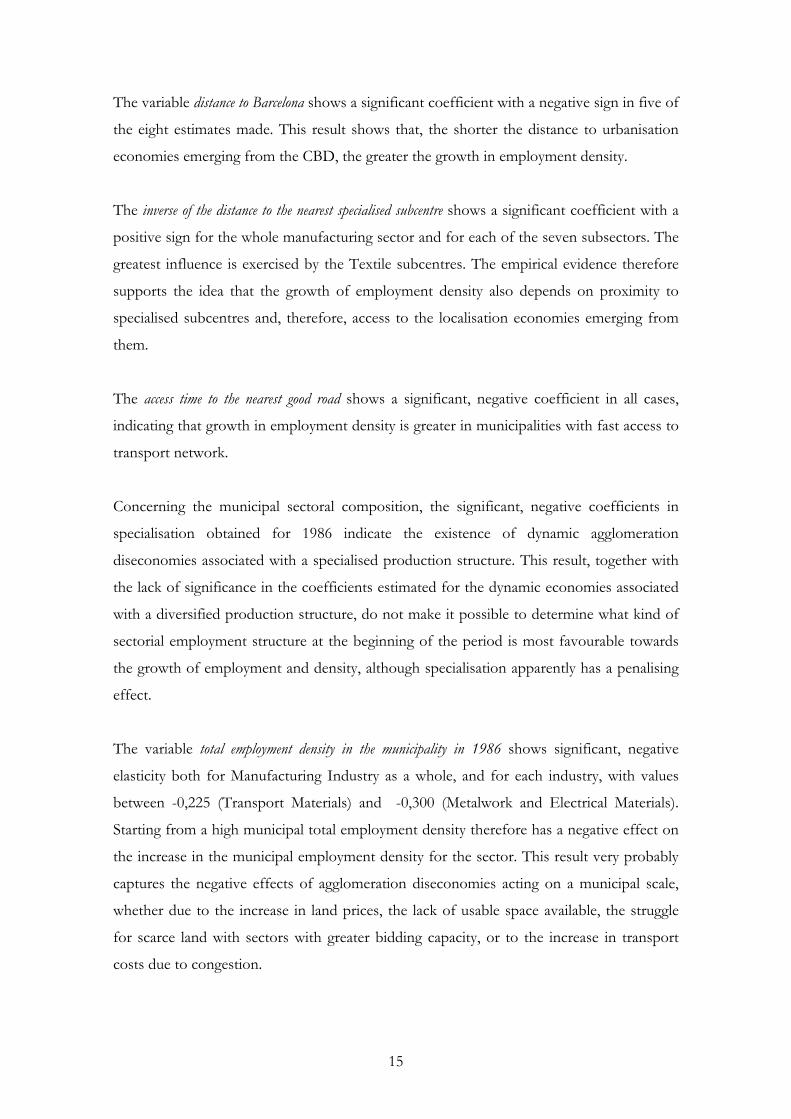
The variable distance to Barcelona shows a significant coefficient with a negative sign in five of
the eight estimates made. This result shows that, the shorter the distance to urbanisation
economies emerging from the CBD, the greater the growth in employment density.
The inverse of the distance to the nearest specialised subcentre shows a significant coefficient with a
positive sign for the whole manufacturing sector and for each of the seven subsectors. The
greatest influence is exercised by the Textile subcentres. The empirical evidence therefore
supports the idea that the growth of employment density also depends on proximity to
specialised subcentres and, therefore, access to the localisation economies emerging from
them.
The access time to the nearest good road shows a significant, negative coefficient in all cases,
indicating that growth in employment density is greater in municipalities with fast access to
transport network.
Concerning the municipal sectoral composition, the significant, negative coefficients in
specialisation obtained for 1986 indicate the existence of dynamic agglomeration
diseconomies associated with a specialised production structure. This result, together with
the lack of significance in the coefficients estimated for the dynamic economies associated
with a diversified production structure, do not make it possible to determine what kind of
sectorial employment structure at the beginning of the period is most favourable towards
the growth of employment and density, although specialisation apparently has a penalising
effect.
The variable total employment density in the municipality in 1986 shows significant, negative
elasticity both for Manufacturing Industry as a whole, and for each industry, with values
between -0,225 (Transport Materials) and -0,300 (Metalwork and Electrical Materials).
Starting from a high municipal total employment density therefore has a negative effect on
the increase in the municipal employment density for the sector. This result very probably
captures the negative effects of agglomeration diseconomies acting on a municipal scale,
whether due to the increase in land prices, the lack of usable space available, the struggle
for scarce land with sectors with greater bidding capacity, or to the increase in transport
costs due to congestion.

16
Overall, these results indicate the existence of a spatial redistribution process for
manufacturing activity in the metropolitan area stimulated by the agglomeration
diseconomies associated with high density levels. However, access to agglomeration
economies with a metropolitan scope and the accessibility of the main transport
infrastructures seem to condition this process decisively. The results corresponding to the
distance to Barcelona and distance to the nearest specialised subcentre variables, together
with access time to the nearest good road, confirm this idea.
The most unsatisfactory results are those concerning specialisation and diversity
economies. It is possible that the problem lies in having used an erroneous spatial area, so
two additional explanatory variables have been added: a specialisation index and a
diversification index including municipalities included within a radius of 5, 8 and 12
kilometres respectively. The idea is that the agglomeration economies associated with the
sectorial composition of employment can act on a scale beyond the municipal boundaries.
In addition, despite the fact that the municipal total employment density seems to be a
good indicator of agglomeration diseconomies, another additional variable has been added
showing the density of the area surrounding the municipality, in this case, too, using
radiuses of 5, 8 and 12 kilometres. The idea of this is to capture whether the fact of being
an area dense in jobs has a positive effect on growth in density in the municipality/sector,
once the effect of municipal density at the beginning of the period has been corrected. To
put it another way, we wanted to verify if the opportunities for employment growth, and
therefore increase in municipal employment density, are intensified in a dense supra-
municipal area, which would indicate the existence of urbanisation economies associated
with good accessibility to a high number of jobs.
,1986 ,1986
, ,1996 , ,1986
,1996 ,1986
10 1 2 3 4 , ,1986 5 , ,1986
6 , ,1986 7 , ,1986 8 ,1986 9 ,1986
ln
ln _ ln _
ln _ ln _ ln _ ln _i i i
i s i s
s s
BCN SBD INFR i s i s
i s i s i i
D DD D
d d t Spe loc Spe area
Div loc Div area D loc D area
µ µ µ µ µ µ
µ µ µ µ
−
⎛ ⎞⎜ ⎟⎜ ⎟⎝ ⎠
= + + + + +
+ + + +
(2)
Tables 6 and 7 show the results obtained by introducing the variables from the area. For
each of the eight cases analysed, three specifications are estimated, corresponding to the
three areas considered (5, 8 and 12 kilometres). The coefficients of the municipal variables

17
appearing in Table 5 remain reasonably stable when the three additional variables referring
to the area indicators are added, so in what follows we will concentrate exclusively on
analysing the results obtained for the area variables.
For the case of total employment density for the area in 1986 positive estimated coefficients are
obtained in all specifications which are statistically significant in the majority of cases. This
result confirms the idea that a dense supra-municipal environment has a positive effect on
the growth in municipal employment density, which suggests the existence of urbanisation
economies on a supra-municipal scale. Unlike the coefficient previously estimated for the
municipal specialisation index, the variable specialisation of the area in 1986 shows positive
elasticity in the majority of sectors, although its significance is rather low. The most
reasonable interpretation of this result is that the municipal specialisation coefficient
captures not only the existence of specialisation economies but also the effects of
congestion on the sector. By expanding the area considered, and once municipal
congestion effects have been controlled for, the results indicate that locating in a
municipality belonging to a supra-municipal area with many jobs in a particular sector have
a positive impact – although not a very significant one – on the growth of the density of
this municipality-sector. The variable diversity of the area in 1986 shows the same behaviour,
that is, it shows a low significance level dominated by positive effects.
In summary, the results of the municipal variables, together with those obtained by
introducing the area variables, confirm the idea that access to location economies (distance
from the nearest specialised subsector) and the presence of agglomeration economies
associated with specialisation and/or with diversity of production operating on a supra-
municipal scale are largely conditioning changes in municipal employment density, thereby
preventing excessive dispersal of employment. There is also empirical evidence pointing to
the positive effect of urbanisation economies measured using the distance separating the
municipality from the CBD, together with the total employment density of the area
surrounding the municipality.
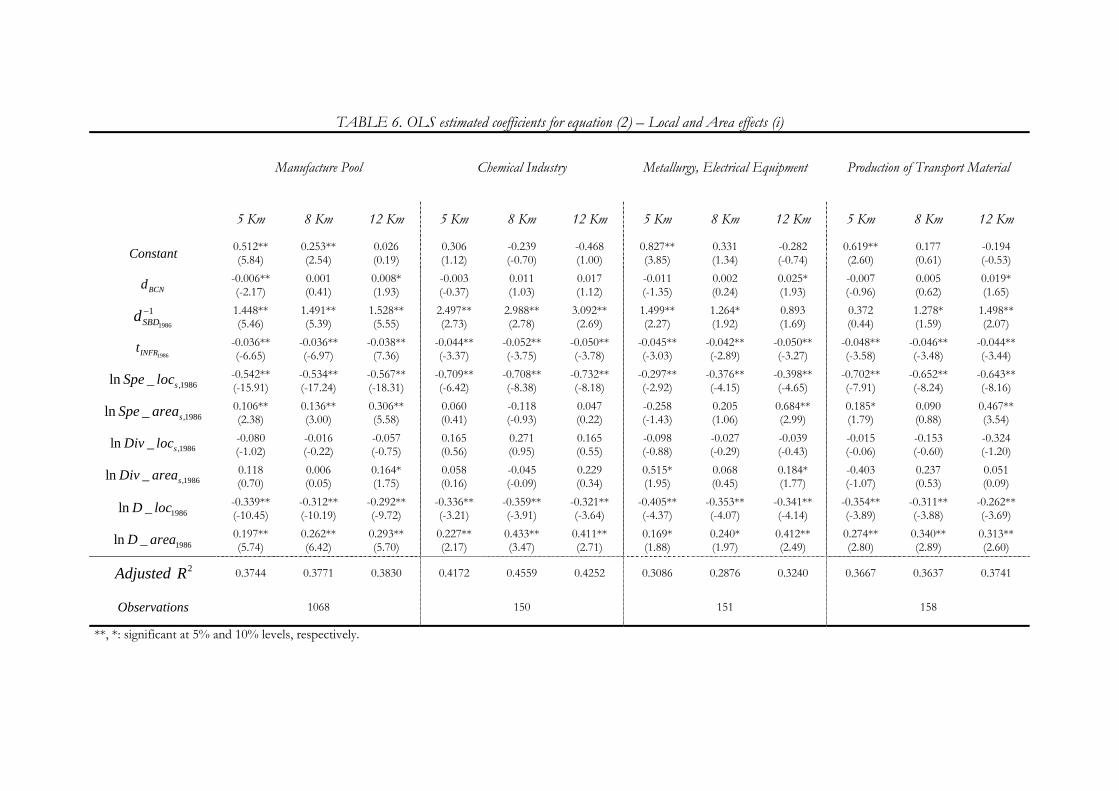
TABLE 6. OLS estimated coefficients for equation (2) – Local and Area effects (i)
Manufacture Pool Chemical Industry Metallurgy, Electrical Equipment Production of Transport Material
5 Km 8 Km 12 Km 5 Km 8 Km 12 Km 5 Km 8 Km 12 Km 5 Km 8 Km 12 Km
Constant 0.512**(5.84)
0.253**(2.54)
0.026(0.19)
0.306(1.12)
-0.239(-0.70)
-0.468(1.00)
0.827**(3.85)
0.331(1.34)
-0.282(-0.74)
0.619**(2.60)
0.177(0.61)
-0.194(-0.53)
BCNd -0.006**(-2.17)
0.001(0.41)
0.008*(1.93)
-0.003(-0.37)
0.011(1.03)
0.017(1.12)
-0.011(-1.35)
0.002(0.24)
0.025*(1.93)
-0.007(-0.96)
0.005(0.62)
0.019*(1.65)
1986
1SBDd − 1.448**
(5.46)1.491**(5.39)
1.528**(5.55)
2.497**(2.73)
2.988**(2.78)
3.092**(2.69)
1.499**(2.27)
1.264*(1.92)
0.893(1.69)
0.372(0.44)
1.278*(1.59)
1.498**(2.07)
1986INFRt -0.036**(-6.65)
-0.036**(-6.97)
-0.038**(7.36)
-0.044**(-3.37)
-0.052**(-3.75)
-0.050**(-3.78)
-0.045**(-3.03)
-0.042**(-2.89)
-0.050**(-3.27)
-0.048**(-3.58)
-0.046**(-3.48)
-0.044**(-3.44)
,1986ln _ sSpe loc -0.542**(-15.91)
-0.534**(-17.24)
-0.567**(-18.31)
-0.709**(-6.42)
-0.708**(-8.38)
-0.732**(-8.18)
-0.297**(-2.92)
-0.376**(-4.15)
-0.398**(-4.65)
-0.702**(-7.91)
-0.652**(-8.24)
-0.643**(-8.16)
,1986ln _ sSpe area 0.106**(2.38)
0.136**(3.00)
0.306**(5.58)
0.060(0.41)
-0.118(-0.93)
0.047(0.22)
-0.258(-1.43)
0.205(1.06)
0.684**(2.99)
0.185*(1.79)
0.090(0.88)
0.467**(3.54)
,1986ln _ sDiv loc -0.080(-1.02)
-0.016(-0.22)
-0.057(-0.75)
0.165(0.56)
0.271(0.95)
0.165(0.55)
-0.098(-0.88)
-0.027(-0.29)
-0.039(-0.43)
-0.015(-0.06)
-0.153(-0.60)
-0.324(-1.20)
,1986ln _ sDiv area 0.118(0.70)
0.006(0.05)
0.164*(1.75)
0.058(0.16)
-0.045(-0.09)
0.229(0.34)
0.515*(1.95)
0.068(0.45)
0.184*(1.77)
-0.403(-1.07)
0.237(0.53)
0.051(0.09)
1986ln _D loc -0.339**(-10.45)
-0.312**(-10.19)
-0.292**(-9.72)
-0.336**(-3.21)
-0.359**(-3.91)
-0.321**(-3.64)
-0.405**(-4.37)
-0.353**(-4.07)
-0.341**(-4.14)
-0.354**(-3.89)
-0.311**(-3.88)
-0.262**(-3.69)
1986ln _D area 0.197**(5.74)
0.262**(6.42)
0.293**(5.70)
0.227**(2.17)
0.433**(3.47)
0.411**(2.71)
0.169*(1.88)
0.240*(1.97)
0.412**(2.49)
0.274**(2.80)
0.340**(2.89)
0.313**(2.60)
2Adjusted R 0.3744 0.3771 0.3830 0.4172 0.4559 0.4252 0.3086 0.2876 0.3240 0.3667 0.3637 0.3741
Observations 1068 150 151 158
**, *: significant at 5% and 10% levels, respectively.

TABLE 7. OLS estimated coefficients for equation (2) – Local and Area effects (ii)
Food Industry Textile, Eláter and Dressmaking Timber and Furniture Paper, Graphic Arts and Edition
5 Km 8 Km 12 Km 5 Km 8 Km 12 Km 5 Km 8 Km 12 Km 5 Km 8 Km 12 Km
Constant 0.282(1.59)
0.247(1.14)
-0.359(-0.79)
0.369(1.42)
-0.034(-0.10)
-0.372(-0.76)
0.537**(2.56)
0.561**(2.31)
0.104(0.28)
0.875**(3.14)
0.538*(1.86)
0.138(0.24)
BCNd 0.001(0.14)
0.003(0.41)
0.017(1.32)
-0.009(-1.10)
0.000(0.05)
0.012(0.83)
0.003(0.55)
0.002(0.28)
0.012(1.21)
-0.022**(-3.04)
-0.009(-0.92)
0.006(0.33)
1986
1SBDd − 0.984**
(2.00)1.300**(1.98)
1.354**(2.09)
2.484**(2.57)
1.928**(2.16)
2.251**(2.03)
1.592**(2.20)
2.165**(2.59)
2.186**(2.26)
1.304**(2.24)
1.466**(2.74)
2.405**(3.64)
1986INFRt -0.035**(-2.55)
-0.033**(-2.35)
-0.026**(-2.30)
-0.034**(-2.10)
-0.036**(-2.30)
-0.037**(-2.38)
-0.028**(-2.86)
-0.026**(-2.48)
-0.037**(-3.03)
-0.031*(-1.91)
-0.030*(-1.92)
-0.025*(-1.77)
,1986ln sSpe loc− -0.607**(-8.57)
-0.591**(-8.43)
-0.616**(-9.80)
-0.467**(-5.18)
-0.478**(-5.60)
-0.472**(-5.39)
-0.729**(-5.60)
-0.623**(-5.64)
-0.624**(-5.87)
-0.556**(-6.91)
-0.542**(-6.08)
-0.550**(-6.91)
,1986ln sSpe area− 0.149(1.24)
0.134(0.95)
0.387**(2.43)
0.056(0.44)
0.046(0.30)
0.009(0.04)
0.231(1.24)
-0.071(-0.40)
0.418(1.35)
0.040(0.37)
0.134(0.75)
0.485(1.63)
,1986ln sDIV loc− -0.148(-0.64)
-0.111(-0.48)
-0.147(-0.67)
0.216(0.67)
0.302(1.07)
0.021(0.07)
0.209(0.82)
0.170(0.74)
0.092(0.37)
-0.152(-0.65)
-0.014(-0.06)
0.032(0.13)
,1986ln sDIV area− -0.066(-0.22)
0.244(0.58)
0.757(1.48)
-0.244(-0.53)
-1.331*(-1.76)
-0.113(-0.09)
-0.161(-0.52)
-0.062(-0.18)
-0.064(-0.14)
0.533(1.53)
0.652*(1.82)
1.240**(2.37)
1986ln Den loc− -0.329**(-4.02)
-0.260**(-3.21)
-0.256**(-3.22)
-0.350**(-3.85)
-0.350**(-3.79)
-0.342**(-3.70)
-0.383**(-4.60)
-0.310**(-4.28)
-0.310**(-4.63)
-0.359**(-4.92)
-0.334**(-4.67)
-0.280**(-4.05)
1986ln Den area− 0.223**(2.95)
0.155(1.59)
0.344*(1.95)
0.185*(1.95)
0.327**(2.63)
0.407**(2.49)
0.238**(2.73)
0.119(1.37)
0.291**(2.02)
0.148*(1.67)
0.228**(2.44)
0.173(1.15)
2Adjusted R 0.3943 0.3629 0.4031 0.3395 0.3635 0.3642 0.3584 0.3200 0.3258 0.3842 0.3920 0.4108
Observations 149 153 154 153
**, *: significant at 5% and 10% levels, respectively.
20
6 CONCLUSIONS
In the BMR, industrial employment is being redistributed within the metropolitan area
driven by the congestion effects appearing in municipalities where employment density
started at high levels. However, this process is being conditioned by the effect of
agglomeration economies, which have a contrary effect on dispersal.
The empirical evidence supports the idea that urbanisation economies are determining the
changes in the spatial structure of industrial employment. Employment density grows more
strongly the nearer one is to the municipality of Barcelona – a dense, diversified
environment -. In addition, density grows more in supra-municipal environments with a
large total scale of production and a diversified production structure. The results also
confirm the impact of localization economies. Both proximity to a specialised subcentre and
the fact of locating in a specialised supra-municipal environment have a positive effect on
growth in manufacturing employment density. Finally, accessibility of the road network
also has a positive effect, which could be capturing the advantages of being able to access
the network economies appearing in the region as a whole at low cost, although it could also be
picking up a preference for environments that allow the efficient dispatch of products to
consumers.
On this point, it is convenient to return to the motivation for the study. The fall in
transport costs is bringing important changes in the location of industrial activity. On a
global scale, this phenomenon is behind the world processes of relocation, while on a
metropolitan scale it involves the decentralisation and dispersal of production. Although it
is undoubtedly necessary to research the gradual flattening and dispersal of cities, focusing
exclusively on this aspect may not allow the required attention to be paid to the forces
acting in the opposite direction, those not allowing a total dispersal of production despite
congestion, high land prices in the employment centres, the discomfort of excessive density
or the competition between firms amplified by proximity. The city is a coagulation of
activity and population which is extending and fragmenting, but at the end of the day it
manages to maintain its principal attraction: physical proximity between agents.
Agglomeration economies perform as powerful economic and extra-economic forces
counterbalancing the centrifugal forces leading towards dispersal. Recently, the idea seems
21
to be gaining strength that cities are extending through low-density settlement because
agglomeration economies are weakening. In fact, a more detailed analysis of the situation
leads to the more precise reformulation of this idea: cities are expanding and become more
dispersed in a controlled way, although possibly beyond what might be socially efficient,
because the costs of accessing the benefits brought about by agglomeration have been
reduced, making possible a more efficient balance between the benefits of concentration
and the costs of congestion.
REFERENCES
ACS, Z.J., AUDRETSCH, D.B. and M.P. FELDMAN (1992) Real Effects of Academic
Research : Comment, American Economic Review, 82, pp. 363-367.
ALMEIDA, P. and B. KOGUT (1999) Localization of Knowledge and the Mobility of
Engineers in Regional Networks, Management Science, 45, pp. 905-917
BERLIANT, M., PUNG, S-K and P. WANG (2002) Production Externalities and Urban
Configuration, Journal of Economic Theory, 104, pp. 275-303.
BLY, P. (1985) Surface Transport, in BROTCHIE, J., NEWTON, P., HALL, P., and P.
NIJKAMP (Eds.), The Future of Urban Form. The Impact of New Technology,
London: Routeledge.
BOIX, R. (2004) Redes de Ciudades y Externalidades, Investigaciones Regionales, 4, pp. 5-
28.
COMBES, P-P. (2000) Economic Structure and Local Growth : France, 1984–1993,
Journal of Urban Economics, 47, pp. 329-355.
DOWALL, D.E. and A. TREFFEISEN (1991) Spatial Transformation in Cities of the
Developing World. Multinucleation and Land-Capital Suburbanisation in Bogota,
Colombia, Regional Science and Urban Economics, 21, pp. 201-224.
DURANTON, G. and H.G. OVERMANS (2002) Testing for Localisation using Micro-
Geographic Data, London School of Economics Working Papers.
DURANTON, G. and D. PUGA (2004), Micro-Foundations of Urban Agglomeration
Economies, in J.V. HENDERSON and J.-F. THISSE (Eds.), Handbook of
Regional and Urban Economics, Volume 4, New York: North Holland.
ELLISON, G. and E.L. GLAESER (1997) Geographic Concentration in U.S.
Manufacturing Industries: A Dartboard Approach, Journal of Political Economy,
105, pp. 889-927.
22
FUJITA, M. (1988) A Monopolistic Competition Model of Spatial Agglomeration:
Differentiated Products Approach, Regional Science and Urban Economics, 18, pp.
87-124.
FUJITA, M. and P. KRUGMAN (1995) When is the Economy Monocentric? Von Thünen
and Chamberlin Unified, Regional Science and Urban Economics, 25, pp. 505-528.
FUJITA, M. and H. OGAWA (1982) Multiple Equilibria and Structural Transition of Non-
Monocentric Urban Configurations, Regional Science and Urban Economics, 12,
pp. 161-196.
GARCÍA, M.A. and I. MUÑIZ (2005) Descentralización del Empleo: ¿Compactación
Policéntrica o Dispersión? El caso de la Región Metropolitana de Barcelona 1986-
1996, Document de Treball 05.06, Departament d’Economia Aplicada, UAB.
GIULIANO G. and K. A. SMALL (1991) Subcenters in the Los Angeles Region, Regional
Science and Urban Economics, 21, pp. 163-182.
GLAESER, E.L., KALLAL, H.D., SCHEINKMAN, J.A. and A. SHLEIFER (1992)
Growth in Cities, Journal of Political Economy, 100, pp. 1126-1152.
GORDON, P. and H.W. RICHARDSON (1996) Beyond Polycentricity. The Dispersed
Metropolis, Los Angeles, 1970-1990, Journal of the American Planning Association,
62, pp. 289-295.
HALL.P, T. REY, H. GRACEY, and R. DREWETT (1973) The Containment of Urban
England, Allen & Unwin, Londres.
HENDERSON, J.V. (1986) Efficiency of Resource Usage and City Size, Journal of Urban
Economics, 19, pp. 47-70.
HENDERSON, J.V. (1997) Externalities and Industrial Development, Journal of Urban
Economics, 42, pp. 449-470.
HENDERSON, J.V. (2003) Marshall’s Scale Economies, Journal of Urban Economics, 53,
pp. 1-28.
HENDERSON, J.V., KUNCORO, A. and M. TURNER (1995) Industrial Development
in Cities, Journal of Political Economy, 103, pp. 1067-1090.
HOLL, A. (2004) Transport Infrastructure, Agglomeration Economies, and Firm Birth:
Empirical Evidence from Portugal, Journal of Regional Science, 44, pp. 693-712.
HOTELLING, H. (1929) Stability in Competition, Economic Journal, 39, pp. 41-57.
JAFFE, A.B., TRAJTENGERG, M. and R. HENDERSON (1993) Geographic
Localization of Knowlegde Spillovers as Evidenced by Patent Citations, Quarterly
Journal of Economics, 108, pp. 577-598.
23
KRUGMAN, P. (1991) Increasing Returns and Economic Geography, Journal of Political
Economy, 99, pp. 483-499.
KRUGMAN, P. (1993) First Nature, Second Nature and Metropolitan Location, Journal of
Regional Science, 33, pp. 129-144.
LIU, H-L. and M. FUJITA (1991) A Monopolistic Competition Model of Spatial
Agglomeration with Variable Density, Annals of Regional Science, 25, pp. 81-99.
MARSHALL, A. (1890) Principles of Economics, London.
MATAS, A. and J.L. ROIG (2004) Una aproximación sectorial a la localización industrial
en Cataluña, Documents de treball 04.06, Departament d’Economia Aplicada,
UAB.
McDONALD, J.F. (1987) The Identification of Urban Employment Subcenters, Journal of
Urban Economics, 21, pp. 242-258.
McDONALD, J.F. and D.P. McMILLEN (2000) Employment Subcenters and Subsequent
Real Estate Development in Suburban Chicago, Journal of Urban Economics, 48,
pp. 135-147.
McDONALD, J.F. and P.J. PRATHER (1994) Suburban Employment Centers: The Case
of Chicago, Urban Studies, 31, pp. 201-218.
McMILLEN, D.P. (1996) One Hundred Fifty Years of Land Values in Chicago: A
Nonparametric Approach, Journal of Urban Economics, 40, pp. 100-124.
McMILLEN, D.P. (2003) Identifying Subcenters Using Contiguity Matrices, Urban
Studies, 40, pp. 57-69.
McMILLEN, D.P. (2004) Employment Densities, Spatial Autocorrelation, and Subcenters
in Large Urban Areas, Journal of Regional Science, 44, pp. 225-243.
McMILLEN, D.P. and T.W. LESTER (2003) Evolving Subcenters: Employment and
Population Densities in Chicago, 1970-2020, Journal of Housing Economics, 12,
pp. 60-81.
McMILLEN, D.P. and J.F. McDONALD (1998) Suburban Subcenters and Employment
Density in Metropolitan Chicago, Journal of Urban Economics, 43, pp. 157-180.
MIRALLES, C. (1997) Transport i Ciutat. Reflexió sobre la Barcelona Contemporània,
Universitat Autónoma de Barcelona, Servei de Publicacions.
MOOMAW, R.L. (1983) Is Population Scale a Worthless Surrogate for Business
Agglomeration Economies?, Regional Science and Urban Economics, 13, pp. 525-
545.

24
MUÑIZ, I., GALINDO, A. and M.A. GARCÍA (2003a) ¿Es Barcelona una ciudad
policéntrica?, Document de Treball 03.09, Departament d’Economia Aplicada,
UAB.
MUÑIZ, I., GALINDO, A. and M.A. GARCÍA (2003b) Cubic Spline Population Density
Functions and Satellite City Delimitation, Urban Studies, 40, pp. 1303-1321.
NAKAMURA, R. (1985) Agglomeration Economies in Urban Manufacturing Industries: a
Case of Japanese Cities, Journal of Urban Economics, 17, pp. 108-124.
PALIVOS, T. and P. WANG (1996) Spatial Agglomeration and Endogenous Growth,
Regional Science and Urban Economics, 26, pp. 645-669.
RICHARDSON, H.W. (1995) Economies and Diseconomies of Agglomeration, in H.
GIERSCH (Ed.), Urban Agglomeration and Economic Growth, Berlin: Springer.
ROSENTHAL, S.S. and W.C. STRANGE (2001) The Determinants of Agglomeration,
Journal of Urban Economics, 50, pp. 191-229.
ROSENTHAL, S.S. and W.C. STRANGE (2003) Geography, Industrial Organization, and
Agglomeration, Review of Economics and Statistics, 85, pp. 377-393.
ROSENTHAL, S.S. and W.C. STRANGE (2004) Evidence on the Nature and Sources of
Agglomeration Economies, in J.V. HENDERSON and J.-F. THISSE (Eds.),
Handbook of Regional and Urban Economics, Volume 4, New York: North
Holland.
SVEIKAUSKAS, L. (1975) The Productivity of Cities, Quarterly Journal of Economics,
89, pp. 393-413.
TABUCHI, T. (1998) Urban Agglomeration and Dispersion: A Sintesis of Alonso and
Krugman, Journal of Urban Economics, 44, pp. 333-351.
TRULLEN, J., LLADÓS, J. and R. BOIX (2002) Economía del Conocimiento, Ciudad y
Competitividad, Investigaciones Regionales, 1, pp. 139-164.
WHITE, H. (1980) A Heteroskedasticity Consistent Covariance Matrix Estimator and a
Direct Test of Heteroskedasticity, Econometrica, 48, pp. 817-838.
WHITE, M.J. (1999) Urban Areas with decentralized Employment: Theory and Empirical
Work, in MILLS, E.S. and P. CHESHIRE (Eds.) Handbook of Regional and Urban
Economics, Vol 4, pp.1375-1412.
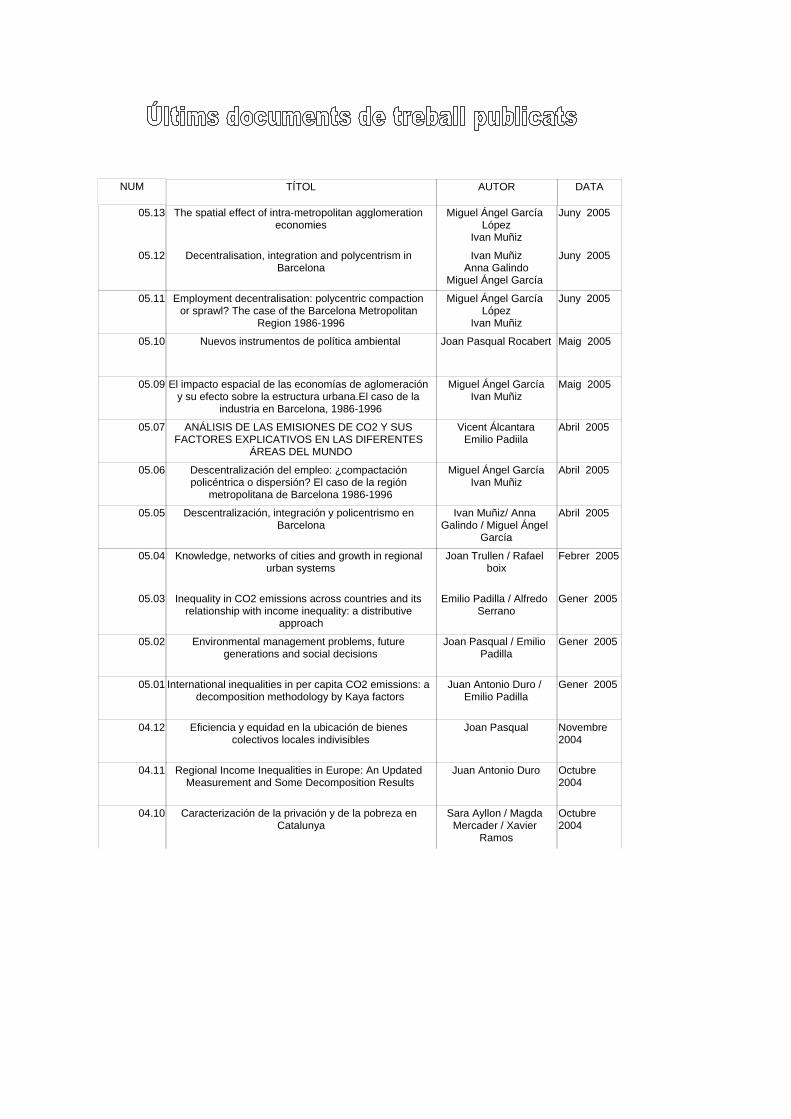
TÍTOLNUM AUTOR DATA
Juny 2005The spatial effect of intra-metropolitan agglomeration economies
05.13 Miguel Ángel García López
Ivan Muñiz
Juny 2005Decentralisation, integration and polycentrism in Barcelona
05.12 Ivan MuñizAnna Galindo
Miguel Ángel García
Juny 2005Employment decentralisation: polycentric compaction or sprawl? The case of the Barcelona Metropolitan
Region 1986-1996
05.11 Miguel Ángel García López
Ivan Muñiz
Maig 2005Nuevos instrumentos de política ambiental05.10 Joan Pasqual Rocabert
Maig 2005El impacto espacial de las economías de aglomeración y su efecto sobre la estructura urbana.El caso de la
industria en Barcelona, 1986-1996
05.09 Miguel Ángel GarcíaIvan Muñiz
Abril 2005ANÁLISIS DE LAS EMISIONES DE CO2 Y SUS FACTORES EXPLICATIVOS EN LAS DIFERENTES
ÁREAS DEL MUNDO
05.07 Vicent ÁlcantaraEmilio Padiila
Abril 2005Descentralización del empleo: ¿compactación policéntrica o dispersión? El caso de la región
metropolitana de Barcelona 1986-1996
05.06 Miguel Ángel GarcíaIvan Muñiz
Abril 2005Descentralización, integración y policentrismo en Barcelona
05.05 Ivan Muñiz/ Anna Galindo / Miguel Ángel
García
Febrer 2005Knowledge, networks of cities and growth in regional urban systems
05.04 Joan Trullen / Rafael boix
Gener 2005Inequality in CO2 emissions across countries and its relationship with income inequality: a distributive
approach
05.03 Emilio Padilla / Alfredo Serrano
Gener 2005Environmental management problems, future generations and social decisions
05.02 Joan Pasqual / Emilio Padilla
Gener 2005International inequalities in per capita CO2 emissions: a decomposition methodology by Kaya factors
05.01 Juan Antonio Duro / Emilio Padilla
Novembre 2004
Eficiencia y equidad en la ubicación de bienes colectivos locales indivisibles
04.12 Joan Pasqual
Octubre 2004
Regional Income Inequalities in Europe: An Updated Measurement and Some Decomposition Results
04.11 Juan Antonio Duro
Octubre 2004
Caracterización de la privación y de la pobreza en Catalunya
04.10 Sara Ayllon / Magda Mercader / Xavier
Ramos