Embed Size (px)
Citation preview

Teaching styles and achievement:
Student and teacher perspectives
Ana Hidalgo-Cabrillana,
Cristina Lopez-Mayan
15.02
Departament d'Economia Aplicada
Facultat d'Economia i Empresa

Aquest document pertany al Departament d'Economia Aplicada.
Data de publicació :
Departament d'Economia AplicadaEdifici BCampus de Bellaterra08193 Bellaterra
Telèfon: 93 581 1680Fax: 93 581 2292E-mail: [email protected]://www.uab.cat/departament/economia-aplicada/
Febrer 2015

Teaching Styles and Achievement: Studentand Teacher Perspectives∗
Ana Hidalgo-CabrillanaUniversidad Autonoma de Madrid
Cristina Lopez-Mayan†
Universidad Autonoma de Barcelona
February 24, 2015
Abstract
Using data from a Spanish assessment program of fourth-grade pupils, we analyze towhat extent using certain teaching practices and materials in class is related to achieve-ment in maths and reading. We distinguish using traditional and modern teaching styles.As a novelty, we measure in-class work using two different sources of information -teacherand students. Our identification strategy relies on between-class within-school variationof teaching styles. We find that modern practices are related to better achievement,specially in reading, while traditional practices, if anything, are detrimental. There aredifferences depending on the source of information: the magnitude of coefficients is largerwhen practices are reported by students. These findings are robust to considering al-ternative definitions of teaching practices. We obtain heterogeneous effects of teachingstyles by gender and type of school but only when using students’ answers. Our find-ings highlight the importance of the source of information, teacher or students, to drawadequate conclusions about the effect of teaching style on achievement.
JEL classification: I20; I21; J24
Keywords : Students and teacher reports; Test scores; Teacher quality; Modern and traditional
teaching
∗We are very grateful to valuable comments by seminar attendants at Universidad Carlos III de Madrid,Bank of Spain, Universidad Autonoma de Madrid, Centre for Economic Performance (LSE), SAEe in Palmade Mallorca, EEA-ESEM Congress and WinE Mentoring Retreat in Toulouse, ESPE Conference in Braga,IAAE Conference in London, Encuentro de Economıa Aplicada in Gran Canaria, Jornadas de Economıa dela Educacion in Valencia, IWAEE in Catanzaro, RWI Research Network Conference on the Economics ofEducation in Berlin. We acknowledge financial support from the Fundacion Ramon Areces grant (Ayudas ala Investigacion en Ciencias Sociales 2012 ). All errors are our own responsibility.†Corresponding author. E-mail: [email protected]. Address: Departament d’Economia Aplicada,
Edifici B, Campus de Bellaterra, 08193 Cerdanyola del Valles, Barcelona (Spain).

1 Introduction
The level of knowledge acquired by people during the schooling period is an important pre-
dictor of different outcomes, such as labor market careers and economic growth.1 In the
schooling period, it is widely accepted that teachers matter for the level of knowledge finally
acquired by students (Hanushek and Rivkin (2006); Hanushek (2006)). Hanushek (2011)
quantifies that an effective teacher is equivalent to advancing knowledge in one academic year.
However, the question about what attributes make a teacher more successful than another
in enhancing students’ performance has not been settled so far. As Hanushek and Rivkin
(2006) point out, previous studies do not find consistent evidence that pupils’ achievement is
strongly correlated to observable teacher characteristics, such as gender, experience, certifica-
tion, etc. Among exceptions, Rockoff (2004) and Rivkin et al. (2005), which find significant
effects of teacher experience (although small and concentrated in first years), and Dee (2005,
2007) which obtain significant effects of teacher’s gender and race. The lack of consistent evi-
dence of observed characteristics contrasts with the general finding that teacher effectiveness,
measured by teacher fixed effects, has an important impact on student achievement (Rockoff
(2004) and Rivkin et al. (2005)).
Since observed characteristics only explain a relatively small part of overall teacher quality,
a line of research has shifted the focus to teaching practices, that is, what teachers actually do
in the classroom (for instance, Van Klaveren (2011), Schwerdt and Wuppermann (2011), Lavy
(2011), Bietenbeck (2014)). These studies show that teaching practices matter for student
achievement. However, the evidence is still scarce and not conclusive, especially to identify
the best teaching practices. Many proposals to reform education advocate a greater use
of modern teaching practices in detriment of a traditional learning style. Therefore, from
a policy perspective, a better understanding of the relationship between in-class work and
student outcomes is necessary.
The objective of our paper is to analyze to what extent using certain teaching practices and
materials in class is related to student achievement. We consider two different teaching styles,
traditional and modern, and relate them to standardized student test scores. A traditional-
based style is defined by the use of rote learning, individual work, or textbooks. A modern-
based style is defined by the use of real-world problem solving, group work, or computers. We
construct traditional and modern teaching measures using two different sources of information:
from the teacher and from her students.
For our purpose, we use data from a national assessment program conducted in 2009 in
Spain, “La Evaluacion General de Diagnostico” (EGD2009). This program evaluates fourth
1See, for example, Murnane et al. (1995), Keane and Wolpin (1997), Cameron and Heckman (1993, 1998),Lazear (2003), Chetty et al. (2011a) for the effect of human capital on labor market outcomes; and Hanushekand Kimko (2000) and Hanushek and Woessmann (2012) for the effect of students’ test scores on economicgrowth.
1

grade students in several competencies, including the core ones (mathematics and reading).
The EGD2009 also collects broad contextual information through questionnaires to students,
families, teachers and principals. Importantly, the program is designed to evaluate all students
belonging to the same class, and evaluates two complete classes in most schools. Classes in
fourth grade are organized around a main teacher, the tutor, who teaches most of the subjects,
including usually maths and reading.2 Students have the same classmates for the entire school
day. In addition, EGD2009 allows linking each student with her teacher. Teacher and students
answer several questions about the practices and materials used in class work. We use this
information to measure the use of traditional and modern teaching in class. The classification
of practices as traditional or modern follows the taxonomy by Zemelman et al. (2005).
Our empirical strategy exploits between-class within-school variation in teaching practices
and test scores to identify the effect of different teaching styles on student achievement. This
type of analysis is challenging because non-random allocation of students to schools, and to
classes within school, introduces bias in the estimate of teaching practices. By exploiting
within-school variation, we deal with bias from between-school sorting. Within-school sorting
should not be a major concern in EGD2009 data since Spanish schooling system is neither
track-based in primary education, nor characterized by the practice of “teacher shopping” by
parents. We conduct an exhaustive analysis that shows no systematic assignment of teachers
and students with specific characteristics to the same class. Although classes were formed
randomly, the teacher may still adapt her teaching style to the class level finally formed.
We neither obtain evidence that supports this behavior. Nevertheless, we control for a rich
set of teacher variables (including tutoring activities) and student characteristics in order to
minimize potential bias due to unobserved traits.
Few previous studies examine the influence of teaching practices on student achievement.
Schwerdt and Wuppermann (2011) and Van Klaveren (2011) study the effect of the percentage
of time spent in lecture-style teaching using the TIMSS wave of 2003 for US and Netherlands,
respectively. Both papers use a between-subject strategy to control for unobserved student
traits. Schwerdt and Wuppermann (2011) find that shifting time from problem solving to
lecturing results in an increase in student achievement. This result is in line with Brewer and
Goldhaber (1997), which conclude that instruction in small groups and emphasis on problem
solving lead to lower student test scores. However, Van Klaveren (2011) find no relationship
between time lecturing and student performance.
Lavy (2011) analyzes the effect of traditional and modern teaching on student achievement
in Israel using a panel data of pupils in fifth and eighth grade. His identification strategy is
based on the within-school change in exposure to teaching practices among students attending
both grades. Lavy (2011) concludes that traditional and modern practices do not necessarily
crowd out each other. In particular, practices that emphasize “instilment of knowledge and
2Throughout the paper, we use the terms “teacher” and “tutor” interchangeably.
2

comprehension”, considered as traditional teaching, have a positive effect on test scores, espe-
cially of girls and pupils from low socioeconomic backgrounds. “Analytical and critical skills”,
viewed as modern teaching, have also a high payoff, especially among pupils from educated
families.
Bietenbeck (2014) analyzes the effect of traditional and modern teaching practices on
maths and science test scores using the TIMSS wave of 2007. He estimates a student fixed-
effect model, where identification relies on the different student exposure to teaching practices
between maths and science. He concludes that traditional teaching has a positive effect on
overall test scores while modern teaching has a statistically insignificant effect. After splitting
overall scores by cognitive skills, modern practices have a positive and significant effect on
reasoning, while traditional teaching increases knowing and applying skills.
Our work extends beyond those previous papers in the following. First, in contrast to
previous literature, we estimate the effect of teaching practices both using the information
reported by the teacher and by her students. Previous works use only one of these sources
of information, usually the students. EGD2009 asks the same questions on teaching prac-
tices to students and teachers. So, we use these two sources of information to construct the
variables measuring traditional and modern teaching. Information reported by students and
teachers have different advantages and disadvantages (Goe et al., 2008). Students’ reports
about teaching are useful because they provide the perspective of students, the recipients
of the teaching practices. However, student responses are subject to bias. Students do not
know all the aspects of teaching. Pupils may also answer about in-class work influenced by
personality characteristics of the teacher or by their grades. In contrast, teacher self-reports
have the advantage that teachers know their own abilities, the class context, and how they
work in class. However, teacher responses are also subject to potential biases. Teachers may
intentionally misreport their practices to adjust them to “social desired” practices. Teachers
may also unintentionally misreport their practices because they believe that they are applying
a certain practice when actually they are not. Therefore, since both student’s and teacher’s
responses on teaching practices are self-reported measures with different potential reporting
bias, using both sources of information will improve our understanding of the role of teaching
practices on student achievement. Goe et al. (2008) recommend assessing teacher effective-
ness gathering data from more than one source, especially if one of these sources are students’
reports.
Our second contribution is that we analyze the impact of teaching practices on test scores
of younger students (fourth grade, around nine years old). As many recent papers show, it
is important to understand at early stages how the education process successfully improves
student achievement and how it influences outcomes later in life (see, for instance, Heckman
(2008), and Chetty et al. (2011b)). Finally, none of the previous studies has analyzed the
impact of teacher attributes and teaching practices on student achievement in Spain. Providing
3

evidence about this is important given the serious problems faced by the Spanish educational
system: high dropout rate (23.5% in 2013 according to Eurostat) and lack of excellence (as
shown by the low performance in PISA).
Estimation results from using students’ and teacher’s answers show that modern practices
are related to better student achievement, while traditional teaching, if anything, is detri-
mental. The magnitude of the coefficients is larger when practices are reported by students.
The use of traditional and modern materials in class is not significantly associated to test
scores. We also show that there are heterogeneous effects across subjects: modern teaching
practices are positively related to reading scores, while the relationship is not significant for
maths scores. We analyze the sensitivity of these findings to alternative definitions of teaching
practices.
We obtain heterogeneous effects after splitting the sample by gender and type of school,
but only depending on the source of information. When practices are reported by teacher, the
estimates do not differ for boys and girls, or for public and private schools. When practices
are reported by students, boys do no benefit from using any particular teaching style, while
girls gain from modern practices and loose from traditional ones. Also according to students’
answers, traditional (modern) practices are related to lower (higher) scores in public schools,
while estimates are not significant in private schools.
Regarding observed teacher characteristics, in line with previous literature, pupils’ achieve-
ment is not correlated to gender or experience. However, unlike previous papers, achievement
is negatively correlated with having a teacher with more than three years of college, suggesting
a negative selection of those teachers into primary education in Spain.
The rest of the paper is organized as follows. Section 2 describes the database and explains
the construction of the teaching measures. Section 3 explains the empirical strategy. Section
4 presents the results. Section 5 concludes.
2 Data
We use data from “La Evaluacion General de Diagnostico”, a national assessment program
conducted in 2009 by the Instituto Nacional de Evaluacion Educativa (INEE), a Spanish in-
stitution belonging to the Ministry of Education. This program evaluates competencies of
fourth-grade students in several subjects using a standardized test, designed by the INEE fol-
lowing PISA methodology. We focus on the analysis of competencies in the two core subjects,
maths and reading.3
EGD2009 evaluates 28,708 pupils belonging to 900 schools following a two-stage stratified
sampling design. In the first stage, schools are selected with probabilities proportional to their
3The program also evaluates students’ competencies on knowledge of the physical world and on civic values.Knowledge of the physical world refers to knowledge about life and health, the Earth and the environment.The civic competence assesses student’s understanding of democratic, social and civic values.
4

fourth grade enrollment. In the second stage, one or two fourth grade classes of the school are
randomly sampled and all students belonging to these classrooms are evaluated. The sample
design ensures that assessment results are representative at national and regional level, and
by type of school (public/private).
The test consists of both multiple-choice questions and constructed-response items, where
the latter requires that students generate and write their own answers. Those type of questions
are intended to measure facts, analytical skills and critical thinking (INEE, 2009). Student’s
overall achievement is made available through five plausible values. Like in other assessment
programs, for each student, these values are random draws from an estimated proficiency
distribution obtained using student answers to the test items and applying the Item Response
Theory. Scores were constructed to have mean equal to 500 and standard deviation equal to
100. However, we standardize scores to have mean zero and standard deviation one in order
to interpret coefficients as fractions of a standard deviation.
EGD2009 also collects detailed contextual information through questionnaires to students,
families, teachers, and school principals. Students and families report, among other, gender,
date of birth, country of origin, household composition, age at starting school, parents’ edu-
cation, parents’ labor status, parents’ support in doing homework, and whether the student
repeated.4
The teacher questionnaire is answered by the tutor of the class. In Spain, fourth grade
students have a teacher, the tutor, who teaches most of the subjects, including the core
ones (maths and reading). Pupils have the same classmates for the entire school day. It is
also usual that students are assigned to a class in first grade and they continue with the same
classmates until the end of primary education (sixth grade). Apart from the relatively standard
set of variables (gender, experience, degree, training), the tutor questionnaire provides rich
information on the practices and materials used in class work, subjects taught, and tutoring
activities.
The original sample contains 28,708 pupils distributed into 1,358 classrooms in 900 schools.
From this initial sample, we drop (i) students with missing maths or reading scores; (ii)
classes with less than five pupils; (iii) students and teachers with blank questionnaires; (iv)
teachers who do not teach maths nor reading, so we are sure that teachers in the final sample
teach the subjects we analyze; (v) students and teachers with missing information in basic
observed variables (gender, country of origin, parents’ education and labor status, household
composition, experience, type of teacher’s degree)5; (vi) teachers with missing information on
4Regarding household composition we construct two categories: living in single-parent household, andliving with siblings. Regarding parents’ education, we distinguish the following categories for both parents:primary or less, compulsory, high school, vocational training, and university. Regarding parents’ labor status,we construct the following categories: self-employed, employee, unemployed, and inactive.
5Since we do control for both parents’ education and labor status, we do not use information on homeresources to avoid dropping too many individuals from the initial sample.
5

teaching items. As we discuss later, since our identification strategy relies on within-school
variation, we do not keep in the sample schools with one sampled class. The final sample
contains 11,774 students from 716 classrooms and 358 schools. We check that the final sample
is still representative of the target population of fourth-grade students in Spain (there are not
significant differences in the distribution of characteristics from initial and final samples).
Table 1 presents statistics describing fourth grade teachers in primary school in Spain.
They are mainly women, with more than thirty years of experience, teaching mathematics
and reading in classes with sixteen students on average.6 74% are tutors of the same class in
third grade. 17% hold more than a three-years university degree (five-years degree, master or
PhD), which is the minimum education level required by law to teach in primary education.
Many teachers respond to have participated in some type of training in the last two years,
although these variables present quite missing responses. Regarding tutoring work, teachers
meet with parents an average of three times per school year, and it is more usual that the tutor
asks for meetings. The characteristics of the learning environment and disciplinary climate
are captured by the proportion of warning letters about student’s behavior sent to her family,
and by the percentage of warnings about temporary class suspension.
Table 2 reports descriptive statistics of student characteristics. Around half of fourth-
grade pupils are girls and 5% has repeated at least once. 7% live in single-parent households
and most students live with at least one sibling. The proportion of non-Spanish pupils is
7%, coming mainly from Non-Western Europe and Latin America. A high percentage started
school with three years old or less, which is the usual age to start school in Spain. Schooling
attainment of mothers and fathers is similar, while the proportion of unemployed or inactive
mothers is higher than the proportion of fathers.
Average reading and mathematics test scores are similar for the full sample (Table 3).
Differences appear by gender and type of school. On average, girls perform better than boys
in reading, while boys perform better in maths. Average scores are larger in both subjects for
students in private schools.
2.1 Teaching practices and materials
Information about teaching practices is derived from the question, “How often do you use the
following teaching practices in your lessons this school year?”. On a point-four scale, possible
answers are “Never or almost never”, “Sometimes”, “Almost always”, and “Always”. Teachers
respond about each of the following practices: (a) “Most of the time I teach by telling”, (b)
“Students present works or topics to classmates”, (c) “While I teach, I ask students questions
about the lesson”, (d) “While I teach, students ask me doubts”, (e) “I promote discussions”, (f)
“Students work on exercises and activities proposed by me”, (g) “Students work individually”,
6Class size is the total number of surveyed students in a class in the initial sample.
6

(h) “Students work in small groups”, (i) “I give different exercises or activities to best/worst
students”. We do not consider this last item in the analysis because it reflects the level of
students in class, leading to a problem of reverse causality in the estimation. According to the
taxonomy by Zemelman et al. (2005), practices (b), (e), and (h) can be classified as modern,
and practices (a), (f), and (g) as traditional. However, it is not possible to unambiguously
match items (c) and (d) as traditional or modern. In principle, item (c) may be thought as
traditional and item (d) as modern, but it is also possible the other way around.
EGD2009 data supports this classification. Table 5 shows correlation coefficients among
tutor’s answers to all items. Modern items (b), (e), and (h) are positively correlated (with
coefficients around 0.26). The same pattern appears for traditional items (a), (f), and (g),
with coefficients ranging from 0.13 to 0.30. Items (d) and (c), classified as modern and
traditional, respectively, present a positive, but smaller, correlation with the respective modern
and traditional items. At the same time, item (c) is positively correlated with modern items,
and item (d) with traditional ones, while this pattern is not observed for the rest of items (see
bottom left of the Table). Moreover, these two items are correlated with a coefficient equal to
0.46. Consistently with Zemelman et al. (2005)’s taxonomy, it is difficult to unambiguously
classified items (c) and (d), and we exclude them from the baseline measure of teaching
practices (see final classification in Table 4). In Section 4.2 we check the robustness of the
results to include items (c) and (d).
For the ease of interpretation, we rescale answers to each item by assigning a proportional
value as follows: 0 to “Never or almost never”, 0.34 to “Sometimes”, 0.67 to “Almost always”,
and 1 to “Always”. In this way, responses are interpreted as the proportion of the time used
in that activity. The aggregate measure of traditional teaching practices is the mean of the
teacher’s answers to items (a), (f) and (g); and the aggregate measure of modern teaching
practices is the mean of the teacher’s answers to items (b), (e) and (h).
Information about teaching materials is derived from the question, “How often do you use
in your lessons the following materials?”. Using the same possible answers as in question 21,
teachers respond about: (a) textbook, (b) workbook, (c) books from school library, (d) your
own materials, (e) newspapers, (f) computers and internet, (g) audiovisual aids. We assign
the proportional values 0, 0.34, 0.67, and 1, to each item. The traditional index is constructed
by averaging teacher’s answers to items (a) and (b), and the modern index is constructed as
the mean to items (f) and (g).
The EGD2009 survey asks students the same questions about practices and materials.
In particular, the question about practices is “In general, how is in-class work?”. Possible
answers correspond exactly with items (a) to (h) from the teacher questionnaire and they
are coded using the same scale. It should be noted that the question to students is about
all class work and, although the tutor teaches most subjects, student’s answers might refer
to another teacher. The question on teaching materials is “How often do you use in the
7

lessons the following materials?”, and possible items are the same included in the teacher’s
question (except item (d)). Assigning the same proportional values (0, 0.34, 0.67, 1), and using
the same classification, we construct modern and traditional measures of teaching practices
and materials by averaging students’ responses at class level (excluding the student’s own
response).
As explained in Introduction, using students’ and teacher’s answers have different ad-
vantages and disadvantages. However, since they are self-reported measures with different
potential reporting bias, it is advisable to use more than one source, especially if one of these
sources are students’ reports. So, unlike previous literature, which uses only one source of
information, usually the students, we estimate the relationship between teaching style and
achievement by measuring the teaching style according to the perspectives of teacher and
students.
Table 6 contains the average and standard deviation of modern and traditional indexes
constructed with tutor’s and students’ answers. On average, teachers report an use of tradi-
tional and modern practices for 66% and 43% of class time, respectively. The proportion of
the time using traditional or modern materials is similar (65% and 34% respectively). Average
pupils’ answers are close to tutors’ response: students slightly underreport modern teaching
and materials, and overreport traditional teaching, but not traditional materials. To gain
further insight about to what extent students’ answers differ from tutor’s ones, we calculate
the gap in the indexes of the tutor and each of her students. Then, we average those gaps
at class level to obtain the distribution of the within-class differences in teacher and student
indexes. Figure 5 shows histograms of this distribution and Table 8 present some descrip-
tive statistics. Figure 5 shows that the average gap in each index is small because positive
and negative differences in students’ and tutor’s index compensate each other across classes
(symmetric distribution of differences). In other words, within each class, students’ answers
do differ from her tutor’s responses, but without a clear positive or negative pattern for the
whole sample.
As we explain in Section 3, we estimate separately using tutor’s and students’ responses.
In each specification, we include jointly traditional and modern indexes. In order to interpret
the effects, we should note that the two measures do not imply a trade-off between using tra-
ditional or modern methods in class. The estimated coefficient of one of the indexes should be
interpreted as the effect on test scores holding constant the other index. In this way, we do not
restrict the possibility that some teaching practices can be conducted, at least to some degree,
simultaneously, even if one practice is traditional and another is modern7. For instance, one
possible activity proposed by the teacher (item (f), traditional) may be to promote discussions
in class (item (e), modern). So, the two practices would happen simultaneously. Indeed, Table
5 shows a positive correlation between these two items. Nevertheless, we assess the sensitivity
7Note that questions about practices and materials do not impose either any restriction of this type.
8

of our results to construct a new measure of teaching practices that imposes that the time
using traditional or modern activities must not violate the time budget constraint.
Table 7 shows that the correlation between traditional and modern practices indexes is not
significantly different from zero. This is the result of negative and positive correlations across
individual items that may compensate each other (see bottom left of Table 5). The correlation
between traditional and modern materials indexes is not zero, but small (0.11). For indexes
constructed with tutor’s information, the correlation between modern practices and materials
is 0.22 and between traditional practices and materials is 0.36, both statistically significant
at one percent level. Those correlations are a bit higher for the students indexes. Correlation
among tutor’s and students’ answers is positive and significant, ranging from 0.10 to 0.24 (see
matrix in the left bottom of Table 7). A positive correlation reflects that students’ and tutor’s
answers go in the same direction. However, the small correlation is evidence that pupils and
tutor’s perception is far from identical.
Finally, Table 9 presents the overall, between- and within-school variance in teaching prac-
tices and materials. Not surprisingly, most of the variation in teaching practices appears
between schools. However, a non-negligible amount still happens within a school (around one
third). Between-class variation in the use of different materials is smaller according to tutor
(21%-23%), but larger according to students (35%-41%).
3 Empirical Strategy
The effect of traditional and modern teaching on student achievement can be estimated using
the following education production function:
yics = α + γ′TIcs + λ′Tcs + β′Xics + φs + εics (1)
where yics is the standardized test score of student i in class c at school s. TIcs is the vector
of traditional and modern teaching indexes in class c in school s (ModTIcs, TradTIcs). We
estimate two specifications, one with modern and traditional practices indexes, and another
with modern and traditional materials indexes. In turn, we run separate regressions for the
indexes constructed using the tutor’s and the students’ answers8. Tcs is a vector of tutor
variables and class size. Xics is a vector of student characteristics. φs is a school fixed effect
and εics is the error term.
The identifying assumption of the effect of traditional and modern teaching on student
achievement (γ) is that teaching practices (and materials) are uncorrelated with the error
term conditional on the other regressors. One of the potential confounding factors is the
endogenous selection of students and teachers across schools. This between-school sorting
8Note that when we use the students’ answers, the indexes are constructed excluding the student’s ownanswer (ModTIcs−i, TradTIcs−i)
9

will happen if, for instance, students attending a school present specific characteristics as
a consequence of the nonrandom choice of neighborhood by parents. Related to this, some
parents may prefer a school that hires teachers with some specific characteristics or that has
certain teaching philosophy. To deal with this endogenous selection of students and teachers
we focus on schools with two sampled classes and include school fixed effects. Therefore,
in this approach identification of γ relies on between-class within-school variation in teaching
styles and test scores. This requires enough within-school variation in data (school fixed effects
account for between-school variation). As shown in Table 9, an important proportion of total
variation in teaching styles happens across classes within school.
Even after accounting for between-school sorting, there may be still unobserved student
and teacher traits (µics and ηcs, respectively) in the error term that may bias the estimate of
γ. In particular, γ would be biased:
- If there is some student unobserved trait that has a direct effect on yics while it is
correlated with the teaching style. That is, γ would be biased if corr(µics, T Ics) 6= 0.
This would happen if there is sorting of students to classes within school (so, the ability
composition of the two classes will be different) and the teacher adapts her teaching
practices to the resulting level of ability in the class (reverse causality). For example, if
high-ability students are assigned to the same class and the teacher decides to increase
the use of modern practices with that class, the estimate of γ will be biased. It is
important to note that although µics affects scores, if students are more or less randomly
assigned to classes, and teachers do not adapt their teaching style to the ability of the
class, γ will not be biased.
- If there are unobserved teacher traits that have a direct impact on yics, while they are
correlated with the teaching style. That is, γ would be biased if corr(ηcs, T Ics) 6= 0.
This would happen if unobserved teacher ability or motivation affect the choice of the
teaching style, while they have a direct effect on student test scores, aside from the effect
through the teaching style.
3.1 Within-school selection of students and teachers
As discussed above, if the teaching style is correlated with µics and ηcs within-school, the
estimate of γ will be biased. This correlation may appear as a result of non-random assignment
of students and teachers to classes within-school. For instance, within-school sorting arises if
parents “buy” the teacher assigned to the class. In our analysis, this source of selection is not
a concern because “teacher shopping” is absent or very rare in Spain. We also should note that
in primary education in Spain there is not an explicit rule to assign students to classes because
the system is not track-based. However, we cannot disregard that within-school sorting does
10

not exist because a school principal still may decide to assign students to classes, or teachers,
following a non-random rule. For example, we will obtain biased estimates if ability is used
to assign students to classes, and, then, the teacher decides to adjust her teaching style to the
final ability level in the class. Another concern is whether more motivated or able teachers
choose a certain teaching style. To assess to what extent these issues can be a problem in
EGD2009 data, we conduct the following analysis.
First, we investigate whether students with certain family characteristics are more likely
to be in classes with certain type of teacher. To this end, we regress observed teacher variables
on sociodemographic characteristics of students measured at class level:
tcs = α0 + α′1Xcs + φs + vics
where tcs is a characteristic of the tutor of class c in school s; Xcs is a vector of sociodemo-
graphic characteristics of class c at school s; and φs is a school fixed effect. Table 10 reports
the results. Each column represents a separate regression. The variables that capture the so-
ciodemographic characteristics of the class are parents’ education, parents’ employment, and
percent of: non-Spanish, students with siblings, living in single-parent household, female, and
repeater. With respect to teacher variables, we consider gender, years of experience, holding
a five-years university degree, taught subjects (maths and reading, only reading), and tutor in
third and fourth grades. Last two columns present the results from regressing modern and tra-
ditional teaching practices on class-level variables. We do not find a systematic within-school
relationship of teacher characteristics and teaching practices with class-level variables. That
is, no relationship with proportion of non-Spanish, percentage of repeaters in class, students
from low-educated families, etc. We also check the joint significance of regressors with an
F-test (last rows of Table 10). In all regressions, F-statistics do not reject the null hypothesis
that the joint effect of class-level characteristics is zero at five percent level.
Second, we analyze whether classes that differ in teaching practices, differ in pupils’ char-
acteristics as well. For this purpose, following Lavy (2011), we regress student-level variables
on modern and traditional teaching practices, and school fixed effects:
xics = β0 + β′1TPcs + φs + ϕics
where xics is the characteristic of student i in class c at school s, TPcs is the vector of modern
and traditional indexes of teaching practices, and φs is a school fixed effect. Student charac-
teristics are: parents’ education, parents’ labor status, living in single-parent household, living
with siblings, gender, repeater and non-Spanish origin. Table 11 presents the results. For each
panel, each column represents a separate regression. Neither traditional nor modern teaching
practices are systematically correlated with student characteristics. In most regressions, the
effect of teaching practices is not significantly different from zero. In addition, F-statistics
do not allow rejecting the null hypothesis that the effect of traditional and modern practices
11
is jointly zero. Thus, conditioning on the school, we conclude that students with certain
characteristics are not more likely to be assigned to teachers using certain practices.
To sum up, evidence from Tables 10 and 11 does not show a systematic within-school
assignment of students with certain characteristics to certain type of teachers. However, even
though classes are formed more or less randomly, they may receive other school resources
differently. For instance, a teacher with a specific teaching style may be assigned to classes of
certain size. To check this, we run
tpcs = λ0 + λ1size+ λ2size2 + φs + ςics
where tpcs denotes teaching practices (traditional or modern); size is class size and φs is
school fixed effect. Results are shown in Table 12, where each column represents a separate
regression. Columns one and three do not include school fixed effects. Individual and joint
significance of class size and class size squared does not show systematic correlation between
these variables and teaching practices, especially after conditioning on school.
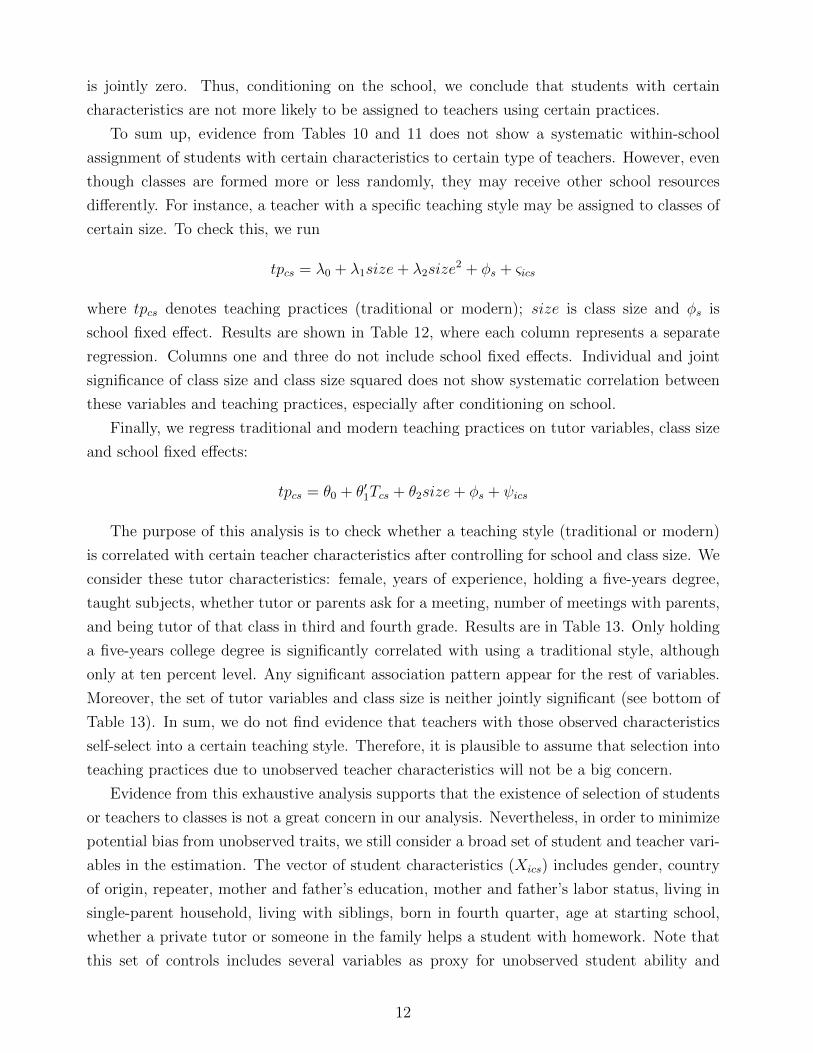
Finally, we regress traditional and modern teaching practices on tutor variables, class size
and school fixed effects:
tpcs = θ0 + θ′1Tcs + θ2size+ φs + ψics
The purpose of this analysis is to check whether a teaching style (traditional or modern)
is correlated with certain teacher characteristics after controlling for school and class size. We
consider these tutor characteristics: female, years of experience, holding a five-years degree,
taught subjects, whether tutor or parents ask for a meeting, number of meetings with parents,
and being tutor of that class in third and fourth grade. Results are in Table 13. Only holding
a five-years college degree is significantly correlated with using a traditional style, although
only at ten percent level. Any significant association pattern appear for the rest of variables.
Moreover, the set of tutor variables and class size is neither jointly significant (see bottom of
Table 13). In sum, we do not find evidence that teachers with those observed characteristics
self-select into a certain teaching style. Therefore, it is plausible to assume that selection into
teaching practices due to unobserved teacher characteristics will not be a big concern.
Evidence from this exhaustive analysis supports that the existence of selection of students
or teachers to classes is not a great concern in our analysis. Nevertheless, in order to minimize
potential bias from unobserved traits, we still consider a broad set of student and teacher vari-
ables in the estimation. The vector of student characteristics (Xics) includes gender, country
of origin, repeater, mother and father’s education, mother and father’s labor status, living in
single-parent household, living with siblings, born in fourth quarter, age at starting school,
whether a private tutor or someone in the family helps a student with homework. Note that
this set of controls includes several variables as proxy for unobserved student ability and
12

previous performance (for instance repeater, or parents’ education). The vector of tutor char-
acteristics (Tcs) includes, aside from typical controls used in the literature (gender, experience,
or type of degree), whether the tutor teaches only maths, only reading or both, and variables
capturing teacher’s work as tutor (number of meetings with parents, whether tutor or parents
ask for a meeting, being tutor of the class in third grade). Unobserved teacher effort or ability
is captured, although partially, through some of these variables.
Although we cannot rule-out completely the presence of unobserved teacher or student
traits, and consequently we have to be cautious in interpreting our estimates as causal, we
should note that (i) we conduct an exhaustive analysis showing no evidence of within-school
sorting; (ii) we do not find evidence of correlation of teaching practices with observed teacher
and class characteristics, so it is plausible to assume that selection on unobservables is neither
a big concern; (iii) we include a broad set of regressors to control for possible differences in
student background and tutor across classes, once we have accounted for school. Finally, note
that the potential problem of endogeneity of teaching variables with test scores in a particular
subject is ameliorated because tutor and students answer about teaching practices or materials
generally used in class, instead of about the particular teaching style used in maths or reading.
4 Results
Table 14 presents results from estimation of regression (1) where TIcs denotes the vector of
modern and traditional teaching practices. Table 15 presents estimation results where TIcs
is the vector of modern and traditional teaching materials. Results are obtained by pooling
maths and reading test scores and including a dummy variable for maths. Standard errors are
clustered at school level.
Columns (1) to (3) show the results corresponding to teaching practices reported by tutor,
and columns (4) to (6) present the estimates using students’ answers. In column (1) and (4), we
estimate an specification of regression (1) that includes only the vector of teaching practices,
and a maths dummy. In columns (2) and (5), we add class size and teacher characteristics.
In columns (3) and (6), we include student characteristics9. Using tutor’s answers, the effect
of modern teaching practices is positive and significant in the most complete specification
-including teacher and student control variables. The coefficient is 0.21, which implies that a
10% increase in the modern index is associated with a 2.1% of a standard deviation increase in
test scores. The effect of traditional teaching practices is small and not significant. Estimates
hardly change after adding teacher and student controls. The coefficients of traditional and
modern teaching practices are larger using students’ answers than tutor’s answers, but, again,
only the effect of modern teaching is significant. In the specification involving all covariates,
a 10% increase in the modern index is associated with a 3.4% of a standard deviation increase
9The estimated coefficients of student characteristics are presented in Tables A.1 and A.2 in Appendix.
13

in the test score. This effect is robust to adding teacher and student control variables.
Using traditional materials in class is associated with larger scores when the information
is reported by the tutor, but with lower ones when the information is reported by students
(Table 15). The effect of modern materials is positive, and larger when using students’ answers.
However, the effect of materials is not estimated with precision in any regression.
In line with previous literature, we do not find strong evidence that pupils’ achievement
is correlated to observable teacher characteristics, such as gender or experience. The effect
of being female is negligible and not significant. Having a teacher with more than five years
of experience is associated with higher test scores, although the effect is only significant for
teachers with 15 to 19, or with more than 30 years of experience. We neither find a clear
relationship of test scores with taught subjects. Regarding tutoring work, being tutor of the
class also in third grade is related to better achievement, but the effect is small and significant
at ten percent level only when using tutor’s answers. The most interesting effect appears for
the type of degree that tutor holds. Teachers with five-years university degree or more are
associated to a lower student achievement of 0.08 standard deviations compared to teachers
with a three-years college degree. The effect is significant at five percent level and robust
across all specifications. Since holding a three-years degree is required to teach in primary
education in Spain, the negative effect may suggest that teachers with more years of college are
negatively self-selected. That is, they may decide to work as primary education teachers after
not finding a job in the private sector and/or in secondary education (where the requirement is
to hold at least a five-years college degree). Consequently, those teachers may lack motivation
or adequate teaching skills, and this would explain the negative effect that we find. Unlike us,
previous works obtain that teachers with more years of education are related to better student
performance.
To better understand why we get different estimates of teaching practices depending on
whether we use students’ or teacher’s reports, we analyze to what extent the gap in tutor
and student indexes is related to observed characteristics. We regress this gap on teacher and
student observed variables, school fixed effects, and dummy for public school. We also include
the first plausible values in maths and reading in order to explore whether differences in student
and teacher perception are related to student ability -for instance, high achievers may perceive
better teacher’s work, responding more similar to her. Results are in Table B.1 in Appendix.
In general, tutor characteristics are not significantly correlated to the teacher-student gap in
practices and materials. With respect to student characteristics, most significant effects appear
for modern practices. This may suggest that, for some reason, students find more difficult to
perceive modern than traditional practices. A complementary explanation is that students
capture well modern practices but tutor’s answers have more measurement error because she
identifies her teaching style as modern although it is not. Note that being tutor in third and
fourth grade reduces the gap in modern practices by 0.04. This is likely to reflect that students
14

with the same tutor over two years have a better knowledge of her class work, responding
closer to tutor’s responses. Female, higher plausible values, and higher mother’s education are
associated to a larger gap in modern practices. Repeater, starting school older, and born in
Latin America or Asia are related to a lower gap in modern practices. Female and repeater
present the reverse correlation with the gap in traditional practices. Attending a public school
reduces the gap by 0.33 and 0.17 in modern and traditional practices, respectively. It also
reduces the gap in traditional materials. In modern materials, the correlation is positive but
small.
Our results provide new insights on the effect of teaching style on achievement. Lavy (2011)
finds that both traditional and modern teaching practices have positive effects on test scores,
larger for traditional teaching. Bietenbeck (2014) concludes that only traditional teaching has
a statistically significant and positive effect on overall test scores. Schwerdt and Wuppermann
(2011) find that teachers who spend more time lecturing are associated with higher test scores.
In contrast, we obtain that modern teaching is related to better student achievement, while
traditional teaching, if anything, is detrimental. Previous evidence is found using only one
source of information (teachers in Schwerdt and Wuppermann (2011), and students in Lavy
(2011) and Bietenbeck (2014)). Our results show that the sign of the effects obtained with
students’ answers is consistent with the sign found using tutor’s answers, but the magnitude
of the coefficients is larger with students’ information. These differences suggest that the
source of information about in-class work is important for a better understanding of the role
of practices on achievement.
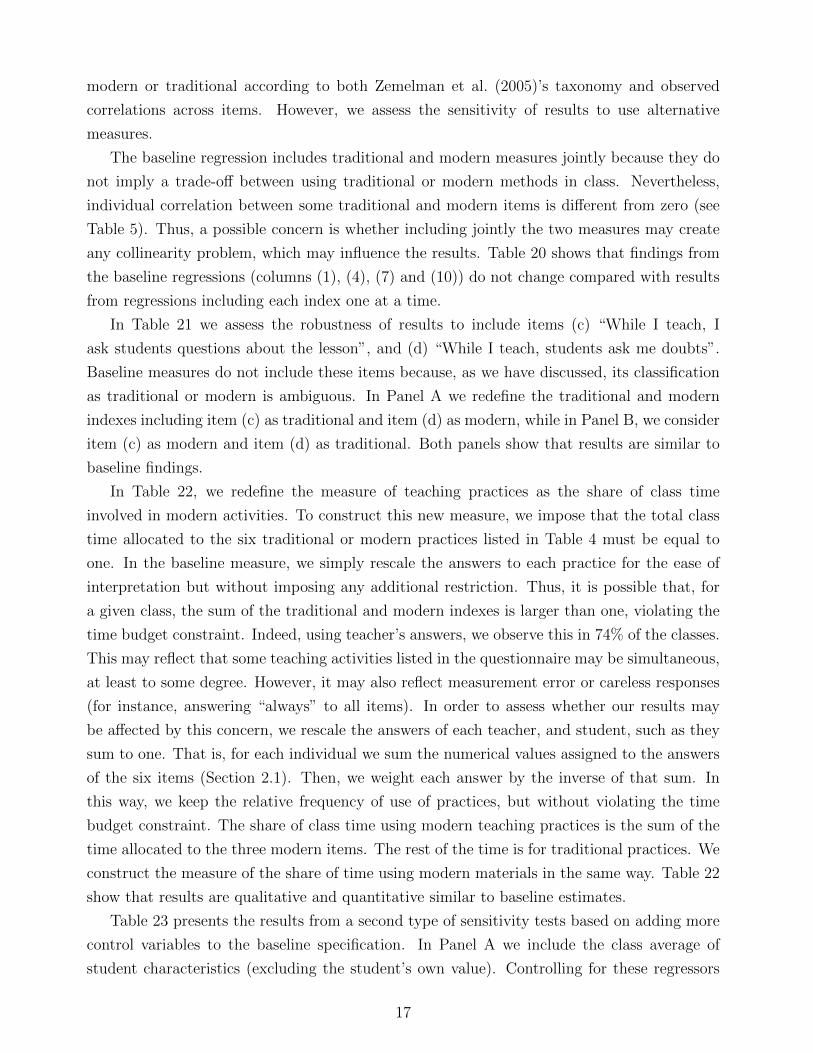
4.1 Heterogeneous effects
Previous results are obtained assuming that the effects of modern and traditional styles are
the same in maths and reading. Now, we explore whether there are heterogeneous effects by
subject. Tables 16 and 17 present the results, where columns (1) and (2) show the effect of
practices and columns (3) and (4) the effect of materials. We estimate separately for maths and
reading instead of using interaction terms for these subjects with teaching variables. Although
sample sizes are smaller, the separate approach allows the effect of the rest of variables to
differ by subject. The estimates including interaction terms would capture differences in
the effect of practices by subject, but also differences in the effect of other variables. Using
modern practices in reading is related to better student achievement and the effect is large
-a 10% increase in the modern index is associated with 3.1% to 4.3% of a standard deviation
increase in test scores. The use of modern practices in maths also is related to higher scores,
although the effect is not significant. Applying traditional practices is not significantly related
to achievement, except with students’ answers, where the effect is large (-0.32) and significant
at 10%. Therefore, the overall positive effect of modern practices in Table 14 comes through its
15

impact on reading scores. The relationship between the use of modern or traditional materials
and achievement is not significant in maths. In reading, using the information reported by
students, modern materials are significantly and strongly associated to scores (coefficient equal
to 0.48).
To gain deeper knowledge about the effect of teaching practices on student achievement,
we explore whether there are heterogeneous effects by gender (Table 18) and type of school
(Table 19). We estimate by splitting the sample by these subgroups. Table 18 shows a gender
gap by subject: boys perform better in maths than girls (maths dummy equal to 0.12 in the
regression for boys and -0.13 in the regression for girls). However, the estimates of modern
and traditional practices do not reveal differences across boys and girls if the tutor reports the
practices (Panel A). The picture is quite different when estimates are obtained using students’
reports (Panel B). In this case, we find striking differences by gender. For girls, the use of
traditional practices is associated to lower scores, while the use of a modern style is related to
better achievement. The estimates for boys are smaller and not significant. Looking at each
subject separately, we find that this gender gap appears for reading but not for maths.
In Table 19 we stratify the sample by public and private schools. The subsample of private
schools include also charter schools. First of all, there is not significant public-private gap by
subject (maths dummy is not significantly different from zero). Using tutor’s answers (Panel
A), estimates hardly differ across public and private schools. Only a positive and significant
association between the use of traditional style and maths scores is found in private schools,
but not in public schools. Again, the picture obtained using students’ answers is different
(Panel B). In public schools, the use of traditional practices is associated to lower scores (-
0.34) and the use of modern practices to higher scores (0.40). These effects are not significantly
different from zero in private schools. By subject, this public-private gap appears in reading
but not in maths.
The existence of differences in the effects of teaching styles across gender and type of school
if indexes are constructed with students’ but not with tutor’s answers suggest that those gaps
do not reflect real differences in the effects of practices. Instead, they may be the result of
differences in the perception of traditional and modern styles for boys and girls, or for students
in public schools, which will translate into different answers about teaching practices.
4.2 Sensitivity analysis
In this Section, we conduct several sensitivity tests in order to address potential reservations
about our findings10. In the first set of tests, we assess whether results hold after considering
alternative ways of measuring teaching practices. Our preferred regressor simply averages
tutor’s or students’ answers across those practices that can be unambiguously classified as
10For the sake of brevity we present results for maths and reading scores. Results from pooling scores areavailable upon request.
16
modern or traditional according to both Zemelman et al. (2005)’s taxonomy and observed
correlations across items. However, we assess the sensitivity of results to use alternative
measures.
The baseline regression includes traditional and modern measures jointly because they do
not imply a trade-off between using traditional or modern methods in class. Nevertheless,
individual correlation between some traditional and modern items is different from zero (see
Table 5). Thus, a possible concern is whether including jointly the two measures may create
any collinearity problem, which may influence the results. Table 20 shows that findings from
the baseline regressions (columns (1), (4), (7) and (10)) do not change compared with results
from regressions including each index one at a time.
In Table 21 we assess the robustness of results to include items (c) “While I teach, I
ask students questions about the lesson”, and (d) “While I teach, students ask me doubts”.
Baseline measures do not include these items because, as we have discussed, its classification
as traditional or modern is ambiguous. In Panel A we redefine the traditional and modern
indexes including item (c) as traditional and item (d) as modern, while in Panel B, we consider
item (c) as modern and item (d) as traditional. Both panels show that results are similar to
baseline findings.
In Table 22, we redefine the measure of teaching practices as the share of class time
involved in modern activities. To construct this new measure, we impose that the total class
time allocated to the six traditional or modern practices listed in Table 4 must be equal to
one. In the baseline measure, we simply rescale the answers to each practice for the ease of
interpretation but without imposing any additional restriction. Thus, it is possible that, for
a given class, the sum of the traditional and modern indexes is larger than one, violating the
time budget constraint. Indeed, using teacher’s answers, we observe this in 74% of the classes.
This may reflect that some teaching activities listed in the questionnaire may be simultaneous,
at least to some degree. However, it may also reflect measurement error or careless responses
(for instance, answering “always” to all items). In order to assess whether our results may
be affected by this concern, we rescale the answers of each teacher, and student, such as they
sum to one. That is, for each individual we sum the numerical values assigned to the answers
of the six items (Section 2.1). Then, we weight each answer by the inverse of that sum. In
this way, we keep the relative frequency of use of practices, but without violating the time
budget constraint. The share of class time using modern teaching practices is the sum of the
time allocated to the three modern items. The rest of the time is for traditional practices. We
construct the measure of the share of time using modern materials in the same way. Table 22
show that results are qualitative and quantitative similar to baseline estimates.
Table 23 presents the results from a second type of sensitivity tests based on adding more
control variables to the baseline specification. In Panel A we include the class average of
student characteristics (excluding the student’s own value). Controlling for these regressors
17

hardly changes the effect of practices or materials on student achievement. This supports our
previous evidence that there is not within-school sorting. If results were driven by this type of
selection, controlling for sociodemographic characteristics of the class would change results.
5 Conclusions
In this paper, we explore to what extent using traditional or modern practices and materials
in class is related to student achievement in maths and reading in primary education. As
a novelty, we measure in-class work using two different sources of information -students and
tutor. Analyzing the effect of teaching on student achievement is challenging because schools,
and classes within school, are not formed randomly. To deal with this non-random assignment,
our identification strategy relies on between-class within-school variation of teaching styles.
We also conduct an exhaustive analysis to show that systematic within-school assignment of
students or teachers to classes is not a concern.
Estimation results from using separately students’ and teacher’s answers show that modern
practices are related to better student achievement, while traditional teaching, if anything,
is detrimental. The magnitude of the coefficients is larger when practices are reported by
students. The use of traditional and modern materials in class is not significantly associated
to test scores. By subject, we find that modern teaching practices improve reading achieve-
ment, while they are not significant for maths. Results are robust to considering alternative
definitions of teaching practices and to controlling for class-average socio-demographic char-
acteristics.
We also explore whether there are heterogeneous effects by gender and type of school.
Results differ depending on the source of information. When practices are reported by teacher,
estimates do not differ for boys and girls, or for public and private schools. When practices
are reported by students, boys do no benefit from using any particular teaching style, while
girls gain from modern practices and loose from traditional ones. Also according to students’
answers, traditional (modern) practices are related to lower (higher) scores in public schools,
while estimates are not significant in private schools.
Regarding observed teacher characteristics, pupils’ achievement is not correlated to gender
or experience, but, unlike previous literature, it is negatively correlated with having a teacher
with more years of education. We argue that this may reflect a negative selection of those
teachers into primary education. Spanish educational authorities should take into account this
misallocation problem when establishing degree requirements to teach in primary education.
Our findings about differences in teaching style estimates depending on who reports the
information about in-class work are important from a policy perspective. We should note that
findings from previous works rely only on one source -usually the students. We discuss that
using practices reported by students or teachers have different advantages and disadvantages.
18

However, since both are self-reported measures with different potential reporting bias, using
both sources of information will improve our understanding of the role of teaching practices
on student achievement, involving better policy recommendations.
19

References
Bietenbeck, J. C. (2014): “Teaching Practices and Cognitive Skills,” Labour Economics,
in press.
Brewer, D. J. and D. D. Goldhaber (1997): “Why don’t schools and teachers seem to
matter?” The Journal of Human Resources, 32, 505–523.
Cameron, S. V. and J. J. Heckman (1993): “The Nonequivalence of High School Equiv-
alents,” Journal of Labor Economics, 11, 1–47.
——— (1998): “Life Cycle Schooling and Dynamic Selection Bias: Models and Evidence for
Five Cohorts of American Males,” Journal of Political Economy, 106, 262–333.
Chetty, R., J. Friedman, and J. Rockoff (2011a): “The Long-Term Impacts of Teach-
ers: Teacher Value-Added and Student Outcomes in Adulthood,” NBER Working Paper
No. 17699.
Chetty, R., J. N. Friedman, N. Hilger, E. Saez, D. W. Schanzenbach, and D. Ya-
gan (2011b): “How Does Your Kindergarten Classroom Affect Your Earnings? Evidence
from Project Star,” Quarterly Journal of Economics, 216, 1593–1660.
Dee, T. S. (2005): “A Teacher like Me: Does Race, Ethnicity, or Gender Matter?” American
Economic Review Papers and Proceedings, 95, 158–165.
——— (2007): “Teachers and the Gender Gaps in Student Achievement,” Journal of Human
Resources, 42, 528–554.
Goe, L., C. Bell, and O. Little (2008): “Approaches to Evaluating Teacher Effectiveness:
a Research Synthesis,” National Comprehensive Center for Teacher Quality.
Hanushek, E. (2011): “The Economic Value of Higher Teacher Quality,” Economics of
Education Review, 30, 466–479.
Hanushek, E. A. (2006): School resources, in Handbook of the Economics of Education,
edited by Eric A. Hanushek and Finis Welch. Amsterdam: North Holland, vol. 2, chap. 14,
865–908.
Hanushek, E. A. and D. D. Kimko (2000): “Schooling, labor force quality, and the growth
of nations,” American Economic Review, 90, 1184–1208.
Hanushek, E. A. and S. Rivkin (2006): Teacher Quality, in Handbook of the Economics
of Education, edited by Eric A. Hanushek and Finis Welch. Amsterdam: North Holland,
vol. 2, chap. 18, 1051–1078.
20

Hanushek, E. A. and L. Woessmann (2012): “Do better schools lead to more growth?
Cognitive skills, economic outcomes, and causation,” Journal of Economic Growth, 17, 267–
321.
Heckman, J. J. (2008): “Schools, Skills and Synapses,” Economic Inquiry, 46, 289–324.
INEE (2009): “Evaluacion General de Diagnostico 2009. Marco de la evaluacion,” Instituto
Nacional de Evaluacion Educativa.
Keane, M. P. and K. I. Wolpin (1997): “The Career Decisions of Young Men,” Journal
of Political Economy, 105, 473–522.
Lavy, V. (2011): “What Makes an Effective Teacher? Quasi-Experimental Evidence,” NBER
Working Paper No. 16885.
Lazear, E. P. (2003): “Teacher Incentives,” Swedish Economic Policy Review, 10, 179–241.
Murnane, R. J., J. B. Willet, and F. Levy (1995): “The Growing Importance of
Cognitive Skills in Wage Determination,” Review of Economics and Statistics, 77, 251–266.
Rivkin, S. G., E. A. Hanushek, and J. F. Kain (2005): “Teachers, Schools, and Aca-
demic Achievement,” Econometrica, 73, 417–458.
Rockoff, J. E. (2004): “The Impact of Individual Teachers on Student Achievement: Evi-
dence from Panel Data,” American Economic Review Papers and Proceedings, 94, 247–252.
Schwerdt, G. and A. C. Wuppermann (2011): “Is traditional teaching really all that
bad? A within-student between-subject approach,” Economics of Education Review, 30,
365–379.
Van Klaveren, C. (2011): “Lecturing Style Teaching and Student Performance,” Economics
of Education Review, 30, 729–739.
Zemelman, S., H. Daniels, and A. Hyde (2005): Best Practice. Today’s Standards for
Teaching and Learning in America’s Schools, Heinemann, third ed.
21

Figures
Figure 1: Histogram of distribution of within-class gap between teacher and student indexes0
12
34
Den
sity
-1 -.5 0 .5 1
Modern practices
01
23
Den
sity
-1 -.5 0 .5 1
Traditional practices
01
23
4D
ensi
ty
-1 -.5 0 .5 1
Modern materials0
12
34
Den
sity
-1 -.5 0 .5 1
Traditional materials
22

Tables
Table 1: Descriptive statistics of teacher
Mean Std. Dev. ClassroomsFemale 0.75 0.43 716Experience (years):
Less than 5 0.10 0.30 7165 - 9 0.10 0.30 71610 - 14 0.07 0.25 71615 - 19 0.09 0.29 71620 - 24 0.10 0.30 71625 - 29 0.15 0.36 71630 or more 0.39 0.49 716
5-years degree or more 0.17 0.37 716Class size 16.44 4.61 716Taught subjects:
Reading and Maths 0.88 0.33 716Reading 0.05 0.22 716Maths 0.07 0.26 716
Training:Attending courses 0.95 0.21 538Working teams at school 0.93 0.26 480Congresses and teaching projects 0.88 0.33 386
Type of warnings to students:Letter to the family 0.68 0.46 679Temporary class suspension 0.16 0.37 663
Person asking for a meeting:Parents 0.22 0.41 714Teacher 0.33 0.47 714
Number of meetings with students’ parents 3.04 0.97 711Teacher at 3rd and 4th grades 0.74 0.44 709Number of schools 358
23

Table 2: Descriptive statistics of students
Mean Std. Dev. ObservationsFemale 0.49 0.50 11774Repeater 0.05 0.23 11774Born in 4th quarter 0.32 0.47 11774Living in single-parent household 0.07 0.26 11774Living with siblings 0.85 0.36 11774Country of origin:
Spain 0.93 0.26 11774Western Europe 0.00 0.05 11774Non-Western Europe 0.02 0.12 11774Morocco 0.00 0.07 11774Latin America 0.05 0.21 11774Asia 0.00 0.04 11774Other 0.00 0.06 11774
Age at starting school:2 years old or less 0.60 0.49 117743 years old 0.36 0.48 117744 years old 0.03 0.16 117745 years old 0.01 0.10 117746 years old 0.00 0.07 11774
Mother’s education:Primary or less 0.10 0.30 11774Compulsory 0.24 0.43 11774High School 0.14 0.35 11774Vocational training 0.20 0.40 11774University 0.31 0.46 11774
Father’s education:Primary or less 0.13 0.33 11774Compulsory 0.26 0.44 11774High School 0.15 0.36 11774Vocational training 0.20 0.40 11774University 0.26 0.44 11774
Mother’s labor status:Self-employed 0.13 0.34 11774Employee 0.52 0.50 11774Unemployed 0.10 0.30 11774Inactive 0.25 0.43 11774
Father’s labor status:Self-employed 0.26 0.44 11774Employee 0.65 0.48 11774Unemployed 0.07 0.26 11774Inactive 0.02 0.13 11774
Help with homework:Private tutor 0.09 0.29 11602Family 0.61 0.49 11602
Number of schools 358
24

Table 3: Descriptive statistics of test scores
Maths ReadingFull sample 0.13 0.14
(1.00) (0.98)By gender:
Male 0.21 0.09(1.03) (0.97)
Female 0.06 0.19(0.96) (0.98)
Gap (male-female) 0.15 -0.05
By type of school:Public 0.04 0.04
(1.00) (0.99)Private 0.30 0.31
(0.98) (0.93)Gap (public-private) -0.26 -0.27
Students 11774 11774Classrooms 716 716Schools 358 358
Test scores are standardised with mean 0 and standard de-
viation 1. Standard deviation in parenthesis
Table 4: Matched teacher questionnaire items
Traditional Teaching Practices Modern Teaching PracticesItem (a): Most of the time I teach by telling Item (b): Students present works or topics
to classmates
Item (f): Students work on exercises and activities Item (e): I promote discussionsproposed by me
Item (g): Students work individually Item (h): Students work in small groups
Traditional Teaching Materials Modern Teaching MaterialsItem (a): Textbook Item (f): Computers and internet
Item (b): Workbook Item (g): Audiovisual aids
Teachers respond to the question “How often do you use the following teaching practices/materials in your
lessons this school year?”. Possible answers are “Never or almost never”, “Sometimes”, “Almost always”, and
“Always”.
25

Table 5: Correlation across teaching practices (Tutor’s answers)
Modern items Traditional items(b) (e) (h) (d) (a) (f) (g) (c)
(b) 1.00
(e) 0.25** 1.00(0.00)
Modernitems (h) 0.26** 0.26** 1.00
(0.00) (0.00)
(d) 0.07 0.18** 0.12** 1.00(0.08) (0.00) (0.00)
(a) 0.09** -0.03 -0.02 0.10** 1.00(0.01) (0.37) (0.65) (0.01)
(f) 0.07 0.09** 0.06 0.26** 0.13** 1.00(0.06) (0.02) (0.12) (0.00) (0.00)
Traditionalitems (g) -0.05 -0.10** -0.13** 0.09** 0.25** 0.30** 1.00
(0.22) (0.01) (0.00) (0.02) (0.00) (0.00)
(c) 0.11** 0.19** 0.07 0.46** 0.20** 0.14** 0.09** 1.00(0.00) (0.00) (0.05) (0.00) (0.00) (0.00) (0.02)
Sample: 358 schools, 716 classrooms, 11774 students. Standard deviation in parenthesis. ∗∗ p < 0.05. (b):
“Students present works or topics to classmates”; (e): “I promote discussions”; (h): “Students work in
small groups”; (d): “While I teach, students ask me doubts”; (a): “Most of the time I teach by telling”;
(f): “Students work on exercises and activities proposed by me”; (g): “Students work individually”; (c):
“While I teach, I ask students questions about the lesson”.
Table 6: Descriptive statistics of indexes
Mean Std. Dev. Min. Max. ClassroomsTutor’s answers:
Modern practices 0.43 0.14 0.00 0.89 716Traditional practices 0.66 0.15 0.11 1.00 716Modern materials 0.34 0.16 0.00 1.00 716Traditional materials 0.65 0.20 0.00 1.00 716
Students’ answers:Modern practices 0.40 0.10 0.13 1.00 716Traditional practices 0.76 0.08 0.37 0.95 716Modern materials 0.32 0.10 0.00 0.81 716Traditional materials 0.65 0.08 0.33 0.87 716
26

Table 7: CorrelationsTutor’s answers Students’ answers
Practices Materials Practices MaterialsMod. Trad. Mod. Trad. Mod. Trad. Mod. Trad.
Mod. 1.00Practices
Trad. 0.00 1.00(0.98)
Tutor’sanswers
Mod. 0.22*** -0.04 1.00Materials (0.00) (0.27)
Trad. 0.00 0.36*** -0.03 1.00(0.91) (0.00) (0.49)
Mod. 0.24*** 1.00Practices (0.00)
Trad. 0.19*** -0.01 1.00(0.00) (0.80)
Students’answers
Mod. 0.17*** 0.37*** 0.04 1.00Materials (0.00) (0.00) (0.31)
Trad. 0.10*** 0.19*** 0.44*** 0.11*** 1.00(0.00) (0.00) (0.00) (0.00)
Sample: 358 schools, 716 classrooms, 11774 students. Standard deviation in parenthesis. ∗∗∗ p < 0.01
27

Table 8: Distribution of within-class gap between teacher and student indexes
Mean Std. Dev. Min. Max. ClassroomsModern practices 0.03 0.15 -0.53 0.55 661Traditional practices -0.10 0.15 -0.58 0.52 669Modern materials 0.03 0.17 -0.59 0.73 659Traditional materials 0.01 0.21 -0.84 0.56 685
Table 9: Decomposition of variance in class-level means
Tutor’s answersTeaching Materials
Modern Traditional Modern TraditionalOverall 0.18 0.21 0.23 0.38Between 0.13 0.14 0.18 0.30Within 0.06 0.07 0.05 0.08% within 30.61 33.59 23.31 21.16
Students’ answersTeaching Materials
Modern Traditional Modern TraditionalOverall 0.09 0.06 0.09 0.05Between 0.06 0.04 0.06 0.03Within 0.03 0.02 0.03 0.02% within 32.23 30.86 35.37 41.16
Sample: 358 schools, 716 classrooms, 11774 students
28

Table 10: Within-school assignment of teachers to classrooms: effect of class-level characteristics
Dependent variable: Teacher characteristicYears of experience 5-years Taught subjects Teacher Teach. Practices
Female 5-9 10-14 15-19 20-24 25-29 ≥30 degree Read-Maths Read 3rd-4th g. Trad. Mod.Mother educ.:
Compulsory 0.17 0.21 0.16 0.01 -0.20 -0.42∗ 0.30 0.18 -0.23 0.06 0.25 -0.08 -0.05(0.27) (0.21) (0.18) (0.23) (0.19) (0.23) (0.37) (0.21) (0.23) (0.21) (0.25) (0.10) (0.09)
High School 0.27 -0.07 0.45∗∗ -0.10 -0.06 -0.34 0.19 0.31 -0.10 0.03 0.04 -0.08 -0.04(0.35) (0.26) (0.18) (0.25) (0.28) (0.31) (0.44) (0.30) (0.24) (0.22) (0.32) (0.12) (0.10)
Vocational -0.04 0.08 0.29 -0.06 -0.26 -0.16 0.24 0.01 -0.14 -0.02 -0.07 -0.23∗ 0.01(0.34) (0.24) (0.20) (0.23) (0.29) (0.31) (0.46) (0.30) (0.26) (0.22) (0.35) (0.13) (0.10)
University 0.07 0.04 0.34∗ 0.02 -0.35 -0.43 0.28 0.19 -0.17 -0.00 -0.36 -0.01 -0.10(0.36) (0.22) (0.19) (0.23) (0.27) (0.29) (0.45) (0.32) (0.25) (0.23) (0.34) (0.12) (0.10)
Father educ.:Compulsory -0.29 -0.09 0.03 -0.06 0.49∗ 0.33 -0.36 -0.19 0.57∗∗∗ -0.34∗ 0.20 0.06 0.04
(0.35) (0.21) (0.20) (0.25) (0.25) (0.26) (0.43) (0.26) (0.20) (0.19) (0.32) (0.11) (0.10)High School -0.61∗ -0.04 -0.43∗∗ 0.15 0.56∗ 0.56∗ -0.30 -0.44 0.04 0.04 0.40 0.15 -0.07
(0.36) (0.23) (0.19) (0.21) (0.29) (0.29) (0.42) (0.32) (0.19) (0.21) (0.30) (0.11) (0.10)Vocational -0.35 -0.03 -0.19 0.16 0.39 0.62∗∗ -0.77∗ -0.57∗ 0.23 -0.17 -0.04 0.11 0.01
(0.35) (0.22) (0.19) (0.23) (0.29) (0.31) (0.42) (0.30) (0.23) (0.21) (0.34) (0.10) (0.09)University -0.13 0.15 -0.12 -0.19 0.65∗∗ 0.40 -0.67 -0.28 0.13 -0.18 0.19 -0.01 0.02
(0.36) (0.22) (0.19) (0.24) (0.29) (0.32) (0.43) (0.32) (0.20) (0.20) (0.32) (0.11) (0.10)% non-Spanish
10-20% -0.02 0.05 0.02 -0.08 -0.07∗ -0.02 0.04 0.13∗∗ -0.02 0.00 0.01 0.01 -0.01(0.07) (0.05) (0.03) (0.05) (0.04) (0.07) (0.08) (0.05) (0.03) (0.02) (0.06) (0.02) (0.02)
More 20% -0.11 0.05 0.11∗ -0.03 -0.07 -0.01 -0.11 0.24∗∗ -0.04 0.05 -0.07 -0.01 0.03(0.10) (0.08) (0.06) (0.06) (0.08) (0.08) (0.12) (0.10) (0.07) (0.05) (0.10) (0.03) (0.03)
% siblings -0.19 0.19 0.05 -0.07 -0.09 -0.11 0.19 -0.07 0.11 -0.18 0.37∗ 0.11 -0.01(0.21) (0.17) (0.12) (0.12) (0.18) (0.19) (0.23) (0.24) (0.16) (0.11) (0.22) (0.07) (0.06)
Each column is a separate regression, including school fixed effects. Reference outcomes: primary education, < 10% non-Spanish, self-employed.
Standard errors clustered at the school level in parentheses. ∗ p < 0.10, ∗∗ p < 0.05, ∗∗∗ p < 0.01. (Continued on next page)
29

Table 10: (continued)
Dependent variable: Teacher characteristicYears of experience 5-years Taught subjects Teacher Teach. Practices
Female 5-9 10-14 15-19 20-24 25-29 ≥30 degree Read-Maths Read 3rd-4th g. Trad. Mod.% single-hh 0.04 0.02 0.11 0.03 -0.26 -0.19 0.41 -0.19 0.11 0.01 0.28 -0.02 -0.17∗
(0.31) (0.21) (0.19) (0.21) (0.28) (0.29) (0.41) (0.33) (0.20) (0.16) (0.31) (0.10) (0.10)% female -0.33∗ 0.14 0.03 -0.01 -0.09 0.06 -0.01 0.05 -0.10 -0.07 0.22 -0.01 0.06
(0.20) (0.13) (0.12) (0.14) (0.15) (0.18) (0.25) (0.18) (0.13) (0.13) (0.18) (0.06) (0.06)% repeater 0.17 0.42∗ 0.00 -0.27 -0.01 0.10 -0.13 0.28 0.56∗∗∗ -0.29 0.05 0.12 0.04
(0.41) (0.23) (0.28) (0.25) (0.30) (0.33) (0.44) (0.32) (0.22) (0.19) (0.38) (0.11) (0.10)Mother employm.:
Employee 0.57∗∗ -0.07 -0.07 0.02 -0.06 0.34 -0.39 0.05 -0.17 0.07 -0.10 0.02 0.04(0.25) (0.18) (0.18) (0.20) (0.17) (0.22) (0.29) (0.25) (0.14) (0.12) (0.22) (0.08) (0.08)
Unemployed 0.23 -0.11 0.12 -0.21 -0.09 0.02 0.24 0.10 -0.50∗∗ 0.32∗∗ -0.22 0.09 -0.08(0.31) (0.26) (0.24) (0.25) (0.23) (0.28) (0.40) (0.34) (0.21) (0.16) (0.29) (0.11) (0.09)
Inactive 0.36 -0.01 -0.04 -0.00 -0.19 0.60∗∗ -0.49 -0.04 -0.11 0.06 -0.12 0.05 0.00(0.28) (0.19) (0.19) (0.23) (0.21) (0.26) (0.36) (0.27) (0.17) (0.15) (0.27) (0.10) (0.09)
Father employm.:Employee 0.01 0.14 0.01 0.19 -0.29∗ -0.04 -0.02 -0.23 0.21 -0.02 0.11 0.04 -0.14∗∗∗
(0.22) (0.13) (0.10) (0.16) (0.16) (0.18) (0.25) (0.21) (0.15) (0.10) (0.18) (0.06) (0.05)Unemployed -0.50 0.12 0.13 0.49∗ 0.11 -0.06 -0.83∗ -0.63∗ 0.01 -0.02 -0.17 -0.07 -0.24∗∗∗
(0.35) (0.29) (0.24) (0.26) (0.27) (0.30) (0.43) (0.35) (0.20) (0.12) (0.35) (0.11) (0.09)Inactive -0.85 -0.54 0.31 -0.05 -0.73 1.00 0.10 0.29 0.60 -0.68∗∗ 0.43 0.07 -0.18
(0.67) (0.38) (0.39) (0.37) (0.51) (0.61) (0.84) (0.51) (0.38) (0.30) (0.59) (0.19) (0.15)Observations 11774 11774 11774 11774 11774 11774 11774 11774 11774 11774 11664 11774 11774R2 0.59 0.58 0.58 0.61 0.53 0.57 0.56 0.55 0.73 0.59 0.65 0.68 0.71F-test 1.22 0.88 0.92 0.70 1.17 1.22 0.94 1.15 1.36 0.86 0.92 0.89 1.44p-value 0.24 0.61 0.56 0.82 0.28 0.24 0.53 0.30 0.14 0.64 0.56 0.60 0.10Each column is a separate regression, including school fixed effects. Reference outcomes: primary education, < 10% non-Spanish, self-employed.∗ p < 0.10, ∗∗ p < 0.05, ∗∗∗ p < 0.01. Standard errors clustered at the school level in parentheses. F-test: joint significance of class-level variables.
30

Table 11: Within-school assignment of teachers to classrooms: effect of teaching practicesDependent variable: Student characteristic
Single-parent hh Siblings Female Repeater Non-SpanishTraditional teaching -0.01 0.07 0.00 0.03 -0.01
(0.03) (0.04) (0.05) (0.02) (0.03)Modern teaching -0.05 0.02 0.07 -0.00 -0.00
(0.03) (0.04) (0.06) (0.03) (0.03)F-test 1.51 1.34 0.78 0.80 0.22p-value 0.22 0.26 0.46 0.45 0.80R2 0.04 0.06 0.05 0.06 0.13Observations 11774 11774 11774 11774 11774
Mother’s educationCompulsory High School Vocational training University
Traditional teaching -0.02 0.01 -0.08∗ 0.05(0.05) (0.04) (0.04) (0.05)
Modern teaching -0.00 -0.01 0.04 -0.04(0.05) (0.04) (0.05) (0.05)
F-test 0.09 0.07 2.07 1.09p-value 0.91 0.93 0.13 0.34R2 0.11 0.05 0.06 0.21Observations 11774 11774 11774 11774
Father’s educationCompulsory High School Vocational training University
Traditional teaching -0.02 0.05 0.03 -0.03(0.04) (0.04) (0.04) (0.05)
Modern teaching 0.02 -0.04 0.00 0.01(0.05) (0.04) (0.05) (0.05)
F-test 0.15 1.09 0.23 0.29p-value 0.86 0.34 0.79 0.75R2 0.10 0.04 0.06 0.22Observations 11774 11774 11774 11774
Mother’s labor statusEmployee Unemployed Inactive
Traditional teaching -0.00 0.03 -0.00(0.06) (0.03) (0.05)
Modern teaching 0.02 -0.06 0.03(0.06) (0.04) (0.05)
F-test 0.04 1.58 0.17p-value 0.96 0.21 0.85R2 0.10 0.06 0.09Observations 11774 11774 11774
Father’s labor statusEmployee Unemployed Inactive
Traditional teaching 0.04 -0.01 0.01(0.05) (0.03) (0.01)
Modern teaching -0.07 -0.06∗∗ -0.01(0.05) (0.03) (0.01)
F-test 1.10 2.29 0.20p-value 0.33 0.10 0.82R2 0.05 0.08 0.04Observations 11774 11774 11774
Each column in each panel is a separate regression, including school fixed effects. Traditional and modern
teaching reported by tutor. Standard errors clustered at the school level in parentheses. ∗ p < 0.10, ∗∗ p < 0.05,∗∗∗ p < 0.01. F-test: joint significance of traditional and modern teaching indexes.
31

Table 12: Within-school assignment of teachers to classrooms: effect of class size
Traditional teaching practices Modern teaching practicesClass size 0.01∗ -0.00 -0.00 0.01
(0.01) (0.01) (0.01) (0.01)
Class size2 -0.00 -0.00 0.00 -0.00(0.00) (0.00) (0.00) (0.00)
F-test 1.90 0.31 0.29 0.59p-value 0.15 0.74 0.75 0.56School fixed effects No Yes No YesR2 0.00 0.67 0.00 0.70Observations 11774 11774 11774 11774
Traditional and modern teaching reported by tutor. Standard errors clustered at the school level
in parentheses. ∗ p < 0.10, ∗∗ p < 0.05, ∗∗∗ p < 0.01. F-test: joint significance of class size and
class size2.
32

Table 13: Within-school assignment of teachers to classrooms: Effect of teacher characteristics
Dependent variable: Teaching indexTraditional Modern
Female -0.02 0.02(0.02) (0.02)
Years of experience (ref: < 5):5 - 9 0.03 0.01
(0.03) (0.03)10 - 14 0.04 0.02
(0.03) (0.03)15 - 19 0.02 0.03
(0.03) (0.04)20 - 24 0.02 0.01
(0.03) (0.03)25 - 29 0.00 0.02
(0.03) (0.03)30 or more 0.03 0.02
(0.03) (0.03)5-years degree or more -0.04∗ -0.00
(0.02) (0.02)Taught subjects (ref: Maths):
Reading and Maths -0.00 -0.01(0.04) (0.03)
Reading 0.01 0.01(0.06) (0.05)
Person asking for a meeting:Parents 0.01 -0.02
(0.03) (0.02)Teacher -0.01 -0.01
(0.02) (0.02)# of meetings with parents 0.02 -0.00
(0.02) (0.02)Teacher at 3rd and 4th grades -0.00 -0.01
(0.02) (0.02)Class size -0.00 -0.00
(0.00) (0.00)Constant 0.45∗∗∗ 0.57∗∗∗
(0.09) (0.08)F-test 0.79 0.20p-value 0.68 1.00School fixed effects Yes YesR2 0.69 0.70Observations 11583 11583
Traditional and modern teaching reported by tutor. Standard errors clustered at the
school level in parentheses. ∗ p < 0.10, ∗∗ p < 0.05, ∗∗∗ p < 0.01. F-test: joint
significance of teacher characteristics.
33

Table 14: Estimation results (Teaching practices)
Tutor’s answers Students’ answers(1) (2) (3) (4) (5) (6)
Traditional practices -0.01 0.03 0.00 -0.17 -0.17 -0.21(0.11) (0.11) (0.11) (0.18) (0.18) (0.16)
Modern practices 0.15 0.15 0.21∗ 0.33∗ 0.45∗∗ 0.34∗
(0.13) (0.13) (0.12) (0.17) (0.18) (0.17)Maths dummy -0.00 -0.00 -0.01 -0.00 -0.00 -0.00
(0.01) (0.01) (0.01) (0.01) (0.01) (0.01)Class size 0.01 0.01 0.01 0.00
(0.01) (0.01) (0.01) (0.01)Teacher variables:Female 0.02 0.01 0.02 0.00
(0.03) (0.03) (0.03) (0.03)Years of exp. (ref: < 5):
5 - 9 0.02 0.04 0.01 0.03(0.06) (0.06) (0.06) (0.06)
10 - 14 0.10 0.11 0.08 0.11(0.07) (0.07) (0.07) (0.07)
15 - 19 0.10 0.11∗ 0.10 0.11∗
(0.06) (0.06) (0.06) (0.06)20 - 24 0.02 0.01 0.00 0.02
(0.06) (0.05) (0.06) (0.06)25 - 29 0.08 0.07 0.06 0.07
(0.06) (0.05) (0.06) (0.06)30 or more 0.09∗ 0.09∗ 0.09∗ 0.11∗∗
(0.05) (0.05) (0.05) (0.05)5-years degree or more -0.09∗∗ -0.09∗∗ -0.10∗∗∗ -0.09∗∗∗
(0.04) (0.03) (0.03) (0.03)Taught subjects (ref: Maths):
Reading and Maths -0.11 -0.05 -0.09 -0.04(0.07) (0.06) (0.07) (0.07)
Reading -0.14∗ -0.12 -0.14∗ -0.11(0.08) (0.08) (0.08) (0.08)
Person asking for a meeting:Parents 0.00 0.02 -0.01 0.00
(0.04) (0.04) (0.04) (0.04)Teacher -0.00 0.04 -0.00 0.02
(0.05) (0.04) (0.05) (0.05)Number of meetings with parents -0.02 -0.02 -0.03 -0.02
(0.03) (0.03) (0.03) (0.03)Dependent variable: Student test score in maths and reading. Standard errors clustered at school
level in parentheses. ∗ p < 0.10, ∗∗ p < 0.05, ∗∗∗ p < 0.01. (Continued on next page)
34

Table 14: (continued)
Tutor’s answers Students’ answers(1) (2) (3) (4) (5) (6)
Teacher at 3rd and 4th grades 0.03 0.06∗ 0.03 0.04(0.03) (0.03) (0.04) (0.04)
Constant 0.81∗∗∗ 0.69∗∗∗ 0.37 0.95∗∗∗ 0.92∗∗∗ 0.73∗∗∗
(0.09) (0.25) (0.25) (0.13) (0.27) (0.27)Student’s characteristics No No Yes No No YesSchool FE Yes Yes Yes Yes Yes YesObservations 23548 23166 22826 21452 21100 20900R2 0.15 0.15 0.22 0.14 0.14 0.21
Dependent variable: Student test score in maths and reading. Standard errors clustered at school
level in parentheses. ∗ p < 0.10, ∗∗ p < 0.05, ∗∗∗ p < 0.01. Student’s characteristics: female, country
of origin, repeater, mother and father’s education, mother and father’s labor status, single-parent
household, siblings, born in 4th quarter, age at starting school, private tutor/family helps
with homework.
35

Table 15: Estimation results (Teaching materials)
Tutor’s answers Students’ answers(1) (2) (3) (4) (5) (6)
Traditional materials 0.13 0.10 0.13 0.00 -0.03 -0.15(0.11) (0.11) (0.11) (0.16) (0.16) (0.16)
Modern materials 0.07 0.04 0.03 0.15 0.23 0.21(0.11) (0.11) (0.11) (0.18) (0.18) (0.17)
Maths dummy -0.00 -0.00 -0.01 -0.01 -0.01 -0.01(0.01) (0.01) (0.01) (0.01) (0.01) (0.01)
Class size 0.01 0.01 0.01 0.01(0.01) (0.01) (0.01) (0.01)
Teacher variables:Female 0.02 0.01 0.03 0.02
(0.03) (0.03) (0.03) (0.03)Years of exp. (ref: < 5):
5 - 9 0.02 0.04 0.04 0.04(0.06) (0.05) (0.06) (0.06)
10 - 14 0.10 0.10 0.10 0.11(0.07) (0.07) (0.07) (0.07)
15 - 19 0.10 0.11∗ 0.11∗ 0.12∗∗
(0.06) (0.06) (0.06) (0.06)20 - 24 0.02 0.02 0.00 0.01
(0.06) (0.05) (0.06) (0.05)25 - 29 0.09 0.08 0.08 0.08
(0.06) (0.05) (0.06) (0.05)30 or more 0.09∗ 0.09∗ 0.07 0.08∗
(0.05) (0.04) (0.05) (0.04)5-years degree or more -0.09∗∗ -0.08∗∗ -0.11∗∗∗ -0.09∗∗∗
(0.04) (0.03) (0.04) (0.03)Taught subjects (ref: Maths):
Reading and Maths -0.11 -0.05 -0.09 -0.04(0.07) (0.06) (0.06) (0.06)
Reading -0.14∗ -0.12 -0.14∗ -0.12(0.07) (0.08) (0.07) (0.08)
Person asking for a meeting:Parents -0.00 0.01 0.01 0.02
(0.04) (0.04) (0.04) (0.04)Teacher -0.00 0.04 0.00 0.04
(0.05) (0.04) (0.05) (0.05)Number of meetings with parents -0.03 -0.02 -0.01 -0.01
(0.03) (0.03) (0.03) (0.03)Dependent variable: Student test score in maths and reading. Standard errors clustered at school
level in parentheses. ∗ p < 0.10, ∗∗ p < 0.05, ∗∗∗ p < 0.01. (Continued on next page)
36
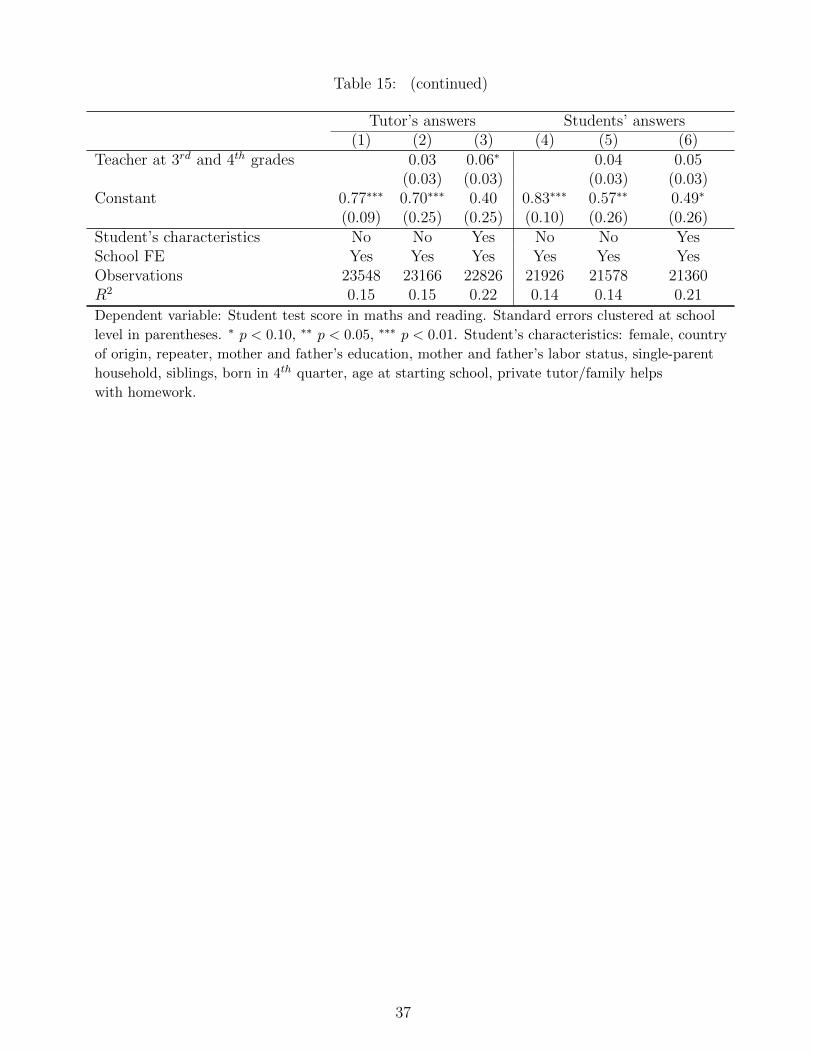
Table 15: (continued)
Tutor’s answers Students’ answers(1) (2) (3) (4) (5) (6)
Teacher at 3rd and 4th grades 0.03 0.06∗ 0.04 0.05(0.03) (0.03) (0.03) (0.03)
Constant 0.77∗∗∗ 0.70∗∗∗ 0.40 0.83∗∗∗ 0.57∗∗ 0.49∗
(0.09) (0.25) (0.25) (0.10) (0.26) (0.26)Student’s characteristics No No Yes No No YesSchool FE Yes Yes Yes Yes Yes YesObservations 23548 23166 22826 21926 21578 21360R2 0.15 0.15 0.22 0.14 0.14 0.21
Dependent variable: Student test score in maths and reading. Standard errors clustered at school
level in parentheses. ∗ p < 0.10, ∗∗ p < 0.05, ∗∗∗ p < 0.01. Student’s characteristics: female, country
of origin, repeater, mother and father’s education, mother and father’s labor status, single-parent
household, siblings, born in 4th quarter, age at starting school, private tutor/family helps
with homework.
37

Table 16: Estimation results (Maths)
Tutor Students Tutor Students(1) (2) (3) (4)
Traditional practices 0.03 -0.11(0.13) (0.21)
Modern practices 0.11 0.25(0.15) (0.20)
Traditional materials 0.10 -0.10(0.13) (0.20)
Modern materials -0.08 -0.06(0.13) (0.22)
Class size 0.01 0.00 0.01 0.01(0.01) (0.01) (0.01) (0.01)
Teacher variables:Female -0.01 -0.00 -0.01 0.00
(0.03) (0.04) (0.04) (0.04)Years of exp. (ref: < 5):
5 - 9 -0.01 -0.02 -0.01 -0.01(0.07) (0.07) (0.06) (0.06)
10 - 14 0.06 0.09 0.06 0.08(0.08) (0.09) (0.08) (0.09)
15 - 19 0.14∗ 0.13∗ 0.14∗ 0.15∗∗
(0.07) (0.08) (0.07) (0.07)20 - 24 0.05 0.05 0.05 0.05
(0.07) (0.07) (0.07) (0.07)25 - 29 0.08 0.07 0.09 0.09
(0.06) (0.07) (0.06) (0.06)30 or more 0.08 0.10∗ 0.09 0.08
(0.06) (0.06) (0.06) (0.06)5-years degree or more -0.08∗∗ -0.09∗∗ -0.07∗∗ -0.08∗∗
(0.04) (0.04) (0.04) (0.04)Taught subjects (ref: Maths):
Reading and Maths -0.06 -0.05 -0.06 -0.05(0.08) (0.08) (0.07) (0.07)
Reading -0.16 -0.17∗ -0.16∗ -0.16(0.10) (0.10) (0.10) (0.10)
Person asking for a meeting:Parents 0.04 0.02 0.04 0.04
(0.05) (0.05) (0.05) (0.05)Teacher 0.03 0.02 0.02 0.03
(0.05) (0.05) (0.05) (0.05)Dependent variable: Student test score in maths. Standard errors clustered at school level
in parentheses. ∗ p < 0.10, ∗∗ p < 0.05, ∗∗∗ p < 0.01. (Continued on next page)
38
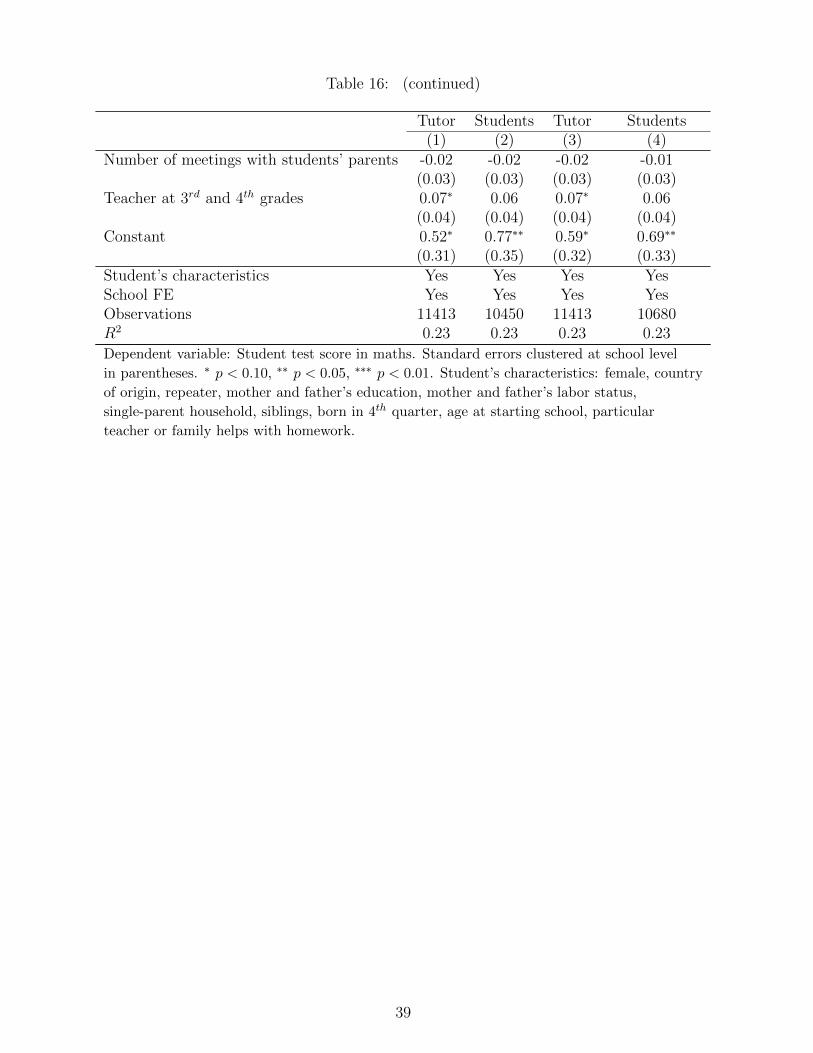
Table 16: (continued)
Tutor Students Tutor Students(1) (2) (3) (4)
Number of meetings with students’ parents -0.02 -0.02 -0.02 -0.01(0.03) (0.03) (0.03) (0.03)
Teacher at 3rd and 4th grades 0.07∗ 0.06 0.07∗ 0.06(0.04) (0.04) (0.04) (0.04)
Constant 0.52∗ 0.77∗∗ 0.59∗ 0.69∗∗
(0.31) (0.35) (0.32) (0.33)Student’s characteristics Yes Yes Yes YesSchool FE Yes Yes Yes YesObservations 11413 10450 11413 10680R2 0.23 0.23 0.23 0.23
Dependent variable: Student test score in maths. Standard errors clustered at school level
in parentheses. ∗ p < 0.10, ∗∗ p < 0.05, ∗∗∗ p < 0.01. Student’s characteristics: female, country
of origin, repeater, mother and father’s education, mother and father’s labor status,
single-parent household, siblings, born in 4th quarter, age at starting school, particular
teacher or family helps with homework.
39

Table 17: Estimation results (Reading)
Tutor Students Tutor Students(1) (2) (3) (4)
Traditional practices -0.03 -0.32∗
(0.12) (0.18)Modern practices 0.31∗∗ 0.43∗∗
(0.13) (0.21)Traditional materials 0.16 -0.19
(0.11) (0.17)Modern materials 0.13 0.48∗∗
(0.12) (0.19)Class size 0.01 0.00 0.01 0.01
(0.01) (0.01) (0.01) (0.01)Teacher variables:Female 0.02 0.01 0.03 0.03
(0.03) (0.03) (0.03) (0.03)Years of exp. (ref: < 5):
5 - 9 0.09 0.08 0.09 0.10(0.07) (0.07) (0.07) (0.07)
10 - 14 0.15∗∗ 0.14∗ 0.15∗ 0.14∗
(0.07) (0.08) (0.07) (0.08)15 - 19 0.07 0.09 0.08 0.10
(0.07) (0.07) (0.07) (0.07)20 - 24 -0.03 -0.02 -0.02 -0.03
(0.07) (0.07) (0.07) (0.07)25 - 29 0.06 0.06 0.07 0.07
(0.06) (0.07) (0.07) (0.07)30 or more 0.09 0.12∗∗ 0.09 0.09
(0.06) (0.06) (0.05) (0.06)5-years degree or more -0.09∗∗ -0.09∗∗ -0.09∗∗ -0.11∗∗
(0.04) (0.04) (0.04) (0.04)Taught subjects (ref: Maths):
Reading and Maths -0.04 -0.02 -0.04 -0.04(0.09) (0.09) (0.09) (0.09)
Reading -0.09 -0.05 -0.09 -0.08(0.10) (0.09) (0.09) (0.10)
Person asking for a meeting:Parents 0.00 -0.01 -0.01 0.01
(0.04) (0.05) (0.04) (0.05)Teacher 0.05 0.03 0.05 0.05
(0.05) (0.05) (0.05) (0.05)Dependent variable: Student test score in reading. Standard errors clustered at school level
in parentheses. ∗ p < 0.10, ∗∗ p < 0.05, ∗∗∗ p < 0.01. (Continued on next page)
40

Table 17: (continued)
Tutor Students Tutor Students(1) (2) (3) (4)
Number of meetings with students’ parents -0.02 -0.03 -0.03 -0.01(0.03) (0.03) (0.03) (0.03)
Teacher at 3rd and 4th grades 0.05 0.03 0.04 0.04(0.04) (0.04) (0.04) (0.04)
Constant 0.22 0.69∗∗ 0.21 0.29(0.28) (0.30) (0.27) (0.29)
Student’s characteristics Yes Yes Yes YesSchool FE Yes Yes Yes YesObservations 11413 10450 11413 10680R2 0.24 0.23 0.24 0.23
Dependent variable: Student test score in reading. Standard errors clustered at school level
in parentheses. ∗ p < 0.10, ∗∗ p < 0.05, ∗∗∗ p < 0.01. Student’s characteristics: female, country
of origin, repeater, mother and father’s education, mother and father’s labor status,
single-parent household, siblings, born in 4th quarter, age at starting school, particular
teacher or family helps with homework.
Table 18: Heterogeneous effects by gender
Both subjects Maths ReadingBoys Girls Boys Girls Boys Girls
A. Using tutor’s answers:
Traditional practices 0.00 -0.03 0.01 -0.01 -0.01 -0.05(0.14) (0.14) (0.17) (0.17) (0.16) (0.16)
Modern practices 0.22 0.22 0.12 0.12 0.33∗ 0.32∗
(0.16) (0.16) (0.19) (0.20) (0.18) (0.17)Maths dummy 0.12∗∗∗ -0.13∗∗∗ - - - -
(0.02) (0.02) - - - -
Observations 11524 11302 5762 5651 5762 5651
B. Using students’ answers:
Traditional practices 0.03 -0.49∗∗ 0.05 -0.31 0.01 -0.66∗∗∗
(0.22) (0.23) (0.27) (0.29) (0.25) (0.24)Modern practices 0.13 0.44∗ 0.12 0.24 0.14 0.65∗∗
(0.23) (0.23) (0.27) (0.28) (0.26) (0.27)Maths dummy 0.12∗∗∗ -0.13∗∗∗ - - - -
(0.02) (0.02) - - - -
Observations 10552 10348 5276 5174 5276 5174
Standard errors clustered at the school level in parentheses. ∗ p < 0.10, ∗∗ p < 0.05, ∗∗∗ p < 0.01.
All regressions control for teacher and student characteristics, and school fixed effects.
41

Table 19: Heterogeneous effects by type of school
Both subjects Maths ReadingPublic Private Public Private Public Private
A. Using tutor’s answers:
Traditional practices -0.09 0.32 -0.10 0.48∗ -0.08 0.16(0.12) (0.23) (0.15) (0.26) (0.14) (0.24)
Modern practices 0.20 0.20 0.15 0.09 0.25 0.30(0.17) (0.17) (0.21) (0.22) (0.18) (0.19)
Maths dummy -0.00 -0.01 - - - -(0.02) (0.02) - - - -
Observations 14616 8210 7308 4105 7308 4105
B. Using students’ answers:
Traditional practices -0.34∗ 0.26 -0.18 0.16 -0.50∗∗ 0.35(0.19) (0.32) (0.24) (0.39) (0.22) (0.32)
Modern practices 0.40∗∗ 0.10 0.36 -0.06 0.44∗ 0.26(0.20) (0.35) (0.23) (0.42) (0.25) (0.34)
Maths dummy -0.00 -0.01 - - - -(0.02) (0.02) - - - -
Observations 13226 7674 6613 3837 6613 3837
Standard errors clustered at the school level in parentheses. ∗ p < 0.10, ∗∗ p < 0.05, ∗∗∗ p < 0.01.
All regressions control for teacher and student characteristics, and school fixed effects.
42

Table 20: Robustness to include each index one at a time in the regression
Maths ReadingTutor’s answers Students’ answers Tutor’s answers Students’ answers
(1) (2) (3) (4) (5) (6) (7) (8) (9) (10) (11) (12)A. Teaching practices
Traditional index 0.03 0.04 -0.11 -0.07 -0.03 -0.01 -0.32∗ -0.21(0.13) (0.13) (0.21) (0.19) (0.12) (0.12) (0.18) (0.17)
Modern index 0.11 0.11 0.25 0.20 0.31∗∗ 0.31∗∗ 0.43∗∗ 0.38∗
(0.15) (0.15) (0.20) (0.19) (0.13) (0.13) (0.21) (0.20)
Observations 11413 11413 11413 10450 10762 10691 11413 11413 11413 10450 10762 10691
B. Teaching materials
Traditional index 0.10 0.10 -0.10 -0.10 0.16 0.16 -0.19 -0.05(0.13) (0.13) (0.20) (0.19) (0.11) (0.11) (0.17) (0.16)
Modern index -0.09 -0.09 -0.06 -0.08 0.13 0.12 0.48∗∗ 0.42∗∗
(0.13) (0.13) (0.22) (0.21) (0.12) (0.12) (0.19) (0.18)
Observations 11413 11413 11413 10680 11010 10742 11413 11413 11413 10680 11010 10742
Standard errors clustered at the school level in parentheses. ∗ p < 0.10, ∗∗ p < 0.05, ∗∗∗ p < 0.01. All regressions control for student and
teacher characteristics, class size and school fixed effects. Columns (1), (4), (7) and (10) report baseline estimations from Tables 16 and 17.
Each column in each Panel (A and B) represents a separate regression.
43

Table 21: Robustness to include items (c) and (d) in teaching practices measures
Maths ReadingTutor Students Tutor Students
A. Item (c) traditional; item (d) modern
Traditional practices index 0.08 0.00 0.00 -0.36∗
(0.15) (0.24) (0.15) (0.22)Modern practices index 0.15 0.13 0.34∗∗ 0.34
(0.17) (0.21) (0.15) (0.22)
B. Item (c) modern; item (d) traditional
Traditional practices index 0.11 -0.20 0.00 -0.42∗
(0.15) (0.24) (0.14) (0.22)
Modern practices index 0.11 0.30 0.34∗∗ 0.39∗
(0.18) (0.22) (0.15) (0.22)
Observations 10994 10435 10994 10435
Standard errors clustered at the school level in parentheses. ∗ p < 0.10, ∗∗ p < 0.05, ∗∗∗ p < 0.01.
All regressions control for student and teacher characteristics, class size and school fixed effects.
Item (c): “While I teach, I ask students questions about the lesson”. Item (d): “While I teach,
students ask me doubts”.
Table 22: Robustness to constraint total time allocated to itemsMaths Reading
Tutor Students Tutor StudentsShare of time using modern practices 0.11 0.23 0.43∗∗ 0.56∗
(0.20) (0.28) (0.18) (0.29)Share of time using modern materials -0.28 -0.07 -0.05 0.41∗
(0.20) (0.26) (0.17) (0.23)
Observations 11413 11413 10443 10649 11413 11413 10443 10649
Standard errors clustered at the school level in parentheses. ∗ p < 0.10, ∗∗ p < 0.05, ∗∗∗ p < 0.01. All regressions
control for student and teacher characteristics, class size and school fixed effects. Each cell represents a separate
regression.
44

Table 23: Robustness to include additional control variablesMaths Reading
Tutor Students Tutor StudentsA. Class-average characteristics
Traditional practices index 0.03 -0.12 0.03 -0.29∗
(0.13) (0.21) (0.12) (0.18)Modern practices index 0.10 0.29 0.28∗∗ 0.47∗∗
(0.15) (0.20) (0.14) (0.20)
Traditional materials index 0.12 -0.12 0.26∗∗ -0.20(0.14) (0.20) (0.11) (0.18)
Modern materials index -0.06 0.03 0.09 0.58∗∗∗
(0.14) (0.23) (0.11) (0.20)
Standard errors clustered at the school level in parentheses. ∗ p < 0.10, ∗∗ p < 0.05,∗∗∗ p < 0.01. All regressions control for student and teacher characteristics, class size
and school fixed effects.
45
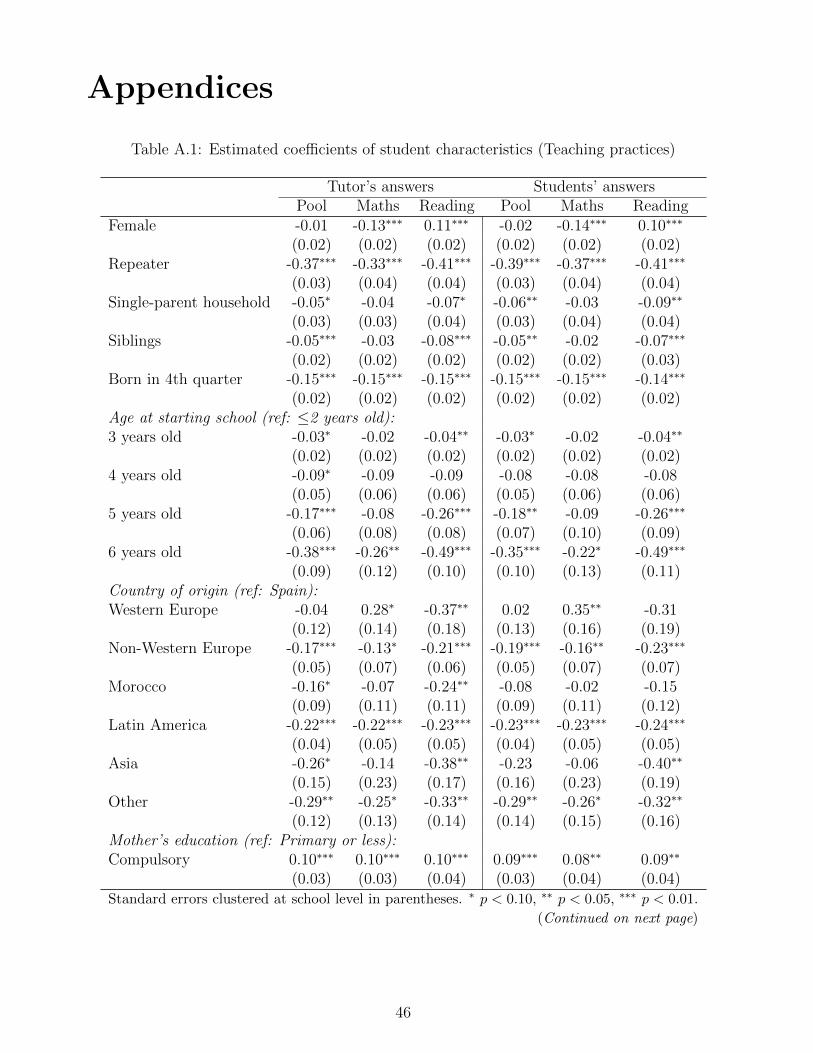
Appendices
Table A.1: Estimated coefficients of student characteristics (Teaching practices)
Tutor’s answers Students’ answersPool Maths Reading Pool Maths Reading
Female -0.01 -0.13∗∗∗ 0.11∗∗∗ -0.02 -0.14∗∗∗ 0.10∗∗∗
(0.02) (0.02) (0.02) (0.02) (0.02) (0.02)Repeater -0.37∗∗∗ -0.33∗∗∗ -0.41∗∗∗ -0.39∗∗∗ -0.37∗∗∗ -0.41∗∗∗
(0.03) (0.04) (0.04) (0.03) (0.04) (0.04)Single-parent household -0.05∗ -0.04 -0.07∗ -0.06∗∗ -0.03 -0.09∗∗
(0.03) (0.03) (0.04) (0.03) (0.04) (0.04)Siblings -0.05∗∗∗ -0.03 -0.08∗∗∗ -0.05∗∗ -0.02 -0.07∗∗∗
(0.02) (0.02) (0.02) (0.02) (0.02) (0.03)Born in 4th quarter -0.15∗∗∗ -0.15∗∗∗ -0.15∗∗∗ -0.15∗∗∗ -0.15∗∗∗ -0.14∗∗∗
(0.02) (0.02) (0.02) (0.02) (0.02) (0.02)Age at starting school (ref: ≤2 years old):3 years old -0.03∗ -0.02 -0.04∗∗ -0.03∗ -0.02 -0.04∗∗
(0.02) (0.02) (0.02) (0.02) (0.02) (0.02)4 years old -0.09∗ -0.09 -0.09 -0.08 -0.08 -0.08
(0.05) (0.06) (0.06) (0.05) (0.06) (0.06)5 years old -0.17∗∗∗ -0.08 -0.26∗∗∗ -0.18∗∗ -0.09 -0.26∗∗∗
(0.06) (0.08) (0.08) (0.07) (0.10) (0.09)6 years old -0.38∗∗∗ -0.26∗∗ -0.49∗∗∗ -0.35∗∗∗ -0.22∗ -0.49∗∗∗
(0.09) (0.12) (0.10) (0.10) (0.13) (0.11)Country of origin (ref: Spain):Western Europe -0.04 0.28∗ -0.37∗∗ 0.02 0.35∗∗ -0.31
(0.12) (0.14) (0.18) (0.13) (0.16) (0.19)Non-Western Europe -0.17∗∗∗ -0.13∗ -0.21∗∗∗ -0.19∗∗∗ -0.16∗∗ -0.23∗∗∗
(0.05) (0.07) (0.06) (0.05) (0.07) (0.07)Morocco -0.16∗ -0.07 -0.24∗∗ -0.08 -0.02 -0.15
(0.09) (0.11) (0.11) (0.09) (0.11) (0.12)Latin America -0.22∗∗∗ -0.22∗∗∗ -0.23∗∗∗ -0.23∗∗∗ -0.23∗∗∗ -0.24∗∗∗
(0.04) (0.05) (0.05) (0.04) (0.05) (0.05)Asia -0.26∗ -0.14 -0.38∗∗ -0.23 -0.06 -0.40∗∗
(0.15) (0.23) (0.17) (0.16) (0.23) (0.19)Other -0.29∗∗ -0.25∗ -0.33∗∗ -0.29∗∗ -0.26∗ -0.32∗∗
(0.12) (0.13) (0.14) (0.14) (0.15) (0.16)Mother’s education (ref: Primary or less):Compulsory 0.10∗∗∗ 0.10∗∗∗ 0.10∗∗∗ 0.09∗∗∗ 0.08∗∗ 0.09∗∗
(0.03) (0.03) (0.04) (0.03) (0.04) (0.04)Standard errors clustered at school level in parentheses. ∗ p < 0.10, ∗∗ p < 0.05, ∗∗∗ p < 0.01.
(Continued on next page)
46
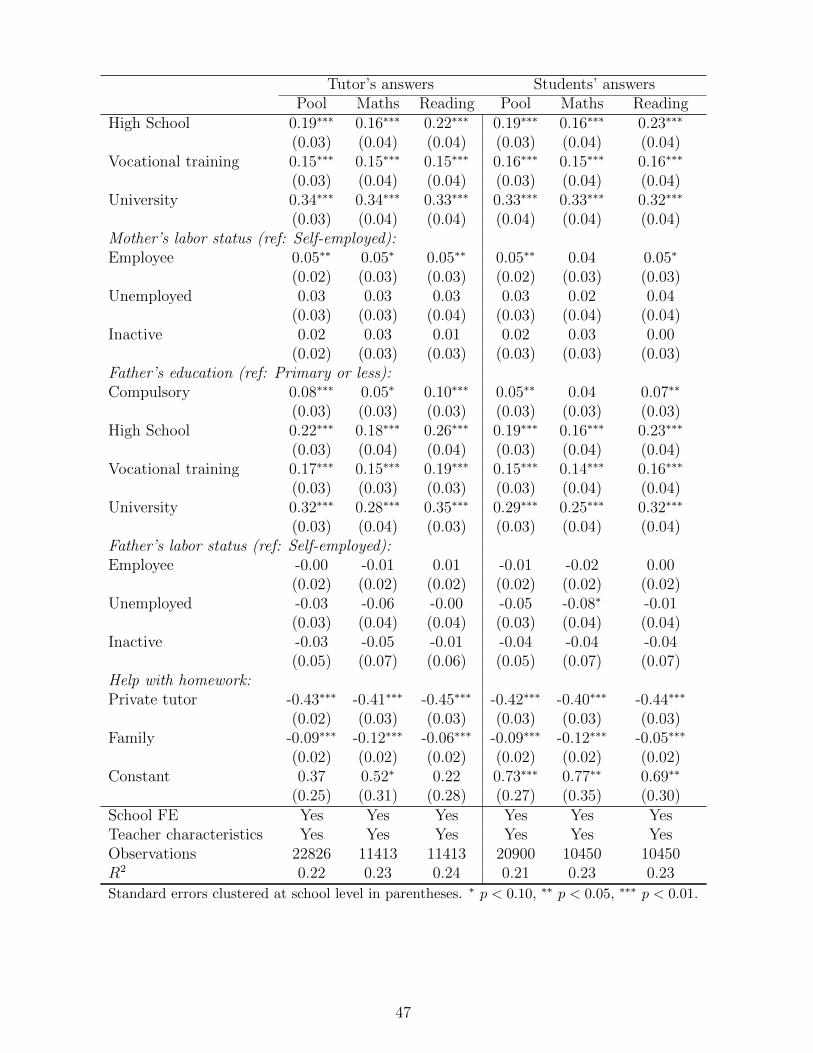
Tutor’s answers Students’ answersPool Maths Reading Pool Maths Reading
High School 0.19∗∗∗ 0.16∗∗∗ 0.22∗∗∗ 0.19∗∗∗ 0.16∗∗∗ 0.23∗∗∗
(0.03) (0.04) (0.04) (0.03) (0.04) (0.04)Vocational training 0.15∗∗∗ 0.15∗∗∗ 0.15∗∗∗ 0.16∗∗∗ 0.15∗∗∗ 0.16∗∗∗
(0.03) (0.04) (0.04) (0.03) (0.04) (0.04)University 0.34∗∗∗ 0.34∗∗∗ 0.33∗∗∗ 0.33∗∗∗ 0.33∗∗∗ 0.32∗∗∗
(0.03) (0.04) (0.04) (0.04) (0.04) (0.04)Mother’s labor status (ref: Self-employed):Employee 0.05∗∗ 0.05∗ 0.05∗∗ 0.05∗∗ 0.04 0.05∗
(0.02) (0.03) (0.03) (0.02) (0.03) (0.03)Unemployed 0.03 0.03 0.03 0.03 0.02 0.04
(0.03) (0.03) (0.04) (0.03) (0.04) (0.04)Inactive 0.02 0.03 0.01 0.02 0.03 0.00
(0.02) (0.03) (0.03) (0.03) (0.03) (0.03)Father’s education (ref: Primary or less):Compulsory 0.08∗∗∗ 0.05∗ 0.10∗∗∗ 0.05∗∗ 0.04 0.07∗∗
(0.03) (0.03) (0.03) (0.03) (0.03) (0.03)High School 0.22∗∗∗ 0.18∗∗∗ 0.26∗∗∗ 0.19∗∗∗ 0.16∗∗∗ 0.23∗∗∗
(0.03) (0.04) (0.04) (0.03) (0.04) (0.04)Vocational training 0.17∗∗∗ 0.15∗∗∗ 0.19∗∗∗ 0.15∗∗∗ 0.14∗∗∗ 0.16∗∗∗
(0.03) (0.03) (0.03) (0.03) (0.04) (0.04)University 0.32∗∗∗ 0.28∗∗∗ 0.35∗∗∗ 0.29∗∗∗ 0.25∗∗∗ 0.32∗∗∗
(0.03) (0.04) (0.03) (0.03) (0.04) (0.04)Father’s labor status (ref: Self-employed):Employee -0.00 -0.01 0.01 -0.01 -0.02 0.00
(0.02) (0.02) (0.02) (0.02) (0.02) (0.02)Unemployed -0.03 -0.06 -0.00 -0.05 -0.08∗ -0.01
(0.03) (0.04) (0.04) (0.03) (0.04) (0.04)Inactive -0.03 -0.05 -0.01 -0.04 -0.04 -0.04
(0.05) (0.07) (0.06) (0.05) (0.07) (0.07)Help with homework:Private tutor -0.43∗∗∗ -0.41∗∗∗ -0.45∗∗∗ -0.42∗∗∗ -0.40∗∗∗ -0.44∗∗∗
(0.02) (0.03) (0.03) (0.03) (0.03) (0.03)Family -0.09∗∗∗ -0.12∗∗∗ -0.06∗∗∗ -0.09∗∗∗ -0.12∗∗∗ -0.05∗∗∗
(0.02) (0.02) (0.02) (0.02) (0.02) (0.02)Constant 0.37 0.52∗ 0.22 0.73∗∗∗ 0.77∗∗ 0.69∗∗
(0.25) (0.31) (0.28) (0.27) (0.35) (0.30)School FE Yes Yes Yes Yes Yes YesTeacher characteristics Yes Yes Yes Yes Yes YesObservations 22826 11413 11413 20900 10450 10450R2 0.22 0.23 0.24 0.21 0.23 0.23
Standard errors clustered at school level in parentheses. ∗ p < 0.10, ∗∗ p < 0.05, ∗∗∗ p < 0.01.
47

Table A.2: Estimated coefficients of student characteristics (Teaching materials)
Tutor’s answers Students’ answersPool Maths Reading Pool Maths Reading
Female -0.01 -0.13∗∗∗ 0.11∗∗∗ -0.02 -0.14∗∗∗ 0.10∗∗∗
(0.02) (0.02) (0.02) (0.02) (0.02) (0.02)Repeater -0.37∗∗∗ -0.33∗∗∗ -0.41∗∗∗ -0.39∗∗∗ -0.36∗∗∗ -0.42∗∗∗
(0.03) (0.04) (0.04) (0.03) (0.04) (0.04)Single-parent household -0.05∗ -0.04 -0.07∗ -0.05∗ -0.03 -0.07∗
(0.03) (0.03) (0.04) (0.03) (0.03) (0.04)Siblings -0.05∗∗ -0.03 -0.08∗∗∗ -0.05∗∗ -0.02 -0.07∗∗∗
(0.02) (0.02) (0.02) (0.02) (0.02) (0.03)Age at starting school (ref: ≤2 years old):3 years old -0.03∗ -0.02 -0.04∗∗ -0.02 -0.02 -0.03
(0.02) (0.02) (0.02) (0.02) (0.02) (0.02)4 years old -0.09∗ -0.09 -0.08 -0.09∗ -0.09 -0.09
(0.05) (0.06) (0.06) (0.05) (0.06) (0.06)5 years old -0.17∗∗∗ -0.08 -0.26∗∗∗ -0.20∗∗∗ -0.11 -0.28∗∗∗
(0.06) (0.08) (0.08) (0.07) (0.09) (0.08)6 years old -0.38∗∗∗ -0.26∗∗ -0.49∗∗∗ -0.40∗∗∗ -0.30∗∗ -0.50∗∗∗
(0.09) (0.12) (0.10) (0.10) (0.13) (0.11)Born in 4th quarter -0.15∗∗∗ -0.15∗∗∗ -0.15∗∗∗ -0.15∗∗∗ -0.15∗∗∗ -0.15∗∗∗
(0.02) (0.02) (0.02) (0.02) (0.02) (0.02)Country of origin (ref: Spain):Western Europe -0.05 0.28∗ -0.38∗∗ -0.01 0.31∗∗ -0.33∗
(0.12) (0.14) (0.18) (0.12) (0.15) (0.18)Non-Western Europe -0.17∗∗∗ -0.13∗ -0.21∗∗∗ -0.16∗∗∗ -0.11 -0.21∗∗∗
(0.05) (0.07) (0.06) (0.05) (0.07) (0.07)Morocco -0.16∗ -0.07 -0.24∗∗ -0.16 -0.08 -0.24∗∗
(0.09) (0.11) (0.11) (0.10) (0.11) (0.12)Latin America -0.22∗∗∗ -0.22∗∗∗ -0.23∗∗∗ -0.22∗∗∗ -0.20∗∗∗ -0.24∗∗∗
(0.04) (0.05) (0.05) (0.04) (0.05) (0.05)Asia -0.27∗ -0.14 -0.40∗∗ -0.23 -0.06 -0.40∗∗
(0.15) (0.22) (0.17) (0.15) (0.23) (0.18)Other -0.28∗∗ -0.24∗ -0.32∗∗ -0.28∗∗ -0.26∗ -0.31∗
(0.12) (0.13) (0.15) (0.13) (0.14) (0.16)Mother’s education (ref: Primary or less):Compulsory 0.10∗∗∗ 0.10∗∗∗ 0.10∗∗∗ 0.08∗∗∗ 0.08∗∗ 0.08∗∗
(0.03) (0.03) (0.04) (0.03) (0.04) (0.04)High School 0.19∗∗∗ 0.16∗∗∗ 0.22∗∗∗ 0.18∗∗∗ 0.14∗∗∗ 0.22∗∗∗
(0.03) (0.04) (0.04) (0.03) (0.04) (0.04)Vocational training 0.15∗∗∗ 0.15∗∗∗ 0.15∗∗∗ 0.14∗∗∗ 0.13∗∗∗ 0.15∗∗∗
(0.03) (0.04) (0.04) (0.03) (0.04) (0.04)University 0.34∗∗∗ 0.34∗∗∗ 0.33∗∗∗ 0.32∗∗∗ 0.31∗∗∗ 0.32∗∗∗
(0.03) (0.04) (0.04) (0.04) (0.04) (0.04)Standard errors clustered at school level in parentheses. ∗ p < 0.10, ∗∗ p < 0.05, ∗∗∗ p < 0.01.
(Continued on next page)
48

Tutor’s answers Students’ answersPool Maths Reading Pool Maths Reading
Mother’s labor status (ref: Self-employed):Employee 0.05∗∗ 0.05∗ 0.05∗∗ 0.05∗∗ 0.04 0.06∗∗
(0.02) (0.03) (0.03) (0.02) (0.03) (0.03)Unemployed 0.03 0.03 0.03 0.04 0.04 0.03
(0.03) (0.03) (0.04) (0.03) (0.04) (0.04)Inactive 0.02 0.03 0.01 0.02 0.02 0.01
(0.02) (0.03) (0.03) (0.03) (0.03) (0.03)Father’s education (ref: Primary or less):Compulsory 0.08∗∗∗ 0.05 0.10∗∗∗ 0.05∗∗ 0.04 0.07∗∗
(0.03) (0.03) (0.03) (0.03) (0.03) (0.03)High School 0.21∗∗∗ 0.18∗∗∗ 0.25∗∗∗ 0.20∗∗∗ 0.16∗∗∗ 0.23∗∗∗
(0.03) (0.04) (0.04) (0.03) (0.04) (0.04)Vocational training 0.17∗∗∗ 0.15∗∗∗ 0.19∗∗∗ 0.15∗∗∗ 0.14∗∗∗ 0.16∗∗∗
(0.03) (0.03) (0.03) (0.03) (0.04) (0.03)University 0.31∗∗∗ 0.28∗∗∗ 0.35∗∗∗ 0.30∗∗∗ 0.27∗∗∗ 0.33∗∗∗
(0.03) (0.04) (0.03) (0.03) (0.04) (0.03)Father’s labor status (ref: Self-employed):Employee -0.00 -0.01 0.01 -0.01 -0.02 0.01
(0.02) (0.02) (0.02) (0.02) (0.02) (0.02)Unemployed -0.03 -0.06 -0.01 -0.04 -0.08∗ 0.00
(0.03) (0.04) (0.04) (0.03) (0.04) (0.04)Inactive -0.03 -0.05 -0.01 -0.04 -0.07 -0.00
(0.05) (0.07) (0.06) (0.05) (0.07) (0.06)Help with homework:Private tutor -0.43∗∗∗ -0.41∗∗∗ -0.45∗∗∗ -0.43∗∗∗ -0.41∗∗∗ -0.44∗∗∗
(0.02) (0.03) (0.03) (0.03) (0.03) (0.03)Family -0.09∗∗∗ -0.12∗∗∗ -0.06∗∗∗ -0.09∗∗∗ -0.13∗∗∗ -0.05∗∗∗
(0.02) (0.02) (0.02) (0.02) (0.02) (0.02)Constant 0.40 0.59∗ 0.21 0.49∗ 0.69∗∗ 0.29
(0.25) (0.32) (0.27) (0.26) (0.33) (0.29)School FE Yes Yes Yes Yes Yes YesTeacher characteristics Yes Yes Yes Yes Yes YesObservations 22826 11413 11413 21360 10680 10680R2 0.22 0.23 0.24 0.21 0.23 0.23Standard errors clustered at school level in parentheses. ∗ p < 0.10, ∗∗ p < 0.05, ∗∗∗ p < 0.01.
49

Table B.1: Teacher-student indexes gap
Practices MaterialsModern Traditional Modern Traditional
Student variables:Plausible value Maths 0.02∗∗∗ -0.00 0.02∗∗∗ 0.00
(0.00) (0.00) (0.00) (0.00)Plausible value Reading 0.03∗∗∗ -0.00 0.03∗∗∗ -0.00
(0.00) (0.00) (0.00) (0.00)Female 0.02∗∗∗ -0.01∗∗∗ 0.03∗∗∗ -0.02∗∗∗
(0.00) (0.00) (0.01) (0.00)Repeater -0.03∗∗ 0.02∗ -0.04∗∗∗ 0.02∗
(0.01) (0.01) (0.01) (0.01)Single-parent household 0.01 0.01∗ 0.02∗∗ 0.03∗∗∗
(0.01) (0.01) (0.01) (0.01)Siblings -0.01 0.00 -0.01 0.01∗∗
(0.01) (0.01) (0.01) (0.01)Age at starting school (ref: ≤2 years old):3 years old -0.01∗∗ -0.01 -0.01 0.01
(0.00) (0.00) (0.01) (0.01)4 years old 0.02 0.01 -0.01 -0.03
(0.02) (0.02) (0.02) (0.02)5 years old -0.07∗∗∗ -0.03∗ -0.03 0.00
(0.02) (0.02) (0.03) (0.02)6 years old -0.02 -0.00 -0.03 0.02
(0.03) (0.03) (0.05) (0.03)Born in 4th quarter 0.01∗∗∗ 0.00 0.00 0.00
(0.00) (0.00) (0.01) (0.01)Country of origin (ref: Spain):Western Europe 0.04 0.11∗∗∗ 0.05 0.07
(0.03) (0.02) (0.05) (0.04)Non-Western Europe -0.02 -0.03∗ -0.02 -0.01
(0.02) (0.02) (0.03) (0.02)Morocco -0.04 -0.01 0.02 -0.01
(0.03) (0.03) (0.04) (0.03)Latin America -0.02∗∗ -0.02 0.02 0.02
(0.01) (0.01) (0.01) (0.01)Asia -0.08∗∗ -0.02 -0.06 0.07
(0.04) (0.04) (0.06) (0.06)Other -0.04 -0.05 0.05 0.00
(0.05) (0.03) (0.04) (0.03)Mother’s education (ref: Primary or less):Compulsory 0.02 -0.01 -0.00 -0.02∗
(0.01) (0.01) (0.01) (0.01)Dependent variable: difference in tutor and student indexes. Standard errors clustered
at school level in parentheses. ∗ p < 0.10, ∗∗ p < 0.05, ∗∗∗ p < 0.01.
(Continued on next page)
50

Practices MaterialsModern Traditional Modern Traditional
High School 0.02∗ 0.00 0.01 -0.01(0.01) (0.01) (0.01) (0.01)
Vocational training 0.03∗∗∗ 0.00 0.01 -0.01(0.01) (0.01) (0.01) (0.01)
University 0.04∗∗∗ 0.00 0.01 -0.00(0.01) (0.01) (0.01) (0.01)
Mother’s labor status (ref: Self-employed):Employee 0.01 -0.00 0.01 -0.01
(0.01) (0.01) (0.01) (0.01)Unemployed -0.00 0.01 -0.01 0.02∗
(0.01) (0.01) (0.01) (0.01)Inactive 0.00 -0.00 -0.00 -0.01
(0.01) (0.01) (0.01) (0.01)Father’s education (ref: Primary or less):Compulsory 0.00 -0.01 0.01 0.01
(0.01) (0.01) (0.01) (0.01)High School 0.00 0.01 -0.00 0.01
(0.01) (0.01) (0.01) (0.01)Vocational training 0.01 0.00 0.00 0.01
(0.01) (0.01) (0.01) (0.01)University 0.01 0.01 0.01 0.01
(0.01) (0.01) (0.01) (0.01)Father’s labor status (ref: Self-employed):Employee -0.01∗ -0.00 -0.01 -0.01
(0.01) (0.00) (0.01) (0.01)Unemployed -0.01 0.00 -0.01 -0.01
(0.01) (0.01) (0.01) (0.01)Inactive 0.02 0.01 -0.00 -0.00
(0.02) (0.02) (0.02) (0.02)Help with homework:Private tutor -0.03∗∗∗ 0.01 -0.04∗∗∗ -0.01
(0.01) (0.01) (0.01) (0.01)Family -0.00 -0.00 0.01 0.00
(0.00) (0.00) (0.01) (0.01)Teacher variables:Female 0.01 -0.00 -0.02 0.00
(0.02) (0.02) (0.02) (0.02)Years of exp. (ref: < 5):5 - 9 0.01 0.04 0.02 0.02
(0.03) (0.03) (0.04) (0.04)10 - 14 0.05 0.07 0.02 0.08∗
(0.03) (0.04) (0.04) (0.04)Dependent variable: difference in tutor and student indexes. Standard errors clustered
at school level in parentheses. ∗ p < 0.10, ∗∗ p < 0.05, ∗∗∗ p < 0.01.
(Continued on next page)
51

Practices MaterialsModern Traditional Modern Traditional
15 - 19 0.06 0.03 0.03 0.05(0.04) (0.04) (0.04) (0.04)
20 - 24 0.03 0.03 0.02 -0.01(0.03) (0.03) (0.04) (0.04)
25 - 29 0.04 0.03 0.05 -0.01(0.03) (0.03) (0.04) (0.04)
30 or more 0.05∗ 0.03 0.02 0.05(0.03) (0.03) (0.04) (0.03)
5-years degree or more -0.01 -0.03 -0.00 -0.03(0.02) (0.02) (0.02) (0.02)
Taught subjects (ref: Maths):Reading and Maths -0.02 0.03 -0.02 0.01
(0.03) (0.05) (0.04) (0.03)Reading -0.01 0.02 -0.02 0.04
(0.05) (0.07) (0.04) (0.04)Person asking for a meeting:Parents -0.02 0.01 0.00 0.04
(0.02) (0.03) (0.02) (0.03)Teacher -0.02 -0.00 -0.04∗∗ 0.01
(0.02) (0.02) (0.02) (0.03)Number of meetings with parents -0.01 0.03∗ 0.02 0.01
(0.01) (0.02) (0.02) (0.02)Teacher at 3rd and 4th grades -0.04∗∗ -0.02 -0.01 -0.01
(0.02) (0.02) (0.02) (0.02)Class size 0.00 -0.00 -0.00 0.00
(0.00) (0.00) (0.00) (0.01)Public school -0.33∗∗∗ -0.17∗∗∗ 0.07∗ -0.35∗∗∗
(0.04) (0.04) (0.04) (0.06)Constant 0.12 -0.33∗∗ 0.10 -0.05
(0.12) (0.15) (0.13) (0.15)School FE Yes Yes Yes YesObservations 10691 10762 10742 11010R2 0.28 0.30 0.27 0.37Dependent variable: difference in tutor and student indexes. Standard errors clustered
at school level in parentheses. ∗ p < 0.10, ∗∗ p < 0.05, ∗∗∗ p < 0.01.
52

TÍTOLNUM AUTOR DATA
Gener 2015The Long-Term Impact of Inequality on Entrepreneurship and Job Creation
15.01 Roxana Gutiérrez Romero, Luciana Méndez Errico
Octubre 2014
The good, the bad and the ugly: The socio-economic impact of drug cartels and their violence in Mexico
14.10 Roxana Gutiérrez Romero, Mónica Oviedo León
Setembre 2014
Estimating the impact of Mexican drug cartels on crime14.09 Roxana Gutiérrez Romero, Alessandra Conte
Juny 2014Real unit labour costs in Eurozone countries: Drivers and clusters
14.05 Javier Ordóñez,Hector Sala,José I. Silva
Maig 2014The determinants of capital intensity in Japan and the U.S.
14.04 Dario Judzik,Hector Sala
Maig 2014EFFECTS OF INSTITUTIONAL ENVIRONMENT AND TECHNOLOGY DEVELOPMENT ON PAYMENT
CHOICE
14.03 Francisco J. Callado-Muñoz,
Jana Hromcová,Natalia Utrero-González
Abril 2014The causal factors of international inequality in CO2 emissions per capita: A regression-based inequality
decomposition analysis.
14.02 Juan Antonio Duro,Jordi Teixidó-Figuerasa,
Emilio Padilla
Abril 2014Energy Intensity in Road Freight Transport of Heavy Goods Vehicles in Spain
14.01 Lidia Andres Delgado,Emilio Padilla
Setembre 2013
The materiality of the immaterial. Services sectors and CO2 emissions in Uruguay
13.06 Matías Piaggio,Vicent Alcántara,
Emilio Padilla
Juny 2013Empirics of the international inequality in CO2 emissions intensity: explanatory factors according to
complementary decomposition methodologies
13.05 Juan Antonio Duro,Jordi Teixidó-Figueras,
Emilio Padilla
Juny 2013Empirical Welfare Analysis: When Preferences Matter13.04 Jean-François Carpantier,Christelle Sapata
Febrer 2013How effective are policies to reduce gasoline consumption? Evaluating a quasi-natural experiment in
Spain
13.03 Javier Asensio,Andrés Gómez-Lobo,
Anna Matas
Febrer 2013Performance in Post-compulsory Education: Evidence from Vocational and Academic Tracks
13.02 Cristina Lopez-Mayan
Gener 2013The Impacts of Social Networks on Immigrants’ Employment Prospects: The Spanish Case 1997-2007
13.01 Luciana Méndez Errico
Desembre 2012
Tax Incentives and Direct Support for R&D: What do Firms Use and Why?
12.12 Isabel Busom,Beatriz Corchuelo,Ester Martinez Ros