Embed Size (px)
Citation preview

Dentist-specific variation indiagnosis of caries – a multilevelanalysis
Dobloug A, Grytten J, Holst D. Dentist-specific variation in diagnosis ofcaries – a multilevel analysis. Community Dent Oral Epidemiol 2014; 42: 185–191. © 2013 John Wiley & Sons A/S. Published by John Wiley & Sons Ltd
Abstract – Background: There are few studies on practice variation withindentistry. This contrasts with medicine where numerous studies exist. A majorfinding from the field of medicine is that the size of the physician-specificeffects depends on the degree of uncertainty in diagnosis. The physician-specific effects are small for diseases where the diagnostic criteria areunambiguous. Conversely, the effects are large for diseases where thediagnostic criteria are less unambiguous. Objectives: To assess the size ofprovider-specific variation in the diagnosis of caries among children andadolescents in Norway and to determine whether this variation depends onuncertainty in diagnosis. Methods: Data on caries diagnosis for 709 611 childrenand adolescents aged 6–18 years were analysed using multilevel regression.Level-1 was patients and level-2 was public dental officers and dentalhygienists. Caries was measured according to the following localization of thelesion: in the outer half of the enamel, in the inner half of the enamel, in theouter third of the dentine, in the middle and inner third of the dentine, to thepulp. The degree of uncertainty in diagnosis is expected to be least the deeperinto the dentine the lesion goes. Our sample included 87.5% of all individualsaged 6–18 years. Results: The provider-specific variation, measured as theintraclass correlation coefficient, ranged from 15% for caries lesions localized inthe outer half of the enamel to 2% for caries to the pulp. Conclusions: The size ofprovider-specific variation in the diagnosis of caries is fairly low. The size of thevariability is dependent on the level of diagnostic uncertainty, which iscoherent with the practice style hypothesis.
Andreas Dobloug, Jostein Grytten and
Dorthe Holst
Department of Community Dentistry,
University of Oslo, Oslo, Norway
Key words: caries; dental health promotion;early childhood caries; prevention
Jostein Grytten, Department of CommunityDentistry, University of Oslo,Post Box 1052, Blindern, Oslo 0316, NorwayTel.: +47 22 84 03 87Fax: +47 22 84 03 03e-mail: [email protected]
Submitted 16 April 2013;accepted 14 July 2013
An extensive amount of literature exists on practice
variation within medicine (for a review see: (1, 2)).
To our knowledge, few studies on this topic have
been undertaken within dentistry. The two central
works by Bader et al., published in 1995 (3, 4), are
reviews of earlier studies. Bader et al. conclude:
‘Even when differences in patients are controlled,
variation in dentists’ clinical decisions is ubiqui-
tous’ (4).
The earlier publications covered by the reviews
of Bader et al., have been carried out on small sam-
ples of dentists – typically ranging from 10 to 80
dentists [for example see references (5–7)]. The
main focus has been to examine the effects that
clinical guidelines and patient preferences have on
practice variation. No attempt has been made to
estimate dentist-specific effects, that is, how much
of the variation in diagnosis of dental disease is
explained by dentist variation compared with
patient variation. Ideally, we want the dentists’
contribution to be small. In that case, the types and
level of diagnosis and the subsequent treatment
are determined by the patient’s dental health status
and/or their preferences for dental care, not by
dentists’ practice styles (8, 9).
An important finding from studies on practice
variation within medicine is that the size of the
physician-specific effects depends on the degree of
doi: 10.1111/cdoe.12067 185
Community Dent Oral Epidemiol 2014; 42; 185–191All rights reserved
� 2013 John Wiley & Sons A/S. Published by John Wiley & Sons Ltd

uncertainty in diagnosis (10, 11). The physician-
specific effects are small for diseases where the
diagnostic criteria are unambiguous. Conversely,
the effects are large for diseases where the diagnos-
tic criteria are less unambiguous.
In this study, we estimate dentist-specific
variation in the diagnosis of caries for children
aged 6–18 years in Norway. Probably, the degree
of uncertainty in diagnosis is least the deeper into
the dentine the lesion is apparent. These lesions are
often easy to identify by clinical examination or by
X-ray. Conversely, uncertainty is probably greatest
for enamel lesions. They may be less visible and
therefore more difficult to detect. Thus, we expect
that dentist-specific variation is greatest for diag-
nosis of enamel lesions and least for diagnosis of
lesions in the dentine.
Below, we first describe the organization of the
public dental services in Norway. This is important
because the framework of the ensuing analyses is
defined by the institutional set-up. In the sections
that follow, our data and the empirical model are
presented. In the last sections, the results are pre-
sented and some policy implications of the find-
ings are discussed.
Public dental services in NorwayIn Norway, the public dental services are orga-
nized at the county level. There are 19 counties,
with one County Dental Officer in each county.
The services which the counties are responsible for
planning, organizing and running are mainly
financed through local taxes and a block grant
given by the state.
The County Dental Officers are responsible for
organizing dental services and deciding how funds
available in the budget for the purpose will be uti-
lized. Public dental officers and dental hygienists
working in the clinics have no control over budget
allocation. With the exception of the county of Øst-
fold, all public dental officers and dental hygienists
receive a fixed salary paid by the county. The num-
ber of contracted man-labour years for public den-
tal officers in Norway was 1175 in 2011 (12). The
corresponding figure for dental hygienists was 439
(12).
In Norway, the public dental services have
responsibility for supplying dental services to the
following groups of the population: (i) all individu-
als 0–18 years of age, (ii) mentally handicapped
adults and (iii) elderly people, people with chronic
illness and people with a disability pension who
are either resident in an institution or who receive
home nursing care [Ministry of Social Affairs 1983
(13)]. For groups (i)–(iii), all dental care is free. On
1 January 2011, the number of individuals aged 0–18 years in Norway was 1 179 368 (12) The provi-
sion of dental care to individuals in the priority
groups (ii) and (iii) is only a minor part of
production. For example, in 2011, the number of
individuals seen in priority group (ii) was 16 949
(12) and in group (iii) 48 049 (12). Nearly all dental
care for adults is provided by private practitioners
(14).
All individuals 3–18 years of age are regularly
recalled to the clinic for dental check-ups. The
recall interval varies. Individuals with a high risk
of developing caries will usually have a check-up
at least once a year. The recall interval for low-risk
individuals can be from 1 to 2 years (15). For very
low-risk individuals, the interval may even be
longer. The clinical examination where caries is
diagnosed can be performed either by a public
dental officer or a dental hygienist. Restorations
can only be made by a public dental officer.
All public dental practices in Norway are
equipped with digital X-ray. The same type of
diagnostic tools is thus available to all public den-
tal officers. Patients moving between clinics will
have a copy of their dental record at the new prac-
tice; thus, each patient’s history is available for all
practitioners.
Materials and methods
Information about caries was obtained from the
dental records for children and adolescents aged
6–18 years. These records are stored at a central
server in each county. They were provided to the
research group by the County Dental Officer. Data
that could identify an individual were removed
from the data file before delivery. The research
project was approved by the Norwegian Regional
Committee for Medical and Health Research Ethics
with registration number 2011/735 (16).
Our sample was created in three steps. For each
step, we constructed a subsample with the follow-
ing characteristics:
• Subsample 1 included all children and adoles-
cents who had been examined at the dental clinic
in 2011, altogether 492 859 individuals.
• Subsample 2 included all children and adoles-
cents who had been examined at the dental clinic
in 2010, but not in 2011, altogether 196 748
individuals. This subsample mainly included
186
Dobloug et al.

low-risk individuals who had had a recall inter-
val longer than 1 year.
• Subsample 3 included all children and adoles-
cents who had been examined at the dental clinic
in 2009, but not in 2010 and not in 2011, alto-
gether 28 439 individuals. This subsample
mainly included very low-risk individuals who
had had a recall interval longer than 2 years
A few of the children and adolescents had had
more than one course of treatment within a year.
For these, it was decided to use data on caries for
the last course of treatment during each of the
years 2009–2011. Each individual was then repre-
sented only once in each of the subsamples.
Patients treated by students were removed from
the sample (8435 individuals).
We merged the three subsamples into one sam-
ple of 709 611 individuals. There were 810 792
individuals 6–18-year-olds in Norway per 1 Janu-
ary 2011 (12). Thus, our sample included 87.5% of
all individuals in the relevant age group.
Analyses
A simple model with no covariates. The data were
analysed using a multilevel mixed model with the
provider as a random effect. We follow the specifi-
cations by Singer (17) and define the two-level
equations in the following way:
Level-1 – the child and adolescent level
Yij ¼ b0j þ rij; rij �Nð0; r2Þ ð1ÞThe subscript i denotes the individual child or
adolescent, and j denotes the provider: a public
dental officer or a dental hygienist. Yij is the number
of surfaces with caries per patient seen by provider
j; b0j is the mean number of surfaces with caries
per patient for provider j; rij is the residual for each
patient.
Level-2 – the provider level
b0j ¼ c00 þ u0j; u0j �Nð0; s20Þ ð2ÞThe provider-specific intercepts b0j are expressed
as the mean number of surfaces with caries per
patient in the population as a whole (=c00) and the
deviation from that mean (=uoj). Substituting (2)
into (1) yields the equation:
Yij ¼ c00 þ u0j þ rij;u0j �Nð0; s20Þrij �Nð0; r2Þ
�ð3Þ
This model has two estimated random effects. The
dentist-specific effect, that is, the variability
between dentists, is measured by the parameter s20.The patient-specific effect, that is, the variability
between patients, is measured by the parameter r2.We ran five separate regressions where we dis-
tinguished between the following localization of
the caries lesions: in the outer half of the enamel, in
the inner half of the enamel, in the outer third of
the dentine, in the middle and inner third of the
dentine, to the pulp. If the size of the physician-
specific effects depends on the degree of uncer-
tainty in diagnosis, we expect the parameter s20 to
be greatest for lesions, which are localized in the
outer half of the enamel. Conversely, we expect s20to be least for lesions to the pulp.
A convenient way of assessing the proportion of
variation that is attributable to the provider level is
to calculate the intraclass correlation coefficient
(ICC). We assume that the residual variances for
each level of the model are independent:
Varðu0j þ rijÞ ¼ VarðuojÞ þ VarðrijÞ ¼ s20 þ r2
ICC can then be calculated using the formula
(18):
q ¼ variance between providers
total variance¼ s20
s20 þ r2
A model with level-1 covariates. The data set also
contained the age (at the time of diagnosis) and
gender of the patient. We can adjust the regression
by adding the variables as covariates to level-1 (the
child and adolescent level) which yields the follow-
ing equation:
Y�ij ¼ b0j þ b1 � AGEij þ b2 � GENDERij
þ rij; rij �Nð0; r2Þð4Þ
Substituting (2) into (4) yields the equation:
Y�ij ¼ c00 þ b1 � AGEij þ b2 � GENDERij þ u0j
þ rij;uoj �Nð0; s20Þrij �Nð0; r2Þ
�
ð5Þ
Robustness tests. To test the robustness of our
results, we did several robustness tests. We esti-
mated the data with 1% and 2.5% of the extreme
values removed. This was done to determine
whether a few outliers in the data would affect our
estimates.
We excluded providers who had <10% of the
mean number of patients per provider per
year. Providers with few patients may potentially
187
Dentist-specific variation in diagnosis
have a higher variance as they only treat a small
subset of the patients in a typical clinic.
We excluded all children and adolescents treated
by a public dental officer from the county of Øst-
fold (n = 34 810). The providers in Østfold are paid
according to a per capita payment scheme (19).
These providers may have a different practice style
compared with those who are paid a fixed salary.
Results
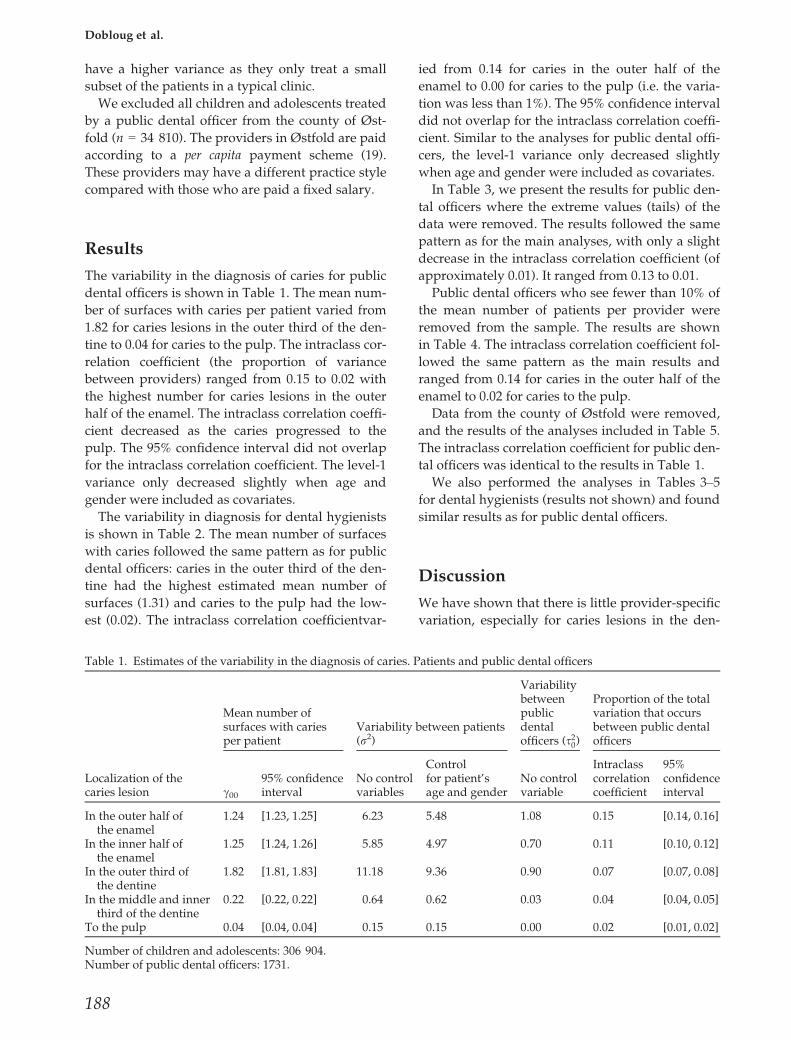
The variability in the diagnosis of caries for public
dental officers is shown in Table 1. The mean num-
ber of surfaces with caries per patient varied from
1.82 for caries lesions in the outer third of the den-
tine to 0.04 for caries to the pulp. The intraclass cor-
relation coefficient (the proportion of variance
between providers) ranged from 0.15 to 0.02 with
the highest number for caries lesions in the outer
half of the enamel. The intraclass correlation coeffi-
cient decreased as the caries progressed to the
pulp. The 95% confidence interval did not overlap
for the intraclass correlation coefficient. The level-1
variance only decreased slightly when age and
gender were included as covariates.
The variability in diagnosis for dental hygienists
is shown in Table 2. The mean number of surfaces
with caries followed the same pattern as for public
dental officers: caries in the outer third of the den-
tine had the highest estimated mean number of
surfaces (1.31) and caries to the pulp had the low-
est (0.02). The intraclass correlation coefficientvar-
ied from 0.14 for caries in the outer half of the
enamel to 0.00 for caries to the pulp (i.e. the varia-
tion was less than 1%). The 95% confidence interval
did not overlap for the intraclass correlation coeffi-
cient. Similar to the analyses for public dental offi-
cers, the level-1 variance only decreased slightly
when age and gender were included as covariates.
In Table 3, we present the results for public den-
tal officers where the extreme values (tails) of the
data were removed. The results followed the same
pattern as for the main analyses, with only a slight
decrease in the intraclass correlation coefficient (of
approximately 0.01). It ranged from 0.13 to 0.01.
Public dental officers who see fewer than 10% of
the mean number of patients per provider were
removed from the sample. The results are shown
in Table 4. The intraclass correlation coefficient fol-
lowed the same pattern as the main results and
ranged from 0.14 for caries in the outer half of the
enamel to 0.02 for caries to the pulp.
Data from the county of Østfold were removed,
and the results of the analyses included in Table 5.
The intraclass correlation coefficient for public den-
tal officers was identical to the results in Table 1.
We also performed the analyses in Tables 3–5for dental hygienists (results not shown) and found
similar results as for public dental officers.
Discussion
We have shown that there is little provider-specific
variation, especially for caries lesions in the den-
Table 1. Estimates of the variability in the diagnosis of caries. Patients and public dental officers
Localization of thecaries lesion
Mean number ofsurfaces with cariesper patient
Variability between patients(r2)
Variabilitybetweenpublicdentalofficers (s20)
Proportion of the totalvariation that occursbetween public dentalofficers
c0095% confidenceinterval
No controlvariables
Controlfor patient’sage and gender
No controlvariable
Intraclasscorrelationcoefficient
95%confidenceinterval
In the outer half ofthe enamel
1.24 [1.23, 1.25] 6.23 5.48 1.08 0.15 [0.14, 0.16]
In the inner half ofthe enamel
1.25 [1.24, 1.26] 5.85 4.97 0.70 0.11 [0.10, 0.12]
In the outer third ofthe dentine
1.82 [1.81, 1.83] 11.18 9.36 0.90 0.07 [0.07, 0.08]
In the middle and innerthird of the dentine
0.22 [0.22, 0.22] 0.64 0.62 0.03 0.04 [0.04, 0.05]
To the pulp 0.04 [0.04, 0.04] 0.15 0.15 0.00 0.02 [0.01, 0.02]
Number of children and adolescents: 306 904.Number of public dental officers: 1731.
188
Dobloug et al.

tine and pulp, for children and adolescents in
Norway. In medicine, the practice style hypothesis
suggests that a large proportion of practice varia-
tion stems from uncertainty regarding diagnosis
and treatment outcomes (10, 11, 20, 21). In our
study, we investigated the variation observed in
diagnostics and found a similar pattern. The prac-
tice variation is higher for diagnosis of caries in the
outer half and inner half of the enamel than in the
dentine. This corresponds with the level of uncer-
tainty in the diagnostic criteria. A potential prob-
lem with our data is that carious lesions in the
enamel might be underreported, as these lesions
are not treated with fillings. It is reasonable to
assume that the degree of underreporting is low
and evenly distributed among the providers. In
that case, the intraclass correlation coefficient
would be underestimated (22).
There is little or no precedence in measuring
dentist-specific practice variation using multilevel
regression. In medicine, multilevel analysis has
been employed (11), but is still not commonly
used. The technique that has been used most com-
monly is small area analysis. With this technique,
there is no clear criterion for how to test the null
hypothesis for the variation between providers. In
Table 2. Estimates of the variability in the diagnosis of caries. Patients and dental hygienists
Localization of thecaries lesion
Mean number ofsurfaces with cariesper patient
Variability betweenpatients (r2)
Variabilitybetweendental hygienists(s20)
Proportion of the totalvariation that occursbetween dentalhygienists
c0095% confidenceinterval
No controlvariables
Control forpatient’s ageand gender
No controlvariable
Intraclasscorrelationcoefficient
95%confidenceinterval
In the outer half ofthe enamel
1.19 [1.18, 1.20] 6.40 5.43 1.05 0.14 [0.13, 0.16]
In the inner half ofthe enamel
1.09 [1.08, 1.09] 5.40 4.47 0.43 0.07 [0.07, 0.08]
In the outer third ofthe dentine
1.31 [1.31, 1.32] 7.37 6.10 0.36 0.05 [0.04, 0.05]
In the middle andinner third of thedentine
0.13 [0.13, 0.13] 0.31 0.30 0.01 0.02 [0.01, 0.02]
To the pulp 0.02 [0.02, 0.02] 0.06 0.06 0.00 0.00 [0.00, 0.00]
Number of children and adolescents: 402 707.Number of dental hygienists: 603.
Table 3. Intraclass correlation coefficient when patients with the most extreme values for caries are removed from thesample. Patients and public dental officers
Localization of the caries lesion
Patients removed fromsample
Numberof patientsin the analysis
Proportion of the totalvariation that occursbetween public dentalofficers
Percenta
Numberof patientsremoved
Intraclasscorrelationcoefficient
95%confidenceinterval
In the outer half of the enamel 1.02.5
30878094
303 817298 810
0.130.12
[0.12, 0.14][0.11, 0.12]
In the inner half of the enamel 1.02.5
26878279
304 217298 625
0.090.09
[0.09, 0.10][0.08, 0.09]
In the outer third of the dentine 1.02.5
76672921
299 237303 983
0.060.06
[0.05, 0.06][0.06, 0.07]
In the middle and inner third of the dentine 1.02.5
35716770
303 333300 134
0.030.02
[0.03, 0.03][0.02, 0.03]
To the pulpb 1.0 2664 304 240 0.01 [0.01, 0.01]
aPercentage of patients with extreme values removed.bNinety-nine percentage of of the patients do not have this diagnosis, hence the omitted values.
189
Dentist-specific variation in diagnosis

particular, type I statistical errors may be difficult
to ascertain using small area analyses (23). This is a
reason for using multilevel regression to estimate
practice variation.
Testing the null hypothesis in a multilevel model
is quite simple: The estimated mean should be
equal for all practitioners ðb01 ¼ b02 ¼ � � � ¼ b0jÞ.This implies that
H0 : s20 ¼ 0
Null hypothesis: no variation between providers
Ha : s20 [ 0
Alternative hypothesis: there is variation between
providers.
The benefit of the multilevel model we used in
our study is that we get separate variance estimates
for providers and patients. However, it is not
meaningful to look at level-2 variance by itself. By
comparing it to level-1 variance (i.e. estimating the
intraclass correlation coefficient), we get a sense of
how much of the observed variation can be attrib-
uted to public dental officers or dental hygienists.
The intraclass correlation coefficient tells us how
much the diagnostics of each provider varies com-
pared with the underlying variation driven by the
patients themselves. It is thus a measure of the pro-
portion of variance between providers.
In previous studies, provider variation has been
measured by comparing diagnoses from several
providers who see the same patients (see (24) for a
review). This method shows that there is variation
in scoring the same patient. The data set used in
our study is restricted to one observation per
patient. We were therefore unable to compare our
findings with earlier findings for which a different
study design has been used. Thus, a separate study
comparing the two methods is warranted.
We considered analysing the data using a three-
level and a four-level model (with dental clinic and
county as the levels). The main challenge with this
approach is the different ways the data are stored
within each county: some counties have one central
installation of their electronic dental record system
(comprising more than 34 000 patients examina-
tions during a year), while several counties have
separate installations for each dental clinic (some
with <100 patient examinations yearly). For 12 of
the 19 counties, it was not possible to identify the
different clinics; that is, a clinical identification was
missing. Analysing the data with the clinic as a
third level would thus exclude large parts of the
data. Therefore, we chose to refrain from analysing
and reporting any clinical-level variance. We can
safely assume that the clinic variance must be
smaller than the observed provider variance. This
implies that the intraclass correlation coefficient at
the clinic level is <7%. Analysing a two-level model
with county as the second level did not converge.
A close examination of the grand mean for each
diagnosis showed that there was only a very small
difference between the counties in the level of car-
ies among children and adolescents. Analysing the
data in a three-level model revealed that this varia-
tion amounted to approximately 1%. The estimates
for the dentist-specific variation in our analyses
decreased approximately by 0.1% in this scenario.
The prevalence of caries in our study population
is fairly similar to that found in comparable coun-
tries. In our data set, the mean DMFT for 12-year-
olds was 1.33 for the years 2009–2011. This figure
can be compared with the figures published by the
World Health Organization (WHO) (25) for the
similar age group. The global DMFT for 2011 is
1.61, while for the whole of Europe it is 1.95. Com-
pared with the numbers published by WHO for
Table 4. Intraclass correlation coefficient when publicdental officers who see few patients are removed fromthe samplea. Patients and public dental officers
Localization of the caries lesion
Intraclasscorrelationcoefficient
95%confidenceinterval
In the outer half of the enamel 0.14 [0.13, 0.15]In the inner half of the enamel 0.10 [0.10, 0.11]In the outer third of the dentine 0.07 [0.06, 0.07]In the middle and inner thirdof the dentine
0.04 [0.03, 0.04]
To the pulp 0.02 [0.01, 0.02]
aDefined as the public dental officers who see <10% ofthe mean number of patients per provider in the sample.Number of patients removed = 2396.Number of public dental officers removed = 380.
Table 5. Intraclass correlation coefficient when the pub-lic dental officers in the county Østfold are removed.Patients and public dental officers
Localization of the caries lesion
Intraclasscorrelationcoefficient
95%confidenceinterval
In the outer half of the enamel 0.15 [0.14, 0.16]In the inner half of the enamel 0.11 [0.10, 0.12]In the outer third of the dentine 0.07 [0.07, 0.08]In the middle and inner thirdof the dentine
0.04 [0.04, 0.05]
To the pulp 0.02 [0.01, 0.02]
Number of patients removed: 34 810.Number of public dental officers removed: 57.
190
Dobloug et al.

Western Europe, Norway is about average. The
results from our study should therefore be applica-
ble for most countries.
In conclusion, we have estimated dentist-specific
variation in caries diagnosis. We consider the vari-
ation to be fairly low. The variability is dependent
on the level of diagnostic uncertainty and is coher-
ent with the practice style hypothesis (11). We have
also shown that a multilevel approach to estimat-
ing practice variation is feasible and has advanta-
ges over the more traditional approaches.
AcknowledgementsWe would like to thank Henrik Jakobsen (HedmarkCounty) for his help with data collection, Linda Gryttenfor correcting the language and all the County DentalOfficers for their cooperation.
References1. Paul-Shaheen P, Williams D, Clark JD. Small area
analysis: a review and analysis of the North Ameri-can literature. J Health Polit Policy Law 1987;12:741–809.
2. Grytten J, Sørensen R. Practice variation and physi-cian-specific effects. J Health Econ 2003;22:403–18.
3. Bader J, Shugars D. Variation, treatment outcomes,and practice guidelines in dental practice. J DentEduc 1995;59:61–95.
4. Bader JD, Shugars DA. Variation in dentists’ clinicaldecisions. J Public Health Dent 1995;55:181–8.
5. Langlais RP, Skoczylas LJ, Prihoda TJ, Langland OE,Schiff T. Interpretation of bitewing radiographs:application of the kappa statistic to determine rateragreements. Oral Surg Oral Med Oral Pathol1987;64:751–6.
6. Mileman PA, van der Weele LT. Accuracy in radio-graphic diagnosis: dutch practitioners and dentalcaries. J Dent 1990;18:130–6.
7. Noar SJ, Smith BGN. Diagnosis of caries and treat-ment decisions in approximal surfaces of posteriorteeth in vitro. J Oral Rehabil 1990;17:209–18.
8. Mercuri M, Gafni A. Medical practice variations:what the literature tells us (or does not) about whatare warranted and unwarranted variations. J EvalClin Pract 2011;17:671–7.
9. Grytten J, Carlsen F, Skau I. Services production andpatient satisfaction in primary care. Health Policy2009;89:312–21.
10. Phelps CE. Diffusion of information in medical care.J Econ Perspect 1992;6:23–42.
11. Grytten J, Monkerud L, Sørensen R. Adoption ofdiagnostic technology and variation in caesarean sec-tion rates: a test of the practice style hypothesis inNorway. Health Serv Res 2012;47:2169–89.
12. Statistics Norway. 2011 (available at: https://www.ssb.no/statistikkbanken) [last accessed 01 April2013].
13. Ministry of Social Affairs. Lov om tannhelsetjenesten.Oslo, Norway: Ministry of Social Affairs, 1983; 27.
14. Grytten J, Skau I. Specialization and competition indental health services. Health Econ 2009;18:457–66.
15. Holst D, Varreng A, Hogsnes T, Jakobsen HN. Inn-kallingsintervaller for barn og unge i den offentligetannhelsetjenesten. Nor Tannlaegeforen Tid2007;117:942–7.
16. Regional committees for medical and health researchethics. Norway (available at: https://helseforskning.etikkom.no/) [last accessed 01 April 2013].
17. Singer JD. Using sas proc mixed to fit multilevelmodels, hierarchical models, and individual growthmodels. J Educ Behav Stat 1998;23:323–55.
18. Snijders TAB, Bosker RJ. Multilevel analysis: anintroduction to basic and advanced multilevel mod-eling. London: Sage; 2012: XI, 354 s.: ill.
19. Grytten J, Holst D, Skau I. Incentives and remunera-tion systems in dental services. Int J Health CareFinance Econ 2009;9:259–78.
20. Wennberg JE, Barnes BA, Zubkoff M. Professionaluncertainty and the problem of supplier-induceddemand. Soc Sci Med 1982;16:811–24.
21. Wennberg JE. Tracking medicine: a researcher’squest to understand health care. USA: Oxford Uni-versity Press, 2010.
22. Newman DA, Sin H-P. How do missing data biasestimates of within-group agreement? Sensitivity ofSDWG, CVWG, rWG(j), rWG(j)*,and ICC to system-atic nonresponse. Organ Res Methods 2009;12:113–47.
23. Diehr P, Cain K, Connell F, Volinn E. What is toomuch variation? The null hypothesis in small-areaanalysis. Health Serv Res 1990;24:741–71.
24. Bader JD, Shugars DA, Bonito AJ. A systematicreview of the performance of methods for identifyingcarious lesions. J Public Health Dent 2002;62:201–13.
25. WHO. (available at: http://www.Mah.Se/capp/country-oral-health-profiles/according-to-alphabeti-cal/global-dmft-for-12-year-olds-2011) [last accessed01 April 2013]. WHO/Malm€o University, 2011.
191
Dentist-specific variation in diagnosis


![Mohsen Maleki Gorji - Conferences · Kamal Asgar Research Center, Encino, CA 3. Dentist 3 • In early caries lesions, ... Mohsen Maleki Gorji [Compatibility Mode] Author: sushma-bandi](https://img.pdfslide.us/doc/110x75/5af05c247f8b9abc788d0e29/mohsen-maleki-gorji-asgar-research-center-encino-ca-3-dentist-3-in-early.jpg)