Embed Size (px)
Citation preview
Denmark’s Climate Policy Objectives and Achievements
Report on Demonstrable Progress in 2005 under the Kyoto Protocol
Denm
ark’s Clim
ate Policy Objectives and A
chievements R
eport on Dem
onstrable Progress in 200
5 under the Kyoto Protocol
Denmark’s Climate Policy Objectives and Achievements
Report on Demonstrable Progress in 2005 under the Kyoto Protocol

� Denmark’s Climate Policy Objectives and Achievements

�Denmark’s Climate Policy Objectives and Achievements
Contents
PRefACe ........................................................ 5
IntRODuCtIOn ...................................................... 7
1 PROgRess In 2005 ....................................... 9
2 POlICIes AnD meAsuRes wIth effeCt On gReenhOuse gAs emIssIOns AnD RemOvAls ....................... 15
2.1 the policy-making process and the legal basis for implementing and enforcing the Kyoto Protocol .... 15
2.2 Denmark’s climate policy, targets and strategy ....... 15
�.�.1 Denmark’sclimatepolicy......................................... 15�.�.� Internationalclimatetargets.................................... 16�.�.� Denmark’sClimateStrategy.................................... 17�.�.4 Progressingeneralconcerningfollow-up
ontheClimateStrategy............................................ 18
2.3 measures limiting greenhouse gas emissions ........ 22�.�.1 Measuresandeffectsacrosssectors...................... ���.�.� PoliciesandMeasuresandtheireffects
inDenmark’seconomicsectors.............................. �5�.�.� Energy ................................................................ �5�.�.4 Transport ................................................................ �9�.�.5 Businesssector......................................................... �0�.�.6 Agriculture,forestry,andfisheries........................... ���.�.7 Thedomesticsector................................................. �5�.�.8 Wasteandwastewater.............................................. �7
3 DesCRIPtIOn Of tRenDs In, AnD PROjeCtIOns Of gReenhOuse gAs emIssIOns AnD RemOvAls .............. 41
3.1 Past trends in greenhouse gas emissions and removals ................................................................ 41
�.1.1 Carbondioxide(CO�)............................................... 41�.1.� Methane(CH4)......................................................... 4��.1.� Nitrousoxide,N�O................................................... 4��.1.4 Thepotentgreenhousegases
HFCs,PFCs,andSF6................................................ 4��.1.5 Denmark’stotalgreenhousegasemissions
andremovals............................................................ 44
3.2 Projected trends in greenhouse gas emissions and removals in the "with measures" baseline scenario ................................................................ 46
�.�.1 Totaleffectofmeasures........................................... 46�.�.� Carbondioxide,CO�................................................. 51�.�.� Methane,CH4........................................................... 51�.�.4 Nitrousoxide,N�O................................................... 51�.�.5 Industrialgases,HFCs,PFCs,andSF6.................... 57�.�.6 Denmark’stotalgreenhousegasemissions
andremovals........................................................... 57
3.3 the projection without measures ............................... 57
3.4 Projected trends in greenhouse gas emissions and removals in a scenario including additional measures ................................................................ 57
4 AnAlysIs Of the COntRIbutIOn Of DOmestIC meAsuRes AnD use Of the KyOtO meChAnIsms ......................... 59
4.1 evaluation of projected progress in emissions reduction by measure .............................................. 59
4.1.1 TheEffortAnalysis.................................................... 59
4.2 Achievement of targets under the Kyoto Protocol in terms of overall greenhouse gas “with measures” projections ............................................................... 67
5 PROgRess COnCeRnIng the OtheR COmmItments unDeR ARtICles 10 AnD 11 Of the KyOtO PROtOCOl ........... 69
nOtes ........................................................ 70
Annex ........................................................ 71
DAtA sheet ........................................................ 80

4 Denmark’s Climate Policy Objectives and Achievements

5Denmark’s Climate Policy Objectives and Achievements
It is a pleasure for me to present this progress report on Denmark’s climate policy objectives and achievements. The report has been prepared to be forwarded to the UN secretariat for the Climate Convention and to the European Commission. The report presents progress made in Denmark in the endeavours to fulfil its interna-tional climate commitments.
The report is an important signal to the international community that Denmark is complying with its international commitments on climate. With this report, Den-mark is able to demonstrate progress as a result of considerable efforts to reduce greenhouse gas emissions.
During the period 2008-2012, Denmark must reduce greenhouse gas emissions by 21% compared to emissions in 1990. As early as in 1990 Denmark adopted its first action plan with reduction of CO2 emissions as the objective. A new analysis of the efforts from 1990 up to 2001 demonstrates that the total reduction effects from do-mestic initiatives implemented can be estimated at approx. 21 million tonnes annu-ally in 2008 - 2012.
New projections of emissions in Denmark in 2008-2012 demonstrate that the so-called climate deficit including the effect of measures adopted since 2003 as a fol-low up to the Government Climate Strategy, has been reduced to 8-13 million tonnes of CO2 equivalents annually in the period of commitment. The deficit reduc-tion is also due to, e.g. anticipated reductions in exports of electricity and antici-pated effects of the allocation of funds to JI and CDM projects in 2003-2008 cor-responding to approx. 4.5 million tonnes of CO2 equivalents annually in 2008-2012. The interval of 8-13 million tonnes of CO2 equivalents annually in the commitment period reflects that the question of Denmark’s base year has not yet been clarified.
In connection with the Government Climate Strategy, the deficit was previously set at 20-25 million tonnes of CO2 equivalents annually in the period 2008-2012.
It is gratifying that Denmark’s commitment is now assessed to be less than previ-ously stated and that our efforts to fulfil our very considerable climate commitment are now paying off. It is, however, too early to rest on our laurels. The new climate deficit is still a great challenge and it will take considerable efforts to eliminate the deficit completely. With the new projections, we now have an up-dated basis for continued efforts.
The most important future measure will be allowance regulation with a reduction of allowances for businesses subject to allowance-regulation, as a follow-up to the Government Climate Strategy of 2003. This will happen in connection with the Al-location Plan for 2008-2012, which will be prepared in 2006. In connection with the preparation of this plan, the measures in all major sectors will also be reviewed.
Copenhagen, June 2005
Connie Hedegaard Minister for the Environment
Preface

6 Denmark’s Climate Policy Objectives and Achievements
7Denmark’s Climate Policy Objectives and Achievements
This report is about Denmark’s demonstrable progress made un-der the Kyoto Protocol. The report has been prepared according to the guidelines for reporting under the United Nations Framework Con-vention on Climate Change and the Kyoto Protocol1.
The report has been prepared on the basis of Denmark’s Fourth Na-tional Communication on Climate Change under the United Nations Framework Convention on Climate Change. The Fourth National Com-munication is the first National Communication after the Kyoto Protocol entered into force. Com-pared to the Third National Com-munication, the Fourth National Communication is extended with supplementary information in ac-cordance with the additional report-
ing requirements for parties to the Protocol.
Since the information in the Fourth National Communication corre-sponds to a great extent to the in-formation that must be included in this report, Denmark has chosen to prepare the two reports in parallel. Except information on Greenland and a few updates the present report contains the same information as the progress report published and forwarded to the European Com-mission in June 2005. The present report will be forwarded to the UN Climate Secretariat together with the Fourth National Communication whereto references for further infor-mation are made.
Introduction

8 Denmark’s Climate Policy Objectives and Achievements

9Denmark’s Climate Policy Objectives and Achievements
Since the report of the Brundtland Commission ”Our Common Fu-ture” from 1987, Denmark’s climate policy has developed as an interac-tion between all sectors, internation-al climate policy, and results from related scientific research.
Thus, since the end of the 1980s and during the 1990s a considerable number of measures to reduce the emissions of greenhouse gases have been implemented.
The developments in Denmark’s emissions and removals of green-house gases from the base year to 2003 (the most recent inventory year), as they are to be invento-ried under the Kyoto Protocol, are shown in Table 1.1.
The relatively great variations in previous total emissions and remov-als of greenhouse gases are espe-cially due to variations in Denmark’s exchange of electricity with neigh-bouring countries. Furthermore, emissions of CO2 from energy con-sumption vary considerably from year to year, depending on winter temperatures.
In order to facilitate the assessment of developments in CO2 emissions associated with Denmark’s own en-ergy consumption in normal winters, the figures are shown in Table 1.2 with corrections made for exchange of electricity and variations in tem-perature.
Table 1.1: Denmark’s emissions anD removals of greenhouse gases invenTorieD accorDing To regulaTions unDer The kyoTo ProTocol
base
year1 1991 1992 1993 1994 1995 1996 1997 1998 1999 2000 2001 2002 2003
million tonnes of CO2 equivalents
69.6 80.0 7�.8 76.� 79.7 76.8 90.0 80.� 76.0 7�.9 68.� 69.6 68.9 7�.9
Index (base year=100)
100 115 106 109 114 110 1�9 115 109 105 98 100 99 106
1InaccordancewiththeKyotoProtocol,thebaseyeariscomposedofemissionsofCO�,methaneandnitrousoxidein1990andemissionsofso-calledindustrialgreenhousegasesin1995.InaccordancewithDenmark’slegalcommitmentundertheEUburdensharingofthetotalEUreductioncommitmentof8%undertheKyotoProtocol,thebaseyearisshownherewithoutcorrec-tionforimportsofelectricityin1990.Thebaseyear–andtherebyDenmark’sexactreductioncommitment–willbesetfinallyin�006.
Table 1.2: Denmark’s greenhouse gas emissions anD removals correcTeD for exchange of elecTriciTy anD TemPeraTure variaTions
base
year1 1991 1992 1993 1994 1995 1996 1997 1998 1999 2000 2001 2002 2003
million tonnes of CO2 equivalents
77.5 80.0 77.9 77.0 76.6 76.� 75.4 74.7 7�.8 71.9 70.� 69.6 68.4 67.9
Index (base year=100)
100 10� 101 99 99 98 97 96 94 9� 91 90 88 88
1ThebaseyeariscomposedofemissionsofCO�,methaneandnitrousoxidein1990andemissionsofso-calledindustrialgreenhousegasesin1995.SinceDenmark’slegalcommitmentsundertheEUburdensharingofthetotalEUreductioncommitmentof8%undertheKyotoProtocolistobeseeninrelationtoabaseyearwithoutcorrections,thefiguresinthetablecanonlybeusedtoillustratetheeffectsofmeasurestakentolimitCO�emissionsassociatedwithDenmark’sownenergyconsumption.
1 Progressin�005
10 Denmark’s Climate Policy Objectives and Achievements
Denmark’s efforts and progress with national measures, e.g. relating to national energy consumption, pref-erably by choosing other fuels (es-pecially natural gas instead of coal and oil), expansion in decentralised cogeneration of heating and power and renewable energy, and energy saving are reflected in Table 1.2, since there is a 12% drop in total emissions of greenhouse gases from 1990 to 2003.
These results are not less remark-able, if compared to economic de-velopment in Denmark, where the GDP has grown, on average, 2% annually during the same period. Furthermore, it has been possible to keep the corrected gross energy con-sumption fairly constant. In the An-nex to this report, a number of indi-cators illustrate progress concerning emissions, emissions seen in relation to economic development, emis-sions per capita, share of renewable energy, decentralised cogeneration of heating and power as part of electricity and district heating pro-duction, gross energy consumption, CO2 intensity in energy consump-tion, etc.
How the various measures have contributed to progress has also been investigated more closely with the Effort Analysis published in April 2005. As described in section 4.1 together with the basis for the analy-sis, this analysis demonstrates that the effect of the Danish efforts in 1990-2001 corresponds to approx. 21 million tonnes of CO2 annu-ally in 2008-2012. Only about 16
million tonnes of CO2 annually in 2008-2012 correspond to the effect on emissions of greenhouse gases in Denmark in the former projection from February 2003. The remain-ing 5 million tonnes would not have been realized as a reduction in Dan-ish emissions, since considerable exports of electricity were expected in 2008-2012, according to the pro-jection from February 2003. In spite of a reduction due to exports of electricity, the effect of the Danish efforts in 1990-2001 is still substan-tial. This previous effort will also lead to reductions in emissions of greenhouse gases in 2008-2012.
In relation to the Kyoto Protocol, for the period 2008-2012 the EU has committed itself to reducing emissions of greenhouse gases on average to 8% below the level in the so-called base year; 1990 for CO2, methane, and nitrous oxide and either 1990 or 1995 for industrial greenhouse gases. As part of the internal EU Burden Sharing Agree-ment, Denmark has committed itself to a 21% reduction.
The Climate Strategy of 2003 stipulated that further cost-effective measures should be implemented with a view to Denmark’s compli-ance with its legal reduction com-mitment. Since the Kyoto Protocol provides the possibility to arrange climate efforts including interna-tional as well as domestic reduction efforts, a significant element of the Government’s Climate Strategy is to combine cost-effective domestic measures with the flexible mecha-
11Denmark’s Climate Policy Objectives and Achievements
nisms of the Kyoto Protocol – Emis-sions Trading and the project mech-anisms Joint Implementation and Clean Development Mechanism.
The implementation of the Climate Strategy includes:
1) Establishment of an interdepart-mental climate committee, to ensure follow-up on the Climate Strategy,
2) Implementation of the EU Emission Trading Scheme (EU ETS), which has led to allow-ance regulation of about half of the Danish greenhouse gas emissions since 1 January 2005 and establishment of a national allowance registry,
3) Initiation of a policies and measures project, which is to investigate the possibilities of implementing additional cost-ef-fective measures and forwarding a report on this to the Climate Committee in 2006,
4) Agreement on the Action Plan for the Aquatic Environment III (VMP III), which will also re-duce emissions of nitrous oxide from agriculture,
5) Allocation of funds to JI and CDM projects and making agreements and entering into contracts on specific projects with other countries as well as implementation of such projects.
The interdepartmental climate com-mittee will follow up regularly on whether the new measures imple-mented are sufficient to secure Den-mark’s compliance with its commit-ments under the Kyoto Protocol and the EU Burden Sharing Agreement.
An up-dated projection of Den-mark’s emissions and removals of greenhouse gases in 2004-2030 was prepared in May 2005. This up-dated baseline projection (‘with (existing) measures’ projection) is based on, e.g. an updated energy projection, which now includes ex-pected effects of the implemented EU allowance directive (only the cost effects of introducing the al-lowance system – i.e., without the effect of the actual allowance, which for the period 2008-2012 will not be decided until 2006). Concerning ag-riculture, the expected effects of the VMP III have now been included in the baseline projection.
The result of this projection of emissions is shown in Table 1.3 to-gether with the expected effects of allocations of funds to JI and CDM projects in 2003-2008.
As shown in Table 1.3, the Dan-ish deficit is estimated at 13 million tonnes of CO2 equivalents annually, based on Denmark’s legal commit-ment according to the EU Burden Sharing Agreement. This is based on a situation where no correction has been made for the particularly large imports of electricity in 1990.

1� Denmark’s Climate Policy Objectives and Achievements
Taking into account Denmark’s as-sumption regarding corrections be-ing made for imports of electricity in the base year 1990, cf. the political declarations of the Council and the Commission, the deficit is reduced to approx. 8 million tonnes of CO2
equivalents annually in 2008-2012, as shown in Table 1.3.
In connection with the Govern-ment’s proposal for a Climate Strategy for Denmark, a projection showing the expected developments without additional measures was
presented in February 2003. Here the deficit was set at 20-25 million tonnes of CO2 equivalents annually in 2008-2012. The new projection from May 2005 thus represents a reduction of approx. 12 million tonnes of CO2 equivalents annually in 2008-2012.
With the choice of method, the defi-cit expresses the need to purchase allowances from abroad or to im-plement new measures outside the sectors subject to allowances. So, as a result of the introduction of the
Table 1.3 The resulTs of Denmark’s laTesT “wiTh exisTing measures only” ProjecTion of greenhouse gas emissions anD The DeficiT comPareD To The eu burDen sharing of The eu reDucTion TargeT unDer The kyoTo ProTocol.Source: 1990-�00�:TheNationalInventoryReport(NIR),theNationalEnvironmentalResearchInstitute(NERI),April�005.
�004-�0�0:Projectionofgreenhousegasemissions,MemorandumtotheDanishEPA,NERI,May�005.
million tonnes of CO2 equivalents
base year1990/951 2003 “2010”2 “2015”3 2020 2025 2030
CO24 5�.9 59.� 59.0 58.8 55.� 54.� 54.9
methane (Ch4) 5.7 5.9 5.6 5.� 5.� 5.� 5.�
nitrous oxide (n2O) 10.7 8.1 6.9 6.8 6.6 6.5 6.5
Industrial gases, hfCs, PfCs, and sf6
0.� 0.7 0.8 0.5 0.� 0.� 0.�
total emissions 69.6 73.9 72.3 71.4 67.2 66.1 66.8
Of which is export of electricity: (- means import)
-6.� 6.9 4.4 �.� 1.4 0.9 �.7
Kyoto target (–21%) 55.0
Reductions in other countries from funds allocated to jI and CDm projects
4.5
Deficit incl. jI and CDm 7.8/1�.85
1BaseyearforCO�,methane,andnitrousoxideis1990.InaccordancewiththeKyotoProtocol,1995ischosenasthebaseyearforindustrialgases.
�”�010”standsformeanemissionsin�008-�01�
�”�015”standsformeanemissionsin�01�-�017
4HerenetemissionofCO�inventoriedundertheKyotoProtocol,becauseremovalofCO�inforestsplantedsince1990isincludedcf.protocolarticle�.�.
5Thedeficithasbeeninventoriedbothonthebasisoftheassumptionoftakingimportsofelectricityin1990intoaccount,cf.thepoliticalstatementoftheCouncilandtheCommissionandonthebasisofDenmark’slegalcommitmentundertheEUBurdenSharingAgreement.
1�Denmark’s Climate Policy Objectives and Achievements
CO2 allowance scheme, the deficit is in principle not directly comparable to the deficit in the Government’s Climate Strategy, since the cost ef-fects of the allowances are included, whereas ultimately the allocation of allowances decides the climatic effects of the scheme. Note that projection, and therefore also the deficit, is based on model predic-tions, which are subject to uncer-tainty. This applies, not least, to expected developments in energy prices, prices of CO2 allowances, and the developments in the Nordic electricity market, which have a di-rect influence on the size of exports of electricity. The implementation of the EU allowance scheme has, however, created a basis for greater certainty regarding the fulfilment of Denmark’s climate commitments under the Kyoto Protocol and the EU Burden Sharing Agreement.
As shown in Table 1.3, there will still be a deficit compared to Den-mark’s target under the Kyoto Pro-tocol, in spite of the implementation of the additional measures men-tioned above.
With the EU allowance scheme, the primary instrument for fulfilling Denmark’s climate commitments is secured. Other cost-effective meas-ures will also be considered. In this context, the Policies and Measures Project’s identification of additional cost-effective measures is expected to contribute to removing the deficit entirely.
Furthermore, sector-policy measures that can be of climatic relevance in the short or long term will be implemented. This includes the long-term energy strategy – Energy Strategy 2025 and the Action Plan for Strengthened Energy-Saving Ef-forts2.
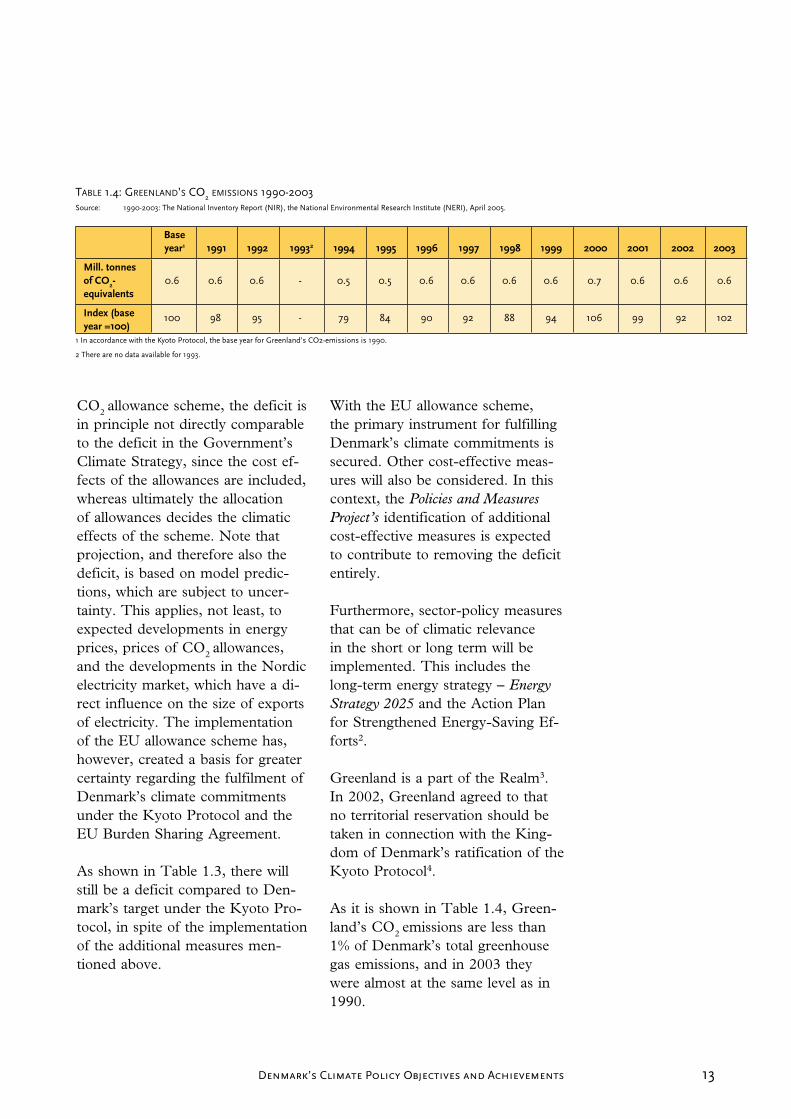
Greenland is a part of the Realm3. In 2002, Greenland agreed to that no territorial reservation should be taken in connection with the King-dom of Denmark’s ratification of the Kyoto Protocol4.
As it is shown in Table 1.4, Green-land’s CO2 emissions are less than 1% of Denmark’s total greenhouse gas emissions, and in 2003 they were almost at the same level as in 1990.
Table 1.4: greenlanD’s co2 emissions 1990-2003 Source: 1990-�00�:TheNationalInventoryReport(NIR),theNationalEnvironmentalResearchInstitute(NERI),April�005.
baseyear1 1991 1992 19932 1994 1995 1996 1997 1998 1999 2000 2001 2002 2003
mill. tonnes of CO2-equivalents
0.6 0.6 0.6 - 0.5 0.5 0.6 0.6 0.6 0.6 0.7 0.6 0.6 0.6
Index (base year =100)
100 98 95 - 79 84 90 9� 88 94 106 99 9� 10�
1InaccordancewiththeKyotoProtocol,thebaseyearforGreenland’sCO�-emissionsis1990.
�Therearenodataavailablefor199�.
14 Denmark’s Climate Policy Objectives and Achievements
Since the 1970s the Home Rule has been interested in using hydropower for energy supply. After several systematic studies and the adop-tion of energy policy guidelines, the first hydropower plant could be taken into use in 1993. It supplies Nuuk with electricity and has since it was commissioned resulted in an annual reduction of CO2 emissions of around 55,000 tonnes, or about 10% of the total CO2 emissions in Greenland. In 2005 another hydro-power plant in Tasiilaq commenced operation, with an expected CO2 reduction of 3,446 tonnes CO2 per year. A small hydropower plant in South Greenland is now under con-struction to supply Qaqortoq and Narsaq. When it starts operation in early 2008, it is expected to con-tribute with displacement of oil cor-responding to 4,800 m3 or 12,700 tonnes CO2 annually.
Progress has also been made within the waste sector, with the establish-ment of waste incineration plants at the six largest towns - covering about 70% of the population - and use of some of the surplus heat from the incineration process for district heating. Waste incineration to some extent replaces fuel oil for heating and reduces methane emissions that would otherwise occur if the waste were deposited at landfill sites.
Greenland is facing new and great challenges, partly because of the country’s increasing energy con-sumption and the increasing oil prices, and partly because global climate change is especially affecting
the Arctic and threatens Greenland’s way of life and hunting culture. Greenland has a global obligation to live up to the Climate Convention and the Kyoto Protocol.
Greenland will work to promote use of renewable and environmentally friendly energy (water, wind power, solar energy, hydrogen) which in the long term will reduce CO2 emissions and make Greenland less dependent on fossil fuels.

15Denmark’s Climate Policy Objectives and Achievements
2.1 The Policy-making Process anD The legal basis for imPlemenT-ing anD enforcing The kyoTo ProTocol
The legal basis for the division of powers into the legislative, execu-tive, and judicial power is the Dan-ish Constitution, Danmarks Riges Grundlov.On the motion of the Government, the Danish Parliament (Folketinget) gave its consent in 2002, allowing Her Majesty Queen Margrethe the Second, on behalf of the National Community and with territorial res-ervations for the Faroe Islands, to ratify the Kyoto Protocol. This hap-pened on 31 May 2002.Denmark’s implementation of the Kyoto Protocol is on-going and is being effectuated by following up on the national Climate Strategy, sector-policy strategies with cli-mate considerations, and concrete measures, which will contribute to limiting or reducing greenhouse gas emissions, and implementation of the other parts of the Kyoto Proto-col. The legislation necessary to do this has been adopted in pursuance of the Constitution regulations con-cerning legislative powers.
The total set of regulations can be accessed via Retsinformation5. Fur-thermore, reference to the specific legal basis for each of the concrete measures dealt with is, as far as possible, included in the Fourth National Communication, just as it is mentioned whether it implements EU legislation.
Legislation concerning measures of importance to Denmark’s commit-ments under the Kyoto Protocol will be enforced pursuant to the current legal basis, including pursuant to any penalty clause. Enforcement can also involve the judicial power.As regards the institutional arrange-ments for the implementation the Kyoto Protocol concerning activities in connection with participation in the mechanisms under articles 6, 12, and 17 of the Kyoto Protocol and establishment and operation of a national allowance registry, the gen-eral delegation of tasks is as follows, although the Danish Environmental Protection Agency (EPA) also has activities concerning the CDM:
JI and The National Allowance Registry :The EPA under the Ministry of the Environment
CDM:The Danish Ministry of Foreign Af-fairs
The Danish Energy Authority un-der the Ministry of Transport and Energy is responsible for legislation and administration concerning the EU allowance directive.
2.2 Denmark’s climaTe Policy, Tar-geTs anD sTraTegy
2.2.1 Denmark’s climate policySince the Brundtland Commission’s report ”Our Common Future” from
� Policiesandmeasureswitheffecton greenhousegasemissionsandremovals

16 Denmark’s Climate Policy Objectives and Achievements
1987, Denmark’s climate policy has developed in collaboration with the different sectors of society, the inter-national climate policy, and results from related scientific research.
Thus, since the end of the 1980s and during the 1990s, a consider-able number of measures have been implemented that have led to re-duced greenhouse gas emissions.
These measures were aimed at achieving environmental improve-ments for society in general, e.g. by introducing environmental taxes and involving the public in the debate and decisions concerning the envi-ronment.
Since 2001, focus has been on mak-ing efforts to reduce emissions cost-effectively.
In order to be able to monitor the development in the total effect of these efforts on greenhouse gas emissions from Denmark’s national energy consumption, the basis for and the follow-up on Denmark’s reduction efforts has included emis-sions inventories corrected for an-nual temperature variations and variations in Denmark’s imports of electricity.
2.2.2 International climate targetsSince 1990, Denmark has undertak-en or committed itself to several tar-gets aimed at reducing greenhouse gas emissions:
• In accordance with the Cli-mate Convention, to reduce
total greenhouse gas emissions in Denmark, Greenland, and the Faroe Islands to the 1990 level by 2000. This target was achieved if only emissions are included. Up-dated figures for 2000 concerning emissions from and removals by forests (reduced removal due to wind-falls are now included) and new data for land (not previously included) brings the Realm to within 1% of the target, when these emissions and removals are included in the inventory.
• As a contribution to stabiliza-tion in the EU, Denmark com-mitted itself to reducing CO2
emissions in 2000 by 5% com-pared to the corrected level for 1990. This target was fulfilled.
• In relation to the Kyoto Proto-col, for the period 2008-2012 the EU has committed itself to reducing emissions of green-house gases on average to 8% below the level in the so-called base year; 1990 for CO2, meth-ane, and nitrous oxide and either 1990 or 1995 for the industrial greenhouse gases. Denmark has committed itself to a reduction of 21% as an element of the burden-sharing agreement within the EU. In the Council’s decision on the EU ratification to the Kyoto Protocol, the commitments of the different Member States are thus given as percentages com-pared to the base year. In 2006 the respective emission levels
17Denmark’s Climate Policy Objectives and Achievements
must be given in tonnes of CO2
equivalents. In this connection, the Council (environment) and the Commission have, in a joint statement, agreed e.g. to show consideration for Denmark’s remarks to the Council conclu-sions of 16-17 June 1998 con-cerning emissions in the base year.
2.2.3 Denmark’s Climate strategyThe Folketing approved Denmark’s present climate strategy in March 2003. The Climate Strategy lays down a framework for Denmark’s future efforts on climate. The point of departure in the Climate Strategy is that Denmark is to fulfil its inter-national climate commitments under the Kyoto Protocol and the subse-quent Burden Sharing Agreement in the EU, and that efforts are to be arranged cost-effectively.
Although many substantial measures have already been taken in order to comply with the climate target, a considerable effort is still needed if Denmark is to fulfil its very ambi-tious Kyoto target. In the baseline projection for Denmark’s green-house gas emissions, which was prepared as a basis for the Climate Strategy - that is a projection which only incorporates expected effects of measures implemented prior to the Strategy – it was estimated that there would be a deficit of 20-25 million tonnes of CO2 equivalents annually in 2008-2012 compared to Denmark’s Kyoto commitment, if no additional measures were imple-mented6, 7.
The Kyoto Protocol makes it pos-sible to plan climate action that is more flexible. The Climate Strategy combines cost-effective domestic measures with the use of the Kyoto Protocol’s flexible mechanisms.
Reduction efforts are first and fore-most tasks for the private sector, not least for the sectors which are subject to allowance regulation. Ac-cording to the Climate Strategy, ef-forts from central authorities could supplement private efforts, and in the initial phase they could contrib-ute by getting the market for CO2
credits started. Efforts from central authorities are concentrated on the flexible mechanisms of the Kyoto Protocol and include implementa-tion of concrete projects to reduce greenhouse gas emissions in for-eign countries. They are JI projects (joint implementation of projects in other Annex I countries) and CDM projects (projects in collaboration with developing countries on the de-velopment of cleaner technology).
Since reduction costs for possible new domestic action in the various sectors are continuously develop-ing as a result of technological de-velopment and changing economic frameworks among other things, the Strategy contemplates assessing ef-forts on a regular basis with the aim of ensuring that the most cost-effec-tive measures are chosen.
In order to ensure correlation of reduction efforts across sectors and measures, the government has set a benchmark at DKK 120 per tonne

18 Denmark’s Climate Policy Objectives and Achievements
of CO2, which can constitute a basis for the implementation of domestic measures outside the sectors and businesses subject to the EU allow-ance scheme. The benchmark is an expression of the value of the CO2
reduction which can be included in the assessment of concrete measures. In addition to this the value of other possible benefits of the implemented measure, e.g., other environmental benefits can be added.
The Government platform of Feb-ruary 2005 is based on the Climate Strategy. A number of elements with climate-policy aspects are also em-phasized. These elements include:
- that the Government will put forward a long-term energy strategy up to 2025,
- that the Government will en-hance energy-saving efforts and put forward an action plan,
- that the Government will put forward a proposal for the de-sign of future energy and CO2
taxes in light of the EU’s intro-duction of CO2 allowances from 1 January 2005,
- that the Government will ap-point a committee which is to investigate the possibilities for, over a number of years, re-ar-ranging the total automobile taxation scheme in a revenue-neutral and environmentally ad-vantageous manner, and
- that the Government, with re-gard to scientific research and development:
- will put forward an action plan aimed at public authorities and private businesses together in-creasing their efforts regarding scientific research and develop-ment,
- via a high technology fund will promote high-technological research and innovation, e.g. within the health-care and en-ergy area, and
- will strengthen the development of green technologies, e.g. with-in the energy and bio-fuel area.
In 2005, the Government took ac-tion on these elements. Some infor-mation on the Government’s Energy Strategy 2025 and The Energy Sav-ing Action Plan are included in this report. Further information on the Governments follow-up on these and all other elements mentioned above, is given in Denmark’s Fourth National Communication on Cli-mate Change.
2.2.4 Progress in general concerning follow-up on the Climate strategy
2.2.1.1 The Climate CommitteeIn order to ensure cost-effectiveness in climate policy, as part of the fol-low-up on the Climate Strategy the Government decided to appoint a standing climate committee to fol-low up regularly on the deficit and
19Denmark’s Climate Policy Objectives and Achievements
ensure cost-effective implementation of the climate policy. The commit-tee is composed of the Ministry of Finance, the Ministry of Economic and Business Affairs, the Ministry of Food, Agriculture and Fisheries, the Ministry of Foreign Affairs, the Ministry of Taxation, the Ministry of Transport – now the Ministry of Transport and Energy – including the Danish Energy Authority, and the Ministry of the Environment – including the Danish Environmental Protection Agency (EPA). The EPA chairs the committee and provides the secretariat.
The climate committee is to moni-tor the Danish climate deficit on a regular basis, i.e., the difference between the Danish target for greenhouse gas emissions in 2008-2012 and the expected emissions. On the basis hereof, the committee is to ensure proper co-ordination and prioritisation between different measures, which can contribute to the fulfilment of Denmark’s reduc-tion commitment, including the use of flexible mechanisms (interna-tional allowance trade, Joint Imple-mentation and Clean Development Mechanism), allowance regulation, and other national measures across various social sectors. In this con-nection, the committee is to assess the socio-economic, state-financial, environmental, distributional and competition related consequences of implementing various measures and of various measures and initiatives.
In 2006 the climate committee is also to co-ordinate the preparation
of a progress report on the fulfil-ment of Denmark’s reduction com-mitment and up-date calculations concerning measures with regard to costs and potentials, aimed at a pos-sible revision of Denmark’s Climate Strategy.
2.2.1.2 The Policies and Measures Project
In Denmark’s Third National Communication to the Climate Convention, the main results of the analyses, which formed the basis for the Climate Strategy with respect to potentials and socio-economic reduction costs were presented. The calculations illustrated that only relatively few domestic actions with a significant potential which did not exceed the benchmark of DKK 120 per tonne of CO2 equivalents, would be cost-effective compared to the use of the flexible mechanisms. This should be viewed in light of the fact that Denmark already made a great national effort during the 1990s.
On this basis the Government’s cost-effective strategy for the ful-filment of Denmark’s reduction commitment emphasises the use of flexible mechanisms – Emissions Trading and the project mechanisms Joint Implementation and Clean Development Mechanism. The EU allowance scheme will constitute the framework for most of the reduc-tion efforts. The actual composition of the efforts depends on the degree to which the businesses included choose to implement their own re-duction measures or to purchase al-lowances from abroad.
�0 Denmark’s Climate Policy Objectives and Achievements
In order to up-date and investigate the possibilities of implementing ad-ditional domestic measures apart from the allowance-regulated activi-ties, the follow-up on the Climate Strategy has also included imple-mentation of a interdepartmental project, the Policies and Measures Project, which e.g. continues to in-vestigate the potential of new do-mestic measures, where previous cal-culations have shown relatively low reduction costs. It also investigates more closely whether new informa-tion exists that could contribute to reducing previously calculated costs further. Finally, the project also in-vestigates whether additional, new cost-effective domestic measures ex-ist.
The project is expected to end in 2006, where the result are to be a part of the Climate Committee’s status 2006 report as a basis for the allocation plan 2008-2012.
2.2.1.3 General progress on implementation of new measures
The EU directive on a common allowance scheme (the EU ETS) constitutes the framework for ef-forts from 1 January 2005 for a large proportion of the energy producers and some of the energy-intensive in-dustry. The businesses subject to the allowance scheme 2005-2007 are in the process of preparing their own climate efforts. They can choose to reduce their own emissions when this is most appropriate, or they can buy allowances or credits from project-based emission reductions
when this is considered most appro-priate. This ensures that businesses concerned can adapt their efforts to market conditions on a regular basis. Denmark’s implementation of the EU allowance directive is dealt with in greater detail in section 2.3.1.1.
As mentioned, using the flexible mechanisms under the Kyoto Pro-tocol is also part of a cost-effective Danish Climate Strategy. Section 2.3.1.2 reports on progress with re-spect to allocation of funds and spe-cific JI and CDM projects.
Section 2.3.1.3 reports in greater detail on progress regarding taxes of importance to Denmark’s green-house gas emissions. The Gov-ernment tax freeze eliminates tax increases, but re-allocations may prove to be the outcome of the committee’s deliberations, which are expected to conclude in 2007.
Within the energy sector, measures have been implemented to enhance further energy saving and improve energy efficiency. Denmark’s Fourth National Communication on Cli-mate Change reports on progress with regard to the specific plans, the Action Plan for Strengthened En-ergy-saving Efforts, and the Energy Strategy 2025, both of which have been finalized in 2005.
The Policies and Measures Project also investigates possibilities in the trans-port sector. In most cases, however, new measures in the transport sector demand a common effort within the EU to become sufficiently effective.

�1Denmark’s Climate Policy Objectives and Achievements
With respect to business and indus-try, focus will be on CO2 reduction by way of allowance regulations as incentives enhancing energy saving and reduction in CO2-process emis-sions. Since the latter is primarily associated with the production of cement and tiles, technology of-fers limited reduction possibilities at present. Technologically, the prospects for reducing emissions of nitrous oxide associated with the production of nitric acid in the fer-tilizer industry are good. As shown in section 3.2.4, this is, however, no longer an issue, since Denmark ceased to produce nitric acid in 2004. Denmark’s important con-tribution to reducing the use and emission of fluorine-containing greenhouse gases is also described in greater detail in the Fourth National Communication.
Certain possibilities also exist for re-ducing greenhouse gas emissions in the agricultural sector. The potential and possibilities of implementing cost-effective measures in this sec-tor were analysed more closely in connection with the preparation of the Action Plan for the Aquatic En-vironment III, which was adopted in 2004. The plan itself only resulted in minor reductions in greenhouse gas emissions, cf. the Fourth Na-tional Communication. Therefore, in continuation hereof, additional concrete measures are being studied at present as part of the Policies and Measures Project. The provisional results are expected to be presented and discussed at a project day in 2005 that will be open to the public.
Apart from the measures concern-ing afforestation which have already been implemented and can be re-ferred to article 3.3 of the Kyoto Protocol, in connection with the Policies and Measures Project, it is being investigated whether article 3.4 of the Protocol can include cost-effective reduction potentials in connection with forests and land (revegetation, forest management, cropland management, and grass-land management).
Concerning the waste sector, the Policies and Measures Project is inves-tigating whether there are cost-effec-tive potentials connected to further expansion of extraction and utiliza-tion of energy from methane from landfills.
2.2.1.4 Denmark’s efforts in 1990-2001 and associated costs
In March 2005 a major analysis of Denmark’s efforts in 1990-2001 to reduce emissions of CO2 and other greenhouse gases, and associated costs was finalized and published in the report “Danmarks udledning af CO2 – indsatsen i perioden 1990-2001 og omkostninger herved” (Denmark’s CO2 emissions – the effort in the period 1990-2001 and the associ-ated costs)8, hereafter the Effort Analysis.
Prior to this analysis, quantitative estimates of the effect of separate measures on greenhouse gas emis-sions were often limited to ex-ante estimates before the measure in question was adopted. In a few cases, the implementation of a mea-
�� Denmark’s Climate Policy Objectives and Achievements
sure was followed by an ex-post evaluation. A major reason for only performing ex-post evaluations of a few measures is that in many cases it is difficult to ascribe unequivocally an observed reduction in greenhouse gas emissions to a certain measure, since many areas (sectors/sources) are affected by several measures si-multaneously.
In the analysis of the importance of selected and implemented measures for greenhouse gas emissions as a result of efforts in 1990-2001, the effect and cost of a number of mea-sures were estimated – both for the year 2001 and for the period 2008-2012. Thus, the latter case is a so-called without measures projection i.e. without the effects of measures implemented since 1990, which gives estimates of the size of mean annual greenhouse gas emissions in 2008-2012, if the measures until 2001 had not been implemented.
Please note that the statistical base for the Effort Analysis has included the emission inventory submitted to the EU and the UN in 2003 (cover-ing 1990-2001) and the “with meas-ures” baseline projection (2008-2012), i.e. without additional meas-ures, published in February 2003 together with the Government’s Cli-mate Strategy and described in Den-mark’s Third National Communication to the Climate Convention.
The outcome of the Effort Analysis is described in greater detail in section 4.1.1.
2.3 measures limiTing greenhouse gas emissions
2.3.1 measures and effects across sectors
2.3.1.1 Allowance regulationOn 1 January 2005 the EU allow-ance scheme replaced Denmark’s national allowance scheme. In ac-cordance with the Climate Strategy, this extended allowance regulation scheme has become part of the new central measures associated with the efforts to reduce Denmark’s green-house gas emissions.
In its present form the EU allowance scheme will be valid in 2005-2007, and in Denmark it will include CO2
emissions from, e.g. a number of energy-producing facilities (over 20 MW), refineries, steel works, a number of mineral-processing facili-ties (cement, lime, glass, tiles) and facilities for the production of paper and cardboard (over 20 tonnes of paper or cardboard daily).
Denmark’s national allowance scheme only included the major producers of electricity in the energy sector. Via the national allocation plan, the present allowance regula-tion in Denmark includes individual emission limits 2005-2007 for CO2
emissions from 377 Danish produc-tion facilities within several sectors, which together produce approx. half of Denmark’s total greenhouse gas emissions9.
The Danish Allocation Plan entails a total allowance allotment of 15% be-
��Denmark’s Climate Policy Objectives and Achievements
low the baseline projection (with ex-isting measures) for the sectors sub-ject to allowances – with the greatest reduction from the production of electricity. Provided that emissions from the other sectors remain fairly constant, the reduction as a result of the Allocation Plan 2005-2007 con-stitutes approx. 7.4% of all projected emissions. Thus, Denmark will be on its way to fulfilling its climate target for the period 2008-12 as set by the EU burden sharing of the reduction target under the Kyoto Protocol.
The anticipated reduction effect of 7.4% of the new allowance regula-tion corresponds to a reduction of 6 million tonnes of CO2 annually in 2005-2007.
The effect in 2008-2012 cannot be estimated before the Allocation Plan for this period has been prepared in 2006.
Changes to the EU allowance direc-tive and/or to Denmark’s implemen-tation of it may have been made by then – e.g. regarding activities, sectors, and greenhouse gases to be included in the scheme.
Denmark has had an active, envi-ronmentally-oriented energy policy since the 1970s, and since 1990 this has been supplemented by a climate policy, which, on an international scale, has entailed a major strain – economically and/or via adminis-trative regulations – on most of the greenhouse gas emissions, especially from businesses and sectors that are
not subject to allowances. Therefore the cheap reduction potentials are to a certain degree exhausted in these sectors. The additional reduction efforts needed to fulfil Denmark’s climate commitment will, therefore, primarily affect sectors subject to al-lowances.
Denmark’s national allowance registryIn connection with the new allow-ance regulation that entered into force on 1 January 2005, Denmark’s national allowance registry10 (DK ETR – Emission Trading Registry), which is used to allot allowances to production facilities subject to al-lowances and enables trade in allow-ances among the allowance holders found in the registry, also opened. The allowance registry has also been prepared to contribute to Denmark’s implementation of the Kyoto Pro-tocol in such a way that Denmark’s EU allowance registry can also be made to function as the national allowance registry (”National Reg-istry”), which is to be established pursuant to the Kyoto Protocol as a prerequisite for the application of the Kyoto mechanisms. Additional information on the national allow-ance registry is found in the Fourth National Communication.
2.3.1.2 The Kyoto mechanismsAs mentioned above, the starting point in the Government’s Climate Strategy is that efforts aimed at ful-filling the international climate com-mitment under the Kyoto Protocol and the subsequent EU Burden Sharing Agreement are organized cost-effectively.
�4 Denmark’s Climate Policy Objectives and Achievements
The flexible mechanisms are, there-fore, important elements of the Government’s Climate Strategy, supplementing domestic reduction measures. The purchasing of CO2
credits is primarily a task for the pri-vate businesses under the regulations of the EU allowance directive. The market for CO2 credits is, however, still in the making. By involvement in project development, the Govern-ment will contribute to ”starting up” the market for CO2 credits earlier than would otherwise have been the case. The buying of credits will also contribute to the fulfilment of Den-mark’s international climate commit-ment, just as the climate projects will entail a number of additional envi-ronmental benefits such as reduced pollution of air and water.
On this basis the Government has allocated DKK 1,130 million for the purchasing of CO2 credits from JI and CDM projects in 2003-2008.
With a mean allowance price in the projects of DKK 50 per tonne of CO2, the allocated funds correspond to approx. 4.5 million tonnes of CO2 annually for 5 years (2008-2012). A target-fulfilment projection that in-cludes the effects of these additional measures in 2008-2012 is 4.5 mil-lion tonnes of CO2 lower than the baseline projection, which is a pro-jection of Denmark’s greenhouse gas emissions and removals inventoried under the Kyoto Protocol with im-plemented and adopted measures.
The implementation of specific JI and CDM projects is described in-
more detail in the Fourth National Communication.
2.3.1.3 Taxes and dutiesIn Denmark, taxes and duties col-lected make up a total of approx. 48% of the GDP. The public sec-tor provides childcare, education, unemployment benefits, health and disability benefits, old-age pensions, and many other services.
The personal income tax is the most important tax, making up more than half (53%) of total tax revenues. Other taxes are VAT, duties, cor-poration taxes, and labour market contributions. The Danish VAT is relatively high, 25%, and there are no differentiated rates. There are a considerable number of additional consumption taxes and environmen-tal taxes. The corporation tax rate is 30%.
Retail prices on products that influ-ence Danish greenhouse gas emis-sions are, in most cases, the decisive factor determining the degree to which they are consumed. Energy prices influence the composition and total size of energy consumption. Therefore extra taxes and duties put on products influence the consump-tion of these products and the size of greenhouse gas emissions associ-ated with the use of the products.
Denmark has special taxes on mo-tor vehicles, energy products, al-cohol, tobacco, and a number of other products. During the 1990s a number of new environmental taxes were introduced. These taxes
�5Denmark’s Climate Policy Objectives and Achievements
were placed on consumer goods that caused pollution or were scarce (wa-ter, energy products such as such as oil, petrol, electricity, etc.) or on discharges of polluting substances (CO2, HFCs, PVC, SF6, SO2, and sewage). Taxes are placed on min-eral oil, tobacco, and alcohol in ac-cordance with EU legislation.
Taxes influencing Denmark’s green-house gas emissions include energy taxes and taxes on mineral oil, gas, coal, and electricity as well as CO2
taxes, and taxes on consumption of the potent greenhouse gases (HFCs, PFCs, and SF6). Registration taxes and annual taxes for cars are dif-ferentiated to promote development towards more energy-effective cars. These taxes are specified in the Fourth National Communication.
2.3.2 Policies and measures and their effects in Denmark’s economic sectors
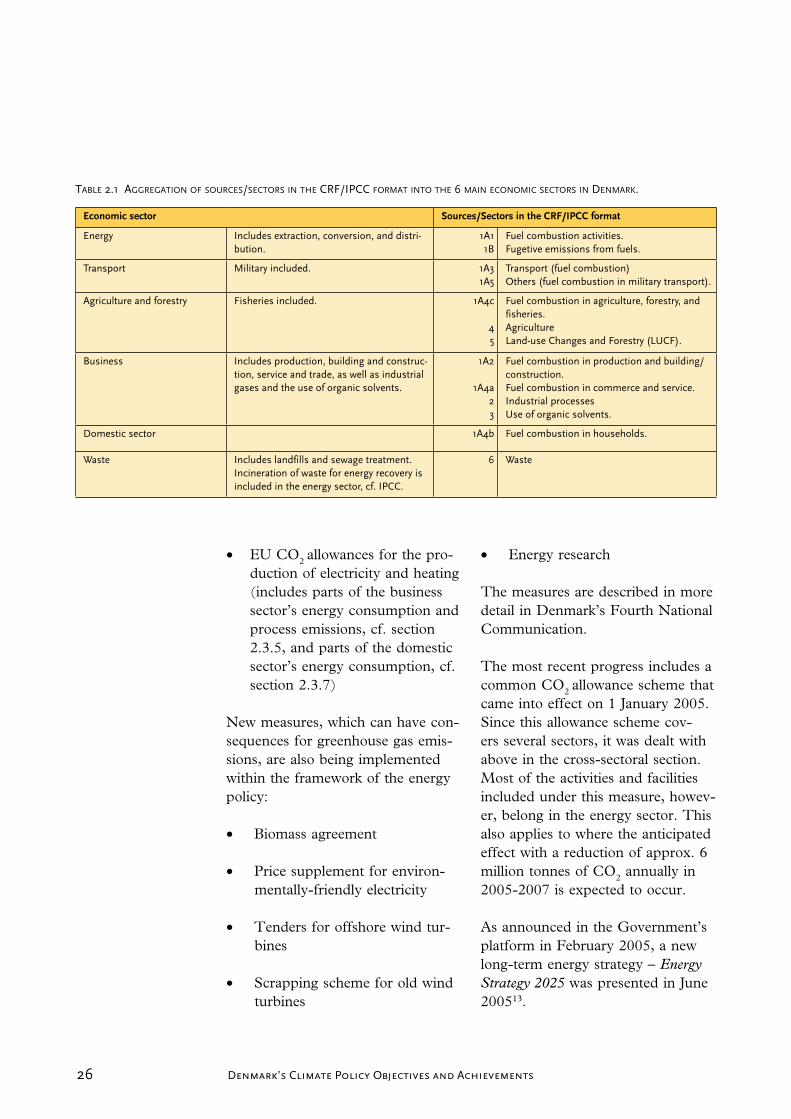
Denmark’s Fourth National Com-munication describes the other measures of importance to green-house gas emissions and removals in the following 6 economic sectors: energy, transport, business, agricul-ture/forestry, the domestic sector, and waste. Table 2.1 shows how the sector categories, which is to be used in connection with the annual emis-sion inventories, is aggregated into the 6 economic sectors.
The main results of this aggrega-tion in 1990/9511, 2003, 2008-12, and 2013-17, as well as in 2020, 2025, and 2030 without emission and removal in connection with land
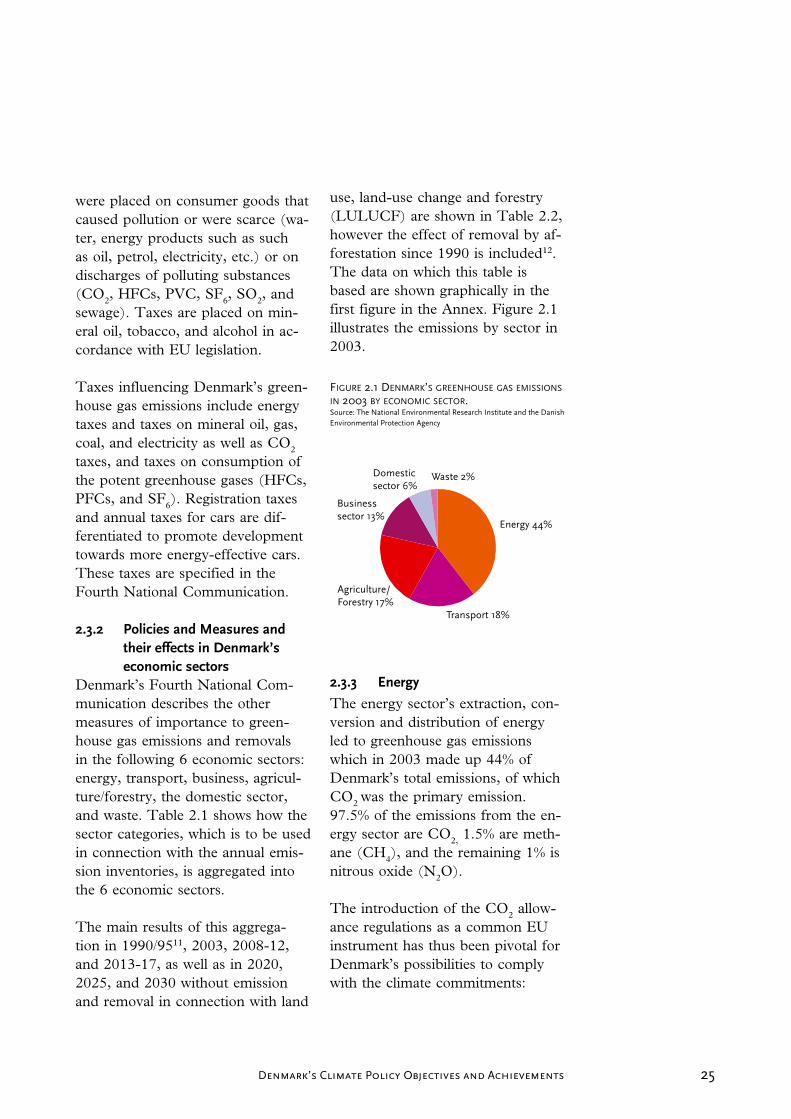
use, land-use change and forestry (LULUCF) are shown in Table 2.2, however the effect of removal by af-forestation since 1990 is included12. The data on which this table is based are shown graphically in the first figure in the Annex. Figure 2.1 illustrates the emissions by sector in 2003. figure 2.1 Denmark’s greenhouse gas emissions in 2003 by economic secTor. Source:TheNationalEnvironmentalResearchInstituteandtheDanishEnvironmentalProtectionAgency
2.3.3 energy
The energy sector’s extraction, con-version and distribution of energy led to greenhouse gas emissions which in 2003 made up 44% of Denmark’s total emissions, of which CO2 was the primary emission. 97.5% of the emissions from the en-ergy sector are CO2, 1.5% are meth-ane (CH4), and the remaining 1% is nitrous oxide (N2O).
The introduction of the CO2 allow-ance regulations as a common EU instrument has thus been pivotal for Denmark’s possibilities to comply with the climate commitments:
�6 Denmark’s Climate Policy Objectives and Achievements
• EU CO2 allowances for the pro-duction of electricity and heating (includes parts of the business sector’s energy consumption and process emissions, cf. section 2.3.5, and parts of the domestic sector’s energy consumption, cf. section 2.3.7)
New measures, which can have con-sequences for greenhouse gas emis-sions, are also being implemented within the framework of the energy policy: • Biomass agreement
• Price supplement for environ-mentally-friendly electricity
• Tenders for offshore wind tur-bines
• Scrapping scheme for old wind turbines
• Energy research
The measures are described in more detail in Denmark’s Fourth National Communication.
The most recent progress includes a common CO2 allowance scheme that came into effect on 1 January 2005. Since this allowance scheme cov-ers several sectors, it was dealt with above in the cross-sectoral section. Most of the activities and facilities included under this measure, howev-er, belong in the energy sector. This also applies to where the anticipated effect with a reduction of approx. 6 million tonnes of CO2 annually in 2005-2007 is expected to occur.
As announced in the Government’s platform in February 2005, a new long-term energy strategy – Energy Strategy 2025 was presented in June 200513.
Table 2.1 aggregaTion of sources/secTors in The crf/iPcc formaT inTo The 6 main economic secTors in Denmark.
economic sector sources/sectors in the CRf/IPCC format
Energy Includesextraction,conversion,anddistri-bution.
1A11B
Fuelcombustionactivities.Fugetiveemissionsfromfuels.
Transport Militaryincluded. 1A�1A5
Transport(fuelcombustion)Others(fuelcombustioninmilitarytransport).
Agricultureandforestry Fisheriesincluded. 1A4c
45
Fuelcombustioninagriculture,forestry,andfisheries.AgricultureLand-useChangesandForestry(LUCF).
Business Includesproduction,buildingandconstruc-tion,serviceandtrade,aswellasindustrialgasesandtheuseoforganicsolvents.
1A�
1A4a��
Fuelcombustioninproductionandbuilding/construction.Fuelcombustionincommerceandservice.IndustrialprocessesUseoforganicsolvents.
Domesticsector 1A4b Fuelcombustioninhouseholds.
Waste Includeslandfillsandsewagetreatment.Incinerationofwasteforenergyrecoveryisincludedintheenergysector,cf.IPCC.
6 Waste

�7Denmark’s Climate Policy Objectives and Achievements
Tab
le 2
.2 D
enm
ar
k’s
gr
een
ho
use
ga
s em
issi
on
s in
199
0/9
5, 2
00
3 a
nD
Th
e m
ay
200
5 ”w
iTh
m
easu
res
” Pr
oje
cTi
on
s u
nTi
l 20
30 b
y ec
on
om
ic s
ecTo
r a
nD
by
ga
s1 .S
ourc
e:T
heN
atio
nalE
nvir
onm
enta
lRes
earc
hIn
stitu
tea
ndth
eD
anis
hEn
viro
nmen
talP
rote
ctio
nA
genc
y
1990
/95
mt
CO
2
equi
v-
alen
ts
1990
/95
%
200
3
mt
CO
2
equi
va-
lent
s
200
3
%
Cha
ng-
es fr
om
1990
/95
to
200
3
200
8-
2012
mt
CO
2
equi
va-
lent
s
200
8-
2012
%
Cha
ng-
es fr
om
1990
/95
to
200
8-
2012
2013
-
2017
mt
CO
2
equi
va-
lent
s
2013
-
2017
%
Cha
ng-
es fr
om
1990
/95
to
2013
-
2017
2020
mt
CO
2
equi
va-
lent
s
2020
%
Cha
ng-
es fr
om
1990
/95
to
2020
2025
mt
CO
2
equi
va-
lent
s
2025
%
Cha
ng-
es fr
om
1990
/95
to
2025
2030
mt
CO
2
equi
va-
lent
s
2030
%
Cha
ng-
es fr
om
1990
/95
to
2030
ener
gy26
.838
.632
.844
.422
%30
.341
.913
%29
.541
.310
%25
.337
.6-6
%23
.936
.1-1
1%24
.336
.4-1
0%
CO
2�6
.4�8
.0��
.04�
.��1
%�9
.540
.91�
%�8
.840
.49%
�4.7
�6.8
-6%
��.�
�5.�
-1�%
��.7
�5.5
-10
%
Met
hane
(C
H4)
0.1
0.�
0.5
0.7
�78%
0.4
0.6
��6%
0.�
0.5
15�%
0.�
0.4
116%
0.�
0.4
106%
0.�
0.4
110
%
Nitr
ous
oxid
e(N
�O)
0.�
0.4
0.�
0.4
19%
0.�
0.4
14%
0.�
0.4
14%
0.�
0.4
�%0
.�0
.4-1
%0
.�0
.4-�
%
tran
spor
t10
.815
.513
.418
.124
%14
.620
.236
%15
.021
.040
%15
.422
.943
%15
.823
.846
%16
.124
.049
%
CO
�10
.615
.�1�
.917
.4��
%14
.019
.4��
%14
.4�0
.��6
%14
.8��
.040
%15
.1��
.94�
%15
.4��
.146
%
Met
hane
(C
H4)
0.1
0.1
0.1
0.1
15%
0.1
0.1
-10
%0
.00
.0-�
7%0
.00
.0-5
4%0
.00
.0-5
9%0
.00
.0-6
0%
Nitr
ous
oxid
e(N
�O)
0.1
0.�
0.4
0.6
191%
0.5
0.7
�66%
0.6
0.8
�86%
0.6
0.9
�00
%0
.60
.9�1
�%0
.60
.9��
�%
Agr
icul
ture
/for
estr
y15
.622
.412
.416
.8-2
0%
12.0
16.6
-23%
11.5
16.2
-26%
11.3
16.7
-28%
11.0
16.7
-29%
10.9
16.3
-30
%
CO
��.
7�.
9�.
5�.
�-8
�%�.
5�.
4-9
%�.
4�.
�-1
�%�.
��.
4-1
5%�.
��.
4-1
6%�.
1�.
�-�
1%
Met
hane
(C
H4)
�.9
5.6
�.8
5.1
-�%
�.6
5.0
-6%
�.5
4.9
-10
%�.
45.
1-1
�%�.
�5.
0-1
4%�.
�5.
0-1
4%
Nitr
ous
oxid
e(N
�O)
9.0
1�.0
6.�
8.4
-�1%
5.9
8.�
-�5%
5.7
7.9
-�7%
5.6
8.�
-�9%
5.4
8.�
-40
%5.
48.
�-4
0%
bus
ines
s9.
613
.89.
713
.11%
9.8
13.6
2%9.
913
.83%
9.8
14.6
2%10
.015
.24%
10.1
15.2
5%
CO
�8.
�11
.78.
010
.8-�
%8.
91�
.�9%
9.�
1�.9
1�%
9.5
14.1
16%
9.7
14.7
19%
9.8
14.7
�0%
Met
hane
(C
H4)
0.0
0.0
0.1
0.1
167%
0.1
0.1
���%
0.1
0.1
��8%
0.1
0.1
�4�%
0.1
0.1
�47%
0.1
0.1
�47%
Nitr
ous
oxid
e(N
�O)
1.1
1.6
1.0
1.�
-14%
0.1
0.1
-9�%
0.1
0.1
-9�%
0.1
0.1
-9�%
0.1
0.1
-9�%
0.1
0.1
-9�%
Indu
stri
alg
ases
0.�
0.5
0.7
1.0
1�9%
0.8
1.1
1�6%
0.5
0.7
61%
0.�
0.�
-45%
0.�
0.�
-45%
0.�
0.�
-45%
Dom
estic
sec
tor
5.2
7.4
4.1
5.6
-20
%4.
25.
9-1
8%4.
25.
9-1
9%4.
16.
1-2
1%4.
06.
1-2
2%4.
06.
0-2
3%
CO
�5.
07.
�4.
05.
4-�
1%4.
15.
6-1
9%4.
05.
6-�
0%
�.9
5.8
-��%
�.8
5.8
-�4%
�.8
5.7
-�5%
Met
hane
(C
H4)
0.1
0.1
0.1
0.1
48%
0.1
0.�
87%
0.1
0.�
96%
0.1
0.�
100
%0
.10
.�10
6%0
.10
.�11
�%
Nitr
ous
oxid
e(N
�O)
0.1
0.1
0.1
0.1
-11%
0.1
0.1
-�%
0.1
0.1
0%
0.1
0.1
1%0
.10
.1�%
0.1
0.1
�%
was
te1.
62.
31.
52.
0-1
0%
1.3
1.8
-19%
1.3
1.8
-19%
1.4
2.0
-17%
1.4
2.1
-15%
1.4
2.1
-13%
Met
hane
(C
H4)
1.5
�.�
1.4
1.9
-9%
1.�
1.7
-18%
1.�
1.8
-18%
1.�
1.9
-16%
1.�
�.0
-14%
1.�
�.0
-1�%
Nitr
ous
oxid
e(N
�O)
0.1
0.1
0.1
0.1
-�1%
0.1
0.1
-�0
%0
.10
.1-�
0%
0.1
0.1
-�0
%0
.10
.1-�
0%
0.1
0.1
-�0
%
tota
l69
.610
073
.910
06%
72.3
100
4%71
.410
03%
67.2
100
-3%
66.1
100
-5%
66.8
100
-4%
CO
�5�
.976
.059
.�78
.�1�
%59
.081
.61�
%58
.88�
.411
%55
.�8�
.14%
54.�
8�.0
�%54
.98�
.14%
Met
hane
(C
H4)
5.7
8.�
5.9
8�%
5.6
7.7
-�%
5.�
7.4
-6%
5.�
7.8
-8%
5.�
7.8
-9%
5.�
7.8
-9%
Nitr
ous
oxid
e(N
�O)
10.7
15.4
8.1
11-�
5%6.
99.
6-�
5%6.
89.
5-�
7%6.
69.
9-�
8%6.
59.
9-�
9%6.
59.
8-�
9%
Indu
stri
alg
ases
0.�
0.5
0.7
1.0
1�9%
0.8
1.1
1�6%
0.5
0.7
61%
0.�
0.�
-45%
0.�
0.�
-45%
0.�
0.�
-45%
1Tr
ends
inG
HG
em
issi
ons
byg
asa
ndb
yse
ctor
can
als
obe
see
nin
Fig
ure
5.1
inC
hapt
er5
.
�8 Denmark’s Climate Policy Objectives and Achievements
The strategy is an overall and coher-ent presentation of the government’s long-term energy policy. At the core of the strategy is a clear marketbased energy-political objective, in which public authorities provide the frame-work for the market actors.
Thus, the Energy Strategy is based on:
- liberalised energy markets with common EU framework
- market-based cost-effective in-struments, and
- public authorities providing the overall grid infrastructure and economic instruments, including the CO2 allowance scheme.
In line with this, the strategy does not propose quantitative objectives for the extension of renewable ener-gy, however it sets the stage for and envisages a market-based increase in the use of renewable energy.
It also underlines the importance of strengthened research and develop-ment of new energy technologies. In this regard, the Government, also in June 2005, published three new research and development strategies: one for hydrogen technologies, one for liquid biofuels, and one for wave energy.
Finally, Energy Strategy 2005 focus-es on the transport sector – a com-mittee will be set up to discuss the overall perspectives for alternative
propellants in the transport sector, including biofuels.
The Government will also promote energy-saving efforts, so Denmark can still be in the forefront con-cerning efficient energy use. In June 2005, the Government made a broad political agreement to sig-nificantly strengthen energy-saving efforts.
The agreement is ambitious, and sets the framework for efficient and increased energy-saving efforts in the coming years. The parties to the agreement agree that overall energy consumption (excluding transport) shall be reduced. Strengthened ef-forts will be made to reach specific and verifiable energy savings corre-sponding to 7.5 PJ per year on aver-age in the period 2006-2013.
Important parts of the energy savings will be achieved by better energy-saving results in grid and distribution companies within electricity, natural gas, district heating and oil. Moreo-ver, energy savings will be achieved through stricter rules on energy in building regulations, new and better energy labelling, better inspection of boilers and ventilation equipment, special efforts within the public sec-tor, and reorganisation of energy companies’ energy-saving efforts.
Together, the government’s action plan and the political agreement entail a significant strengthening of theoverall energy-saving efforts14.
�9Denmark’s Climate Policy Objectives and Achievements
2.3.4 transport
In 2003, the transport sector was responsible for 22% of Denmark’s CO2 emissions and 18% of total greenhouse gas emissions. The emis-sions from the transport sector are primarily CO2. 13 million tonnes of CO2 corresponded to 96.3% of emis-sions in 2003. Nitrous oxide made up 3.2% or 0.4 million tonnes of CO2 equivalents and methane ap-prox. 0.5% or 0.07 million tonnes of CO2 equivalents.
In 2003, the transport sector’s en-ergy consumption – primarily oil products – made up 31.5% of total energy consumption in Denmark. Traffic, especially passenger trans-port, has risen uniformly in recent years. Associated energy consump-tion and greenhouse gas emissions have risen correspondingly. In 2003 total greenhouse gas emissions from the transport sector were 24% higher than in 1990. The most recent prognosis from 2002 predicts con-tinued growth in the sector’s CO2 emissions, in spite of the fact that technological development has led to a reduction in energy consumption per km. Thus, the expected growth in traffic is expected to be approx. 17% from 2003 to 2012, whereas the growth in the transport sector’s energy consumption is expected to be approx. 9% during the same pe-riod.
One of the most important interna-tional measures yet is the EU target of attaining a mean CO2 emission from new passenger cars of 120 g of CO2 per km before 2010. With the
aim of fulfilling this target, agree-ments have been made with the au-tomobile industry in Europe, Japan, and most recently Korea, which commit the industry to reducing the mean CO2 emission per km. This measure is assessed to have had, and will in the future have, considerable effect and has been implemented with the reduction of CO2 emissions as one of the primary targets.
The national environmentally moti-vated measures for the transport sec-tor, which have also influenced CO2
emissions, are usually characterized by aiming at limiting environmental impacts in general. “Changing the registration tax to a green owner tax” and “increased fuel taxes” are both assessed to have had consider-able effects and were, furthermore, implemented with reduction of CO2
emissions as one of the primary tar-gets.
A great number of additional meas-ures aiming directly or indirectly at reducing CO2 emissions have been implemented within various areas. Denmark’s Fourth National Com-munication contains additional infor-mation on the following:
• Higher fuel taxes
• Green owner tax on motor vehi-cles
• Information campaign on the fuel consumption of new cars
• Energy-correct driving tech-niques
�0 Denmark’s Climate Policy Objectives and Achievements
• Initiative on enforcing speed limits
• Establishment of intermodal in-stallations
• Promotion of environmentally friendly freight transport
• Reduced travelling time for public transport
• Spatial planning.
2.3.5 business sectorThe business sector covers industry, building and construction, and pub-lic and private services.
In 2003, this sector was responsible for approx. 13% of Denmark’s total greenhouse gas emissions. 82% of these emissions were CO2. This sec-tor is, furthermore, the sole source of emissions of industrial gases. Cli-mate measures within the business sector include:
• EU CO2 allowances (parts of the business sector’s energy consumption and process emis-sions are subject to the EU CO2
allowance regulation, cf. section 2.3.3 on ”Energy”)
• Tax on HFCs, PFCs, and SF6
• Regulation of use of HFCs, PFCs, and SF6
The following substantial energy-saving measures which contribute to reducing domestic climate gas emis-
sions (both outside and within areas subject to allowances), have also been implemented:
• Agreements on energy-efficiency improvements in the business sector
• Electricity grid, gas and district heating companies' energy-sav-ing activities
• Circular on energy-efficiency in state institutions
• Electricity Saving Trust (El-sparefonden) – campaigns and A-club for institutions to pro-mote efficient appliances (incl. electricity-heat conversion and efficient appliances in house-holds)
The main efforts concerning the business sector’s energy consump-tion have been based on the 1995 green business-sector tax package. This was a combination of duties and refunds of tax revenues to the business sector, e.g. as normal state subsidies to promote energy saving in businesses. Tax refunds could be obtained on the basis of agreements on energy-efficiency improvements.
The total effect of the green package was evaluated in 1999. The main conclusion is that the package had the intended effects. Considerable environmental gains were achieved in an economically efficient man-ner, taking account of international competitiveness. The environmental consequences of the energy package
�1Denmark’s Climate Policy Objectives and Achievements
have largely satisfied the expecta-tions at the outset, and thereby they constitute an important part of the efforts to reduce the Danish CO2
emissions.
The agreement scheme was evalu-ated in 2005. The main conclusion is that businesses with agreements in 1996-1999 saved approx. 5.5% in energy, 2.5% of which are due to the agreements. For the period 2000-2003 the corresponding figures are approx. 4.5% and 2% respectively.
In the Government’s Climate Strat-egy from February 2003, it was esti-mated that there was still a potential for relatively inexpensive emission reductions in the energy-intensive part of the industry, which, until then, had paid lower CO2 taxes than other parts of the business sector and the domestic sector, out of re-gard for competitiveness.
Certain energy-intensive businesses are subject to allowance regulation as a consequence of the EU allow-ance directive. With the common EU allowance scheme, CO2 regula-tions without too serious effects on competitiveness could be imposed on energy-intensive industry. Allow-ance regulation is the main measure to be used with regard to these busi-nesses.
Energy efficiency in the public sec-tor has been an issue for more than 10 years, and substantial savings have been achieved.
In connection with the Finance Act for the fiscal year 2005, a political agreement on several areas including energy-saving measures was made. The agreement focuses particularly on energy saving in state institu-tions, as a consequence of the ef-forts of the Electricity Saving Trust (Elsparefonden), on new energy de-mands for state buildings, and on a new circular on energy-efficiency in state institutions.
Furthermore, the action plan for a renewed energy-saving effort pro-poses a number of activities aimed at public institutions.
Up to now, efforts with regard to the cement industry’s energy con-sumption have been based on the green business sector tax package with a combination of taxes and agreements on energy efficiency. From 1 January 2005, all CO2 emis-sions from cement production in Denmark are subject to the EU al-lowance directive.
The emission of nitrous oxide (N2O) from the production of nitric acid in connection with the produc-tion of fertilizer in Denmark ceased in 2004. From 2005 this corre-sponds to a reduction in the annual emissions amounting to approx. 0.9 million tonnes of CO2 equivalents.
The industrial sector is the only sector which in practice emits the industrial gases HFCs, PFCs, and SF6. These gases are used for several purposes including as cooling and foaming agents, etc. (HFCs), cool-
�� Denmark’s Climate Policy Objectives and Achievements
ing agents (PFCs), and insulator gas in high-tension contacts (SF6).
The Danish regulation of emissions of the industrial greenhouse gases (HFCs, PFCs, and SF6) is 2-phased, since there is a consumer tax and also a statutory order on the phasing out of use of the gases in new facili-ties and products.
Taxes corresponding to their GWP have been imposed on each of the greenhouse gases from March 2001 in combination with the Danish CO2
tax of DKK 0.1 per kg CO2.
On 15 July 2002, a statutory order on the regulation of certain industri-al greenhouse gases came into force. This order includes a general ban on the use of industrial greenhouse gas-es in a great number of new facilities and products from 1 January 2006, including household cooling and freezing appliances, PUR foam, etc. There are, however, certain excep-tions to the general phase-out date.
2.3.6 Agriculture, forestry, and fisheries
The primary occupational sectors agriculture, forestry, and fisher-ies are mainly dealt with as one economic sector in Denmark. The measures concerning agriculture and forestry include:
• Action Plan for the Aquatic En-vironment I+II and Action Plan for Sustainable Agriculture
• Action Plan for the Aquatic En-vironment III
• Ban on the burning of straw in fields
• Ammonia action plan and new Statutory Order on Manure
• Planting of windbreaks
• Biogas installations
• Grant scheme for private affor-estation on agricultural land
• Afforestation by public authori-ties (state, counties, and munici-palities)
AgricultureIn 2003, agriculture was responsible for 17% of Denmark’s total green-house gas emissions. Approx. 80% consisted of methane and nitrous oxide and 20% of CO2 from the burning of fuel.
In 2003, 176,000 tonnes of methane corresponding to 3.7 million tonnes of CO2 equivalents were emitted. The emissions from agriculture consist primarily of methane from enteric fermentation and decomposi-tion of manure.
Dairy cattle are the major contribu-tors of methane.
Methane is a by-product from the digestion process, especially com-ing from roughage. Methane is also produced when manure decomposes anaerobically, if the temperature is sufficiently high. These conditions usually exist in manure stores and in

��Denmark’s Climate Policy Objectives and Achievements
cow houses with slurry or deep bed-ding.
The emission of methane from ag-riculture is expected to be reduced in 2003-2012, corresponding to approx. 0.1 million tonnes of CO2
equivalents, primarily due to im-proved efficiency in cattle farming.
Agriculture is the primary source of nitrous oxide emissions in Denmark. Of the total emissions of 26,000 tonnes in 2003, 77% or 20,000 tonnes, corresponding to more than 6.2 million tonnes of CO2 equiva-lents came from agriculture.
The main sources of nitrous ox-ide are nitrogen in commercial and natural fertilizers and plant residues. Of the contributions of nitrous oxide from agriculture in 2003, 43% came from fertilizer and 31% from runoff. Evaporated ammonia also contrib-utes to the greenhouse effect, since some of the ammonia nitrogen ends up in the atmosphere as a compo-nent of nitrous oxide.
The emissions of nitrous oxide from agriculture are expected to be reduced, corresponding to about 3 million tonnes of CO2 equivalents or 32% during the period from 1990 to 2008-2012. Implementation of the Action Plan for the Aquatic En-vironment II and III will contribute the most to this reduction16,17.
With the political agreement on the Action Plan for the Aquatic Environment III of 2 April 2004, a number of measures were imple-
mented to follow up on the results attained via the previous plans. This third action plan contains targets with respect to nitrogen, phospho-rous, sensitive natural areas, and manure odour. The effect of the plan is estimated to be a reduction in emissions corresponding to 0.2 million tonnes of CO2 equivalents annually18 in 2008-2012.
Emitted ammonia will, by deposi-tion, stimulate the emission of ni-trous oxide. A reduction in the evap-oration of ammonia will, therefore, reduce emissions of nitrous oxide. An Ammonia Action Plan adopted in 2001 will, together with Action Plan for the Aquatic Environment I and II, reduce ammonia emissions by 15-20,000 tonnes of nitrogen an-nually. Hereby ammonia evaporation from agriculture should be reduced from 90,000 tonnes of nitrogen in the mid 1990s to approx. 60,000 tonnes of nitrogen in 2004.
The measures included in the Am-monia Action Plan are:
1) Optimisation of manure han-dling during housing for cattle, pigs, poultry and fur animals.
2) Rules on covering storage facili-ties for solid manure and slurry tanks.
3) Ban on surface spreading and reduction of the time from field application of manure to incor-poration.
�4 Denmark’s Climate Policy Objectives and Achievements
4) Ban on ammonia treatment of straw.
These measures are estimated to lead to a reduction in emissions of nitrous oxide corresponding to 34,000 tonnes of CO2 equivalents annually by 2010. A shorter period of exposure for spread manure has the greatest effect of 13,000 tonnes of CO2 equivalents annually215.
In 1987, an action plan on the ex-pansion of common biogas installa-tions was implemented. The Energy Policy Agreement of 29 March 2004 supports the production of biogas by raising the price of electricity from biogas installations from 2008. Expansions are, however, not being made as quickly as anticipated, but still to a degree allowing the baseline projection to be doubled in 2010 to approx. 0.5 million tonnes of CO2
equivalents annually. About half of this effect is due to expected reduc-tions in methane and nitrous oxide emissions. The other half is due to reduced CO2 emissions from substi-tution of fossil fuels in energy sup-ply.
Forestry The influence from forestry stems from the removal and emission of CO2 through the photosynthesis and respiration of the trees and their de-composition. Danish forests contain considerable stores of CO2 retrieved from the atmosphere. Afforestation increases these stores.
The total CO2 balance for forests is complicated and depends on many
factors. In Denmark, forests have several purposes including recrea-tion, landscape values, the produc-tion of wood products, e.g. firewood and timber, as well as hunting and nature. The net CO2 budget for forests depends on many factors, including the age distribution of the trees, the species of trees planted, and the production considerations taken.
The political target that most di-rectly influences an increased carbon binding is the declaration of intent from 1989, which states the Danish forested area is to be doubled within a 100-year period.
Several measures contribute to the fulfilment of this target. A state sub-sidy scheme supports afforestation on privately owned agricultural land. Afforestation is also carried out by the state and by private landowners without subsidisation.
Primarily the CO2 balance is af-fected by these measures. Forests raised on agricultural land accu-mulate far more biomass than the previous agricultural land-use. The forest biomass contains about 50% carbon, which is absorbed as CO2 through photosynthesis. Probably, additional carbon is stored in the organic matter in the soil due to a larger supply of dead organic matter and the absence of soil preparation. The effect of afforestation on other greenhouse gases, such as nitrous oxide and methane has not been properly clarified. However, the acidification of nitrogen-rich former
�5Denmark’s Climate Policy Objectives and Achievements
agricultural land may stimulate the formation of nitrous oxide, and blocking of drains after afforestation and the resulting water stagnation could increase methane emissions. Increased methane and nitrous ox-ide emissions could counteract the positive effect of afforestation on CO2 sequestration. However, since sufficient information is still unavail-able on changes in the methane and nitrous oxide emissions, analyses of the consequences are only carried out for CO2.
The Danish Forest and Nature Agency is responsible for the imple-mentation of the policy on afforesta-tion on privately owned farmland and state property.
Afforestation on 12,000 hectares of privately owned farmland, cor-responding to additional binding of 131,000 tonnes of CO2, was subsi-dized in 1990-2004.
The state, counties, and municipali-ties have contributed approx. 6,400 hectares of new forest since 1990. Our knowledge of unsubsidised pri-vate afforestation is limited, but it is estimated at approx. 600 hectares annually.
Both the subsidized private affor-estation and afforestation by public authorities will be less in the next 6-8 years, since work in connec-tion with the Natura 2000 Areas has been given high priority.
Additional information on subsidized private afforestation, afforestation by
public authorities, and total affores-tation can be found in Denmark’s Fourth National Communication.
FisheriesThe emission of greenhouse gases from fuels sold for use in fishing vessels are included in the figures on total greenhouse gas emissions and removals. The contribution from fishing vessels to total greenhouse gas emissions is primarily CO2. No special measures have been imple-mented in relation to fishing ves-sels. But the reduction in fisheries in recent years has also resulted in lowering fuel consumption rates and thereby also CO2 emissions.
2.3.7 the domestic sector96% of greenhouse gas emissions from households in 2003, corre-sponding to 4.1 million tonnes of CO2 equivalents, consisted of CO2. The domestic sector also emits a small amount of methane and even less nitrous oxide. To this can be added emissions as a result of con-sumption of electricity and district heating. These emissions are in-cluded in the figures for producers and therefore they are also subject to allowance regulation in the energy sector.
The consumption of energy by households, including electricity and district heating, is responsible for almost 30% of the total energy con-sumption in Denmark.
Most of this energy goes to heat-ing, where combustion of oil and gas produces CO2. A large part of
�6 Denmark’s Climate Policy Objectives and Achievements
heating is covered by district heat-ing (approx. 43% in 2003). District heating produced by cogeneration or with the use of CO2-friendly fuels such as natural gas end especially renewable energy entails great CO2
savings compared to the use of in-dividual heating based on, e.g. oil boilers.
Households also use considerable amounts of electricity. Most of the household consumption of electric-ity goes to household appliances and light sources, whereas less than 19% goes to electric heating. Consump-tion of electricity for heating has gone down in recent years due to efforts by, e.g. the Electricity Saving Trust (Elsparefonden), which has led to considerable conversion from electric heating to district heating and heating with natural gas.
In 2003, the domestic sector used 157 PJ of energy for heating (cli-mate-corrected) and 32 PJ of electricity for appliances, etc. Con-sumption for heating has been quite constant for a number of years in spite of an increase in the number of households and in the area heated. The consumption of electricity for appliances, etc. has risen steadily since 1996. The increase in the con-sumption of electricity has, however, not been as great as the increase in the number of appliances, since these have become steadily more en-ergy efficient.
A great number of measures aimed at promoting electricity saving, re-ducing energy consumption for
heating, and fuel conversion (from electric heating and the use of oil to district heating and the use of renewable energy) have been imple-mented for the purpose of reducing energy consumption and environ-mental impacts from households:
• EU CO2 allowances (some of the domestic energy consump-tion – electricity and heating – are subject to EU CO2 allow-ance regulation, cf. section 2.3.3 on ”Energy”)
• Energy labelling of small and large buildings (incl. the public sector and businesses)
• Energy labelling of electrical ap-pliances
The action plan for a renewed ener-gy-saving effort includes a proposal for implementation of a number of measures in the domestic sector, in-cluding:
• Tightening the energy-saving demands in building regulations by 25-30% from 2006.
• Further tightening of energy demands by approx. 25% from 2010.
• Abolishing mandatory linking and banning electric heating in new low-energy buildings.
• Demands in building regulations for existing buildings in con-nection with major renovations, changes in heating systems, re-

�7Denmark’s Climate Policy Objectives and Achievements
placement of boilers, windows and roofing.
• Maintaining and further devel-oping an ambitious energy la-belling scheme for buildings.
• Giving higher priority to inter-national efforts concerning en-ergy labelling and standards.
• Promoting visualisation of en-ergy consumption and develop-ment of sophisticated energy meters.
• Strengthening dissemination of information on energy saving.
These measures will be part of the political discussions on the imple-mentation of the action plan on re-newed energy-saving efforts.
2.3.8 waste and wastewaterThe contribution of the waste sector to greenhouse gas emissions consists primarily of methane from decom-position of organic waste at landfill sites. Smaller contributions of meth-ane and nitrous oxide come from wastewater treatment. Of the waste sector’s total greenhouse gas emis-sions of close to 1.5 million tonnes of CO2 equivalents in 2003 – cor-responding to 2% of Denmark’s total greenhouse gas emissions – landfill sites and wastewater treatment con-tributed 79% and 21% respectively.
Because all incineration of waste in Denmark is associated with energy utilization, the emission of CO2 from the incineration of plastic waste is
included under the energy sector. In accordance with the targets in Energy 21 and Waste 21, waste in-cineration plants are designed so as to optimise energy utilization.
In previous years, efforts within the waste sector have been based on ”Action plan for waste and recycling 1993-97”, which included targets on waste treatment to the year 2000. In addition to an objective of stopping landfilling of combustible waste, the plan contained a number of measures of relevance to waste containing in-dustrial gases (HFCs and SF6).
The waste sector’s contribution to reducing greenhouse gas emissions consists primarily of:
• limiting landfilling of organic waste,
• utilising gas from closed/existing landfills,
• promoting oxidation of gas in landfill coverings,
• increasing recycling of plastics, and
• utilising waste as an energy source.
The emission of methane from Dan-ish landfills is calculated to have been 64,000 tonnes gross in 1990, increas-ing to a maximum of 68,800 tonnes in 1996, corresponding to 1.2 million tonnes of CO2 equivalents.

�8 Denmark’s Climate Policy Objectives and Achievements
As a consequence of stopping land-filling combustible waste on 1 Janu-ary 1997, the emissions of methane from Danish landfills will decrease in the years to come. The emission of methane in 2012 is, thus, calculated to be 55,400 tonnes, corresponding to approx. 20% of the maximum in 1996.
According to the Danish Energy Authority’s figures in ”Biogas: Pro-duction, prognosis and targets”, Den-mark had 25 gas installations at land-fills in the autumn of 2002. These installations produced 10,000 tonnes of methane annually, compared to approx. 1,700 tonnes in 1993.
In addition to the direct influence of waste management on greenhouse gas emissions, emissions are also influ-enced indirectly by recycling of, e.g., paper and cardboard, due to a re-duction in energy consumption and, thus, in CO2 emissions. When organic material in domestic refuse is used in biogas plants and the methane produced is used in biogas motors, it is essential that emission of methane from these motors be reduced, either by use of new technologies or by af-terburning exhaust fumes.
The implementation of national waste plans and fulfilment of targets set has necessitated the implementation of a wide range of measures:
• Obligation to send combustible waste to incineration (in prac-tice a ban on landfilling)
• Waste tax
• Weight- and volume-based taxes
• Subsidy programme – special scheme for businesses
• Increased recycling of plastic packaging
• Implementation of the EU land-fill directive
• Support for gas recovery at land-fill sites
• Subsidy programme for cleaner products
Denmark’s Fourth National Com-munication contains additional infor-mation on these measures.
On the basis of the EU landfill direc-tive, demands on the arrangement and running of landfills have been tightened with Statutory Order No. 650 of 29 June 2001 on landfills. According to the new regulations, waste-gas in landfills for mixed waste must be monitored. Gas from land-fills where not insignificant amounts of biodegradable waste are landfilled must be managed in an environ-mentally-sound way or be used to produce electricity or for heating pur-poses.
According to the new regulations on landfilling, transitional plans must be prepared for all existing landfills, and the validating authority must re-assess the environmental conditions at the site and decide whether the facility is to comply with the new regulations or must close in 2009 at the latest.
�9Denmark’s Climate Policy Objectives and Achievements
The new regulations are expected to lead to:
• a reduction in the number of landfills,
• a not insignificant rise in the tax on landfilled waste,
• a further reduction in amounts landfilled annually, and
• requirements that waste is gen-erally characterized before it is received at the landfill.

40 Denmark’s Climate Policy Objectives and Achievements
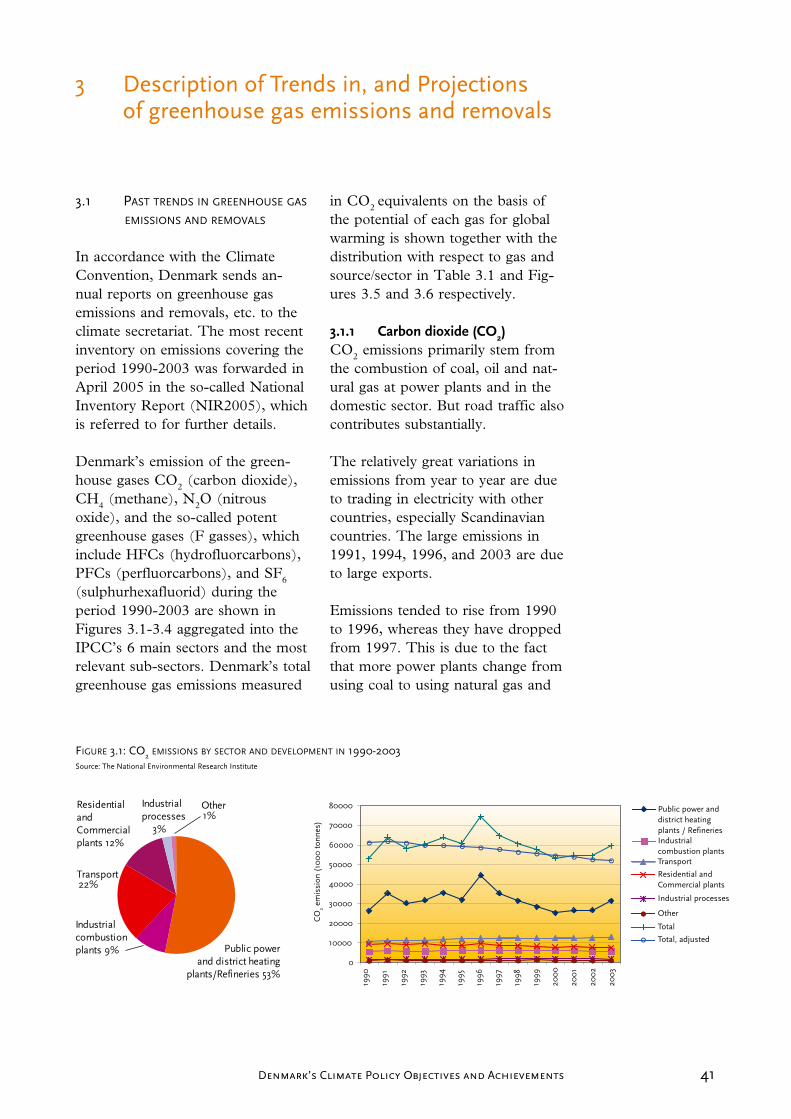
41Denmark’s Climate Policy Objectives and Achievements
3.1 PasT TrenDs in greenhouse gas emissions anD removals
In accordance with the Climate Convention, Denmark sends an-nual reports on greenhouse gas emissions and removals, etc. to the climate secretariat. The most recent inventory on emissions covering the period 1990-2003 was forwarded in April 2005 in the so-called National Inventory Report (NIR2005), which is referred to for further details.
Denmark’s emission of the green-house gases CO2 (carbon dioxide), CH4 (methane), N2O (nitrous oxide), and the so-called potent greenhouse gases (F gasses), which include HFCs (hydrofluorcarbons), PFCs (perfluorcarbons), and SF6 (sulphurhexafluorid) during the period 1990-2003 are shown in Figures 3.1-3.4 aggregated into the IPCC’s 6 main sectors and the most relevant sub-sectors. Denmark’s total greenhouse gas emissions measured
in CO2 equivalents on the basis of the potential of each gas for global warming is shown together with the distribution with respect to gas and source/sector in Table 3.1 and Fig-ures 3.5 and 3.6 respectively.
3.1.1 Carbon dioxide (CO2)CO2 emissions primarily stem from the combustion of coal, oil and nat-ural gas at power plants and in the domestic sector. But road traffic also contributes substantially.
The relatively great variations in emissions from year to year are due to trading in electricity with other countries, especially Scandinavian countries. The large emissions in 1991, 1994, 1996, and 2003 are due to large exports.
Emissions tended to rise from 1990 to 1996, whereas they have dropped from 1997. This is due to the fact that more power plants change from using coal to using natural gas and
� DescriptionofTrendsin,andProjections ofgreenhousegasemissionsandremovals
0
10000
20000
30000
40000
50000
60000
70000
80000
CO
2 em
issi
on (
100
0 to
nnes
)
Public power anddistrict heatingplants / RefineriesIndustrialcombustion plantsTransport
Residential andCommercial plants
Industrial processes
Other
Total
Total, adjusted
1990
1991
1992
1993
1994
1995
1996
1997
1998
1999
200
0
200
1
200
2
200
3
figure 3.1: co2 emissions by secTor anD DeveloPmenT in 1990-2003Source:TheNationalEnvironmentalResearchInstitute
Industrial combustion plants 9%
Industrialprocesses 3%
Transport22%
Public powerand district heating
plants/Refineries 53%
Other1%
Residentialand Commercial plants 12%
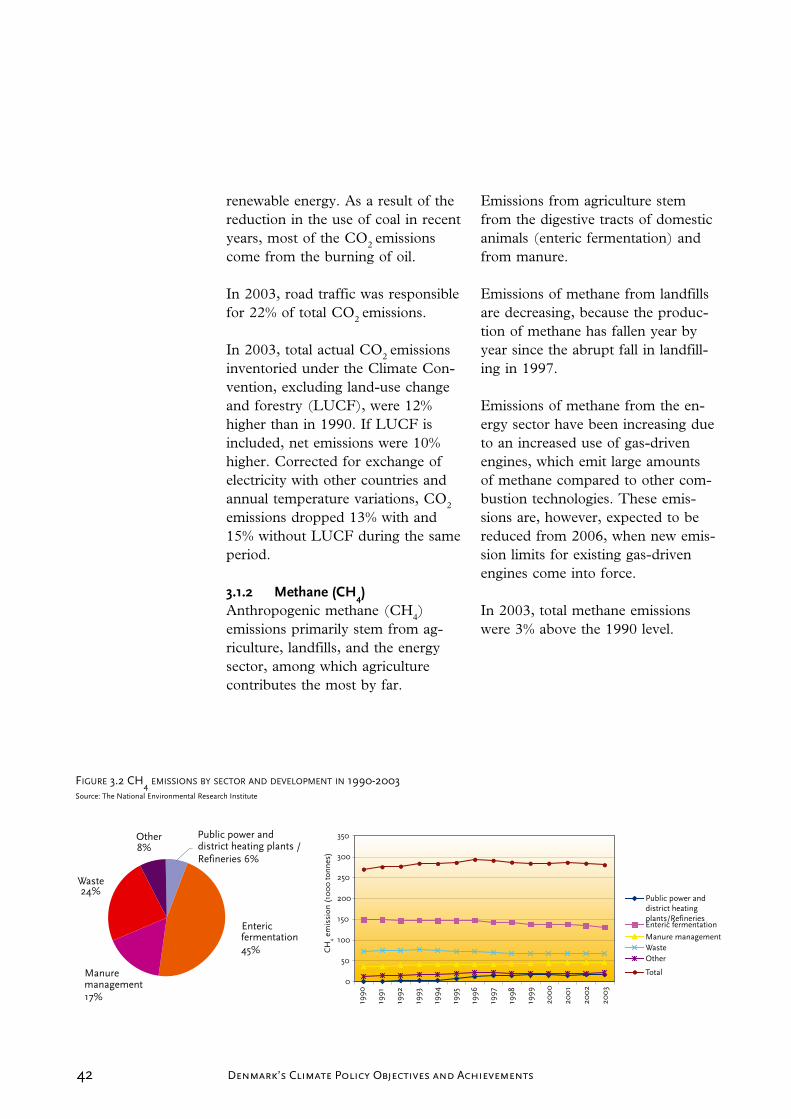
4� Denmark’s Climate Policy Objectives and Achievements
renewable energy. As a result of the reduction in the use of coal in recent years, most of the CO2 emissions come from the burning of oil.
In 2003, road traffic was responsible for 22% of total CO2 emissions.
In 2003, total actual CO2 emissions inventoried under the Climate Con-vention, excluding land-use change and forestry (LUCF), were 12% higher than in 1990. If LUCF is included, net emissions were 10% higher. Corrected for exchange of electricity with other countries and annual temperature variations, CO2
emissions dropped 13% with and 15% without LUCF during the same period.
3.1.2 methane (Ch4)Anthropogenic methane (CH4) emissions primarily stem from ag-riculture, landfills, and the energy sector, among which agriculture contributes the most by far.
Emissions from agriculture stem from the digestive tracts of domestic animals (enteric fermentation) and from manure.
Emissions of methane from landfills are decreasing, because the produc-tion of methane has fallen year by year since the abrupt fall in landfill-ing in 1997.
Emissions of methane from the en-ergy sector have been increasing due to an increased use of gas-driven engines, which emit large amounts of methane compared to other com-bustion technologies. These emis-sions are, however, expected to be reduced from 2006, when new emis-sion limits for existing gas-driven engines come into force.
In 2003, total methane emissions were 3% above the 1990 level.
figure 3.2 ch4 emissions by secTor anD DeveloPmenT in 1990-2003Source:TheNationalEnvironmentalResearchInstitute
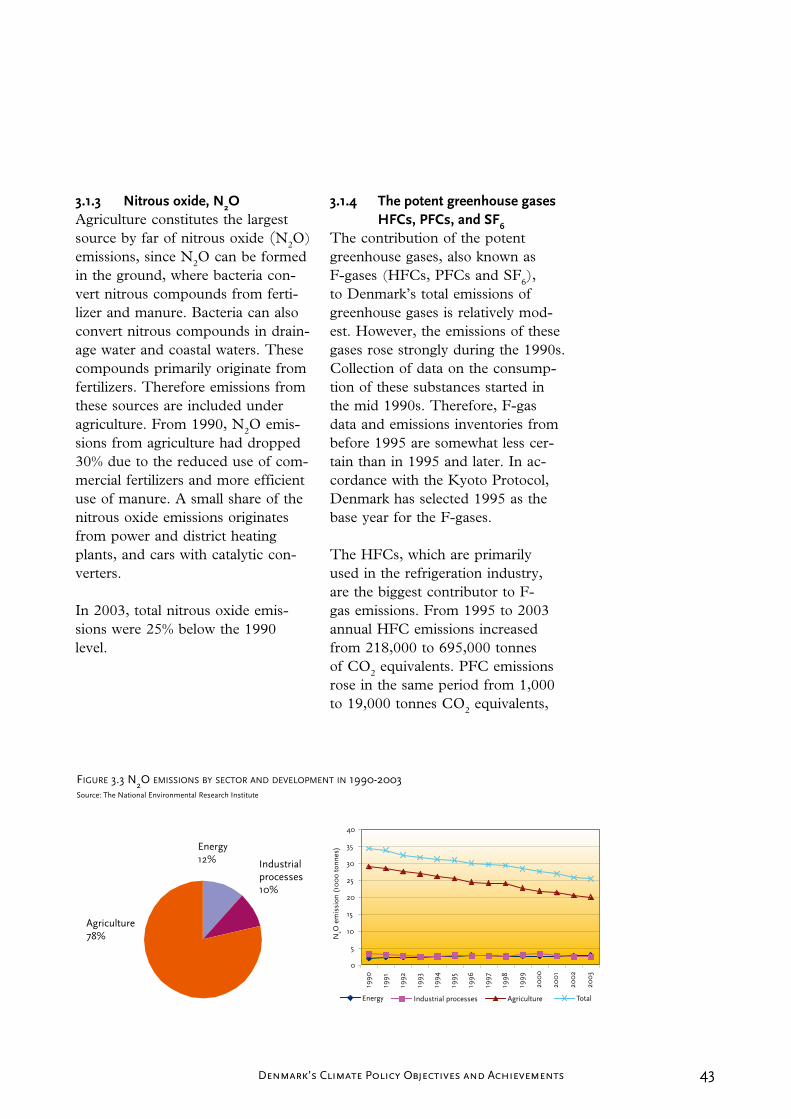
4�Denmark’s Climate Policy Objectives and Achievements
3.1.3 nitrous oxide, n2OAgriculture constitutes the largest source by far of nitrous oxide (N2O) emissions, since N2O can be formed in the ground, where bacteria con-vert nitrous compounds from ferti-lizer and manure. Bacteria can also convert nitrous compounds in drain-age water and coastal waters. These compounds primarily originate from fertilizers. Therefore emissions from these sources are included under agriculture. From 1990, N2O emis-sions from agriculture had dropped 30% due to the reduced use of com-mercial fertilizers and more efficient use of manure. A small share of the nitrous oxide emissions originates from power and district heating plants, and cars with catalytic con-verters.
In 2003, total nitrous oxide emis-sions were 25% below the 1990 level.
3.1.4 the potent greenhouse gases hfCs, PfCs, and sf6
The contribution of the potent greenhouse gases, also known as F-gases (HFCs, PFCs and SF6), to Denmark’s total emissions of greenhouse gases is relatively mod-est. However, the emissions of these gases rose strongly during the 1990s. Collection of data on the consump-tion of these substances started in the mid 1990s. Therefore, F-gas data and emissions inventories from before 1995 are somewhat less cer-tain than in 1995 and later. In ac-cordance with the Kyoto Protocol, Denmark has selected 1995 as the base year for the F-gases.
The HFCs, which are primarily used in the refrigeration industry, are the biggest contributor to F-gas emissions. From 1995 to 2003 annual HFC emissions increased from 218,000 to 695,000 tonnes of CO2 equivalents. PFC emissions rose in the same period from 1,000 to 19,000 tonnes CO2 equivalents,
figure 3.3 n2o emissions by secTor anD DeveloPmenT in 1990-2003Source:TheNationalEnvironmentalResearchInstitute

44 Denmark’s Climate Policy Objectives and Achievements
however with a slight fall in 2003 compared to 2002. SF6 emissions dropped by 71% from 107,000 to 31,000 tonnes of CO2 equivalents in the period.
Total F-gas emissions rose by 129% from 1995 to 2003.
3.1.5 Denmark’s total greenhouse gas emissions and removals
Table 3.1, figures 3.5 and 3.6 show the development in Denmark’s greenhouse gas emissions and re-movals as CO2 equivalents and by gases and sources according to inventory guidelines on summary information under the Climate Con-vention. CO2 is the most impor-tant greenhouse gas followed by N2O and CH4. From 1996, when total emissions (excl. LUCF) cor-responded to 90 million tonnes of CO2 equivalents, there has been a general reduction until 2000, when total emissions corresponded to 68.3
million tonnes of CO2 equivalents, whereas total greenhouse gas emis-sions corresponded to 74 million tonnes of CO2 equivalents (excl. LUCF) in 2003. The increase of 7.3% from 2002 to 2003 is due to large exports of electricity to other Scandinavian countries. Of the total greenhouse gas emissions in 2003, CO2 made up 80%, methane 8%, nitrous oxide 11%, and F-gasses 1%. If net contributions from forests and land and removal of CO2 (i.e. with LUCF) are included, then net total Danish greenhouse gas emissions corresponded to 72.8 million tonnes of CO2 equivalents in 2003.
figure 3.4 DeveloPmenT in hfc, Pfc, anD sf6 emissions in 1990-2003Source:TheNationalEnvironmentalResearchInstitute
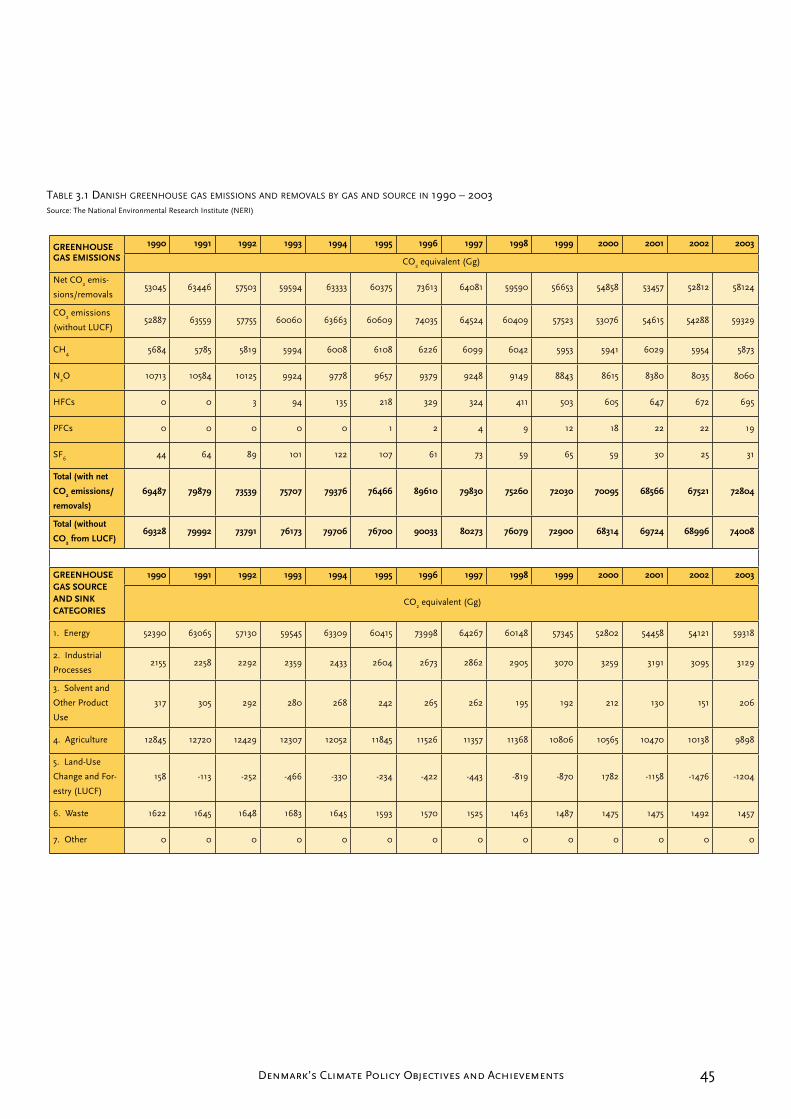
45Denmark’s Climate Policy Objectives and Achievements
gReenhOuse gAs emIssIOns
1990 1991 1992 1993 1994 1995 1996 1997 1998 1999 2000 2001 2002 2003
CO�equivalent(Gg)
NetCO�emis-
sions/removals5�045 6�446 5750� 59594 6���� 60�75 7�61� 64081 59590 5665� 54858 5�457 5�81� 581�4
CO�emissions
(withoutLUCF)5�887 6�559 57755 60060 6�66� 60609 740�5 645�4 60409 575�� 5�076 54615 54�88 59��9
CH4 5684 5785 5819 5994 6008 6108 6��6 6099 604� 595� 5941 60�9 5954 587�
N�O 1071� 10584 101�5 99�4 9778 9657 9�79 9�48 9149 884� 8615 8�80 80�5 8060
HFCs 0 0 � 94 1�5 �18 ��9 ��4 411 50� 605 647 67� 695
PFCs 0 0 0 0 0 1 � 4 9 1� 18 �� �� 19
SF6 44 64 89 101 1�� 107 61 7� 59 65 59 �0 �5 �1
total (with net
CO2 emissions/
removals)
69487 79879 73539 75707 79376 76466 89610 79830 75260 72030 70095 68566 67521 72804
total (without
CO2 from luCf) 69328 79992 73791 76173 79706 76700 90033 80273 76079 72900 68314 69724 68996 74008
gReenhOuse gAs sOuRCe AnD sInK CAtegORIes
1990 1991 1992 1993 1994 1995 1996 1997 1998 1999 2000 2001 2002 2003
CO�equivalent(Gg)
1.Energy 5��90 6�065 571�0 59545 6��09 60415 7�998 64�67 60148 57�45 5�80� 54458 541�1 59�18
�.Industrial
Processes�155 ��58 ��9� ��59 �4�� �604 �67� �86� �905 �070 ��59 �191 �095 �1�9
�.Solventand
OtherProduct
Use
�17 �05 �9� �80 �68 �4� �65 �6� 195 19� �1� 1�0 151 �06
4.Agriculture 1�845 1�7�0 1�4�9 1��07 1�05� 11845 115�6 11�57 11�68 10806 10565 10470 101�8 9898
5.Land-Use
ChangeandFor-
estry(LUCF)
158 -11� -�5� -466 -��0 -��4 -4�� -44� -819 -870 178� -1158 -1476 -1�04
6.Waste 16�� 1645 1648 168� 1645 159� 1570 15�5 146� 1487 1475 1475 149� 1457
7.Other 0 0 0 0 0 0 0 0 0 0 0 0 0 0
Table 3.1 Danish greenhouse gas emissions anD removals by gas anD source in 1990 – 2003Source:TheNationalEnvironmentalResearchInstitute(NERI)

46 Denmark’s Climate Policy Objectives and Achievements
3.2 ProjecTeD TrenDs in green-house gas emissions anD re-movals in The "wiTh measures" baseline scenario
3.2.1 total effect of measuresAccording to the EU’s burden shar-ing agreement, Denmark has com-mitted itself to a reduction of green-house gas emissions by 21% in the period 2008-2012 in relation to the base year 1990/95 under the Kyoto Protocol.
In connection with this agreement, Denmark had reservations with re-spect to effects of large imports of electricity from Norway and Swe-den in the base year 1990, which reduced Denmark’s emissions that year by 6.3 mill. tonnes of CO2 compared to the domestic produc-tion of electricity to cover consump-tion. The Danish position was, and is, that the Danish EU reduction commitment should not be based on low emissions in a single year like in 1990, where low emissions were due to exceptionally large im-ports of electricity. In March 2002, Denmark had to accept a Council decision subjecting Denmark to the legal commitment to reduce emis-sions by 21% compared to the base year, without correcting for imports of electricity.
Denmark was, however, assured in a political declaration from the EU Council of Ministers and the Euro-pean Commission that the assump-tions relating to base year emissions will be taken into account in con-nection with fixing the assigned
figure 3.5 Danish greenhouse gas emissions by TyPe of gas in 1990 - 2003.Source:TheNationalEnvironmentalResearchInstitute
figure 3.6 Danish greenhouse gas emissions by source/secTor in 1990 – 2003Source:TheNationalEnvironmentalResearchInstitute
47Denmark’s Climate Policy Objectives and Achievements
amount of emissions in 2006, meas-ured in tonnes of CO2 equivalents. The government, therefore, aims at a reduction burden for Denmark in 2008-2012 which is equal to 21% of the 1990 level corrected for imports of electricity. The difference cor-responds to 5 mill. tonnes of CO2 equivalents annually in 2008-2012.
The shortfall in respect of fulfill-ing Denmark’s obligations with the existing policies and measures has been calculated both for a situation in which account is taken of the electricity import in 1990 and for a situation in which account is not taken of this.
The projections are based on a number of sector-specific projec-tions of domestic emissions for the period. These emissions depend on the extent of economic activity in all sectors of society, energy prices, technological development, and leg-islation regulating individual activi-ties in relation to the environment, energy efficiency, etc. Among the most important preconditions are the Ministry of Finances’ estimate of economic development and the IEA’s expectations regarding fu-ture energy prices. The projections are also based on measures already adopted described in the Fourth Na-tional Communication (Chapter 4 and Annex B). Corresponding to the most recent inventory of greenhouse gas emissions, Denmark’s reduc-tion commitment of 21% entails that emissions must be reduced from an amount corresponding to 69.6 mil-lion tonnes of CO2 equivalents in
the base year 1990/95 to 55 million tonnes of CO2 equivalents in 2008-2012.
The most recent projections from May 2005 include the period 2004-2030 and are shown in Annex E of the Fourth National Communica-tion. Computations for 2013-2030 are, however, somewhat more uncer-tain than the projections up to 2013, due to several factors, including the fact that uncertainties concerning measures and their expected effects increase with projection length. The projection is a ”with measures” projection, which includes measures that have been or are expected to be implemented. Therefore the pro-jection must not be confused with the most likely development, since effects of new political initiatives, which will most likely be implement-ed as part of the continued follow-up to the Climate Strategy, have not been taken into account.
Since the Climate Strategy of 2003 and the associated baseline projec-tion without additional measures, a baseline projection has been pre-pared and the previous emission inventories have been up-dated as a result of new knowledge, includ-ing new figures for the base year. Therefore the climate deficit has changed in comparison to the in-ventory in the Climate Strategy. The deficit is what Denmark lacks to fulfill the target for reduction of greenhouse gas emissions under the Kyoto Protocol and EU burden sharing.
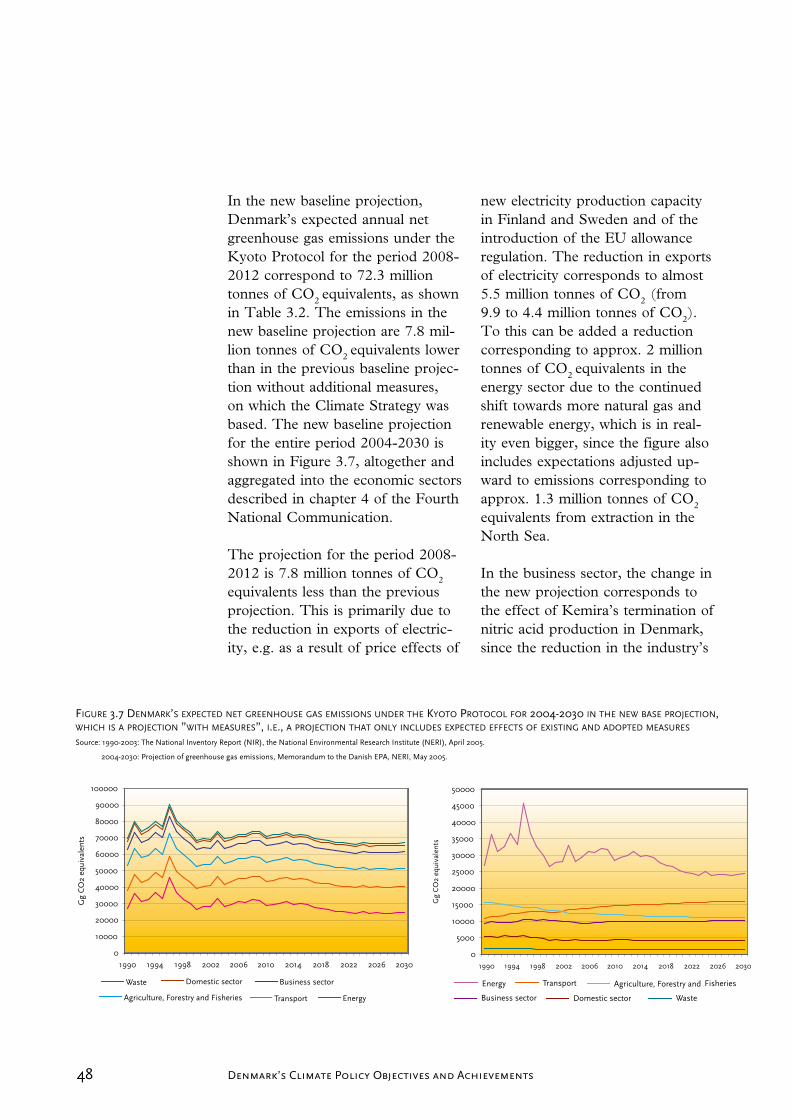
48 Denmark’s Climate Policy Objectives and Achievements
In the new baseline projection, Denmark’s expected annual net greenhouse gas emissions under the Kyoto Protocol for the period 2008-2012 correspond to 72.3 million tonnes of CO2 equivalents, as shown in Table 3.2. The emissions in the new baseline projection are 7.8 mil-lion tonnes of CO2 equivalents lower than in the previous baseline projec-tion without additional measures, on which the Climate Strategy was based. The new baseline projection for the entire period 2004-2030 is shown in Figure 3.7, altogether and aggregated into the economic sectors described in chapter 4 of the Fourth National Communication.
The projection for the period 2008-2012 is 7.8 million tonnes of CO2
equivalents less than the previous projection. This is primarily due to the reduction in exports of electric-ity, e.g. as a result of price effects of
new electricity production capacity in Finland and Sweden and of the introduction of the EU allowance regulation. The reduction in exports of electricity corresponds to almost 5.5 million tonnes of CO2 (from 9.9 to 4.4 million tonnes of CO2). To this can be added a reduction corresponding to approx. 2 million tonnes of CO2 equivalents in the energy sector due to the continued shift towards more natural gas and renewable energy, which is in real-ity even bigger, since the figure also includes expectations adjusted up-ward to emissions corresponding to approx. 1.3 million tonnes of CO2
equivalents from extraction in the North Sea.
In the business sector, the change in the new projection corresponds to the effect of Kemira’s termination of nitric acid production in Denmark, since the reduction in the industry’s
figure 3.7 Denmark’s exPecTeD neT greenhouse gas emissions unDer The kyoTo ProTocol for 2004-2030 in The new base ProjecTion, which is a ProjecTion ”wiTh measures”, i.e., a ProjecTion ThaT only incluDes exPecTeD effecTs of exisTing anD aDoPTeD measures
Source:1990-�00�:TheNationalInventoryReport(NIR),theNationalEnvironmentalResearchInstitute(NERI),April�005.
�004-�0�0:Projectionofgreenhousegasemissions,MemorandumtotheDanishEPA,NERI,May�005.
49Denmark’s Climate Policy Objectives and Achievements
energy consumption, corresponding to approx. 0.5 million tonnes of CO2
equivalents has largely been com-pensated for by a similar increase in process emissions, where the in-crease from cement production con-tributes the most (almost 0.4 million tonnes of CO2 equivalents).
The increase in the domestic sector follows the upward-adjusted projec-tion of energy consumption.
Of the increase of 0.4 million tonnes of CO2 equivalents from waste, al-most 0.3 million tonnes are due to the new inclusion of methane and nitrous oxide from wastewater. Since this source has also been included in the base year 1990 and it is almost unchanged, up-dating emission in-ventories and projections to include this source does not alter the deficit. But the deficit is influenced slightly by the up-dated projection of 0.1 million tonnes of CO2 equivalents of methane from landfills.
To these expected effects of new measures and changes on the total result due to the new projection of emissions should be added expected effects of funds allocated for projects reducing greenhouse gas emissions in other countries – that is the JI and CDM projects, cf. articles 6 and 12 in the Kyoto Protocol. Since the Climate Strategy for the period 2003-2008 was agreed, Denmark has allocated DKK 1,130 million to such projects, corresponding to 4.5 million tonnes of CO2 equivalents annually in 2008-2012 with an aver-age cost of DKK 50 per tone.
As shown in Table 3.2, the Danish deficit is estimated on this back-ground to be approx. 13 million tonnes of CO2 equivalents annually, based on Denmark’s legal commit-ment under the EU Burden Sharing Agreement. This is based on a situ-ation where no corrections has been made for the particularly large im-ports of electricity in 1990.
If this correction is made as assumed by Denmark, the deficit is reduced to approx. 8 million tonnes of CO2
equivalents annually in 2008-2012, as shown in Table 3.2.
Compared to the deficit of 20-25 million tonnes of CO2 equivalents annually in 2008-2012, inventoried on the basis of the projection which was presented together with the Government’s Proposal for a Climate Strategy for Denmark in February 2003 to show the expected devel-opment without implementation of additional measures, there is a re-duction of approx. 12 million tonnes of CO2 equivalents annually in 2008-2012.
Using this method, the deficit ex-presses the need for buying allow-ances abroad or for implementing additional measures outside sectors subject to allowances. As a result of the introduction of the CO2 allow-ance scheme, the deficit is not in principle directly comparable to the deficit in the Government’s Climate Strategy, since the cost effects of the allowances have been taken into ac-count, whereas it is ultimately only the allocation of allowances that
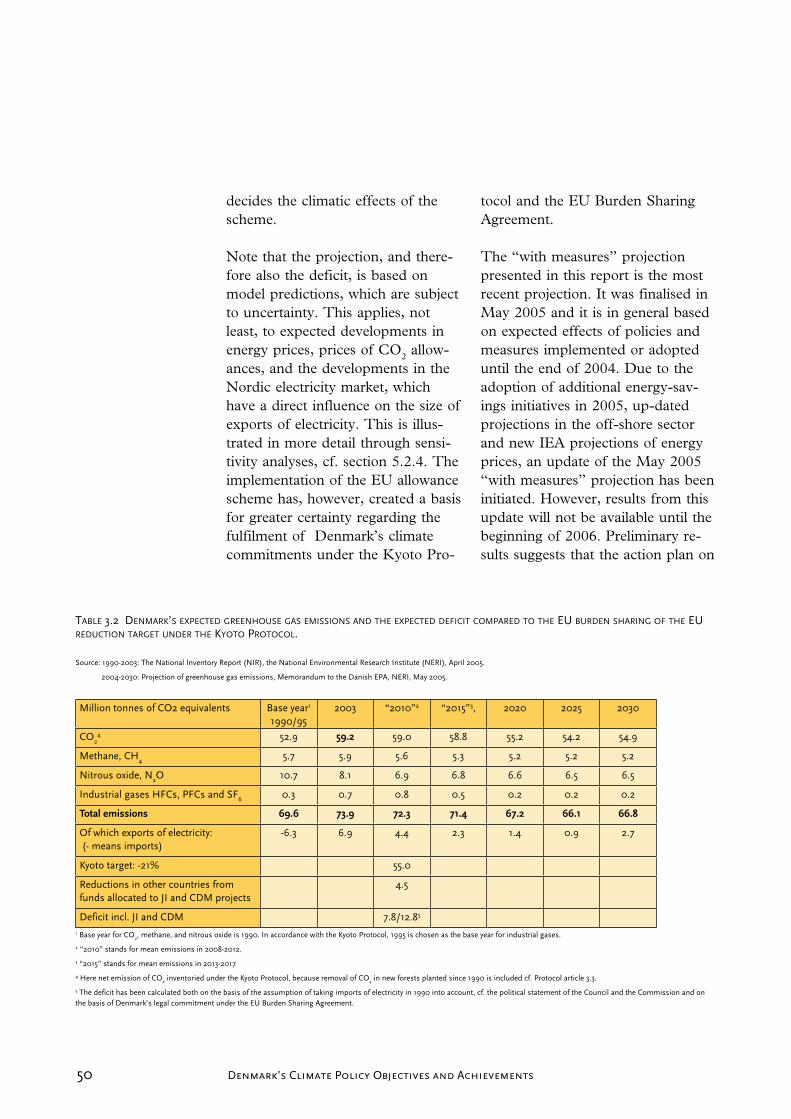
50 Denmark’s Climate Policy Objectives and Achievements
decides the climatic effects of the scheme.
Note that the projection, and there-fore also the deficit, is based on model predictions, which are subject to uncertainty. This applies, not least, to expected developments in energy prices, prices of CO2 allow-ances, and the developments in the Nordic electricity market, which have a direct influence on the size of exports of electricity. This is illus-trated in more detail through sensi-tivity analyses, cf. section 5.2.4. The implementation of the EU allowance scheme has, however, created a basis for greater certainty regarding the fulfilment of Denmark’s climate commitments under the Kyoto Pro-
tocol and the EU Burden Sharing Agreement.
The “with measures” projection presented in this report is the most recent projection. It was finalised in May 2005 and it is in general based on expected effects of policies and measures implemented or adopted until the end of 2004. Due to the adoption of additional energy-sav-ings initiatives in 2005, up-dated projections in the off-shore sector and new IEA projections of energy prices, an update of the May 2005 “with measures” projection has been initiated. However, results from this update will not be available until the beginning of 2006. Preliminary re-sults suggests that the action plan on
Table 3.2 Denmark’s exPecTeD greenhouse gas emissions anD The exPecTeD DeficiT comPareD To The eu burDen sharing of The eu reDucTion TargeT unDer The kyoTo ProTocol.
Source:1990-�00�:TheNationalInventoryReport(NIR),theNationalEnvironmentalResearchInstitute(NERI),April�005.
�004-�0�0:Projectionofgreenhousegasemissions,MemorandumtotheDanishEPA,NERI,May�005.
MilliontonnesofCO�equivalents Baseyear1
1990/95�00� “�010”� “�015”�, �0�0 �0�5 �0�0
CO�4 5�.9 59.2 59.0 58.8 55.� 54.� 54.9
Methane,CH4 5.7 5.9 5.6 5.� 5.� 5.� 5.�
Nitrousoxide,N�O 10.7 8.1 6.9 6.8 6.6 6.5 6.5
IndustrialgasesHFCs,PFCsandSF6 0.� 0.7 0.8 0.5 0.� 0.� 0.�
total emissions 69.6 73.9 72.3 71.4 67.2 66.1 66.8
Ofwhichexportsofelectricity:(-meansimports)
-6.� 6.9 4.4 �.� 1.4 0.9 �.7
Kyototarget:-�1% 55.0
ReductionsinothercountriesfromfundsallocatedtoJIandCDMprojects
4.5
Deficitincl.JIandCDM 7.8/1�.85
1BaseyearforCO�,methane,andnitrousoxideis1990.InaccordancewiththeKyotoProtocol,1995ischosenasthebaseyearforindustrialgases.
�“�010”standsformeanemissionsin�008-�01�.
�“�015”standsformeanemissionsin�01�-�017
4HerenetemissionofCO�inventoriedundertheKyotoProtocol,becauseremovalofCO�innewforestsplantedsince1990isincludedcf.Protocolarticle�.�.
5Thedeficithasbeencalculatedbothonthebasisoftheassumptionoftakingimportsofelectricityin1990intoaccount,cf.thepoliticalstatementoftheCouncilandtheCommissionandonthebasisofDenmark’slegalcommitmentundertheEUBurdenSharingAgreement.
51Denmark’s Climate Policy Objectives and Achievements
additional energy-savings initiatives could lead to a 2 mill. tonnes further reduction in annual CO2 emissions 2008-2012.
3.2.2 Carbon dioxide, CO2
Table 3.3 shows the expected de-velopment in CO2 emissions. The largest source of CO2 emissions in Denmark is the burning of fossil fu-els, including for the production of electricity, heating and transport.
Since 1990, the transport sector has shown the greatest increase in CO2 emissions, and this increase is expected to continue throughout the projection period. CO2 emis-sions from the transport sector were 10,441 Gg of CO2 in 1990 and had risen to 12,785 Gg of CO2 in 2003, whereas the projection for 2008-2012 is 13,890 Gg of CO2 annually. Emissions from energy production, including conversion and distribu-tion have varied in 1990-2003 due to great variations in exports/imports of electricity. Emissions from the production of energy were 26,173 Gg of CO2 in 1990 and 31,402 Gg of CO2 in 2003, whereas the projec-tion for 2008-2012 is 29,021 Gg of CO2 annually, of which 4,400 Gg of CO2 are due to electricity exports.
Total CO2 emissions, exclud-ing land-use changes and forestry (LUCF19) were 52,887 Gg of CO2 in 1990 and 59,329 Gg of CO2 in 2003, whereas the projection for 2008-2012 is 59,233 Gg of CO2 an-nually.
3.2.3 methane, Ch4
Most of the methane emissions come from the digestive tracts of do-mestic animals. The projections are shown in Table 3.4. The reduction in emissions from agriculture from 1990 to 2001 and the continued reductions in the projection period are primarily due to reductions in cattle stocks. The next largest source of methane is landfills, from which emissions were also reduced from 1990 to 2001. Methane emissions from the energy sector have, howev-er, increased considerably during the same period, due to an increase in the use of gas-driven motors. This has altogether led to an increase in total methane emissions from 5,684 Gg of CO2 equivalents in 1990 to 5,873 Gg of CO2 equivalents in 2003, whereas the projection for 2008-2012 is lower, i.e. 5,573 Gg of CO2 equivalents annually.
3.2.4 nitrous oxide, n2OAgriculture constitutes the most important source of nitrous oxide emissions, since soil bacteria can create this gas on the basis of ferti-lizer and manure spread on fields. The projections are shown in Table 3.5. The decrease in total emissions from 10,713 Gg of CO2 equiva-lents in 1990 to 8,060 Gg of CO2
equivalents in 2003 is primarily due to a combination of the Action Plan for the Aquatic Environment I and II and the Action Plan for Sustain-able Agriculture. The projection for 2008-12 is 6,942 Gg of CO2 equiva-lents annually. This substantial re-duction is not least due to the fact that Denmark ceased to produce

5� Denmark’s Climate Policy Objectives and Achievements
Tab
le 3
.3 P
ro
jec
Tio
ns
of
Den
ma
rk’s
co
2 em
issi
on
s in
20
04
– 20
30 a
nD
em
issi
on
s o
bse
rv
eD in
199
0, 1
995,
20
00
, an
D 2
00
3.So
urce
:19
90-�
00
�:T
heN
atio
nalI
nven
tory
Rep
ort(
NIR
),N
ERI,
Apr
il�0
05.
�0
04-
�0�0
:Pro
ject
ions
ofg
reen
hous
ega
sem
issi
ons,
Mem
oran
dum
toth
eD
anis
hEP
A,N
ERI,
May
�0
05

5�Denmark’s Climate Policy Objectives and Achievements
equi
vale
nts
equi
vale
nts
Tab
le 3
.4 P
ro
jec
Tio
ns
of
Den
ma
rk’s
meT
ha
ne
emis
sio
ns
in 2
00
4 –
30 a
nD
em
issi
on
s o
bse
rv
eD in
199
0, 1
995,
20
00
, an
D 2
00
3.So
urce
:19
90-�
00
�:T
heN
atio
nalI
nven
tory
Rep
ort(
NIR
),N
ERI)
,Apr
il�0
05.
�00
4-�0
�0:P
roje
ctio
nof
gre
enho
use
gas
emis
sion
s,M
emor
andu
mto
the
Dan
ish
EPA
,NER
I,M
ay�
00
5
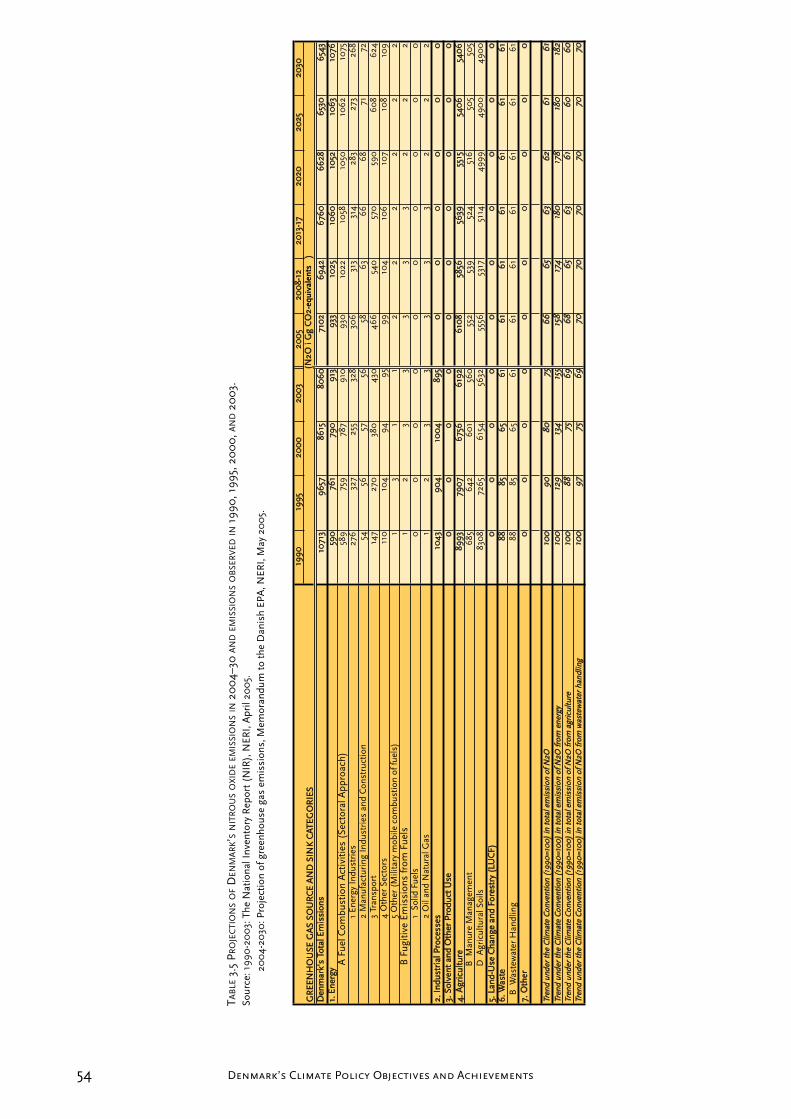
54 Denmark’s Climate Policy Objectives and Achievements
Tab
le 3
.5 P
ro
jec
Tio
ns
of
Den
ma
rk’s
niT
ro
us
ox
iDe
emis
sio
ns
in 2
00
4–30
an
D e
mis
sio
ns
ob
ser
veD
in 1
990
, 199
5, 2
00
0, a
nD
20
03.
So
urce
:199
0-�
00
�:T
heN
atio
nalI
nven
tory
Rep
ort(
NIR
),N
ERI,
Apr
il�0
05.
�0
04-
�0�0
:Pro
ject
ion
ofg
reen
hous
ega
sem
issi
ons,
Mem
oran
dum
toth
eD
anis
hEP
A,N
ERI,
May
�0
05.
equi
vale
nts
equi
vale
nts
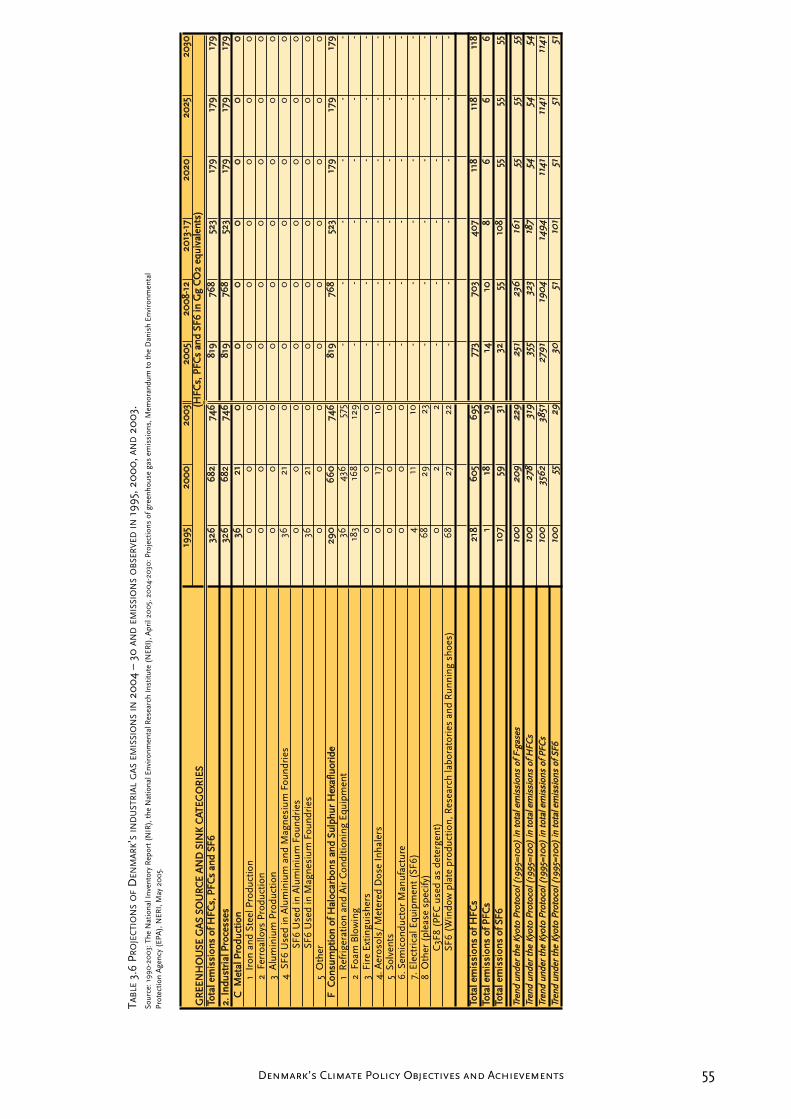
55Denmark’s Climate Policy Objectives and Achievements
Tab
le 3
.6 P
ro
jec
Tio
ns
of
Den
ma
rk’s
inD
usT
ria
l g
as
emis
sio
ns
in 2
00
4 –
30 a
nD
em
issi
on
s o
bse
rv
eD in
199
5, 2
00
0, a
nD
20
03.
Sour
ce:1
990
-�0
0�:
The
Nat
iona
lInv
ento
ryR
epor
t(N
IR),
the
Nat
iona
lEnv
iron
men
talR
esea
rch
Inst
itute
(N
ERI)
,Apr
il�0
05.
�0
04-
�0�0
:Pro
ject
ions
ofg
reen
hous
ega
sem
issi
ons,
Mem
oran
dum
toth
eD
anis
hEn
viro
nmen
tal
Prot
ectio
nA
genc
y(E
PA),
NER
I,M
ay�
00
5.

56 Denmark’s Climate Policy Objectives and Achievements
Tab
le 3
.7 P
ro
jec
Tio
ns
of
Den
ma
rk’s
To
Tal
gr
een
ho
use
ga
s em
issi
on
s a
nD
rem
ov
als
in 2
00
4–20
30 a
nD
em
issi
on
s o
bse
rv
eD in
199
0, 1
995,
20
00
, an
D 2
00
3.So
urce
:19
90-�
00
�:N
atio
nalI
nven
tory
Rep
ort(
NIR
),N
ERI,
Apr
il�0
05.
�0
04-
�0�0
:Pro
ject
ion
ofg
reen
hous
ega
sem
issi
ons,
Mem
oran
dum
toth
eD
anis
hEP
A,N
ERI,
May
�0
05.
equi
vale
nts
equi
vale
nts
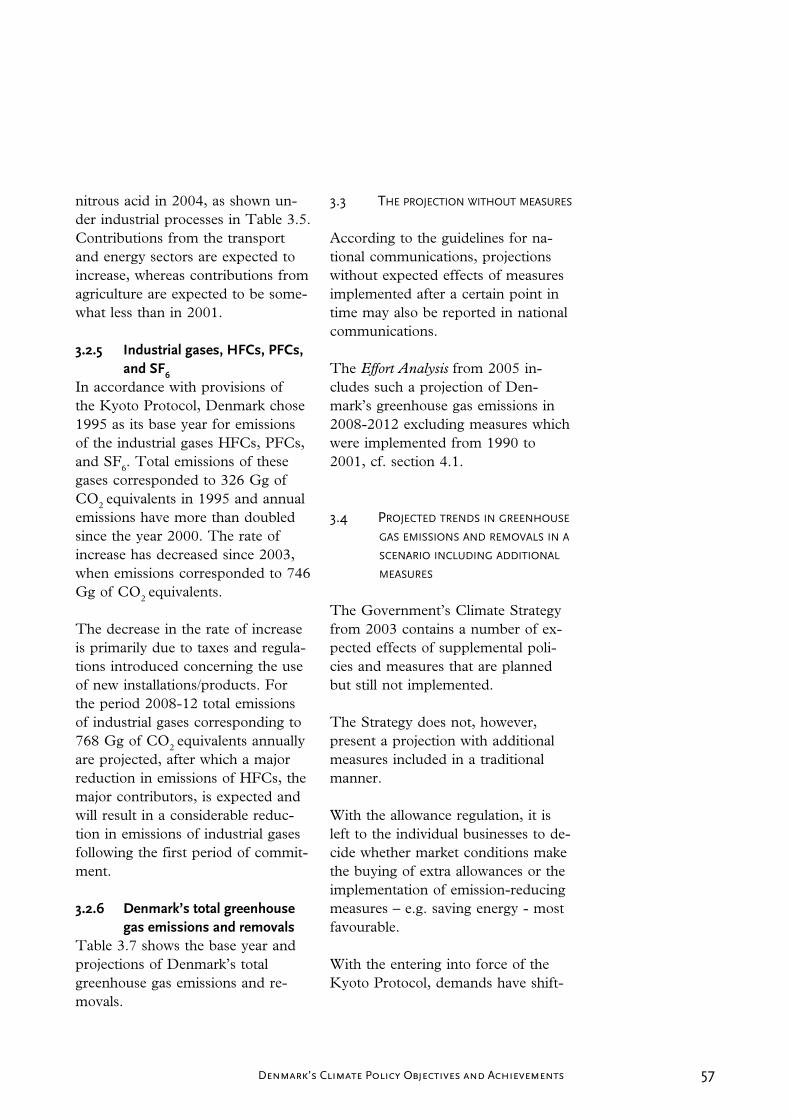
57Denmark’s Climate Policy Objectives and Achievements
nitrous acid in 2004, as shown un-der industrial processes in Table 3.5. Contributions from the transport and energy sectors are expected to increase, whereas contributions from agriculture are expected to be some-what less than in 2001.
3.2.5 Industrial gases, hfCs, PfCs, and sf6
In accordance with provisions of the Kyoto Protocol, Denmark chose 1995 as its base year for emissions of the industrial gases HFCs, PFCs, and SF6. Total emissions of these gases corresponded to 326 Gg of CO2 equivalents in 1995 and annual emissions have more than doubled since the year 2000. The rate of increase has decreased since 2003, when emissions corresponded to 746 Gg of CO2 equivalents.
The decrease in the rate of increase is primarily due to taxes and regula-tions introduced concerning the use of new installations/products. For the period 2008-12 total emissions of industrial gases corresponding to 768 Gg of CO2 equivalents annually are projected, after which a major reduction in emissions of HFCs, the major contributors, is expected and will result in a considerable reduc-tion in emissions of industrial gases following the first period of commit-ment.
3.2.6 Denmark’s total greenhouse gas emissions and removals
Table 3.7 shows the base year and projections of Denmark’s total greenhouse gas emissions and re-movals.
3.3 The ProjecTion wiThouT measures
According to the guidelines for na-tional communications, projections without expected effects of measures implemented after a certain point in time may also be reported in national communications.
The Effort Analysis from 2005 in-cludes such a projection of Den-mark’s greenhouse gas emissions in 2008-2012 excluding measures which were implemented from 1990 to 2001, cf. section 4.1.
3.4 ProjecTeD TrenDs in greenhouse gas emissions anD removals in a scenario incluDing aDDiTional measures
The Government’s Climate Strategy from 2003 contains a number of ex-pected effects of supplemental poli-cies and measures that are planned but still not implemented.
The Strategy does not, however, present a projection with additional measures included in a traditional manner.
With the allowance regulation, it is left to the individual businesses to de-cide whether market conditions make the buying of extra allowances or the implementation of emission-reducing measures – e.g. saving energy - most favourable.
With the entering into force of the Kyoto Protocol, demands have shift-

58 Denmark’s Climate Policy Objectives and Achievements
ed from traditional projections of greenhouse gas emissions to more appropriate target-fulfilment pro-jections, which is expressed by e.g. the inclusion of expected effects of funds already allocated to JI and CDM projects as in Table 3.2.
If additional, specific cost-effective measures that should be included in future planning of reduction efforts are found in connection with the Policies and measures Project (section 2.2.4.2), then up-dated projections can be made where expected effects of these additional measures are in-cluded.

59Denmark’s Climate Policy Objectives and Achievements
4.1 evaluaTion of ProjecTeD Progress in emissions reDuc-Tion by measure
The result of the latest baseline pro-jection of Denmark’s greenhouse gas emissions and removals – “with (existing) measures” projection – is shown in section 3.2 of this report. The conditions and assumptions underlying this baseline projection include estimates of the effects of existing measures on greenhouse gas emissions. The result of the baseline projection is thus the result of com-bined quantitative estimates of the effects of existing policies and mea-sures on greenhouse gas emissions.
Prior to this analysis, quantitative estimates of the effects of individual measures on greenhouse gas emis-sions were often limited to ex-ante estimates prior to adoption of the measures. In a few cases, the imple-mentation of a measure was followed by an ex-post evaluation. A major reason that only a few ex-post evalu-ations of individual measures have been carried out is that it is often difficult to clearly attribute an ob-served greenhouse gas reduction to a particular measure, since many areas (sectors/sources) are affected by sev-eral measures at the same time.
Despite these difficulties, Denmark has in 2005 completed an analysis of the impact of selected initiated mea-sures on greenhouse gas emissions as a result of Denmark’s efforts be-tween 1990-2001. The analysis was published in the report “Danmarks udledning af CO2 – indsatsen i perioden
1990-2001 og omkostningerne herved” (Denmark’s CO2 emissions – the effort in the period 1990-2001 and the associated costs) from the Dan-ish EPA, no. 2, April 200520. In this analysis (hereafter referred to as the Effort Analysis), the effects of a num-ber of measures have been estimated – both for 2001 and the period 2008-2012. The latter case, is a so-called “without measures” projection without the effect of measures since 1990 – i.e. estimates of what the vol-ume of average annual greenhouse gas emissions would have been in 2008-2012, if the measures initiated prior to 2001 had not been initiated.
Please note that the statistical base for the Effort Analysis has included the emissions inventory submitted to the EU and the UN in 2003 (cover-ing 1990-2001) and the “with mea-sures” baseline projection (2008-2012), i.e. without additional mea-sures, published in February 2003 together with the Government’s Climate Strategy.
The Effort Analysis also includes es-timates of the costs of some of the individual measures. The analysis is described in more detail in the next section.
4.1.1 the effort AnalysisSince 1990, a broad range of na-tional policies and measures have been implemented in Denmark that have impacted on emissions of greenhouse gases. Some initiatives have been implemented with CO2 reduction as the primary aim, while
4 Analysisofthecontributionofdomestic measuresanduseoftheKyotomechanisms
60 Denmark’s Climate Policy Objectives and Achievements
other initiatives have been motivated by other aims.
The Effort Analysis reports on Den-mark’s effort related to the reduction of greenhouse gas emissions under-taken on national level in the period 1990-2001, and the costs of this ef-fort.
Under the Kyoto Protocol and the EU’s subsequent Burden Sharing Agreement, Denmark has under-taken to reduce greenhouse gas emissions by 21% in 2008-2012, compared to 1990 levels21.
One of the additional requirements of the Kyoto Protocol is that the use of flexible mechanisms has to be supplemental to domestic action. The calculation of the total Danish effort is relevant in this connection.
It is therefore relevant to consider the effects of Denmark’s efforts both in relation to the Kyoto accounting, and in relation to the total effect - regardless of whether the emissions reductions have been in Denmark or abroad.
In relation to the Kyoto accounting, which is based on the CO2 impact associated with the specific emis-sions in Denmark, it is expected that part of the effect of the energy sector initiatives will be offset by increased electricity exports. This means that the CO2 emissions linked to the exported electricity com-ponent have a negative impact on Denmark’s Kyoto accounting, rather
than on that of the electricity im-porting country.
Choice of measuresThe Effort Analysis report aimed to include the most important environ-ment and energy policy measures implemented in the period 1990-2001 that have had a significant ef-fect on greenhouse gas emissions.
Please note that many of the mea-sures have not been planned and adopted with the aim of contribut-ing to the fulfilment of Denmark’s Kyoto obligation, but derive from the political objective from 1990 (in the “Energy 2000” action plan) of reducing CO2 emissions from Den-mark’s energy consumption by 20% between 1988 and 2005. Thus the Effort Analysis does not evaluate the implemented initiatives against their original objective, but rather in rela-tion to reducing greenhouse gases, and how much the implemented ini-tiatives will contribute to the binding Kyoto objectives that exist today.
The chronological definition of the initiatives is not always straightfor-ward. Some initiatives were intro-duced prior to 1990, but the imple-mentation (and associated reduction in greenhouse gas emissions) has taken place after 1990. This is the case, for example, for the conversion to natural gas and for Action Plan for the Aquatic Environment I. The calculations in the Effort Analysis only include the CO2 reductions that have taken place after 1990.
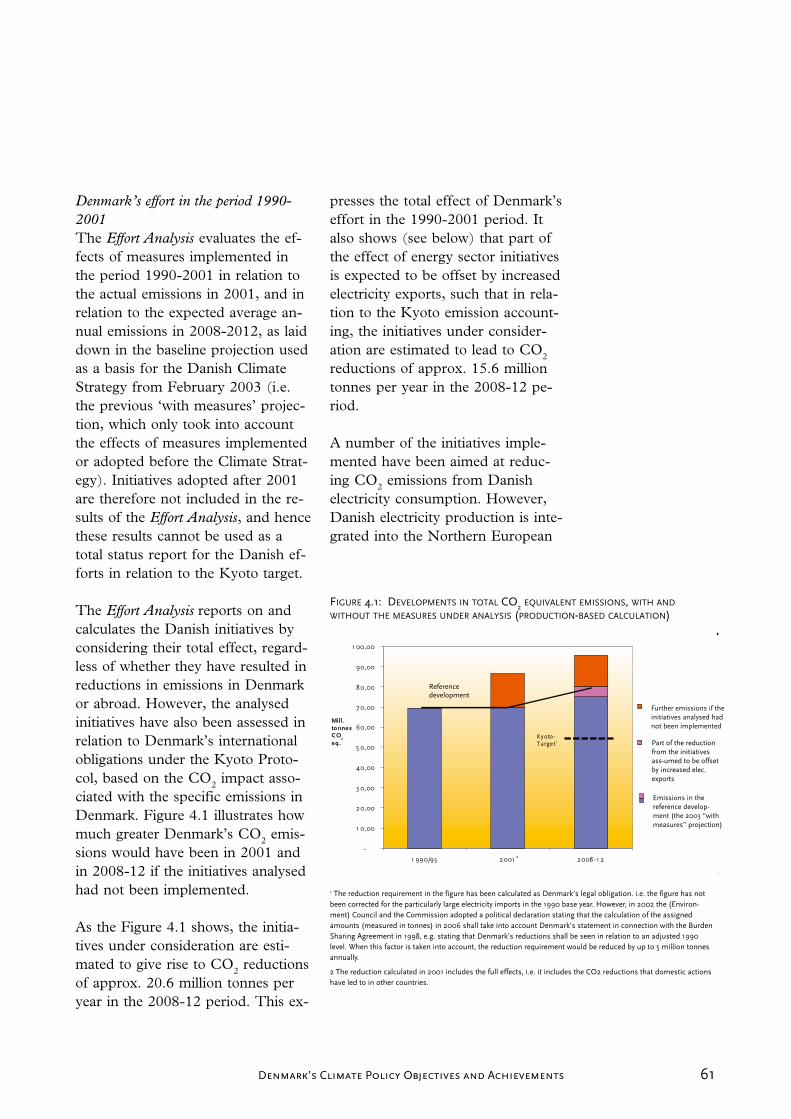
61Denmark’s Climate Policy Objectives and Achievements
Denmark’s effort in the period 1990-2001The Effort Analysis evaluates the ef-fects of measures implemented in the period 1990-2001 in relation to the actual emissions in 2001, and in relation to the expected average an-nual emissions in 2008-2012, as laid down in the baseline projection used as a basis for the Danish Climate Strategy from February 2003 (i.e. the previous ‘with measures’ projec-tion, which only took into account the effects of measures implemented or adopted before the Climate Strat-egy). Initiatives adopted after 2001 are therefore not included in the re-sults of the Effort Analysis, and hence these results cannot be used as a total status report for the Danish ef-forts in relation to the Kyoto target.
The Effort Analysis reports on and calculates the Danish initiatives by considering their total effect, regard-less of whether they have resulted in reductions in emissions in Denmark or abroad. However, the analysed initiatives have also been assessed in relation to Denmark’s international obligations under the Kyoto Proto-col, based on the CO2 impact asso-ciated with the specific emissions in Denmark. Figure 4.1 illustrates how much greater Denmark’s CO2 emis-sions would have been in 2001 and in 2008-12 if the initiatives analysed had not been implemented.
As the Figure 4.1 shows, the initia-tives under consideration are esti-mated to give rise to CO2 reductions of approx. 20.6 million tonnes per year in the 2008-12 period. This ex-
presses the total effect of Denmark’s effort in the 1990-2001 period. It also shows (see below) that part of the effect of energy sector initiatives is expected to be offset by increased electricity exports, such that in rela-tion to the Kyoto emission account-ing, the initiatives under consider-ation are estimated to lead to CO2 reductions of approx. 15.6 million tonnes per year in the 2008-12 pe-riod.
A number of the initiatives imple-mented have been aimed at reduc-ing CO2 emissions from Danish electricity consumption. However, Danish electricity production is inte-grated into the Northern European
figure 4.1: DeveloPmenTs in ToTal co2 equivalenT emissions, wiTh anD wiThouT The measures unDer analysis (ProDucTion-baseD calculaTion)
1ThereductionrequirementinthefigurehasbeencalculatedasDenmark’slegalobligation.i.e.thefigurehasnotbeencorrectedfortheparticularlylargeelectricityimportsinthe1990baseyear.However,in�00�the(Environ-ment)CouncilandtheCommissionadoptedapoliticaldeclarationstatingthatthecalculationoftheassignedamounts(measuredintonnes)in�006shalltakeintoaccountDenmark’sstatementinconnectionwiththeBurdenSharingAgreementin1998,e.g.statingthatDenmark’sreductionsshallbeseeninrelationtoanadjusted1990level.Whenthisfactoristakenintoaccount,thereductionrequirementwouldbereducedbyupto5milliontonnesannually.
�Thereductioncalculatedin�001includesthefulleffects,i.e.itincludestheCO�reductionsthatdomesticactionshaveledtoinothercountries.
-
1 0,00
20,00
3 0,00
40,00
5 0,00
60,00
7 0,00
80,00
90,00
1 00,00
1 990/95 2001 2 2008-1 2
Mill.tonnesC O
2
eq .Kyoto-Target1
Emissions in the reference develop-ment (the 2003 “with measures” projection)
Referencedevelopment
Further emissions if the initiatives analysed had not been implemented
Part of the reductionfrom the initiatives ass-umed to be offset by increased elec. exports
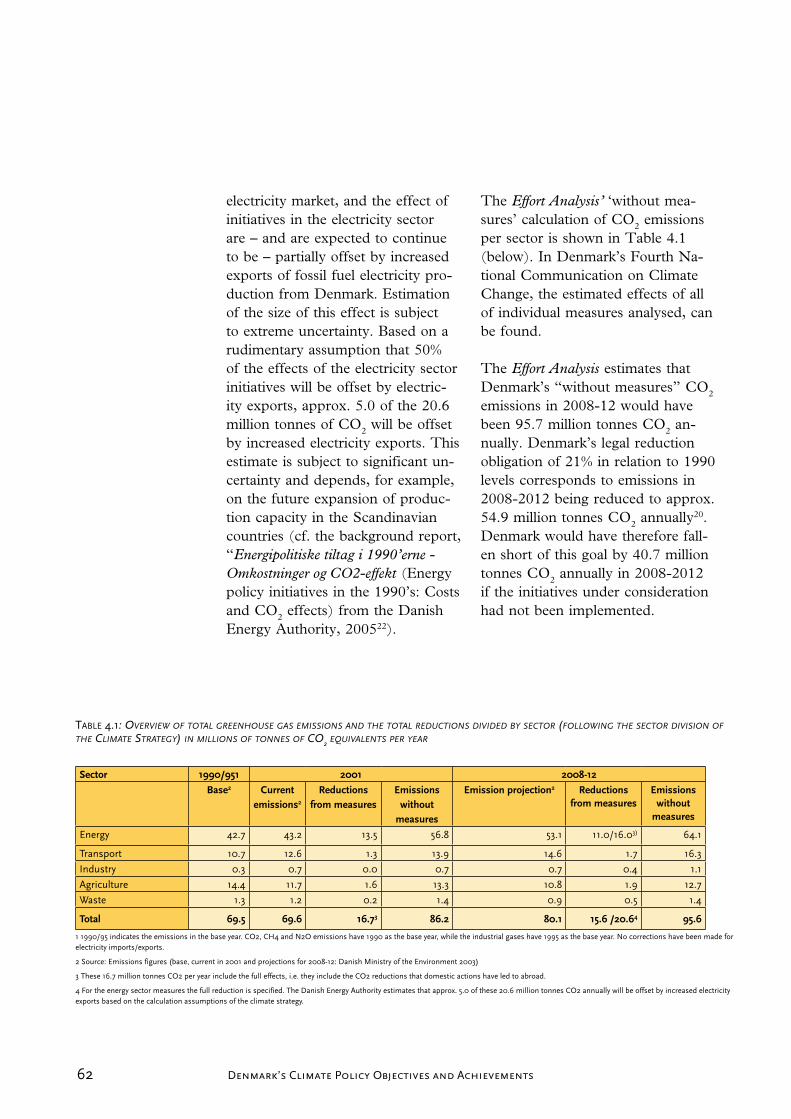
6� Denmark’s Climate Policy Objectives and Achievements
electricity market, and the effect of initiatives in the electricity sector are – and are expected to continue to be – partially offset by increased exports of fossil fuel electricity pro-duction from Denmark. Estimation of the size of this effect is subject to extreme uncertainty. Based on a rudimentary assumption that 50% of the effects of the electricity sector initiatives will be offset by electric-ity exports, approx. 5.0 of the 20.6 million tonnes of CO2 will be offset by increased electricity exports. This estimate is subject to significant un-certainty and depends, for example, on the future expansion of produc-tion capacity in the Scandinavian countries (cf. the background report, “Energipolitiske tiltag i 1990’erne - Omkostninger og CO2-effekt (Energy policy initiatives in the 1990’s: Costs and CO2 effects) from the Danish Energy Authority, 200522).
The Effort Analysis’ ‘without mea-sures’ calculation of CO2 emissions per sector is shown in Table 4.1 (below). In Denmark’s Fourth Na-tional Communication on Climate Change, the estimated effects of all of individual measures analysed, can be found.
The Effort Analysis estimates that Denmark’s “without measures” CO2
emissions in 2008-12 would have been 95.7 million tonnes CO2 an-nually. Denmark’s legal reduction obligation of 21% in relation to 1990 levels corresponds to emissions in 2008-2012 being reduced to approx. 54.9 million tonnes CO2 annually20. Denmark would have therefore fall-en short of this goal by 40.7 million tonnes CO2 annually in 2008-2012 if the initiatives under consideration had not been implemented.
Table 4.1: Overview Of tOtal greenhOuse gas emissiOns and the tOtal reductiOns divided by sectOr (fOllOwing the sectOr divisiOn Of the climate strategy) in milliOns Of tOnnes Of cO2 equivalents per year
sector 1990/951 2001 2008-12
base2 Current emissions2
Reductions from measures
emissions without
measures
emission projection2 Reductionsfrom measures
emissions without
measures
Energy 4�.7 4�.� 1�.5 56.8 5�.1 11.0/16.0�) 64.1
Transport 10.7 1�.6 1.� 1�.9 14.6 1.7 16.�
Industry 0.� 0.7 0.0 0.7 0.7 0.4 1.1
Agriculture 14.4 11.7 1.6 1�.� 10.8 1.9 1�.7
Waste 1.� 1.� 0.� 1.4 0.9 0.5 1.4
total 69.5 69.6 16.73 86.2 80.1 15.6 /20.64 95.6
11990/95indicatestheemissionsinthebaseyear.CO�,CH4andN�Oemissionshave1990asthebaseyear,whiletheindustrialgaseshave1995asthebaseyear.Nocorrectionshavebeenmadeforelectricityimports/exports.
�Source:Emissionsfigures(base,currentin�001andprojectionsfor�008-1�:DanishMinistryoftheEnvironment�00�)
�These16.7milliontonnesCO�peryearincludethefulleffects,i.e.theyincludetheCO�reductionsthatdomesticactionshaveledtoabroad.
4Fortheenergysectormeasuresthefullreductionisspecified.TheDanishEnergyAuthorityestimatesthatapprox.5.0ofthese�0.6milliontonnesCO�annuallywillbeoffsetbyincreasedelectricityexportsbasedonthecalculationassumptionsoftheclimatestrategy.
6�Denmark’s Climate Policy Objectives and Achievements
In summary, the effect in 2008-2012 of the initiatives analysed would be 15.6 million tonnes annually, after taking into account that 50% of the electricity sector initiatives are expected to be offset by electricity exports.
As mentioned above, the total re-duction effects, in Denmark and abroad, from the implemented do-mestic initiatives can be estimated at 20.6 million tons annually. One can therefore conclude that Denmark has already made significant prog-ress domestically.
Extensive Danish electricity imports from Norway and Sweden in the 1990 base year led to unusually low Danish emissions. If the effects of these imports are compensated for, it would allow Denmark to reduce Danish emissions by approx. 5 mil-lion tonnes less than specified above.
Please note that in 2002, the (Envi-ronment) Council and the Commis-sion adopted a political declaration stating that the calculation of the permitted emission volumes (mea-sured in tonnes) in 2006 shall take into account Denmark’s statement in connection with the Burden Sharing Agreement in 1998, i.a. stating that Denmark’s reductions shall be seen in relation to an adjusted 1990 level.
Costs of measuresThe costs of the CO2 reduction have also been estimated in the Effort Analysis, but only for selected mea-sures. The choice of these measures has largely been governed by which
measures CO2 costs had previously been calculated for.
The estimate is based on a cost-ben-efit analysis of the total costs and benefits for each measure, excluding the value of the reduction in CO2 emissions.
An expression of the total socio-eco-nomic costs per tonne of reduced CO2 emissions (also called the initiative’s CO2 shadow price) can be found by comparing the total net costs of the initiative against the esti-mated resultant CO2 reduction. The total CO2 reduction has been used, i.e. regardless of whether this CO2 reduction took place in Denmark or abroad (consumption-based calcula-tion).
This corresponds to the method used in previous analyses carried out by the Danish Ministry of Finance and others in 2001, by the Econom-ic Council in 2002, and in cost es-timations used in the Government’s Climate Strategy from 2003.
Please note that the introduction of the EU’s CO2 quota scheme from 2005 changes the framework condi-tions for large parts of the energy sector and energy-intensive industry. Therefore, the calculation method cannot be used to assess future mea-sures within these areas where quo-tas have been imposed. The intro-duction of the quota scheme means that CO2 emissions from the sectors subject to quotas, including electric-ity production, will be unequivo-cally determined by the total quota
64 Denmark’s Climate Policy Objectives and Achievements
measured in accordance with Kyoto accounting. The calculations of the shadow values for the areas subject to quotas, up until the 2008-12 peri-od where the new Kyoto regime will have entered into force, thus serve purely illustrative purposes.
The introduction of the open in-ternational electricity market since the late 1990’s means it is no longer certain that for example such as the expansion of renewable energy will reduce CO2 emissions from Danish electricity producers correspond-ingly, as it may be an advantage for producers to export electricity rather than reduce production. Where this is the case, CO2 emissions will be reduced in other countries instead. This is a major issue in relation to calculating how great an effect the measures will have in relation to the baseline projection.
Please note that the CO2 allowance system will increase the European electricity price and thus increase the profitability of electricity savings compared to the situation today.
Note that no attempt has been made in the Effort Analysis to incorporate any positive effects on security of supply, technology development and commercial development, nor has it been possible to include the value of all environmental impacts. This is due to the difficulty of quantifying and valuing these effects, which in principle should be included.
The value of the reductions in SO2 and NOx emissions resulting from
the measures has been included, but the valuation of these physical re-ductions is very uncertain. This re-port uses the same valuations as the Climate Strategy. Since the calcula-tions were carried out, the National Environmental Research Institute, Denmark (NERI) has published new, higher valuations for the cost of the negative impacts of SO2 and NOx emissions. Using these new, updated assumptions from NERI – and with nothing else changed – the calculations would have resulted in lower CO2 shadow prices for several measures.
Table 4.2 shows that the shadow costs for the selected measures vary substantially, and for most of the measures are higher than the indi-cator of DKK 120 per tonne CO2 specified in the Government’s Cli-mate Strategy. In the energy sector, the “Grant for conversion of apart-ments for the aged to cogenerated heat and power”, “Grants for solar heating, heat pumps, and biomass” and “Building labelling” measures are estimated to have been associat-ed with the highest costs in relation to their CO2 reduction, while the “Grant to cover CO2 tax (agreement scheme)” and “Expansion in decen-tralised cogeneration of heating and power” have been associated with the lowest costs.
Note that the calculations are gener-ally subject to significant uncertainty and it has not been possible to in-clude all the socio-economic effects in the calculations. For example, the benefit of increased comfort associ-
65Denmark’s Climate Policy Objectives and Achievements
Table 4.2: hisTorical co2 shaDow Prices for selecTeD measures (consumPTion-baseD calculaTion)
sector measureAverage annual CO2 reduction for 2008-2012-{}-mill. tonnes CO2 per year
socio-economic cost1 per tonne CO2
DKK/tonne CO2 (2002 prices)
Energy
Grantstoprivatewindturbines �.4�75
Electricitygenerationplantexpansionusingwindturbines
0.9�50
Expansionindecentralisedcogenerationofheatingandpower
�.1100
Agreementonuseofbiomassforelectricityproduction
1.1 ��5
Grantsforenergysavingsinbusinesses 0.9 �75
GranttocoverCO�tax(agreementscheme) 0.6 0
Grantforconversionofolddwellingstocogeneratedheatandpower
0.� 1,9�5�
Granttopromoteconnectiontocoal-firedCHP 0.1 850
Grantsforsolarheating,heatpumps,biomass 0.1 1,500�
Buildinglabelling 0.4 1,�00
TaxmeasuresChangestotaxesonenergyproducts4 1.5 ��5
Increasedtaxesonfuel4 1.� 7755
Industry Regulationofindustrialgases 0.4 �006
1TheshadowpricehasbeencalculatedbasedonthetotalCO�reduction.
�ThismeasurehasalsoleadtoimprovedcomfortforthosewhohavechangedtoCHP.Thisisbelievedtohavebeenpartofthepoliticalmotiveforthemeasure.However,noattempthasbeenmadetovaluethisgain.
�Weightedaverage.Thisshadowpricecoversthreeinitiativeareaswithverydifferentshadowprices.Solarheating(DKK5,700/tonneCO�),Heatpumps(DKK650/tonneCO�)andBiomass(DKK600/tonneCO�).
4Theeffectandtheshadowpricehavebeenestimatedfor�001basedonthenominaltaxincreasefrom1990to�001.Assumingtherearenochangesindemand,andconstantrealpricesandtaxes,itwillalsobepossibletousethisestimateforthe�008-1�period.Notethattheseassumptionsarenotfullycompatiblewiththeassumptionsaboutchangestofuelpricesassociatedwiththeenergymeasures.
5TheCO�reductionhasbeencalculatedforallfuelconsumption,i.e.fuelconsumptionforbothpassengercarsandtrucks.Howevertheshadowpricehasonlybeencalculatedforfuelconsump-tioninpassengercars,correspondingtothecalculationscarriedoutinconnectionwiththeGovernment’s�00�ClimateStrategy.
6Industrialgasesareusedformanypurposes.Theillustratedshadowpricehasbeencalculated,asanexample,forthecostsofreplacingHFCgaseswithmoreenvironmentally-friendlyrefriger-antsinindustrialrefrigerationplant,thebiggestconsumptiongroupwithintheaffectedindustrialgases.

66 Denmark’s Climate Policy Objectives and Achievements
ated with the transition to CHP has not been included in the calcula-tion of the net costs for the “Grant for conversion of old dwellings to cogenerated heat and power” initia-tive. Many of the measures will also have a positive effect on the security of the energy supply, which has not been valued.
Please refer to the annex report to the Effort Analysis and to “Energy policy measures in the 1990’s: Costs and CO2 effects” for further descrip-tion of the conditions and assump-tions underlying the calculation of the shadow price for each measure.
Uncertainty and sensitivity analyses
Both the CO2 reductions and shad-ow costs for the analysed measures are subject to significant uncertainty due to the complexity and scope of the calculations alone. The fol-lowing key issues in relation to the
uncertainty of the results should be highlighted:
• It is not unequivocally clear how the demarcation of an initiative should be carried out. This ap-plies both to choosing which measures to include and, in cer-tain cases, how to define each initiative. Demarcation influ-ences both the CO2 reduction and shadow cost.
• The CO2 reductions have been calculated separately for each initiative. There may be certain consequential effects from an initiative that are not included in the analysis of another initia-tive. Caution should therefore be exercised when comparing the shadow costs of various measures and across sectors.
In addition to the uncertainty associ-ated with determining the expected
Table 4.3: sensiTiviTy analyses for selecTeD measures – examPles
measure Change in parameter Result of base calculationshadow price
reduction in 2008-12
Result of sensitivity analysis
Grantstoprivatewindturbines Adiscountrateof�%insteadof6%p.a.
�.4milliontonnesCO�/yearDKK�75/tonneCO�
-
DKK175/tonneCO�
(-DKK100/tonne)
Grantstoprivatewindturbines Changeintheelectricitypricefrom�005of-DKK0.0�/kWh
�.4milliontonnesCO�/yearDKK�75/tonneCO�
-DKK�95/tonne
(+DKK�0/tonne)
Increasestofueltaxes1 Demandelasticityhalvedfrom-0.6to-0.�(passengervehicles)and
-0.�to-0.1(trucks)
1.�milliontonnesCO�/year
DKK775/tonneCO�
0.6milliontonnes/year(-0.6mill.tonnes/year)
DKK575/tonne(-DKK�00/tonne)
1TheCO�reductionhasbeencalculatedforallfuelconsumption,i.e.fuelconsumptionforbothpassengercarsandtrucks.Howevertheshadowpricehasonlybeencalculatedforfuelconsump-tioninpassengercars,correspondingtothecalculationscarriedoutinconnectionwiththeGovernment’s�00�ClimateStrategy.Thisfactoralsoappliestothesensitivityanalysisfor“Increasestofueltaxes.
67Denmark’s Climate Policy Objectives and Achievements
reductions, there is also significant uncertainty linked to determining the socio-economic prices for the various effects included in such an analysis. With regard to the socio-economic energy prices, the same fuel price as-sumptions have generally been used as were used in the Government’s 2003 Climate Strategy.
To give an indication of the signifi-cance of central assumptions, Table 3 contains a few examples showing how much the shadow price varies in response to potential changes to the key background parameters. For a more complete and systematic pre-sentation of the sensitivity analyses for the individual measures, please refer to “Energy policy measures in the 1990’s: Costs and CO2 effects” .
4.2 achievemenT of TargeTs unDer The kyoTo ProTocol in Terms of overall greenhouse gas “wiTh measures” ProjecTions
As shown in section 3.2.1 the base projection of Denmark’s greenhouse emissions and removals in 2004-2030 was up-dated in May 2005. This up-date (”with (existing) mea-sures” projection) builds on, e.g. an updated energy projection, which now includes expected effects of the implementation of the EU allowance directive (cost effects alone of the implementation of the directive– i.e. excluding the effect of the allowance itself, which for the period 2008-2012 will not be decided before 2006). The expected effects of the Action Plan for the Aquatic Envi-
ronment III are also included in the base projection.
The outcome of this projection of emissions is shown in Table 3.2, together with expected effects of the allocation of funds to JI and CDM projects in 2003-2008.
As shown in Table 3.2, the Danish deficit is estimated on this back-ground to be at approx. 13 million tonnes of CO2 equivalents annually, based on Denmark’s legal commit-ment according to the EU Burden Sharing Agreement. This is based on a situation where no correction has been made for the particularly large imports of electricity in 1990.
If this correction is made as assumed by Denmark, the deficit is reduced to approx. 8 mill. tonnes of CO2 equivalents annually in 2008-2012, as shown in Table 3.2. The defi-cit of 20-25 million tonnes of CO2
equivalents annually in 2008-2012 is based on a projection showing the expected development without im-plementation of the additional meas-ures, which were presented together with the Government’s Proposal for a Climate Strategy for Denmark in Feb-ruary of 2003. The new projection from May of 2005 of the mean an-nual deficit in 2008-2012 is approx. 12 million tonnes of CO2 equivalents lower than the previous one.
With the choice of method, the defi-cit expresses the need to purchase allowances from abroad or to im-plement new measures outside the sectors subject to allowances. So, as

68 Denmark’s Climate Policy Objectives and Achievements
a result of the introduction of the CO2 allowance scheme, the deficit is in principle not directly comparable to the deficit in the government’s Climate Strategy, since the cost ef-fects of the allowances are included, whereas ultimately the allocation of allowances decides the climatic ef-fects of the scheme.
Note that the projection, and there-fore also the deficit, is based on model predictions, which are subject to uncertainty. This applies, not least, to expected developments in energy prises, prises of CO2 allow-ances, and the developments in the Nordic electricity market, which have a direct influence on the size of exports of electricity. The im-plementation of the EU allowance scheme has, however, created a basis for greater certainty regarding the fulfilment of Denmark’s climate commitments under the Kyoto Pro-tocol and EU burden sharing.
The main instrument for fulfilling Denmark’s climate commitments is secured with the allowance scheme.
Other measures will be implement-ed, if they can contribute cost-ef-fectively. Additional cost-effective measures identified by the Measures Project and further allocation of funds for JI and CDM projects are expected to eliminate the deficit en-tirely.
Sector policy measures that can have climate relevance in the short or long term, including the long-term energy strategy towards 2025 and
the action plan for increased energy saving, will also be implemented.
The “with measures” projection presented in this report is the most recent projection. It was finalised in May 2005 and it is in general based on expected effects of policies and measures implemented or adopted until the end of 2004. Due to the adoption of additional energy-sav-ings initiatives in 2005, up-dated projections in the off-shore sector and new IEA projections of energy prices, an update of the May 2005 “with measures” projection has been initiated. However, results from this update will not be available until the beginning of 2006. Preliminary re-sults suggests that the action plan on additional energy-savings initiatives could lead to a 2 mill. tonnes further reduction in annual CO2 emissions 2008-2012.
69Denmark’s Climate Policy Objectives and Achievements
In accordance with the Climate Convention and articles 10 and 11 of the Kyoto Protocol, Denmark is continuously:
- improving the emission inventories etc.: the national system for making emission inventories under the Kyo-to Protocol is being established,
- preparing to adapt to climate changes: a national strategy is being prepared,
- ensuring the introduction, dis-semination, and transfer of climate-friendly technology: the Danish Government is giving high priority to scientific research and develop-ment, including green technology, which is included in the Govern-ment platform. In the EU, heads of state and government have encour-aged Member States to prepare ”roadmaps” for efforts to be made concerning environmental technolo-gy, including relevant measures and timetables. The Government will – as also encouraged to by the Dan-ish Parliament, Folketinget - continue its focused efforts to promote devel-opment and use of environmentally efficient technologies and prepare a Danish action plan for environ-mental technology and a report to Folketinget,
- promoting co-operation in sci-entific and technological research: Danish universities and businesses are co-operating in developing cli-mate-friendly technology, in part with the support of a number of research programmes, including the
Energy Research Programme, which is mentioned in Denmark’s Fourth National Communication,
- supporting capacity-building con-cerning climate, especially in de-veloping countries: Denmark has a long tradition of giving assistance to and supporting capacity build-ing in developing countries, also concerning climate, as shown in e.g. Denmark’s Fourth National Com-munication, and
- giving assistance to implement the Climate Convention in develop-ing countries: Danish assistance to developing countries, not least the poorest countries, also includes as-sistance to implement the Climate Convention.
Additional information on these activities is available in Denmark’s Fourth National Communication on Climate Change.
5 Progressconcerningtheothercommitments underarticles10and11oftheKyotoProtocol
70 Denmark’s Climate Policy Objectives and Achievements
notes
1 (Decision��/CP.7andDecision�5/CP.8)
� The”withmeasures”baselineprojectionpresentedinthisreportisthemostrecentprojection.ItwasfinalisedinMay�005anditisingeneralbasedonexpectedeffectsofpoliciesandmeasuresimplementedoradopteduntiltheendof�004.Duetotheadoptionofadditionalenergy-savingsinitiativesin�005,up-datedprojectionsintheoff-shoresectorandnewIEAprojectionsofenergyprices,anupdateoftheMay�005“withmeasures”projectionhasbeeninitiated.However,resultsfromthisupdatewillnotbeavailableuntilthebeginningof�006.Preliminaryresultssuggestthattheactionplanonadditionalenergy-savingsinitiativescouldleadtoa�mill.tonnesfurtherreductioninannualCO�emissions�008-�01�.
� ItshouldbenotedthatGreenlandisnotincludedintheEuro-peanUnion.
4 ForFaroeIslands,whichisalsoapartoftheRealm,territorialreservationwastakeninconnectionwiththeKingdomofDen-mark’sratificationoftheKyotoProtocol.AndtheFaroeIslandsarenotincludedintheEuropeanUnion.
5 http://www.retsinfo.dk/
6 Denmark’sGreenhouseGasProjectionupto�01�,anup-dateincludingpreliminaryprojectionupto�017,December�00�,JørgenFenham,UNEP-centre.
7 Differencebetween�0and�5milliontonnesofCO�equiva-lents,dependingontheoutcometheEU’sfinalsettingoftheindividualEUcountries’reductions,whichistotakeplacein�006,includingconsiderationforDenmark’scorrectiontotheimportofelectricpowerinthebaseyear1990.
8 ”DanmarksudledningafCO�–indsatseniperioden1990-�001ogomkostningerneherved”(Denmark’sCO�emissions-theeffortintheperiod1990-�001andtheassociatedcosts),ReportfromtheDanishEPA,No.�,April�005(Mainreporthttp://www.mst.dk/udgiv/publikationer/�005/87-7614-587-5/pdf/87-7614-588-�.pdfandAnnexreport:http://www.mst.dk/udgiv/publikationer/�005/87-7614-589-1/html)
9 http://www.ens.dk/graphics/CO�_kvoter/Kvoteomfattede_Produktionsenheder_�005-01-1�b.xls(inEnglish:http://www.mst.dk/transportuk/pdf/NAPeng.xls)
10 http://www.mst.dk/transport/01100000.htm
11 UndertheKyotoProtocol,Denmark’sbaseyearis1990forCO�,methaneandnitrousoxide,whereas1995willbechosenasbaseyearfortheindustrialgases(HFCs,PFCs,andSF6)cf.Article�.8oftheprotocol.
1� UndertheKyotoProtocol,theLULUCFcategoryisdealtwithseparatelyunderarticles�.�and�.4.Sinceeffectsofafforesta-tionmustbeincludedasacontributiontofulfillingthereduc-tiontarget,accordingtoarticle�.�,thesearealsoincludedhere.Sinceitisoptionaltoincludeeffectsofactivitiesunderarticle�.4andDenmarkhasnotyetmadeadecisiononthis,theseef-fectsareexcludedhere.
1� Seehttp://ens.dk/graphics/Publikationer/Energipolitik_UK/En-ergy_Strategy_�0�5/index.htm
14 Seehttp://ens.dk/graphics/Publikationer/Energipolitik/TRM_handlingsplan_web.pdf
15 Olesenetal.,�004
16 Olesenetal.,�004:Olesen,J.E.,Petersen,S.O.,Gyldenkærne,S.,Mikkelsen,M.H.,Jacobsen,B.H.,Vesterdal,L.,Jørgensen,A.M.K.,Christensen,B.T.,Abildtrup,J.,Heidmann,T.&Rubæk,G.(�004).Jordbrugogklimaændringer-samspiltilvandmiljø-planer.(Agricultureandclimatechange-interactionwithactionplansfortheaquaticenvironment)DJFreportMarkbrugno.109.
17 Olesen,�005:Olesen,J.E.(�005).Mulighederforreduktionafdrivhusgasemissionerijordbruget.(Possiblewaysofreducinggreenhousegasemissionsfromagriculture)In:Olesen,J.E.(red).Drivhusgasserfrajordbruget-reduktionsmuligheder.(Greenhousegasesfromagriculture–reductionpossibilities)DJFreportMarkbrugno.11�,pp.1�-��.
18 Olesenetal.,�001:Olesen,J.E.,Andersen,J.M.,Jacobsen,B.H.,Hvelplund,T.,Jørgensen,U.,Schou,J.S.,Graversen,J.,Dalgaard,T.&Fenhann,J.(�001).Kvantificeringaftretiltagtilreduktionaflandbrugetsudledningafdrivhusgasser.(Quanti-ficationofthreemeasuresforreducinggreenhousegasemis-sionsfromagriculture)DJFreportMarkbrug48.
19 ”LUCF”standsfor”Land-UseChangeandForestry”.ThisisasourcecategoryintheUNguidelinesformakinginventoriesongreenhousegasemissionsandremovalsundertheClimateConvention,underwhichCO�emissionsandremovalsincon-nectionwithland-usechangesfeature.Accordingtoarticles�.�and�.4oftheprotocol,onlycertainpartsofthiscanbeincluded.So,persuanttothereportingcommitmentsundertheClimateConvention,netCO�emissionsandtotalgreenhousegasemissionsaretobereportedbothwithandwithoutinclu-sionofthissourcecategory.
�0 http://www.mst.dk/transport/01041000.htm
�1 However,in�00�the(Environment)CouncilandtheCommis-sionadoptedapoliticaldeclarationstatingthatthecalculationoftheassignedamounts(measuredintonnes)in�006shalltakeintoaccountDenmark’sstatementinconnectionwiththeBurdenSharingAgreementin1998,i.a.statingthatDenmark’sreductionsshallbeseeninrelationtoanadjusted1990level,andthattheadoptionofadditionalcommonEuropeanmeas-uresisassumed.
�� http://www.ens.dk/graphics/Publikationer/Energipolitik/ener-gipol_tiltag_CO�effekt.pdf.
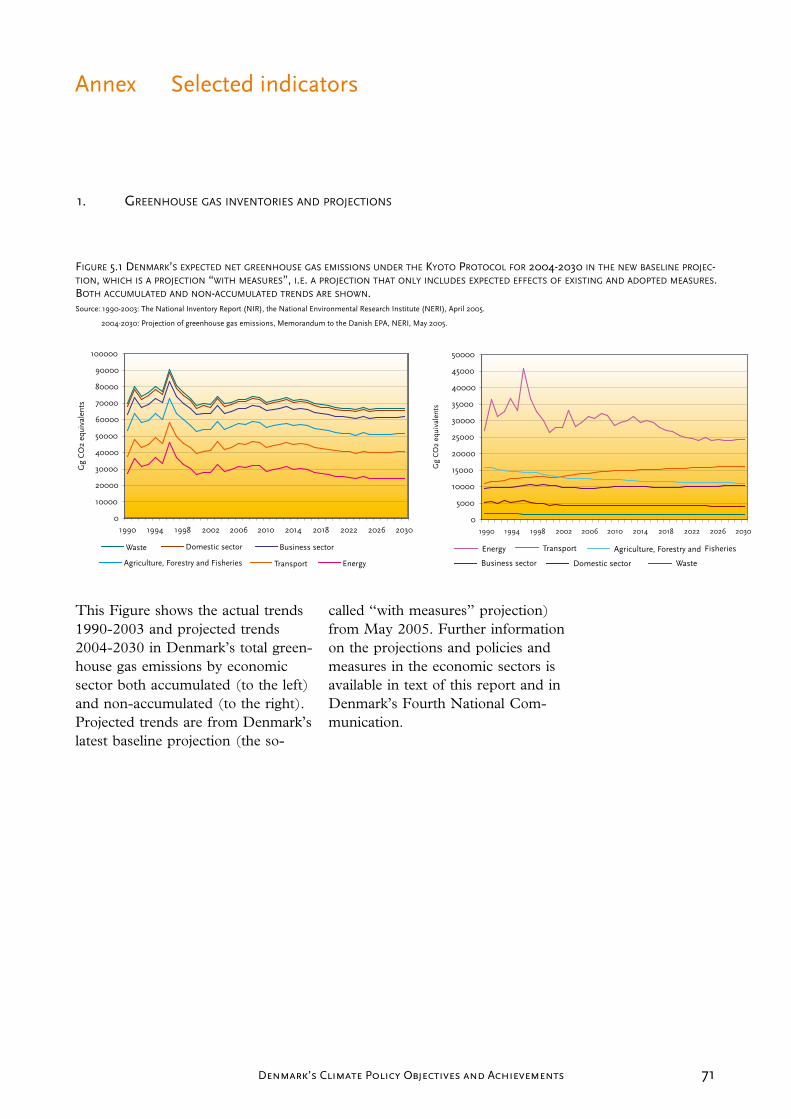
71Denmark’s Climate Policy Objectives and Achievements
1. greenhouse gas invenTories anD ProjecTions
Annex Selectedindicators
figure 5.1 Denmark’s exPecTeD neT greenhouse gas emissions unDer The kyoTo ProTocol for 2004-2030 in The new baseline Projec-Tion, which is a ProjecTion “wiTh measures”, i.e. a ProjecTion ThaT only incluDes exPecTeD effecTs of exisTing anD aDoPTeD measures. boTh accumulaTeD anD non-accumulaTeD TrenDs are shown. Source:1990-�00�:TheNationalInventoryReport(NIR),theNationalEnvironmentalResearchInstitute(NERI),April�005.
�004-�0�0:Projectionofgreenhousegasemissions,MemorandumtotheDanishEPA,NERI,May�005.
This Figure shows the actual trends 1990-2003 and projected trends 2004-2030 in Denmark’s total green-house gas emissions by economic sector both accumulated (to the left) and non-accumulated (to the right). Projected trends are from Denmark’s latest baseline projection (the so-
called “with measures” projection) from May 2005. Further information on the projections and policies and measures in the economic sectors is available in text of this report and in Denmark’s Fourth National Com-munication.
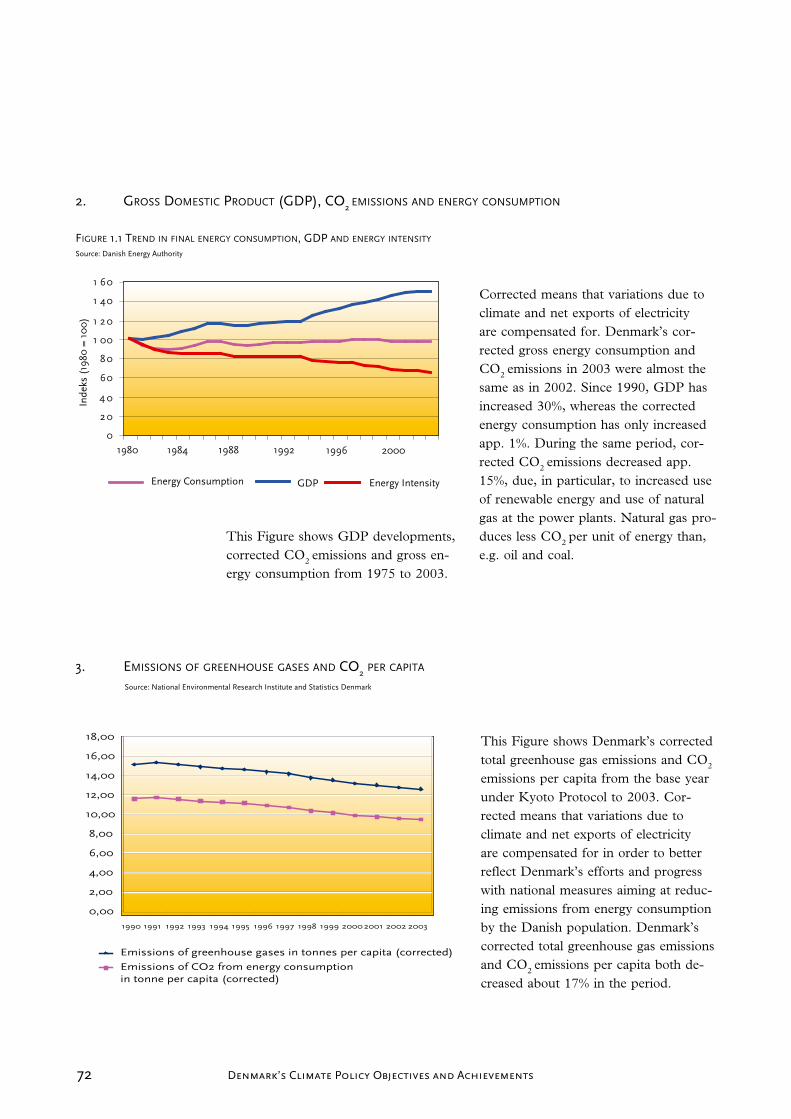
7� Denmark’s Climate Policy Objectives and Achievements
This Figure shows GDP developments, corrected CO2 emissions and gross en-ergy consumption from 1975 to 2003.
Corrected means that variations due to climate and net exports of electricity are compensated for. Denmark’s cor-rected gross energy consumption and CO2 emissions in 2003 were almost the same as in 2002. Since 1990, GDP has increased 30%, whereas the corrected energy consumption has only increased app. 1%. During the same period, cor-rected CO2 emissions decreased app. 15%, due, in particular, to increased use of renewable energy and use of natural gas at the power plants. Natural gas pro-duces less CO2 per unit of energy than, e.g. oil and coal.
2. gross DomesTic ProDucT (gDP), co2 emissions anD energy consumPTion
3. emissions of greenhouse gases anD co2 Per caPiTa Source:NationalEnvironmentalResearchInstituteandStatisticsDenmark
figure 1.1 TrenD in final energy consumPTion, gDP anD energy inTensiTy
Source:DanishEnergyAuthority
This Figure shows Denmark’s corrected total greenhouse gas emissions and CO2
emissions per capita from the base year under Kyoto Protocol to 2003. Cor-rected means that variations due to climate and net exports of electricity are compensated for in order to better reflect Denmark’s efforts and progress with national measures aiming at reduc-ing emissions from energy consumption by the Danish population. Denmark’s corrected total greenhouse gas emissions and CO2 emissions per capita both de-creased about 17% in the period.
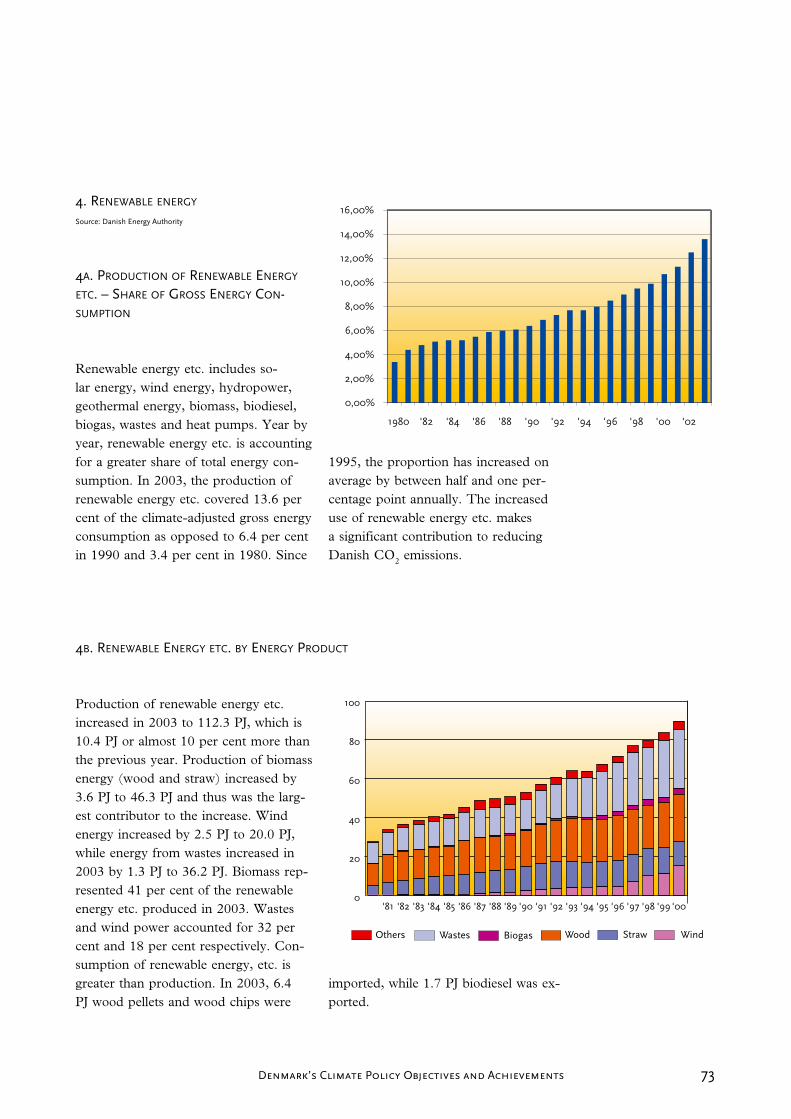
7�Denmark’s Climate Policy Objectives and Achievements
4. renewable energy Source:DanishEnergyAuthority
4a. ProDucTion of renewable energy eTc. – share of gross energy con-sumPTion
Renewable energy etc. includes so-lar energy, wind energy, hydropower, geothermal energy, biomass, biodiesel, biogas, wastes and heat pumps. Year by year, renewable energy etc. is accounting for a greater share of total energy con-sumption. In 2003, the production of renewable energy etc. covered 13.6 per cent of the climate-adjusted gross energy consumption as opposed to 6.4 per cent in 1990 and 3.4 per cent in 1980. Since
1995, the proportion has increased on average by between half and one per-centage point annually. The increased use of renewable energy etc. makes a significant contribution to reducing Danish CO2 emissions.
4b. renewable energy eTc. by energy ProDucT
Production of renewable energy etc. increased in 2003 to 112.3 PJ, which is 10.4 PJ or almost 10 per cent more than the previous year. Production of biomass energy (wood and straw) increased by 3.6 PJ to 46.3 PJ and thus was the larg-est contributor to the increase. Wind energy increased by 2.5 PJ to 20.0 PJ, while energy from wastes increased in 2003 by 1.3 PJ to 36.2 PJ. Biomass rep-resented 41 per cent of the renewable energy etc. produced in 2003. Wastes and wind power accounted for 32 per cent and 18 per cent respectively. Con-sumption of renewable energy, etc. is greater than production. In 2003, 6.4 PJ wood pellets and wood chips were
imported, while 1.7 PJ biodiesel was ex-ported.

74 Denmark’s Climate Policy Objectives and Achievements
4c. uses of renewable energy eTc. in 2003
Total consumption of renewable energy, etc. in 2003 (production plus net im-ports) was 117.0 PJ, of which 82.9 PJ was used in the production of electricity and district heating. Wastes energy wasclearly dominant followed by biomass and wind power. The development of offshore wind parksmeans wind power is expected to play a more prominent role in the years to come. 34.1 PJ renewable energy etc. was included in the final energy consump-tion, i.e. in processing and heating in the agriculture and industry sector and the trade and service sector, as well as heat-ing in households. In final energy con-sumption, biomass, particularly wood, is most prominent. Additionally, a small amount of biogas was used by the en-ergy sector.
4D. winD Power caPaciTy anD PercenTage share of elecTriciTy suPPly
Wind power constitutes an ever larger proportion of the Danish electricity supply. 15.8 per cent of electricity was supplied by wind power in 2003, as opposed to 13.8 per cent in the previ-ous year. The increases in wind power capacity and production do not always correspond exactly, as annualwind power production is highly de-pendent on wind conditions, which can be quite variable in Denmark. 2001 was a relatively poor wind year, while 2002 and 2003 were close to a normal wind year. Wind power capacity in 2003 was 3115 MW, which is 7.9 per cent more than the year before.

75Denmark’s Climate Policy Objectives and Achievements
5. gross energy consumPTion anD energy inTensiTy Source:DanishEnergyAuthority
Private commerce and service
0
20
40
60
80
100
120
140
Inde
x 19
80 =
10
0In
dex
1980
= 1
00
Energy Consumption Energy Intensity
Public service
0
20
40
60
80
100
120
5a. gross energy consumPTion – observeD anD aDjusTeD
Observed energy consumption shows the registered amount of en-ergy consumed in a calendar year. Gross energy consumption is de-rived by adjusting observed energy consumption by the fuel consumed to produce electricity for foreign trade. Additionally, the adjusted gross energy consumption is adjust-ed for climate variations with respect to a normal weather year. The pur-pose of this consumption figure is to provide a clearer picture of trends in domestic energy consumption. Adjusted gross energy consumption in 2003 was 829 PJ as opposed to 827 PJ in 2002 and 820 PJ in 1990. Observed energy consumption in 2003 was 863 PJ, which is 5.0 per cent higher than for 2002. It is 14.7 per cent higher than in 1990, which should be regarded in the context of considerable net imports of electrici-ty in 1990 as opposed to even larger net exports in 2003.
5b. energy inTensiTy in PrivaTe commerce anD service anD Public secTor
As can be seen from this Figure, over the past 15 years there has been a steady increase in energy consumption by the private com-merce and services sector. Primarily

76 Denmark’s Climate Policy Objectives and Achievements
electricity consumption has been rising. The growth in energy consump-tion by the service sector is due to high growth in this sector and reflects a
development where services are be-coming increasingly important in the economy. As the Figure shows, there has been a constant drop in intensity of on average 2.3% per year from 1975-2003. Since 1990 the drop has been on average 1.6% per year.
Energy consumption in public services (the public sector), as shown in the Figure, has been roughly constant over the last 15-20 years, and since the early 1990s there has been a considerable fall in energy intensity.
6. co2 from energy consumPTion Source:DanishEnergyAuthority
6a. co2 emissions, observeD anD aDjusTeD
The Danish Energy Authority calcu-lates both observed CO2 emissions and adjusted CO2 emissions, taking into consideration annual tempera-ture variations and foreign trade in electricity. The aim of the adjusted statement is to obtain a better pic-ture of the underlying trends in the development. In 2003, observed CO2 emissions went up by 9.3 per cent in relation to 2002. Compared with 1990, observed CO2 emissions were 9.9 per cent higher. This trend should be seen in the context of a significant increase in net electricity exports from 2002 to 2003. More-over, the weather was colder in 2003 than in 2002. In 1990, Denmark had large net imports of electricity. In 2003, the adjusted CO2 emissions were 1.2 per cent lower than the year before. Compared with 1990, there has been a fall of 14.9 per cent.

77Denmark’s Climate Policy Objectives and Achievements
6b. co2 emissions by fuels
0
10
20
30
40
50
60
70
80
Coal Natural Gas Oil
Since 1990, there has been a marked shift in the breakdown of energy consumption by fuel. Consumption of natural gas and renewable energy etc. has increased at the expense of coal consumption. The change in fuel types has led to a decline in CO2 emissions despite an increase in gross energy consumption of 1.0 per cent since 1990, as coal burn-ing generates greater CO2 emissions than the burning of natural gas.
6c. co2 emissions Per fuel uniT anD Per kwh of elecTriciTy
Gross energy consumption has been more or less constant over the last 10 years; however, the fuels used have changed considerably. The shift from coal to natural gas and re-newable energy etc. has meant that, year by year, less CO2 is linked to each unit of fuel consumed. Thus, in 2003 each GJ of adjusted gross energy consumption was linked to 62.5 kg CO2, against 74.2 kg in 1990. In 2003, fuel consumption in electricity generation adjusted for electricity exports and climate varia-tions resulted in emissions of 572 g CO2 per kWh electricity. In 1990, 937 g CO2 were emitted per kWh electricity.

78 Denmark’s Climate Policy Objectives and Achievements
6D. co2 emissions by secTor
The energy system is divided into three sectors: energy sector (extraction and refining), transformation sector (produc-tion of electricity, district heating and town gas) and final consumption (trans-port and consumption in households and agriculture and industry, exclud-ing energy and transformation sec-tors). Most of the CO2 reduction since 1990 has been in the transformation sector, when net exports of electricity are disregarded. CO2 emissions in the transformation sector were at 22.8 mil-lion tonnes in 2003 compared to 32.2 million tonnes in 1990, corresponding to a decrease of 29.1 per cent. Today, the largest contribution to Danish CO2 emissions comes from final consumption. In 2003, CO2 emissions were at 26.6 mil-lion tonnes, as opposed to 27.4 million tonnes in 1990. This corresponds to a re-duction of 2.7 per cent.
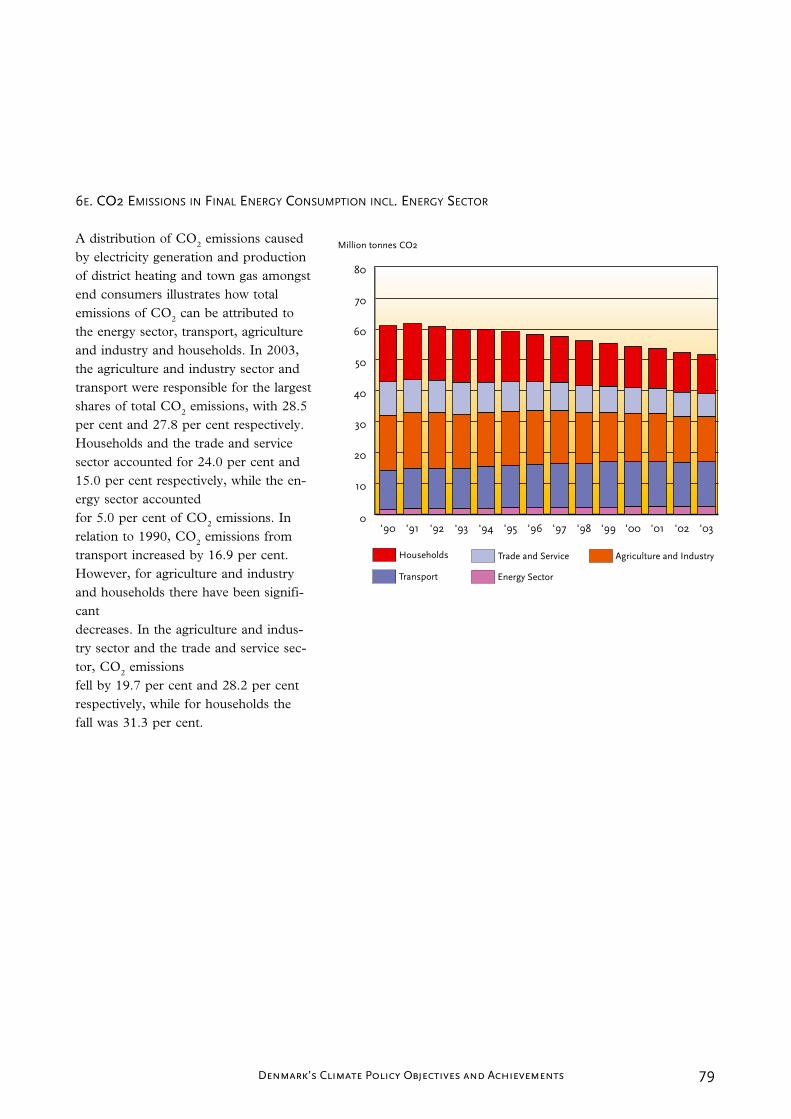
79Denmark’s Climate Policy Objectives and Achievements
A distribution of CO2 emissions caused by electricity generation and production of district heating and town gas amongst end consumers illustrates how total emissions of CO2 can be attributed to the energy sector, transport, agriculture and industry and households. In 2003, the agriculture and industry sector and transport were responsible for the largest shares of total CO2 emissions, with 28.5 per cent and 27.8 per cent respectively. Households and the trade and service sector accounted for 24.0 per cent and 15.0 per cent respectively, while the en-ergy sector accountedfor 5.0 per cent of CO2 emissions. In relation to 1990, CO2 emissions from transport increased by 16.9 per cent. However, for agriculture and industry and households there have been signifi-cantdecreases. In the agriculture and indus-try sector and the trade and service sec-tor, CO2 emissionsfell by 19.7 per cent and 28.2 per cent respectively, while for households the fall was 31.3 per cent.
6e. co2 emissions in final energy consumPTion incl. energy secTor
80 Denmark’s Climate Policy Objectives and Achievements
Publisher:MinistryoftheEnvironment,DanishEnvironmentalProtectionAgency,Strandgade�9,DK-1401CopenhagenKTelephone+45��660100Telefax+45��660479Internethttp://www.mst.dk
year of publication:�005
title: ”Denmark’sClimatePolicy
ObjectivesandAchievements”
subtitle:Denmark’sreportondemonstrableprogressin
�005undertheKyotoProtocol
Author(s):Rasmussen,Erik(red);
Jørgensen,Jesper(red)
Performing organization(s): DanishEnvironmentalProtectionAgency;DanishForestandNatureAgency;NationalEnvironmentalResearchInstitute;GeologicalSurveyofDenmarkandGreenland;DanishEnergyAuthority;TheDanishForestandNatureAgency;MinistryofForeignAffairs;MinistryofFinance;MinistryofTransport;DanishMeteorologicalInstitute;DanishCoa-stalAuthority;MinistryofFood,AgricultureandFisheries;DanishInstituteofAgriculturalSciences;DanishCentreforForest,LandscapeandPlanning;GreenlandHomeRule,includingtheDepartmentforEnvironmentandNature;FaroeHomeRule,includingtheMinistryoftheInterior;StatisticsDenmark;RisøNationalLabo-
ratory;UniversityofCopenhagen;UniversityofAarhus;TechnicalUniversityofDenmark;Insti-tuteofLocalGovernmentStudies–Denmark;RoyalVeterinaryandAgriculturalUniversity
DataSheet
Abstract:”Denmark’sClimatePolicyObjectivesandAchievements”isDenmark’sreportondemon-strableprogressin�005undertheKyotoPro-tocolinaccordancewithdecisionstakenundertheUnitedNationsFrameworkConventiononClimateChange.ThereportpresentsprogressmadeinDenmarkintheendeavourstofulfilitsinternationalclimatecommitments. supplementary notes:ThereporthasbeenpreparedtobeforwardedtotheUNsecretariatfortheClimateConven-tionandtotheEuropeanCommission.ExceptforminorupdatesitwaspublishedinDanishinJune�005.
edition closed (month/year):november�005 number of pages 80 format: A4
number of copies: 1500 Isbn: 87-7614-893-9
graphic Design: FinnHagenMadsen
Printed by: Schultz
Price (incl. 25 % vAt): Freeofcharge
Distributed by: TheMinistryoftheEnvironmentFrontlinienRentemestervej8,�400KøbenhavnNVPhone:+45701�0�[email protected]
Reproductionisauthorizedprovidedthesour-ceisacknowledged
Printedon100%recycledpaperCyclus
Denm
ark’s Clim
ate Policy Objectives and A
chievements R
eport on Dem
onstrable Progress in 200
5 under the Kyoto Protocol
”Denmark’s Climate Policy Objectives and Achievements”
is Denmark’s report on demonstrable progress in 2005 under
the Kyoto Protocol in accordance with decisions taken under the
United Nations Framework Convention on Climate Change.
ISBN 87-7614-891-2Price: Free of charge.
The Ministry of the EnvironmentFrontlinien
Rentemestervej 8 2400 København NVPhone: +45 70 12 02 [email protected] • Internet www.frontlinien.dk