Embed Size (px)
Citation preview

Copyright � 2010 by the Genetics Society of AmericaDOI: 10.1534/genetics.109.109629
Defining and Mapping Mammalian Coat Pattern Genes: Multiple GenomicRegions Implicated in Domestic Cat Stripes and Spots
Eduardo Eizirik,*,†,‡,1 Victor A. David,* Valerie Buckley-Beason,*,2 Melody E. Roelke,§
Alejandro A. Schaffer,** Steven S. Hannah,†† Kristina Narfstrom,‡‡
Stephen J. O’Brien* and Marilyn Menotti-Raymond*
*Laboratory of Genomic Diversity, National Cancer Institute, Frederick, Maryland 21702, †Faculdade de Biociencias, Pontifıcia UniversidadeCatolica do Rio Grande do Sul, Porto Alegre, Rio Grande do Sul 90619-900, Brazil, ‡Instituto Pro-Carnıvoros, Atibaia, Sao Paulo
12945-010, Brazil, §Laboratory of Genomic Diversity, SAIC-Frederick, National Cancer Institute, Frederick, Maryland 21702,**PetCare Company, National Center for Biotechnology Information, National Institutes of Health, Department of Health
and Human Services, Bethesda, Maryland 20894, ††Nestle Purina, Saint Louis, Missouri 63164and ‡‡Department of Ophthalmology, Mason Eye Institute, University of Missouri,
Columbia, Missouri 65211
Manuscript received September 10, 2009Accepted for publication October 12, 2009
ABSTRACT
Mammalian coat patterns (e.g., spots, stripes) are hypothesized to play important roles in camouflageand other relevant processes, yet the genetic and developmental bases for these phenotypes arecompletely unknown. The domestic cat, with its diversity of coat patterns, is an excellent model organismto investigate these phenomena. We have established three independent pedigrees to map the fourrecognized pattern variants classically considered to be specified by a single locus, Tabby; in order ofdominance, these are the unpatterned agouti form called ‘‘Abyssinian’’ or ‘‘ticked’’ (Ta), followed bySpotted (Ts), Mackerel (TM), and Blotched (tb). We demonstrate that at least three different loci controlthe coat markings of the domestic cat. One locus, responsible for the Abyssinian form (herein termed theTicked locus), maps to an �3.8-Mb region on cat chromosome B1. A second locus controls the Tabby allelesTM and tb, and maps to an �5-Mb genomic region on cat chromosome A1. One or more additional loci actas modifiers and create a spotted coat by altering mackerel stripes. On the basis of our results andassociated observations, we hypothesize that mammalian patterned coats are formed by two distinct pro-cesses: a spatially oriented developmental mechanism that lays down a species-specific pattern of skin celldifferentiation and a pigmentation-oriented mechanism that uses information from the preestablishedpattern to regulate the synthesis of melanin profiles.
PATTERNED coats are typical of many mammaliangroups, whose spots, stripes, and other markings
have been hypothesized to play important adaptiveroles in camouflage, predator evasion, and social com-munication (Cott 1940; Searle 1968; Ortolani andCaro 1996). Many mammals bear striped or spottedcoats, and these phenotypes have historically drawn at-tention from many fields of human science and culture(e.g., the leopard’s spots, or the stripes seen in tigersand zebras). Although several theoretical studies haveproposed mathematical models that could underlie thedevelopmental dynamics of coat pattern formation inmammals (Murray and Oster 1984; Oyehaug et al.
2002), no direct investigation of the genetic basis ofthese phenotypes has yet been performed, so that theirmechanistic causes remain a mystery. Recent advances ingenomics, molecular biology, and evolutionary develop-mental biology (Evo-Devo) have revealed genes and path-ways involved in skin pattern formation in Drosophila(Schug et al. 1998; Gompel et al. 2005; Prud’homme et al.2006; Parchem et al. 2007), butterflies (Joron et al.2006a,b), and zebrafish (Iwashita et al. 2006; Watanabe
et al. 2006; Svetic et al. 2007). In contrast, despite therelevance of characterizing equivalent processes in mam-mals, little progress toward this goal has been accom-plished, perhaps due to the lack of adequate mammalianmodels exhibiting variation in skin pattern and for whichgenetic and genomic tools were available.
The domestic cat is a very promising model in thisregard, as it presents several coat pattern variants anda growing body of genetic and genomic tools suitablefor gene identification (Menotti-Raymond et al. 2003;Murphy et al. 2007; Pontius et al. 2007; Pontius
and O’Brien 2007; Davis et al. 2009). Classic work on
Supporting information is available online at http://www.genetics.org/cgi/content/full/genetics.109.109629/DC1.
1Corresponding author: Faculdade de Biociencias, PUCRS, Av. Ipiranga6681, Predio 12, Porto Alegre, RS 90619-900, Brazil.E-mail: [email protected]
2Present address: George Mason University, Krasnow Institute ForAdvanced Study, Center for Biomedical Genomic and Informatics,Manassas, VA 20110.
Genetics 184: 267–275 ( January 2010)
domestic cat coat color (Robinson 1958; Lomax andRobinson 1988) has suggested that there is a monogenicallelic series of coat patterns in the domestic cat, con-trolled by the Tabby (T) locus: in order of dominance, thefour recognized alleles would be Abyssinian or ‘‘ticked’’(Ta), Spotted (Ts), Mackerel (TM), and Blotched (tb)(Figure 1). Although there has been little doubt amongbreeders that the ‘‘mackerel’’ and ‘‘blotched’’ formssegregate as a single autosomal locus, this may not bethe case for the other two phenotypes (Ta and Ts), whichso far have not been tested thoroughly for allelism rel-ative to the more common Tabby variants TM and tb. Somebreeding data have suggested that these variants may notbe allelic with the main Tabby locus (Lorimer 1995), butfurther scrutiny is required to test this hypothesis. Arecent genetic study (Lyons et al. 2006) considered theAbyssinian variant as an allele of Tabby, reflecting theprevalent perception that they are coded by the samelocus. Testing this hypothesis, and identifying the impli-cated genomic region (or regions), is a first step in theprocess of dissecting the molecular and developmentalbasis for these pattern-formation phenotypes.
Aiming to investigate the genetic basis of patternformation on the domestic cat pelage by genomic, posi-tional methods, we established three separate pedigreessegregating for different combinations of coat patternphenotypes. Our results demonstrate that at least threedifferent loci underlie the striping and spotting patternsobserved in domestic cats and identify the genomic loca-tion of two of them.
MATERIALS AND METHODS
Pedigrees and phenotyping: To avoid potential complica-tions stemming from multiple loci affecting coat patternformation phenotypes, we chose to analyze each variant sepa-rately, a strategy that could simultaneously test for allelismand identify the implicated genomic regions. We thus estab-lished three independent pedigrees, each of which segregatedfor a single ‘‘Tabby’’ variant, relative to a standard. Pedigree 1was a multigenerational outbred (and nonbreed) domestic catpedigree maintained by the Nestle Purina PetCare Companyfor nutrition studies, which we have previously used to build agenetic linkage map of the domestic cat genome (Menotti-Raymond et al. 2009; Schmidt-Kuntzel et al. 2009) and also toidentify genes involved in coat color and hair length (Eizirik
et al. 2003; Ishida et al. 2006; Kehler et al. 2007). It consisted of287 individuals, 256 of which were genotyped. This pedigreeshowed segregation for the mackerel and blotched Tabbyvariants, providing a basis for their mapping using a genomescan.
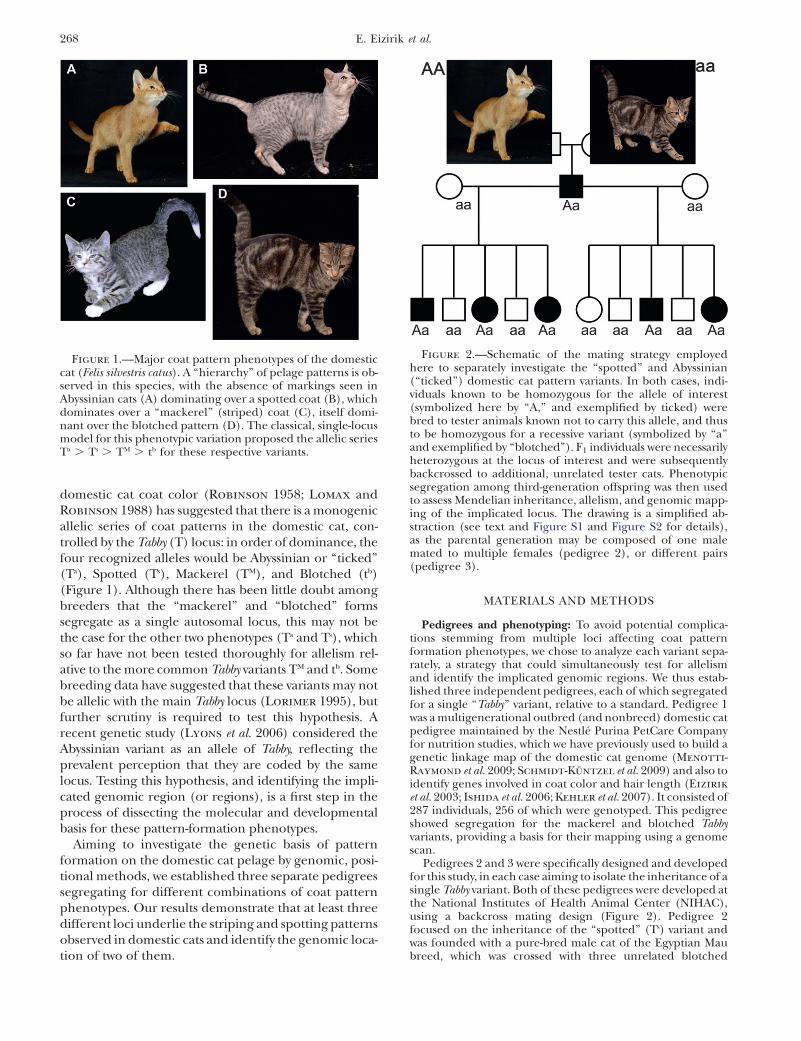
Pedigrees 2 and 3 were specifically designed and developedfor this study, in each case aiming to isolate the inheritance of asingle Tabby variant. Both of these pedigrees were developed atthe National Institutes of Health Animal Center (NIHAC),using a backcross mating design (Figure 2). Pedigree 2focused on the inheritance of the ‘‘spotted’’ (Ts) variant andwas founded with a pure-bred male cat of the Egyptian Maubreed, which was crossed with three unrelated blotched
Figure 1.—Major coat pattern phenotypes of the domesticcat (Felis silvestris catus). A ‘‘hierarchy’’ of pelage patterns is ob-served in this species, with the absence of markings seen inAbyssinian cats (A) dominating over a spotted coat (B), whichdominates over a ‘‘mackerel’’ (striped) coat (C), itself domi-nant over the blotched pattern (D). The classical, single-locusmodel for this phenotypic variation proposed the allelic seriesTa . Ts . TM . tb for these respective variants.
Figure 2.—Schematic of the mating strategy employedhere to separately investigate the ‘‘spotted’’ and Abyssinian(‘‘ticked’’) domestic cat pattern variants. In both cases, indi-viduals known to be homozygous for the allele of interest(symbolized here by ‘‘A,’’ and exemplified by ticked) werebred to tester animals known not to carry this allele, and thusto be homozygous for a recessive variant (symbolized by ‘‘a’’and exemplified by ‘‘blotched’’). F1 individuals were necessarilyheterozygous at the locus of interest and were subsequentlybackcrossed to additional, unrelated tester cats. Phenotypicsegregation among third-generation offspring was then usedto assess Mendelian inheritance, allelism, and genomic mapp-ing of the implicated locus. The drawing is a simplified ab-straction (see text and Figure S1 and Figure S2 for details),as the parental generation may be composed of one malemated to multiple females (pedigree 2), or different pairs(pedigree 3).
268 E. Eizirik et al.
females (supporting information, Figure S1). Egyptian Maucats are fully spotted (Figure 3) and breed true for this trait,thus being homozygous for whatever alleles cause this coatpattern. Blotched was selected as the tester phenotype, since itis determined by a recessive allele relative to mackerel, so thatthese individuals can be confidently assumed to be homozy-gotes (tb/tb) at the Tabby locus. The founder crosses of thispedigree were therefore set up to be TsTs 3 tbtb, consideringthe single-locus model of Tabby inheritance.
Pedigree 3 focused on the inheritance of the Abyssinian(Ta) variant (known as ticked in breeder terminology), alsobased on a backcross mating design (Figure 2 and Figure S2).The Abyssinian form is semidominant relative to any of theother variants, with homozygotes Ta/Ta bearing plain color(a homogeneous agouti coat, with banded individual hairsbut no body markings) (Figure 1), and heterozygotes exhibit-ing faint, thin body stripes and banding on the legs and tail(Lomax and Robinson 1988). The founders of this kindredwere two males previously generated in an Abyssinian pedigreesegregating for retinal atrophy which had been outcrossedto non-Abyssinian European shorthairs (Menotti-Raymond
et al. 2007). Given their progenitors (both had differentAbyssinian sires, each of which had been crossed to a blotchedand a mackerel female, respectively), these two individualswere known to be heterozygotes carrying the TA allele, andindeed displayed stripes on the legs and tail of an otherwisetypical Abyssinian (i.e., agouti or ticked) coat. These two F1
individuals were used for backcrossing with 12 non-Abyssinianfemales (mackerel or blotched), and phenotypic segregationof ticked was analyzed in the resulting third-generationindividuals.
For all three pedigrees, individuals were phenotyped byE. Eizirik and photographs recorded in a central databasemaintained at the Laboratory of Genomic Diversity, NationalInstitutes of Health (NIH). All cats analyzed in this study weremaintained in facilities inspected by the United StatesDepartment of Agriculture, under conditions established bythe American Association of Laboratory Animal Care in com-pliance with the federal Animal Welfare Act.
DNA extraction and marker genotyping: Blood sampleswere obtained from all individuals in pedigrees 1–3. Inaddition, for pedigrees 2 and 3, fibroblast cell lines wereestablished as a source of high-quality genomic DNA. DNA wasextracted from whole blood or cell lines using a QIAamp DNABlood Midi kit (QIAGEN). PCR amplification was performed
with a touchdown PCR protocol as described previously(Menotti-Raymond et al. 2005). Sample electrophoresisand genotyping, as well as Mendelian inheritance checking,were carried out as previously described (Ishida et al. 2006).See the results section and Table S1 for the microsatellite locityped in each pedigree.
Development of microsatellites for fine mapping of Tabbyand Ticked: After linkage was established to a known regionusing previously published cat STR markers, additional micro-satellites from candidate regions were mined from the cat 1.9Xwhole genome sequence (Pontius et al. 2007). Initiallymicrosatellites were selected on the basis of their conservedsyntenic position in the dog, following the method describedby Ishida et al. (2006). Following the availability of a catgenome assembly (Pontius et al. 2007), microsatellite markerswere selected on the basis of their location on cat chromo-somes using the algorithm ABCC Retrieve STRs (ABCC STR-centric tools, http://www.abcc.ncifcrf.gov/Genomes/Cat/index.php) (Pontius and O’Brien 2007) (these include allloci used for Ticked mapping with prefix ‘‘chrB1,’’ see below).Primers (see Table S1) were designed with Primer 3 (http://frodo.wi.mit.edu/cgi-bin/primer3/primer3_www.cgi (Rozen
and Skaletsky 2000), including an M13 tail for fluorescentlabeling of PCR products (Boutin-Ganache et al. 2001).
Genetic linkage mapping: Single-marker LOD scores werecomputed using Superlink (Fishelson and Geiger 2002;Fishelson and Geiger 2004), as described in Ishida et al.(2006) and Kehler et al. (2007). Recombination fractions areoptimal to within 0.01. Multipoint analyses were performed toclarify which markers belong above or below the intervals ofzero recombination. The traits were modeled as fully pene-trant. For the LOD scores shown here, the trait-associatedallele frequency was set to 0.25, but the LOD scores areinsensitive to this value. Marker-allele frequencies were set allequal, but since most of the cats are genotyped, the markerallele frequencies have little effect on the LOD scores.
RESULTS
A detailed inspection of phenotype segregation inpedigree 1 corroborated the expected monogenic in-heritance of the mackerel and blotched Tabby variants(Figure 1), with the latter being a fully penetrant,
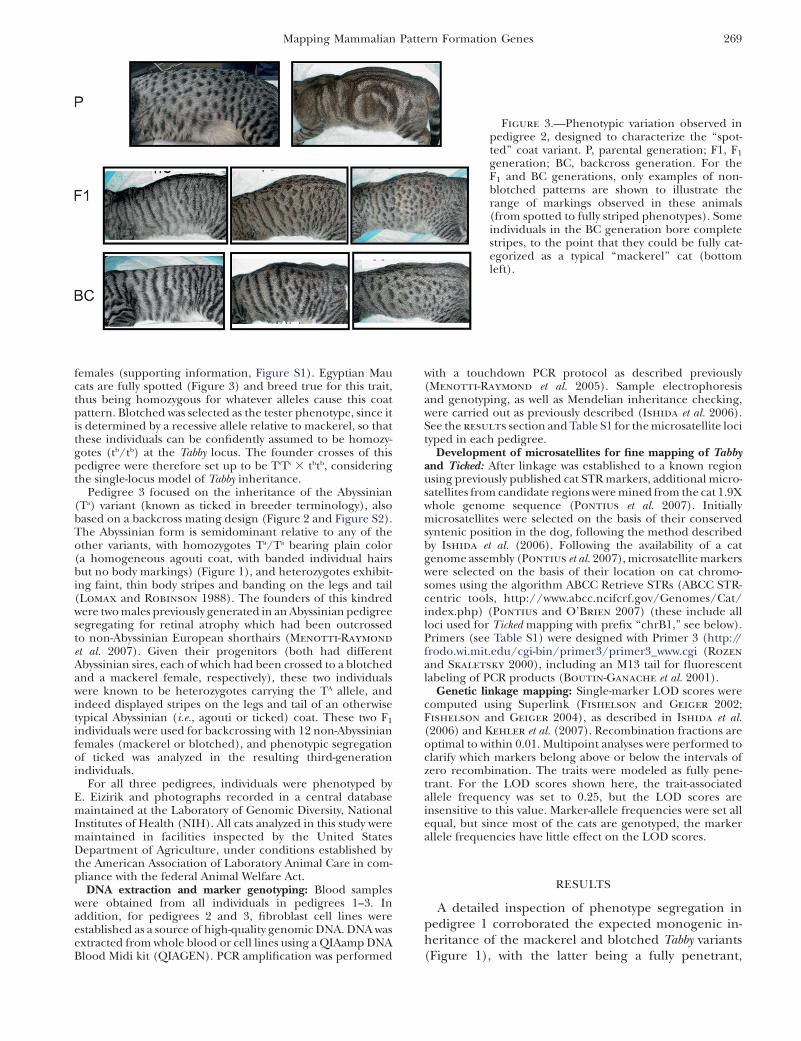
Figure 3.—Phenotypic variation observed inpedigree 2, designed to characterize the ‘‘spot-ted’’ coat variant. P, parental generation; F1, F1
generation; BC, backcross generation. For theF1 and BC generations, only examples of non-blotched patterns are shown to illustrate therange of markings observed in these animals(from spotted to fully striped phenotypes). Someindividuals in the BC generation bore completestripes, to the point that they could be fully cat-egorized as a typical ‘‘mackerel’’ cat (bottomleft).
Mapping Mammalian Pattern Formation Genes 269
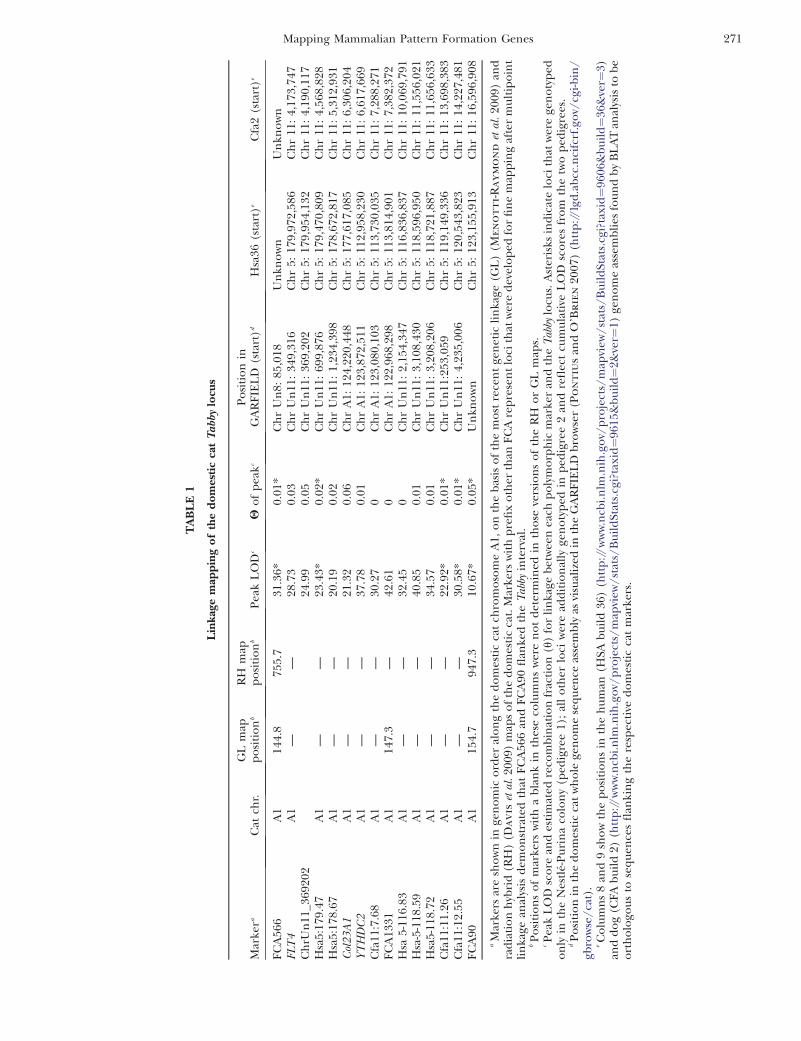
autosomal recessive allele. In the absence of candidategenes for this phenotype, a genome scan was performedusing 483 microsatellite markers. Among these estab-lished markers, significant linkage to the Tabby locus wasobserved in a region of chromosome A1 [markersFCA566 (LOD ¼ 31.4, u ¼ 0.01), FCA90 (LOD ¼ 10.7,u¼ 0.05), and FCA1331 (LOD¼ 42.61, u¼ 0)] (Table 1).Fine mapping of Tabby was accomplished by developingadditional microsatellite markers for the region (seeTable S1 for a list of all new primers), combined with thesubsequent addition of meioses from pedigree 2 (seebelow). This joint approach defined a genomic regionof �5 Mb for the Tabby locus, on the basis of conservedsynteny with the human and dog genomes (Table 1).Although the domestic cat sequence assembly is not yetcomplete in this region, the current radiation hybrid(RH) map (Davis et al. 2009) shows that this genomicsegment is well defined and exhibits conserved syntenyto human chromosome 5 (113.0–118.6 Mb) and dogchromosome 11 (6.6–11.5 Mb).
The parental crosses of pedigree 2 (spotted vs.blotched phenotypes) yielded seven F1 individuals, noneof which were fully spotted, but rather exhibiting inter-mediate patterns between spotted and mackerel (i.e.,they would be considered to be ‘‘broken mackerel,’’ dueto a mixture of spots and broken stripes; Figure 3).These F1 individuals were backcrossed to nine testerblotched cats, producing a third-generation progeny of39 animals, 35 of which could be confidently pheno-typed (Figure S1). These backcross offspring conformedto a 1:1 ratio of blotched (n ¼ 19) to nonblotched (n ¼16) pattern, supporting an allelic relationship at theTabby locus. However, the nonblotched animals ex-hibited a full range from spotted to striped phenotypes,including individuals that could be fully categorized asmackerel (see Figure 3). Since the mackerel form wasnot present in any of the original crosses, this resultdemonstrates that it was represented by the spotted in-dividuals, modified by the epistatic action of other genes.The segregation we observed was therefore between thetwo common alleles at the Tabby locus, TM and tb, withthe former originally masked as the spotted phenotypeby modifier loci. Given these findings, we added themeioses from this pedigree to the analysis of the Tabbylocus (TM and tb), described above, to refine themapping of its genomic position (Table 1).
In the case of pedigree 3 (Figure S2), the two malefounders (F1 individuals) were backcrossed to multiplenon-Abyssinian females, producing a total of 85 off-spring, 73 of which could be phenotyped with confi-dence (the remaining 12 were stillborn and did notallow for reliable recognition of coat color features).These third-generation individuals exhibited an almostperfect 1:1 ratio of Ta carriers (n ¼ 36) vs. noncarriers(mackerel or blotched) (n ¼ 37), in accordance toMendelian expectations for a single locus. To verifywhether this segregation in pedigree 3 occurred at the
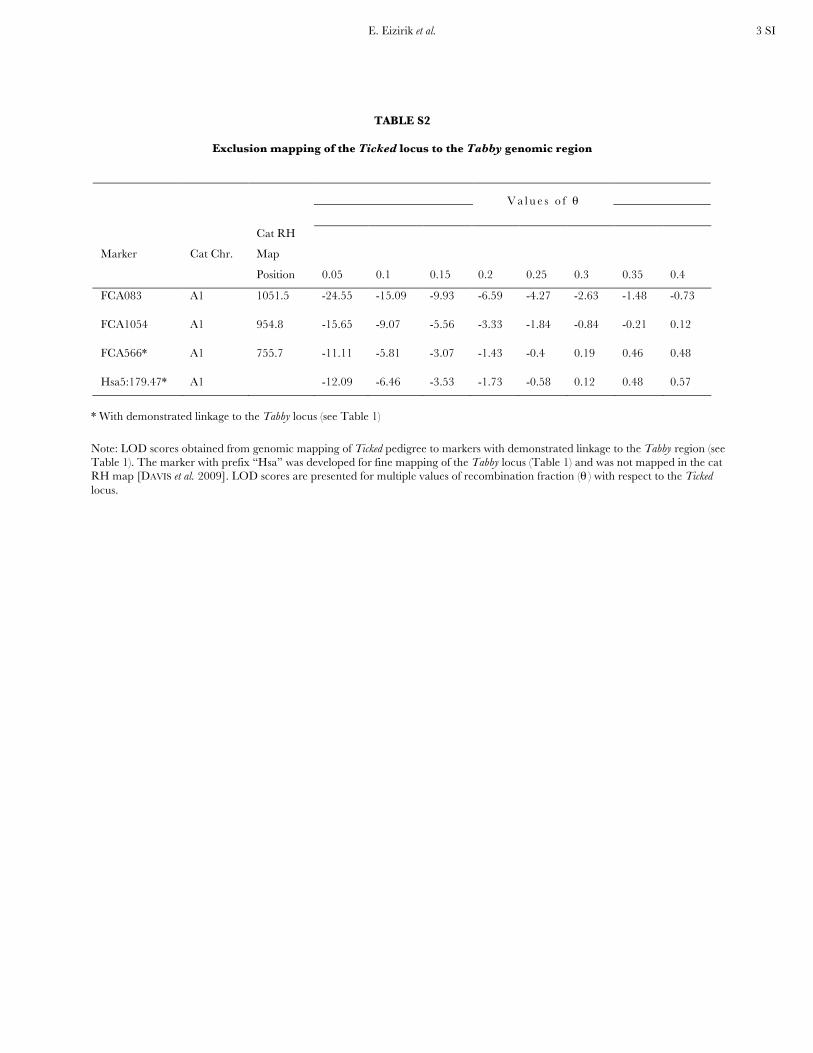
same locus as the TM and tb alleles mentioned above, weinitially genotyped the members of this kindred for sixmicrosatellites linked to the Tabby locus (mapped tochromosome A1 using pedigrees 1 and 2, see Table 1),as well as three additional markers in the same regionof chromosome A1. The results from this experimentexcluded this chromosomal segment, refuting Tabby asthe implicated locus in the Ta variant (Table S2).
This finding indicated that the Abyssinian phenotypeis not coded by an allele of Tabby, but rather by a separategenetic locus, which we henceforth call Ticked. Beforeinitiating a whole genome scan for this locus, we pro-ceeded to genotype three microsatellites in a candidateregion linked to ‘‘brindling’’ (the ‘‘K’’ locus) in dogs(G. S. Barsh, personal communication; Candille et al.2007; Kerns et al. 2007), as this canine variant might behomologous to some aspect of the cat pelage pattern-ing. Microsatellites were selected for a region on catchromosome B1 with conserved synteny to the brindl-ing locus, at 34.8 Mb on dog chromosome 19 (Candille
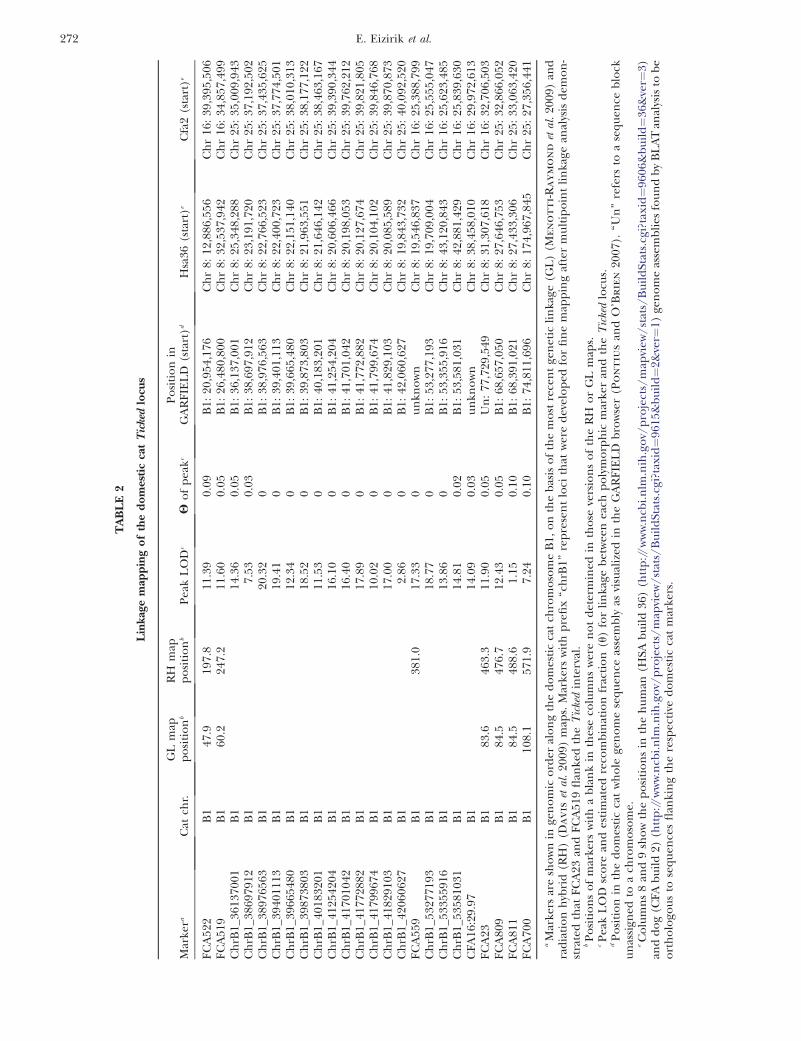
et al. 2007; Kerns et al. 2007). Although Ticked demon-strated significant linkage to the K region [markersFCA522 (LOD ¼ 11.4, u ¼ 0.09) and FCA519 (LOD ¼11.6, u ¼ 0.05)], recombination between the markersand this trait was demonstrated within this genomicsegment of cat chromosome B1 (Table 2). Although thisresult indicated that the dog brindling and cat tickedcoat color variants were not caused by the same gene,this initial finding allowed us to restrict all furthermarker development and genotyping to chromosomeB1. Additional markers were thus designed to identifya region of zero recombination with Ticked (see materi-
als and methods). The genomic region for Ticked wasultimately defined as a segment of �3.8 Mb, with con-served synteny to Hsa 8: 23–19.7, 43.1–42.9 Mb. Thisregion is equivalent to that reported by Lyons et al.(2006) as linked to the Tabby locus. The defined seg-ment occurs within a region showing an intrachromo-somal break in synteny between cat and human, and aninterchromosomal break between cat and dog (Table 2).
DISCUSSION
The results presented here indicate that there are atleast three different loci determining the pattern of coatmarkings in the domestic cat: (1) the Tabby locus (forwhich we propose the symbol ‘‘Ta’’), mapped to chro-mosome A1 and containing alleles TaM and tab (mackerel/blotched); (2) one or more modifier loci that create aspotted coat by altering the mackerel stripes and thatpossibly also influence variation in the blotched pattern;and (3) the Ticked locus (for which we propose thesymbol ‘‘Ti’’), mapping to chromosome B1 and contain-ing alleles TiA (Abyssinian) and Ti1 (non-Abyssinian).The TiA allele is semidominant and has an epistaticeffect on the expression of Tabby and its shape-alteringmodifiers (Table 3).
270 E. Eizirik et al.
TA
BL
E1
Lin
kag
em
app
ing
of
the
do
mes
tic
cat
Ta
bby
locu
s
Mar
kera
Cat
chr.
GL
map
po
siti
on
b
RH
map
po
siti
on
bP
eak
LO
Dc
Qo
fp
eakc
Po
siti
on
inG
AR
FIE
LD
(sta
rt)d
Hsa
36(s
tart
)eC
fa2
(sta
rt)e
FC
A56
6A
114
4.8
755.
731
.36*
0.01
*C
hr
Un
8:85
,018
Un
kno
wn
Un
kno
wn
FLT
4A
1—
—28
.73
0.03
Ch
rU
n11
:34
9,31
6C
hr
5:17
9,97
2,58
6C
hr
11:
4,17
3,74
7C
hrU
n11
_369
202
24.9
90.
05C
hr
Un
11:
369,
202
Ch
r5:
179,
954,
132
Ch
r11
:4,
190,
117
Hsa
5:17
9.47
A1
——
23.4
3*0.
02*
Ch
rU
n11
:69
9,87
6C
hr
5:17
9,47
0,80
9C
hr
11:
4,56
8,82
8H
sa5:
178.
67A
1—
—20
.19
0.02
Ch
rU
n11
:1,
234,
398
Ch
r5:
178,
672,
817
Ch
r11
:5,
312,
931
Col
23
A1
A1
——
21.3
20.
06C
hr
A1:
124,
220,
448
Ch
r5:
177,
617,
085
Ch
r11
:6,
306,
204
YT
HD
C2
A1
——
37.7
80.
01C
hr
A1:
123,
872,
511
Ch
r5:
112,
958,
230
Ch
r11
:6,
617,
669
Cfa
11:7
.68
A1
——
30.2
70
Ch
rA
1:12
3,08
0,10
3C
hr
5:11
3,73
0,03
5C
hr
11:
7,28
8,27
1F
CA
1331
A1
147.
3—
42.6
10
Ch
rA
1:12
2,96
8,29
8C
hr
5:11
3,81
4,90
1C
hr
11:
7,38
2,37
2H
sa5-
116.
83A
1—
—32
.45
0C
hr
Un
11:
2,15
4,34
7C
hr
5:11
6,83
6,83
7C
hr
11:
10,0
69,7
91H
sa-5
-118
.59
A1
——
40.8
50.
01C
hr
Un
11:
3,10
8,43
0C
hr
5:11
8,59
6,95
0C
hr
11:
11,5
56,0
21H
sa5-
118.
72A
1—
—34
.57
0.01
Ch
rU
n11
:3,
208,
206
Ch
r5:
118,
721,
887
Ch
r11
:11
,656
,633
Cfa
11:1
1.26
A1
——
22.9
2*0.
01*
Ch
rU
n11
:253
,059
Ch
r5:
119,
149,
336
Ch
r11
:13
,698
,383
Cfa
11:1
2.55
A1
——
30.5
8*0.
01*
Ch
rU
n11
:4,
235,
006
Ch
r5:
120,
543,
823
Ch
r11
:14
,227
,481
FC
A90
A1
154.
794
7.3
10.6
7*0.
05*
Un
kno
wn
Ch
r5:
123,
155,
913
Ch
r11
:16
,596
,908
aM
arke
rsar
esh
ow
nin
gen
om
ico
rder
alo
ng
the
do
mes
tic
cat
chro
mo
som
eA
1,o
nth
eb
asis
of
the
mo
stre
cen
tge
net
icli
nka
ge(G
L)
(Men
ot
ti-R
ay
mo
nd
etal
.20
09)
and
rad
iati
on
hyb
rid
(RH
)(D
av
is
etal
.20
09)
map
so
fth
ed
om
esti
cca
t.M
arke
rsw
ith
pre
fix
oth
erth
anF
CA
rep
rese
nt
loci
that
wer
ed
evel
op
edfo
rfi
ne
map
pin
gaf
ter
mu
ltip
oin
tli
nka
gean
alys
isd
emo
nst
rate
dth
atF
CA
566
and
FC
A90
flan
ked
the
Tab
byin
terv
al.
bP
osi
tio
ns
of
mar
kers
wit
ha
bla
nk
inth
ese
colu
mn
sw
ere
no
td
eter
min
edin
tho
seve
rsio
ns
of
the
RH
or
GL
map
s.cP
eak
LO
Dsc
ore
and
esti
mat
edre
com
bin
atio
nfr
acti
on
(u)
for
lin
kage
bet
wee
nea
chp
oly
mo
rph
icm
arke
ran
dth
eT
abby
locu
s.A
ster
isks
ind
icat
elo
cith
atw
ere
gen
oty
ped
on
lyin
the
Nes
tle-
Pu
rin
aco
lon
y(p
edig
ree
1);
all
oth
erlo
ciw
ere
add
itio
nal
lyge
no
typ
edin
ped
igre
e2
and
refl
ect
cum
ula
tive
LO
Dsc
ore
sfr
om
the
two
ped
igre
es.
dP
osi
tio
nin
the
do
mes
tic
cat
wh
ole
gen
om
ese
qu
ence
asse
mb
lyas
visu
aliz
edin
the
GA
RF
IEL
Db
row
ser
(Po
nt
iu
san
dO
’B
rien
2007
)(h
ttp
://lg
d.a
bcc
.nci
fcrf
.go
v/cg
i-bin
/gb
row
se/
cat)
.eC
olu
mn
s8
and
9sh
ow
the
po
siti
on
sin
the
hu
man
(HSA
bu
ild
36)
(htt
p://
ww
w.n
cbi.
nlm
.nih
.go
v/p
roje
cts/
map
view
/st
ats/
Bu
ild
Stat
s.cg
i?ta
xid¼
9606
&b
uil
d¼
36&
ver¼
3)an
dd
og
(CFA
bu
ild
2)(h
ttp
://w
ww
.ncb
i.n
lm.n
ih.g
ov/
pro
ject
s/m
apvi
ew/
stat
s/B
uil
dSt
ats.
cgi?
taxi
d¼
9615
&b
uil
d¼
2&ve
r¼1)
gen
om
eas
sem
bli
esfo
un
db
yB
LA
Tan
alys
isto
be
ort
ho
logo
us
tose
qu
ence
sfl
anki
ng
the
resp
ecti
ved
om
esti
cca
tm
arke
rs.
Mapping Mammalian Pattern Formation Genes 271
TA
BL
E2
Lin
kag
em
app
ing
of
the
do
mes
tic
cat
Tic
ked
locu
s
Mar
kera
Cat
chr.
GL
map
po
siti
on
b
RH
map
po
siti
on
bP
eak
LO
Dc
Qo
fp
eakc
Po
siti
on
inG
AR
FIE
LD
(sta
rt)d
Hsa
36(s
tart
)eC
fa2
(sta
rt)e
FC
A52
2B
147
.919
7.8
11.3
90.
09B
1:20
,954
,176
Ch
r8:
12,8
86,5
56C
hr
16:
39,3
95,5
06F
CA
519
B1
60.2
247.
211
.60
0.05
B1:
26,4
80,8
00C
hr
8:32
,537
,942
Ch
r16
:34
,857
,499
Ch
rB1_
3613
7001
B1
14.3
60.
05B
1:36
,137
,001
Ch
r8:
25,3
48,2
88C
hr
25:
35,0
09,9
43C
hrB
1_38
6979
12B
17.
530.
03B
1:38
,697
,912
Ch
r8:
23,1
91,7
20C
hr
25:
37,1
92,5
02C
hrB
1_38
9765
63B
120
.32
0B
1:38
,976
,563
Ch
r8:
22,7
66,5
23C
hr
25:
37,4
35,6
25C
hrB
1_39
4011
13B
119
.41
0B
1:39
,401
,113
Ch
r8:
22,4
00,7
23C
hr
25:
37,7
74,5
01C
hrB
1_39
6654
80B
112
.34
0B
1:39
,665
,480
Ch
r8:
22,1
51,1
40C
hr
25:
38,0
10,3
13C
hrB
1_39
8738
03B
118
.52
0B
1:39
,873
,803
Ch
r8:
21,9
63,5
51C
hr
25:
38,1
77,1
22C
hrB
1_40
1832
01B
111
.53
0B
1:40
,183
,201
Ch
r8:
21,6
46,1
42C
hr
25:
38,4
63,1
67C
hrB
1_41
2542
04B
116
.10
0B
1:41
,254
,204
Ch
r8:
20,6
06,4
66C
hr
25:
39,3
90,3
44C
hrB
1_41
7010
42B
116
.40
0B
1:41
,701
,042
Ch
r8:
20,1
98,0
53C
hr
25:
39,7
62,2
12C
hrB
1_41
7728
82B
117
.89
0B
1:41
,772
,882
Ch
r8:
20,1
27,6
74C
hr
25:
39,8
21,8
05C
hrB
1_41
7996
74B
110
.02
0B
1:41
,799
,674
Ch
r8:
20,1
04,1
02C
hr
25:
39,8
46,7
68C
hrB
1_41
8291
03B
117
.00
0B
1:41
,829
,103
Ch
r8:
20,0
85,5
89C
hr
25:
39,8
70,8
73C
hrB
1_42
0606
27B
12.
860
B1:
42,0
60,6
27C
hr
8:19
,843
,732
Ch
r25
:40
,092
,520
FC
A55
9B
138
1.0
17.3
30
un
kno
wn
Ch
r8:
19,5
46,8
37C
hr
16:
25,3
88,7
99C
hrB
1_53
2771
93B
118
.77
0B
1:53
,277
,193
Ch
r8:
19,7
09,0
04C
hr
16:
25,5
55,0
47C
hrB
1_53
3559
16B
113
.86
0B
1:53
,355
,916
Ch
r8:
43,1
20,8
43C
hr
16:
25,6
23,4
85C
hrB
1_53
5810
31B
114
.81
0.02
B1:
53,5
81,0
31C
hr
8:42
,881
,429
Ch
r16
:25
,839
,630
CFA
16:2
9.97
B1
14.0
90.
03u
nkn
ow
nC
hr
8:38
,458
,010
Ch
r16
:29
,972
,613
FC
A23
B1
83.6
463.
311
.90
0.05
Un
:77
,729
,549
Ch
r8:
31,3
07,6
18C
hr
16:
32,7
06,5
03F
CA
809
B1
84.5
476.
712
.43
0.05
B1:
68,6
57,0
50C
hr
8:27
,646
,753
Ch
r25
:32
,866
,052
FC
A81
1B
184
.548
8.6
1.15
0.10
B1:
68,3
91,0
21C
hr
8:27
,433
,306
Ch
r25
:33
,063
,420
FC
A70
0B
110
8.1
571.
97.
240.
10B
1:74
,811
,696
Ch
r8:
174,
967,
845
Ch
r25
:27
,356
,441
aM
arke
rsar
esh
ow
nin
gen
om
ico
rder
alo
ng
the
do
mes
tic
cat
chro
mo
som
eB
1,o
nth
eb
asis
of
the
mo
stre
cen
tge
net
icli
nka
ge(G
L)
(Men
ot
ti-R
ay
mo
nd
etal
.20
09)
and
rad
iati
on
hyb
rid
(RH
)(D
av
is
etal
.20
09)
map
s.M
arke
rsw
ith
pre
fix
‘‘ch
rB1’
’re
pre
sen
tlo
cith
atw
ere
dev
elo
ped
for
fin
em
app
ing
afte
rm
ult
ipo
int
lin
kage
anal
ysis
dem
on
-st
rate
dth
atF
CA
23an
dF
CA
519
flan
ked
the
Tic
ked
inte
rval
.bP
osi
tio
ns
of
mar
kers
wit
ha
bla
nk
inth
ese
colu
mn
sw
ere
no
td
eter
min
edin
tho
seve
rsio
ns
of
the
RH
or
GL
map
s.cP
eak
LO
Dsc
ore
and
esti
mat
edre
com
bin
atio
nfr
acti
on
(u)
for
lin
kage
bet
wee
nea
chp
oly
mo
rph
icm
arke
ran
dth
eT
icke
dlo
cus.
dP
osi
tio
nin
the
do
mes
tic
cat
wh
ole
gen
om
ese
qu
ence
asse
mb
lyas
visu
aliz
edin
the
GA
RF
IEL
Db
row
ser
(Po
nt
iu
san
dO
’B
rien
2007
).‘‘U
n’’
refe
rsto
ase
qu
ence
blo
cku
nas
sign
edto
ach
rom
oso
me.
eC
olu
mn
s8
and
9sh
ow
the
po
siti
on
sin
the
hu
man
(HSA
bu
ild
36)
(htt
p://
ww
w.n
cbi.
nlm
.nih
.go
v/p
roje
cts/
map
view
/st
ats/
Bu
ild
Stat
s.cg
i?ta
xid¼
9606
&b
uil
d¼
36&
ver¼
3)an
dd
og
(CFA
bu
ild
2)(h
ttp
://w
ww
.ncb
i.n
lm.n
ih.g
ov/
pro
ject
s/m
apvi
ew/
stat
s/B
uil
dSt
ats.
cgi?
taxi
d¼
9615
&b
uil
d¼
2&ve
r¼1)
gen
om
eas
sem
bli
esfo
un
db
yB
LA
Tan
alys
isto
be
ort
ho
logo
us
tose
qu
ence
sfl
anki
ng
the
resp
ecti
ved
om
esti
cca
tm
arke
rs.
272 E. Eizirik et al.

Since our results seem to be discrepant with thosepresented by Lyons et al. (2006), who reported themapping of Tabby to the same location that we havedefined as the Ticked locus, we offer the following clari-fication. Lyons et al. (2006) mapped Tabby under theassumption that a single locus was responsible for allcoat pattern phenotypes in the domestic cat. Their uti-lization of a single pedigree that segregated for all butfour meiotic events for the ticked phenotype identifiedthe B1 locus that we report here to be responsible forthe alleles TiA (Abyssinian) and Ti1 (non-Abyssinian),and have elected to call the Ticked locus. The results ofthe two studies are therefore congruent, but we showthat two different genetic loci are implicated in thisparticular set of coat patterning variants. In this context,we point out that the name Tabby should be appliedto the locus on A1, which specifies the mackerel andblotched alleles, as these phenotypes are classically iden-tified with the Tabby locus.
In Table S3, we list all the human genes (humangenome build 36.3) located in the syntenic segmentscorresponding to the Tabby and Ticked linkage intervals.For the case of Tabby, we noted that the interval in-cludes the gene AP3S1, which may be a good candidatesince the AP3 complex transports pigment and thegene AP3B1, encoding another protein in this com-plex, is mutated in the hypopigmentation-inducingHermansky-Pudlak syndrome type 2 (Dell’Angelica
et al. 1997). Another possible candidate gene for Tabby,TYRP1, is involved in dog coat color phenotypes(Schmutz et al. 2002; Cargill et al. 2005) and mapsto dog chromosome 11, 20 Mb distal from the conservedsyntenic canine interval identified in Table 1. However,in the domestic cat TYRP1 has been mapped to chro-mosome D4, and is associated with brown and cinnamoncoat color phenotypes (Lyons et al. 2005; Schmidt-Kuntzel et al. 2005), and not to patterning traits suchas Tabby. Even though the actual genes correspondingto Tabby and Ticked have not been identified at themolecular level, the clarification that multiple loci areinvolved and the delimitation of two implicated regionsenable the design of detailed studies targeting the iden-
tification and characterization of these loci and theirfunctions.
We hypothesize that mammalian patterned coats areformed by two distinct processes: (i) a spatially orienteddevelopmental mechanism that lays down a species-specific pattern of skin cell differentiation; and (ii) apigmentation-oriented mechanism that uses informa-tion from the preestablished pattern to regulate thesynthesis of particular melanin profiles. Our results, incombination with phenotype-based observations, indi-cate that the Tabby locus is involved in establishing theshape of the pattern (process ‘‘i’’ above), and so are themodifier loci that produce a spotted coat. The Tickedlocus may control process ‘‘ii’’ defined above, i.e., thecoupling between pigmentation pathways and thepreexisting pattern laid down by Tabby, so that variantsmay exhibit differing amounts of pigmentation on thecoat areas destined to be spots or stripes. As an alter-native hypothesis, however, the Ticked locus may also beinvolved in process i, affecting the shape of markings, byleading to progressively thinner and more numerousstripes that lead them to ‘‘disappear’’ amid the agoutibanding of individual hairs. This idea fits the observa-tion of very thin but discernible flank stripes in hetero-zygous animals TiA/Ti1.
The logic behind this two-step process stems fromobservations such as the following: (a) coat patterns arespecies specific, with instances of intraspecific poly-morphism that also seem to be heritable; (b) manyvariants affect the spatial conformation of the pattern(process i), but do not seem to affect the mechanismthat ‘‘reads’’ this pattern to promote differential pig-mentation (process ii) (e.g., the case of the domestic catmackerel and blotched variants); (c) conversely, thereare variants that affect pigmentation pathways (e.g., X-linked Orange in domestic cats; Schmidt-Kuntzel et al.2009; melanism in several species) but do not changethe underlying pattern, which remains constant andoften visible in a different color; (d) the instructions toproduce darker pigment on stripes/spots overrides thedorsal-ventral patterning often seen on mammaliancoats (e.g., the black stripes present on the whitish tiger
TABLE 3
Summary of dominance and epistasis relationships leading to genotype–phenotype correspondence at thedomestic cat pattern-forming loci Ticked and Tabby (see text for details)
Composite genotypes at the Ticked (Ti)and Tabby (Ta) loci Resulting phenotype
TiA/TiA; __/__ Abyssinian or ‘‘ticked’’ (plain agouti coat)TiA/Ti1; __/__ Banded legs and tail, along with faint body
stripes on an otherwise plain agouti coatTi1/Ti1; TaM/__ Mackerel tabby (vertically striped pattern)a
Ti1/Ti1; tab/tab Blotched tabby (circular markings and broad stripes)
a One or more modifier genes transform the ‘‘mackerel’’ striping into a ‘‘spotted’’ pattern (previously attrib-uted to the TS allele in the classical single-locus model).
Mapping Mammalian Pattern Formation Genes 273

ventrum); and (e) two felids [lion (Panthera leo) and puma(Puma concolor)] exhibit a developmentally regulatedfading of body markings, which are present in juvenilesand essentially disappear in adults. The latter observa-tion suggests that it is process ii that is developmentallyregulated, gradually decoupling the pigmentation path-ways from the underlying pattern (which was evidentlyformed in the juvenile). Many such comparisons arepossible within and among the extant 37 felid species,highlighting the potential of this mammalian family as amodel for investigating the evolutionary genetics of coatpattern formation. Although the understanding of themolecular basis of this phenomenon is still in its infancy,we propose that comparative genetic analyses of thedomestic cat and its wild relatives hold promise forunraveling these complex and potentially revealingdevelopmental pathways for mammals in general.
We thank Audrey Law for making available the male Egyptian Maucat used as the founder of pedigree 2, as well as Lyn Colenda and KevinJ. Cogan at the National Institutes of Health Animal Center for theirefforts in maintaining and managing pedigrees 2 and 3. We thank theNestle Purina PetCare Center and personnel for providing us withsamples of DNA, as well as assistance in phenotyping the cats frompedigree 1. We thank Marti Welch, Advanced Technology Program,SAIC, Frederick, MD, for assistance in taking photographs. Weadditionally thank the Frederick County Animal Control Center,Frederick, MD, which allowed us to take photographs of a mackerelcat. David Wells, Ali Wilkerson, Jan Martenson, and William Murphyassisted with various aspects of project design and execution. Thisresearch was supported in part by the Intramural Research Program ofthe National Institutes of Health (NIH), National Cancer Institute(NCI), and National Library of Medicine. This project has beenfunded in whole or in part with federal funds from the NCI and NIHunder contract N01-CO-12400. The content of this publication doesnot necessarily reflect the views or policies of the Department ofHealth and Human Services, nor does mention of trade names,commercial products, or organizations imply endorsement by theUnited States government.
LITERATURE CITED
Boutin-Ganache, I., M. Raposo, M. Raymond and C. F. Deschepper,2001 M13-tailed primers improve the readability and usabilityof microsatellite analyses performed with two different allele-siz-ing methods. Biotechniques 31: 24–26, 28.
Candille, S. I., C. B. Kaelin, B. M. Cattanach, B. Yu, D. A. Thompson
et al., 2007 A B-defensin mutation causes black coat color in do-mestic dogs. Science 318: 1418–1423.
Cargill, E. J., T. R. Famula, R. D. Schnabel, G. M. Strain and K. E.Murphy, 2005 The color of a Dalmatian’s spots: linkage evi-dence to support the TYRP1 gene. BMC Vet. Res. 1: 1.
Cott, H. B., 1940 Adaptive Coloration in Animals. Methuen, London.Davis, B. W., T. Raudsepp, A. J. Pearks Wilkerson, R. Agarwala,
A. A. Schaffer et al., 2009 A high-resolution cat radiation hy-brid and integrated FISH mapping resource for phylogenomicstudies across Felidae. Genomics 93: 299–304.
Dell’Angelica, E. C., C. E. Ooi and J. S. Bonifacino, 1997 b3A-adaptin, a subunit of the adaptor-like complex AP-3. J. Biol.Chem. 272: 15078–15084.
Eizirik, E., N. Yuhki, W. E. Johnson, M. Menotti-Raymond, S. S.Hannah et al., 2003 Molecular genetics and evolution of mela-nism in the cat family. Curr. Biol. 13: 1–20.
Fishelson, M., and D. Geiger, 2002 Exact genetic linkage compu-tations for general pedigrees. Bioinformatics 18(Suppl 1): S189–S198.
Fishelson, M., and D. Geiger, 2004 Optimizing exact genetic link-age computations. J. Comput. Biol. 11: 263–275.
Gompel, N., B. Prud’homme, P. J. Wittkopp, V. A. Kassner and S. B.Carroll, 2005 Chance caught on the wing: cis-regulatory evo-lution and the origin of pigment patterns in Drosophila. Nature433: 481–487.
Ishida, Y., V. A. David, E. Eizirik, A. A. Schaffer, B. A. Neelam et al.,2006 A homozygous single-base deletion in MLPH causes thedilute coat color phenotype in the domestic cat. Genomics 88:698–705.
Iwashita, M., M. Watanabe, M. Ishii, T. Chen, S. L. Johnson et al.,2006 Pigment pattern in jaguar/obelix zebrafish is caused by aKir7.1 mutation: implications for the regulation of melanosomemovement. PLoS Genet. 2: 1861–1870.
Joron, M., C. D. Jiggins, A. Papanicolaou and W. O. McMillan,2006a Heliconius wing patterns: an evo-devo model for under-standing phenotypic diversity. Heredity 97: 157–167.
Joron, M., R. Papa, M. Beltran, N. Chamberlain, J. Mavarez et al.,2006b A conserved supergene locus controls colour pattern di-versity in Heliconius butterflies. PLoS Biol. 4: 1831–1840.
Kehler, J. S., V. A. David, A. A. Schaffer, E. Eizirik, D. K. Ryugo
et al., 2007 Four separate mutations in the feline FibroblastGrowth Factor 5 gene determine the long-haired phenotype in do-mestic cats. J. Hered. 98: 555–566.
Kerns, J. A., E. J. Cargill, L. A. Clark, S. I. Candille, T. G. Berryere
et al., 2007 Linkage and segregation analysis of black and brin-dle coat color in domestic dogs. Genetics 176: 1679–1689.
Lomax, T. D., and R. Robinson, 1988 Tabby pattern alleles of thedomestic cat. J. Hered. 79: 21–23.
Lorimer, H. E., 1995 Variations on the theme or how to paint a cat,pp. 193–200 in The Cat Fanciers’ Association, Inc. Yearbook. The CatFanciers’ Association, Inc., Manasquan, NJ.
Lyons, L. A., I. T. Foe, H. C. Rah and R. A. Grahn, 2005 Chocolatecoated cats: TYRP1 mutations for brown color in domestic cats.Mamm. Genome 16: 356–366.
Lyons, L. A., S. J. Bailey, K. C. Baysac, G. Byrns, C. A. Erdman et al.,2006 The Tabby cat locus maps to feline chromosome B1. Anim.Genet. 37: 383–386.
Menotti-Raymond, M., V. A. David, M. E. Roelke, Z. Q. Chen, K. A.Menotti et al., 2003 Second-generation integrated geneticlinkage/radiation hybrid maps of the domestic cat (Felis catus).J. Hered. 94: 95–106.
Menotti-Raymond, M., V. A. David, A. A. Schaffer, R. Stephens,D. Wells et al., 2007 Mutation in CEP290 discovered forcat model of human retinal degeneration. J Hered 98: 211–220.
Menotti-Raymond, M., V. A. David, A. A. Schaffer, J. F. Tomlin,E. Eizirik et al., 2009 An autosomal genetic linkage map ofthe domestic cat, Felis silvestris catus. Genomics 93: 305–313.
Menotti-Raymond, M. A., V. A. David, L. L. Wachter, J. M. Butler
and S. J. O’Brien, 2005 An STR forensic typing system for ge-netic individualization of domestic cat (Felis catus) samples.J. Forensic Sci. 50: 1061–1070.
Murphy, W. J., B. Davis, V. A. David, R. Agarwala, A. A. Schaffer
et al., 2007 A 1.5-Mb-resolution radiation hybrid map of the catgenome and comparative analysis with the canine and humangenomes. Genomics 89: 189–196.
Murray, J. D., and G. F. Oster, 1984 Generation of biological pat-tern and form. IMA J. Math. Appl. Med. Biol. 1: 51–75.
Ortolani, A., and T. M. Caro, 1996 The adaptive significanceof color patterns in carnivores: phylogenetic test of classichypotheses, pp. 132–188 in Carnivore Behavior, Ecology and Evo-lution, edited by J. L. Gittleman. Cornell University Press,New York.
Oyehaug, L., E. Plahte, D. I. Vage and S. W. Omholt, 2002 Theregulatory basis of melanogenic switching. J. Theor. Biol. 215:449–468.
Parchem, R. J., M. W. Perry and N. H. Patel, 2007 Patterns on theinsect wing. Curr. Opin. Genet. Dev. 17: 300–308.
Pontius, J. U., J. C. Mullikin, D. R. Smith, A. S. Team, K. Lindblad-Toh et al., 2007 Initial sequence and comparative analysis of thecat genome. Genome Res. 17: 1675–1689.
Pontius, J. U., and S. J. O’Brien, 2007 Genome Annotation Re-source Fields–GARFIELD: A Genome Browser for Felis catus.J. Hered. 98: 386–389.
274 E. Eizirik et al.

Prud’homme, B., N. Gompel, A. Rokas, V. A. Kassner, T. M.Williams et al., 2006 Repeated morphological evolution throughcis-regulatory changes in a pleiotropic gene. Nature 440: 1050–1053.
Robinson, R., 1958 Mosaicism in mammals. Genetica 29: 120–145.Rozen, S., and H. Skaletsky, 2000 Primer3 on the WWW for gen-
eral users and for biologist programmers. Methods Mol. Biol.132: 365–386.
Schmidt-Kuntzel, A., E. Eizirik, S. J. O’Brien and M. Menotti-Raymond, 2005 Tyrosinase and tyrosinase related protein 1 allelesspecify domestic cat coat color phenotypes of the albino and brownloci. J. Hered. 96: 289–301.
Schmidt-Kuntzel, A., G. Nelson, V. A. David, A. A. Schaffer, E.Eizirik et al., 2009 A domestic cat X-chromosome linkagemap and the sex-linked orange locus- mapping of orange, multipleorigins, and epistasis over non-agouti. Genetics 181: 1415–1425.
Schmutz, S. M., T. G. Berryere and A. D. Goldfinch, 2002 TYRP1and MC1R genotypes and their effects on coat color in dogs.Mamm. Genome 13: 380–387.
Schug, M. D., C. M. Hutter, K. A. Wetterstrand, M. S. Gaudette,T. F. Mackay et al., 1998 The mutation rates of di-, tri- andtetranucleotide repeats in Drosophila melanogaster. Mol. Biol.Evol. 15: 1751–1760.
Searle, A. G., 1968 Comparative Genetics of Coat Color in Mammals.Logos Press, London.
Svetic, V., G. E. Hollway, S. Elworthy, T. R. Chipperfield,C. Davison et al., 2007 Sdf1a patterns zebrafish melanophoresand links the somite and melanophore pattern defects in chokermutants. Development 134: 1011–1022.
Watanabe, M., M. Iwashita, M. Ishii, Y. Kurachi, A. Kawakami
et al., 2006 Spot pattern of leopard Danio is caused by muta-tion in the zebrafish connexin41.8 gene. EMBO Rep. 7: 893–897.
Communicating editor: D. W. Threadgill
Mapping Mammalian Pattern Formation Genes 275

Supporting Information http://www.genetics.org/cgi/content/full/genetics.109.109629/DC1
Defining and Mapping Mammalian Coat Pattern Genes: Multiple Genomic Regions Implicated in Domestic Cat Stripes and Spots
Eduardo Eizirik, Victor A. David, Valerie Buckley-Beason, Melody E. Roelke, Alejandro A. Schäffer, Steven S. Hannah, Kristina Narfström, Stephen J. O'Brien
and Marilyn Menotti-Raymond
Copyright © 2009 by the Genetics Society of America DOI: 10.1534/genetics.109.109629

E. Eizirik et al. 2 SI
TABLE S1
Primers used for fine-mapping of the Ticked and Tabby loci
Ticked locus
Marker Repeat* Product Size (bp) Forward Primer Reverse Primer
chrB1_36137001 TG(18) 181 TAAACATGAGGGGTGCCAGT CGGATTTTCAACTGCACAGA
chrB1_38697912 GATA(11) 243 AAACAAAGGAAAACATGAAACTG GGGAGATCTGCAGCTACTTGA
chrB1_38976563 CA(22) 171 TACCTGGAATCATGCGTTGA CCTGAATCCAGAGACGATGAG
chrB1_39401113 TC(21) 160 GGTTCATGAAATCAACCTCCA GAGAAAGGGCTAAAGGGGATT
chrB1_39665480 GA(20) 176 CACCCAAACTTTTGATGTTCC CCTGGAGCCTGTTTCAGATT
chrB1_39873803 GT(20) 248 GGCATGGTAGCTGTCAAGGT GGGGGATGGTCTACTGGTCT
chrB1_40183201 GT(22) 202 TTGGCTGAATTCTCTCACCC ACATAACCATCCTCCCCACA
chrB1_41254204 AC(20) 224 TGATCGAAGCATACAAGGCA GTGGAACTGGTGGAGGTGTT
chrB1_41701042 AC(24) 320 CCAGTACCTGGAACAAAGGC AATGCCATGGAGAGACCAAC
chrB1_41772882 AC(18) 176 AAAATTGTGATGGTCGCACA GGTCATGCAGGAGAATGGTT
chrB1_41799674 GA(16) 169 GGTGGGGGTGAGGATCTAGT GCCTGCTTTGGATTCTGTGT
chrB1_41829103 GA(19) 209 TCAGGATCTTGAGATGGAGGA AGTTTCTTGGCTTGCAGCTC
chrB1_42060627 CA(13) 301 GGTGAAGAAATGGGCAAAAG CCATTCGATTTGGTTTTTGG
chrB1_53277193 AAG(18) 309 TGTGCTGAGTATGGAGCCTG TTTGGACCATCTTGGGTTGT
chrB1_53355916 AC(21) 234 ATGCCTGCCCTCTAAGGTTC AGTCCCCGTACACACAGGAC
chrB1_53581031 AC(18) 224 AACAAATCCCTGCCTCTGTG CAGTGAGGCCTTCTCTGACC
CFA16:29.97 AC(31) 233 TGAATCAACACCTAGGCCATT GGACACCCCTAAGTGACACG
Tabby locus
Marker Repeat Product Size (bp) Forward Primer Reverse Primer
Hsa5:179.47 TG(14) 250 GCTTCCCCTTGGACACAGTA TGGAGAAAAGATGCCTCAGC
FLT4 GA(15) 228 CTGTTGTCCTCTCTCTGCCC TCAACACAGAGCCCTACACG
Hsa5:178.67 CA(15) 247 CAATGCATTCTCACACTTGC TGGACTCAGGAACACAGTGC
Col23A1 AAAC(6) 226 TGGAGCCTGCTTGAAACTCT TCATCCTGCCACCCTCTTAC
YTHDC2 CA(26) 208 AAAAAGCCACTGGGGAAACT TCCTTGCGTTTTTGGATTTC
Cfa11:7.68 TTCT(14) 247 CCTGAAGCCCAGTGGAACTA CCCCTGTGCTGAATTCTTTC
Hsa5- 116.83 CA(18) 195 CCACGTCAAGCTCTGCATT GCCAGCCTGGACATAAACAT
Hsa-5- 118.59 GT(21) 250 TGTTCAGTTGGTTCTTTCTGGA AAGCCCCCAGATTTTACTCA
Hsa5-118.72 CT(10) 231 TGGGCTCTGTGCTGACAGT CGGCTCTGATCTCTGAGGAC
Cfa11:11.26 CA(22) 224 ATAACTGGTGCCCATTCCTG TGCTGTAGAGGCTATCCAGATG
Cfa11:12.55 GT(18) 201 AAGCATGAAATCAACCTTTGTG CTGTTGCCTGTTAGGTGAAAGA
* Indicates number of repeat units in the microsatellite that produces a PCR product specified in column 3.
E. Eizirik et al. 3 SI
TABLE S2
Exclusion mapping of the Ticked locus to the Tabby genomic region
V a l u e s o f θ
Marker Cat Chr.
Cat RH
Map
Position 0.05 0.1 0.15 0.2 0.25 0.3 0.35 0.4
FCA083 A1 1051.5 -24.55 -15.09 -9.93 -6.59 -4.27 -2.63 -1.48 -0.73
FCA1054 A1 954.8 -15.65 -9.07 -5.56 -3.33 -1.84 -0.84 -0.21 0.12
FCA566* A1 755.7 -11.11 -5.81 -3.07 -1.43 -0.4 0.19 0.46 0.48
Hsa5:179.47* A1 -12.09 -6.46 -3.53 -1.73 -0.58 0.12 0.48 0.57
* With demonstrated linkage to the Tabby locus (see Table 1)
Note: LOD scores obtained from genomic mapping of Ticked pedigree to markers with demonstrated linkage to the Tabby region (see Table 1). The marker with prefix “Hsa” was developed for fine mapping of the Tabby locus (Table 1) and was not mapped in the cat RH map [DAVIS et al. 2009]. LOD scores are presented for multiple values of recombination fraction (θ ) with respect to the Ticked locus.
E. Eizirik et al. 4 SI
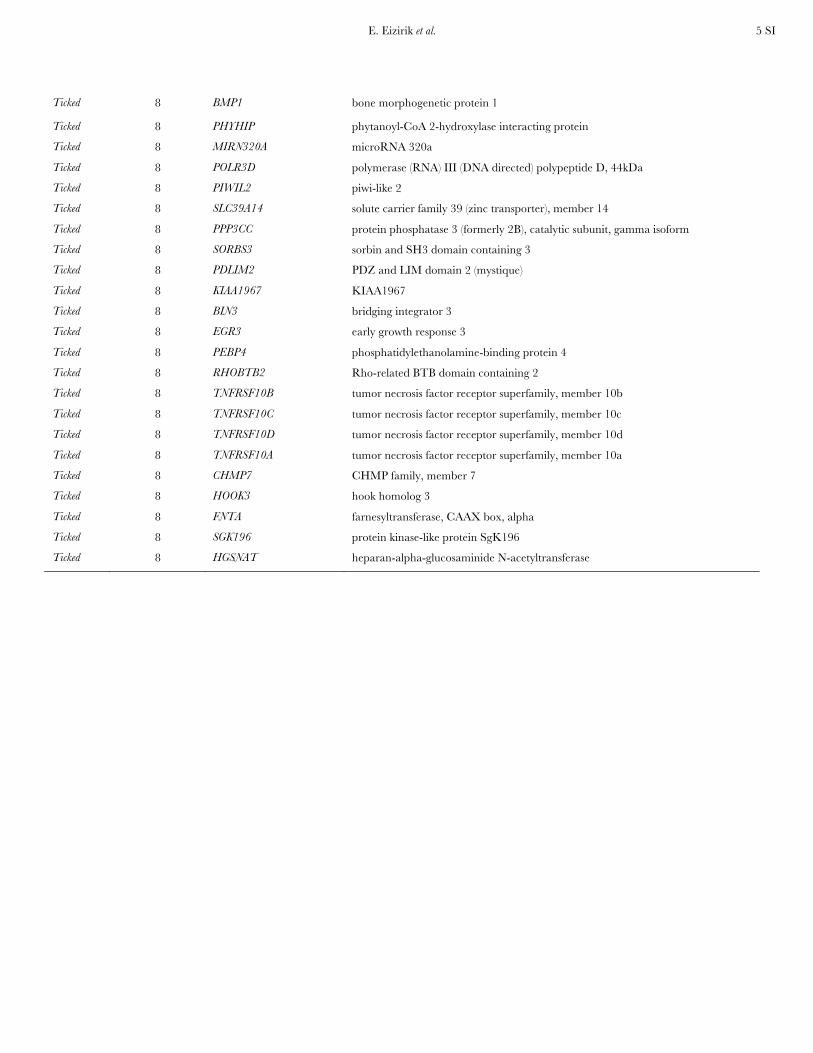
TABLE S3
Human genes from genome build 36.3 that may be located in the segments syntenic to the linkage intervals for the Tabby and
Ticked loci.
Locus Human Chr. Gene Symbol Gene Name
Tabby 5 YTHDC2 YTH domain containing 2
Tabby 5 KCNN2 potassium intermediate/small conductance calcium-activated channel, subfamily
N, member 2
Tabby 5 TRIM36 tripartite motif-containing 36
Tabby 5 PGGT1B protein geranylgeranyltransferase type I, beta subunit
Tabby 5 CCDC112 coiled-coil domain containing 112
Tabby 5 FEM1C fem-1 homolog c
Tabby 5 TICAM2 toll-like receptor adaptor molecule 2
Tabby 5 TMED7 transmembrane emp24 protein transport domain containing 7
Tabby 5 CDO1 cysteine dioxygenase, type I
Tabby 5 ATG12 autophagy related 12 homolog
Tabby 5 AP3S1 adaptor-related protein complex 3, sigma 1 subunit
Tabby 5 LVRN laeverin
Tabby 5 COMMD10 COMM domain containing 10
Tabby 5 SEMA6A sema domain, transmembrane domain (TM), and cytoplasmic domain,
(semaphorin) 6A
Tabby 5 DTWD2 DTW domain containing 2
Tabby 5 DMXL1 DMX-like 1
Ticked 8 INTS10 integrator complex subunit 10
Ticked 8 LPL lipoprotein lipase
Ticked 8 SLC18A1 solute carrier family 18 (vesicular monoamine), member 1
Ticked 8 ATP6V1B2 ATPase, H+ transporting, lysosomal 56/58kDa, V1 subunit B2
Ticked 8 LZTS1 leucine zipper, putative tumor suppressor 1
Ticked 8 GFRA2 GDNF family receptor alpha 2
Ticked 8 DOK2 docking protein 2, 56kDa
Ticked 8 XPO7 exportin 7
Ticked 8 NPM2 nucleophosmin/nucleoplasmin, 2
Ticked 8 FGF17 fibroblast growth factor 17
Ticked 8 EPB49 erythrocyte membrane protein band 4.9 (dematin)
Ticked 8 FAM160B2 family with sequence similarity 160, member B2
Ticked 8 NUDT18 nudix (nucleoside diphosphate linked moiety X)-type motif 18
Ticked 8 HR hairless homolog
Ticked 8 REEP4 receptor accessory protein 4
Ticked 8 LGI3 leucine-rich repeat LGI family, member 3
Ticked 8 SFTPC surfactant protein C
E. Eizirik et al. 5 SI
Ticked 8 BMP1 bone morphogenetic protein 1
Ticked 8 PHYHIP phytanoyl-CoA 2-hydroxylase interacting protein
Ticked 8 MIRN320A microRNA 320a
Ticked 8 POLR3D polymerase (RNA) III (DNA directed) polypeptide D, 44kDa
Ticked 8 PIWIL2 piwi-like 2
Ticked 8 SLC39A14 solute carrier family 39 (zinc transporter), member 14
Ticked 8 PPP3CC protein phosphatase 3 (formerly 2B), catalytic subunit, gamma isoform
Ticked 8 SORBS3 sorbin and SH3 domain containing 3
Ticked 8 PDLIM2 PDZ and LIM domain 2 (mystique)
Ticked 8 KIAA1967 KIAA1967
Ticked 8 BIN3 bridging integrator 3
Ticked 8 EGR3 early growth response 3
Ticked 8 PEBP4 phosphatidylethanolamine-binding protein 4
Ticked 8 RHOBTB2 Rho-related BTB domain containing 2
Ticked 8 TNFRSF10B tumor necrosis factor receptor superfamily, member 10b
Ticked 8 TNFRSF10C tumor necrosis factor receptor superfamily, member 10c
Ticked 8 TNFRSF10D tumor necrosis factor receptor superfamily, member 10d
Ticked 8 TNFRSF10A tumor necrosis factor receptor superfamily, member 10a
Ticked 8 CHMP7 CHMP family, member 7
Ticked 8 HOOK3 hook homolog 3
Ticked 8 FNTA farnesyltransferase, CAAX box, alpha
Ticked 8 SGK196 protein kinase-like protein SgK196
Ticked 8 HGSNAT heparan-alpha-glucosaminide N-acetyltransferase

E. Eizirik et al. 6 SI
!"#$ !"#% !"#& !"## !"%'
"''!!'%"#'(
!"&% !"#( !"#' !"#)
!'%)
!"#" !"#* !"#!
)"&"
)%%&!()! !()* !()$
)%$#
!'%"
)"&"
!"%*
)%#(
!()&
%(*
!("' !()%!()#
!!'*
#'(
!'%)
!!')!"%& !"%# !"%% !!'' !!'(
!*($!*(! !*(& !*(# !*(" !*(*
!"&& !"&#
!*'%
!'&% !'#! !'#* !'#' !'#( !'#) !'#"
FIGURE S1.—Graphic depiction of Pedigree 2, developed for this study to map the domestic cat ‘spotted’ coat color variant. Dark symbols indicate spotted or mackerel
phenotypes, while white symbols indicate blotched phenotypes. Individuals bearing both colors indicate inferred heterozygotes, all of which exhibited mackerel/spotted phenotypes. Numbers indicate the individual ID for each member of the pedigree.
E. Eizirik et al. 7 SI E. Eizirik et al. 7 SI
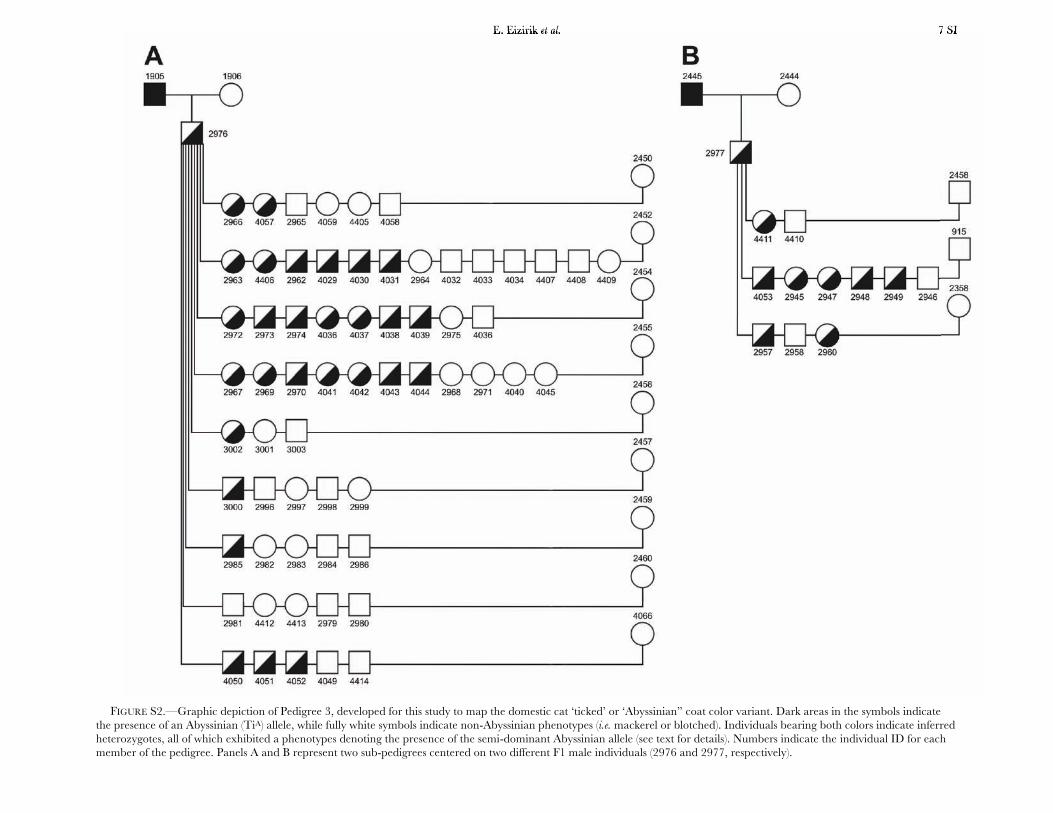
FIGURE S2.—Graphic depiction of Pedigree 3, developed for this study to map the domestic cat ‘ticked’ or ‘Abyssinian” coat color variant. Dark areas in the symbols indicate
the presence of an Abyssinian (TiA) allele, while fully white symbols indicate non-Abyssinian phenotypes (i.e. mackerel or blotched). Individuals bearing both colors indicate inferred heterozygotes, all of which exhibited a phenotypes denoting the presence of the semi-dominant Abyssinian allele (see text for details). Numbers indicate the individual ID for each member of the pedigree. Panels A and B represent two sub-pedigrees centered on two different F1 male individuals (2976 and 2977, respectively).


![[re]defining age - LeadingAge New Jersey](https://img.pdfslide.us/doc/110x75/5868e06a1a28ab5e1d8b8feb/redening-age-leadingage-new-jersey.jpg)