Embed Size (px)
Citation preview
Den Networks Ltd.
BUY
- 1 of 19 - Monday 13th August, 2012
This document is for private circulation, and must be read in conjunction with the disclaimer on the last page.
ST
OC
K P
OIN
TE
R
Target Price `210 CMP `124 FY14 PE 17.6x
Index Details We initiate coverage on Den Networks Ltd (DEN) as a BUY with a
DCF valuation based Price Objective of `210. At CMP of `124, the stock is trading at 21.5x and 17.6x its estimated earnings for FY13 & FY14 respectively, representing a potential upside of ~70% over a period of 18 months. Being the only profitable MSO with a market share of 12% and a subscriber base of 11mn, DEN is well poised to benefit from the ongoing digitization wave in the cable industry. We expect revenues to grow multifold as the LCO will no longer be able to under report the subscriber base. We expect
revenues and earnings to reach to `1,280.9 crore and `93.4 crore
in FY14 from `714.3 and `14.6 crore in FY12 respectively.
Digitization- The game changer
Digitization is expected to be the turning point for the struggling cable industry. The cable industry has been characterized by drastic under reporting of subscribers leading to substantial revenue losses not only to the broadcasters & MSO’s (Multi System Operators) but also the GoI (Government of India) in the form of lost taxation. With Digitization gradually replacing the analog distribution system, the entire universe of subscribers will now be uniquely recognized leading to a multifold jump in the paying subscribers for MSOs. This would lead to a quantum jump in the revenues for the MSOs and broadcasters, besides paving the way for the launch of higher value added services like premium content, high definition offerings and broadband services.
DEN – well poised to benefit from digitization
DEN is expected to be one of the biggest beneficiaries of this Digitization. Although the full impact of the revenue benefit would be felt FY15 onward, nevertheless in the interim, the impact on revenue and profitability is expected to be substantial. Post digitization, DEN’s entire ~11 mn subscriber base (as against the reported number of ~1.4 mn) is expected to start contributing to the revenues. We expect DEN’s subscription revenue’s to grow multifold to `853.8 crore by FY14 from `262.34 crore in FY12.
Sensex 17,633
Nifty 5,348
BSE 100 5,341
Industry Cable TV
Scrip Details
Mkt Cap (` cr) 1,638
BVPS (`) 61
O/s Shares (Cr) 13.3
Av Vol (Lacs) 0.4
52 Week H/L 130/35
Div Yield (%) 0
FVPS (`) 10.0
Shareholding Pattern
Shareholders %
Promoters 53.8
DIIs 2.5
FIIs 8.5
Public 35.2
Total 100
Den Networks. vs. Sensex
Key Financials (` in Cr)
Y/E Mar Net
Revenue EBITDA PAT EPS
EPS Growth (%)
RONW (%)
ROCE (%)
P/E (x)
EV/EBITDA (x)
2011 606.6 136.1 37.5 2.8 28.4 4.8 13.1 43.5 11.7
2012 714.3 134.0 14.6 1.1 -61.1 1.8 11.3 112.9 11.9
2013E 936.4 259.1 76.7 5.8 426.1 8.7 20.3 21.5 6.2
2014E 1280.9 308.6 93.4 7.0 21.8 9.6 21.3 17.6 5.2
- 2 of 19 - Monday 13th
August, 2012
This document is for private circulation, and must be read in conjunction with the disclaimer on the last page.
Distribution JV Media Pro to facilitate better negotiation power
In its initiative to grow through partnership, Den Network and STAR India Ltd formed STAR DEN, a strategic 50-50 Joint Venture (JV) for the distribution of TV channels and services in India. To further reinforce STAR DEN’s visibility and ensure a better negotiation power aided by a strong bouquet of channels, the company formed a JV with Zee Turner Ltd in May 2011 called Media Pro Enterprise India Private Limited. DEN is a participant in this JV through its 50 percent stake in STAR DEN.
Valuation
At a CMP of `124, the stock is trading at 21.5x and 17.6x estimated earnings for FY13
and FY14 respectively. MSO’s are expected to be the biggest beneficiaries of digitization as revenues will no longer be under declared by the MSO’s. We believe DEN with a market share of 11% and a subscriber revenue base of ~11 mn is well equipped to meet the digitization deadlines for Phase I and Phase II cities. We initiate coverage on Den Networks Limited as a BUY with a price objective of `210 representing an upside potential of ~70% over the next 18 months.
- 3 of 19 - Monday 13th
August, 2012
This document is for private circulation, and must be read in conjunction with the disclaimer on the last page.
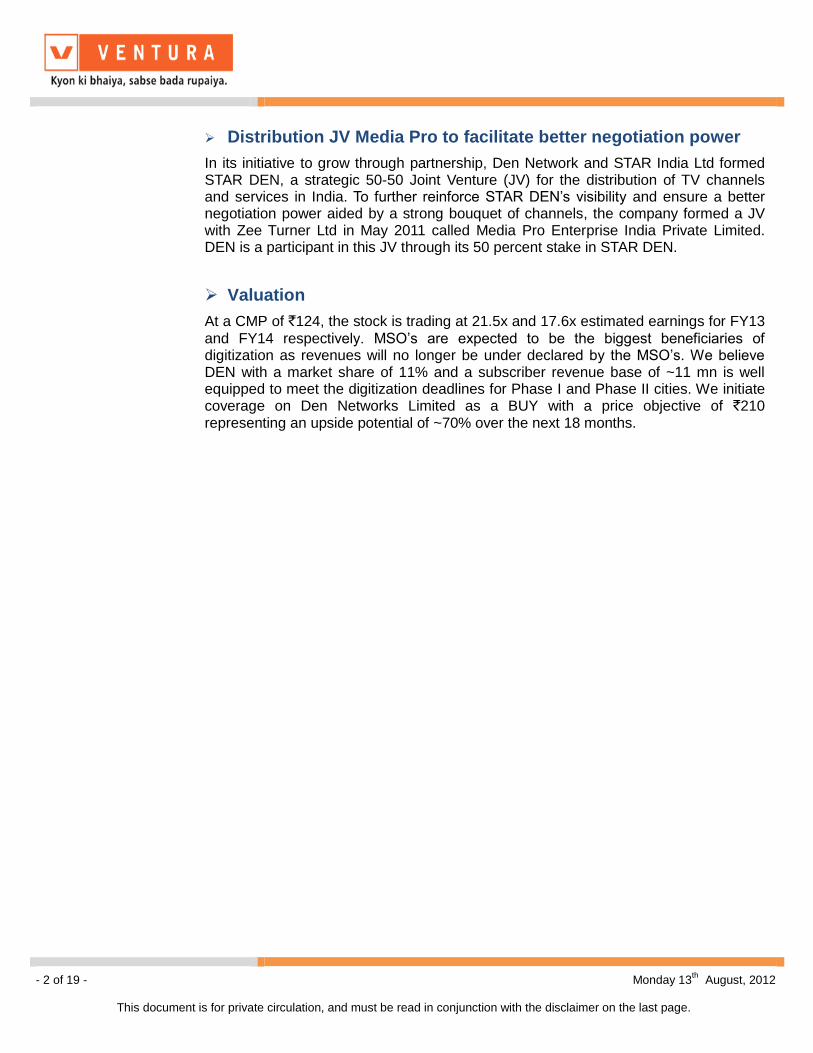
Company Background
Incorporated in 2007, Den Networks Ltd (DEN) is one of the largest Multi System Operator (MSO) in India reaching ~11 million households across 13 states and 88 cities. The company is engaged in distribution of television channels through analog and digital mode and broadband services. The company has major presence in Delhi (NCR), Uttar Pradesh, Rajasthan, Maharashtra, Gujarat, Karnataka, Haryana, Madhya Pradesh and Kerala amongst others. Presently, DEN has controlling stakes in 84 MSO’s across its markets.
Den’s Geographical Presence
Source: Den Networks, Ventura Research
Market share of various players
9%
12%
9%
9%
10%
2%
49%
Hathway Den NetworksIncable DigicableWWIL You BroadbandUnorganised Sector
Source: Den Networks, Ventura Research
Source: Industry, Ventura Research
Cable Industry in India
- 4 of 19 - Monday 13th
August, 2012
This document is for private circulation, and must be read in conjunction with the disclaimer on the last page.
Key Investment Highlights
Digitization- The game changer
Digitization is expected to be the turning point for the struggling cable industry. The cable industry has been characterized by drastic under reporting of subscribers leading to substantial revenue losses not only to the broadcasters & MSO’s (Multi System Operators) but also the GoI (Government of India) in the form of lost taxation. With Digitization gradually replacing the analog distribution system, the entire universe of subscribers will now be uniquely recognized leading to a multifold jump in the paying subscribers for MSOs. This would lead to a quantum jump in the revenues for the MSOs and broadcasters, besides paving the way for the launch of higher value added services like premium content, high definition offerings and broadband services.
Under declaration of revenues to be eliminated
Currently, the analog market is highly unorganized with over 1000 MSO’s and 60,000 LCO’s (Local Cable Operators) servicing the 146 mn strong Indian TV households. As per the existing structure of broadcasting, the content is passed on to the LCO’s by the MSO’s via cable who further distributes the channels to the consumers. This results in the LCO having singular access to the consumer and the analog system ensures that there is no way for the MSO to have a clear understanding on the number of subscribers who are enjoying its services. This has resulted in a significant under reporting of the total subscriber base leading to severe revenue leakages for not only the broadcasters and MSOs but also the exchequer. The extent of this under reporting is so large that out of the total market size of `18,000 crore, revenues to the extent of
only 15% are actually realized.
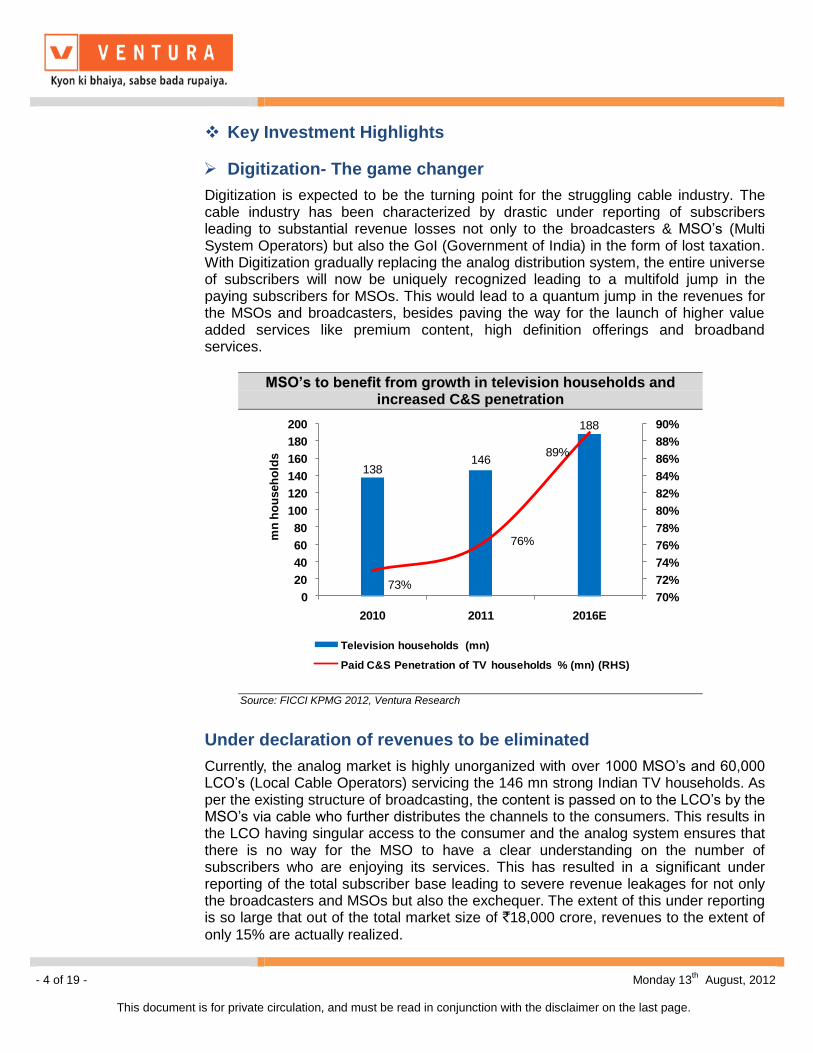
MSO’s to benefit from growth in television households and increased C&S penetration
138146
188
73%
76%
89%
70%
72%
74%
76%
78%
80%
82%
84%
86%
88%
90%
0
20
40
60
80
100
120
140
160
180
200
2010 2011 2016E
mn
ho
useh
old
s
Television households (mn)
Paid C&S Penetration of TV households % (mn) (RHS)
Source: FICCI KPMG 2012, Ventura Research
Source: Den Networks, Ventura Research
- 5 of 19 - Monday 13th
August, 2012
This document is for private circulation, and must be read in conjunction with the disclaimer on the last page.
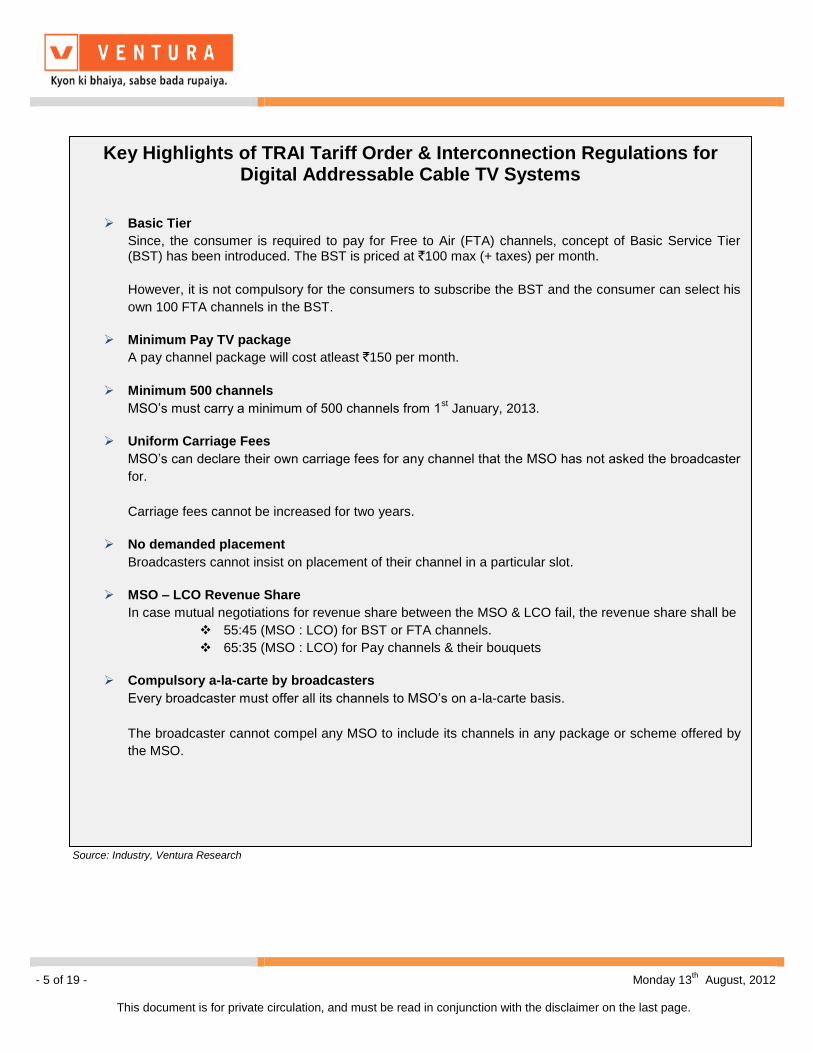
Key Highlights of TRAI Tariff Order & Interconnection Regulations for Digital Addressable Cable TV Systems
Basic Tier
Since, the consumer is required to pay for Free to Air (FTA) channels, concept of Basic Service Tier (BST) has been introduced. The BST is priced at `100 max (+ taxes) per month.
However, it is not compulsory for the consumers to subscribe the BST and the consumer can select his
own 100 FTA channels in the BST.
Minimum Pay TV package
A pay channel package will cost atleast `150 per month.
Minimum 500 channels
MSO’s must carry a minimum of 500 channels from 1st January, 2013.
Uniform Carriage Fees
MSO’s can declare their own carriage fees for any channel that the MSO has not asked the broadcaster
for.
Carriage fees cannot be increased for two years.
No demanded placement
Broadcasters cannot insist on placement of their channel in a particular slot.
MSO – LCO Revenue Share
In case mutual negotiations for revenue share between the MSO & LCO fail, the revenue share shall be
55:45 (MSO : LCO) for BST or FTA channels.
65:35 (MSO : LCO) for Pay channels & their bouquets
Compulsory a-la-carte by broadcasters
Every broadcaster must offer all its channels to MSO’s on a-la-carte basis.
The broadcaster cannot compel any MSO to include its channels in any package or scheme offered by
the MSO.
Source: Industry, Ventura Research
- 6 of 19 - Monday 13th
August, 2012
This document is for private circulation, and must be read in conjunction with the disclaimer on the last page.
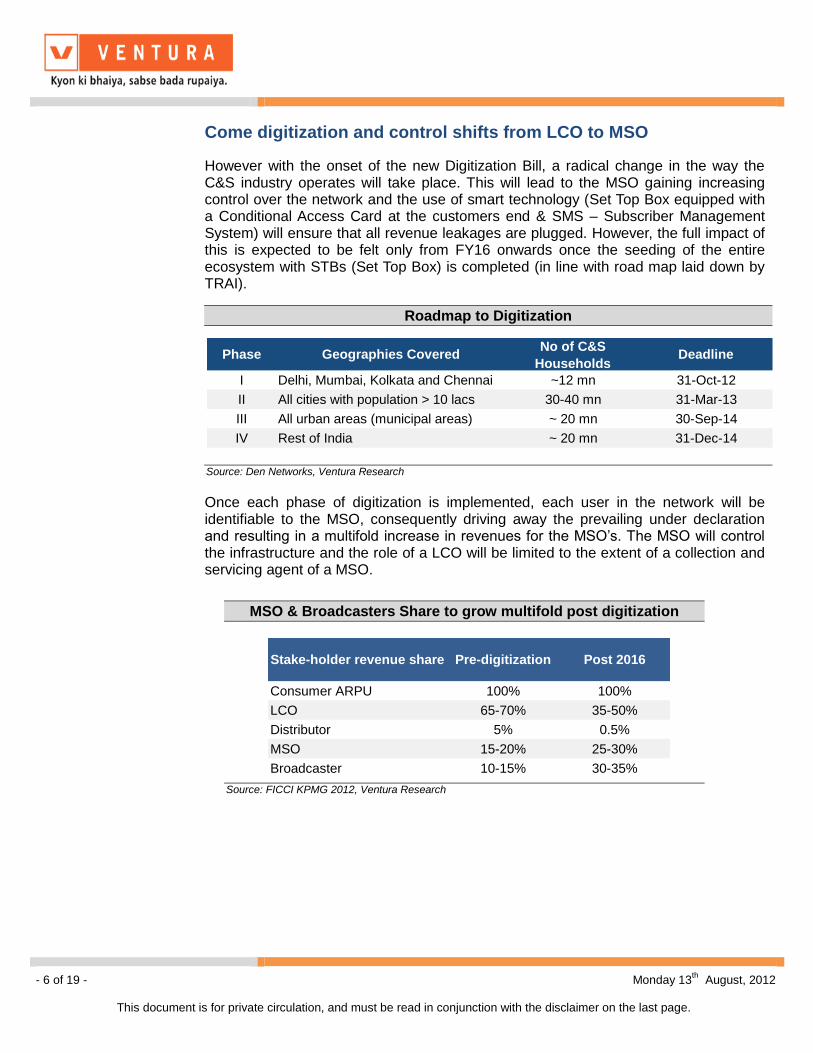
Come digitization and control shifts from LCO to MSO
However with the onset of the new Digitization Bill, a radical change in the way the C&S industry operates will take place. This will lead to the MSO gaining increasing control over the network and the use of smart technology (Set Top Box equipped with a Conditional Access Card at the customers end & SMS – Subscriber Management System) will ensure that all revenue leakages are plugged. However, the full impact of this is expected to be felt only from FY16 onwards once the seeding of the entire ecosystem with STBs (Set Top Box) is completed (in line with road map laid down by TRAI). Once each phase of digitization is implemented, each user in the network will be identifiable to the MSO, consequently driving away the prevailing under declaration and resulting in a multifold increase in revenues for the MSO’s. The MSO will control the infrastructure and the role of a LCO will be limited to the extent of a collection and servicing agent of a MSO.
Roadmap to Digitization
Phase Geographies CoveredNo of C&S
HouseholdsDeadline
I Delhi, Mumbai, Kolkata and Chennai ~12 mn 31-Oct-12
II All cities with population > 10 lacs 30-40 mn 31-Mar-13
III All urban areas (municipal areas) ~ 20 mn 30-Sep-14
IV Rest of India ~ 20 mn 31-Dec-14
Source: Den Networks, Ventura Research
MSO & Broadcasters Share to grow multifold post digitization
Stake-holder revenue share Pre-digitization Post 2016
Consumer ARPU 100% 100%
LCO 65-70% 35-50%
Distributor 5% 0.5%
MSO 15-20% 25-30%
Broadcaster 10-15% 30-35%
Source: FICCI KPMG 2012, Ventura Research
- 7 of 19 - Monday 13th
August, 2012
This document is for private circulation, and must be read in conjunction with the disclaimer on the last page.
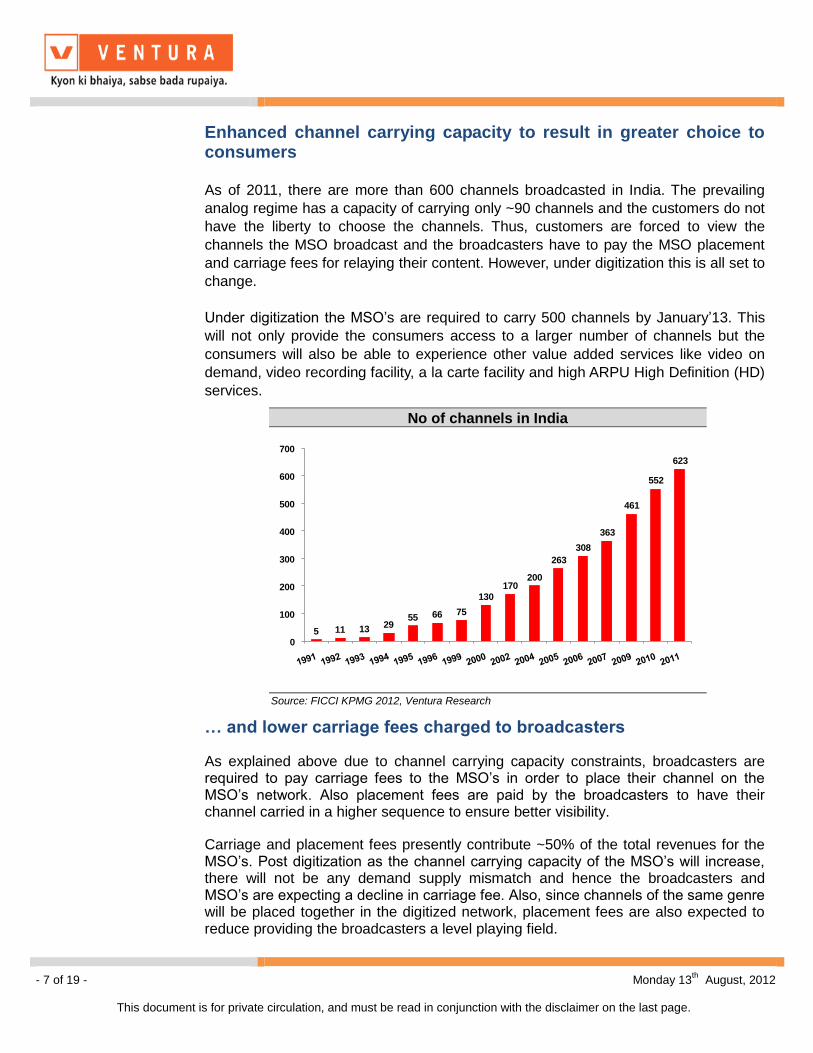
Enhanced channel carrying capacity to result in greater choice to consumers
As of 2011, there are more than 600 channels broadcasted in India. The prevailing
analog regime has a capacity of carrying only ~90 channels and the customers do not
have the liberty to choose the channels. Thus, customers are forced to view the
channels the MSO broadcast and the broadcasters have to pay the MSO placement
and carriage fees for relaying their content. However, under digitization this is all set to
change.
Under digitization the MSO’s are required to carry 500 channels by January’13. This
will not only provide the consumers access to a larger number of channels but the
consumers will also be able to experience other value added services like video on
demand, video recording facility, a la carte facility and high ARPU High Definition (HD)
services.
… and lower carriage fees charged to broadcasters
As explained above due to channel carrying capacity constraints, broadcasters are required to pay carriage fees to the MSO’s in order to place their channel on the MSO’s network. Also placement fees are paid by the broadcasters to have their channel carried in a higher sequence to ensure better visibility.
Carriage and placement fees presently contribute ~50% of the total revenues for the MSO’s. Post digitization as the channel carrying capacity of the MSO’s will increase, there will not be any demand supply mismatch and hence the broadcasters and MSO’s are expecting a decline in carriage fee. Also, since channels of the same genre will be placed together in the digitized network, placement fees are also expected to reduce providing the broadcasters a level playing field.
No of channels in India
5 11 1329
55 66 75
130
170200
263
308
363
461
552
623
0
100
200
300
400
500
600
700
Source: FICCI KPMG 2012, Ventura Research
- 8 of 19 - Monday 13th
August, 2012
This document is for private circulation, and must be read in conjunction with the disclaimer on the last page.
However, there is no consensus of opinion with regards to the movement of carriage fee in the near term. We believe that even a significant decline in carriage fees will not impact the MSO’s as the gain from the subscription revenues will be far more than the decline.
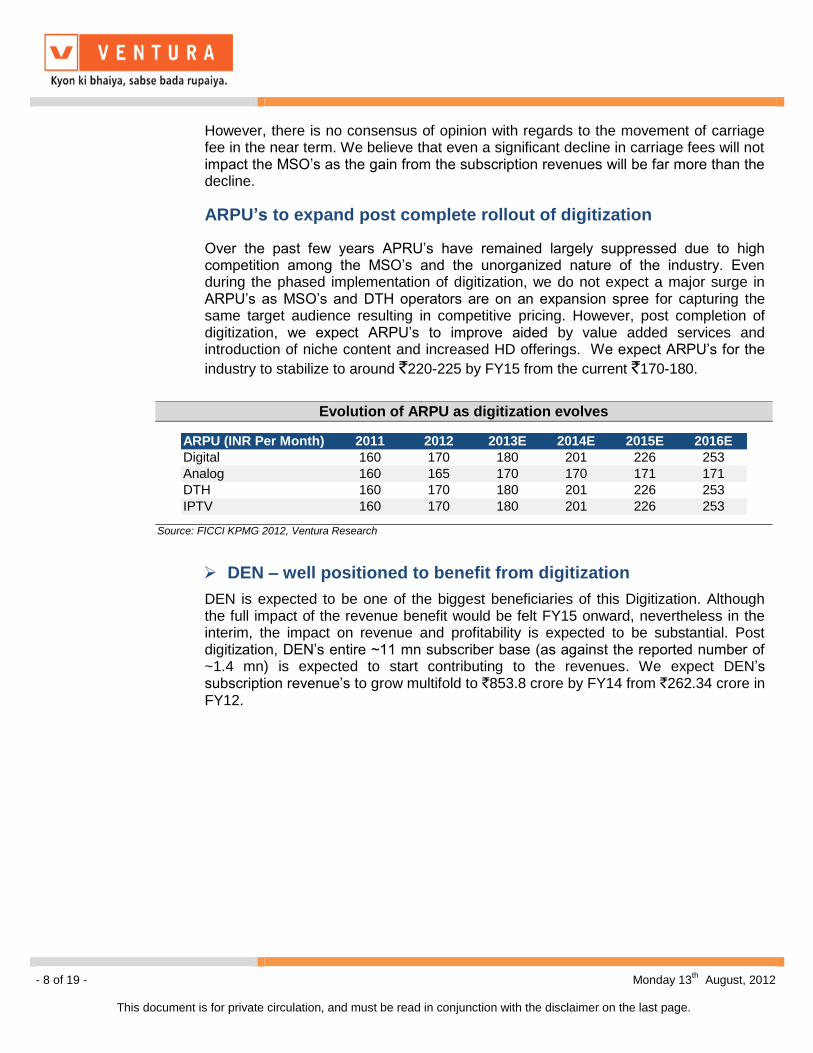
ARPU’s to expand post complete rollout of digitization
Over the past few years APRU’s have remained largely suppressed due to high competition among the MSO’s and the unorganized nature of the industry. Even during the phased implementation of digitization, we do not expect a major surge in ARPU’s as MSO’s and DTH operators are on an expansion spree for capturing the same target audience resulting in competitive pricing. However, post completion of digitization, we expect ARPU’s to improve aided by value added services and introduction of niche content and increased HD offerings. We expect ARPU’s for the
industry to stabilize to around `220-225 by FY15 from the current `170-180.
DEN – well positioned to benefit from digitization
DEN is expected to be one of the biggest beneficiaries of this Digitization. Although the full impact of the revenue benefit would be felt FY15 onward, nevertheless in the interim, the impact on revenue and profitability is expected to be substantial. Post digitization, DEN’s entire ~11 mn subscriber base (as against the reported number of ~1.4 mn) is expected to start contributing to the revenues. We expect DEN’s subscription revenue’s to grow multifold to `853.8 crore by FY14 from `262.34 crore in FY12.
Evolution of ARPU as digitization evolves
ARPU (INR Per Month) 2011 2012 2013E 2014E 2015E 2016E
Digital 160 170 180 201 226 253
Analog 160 165 170 170 171 171
DTH 160 170 180 201 226 253
IPTV 160 170 180 201 226 253
Source: FICCI KPMG 2012, Ventura Research
- 9 of 19 - Monday 13th
August, 2012
This document is for private circulation, and must be read in conjunction with the disclaimer on the last page.
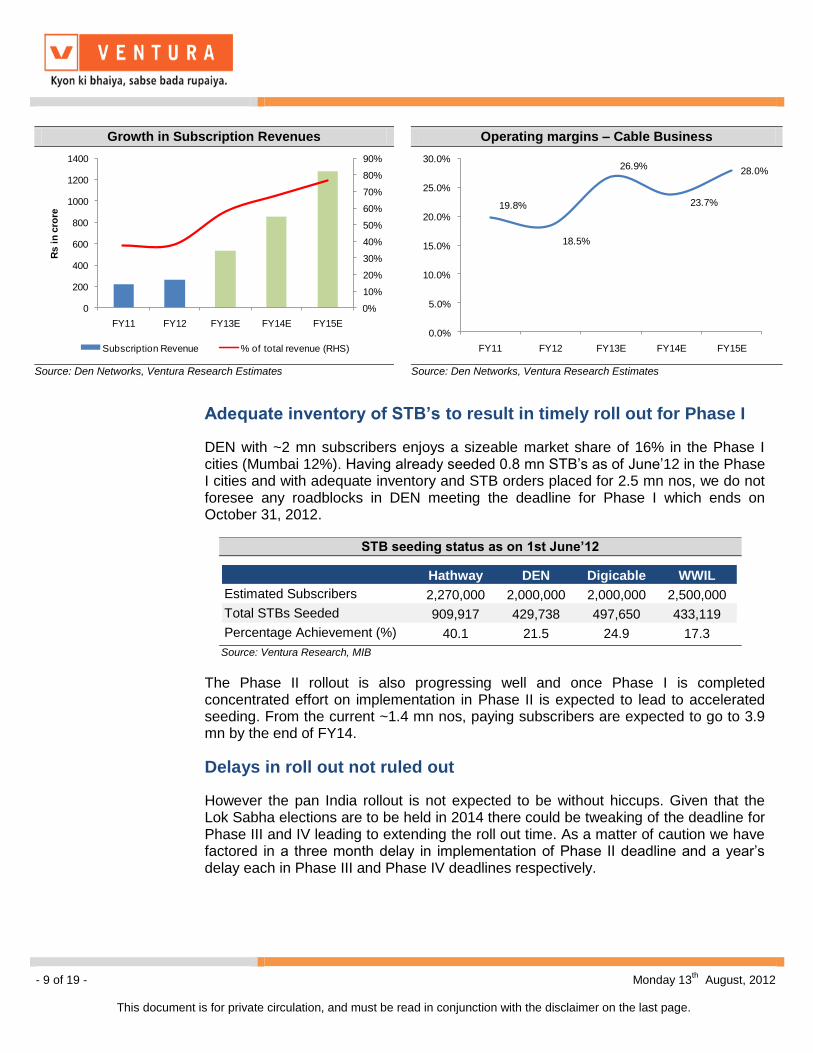
Adequate inventory of STB’s to result in timely roll out for Phase I
DEN with ~2 mn subscribers enjoys a sizeable market share of 16% in the Phase I cities (Mumbai 12%). Having already seeded 0.8 mn STB’s as of June’12 in the Phase I cities and with adequate inventory and STB orders placed for 2.5 mn nos, we do not foresee any roadblocks in DEN meeting the deadline for Phase I which ends on October 31, 2012. The Phase II rollout is also progressing well and once Phase I is completed concentrated effort on implementation in Phase II is expected to lead to accelerated seeding. From the current ~1.4 mn nos, paying subscribers are expected to go to 3.9 mn by the end of FY14.
Delays in roll out not ruled out
However the pan India rollout is not expected to be without hiccups. Given that the Lok Sabha elections are to be held in 2014 there could be tweaking of the deadline for Phase III and IV leading to extending the roll out time. As a matter of caution we have factored in a three month delay in implementation of Phase II deadline and a year’s delay each in Phase III and Phase IV deadlines respectively.
STB seeding status as on 1st June’12
Hathway DEN Digicable WWIL
Estimated Subscribers 2,270,000 2,000,000 2,000,000 2,500,000
Total STBs Seeded 909,917 429,738 497,650 433,119
Percentage Achievement (%) 40.1 21.5 24.9 17.3
Source: Ventura Research, MIB
Growth in Subscription Revenues Operating margins – Cable Business
0%
10%
20%
30%
40%
50%
60%
70%
80%
90%
0
200
400
600
800
1000
1200
1400
FY11 FY12 FY13E FY14E FY15E
Rs i
n c
rore
Subscription Revenue % of total revenue (RHS)
19.8%
18.5%
26.9%
23.7%
28.0%
0.0%
5.0%
10.0%
15.0%
20.0%
25.0%
30.0%
FY11 FY12 FY13E FY14E FY15E
Source: Den Networks, Ventura Research Estimates
Source: Den Networks, Ventura Research Estimates
- 10 of 19 - Monday 13th
August, 2012
This document is for private circulation, and must be read in conjunction with the disclaimer on the last page.
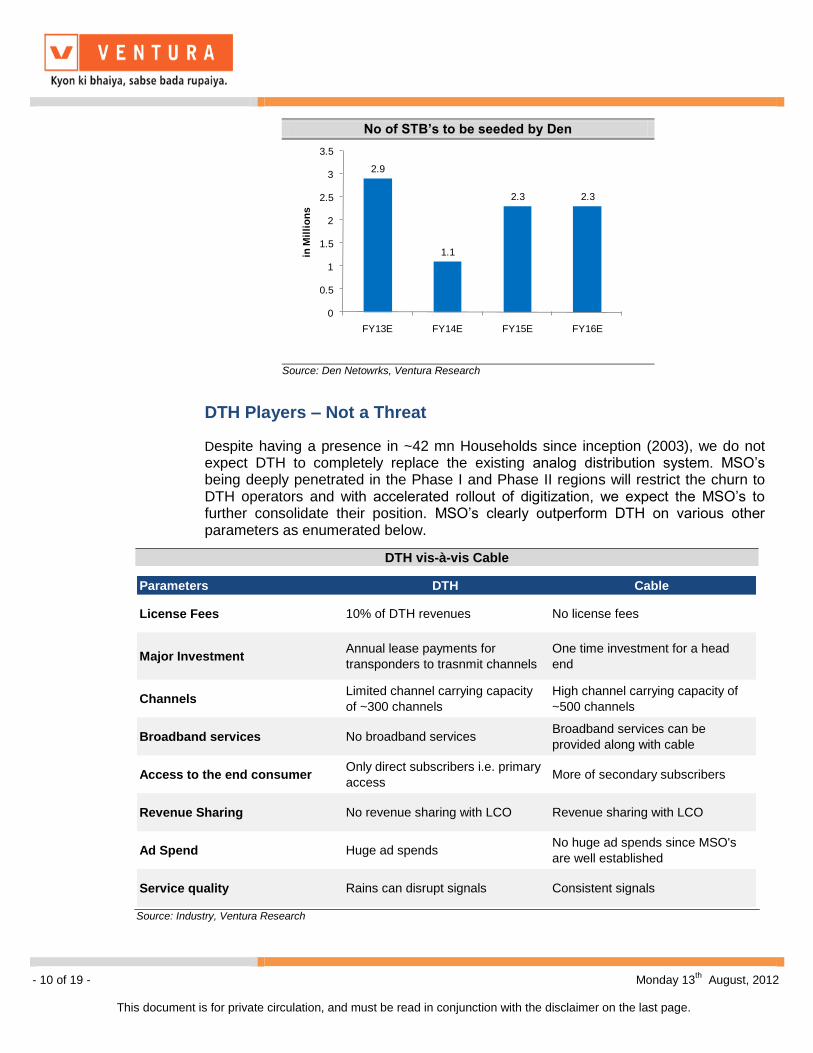
DTH Players – Not a Threat
Despite having a presence in ~42 mn Households since inception (2003), we do not expect DTH to completely replace the existing analog distribution system. MSO’s being deeply penetrated in the Phase I and Phase II regions will restrict the churn to DTH operators and with accelerated rollout of digitization, we expect the MSO’s to further consolidate their position. MSO’s clearly outperform DTH on various other parameters as enumerated below.
DTH vis-à-vis Cable
No of STB’s to be seeded by Den
2.9
1.1
2.3 2.3
0
0.5
1
1.5
2
2.5
3
3.5
FY13E FY14E FY15E FY16E
in M
illi
on
s
Source: Den Netowrks, Ventura Research
Parameters DTH Cable
License Fees 10% of DTH revenues No license fees
Major InvestmentAnnual lease payments for
transponders to trasnmit channels
One time investment for a head
end
ChannelsLimited channel carrying capacity
of ~300 channels
High channel carrying capacity of
~500 channels
Broadband services No broadband servicesBroadband services can be
provided along with cable
Access to the end consumerOnly direct subscribers i.e. primary
accessMore of secondary subscribers
Revenue Sharing No revenue sharing with LCO Revenue sharing with LCO
Ad Spend Huge ad spendsNo huge ad spends since MSO's
are well established
Service quality Rains can disrupt signals Consistent signals
Source: Industry, Ventura Research
- 11 of 19 - Monday 13th
August, 2012
This document is for private circulation, and must be read in conjunction with the disclaimer on the last page.
In our opinion, DTH players will experience higher seeding in Phase III and Phase IV regions. However for them to make inroads into Phase I and II will be a tall task given the fact that we have not witnessed significant churn amongst cable subscribers to DTH services. And with completion of phase I already on anvil the going will only get tougher for them.
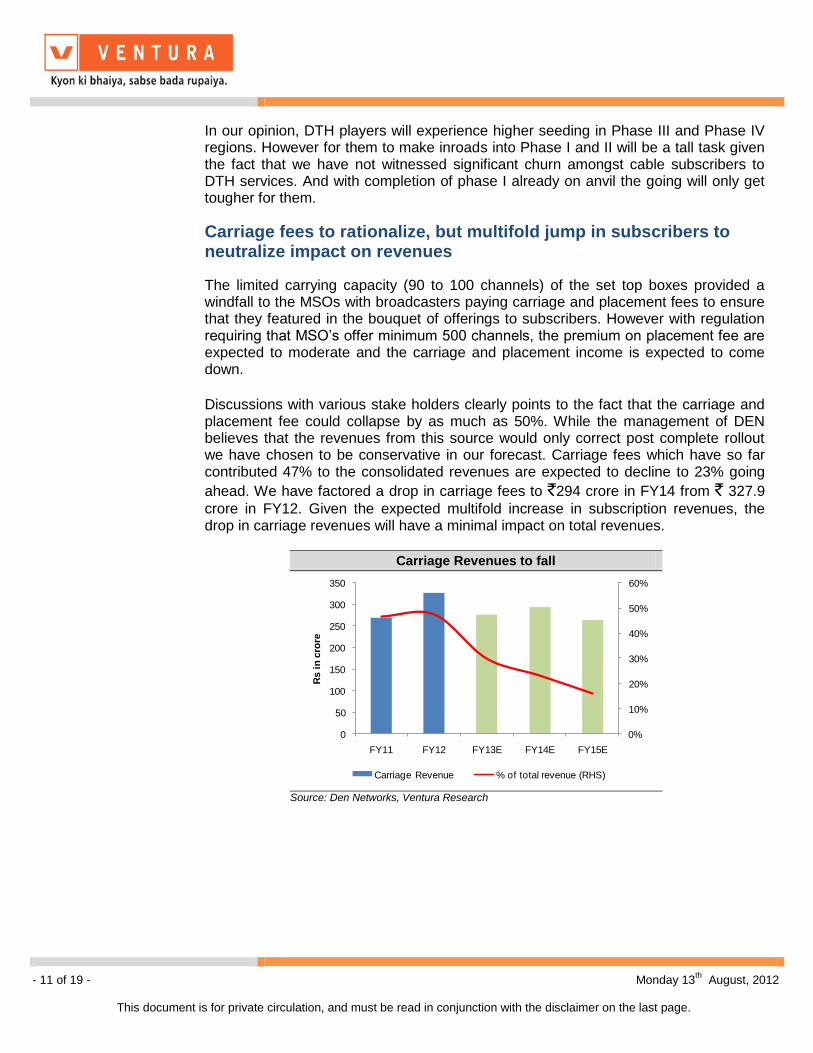
Carriage fees to rationalize, but multifold jump in subscribers to neutralize impact on revenues
The limited carrying capacity (90 to 100 channels) of the set top boxes provided a windfall to the MSOs with broadcasters paying carriage and placement fees to ensure that they featured in the bouquet of offerings to subscribers. However with regulation requiring that MSO’s offer minimum 500 channels, the premium on placement fee are expected to moderate and the carriage and placement income is expected to come down.
Discussions with various stake holders clearly points to the fact that the carriage and placement fee could collapse by as much as 50%. While the management of DEN believes that the revenues from this source would only correct post complete rollout we have chosen to be conservative in our forecast. Carriage fees which have so far contributed 47% to the consolidated revenues are expected to decline to 23% going
ahead. We have factored a drop in carriage fees to `294 crore in FY14 from ` 327.9
crore in FY12. Given the expected multifold increase in subscription revenues, the drop in carriage revenues will have a minimal impact on total revenues.
Carriage Revenues to fall
0%
10%
20%
30%
40%
50%
60%
0
50
100
150
200
250
300
350
FY11 FY12 FY13E FY14E FY15E
Rs i
n c
rore
Carriage Revenue % of total revenue (RHS)
Source: Den Networks, Ventura Research
- 12 of 19 - Monday 13th
August, 2012
This document is for private circulation, and must be read in conjunction with the disclaimer on the last page.
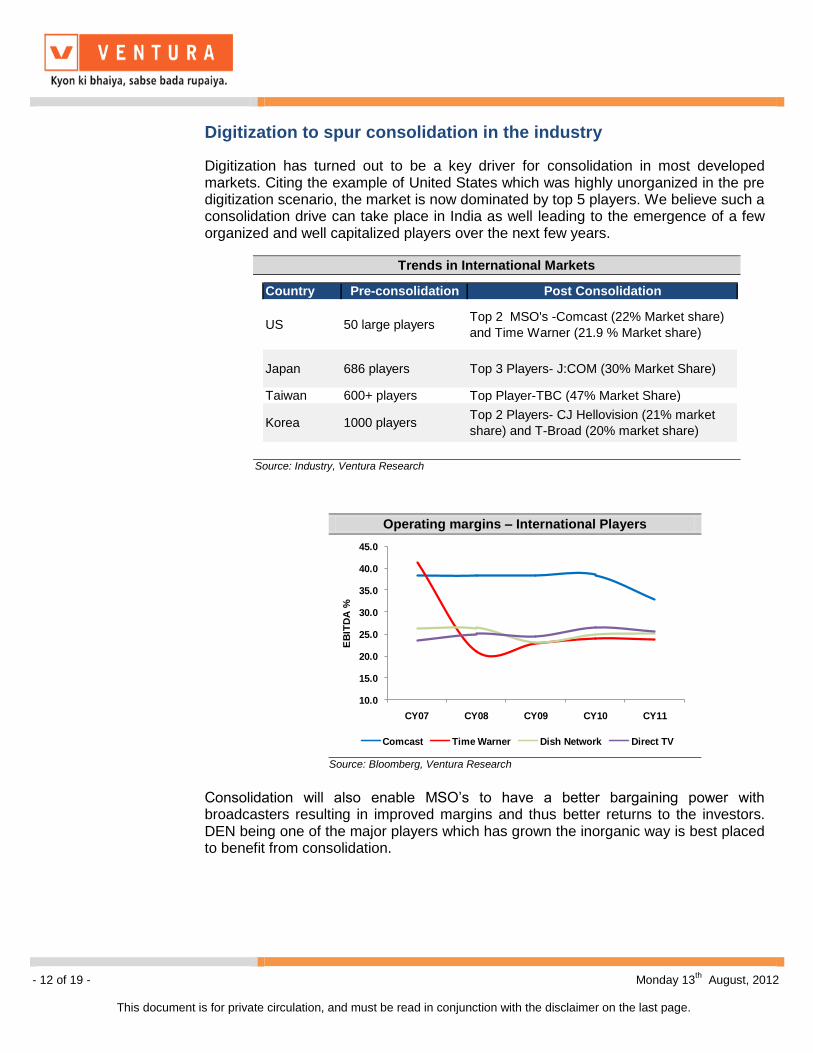
Digitization to spur consolidation in the industry
Digitization has turned out to be a key driver for consolidation in most developed markets. Citing the example of United States which was highly unorganized in the pre digitization scenario, the market is now dominated by top 5 players. We believe such a consolidation drive can take place in India as well leading to the emergence of a few organized and well capitalized players over the next few years.
Consolidation will also enable MSO’s to have a better bargaining power with broadcasters resulting in improved margins and thus better returns to the investors. DEN being one of the major players which has grown the inorganic way is best placed to benefit from consolidation.
Trends in International Markets
Country Pre-consolidation Post Consolidation
US 50 large playersTop 2 MSO's -Comcast (22% Market share)
and Time Warner (21.9 % Market share)
Japan 686 players Top 3 Players- J:COM (30% Market Share)
Taiwan 600+ players Top Player-TBC (47% Market Share)
Korea 1000 playersTop 2 Players- CJ Hellovision (21% market
share) and T-Broad (20% market share)
Source: Industry, Ventura Research
Operating margins – International Players
10.0
15.0
20.0
25.0
30.0
35.0
40.0
45.0
CY07 CY08 CY09 CY10 CY11
EB
ITD
A %
Comcast Time Warner Dish Network Direct TV
Source: Bloomberg, Ventura Research
- 13 of 19 - Monday 13th
August, 2012
This document is for private circulation, and must be read in conjunction with the disclaimer on the last page.
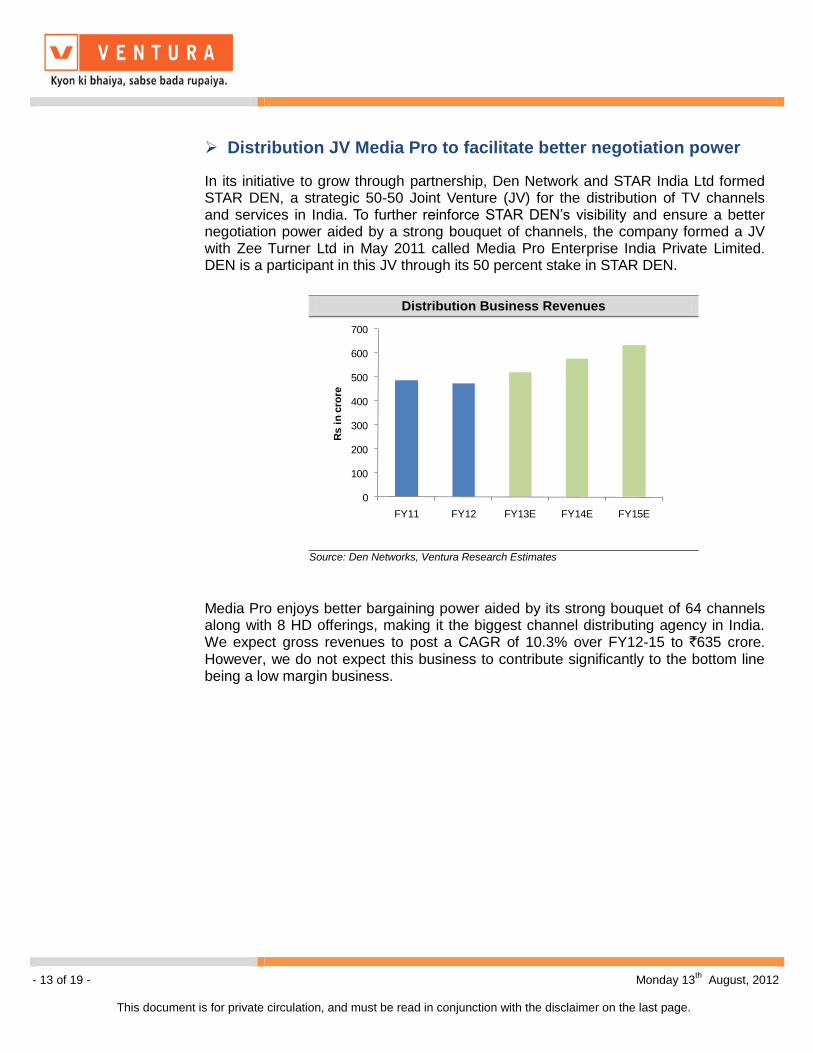
Distribution JV Media Pro to facilitate better negotiation power
In its initiative to grow through partnership, Den Network and STAR India Ltd formed STAR DEN, a strategic 50-50 Joint Venture (JV) for the distribution of TV channels and services in India. To further reinforce STAR DEN’s visibility and ensure a better negotiation power aided by a strong bouquet of channels, the company formed a JV with Zee Turner Ltd in May 2011 called Media Pro Enterprise India Private Limited. DEN is a participant in this JV through its 50 percent stake in STAR DEN.
Media Pro enjoys better bargaining power aided by its strong bouquet of 64 channels along with 8 HD offerings, making it the biggest channel distributing agency in India. We expect gross revenues to post a CAGR of 10.3% over FY12-15 to `635 crore. However, we do not expect this business to contribute significantly to the bottom line being a low margin business.
Distribution Business Revenues
0
100
200
300
400
500
600
700
FY11 FY12 FY13E FY14E FY15E
Rs i
n c
rore
Source: Den Networks, Ventura Research Estimates
- 14 of 19 - Monday 13th
August, 2012
This document is for private circulation, and must be read in conjunction with the disclaimer on the last page.
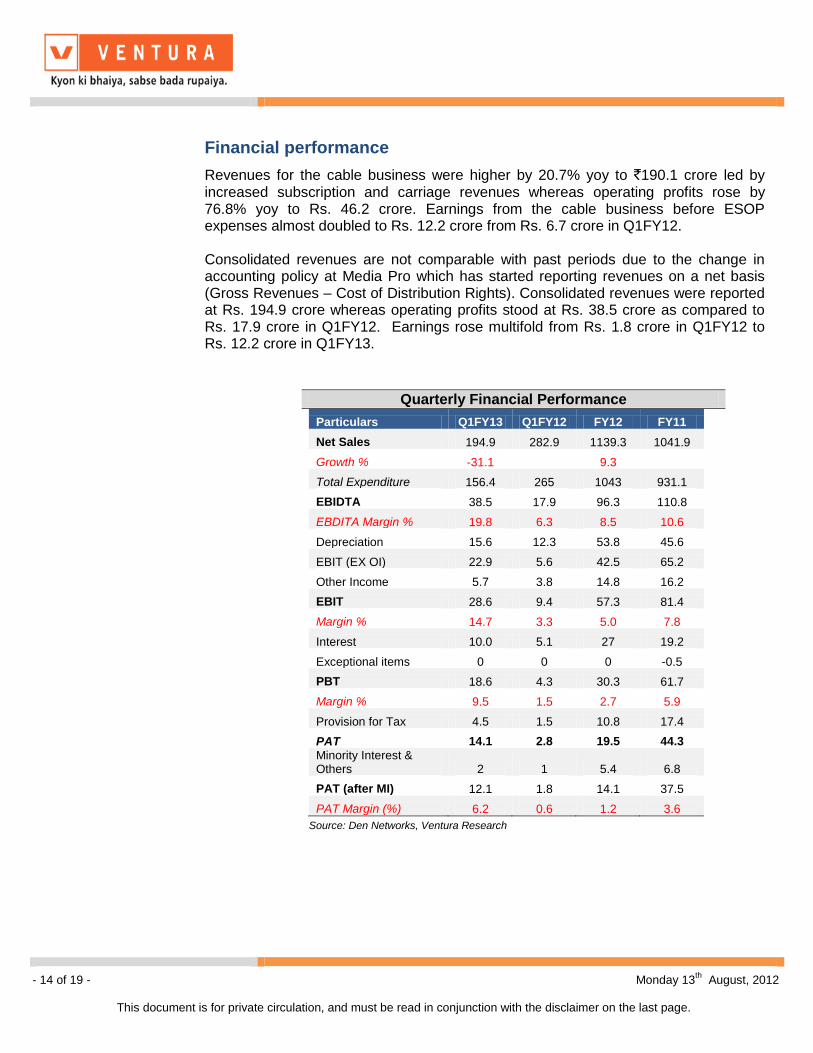
Financial performance
Revenues for the cable business were higher by 20.7% yoy to `190.1 crore led by increased subscription and carriage revenues whereas operating profits rose by 76.8% yoy to Rs. 46.2 crore. Earnings from the cable business before ESOP expenses almost doubled to Rs. 12.2 crore from Rs. 6.7 crore in Q1FY12. Consolidated revenues are not comparable with past periods due to the change in accounting policy at Media Pro which has started reporting revenues on a net basis (Gross Revenues – Cost of Distribution Rights). Consolidated revenues were reported at Rs. 194.9 crore whereas operating profits stood at Rs. 38.5 crore as compared to Rs. 17.9 crore in Q1FY12. Earnings rose multifold from Rs. 1.8 crore in Q1FY12 to Rs. 12.2 crore in Q1FY13.
Quarterly Financial Performance Particulars Q1FY13 Q1FY12 FY12 FY11
Net Sales 194.9 282.9 1139.3 1041.9
Growth % -31.1
9.3
Total Expenditure 156.4 265 1043 931.1
EBIDTA 38.5 17.9 96.3 110.8
EBDITA Margin % 19.8 6.3 8.5 10.6
Depreciation 15.6 12.3 53.8 45.6
EBIT (EX OI) 22.9 5.6 42.5 65.2
Other Income 5.7 3.8 14.8 16.2
EBIT 28.6 9.4 57.3 81.4
Margin % 14.7 3.3 5.0 7.8
Interest 10.0 5.1 27 19.2
Exceptional items 0 0 0 -0.5
PBT 18.6 4.3 30.3 61.7
Margin % 9.5 1.5 2.7 5.9
Provision for Tax 4.5 1.5 10.8 17.4
PAT 14.1 2.8 19.5 44.3
Minority Interest & Others 2 1 5.4 6.8
PAT (after MI) 12.1 1.8 14.1 37.5
PAT Margin (%) 6.2 0.6 1.2 3.6
Source: Den Networks, Ventura Research
- 15 of 19 - Monday 13th
August, 2012
This document is for private circulation, and must be read in conjunction with the disclaimer on the last page.
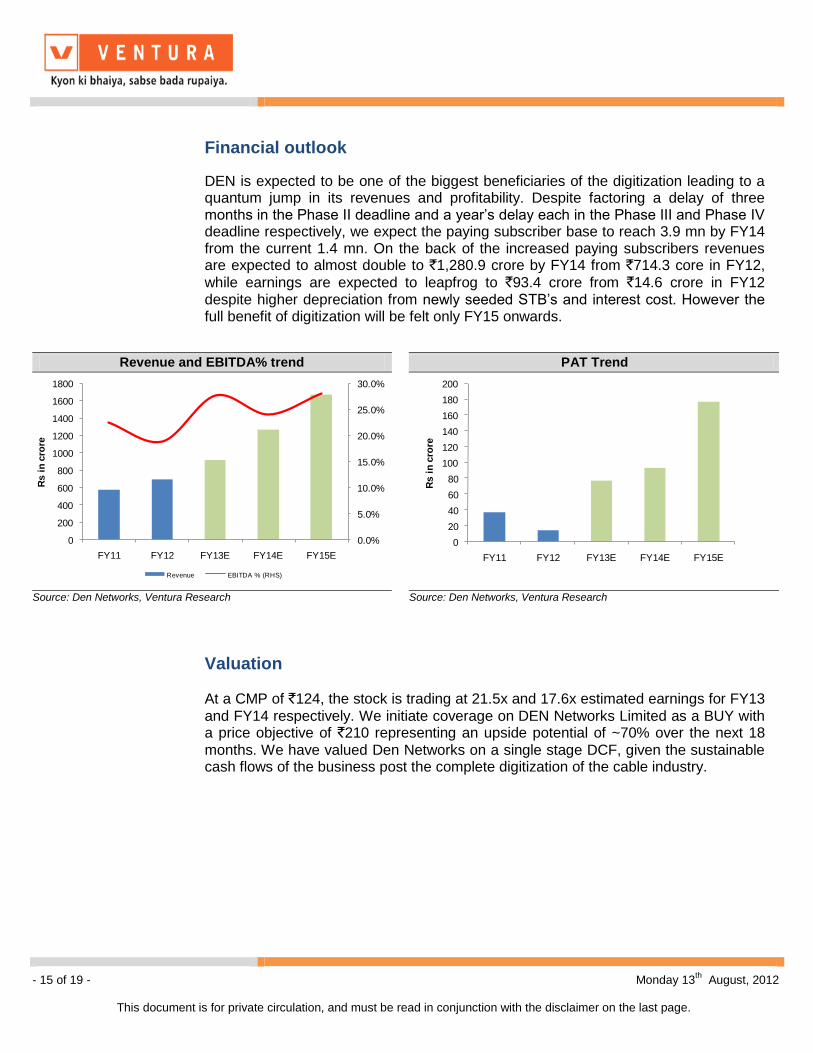
Financial outlook
DEN is expected to be one of the biggest beneficiaries of the digitization leading to a quantum jump in its revenues and profitability. Despite factoring a delay of three months in the Phase II deadline and a year’s delay each in the Phase III and Phase IV deadline respectively, we expect the paying subscriber base to reach 3.9 mn by FY14 from the current 1.4 mn. On the back of the increased paying subscribers revenues are expected to almost double to `1,280.9 crore by FY14 from `714.3 core in FY12,
while earnings are expected to leapfrog to `93.4 crore from `14.6 crore in FY12 despite higher depreciation from newly seeded STB’s and interest cost. However the full benefit of digitization will be felt only FY15 onwards.
Valuation At a CMP of `124, the stock is trading at 21.5x and 17.6x estimated earnings for FY13
and FY14 respectively. We initiate coverage on DEN Networks Limited as a BUY with a price objective of `210 representing an upside potential of ~70% over the next 18
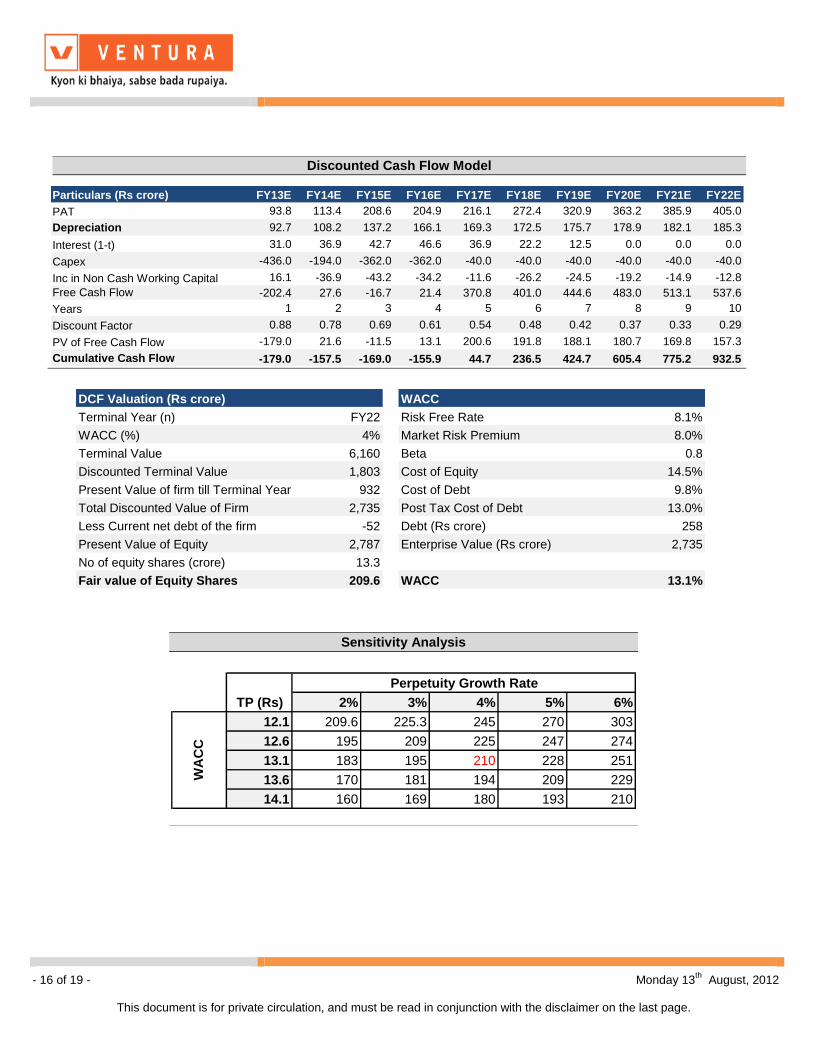
months. We have valued Den Networks on a single stage DCF, given the sustainable cash flows of the business post the complete digitization of the cable industry.
Revenue and EBITDA% trend PAT Trend
0.0%
5.0%
10.0%
15.0%
20.0%
25.0%
30.0%
0
200
400
600
800
1000
1200
1400
1600
1800
FY11 FY12 FY13E FY14E FY15E
Rs i
n c
rore
Revenue EBITDA % (RHS)
0
20
40
60
80
100
120
140
160
180
200
FY11 FY12 FY13E FY14E FY15E
Rs i
n c
rore
Source: Den Networks, Ventura Research
Source: Den Networks, Ventura Research
- 16 of 19 - Monday 13th
August, 2012
This document is for private circulation, and must be read in conjunction with the disclaimer on the last page.
Particulars (Rs crore) FY13E FY14E FY15E FY16E FY17E FY18E FY19E FY20E FY21E FY22E
PAT 93.8 113.4 208.6 204.9 216.1 272.4 320.9 363.2 385.9 405.0
Depreciation 92.7 108.2 137.2 166.1 169.3 172.5 175.7 178.9 182.1 185.3
Interest (1-t) 31.0 36.9 42.7 46.6 36.9 22.2 12.5 0.0 0.0 0.0
Capex -436.0 -194.0 -362.0 -362.0 -40.0 -40.0 -40.0 -40.0 -40.0 -40.0
Inc in Non Cash Working Capital 16.1 -36.9 -43.2 -34.2 -11.6 -26.2 -24.5 -19.2 -14.9 -12.8
Free Cash Flow -202.4 27.6 -16.7 21.4 370.8 401.0 444.6 483.0 513.1 537.6
Years 1 2 3 4 5 6 7 8 9 10
Discount Factor 0.88 0.78 0.69 0.61 0.54 0.48 0.42 0.37 0.33 0.29
PV of Free Cash Flow -179.0 21.6 -11.5 13.1 200.6 191.8 188.1 180.7 169.8 157.3
Cumulative Cash Flow -179.0 -157.5 -169.0 -155.9 44.7 236.5 424.7 605.4 775.2 932.5
Discounted Cash Flow Model
2% 3% 4% 5% 6%
12.1 209.6 225.3 245 270 303
12.6 195 209 225 247 274
13.1 183 195 210 228 251
13.6 170 181 194 209 229
14.1 160 169 180 193 210
Perpetuity Growth Rate
WA
CC
TP (Rs)
Sensitivity Analysis
Terminal Year (n) FY22 Risk Free Rate 8.1%
WACC (%) 4% Market Risk Premium 8.0%
Terminal Value 6,160 Beta 0.8
Discounted Terminal Value 1,803 Cost of Equity 14.5%
Present Value of firm till Terminal Year 932 Cost of Debt 9.8%
Total Discounted Value of Firm 2,735 Post Tax Cost of Debt 13.0%
Less Current net debt of the firm -52 Debt (Rs crore) 258
Present Value of Equity 2,787 Enterprise Value (Rs crore) 2,735
No of equity shares (crore) 13.3
Fair value of Equity Shares 209.6 WACC 13.1%
DCF Valuation (Rs crore) WACC
- 17 of 19 - Monday 13th
August, 2012
This document is for private circulation, and must be read in conjunction with the disclaimer on the last page.
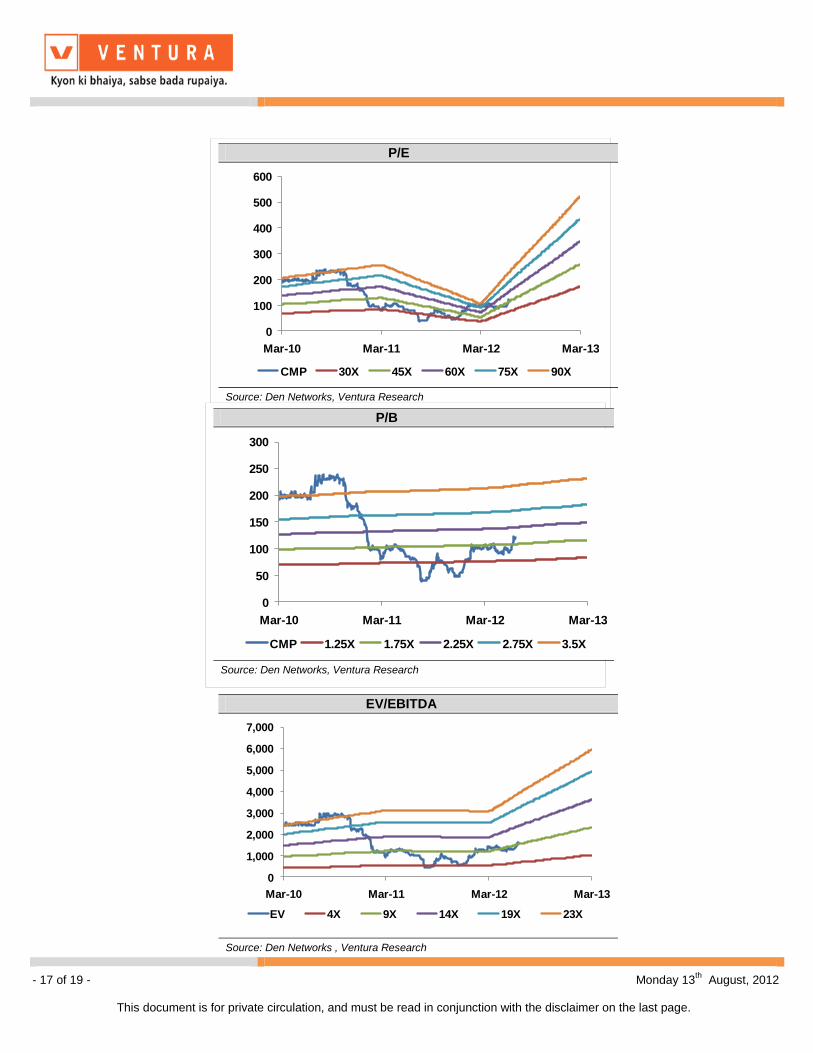
P/E
0
100
200
300
400
500
600
Mar-10 Mar-11 Mar-12 Mar-13
CMP 30X 45X 60X 75X 90X
Source: Den Networks, Ventura Research
P/B
0
50
100
150
200
250
300
Mar-10 Mar-11 Mar-12 Mar-13
CMP 1.25X 1.75X 2.25X 2.75X 3.5X
Source: Den Networks, Ventura Research
EV/EBITDA
0
1,000
2,000
3,000
4,000
5,000
6,000
7,000
Mar-10 Mar-11 Mar-12 Mar-13
EV 4X 9X 14X 19X 23X
Source: Den Networks , Ventura Research
- 18 of 19 - Monday 13th
August, 2012
This document is for private circulation, and must be read in conjunction with the disclaimer on the last page.
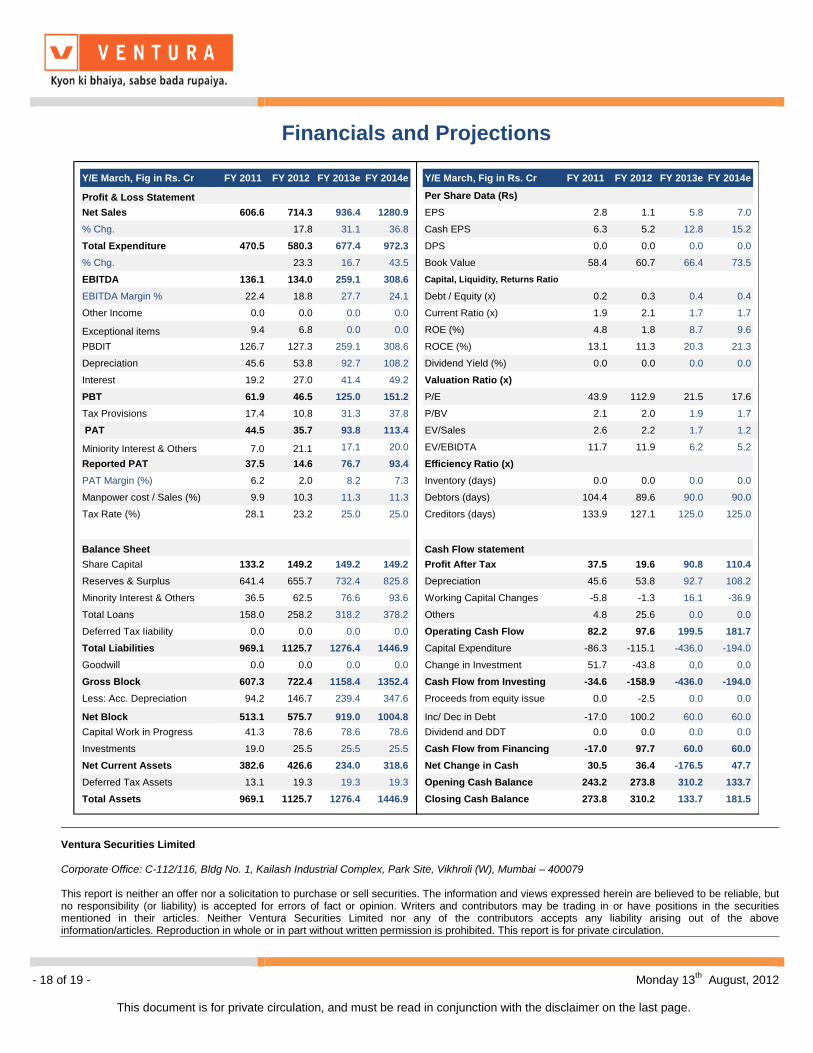
Financials and Projections
Y/E March, Fig in Rs. Cr FY 2011 FY 2012 FY 2013e FY 2014e Y/E March, Fig in Rs. Cr FY 2011 FY 2012 FY 2013e FY 2014e
Profit & Loss Statement Per Share Data (Rs)
Net Sales 606.6 714.3 936.4 1280.9 EPS 2.8 1.1 5.8 7.0
% Chg. 17.8 31.1 36.8 Cash EPS 6.3 5.2 12.8 15.2
Total Expenditure 470.5 580.3 677.4 972.3 DPS 0.0 0.0 0.0 0.0
% Chg. 23.3 16.7 43.5 Book Value 58.4 60.7 66.4 73.5
EBITDA 136.1 134.0 259.1 308.6 Capital, Liquidity, Returns Ratio
EBITDA Margin % 22.4 18.8 27.7 24.1 Debt / Equity (x) 0.2 0.3 0.4 0.4
Other Income 0.0 0.0 0.0 0.0 Current Ratio (x) 1.9 2.1 1.7 1.7
Exceptional items 9.4 6.8 0.0 0.0 ROE (%) 4.8 1.8 8.7 9.6
PBDIT 126.7 127.3 259.1 308.6 ROCE (%) 13.1 11.3 20.3 21.3
Depreciation 45.6 53.8 92.7 108.2 Dividend Yield (%) 0.0 0.0 0.0 0.0
Interest 19.2 27.0 41.4 49.2 Valuation Ratio (x)
PBT 61.9 46.5 125.0 151.2 P/E 43.9 112.9 21.5 17.6
Tax Provisions 17.4 10.8 31.3 37.8 P/BV 2.1 2.0 1.9 1.7
PAT 44.5 35.7 93.8 113.4 EV/Sales 2.6 2.2 1.7 1.2
Miniority Interest & Others 7.0 21.1 17.1 20.0 EV/EBIDTA 11.7 11.9 6.2 5.2
Reported PAT 37.5 14.6 76.7 93.4 Efficiency Ratio (x)
PAT Margin (%) 6.2 2.0 8.2 7.3 Inventory (days) 0.0 0.0 0.0 0.0
Manpower cost / Sales (%) 9.9 10.3 11.3 11.3 Debtors (days) 104.4 89.6 90.0 90.0
Tax Rate (%) 28.1 23.2 25.0 25.0 Creditors (days) 133.9 127.1 125.0 125.0
Balance Sheet Cash Flow statement
Share Capital 133.2 149.2 149.2 149.2 Profit After Tax 37.5 19.6 90.8 110.4
Reserves & Surplus 641.4 655.7 732.4 825.8 Depreciation 45.6 53.8 92.7 108.2
Minority Interest & Others 36.5 62.5 76.6 93.6 Working Capital Changes -5.8 -1.3 16.1 -36.9
Total Loans 158.0 258.2 318.2 378.2 Others 4.8 25.6 0.0 0.0
Deferred Tax Iiability 0.0 0.0 0.0 0.0 Operating Cash Flow 82.2 97.6 199.5 181.7
Total Liabilities 969.1 1125.7 1276.4 1446.9 Capital Expenditure -86.3 -115.1 -436.0 -194.0
Goodwill 0.0 0.0 0.0 0.0 Change in Investment 51.7 -43.8 0.0 0.0
Gross Block 607.3 722.4 1158.4 1352.4 Cash Flow from Investing -34.6 -158.9 -436.0 -194.0
Less: Acc. Depreciation 94.2 146.7 239.4 347.6 Proceeds from equity issue 0.0 -2.5 0.0 0.0
Net Block 513.1 575.7 919.0 1004.8 Inc/ Dec in Debt -17.0 100.2 60.0 60.0
Capital Work in Progress 41.3 78.6 78.6 78.6 Dividend and DDT 0.0 0.0 0.0 0.0
Investments 19.0 25.5 25.5 25.5 Cash Flow from Financing -17.0 97.7 60.0 60.0
Net Current Assets 382.6 426.6 234.0 318.6 Net Change in Cash 30.5 36.4 -176.5 47.7
Deferred Tax Assets 13.1 19.3 19.3 19.3 Opening Cash Balance 243.2 273.8 310.2 133.7
Total Assets 969.1 1125.7 1276.4 1446.9 Closing Cash Balance 273.8 310.2 133.7 181.5
Ventura Securities Limited Corporate Office: C-112/116, Bldg No. 1, Kailash Industrial Complex, Park Site, Vikhroli (W), Mumbai – 400079 This report is neither an offer nor a solicitation to purchase or sell securities. The information and views expressed herein are believed to be reliable, but no responsibility (or liability) is accepted for errors of fact or opinion. Writers and contributors may be trading in or have positions in the securities mentioned in their articles. Neither Ventura Securities Limited nor any of the contributors accepts any liability arising out of the above information/articles. Reproduction in whole or in part without written permission is prohibited. This report is for private circulation.
- 19 of 19 - Monday 13th
August, 2012
This document is for private circulation, and must be read in conjunction with the disclaimer on the last page.
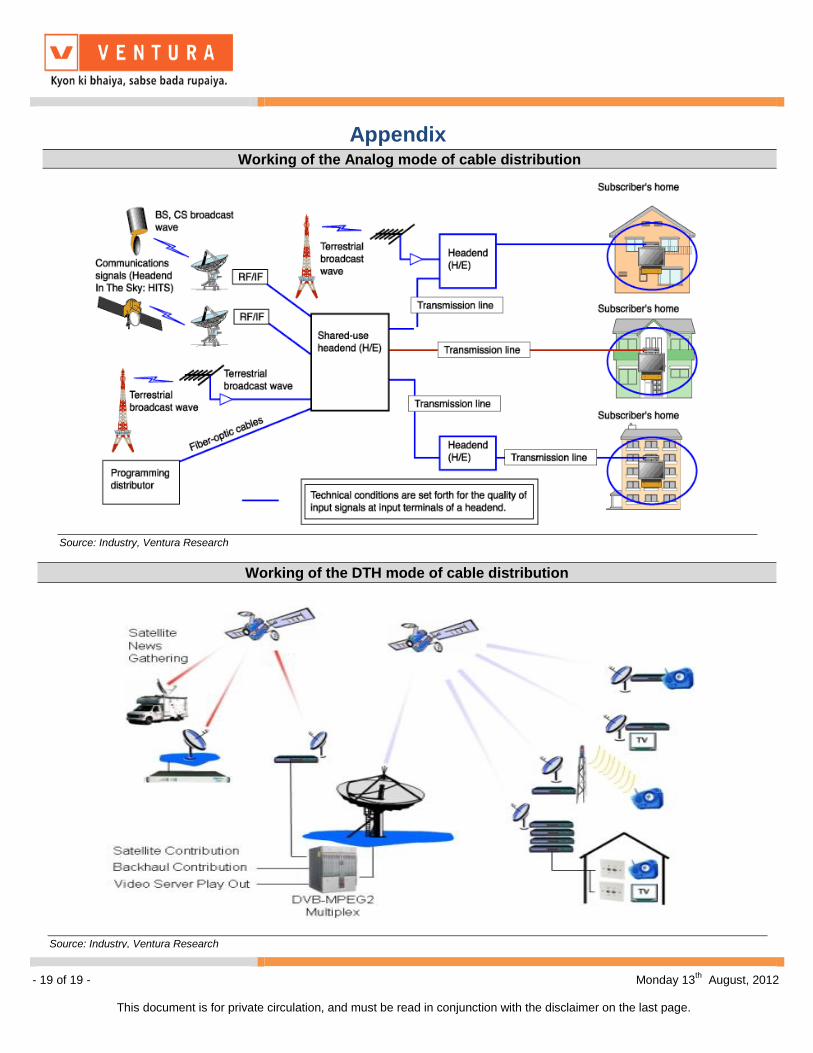
Appendix
Working of the Analog mode of cable distribution
Working of the DTH mode of cable distribution
Source: Industry, Ventura Research
Source: Industry, Ventura Research


![[forthcoming in the Journal of Economic Literature · [forthcoming in the . Journal of Economic Literature] Abstract: This essay tries to bring out some of the complexities that are](https://img.pdfslide.us/doc/110x75/5e59d3eb0776ff7125452834/forthcoming-in-the-journal-of-economic-literature-forthcoming-in-the-journal.jpg)
![INDEX [christuniversity.in]...leadership skills. Here, at Christ University, General Management program tries to bring integration among different domains of the business thereby helps](https://img.pdfslide.us/doc/110x75/5f7fecdb7a2517735b0cd6d5/index-leadership-skills-here-at-christ-university-general-management.jpg)


![5.2 TRIES - Princeton University Computer Science · 2020. 11. 12. · Tries Tries. [ from retrieval, but pronounced “try” ] rìStore characters in nodes (not keys). rìEach node](https://img.pdfslide.us/doc/110x75/60e1fba7c1bd1749507dae3a/52-tries-princeton-university-computer-science-2020-11-12-tries-tries-.jpg)