Embed Size (px)
Citation preview
Demonstration of Santoku: OptimizingMachine Learning over Normalized Data
Arun Kumar Mona Jalal Boqun Yan Jeffrey Naughton Jignesh M. PatelUniversity of Wisconsin-Madison
{arun, jalal, byan23, naughton, jignesh}@cs.wisc.edu
ABSTRACTAdvanced analytics is a booming area in the data man-agement industry and a hot research topic. Almostall toolkits that implement machine learning (ML) al-gorithms assume that the input is a single table, butmost relational datasets are not stored as single tablesdue to normalization. Thus, analysts often join tablesto obtain a denormalized table. Also, analysts typ-ically ignore any functional dependencies among fea-tures because ML toolkits do not support them. Inboth cases, time is wasted in learning over data withredundancy. We demonstrate Santoku, a toolkit to helpanalysts improve the performance of ML over normal-ized data. Santoku applies the idea of factorized learn-ing and automatically decides whether to denormalizeor push ML computations through joins. Santoku alsoexploits database dependencies to provide automatic in-sights that could help analysts with exploratory featureselection. It is usable as a library in R, which is a pop-ular environment for advanced analytics. We demon-strate the benefits of Santoku in improving ML perfor-mance and helping analysts with feature selection.
1. INTRODUCTIONMany projects in both industry and academia aim to
integrate ML algorithms as well as statistical comput-ing languages such as R with scalable data processingin RDBMSs, Hadoop, and other systems. Almost allimplementations require that the input to an ML algo-rithm be a flat single table. However, most relationaldatasets are not stored as single tables due to normal-ization. Thus, analysts often perform joins, especiallykey-foreign key joins, to bring in more features and ma-terialize a single denormalized table.
This work is licensed under the Creative Commons Attribution-NonCommercial-NoDerivs 3.0 Unported License. To view a copy of this li-cense, visit http://creativecommons.org/licenses/by-nc-nd/3.0/. Obtain per-mission prior to any use beyond those covered by the license. Contactcopyright holder by emailing [email protected]. Articles from this volumewere invited to present their results at the 41st International Conference onVery Large Data Bases, August 31st - September 4th 2015, Kohala Coast,Hawaii.Proceedings of the VLDB Endowment, Vol. 8, No. 12Copyright 2015 VLDB Endowment 2150-8097/15/08.
Example: Customer Churn (based on [3]). Con-sider an insurance company analyst modeling customerchurn, i.e., predicting how likely a customer is to leavethe company. She builds an ML classifier using dataabout customers, including past customers that havechurned, which are stored in the Customers table withthe schema Customers (CID, Churn, Sex, EID, . . . ). EID
is a foreign key that refers to the Employers table, whichcontains information about the customers’ employerssuch as corporations and non-profits. It has the schemaEmployers (EID, State, Size, . . . ), wherein Size in-dicates how big the employer is in terms of its rev-enue. Intuitively, the features of the customers’ employ-ers could help a classifier predict if the customer willchurn. For example, customers employed by large cor-porations from Wisconsin might be unlikely to churn, inwhich case including the State and Size features couldimprove accuracy. She performs a key-foreign key jointo create a denormalized table: Temp← π(Customers ./Employers), as shown in Figure 1. She feeds Temp to atoolkit that implements a classifier, e.g., Naive Bayes.
The above is a case of “learning after joins” – theanalyst is forced to materialize Temp because existingML toolkits cannot process normalized data directly.As we explain in [3], this could introduce redundancythat is avoided by normalization and hurt performance.Moreover, it causes data management burdens for ana-lysts, which could hinder exploratory analyses [5]. Ourrecently introduced paradigm of “learning over joins”,specifically factorized learning (FL), helps mitigate theseissues by “pushing the ML computations down throughjoins” to the base tables [3]. In our example, if the ana-lyst provides the base tables (Customers and Employers)and the join column (EID), one can apply FL to NaiveBayes to avoid redundant computations on Temp, whichcould improve performance (see Figure 1; details in Sec-tion 2). Santoku is the first toolkit to offer FL for a setof popular ML models such as Naive Bayes. While FLavoids redundant computations, it performs extra workfor “book-keeping”. Thus, FL could be slower than op-erating over denormalized data on some inputs depend-ing on various parameters of the data, system, and MLmodel [3]. It will be helpful for analysts if a system couldautomatically decide which tables to join and which to
1864

EID State Size …
1 WI L
2 WI S
3 CA L
CID Churn Sex EID …
1 Y M 1
2 N F 1
3 N M 1
4 N F 1
5 Y M 2
6 N M 2
7 N F 2
8 Y F 2
9 Y F 3
10 Y M 3
11 Y M 3
12 N F 3
Employers Customers
Customers.EID refers to Employers.EID
Temp ← 𝜋(𝐂𝐮𝐬𝐭𝐨𝐦𝐞𝐫𝐬 ⋈𝐄𝐈𝐃=𝐄𝐈𝐃 𝐄𝐦𝐩𝐥𝐨𝐲𝐞𝐫𝐬)
CID Churn Sex EID State Size …
1 Y M 1 WI L
2 N F 1 WI L
3 N M 1 WI L
4 N F 1 WI L
5 Y M 2 WI S
6 N M 2 WI S
7 N F 2 WI S
8 Y F 2 WI S
9 Y F 3 CA L
10 Y M 3 CA L
11 Y M 3 CA L
12 N F 3 CA L
Temp
#(Churn=N) = 1+1+1+1+1+1 = 6
P(State=WI | Churn=N)
= #(State=WI,Churn=N)
#(Churn=N)
= |*t∈Temp|t.State=WI^t.Churn=N+|
6
= 1+1+1+1+1
6 =
5
6
P(Size=L | Churn=N)
= #(Size=L,Churn=N)
#(Churn=N)
= |*t∈Temp|t.Size=L^t.Churn=N+|
6
= 1+1+1+1
6 =
4
6
FL avoids redundancy by pre-counting references and factorizing the sums: Naive Bayes computations with redundancy:
Churn EID Count
Y 1 1
Y 2 2
Y 3 3
N 1 3
N 2 2
N 3 1
CustRefs
State EIDs
WI {1,2}
CA {3}
StateRefs
Size EIDs
L {1,3}
S {3}
SizeRefs
P(State=WI | Churn=N)
= #(State=WI,Churn=N)
#(Churn=N)
= CustRefs,Churn=N^EID=e-e∈StateRefs,WI-.EIDs
6
= 3+2
6 =
5
6
P(Size=L | Churn=N)
= #(Size=L,Churn=N)
#(Churn=N)
= CustRefs,Churn=N^EID=e-e∈SizeRefs,L-.EIDs
6
= 3+1
6 =
4
6
A B C
5 terms
4 terms
2 terms
2 terms
Figure 1: Illustration of Factorized Learning for Naive Bayes. (A) The base tables Customers (the “entity table”as defined in [3]) and Employers (an “attribute table” as defined in [3]). The target feature is Churn in Customers.(B) The denormalized table Temp. Naive Bayes computations using Temp have redundancy, as shown here for theconditional probability calculations for State and Size. (C) FL avoids computational redundancy by pre-countingreferences, which are stored in CustRefs, and by decomposing (“factorizing”) the sums using StateRefs and SizeRefs.
apply FL on in order to optimize the performance of theML model over normalized data. Santoku provides suchan optimization capability by using a simple cost modeland a cost-based optimizer.
A closely related scenario is learning over a table withfunctional dependencies (FDs) between features. Forexample, we can view Temp as having the following FD:EID → {State, Size, . . . }. This FD is a result of thekey-foreign key join.1 In general, there could be manysuch FDs in a denormalized table. From speaking to an-alysts at various companies, we learned that they ignoresuch FDs altogether because their ML toolkits cannothandle them. While they may not use the databaseterminology (FD), analysts recognize that such “func-tional relationships” can exist among features. One canuse the FDs to normalize the single table, and then ap-ply FL to different degrees. But once again, these ap-proaches could be slower than using the single table onsome inputs. Santoku enables analysts to integrate suchFD-based functional relationships into some popular MLmodels and automatically optimizes performance.
Finally, we consider the important related task of fea-ture selection. It is often a tedious exploratory pro-cess in which analysts evaluate smaller feature vectorsfor their ML model to help improve accuracy, inter-pretability, etc. [1, 2]. Ignoring FD-based functional re-lationships could mean ignoring potentially valuable in-formation about what features are “useful”. Santokuhelps analysts exploit FD-based functional relationshipsfor feature selection purposes. Santoku provides a “fea-ture exploration” option that automatically constructsand evaluates smaller feature vectors by dropping dif-ferent combinations of sides of FDs. For example, onecan drop EID (perhaps an uninterpretable identifier), orother features from Employers, or both. While this maynot “solve” feature selection fully, it provides valuableautomatic insights using FDs that could help analystswith feature selection.
1Key-foreign key dependencies are not FDs, but we canview them as such with some obvious assumptions.
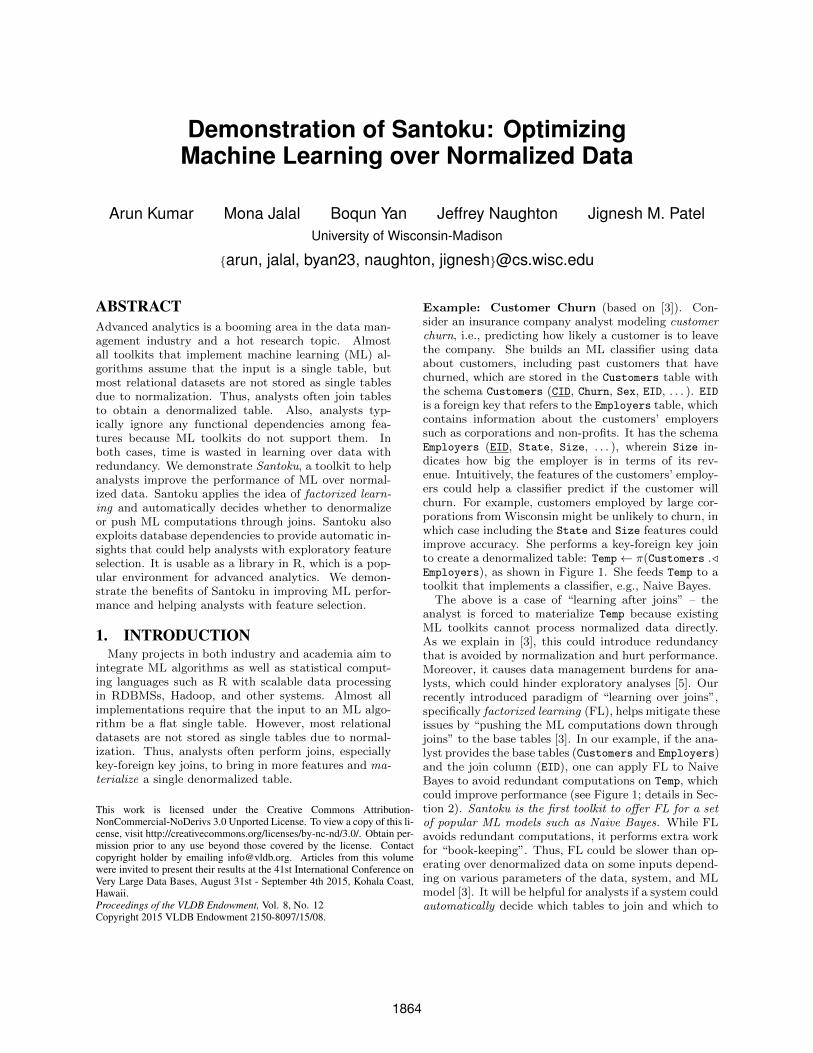
Santoku is designed as an open-source library usablein R, which is a powerful and popular environment forstatistical computing. R provides easy access to a largerepository of ML codes 2. By open-sourcing our APIand code, we hope to encourage contributions from theR community that extend Santoku to more ML models.Many data management companies such as EMC, Ora-cle, and SAP have also released products that scale Rscripts transparently to larger-than-memory data. Weimplement Santoku fully in the R language, which en-ables us to exploit such R-based analytics systems toprovide scalability automatically. For users that do notwant to write R scripts, Santoku also provides an easy-to-use GUI, as illustrated in Figure 2.
In summary, we demonstrate Santoku, the first toolkitto integrate common database dependencies with pop-ular ML models. We explain FL with an example inSection 2 and present Santoku’s architecture in Section3. In Section 4, we discuss how demonstration attendeescan interact with Santoku to see its benefits.
2. FACTORIZED LEARNINGFactorized learning (FL) was first proposed for gen-
eralized linear models [3]. Santoku extends FL to a fewother popular ML models, including Naive Bayes. Weexplain FL with a detailed example using Naive Bayes.
Example: Naive Bayes assumes that the data examplesare samples from a (hidden) joint probability distribu-tion P (X, Y ) over the class label Y , and feature vectorX. But it also assumes conditional independence amongthe features, given Y . Thus, it computes the following:P (X, Y ) = P (Y )P (X|Y ) ≈ P (Y )ΠF∈XP (F |Y ). Theprobabilities are estimated by counting the frequenciesof various combinations of features values and class la-bels in the training dataset. In SQL terms, this involvesa bunch of COUNT aggregation queries, which could bebatched into a single pass over the data.
2http://cran.r-project.org/
1865

B
C D A
Figure 2: Screenshots of Santoku: (A) The GUI to load the datasets, specify the database dependencies, and trainML models. (B) Results of training a single model. (C) Results of feature exploration comparing multiple featurevectors. (D) An R script that performs these tasks programmatically from an R console using the Santoku API.
Figure 1(A) shows a simple instance of our insur-ance customer churn example. The output of the join,Temp, has redundancy in the features from Employers,e.g., values of State and Size get repeated more of-ten. This results in redundancy in the computations forNaive Bayes when it counts occurrences to estimate theconditional probabilities for those features. Figure 1(B)illustrates the additions needed for both State=WI andSize=L when operating over Temp. In contrast, FL avoidsredundant computations by pre-computing the num-ber of foreign key references, and by factoring theminto the counting. Figure 1(C) illustrates the referencecounts that are temporarily stored in CustRefs, whichis obtained, in SQL terms, using a GROUP BY on Churn
and EID along with a COUNT. The list of EID values forState=WI (and Size=L) are also obtained. Thus, we canreduce the sums for those features into smaller sums,viz., 2 terms instead of 5 for State=WI, and 2 instead of4 for Size=L. While training computations are reduced,extra work is needed to obtain the pre-aggregated ref-erences. Thus, whether or not this approach is fasterdepends on the data properties, especially the dimen-sions of the input tables. Santoku uses a simple costmodel to pick the faster approach on a given input.
Usually, the learned ML models are also “scored”, i.e.,their prediction accuracy is validated with a set of testexamples. For Naive Bayes, this requires us to computethe maximum a posteriori (MAP) estimate on a giventest feature vector x as follows: argmaxy∈DY P (Y =y)ΠF∈XP (F = x(F )|Y = y) [4]. Essentially, scoring in-volves a multiplication of conditional probabilities. Thus,we can exploit the redundancy in scoring as well, notjust learning, by factorizing the computations on a testset and pushing them through the joins. We call this
Console
Santoku Optimization
Engine
Execution Engine
In-Memory R
Oracle R Enterprise
SparkR
…
Factorized ML Models
Feature Manager
Cost-based Optimizer
GUI
Figure 3: High-level architecture. Users interact withSantoku either using the GUI or R scripts. Santokuoptimizes the computations using factorized learning,and invokes an underlying R execution engine.
technique factorized scoring, and we use it in Santokuwhen the models need to be validated.
3. SYSTEM OVERVIEWWe discuss Santoku’s architecture (see Figure 3), and
explain how it fits into a standard analytics ecosystem.
Front-end: Santoku provides custom front-ends fortwo kinds of analysts – those who prefer a graphical userinterface (GUI), and those who prefer to write R scripts.The GUI is intuitive and has three major portions (Fig-ure 2(A)). The first portion deals with the data – an-alysts can specify either a multi-table (normalized) in-put or a single-table (denormalized) input. For normal-ized inputs, the analyst specifies the base tables and the“join columns”, i.e., the features on which the tables arejoined (the foreign keys and primary keys in databaseparlance) using menus. For denormalized inputs, theanalyst specifies the single table and any “functional
1866

relationships” among the features (the left and rightsides of FDs in database parlance) using menus. Thesecond portion deals with the ML model – they choosea model and its parameters, and can either train a sin-gle model or perform feature exploration, possibly withvalidation. The third portion displays the results – asummary of the execution for training (Figure 2(B)),and plots comparing several feature vectors for featureexploration (Figure 2(C)). Interestingly, we were ableto implement Santoku’s GUI in R itself using its graph-ics and visualization libraries. The GUI is rendered in abrowser, which makes it portable. Santoku also providesan intuitive API that can be used in R scripts (Fig-ure 2(D)). This enables analysts to exploit Santoku’sfactorized ML models programmatically. The opera-tions on Santoku’s GUI also invoke this API internally.
Santoku Optimization Engine: The core part ofSantoku is its optimization engine, which has three com-ponents. The first component is a library of R codesthat implement factorized learning and scoring for aset of popular ML techniques – decision trees, featureranking, Naive Bayes, and Tree-Augmented Naive Bayes(TAN) [4] as well as linear and logistic regression usinggradient methods [3]. We adapted the implementationsof these models from standard R packages on CRAN.We expect to add more as our system matures. Thesecond component is the feature manager. It manip-ulates the feature vectors of the datasets. It handlesthree major tasks: normalization of single tables usingFDs, denormalization by joining multiple tables, andconstructing the alternative feature vectors for featureexploration. The third component is a cost-based opti-mizer that uses a cost model to determine whether ornot to use factorized learning and scoring on a giveninput (given by the analyst, or constructed internallyas part of feature exploration). The cost model is cali-brated based on the R execution engine.
Back-end: Since Santoku is implemented in R, it sim-ply “piggybacks” on existing R execution engines, withthe standard in-memory R perhaps being the most pop-ular. Several commercial and open-source systems scaleR to different data platforms, e.g., Oracle R Enterpriseoperates over an RDBMS (and Hive), while SparkR op-erates over the Spark distributed engine. Such systemsenable Santoku to automatically scale to large datasets.
4. DEMONSTRATION DETAILSWe divide the demonstration into three phases: (1)
A brief introduction to factorized learning with an ex-ample, and an overview of Santoku. (2) A “hands-on” phase in which we demonstrate Santoku’s GUI andAPI in an R console to show its benefits on multi-ple datasets. (3) A performance comparison phase inwhich we present Santoku’s performance against naiveapproaches on both real and synthetic datasets to givea better picture of Santoku’s optimizations. We willuse animated slides during the demonstration to explainthe example. Next, we describe the hands-on phase (the
GUI and the R console) as well as the performance com-parison phase in more detail.
End-to-end Execution with GUI: We demonstrateboth multi-table (normalized) and single-table (denor-malized) inputs using real datasets from different appli-cation domains – retail, hospitality, transportation, andrecommendation systems. A Santoku user can specifythe kind of input as well as the join columns (for normal-ized input) or the functional relationships between fea-tures (for denormalized input) on the GUI using drop-down menus that list the features. We will provide theschemas of our datasets to help users choose features.The user can then select an ML model they want andspecify its parameters (or use default parameters). Fi-nally, they can run the training. They also have anoption of validating the model to check its accuracy ona test set. This step is illustrated in Figure 2(A). Thequality and performance results of the execution will bedisplayed on the screen, as illustrated in Figure 2(B).They can then try feature exploration, possibly includ-ing validation. Santoku will automatically create mul-tiple feature vectors and plot their quality and perfor-mance results, as illustrated in Figure 2(C). This willdemonstrate how Santoku can be helpful in selectinga more accurate subset of features. The user can alsochange the ML model to see new results displayed, orperform a similar exploration with another dataset.
R Script with Console: We demonstrate how San-toku’s API can be used in R scripts. We will show thescripts that are automatically generated by the GUI-based input specifications from the previous phase. Theuser can edit the scripts in an R console and modify thespecifications. We will explain the usage of the functionsin our API. This will show how more advanced analystsmight interact with Santoku. This step is illustratedwith a screenshot in Figure 2(D).
Performance Comparison: We demonstrate the ex-ecutions of the R scripts on the real datasets with San-toku’s optimizer disabled. This will provide a betterpicture of the performance optimizations performed bySantoku. We present a set of “offline” results based onsynthetic datasets that drill into Santoku’s optimizer byvarying the number of tables joined, the number of tu-ples, the number of features, different ML models, etc.This will provide users with a better picture of the per-formance tradeoff space for Santoku’s optimizer whenoperating over normalized data without having to waitfor these executions to finish.
5. REFERENCES[1] M. Anderson et al. Brainwash: A Data System for Feature
Engineering. In CIDR, 2013.
[2] P. Konda et al. Feature Selection in Enterprise Analytics:A Demonstration using an R-based Data Analytics System.In VLDB, 2013.
[3] A. Kumar et al. Learning Generalized Linear Models OverNormalized Data. In SIGMOD, 2015.
[4] T. M. Mitchell. Machine Learning. McGraw Hill, 1997.
[5] C. Zhang et al. Materialization Optimizations for FeatureSelection Workloads. In SIGMOD, 2014.
1867