Embed Size (px)
Citation preview

1 November 27, 2017 | ©2017 Kaiser Foundation Health Plan, Inc.
Demonstration of Math and Actuarial Principles in Health InsuranceUCLA BAS – November 27th, 2017
Lorenz Glaza, FSA, MAAA
Agenda
2
Topic Objective
• Introduction
• Basic Terminology
• Spotlight Discussions
• Probability and Statistics/Construction of
Actuarial Models
• Numerical Analysis/Linear Algebra
• Life Contingencies/Financial Economics
• Get to know each other/get you excited about Math
• Overview of basic terminology
• Discussion of principles from the Actuarial exams and UCLA
courses
• Applications of theoretical models in real-world business situations
• Really, we use some of the more advanced math stuff we learn
from UCLA and from the Actuarial exams

Introduction


Basic Terminology

Deductible - A specified amount of money that the insured must pay before an
insurance company will begin providing benefits (i.e. paying of medical claims).
Embedded Deductible – Under a family contract, it is the individual deductible that
each member is responsible for.
Aggregate Deductible – Under a family contract, the common deductible that
applies to all insureds. The deductible can be paid by one or several members.
Out of Pocket Maximum - The most an insured has to out of pocket during a policy
period (usually a year) for health care services.
Coinsurance – A percent share of the claim an insured must pay.
Lapse Rate - The rate at which an insurance policy terminates usually because of
failure to pay the premiums or death.

Spotlight Discussions

Probability and StatisticsExam P
Construction of Actuarial ModelsExam C

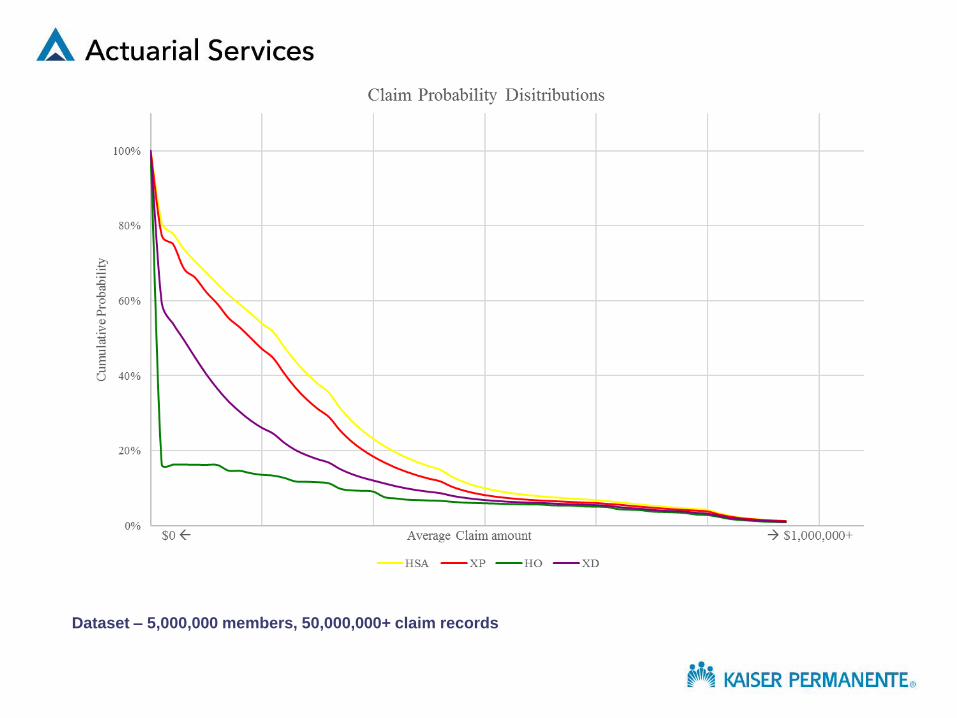
Building a Claims Probability Distribution (CPD):
1. Need data
Use experience data which is discrete
2. What to consider so we can summarize the data
What are we trying to do? Value deductibles, benefit maximums, per script maximums?
At what level of data do we need our data? Member level, claim level?
How do we want to express our data?
What variables do we need? Claim allowed amounts, types of services, dates of service, etc.?
How large is the dataset we are using? How can we be efficient in how we summarize our data?
3. Let’s summarize the data
4. How do we know if the distribution is credible/usable?
Statistical analysis can be performed
Work experience/common sense helps to know if the results are reasonable

Dataset – 5,000,000+ members, 50,000,000+ claim records
Roughly 1 in 8 Californians

CLAIM PROBABILITY DISTRIBUTION
(1) (2) (3) (4) (5)
Probability Annual Cost
Claims are of Claims
Total Annual Greater Than Greater Than
Annual Annual Cost of or Equal to or Equal to
Frequency Claim Claim Column 2 Column 2
0.8359830 $0.00 $0.00 1.0000000 $2,515.22
0.0002127 $28.47 $0.01 0.1640170 $2,515.22
0.0003144 $75.18 $0.02 0.1638043 $2,515.21
0.0003980 $124.16 $0.05 0.1634899 $2,515.19
0.0003421 $173.98 $0.06 0.1630919 $2,515.14
0.0003103 $224.81 $0.07 0.1627498 $2,515.08
0.0151644 $274.74 $4.17 0.1624395 $2,515.01
0.0002242 $324.89 $0.07 0.1472751 $2,510.84
0.0065839 $355.82 $2.34 0.1470509 $2,510.77
0.0043014 $443.91 $1.91 0.1404670 $2,508.43
0.0018799 $484.50 $0.91 0.1361656 $2,506.52
0.0062227 $541.71 $3.37 0.1342857 $2,505.61
0.0094493 $646.20 $6.11 0.1280630 $2,502.24
0.0008870 $752.00 $0.67 0.1186137 $2,496.13
0.0013524 $851.94 $1.15 0.1177267 $2,495.46
0.0027165 $930.15 $2.53 0.1163743 $2,494.31
0.0142911 $1,129.83 $16.15 0.1136578 $2,491.78
0.0045062 $1,328.49 $5.99 0.0993667 $2,475.63
0.0014211 $1,491.12 $2.12 0.0948605 $2,469.64
0.0020347 $1,720.09 $3.50 0.0934394 $2,467.52
0.0148140 $1,907.31 $28.25 0.0914047 $2,464.02
0.0033126 $2,080.23 $6.89 0.0765907 $2,435.77
0.0032845 $2,273.10 $7.47 0.0732781 $2,428.88
0.0011410 $2,489.57 $2.84 0.0699936 $2,421.41
0.0010695 $2,682.69 $2.87 0.0688526 $2,418.57

1A HSA 1B XP 2A HO 5A XD
Pr(Claim) Avg Claim Amt Pr(Claim) Avg Claim Amt Pr(Claim) Avg Claim Amt Pr(Claim) Avg Claim Amt
0.1920810 $0.00 0.2258301 $0.00 0.8359827 $0.00 0.4056799 $0.00
0.0283029 29.56 0.0225886 34.11 0.0002127 28.47 0.0550497 36.21
0.0424781 85.93 0.0665892 88.58 0.0003144 75.18 0.0445185 78.56
0.0322477 122.96 0.0239146 126.11 0.0003980 124.16 0.0468316 121.59
0.0300715 176.64 0.0386297 177.16 0.0003421 173.98 0.0443365 174.81
0.0299126 222.23 0.0314649 220.50 0.0003103 224.81 0.0388783 222.52
0.0294778 275.73 0.0377795 275.40 0.0151644 274.74 0.0338326 274.35
0.0245889 324.77 0.0244346 325.17 0.0002242 324.89 0.0272280 323.45
0.0249513 374.21 0.0290306 372.65 0.0065839 355.82 0.0239903 371.74
0.0267688 423.53 0.0289123 423.08 0.0043014 443.91 0.0191783 425.30
0.0219945 474.77 0.0239112 474.37 0.0018799 484.50 0.0151545 474.05
0.0406693 548.24 0.0415431 547.74 0.0062227 541.71 0.0245550 545.92
0.0379326 647.23 0.0379698 646.29 0.0094493 646.20 0.0194220 646.57
0.0321368 747.91 0.0308174 747.14 0.0008870 752.00 0.0136808 748.86
0.0272855 848.91 0.0256398 848.20 0.0013524 851.94 0.0108113 848.14
0.0239394 948.82 0.0215171 948.34 0.0027165 930.15 0.0091097 948.92
0.0408286 1,096.54 0.0358569 1,095.43 0.0142911 1,129.83 0.0170319 1,099.27
0.0334127 1,296.15 0.0288626 1,294.93 0.0045062 1,328.49 0.0128534 1,295.40
0.0267005 1,496.65 0.0225108 1,495.32 0.0014211 1,491.12 0.0099590 1,494.88
0.0227243 1,697.76 0.0188113 1,697.13 0.0020347 1,720.09 0.0078685 1,695.98
0.0192855 1,897.06 0.0158268 1,896.76 0.0148140 1,907.31 0.0077990 1,901.65
0.0165371 2,096.84 0.0136593 2,095.09 0.0033126 2,080.23 0.0073811 2,092.82
0.0141144 2,297.70 0.0113897 2,296.94 0.0032845 2,273.10 0.0060126 2,295.09
0.0122113 2,497.69 0.0097671 2,497.64 0.0011410 2,489.57 0.0049034 2,495.90
0.0105659 2,697.81 0.0081796 2,696.91 0.0010695 2,682.69 0.0039746 2,694.94
0.0090844 2,897.46 0.0071234 2,896.49 0.0008448 2,899.72 0.0035592 2,895.07
0.0180807 3,236.53 0.0137421 3,235.72 0.0024116 3,186.38 0.0068276 3,235.32
Dataset – 5,000,000 members, 50,000,000+ claim records
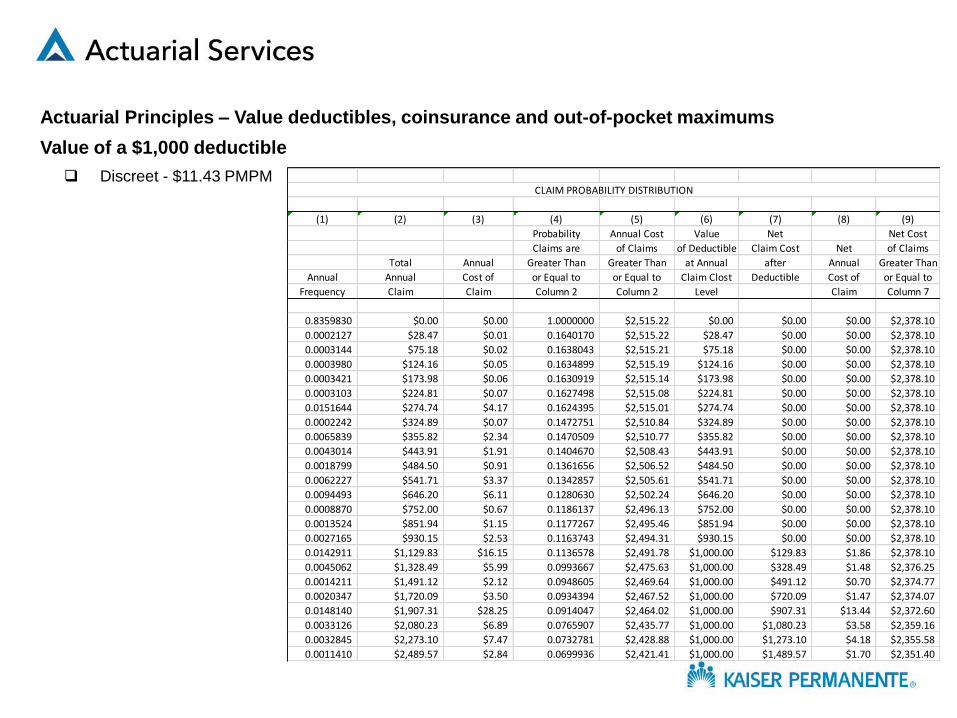
Actuarial Principles – Value deductibles, coinsurance and out-of-pocket maximums
Value of a $1,000 deductible
Discreet - $11.43 PMPMCLAIM PROBABILITY DISTRIBUTION
(1) (2) (3) (4) (5) (6) (7) (8) (9)
Probability Annual Cost Value Net Net Cost
Claims are of Claims of Deductible Claim Cost Net of Claims
Total Annual Greater Than Greater Than at Annual after Annual Greater Than
Annual Annual Cost of or Equal to or Equal to Claim Clost Deductible Cost of or Equal to
Frequency Claim Claim Column 2 Column 2 Level Claim Column 7
0.8359830 $0.00 $0.00 1.0000000 $2,515.22 $0.00 $0.00 $0.00 $2,378.10
0.0002127 $28.47 $0.01 0.1640170 $2,515.22 $28.47 $0.00 $0.00 $2,378.10
0.0003144 $75.18 $0.02 0.1638043 $2,515.21 $75.18 $0.00 $0.00 $2,378.10
0.0003980 $124.16 $0.05 0.1634899 $2,515.19 $124.16 $0.00 $0.00 $2,378.10
0.0003421 $173.98 $0.06 0.1630919 $2,515.14 $173.98 $0.00 $0.00 $2,378.10
0.0003103 $224.81 $0.07 0.1627498 $2,515.08 $224.81 $0.00 $0.00 $2,378.10
0.0151644 $274.74 $4.17 0.1624395 $2,515.01 $274.74 $0.00 $0.00 $2,378.10
0.0002242 $324.89 $0.07 0.1472751 $2,510.84 $324.89 $0.00 $0.00 $2,378.10
0.0065839 $355.82 $2.34 0.1470509 $2,510.77 $355.82 $0.00 $0.00 $2,378.10
0.0043014 $443.91 $1.91 0.1404670 $2,508.43 $443.91 $0.00 $0.00 $2,378.10
0.0018799 $484.50 $0.91 0.1361656 $2,506.52 $484.50 $0.00 $0.00 $2,378.10
0.0062227 $541.71 $3.37 0.1342857 $2,505.61 $541.71 $0.00 $0.00 $2,378.10
0.0094493 $646.20 $6.11 0.1280630 $2,502.24 $646.20 $0.00 $0.00 $2,378.10
0.0008870 $752.00 $0.67 0.1186137 $2,496.13 $752.00 $0.00 $0.00 $2,378.10
0.0013524 $851.94 $1.15 0.1177267 $2,495.46 $851.94 $0.00 $0.00 $2,378.10
0.0027165 $930.15 $2.53 0.1163743 $2,494.31 $930.15 $0.00 $0.00 $2,378.10
0.0142911 $1,129.83 $16.15 0.1136578 $2,491.78 $1,000.00 $129.83 $1.86 $2,378.10
0.0045062 $1,328.49 $5.99 0.0993667 $2,475.63 $1,000.00 $328.49 $1.48 $2,376.25
0.0014211 $1,491.12 $2.12 0.0948605 $2,469.64 $1,000.00 $491.12 $0.70 $2,374.77
0.0020347 $1,720.09 $3.50 0.0934394 $2,467.52 $1,000.00 $720.09 $1.47 $2,374.07
0.0148140 $1,907.31 $28.25 0.0914047 $2,464.02 $1,000.00 $907.31 $13.44 $2,372.60
0.0033126 $2,080.23 $6.89 0.0765907 $2,435.77 $1,000.00 $1,080.23 $3.58 $2,359.16
0.0032845 $2,273.10 $7.47 0.0732781 $2,428.88 $1,000.00 $1,273.10 $4.18 $2,355.58
0.0011410 $2,489.57 $2.84 0.0699936 $2,421.41 $1,000.00 $1,489.57 $1.70 $2,351.40

Actuarial Principles – Value deductibles, coinsurance and out-of-pocket maximums
Value of a $1,000 deductible
2 ways to value the deductible
Short-hand:
((Total Gross Annual Claims) – ((Claims in Excess of the Deductible – (Deductible) * (Probability of Member
Exceeding the Deductible)))/12
In Excel: =E22/12-(VLOOKUP(F6,$B$22:$E$121,4)-F6*VLOOKUP(F6,$B$22:$D$121,3))/12
What value did you get?

Actuarial Principles – Value deductibles, coinsurance and out-of-pocket maximums
Value of a $6,000 Out-Of-Pocket (OOP) Credit
We need to know the deductible and coinsurance amount – Let’s assume a $1,000 deductible and 20% coinsurance
Need to calculate the trigger amount – The gross claim amount where a member would hit their OOP
(OOP – Deductible)/(Coinsurance) + Deductible
If we did not have any out-of-pocket protection, the member could pay over $200,000 in out-of-pocket costs!
Value of Gross Claims $2,515.22
Value of Member Cost Share Before OOP Adjustment $612.71
Value of OOP Adjustment $250.60
Net Adjustment for Member OOP $362.11
Estimated Net Health Plan Paid Claims $2,153.11
Benefit Plan Value 85.6%

Actuarial Principles – Value deductibles, coinsurance and out-of-pocket maximums
CLAIM PROBABILITY DISTRIBUTION CLAIM COST SUMMARY
(1) (2) (3) (4) (5) (6) (7) (8) (9) (10)
Probability Annual Cost
Claims are of Claims Value of Annual Adjustment
Total Annual Greater Than Greater Than OOP Value of for Value with Credit
Annual Annual Cost of or Equal to or Equal to Before OOP Member $6,000 OOP $6,000 for
Frequency Claim Claim Column 2 Column 2 Adjustment Cost Share Adjustment OOP $6,000 OOP
0.8359830 $0.00 $0.00 1.0000000 $2,515.22 $0.00 $0.00 $0.00 $0.00 $0.00
0.0002127 28.47 0.01 0.1640170 2,515.22 28.47 $0.01 28.47 $0.01 $0.00
0.0003144 75.18 0.02 0.1638043 2,515.21 75.18 $0.02 75.18 $0.02 $0.00
0.0018084 17,535.55 31.71 0.0362035 2,121.81 4,307.11 $7.79 4,307.11 $7.79 $0.00
0.0039754 18,418.42 73.22 0.0343951 2,090.10 4,483.68 $17.82 4,483.68 $17.82 $0.00
0.0013475 19,445.74 26.20 0.0304197 2,016.88 4,689.15 $6.32 4,689.15 $6.32 $0.00
0.0048922 22,274.10 108.97 0.0290722 1,990.68 5,254.82 $25.71 5,254.82 $25.71 $0.00
0.0056290 26,998.55 151.97 0.0241800 1,881.71 6,199.71 $34.90 6,000.00 $33.77 $1.12
0.0028679 32,213.40 92.38 0.0185510 1,729.74 7,242.68 $20.77 6,000.00 $17.21 $3.56
0.0020359 37,376.83 76.10 0.0156831 1,637.36 8,275.37 $16.85 6,000.00 $12.22 $4.63
0.0019474 42,300.38 82.38 0.0136472 1,561.26 9,260.08 $18.03 6,000.00 $11.68 $6.35
0.0011634 47,413.98 55.16 0.0116998 1,478.88 10,282.80 $11.96 6,000.00 $6.98 $4.98
0.0009892 52,447.19 51.88 0.0105364 1,423.72 11,289.44 $11.17 6,000.00 $5.94 $5.23
0.0014451 57,914.31 83.69 0.0095472 1,371.84 12,382.86 $17.89 6,000.00 $8.67 $9.22
0.0007468 62,355.14 46.57 0.0081021 1,288.15 13,271.03 $9.91 6,000.00 $4.48 $5.43
0.0006210 67,381.73 41.84 0.0073553 1,241.58 14,276.35 $8.87 6,000.00 $3.73 $5.14
0.0005440 72,480.87 39.43 0.0067343 1,199.74 15,296.17 $8.32 6,000.00 $3.26 $5.06
0.0006102 77,066.29 47.03 0.0061903 1,160.31 16,213.26 $9.89 6,000.00 $3.66 $6.23
0.0004390 82,491.27 36.21 0.0055801 1,113.28 17,298.25 $7.59 6,000.00 $2.63 $4.96
0.0003897 87,313.43 34.03 0.0051411 1,077.07 18,262.69 $7.12 6,000.00 $2.34 $4.78
0.0003198 92,260.85 29.51 0.0047514 1,043.04 19,252.17 $6.16 6,000.00 $1.92 $4.24
0.0001299 373,665.17 48.54 0.0005788 380.60 75,533.03 $9.81 6,000.00 $0.78 $9.03
0.0000881 425,432.03 37.48 0.0004489 332.06 85,886.41 $7.57 6,000.00 $0.53 $7.04
0.0000616 473,920.84 29.19 0.0003608 294.58 95,584.17 $5.89 6,000.00 $0.37 $5.52
0.0000517 524,757.01 27.13 0.0002992 265.39 105,751.40 $5.47 6,000.00 $0.31 $5.16
0.0000393 573,394.12 22.53 0.0002475 238.26 115,478.82 $4.54 6,000.00 $0.24 $4.30
0.0000290 624,706.63 18.12 0.0002082 215.73 125,741.33 $3.65 6,000.00 $0.17 $3.47
0.0000236 677,900.80 16.00 0.0001792 197.61 136,380.16 $3.22 6,000.00 $0.14 $3.08
0.0001556 1,167,134.51 181.61 0.0001556 181.61 234,226.90 $36.45 6,000.00 $0.93 $35.51

Numerical AnalysisUCLA Math Course 151
Linear AlgebraUCLA Math Course 33/115
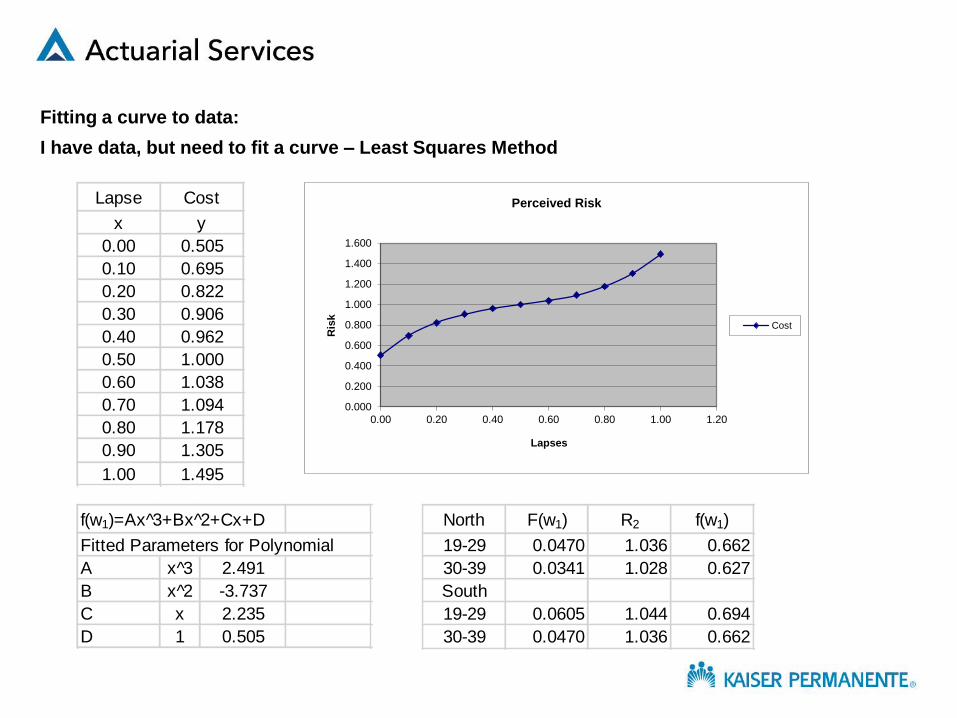
Fitting a curve to data:
I have data, but need to fit a curve – Least Squares Method
Lapse Cost
x y
0.00 0.505
0.10 0.695
0.20 0.822
0.30 0.906
0.40 0.962
0.50 1.000
0.60 1.038
0.70 1.094
0.80 1.178
0.90 1.305
1.00 1.495
0.000
0.200
0.400
0.600
0.800
1.000
1.200
1.400
1.600
0.00 0.20 0.40 0.60 0.80 1.00 1.20
Ris
k
Lapses
Perceived Risk
Cost
North F(w1) R2 f(w1)
19-29 0.0470 1.036 0.662
30-39 0.0341 1.028 0.627
South
19-29 0.0605 1.044 0.694
30-39 0.0470 1.036 0.662
f(w1)=Ax 3̂+Bx 2̂+Cx+D
Fitted Parameters for Polynomial
A x 3̂ 2.491
B x 2̂ -3.737
C x 2.235
D 1 0.505

Northern CA Age/Step Adjustments Southern CA Age/Step Adjustments
North South
Lapse Rate for 19-29 year olds 8.00% Lapse Rate for 19-29 year olds 10.00%
Lapse Rate for 30-39 year olds 6.00% Lapse Rate for 30-39 year olds 8.00%
Additional Rate Increase to 19-29 year olds 3.6% Additional Rate Increase to 19-29 year olds 4.4%
Additional Rate Increase to 30-39 year olds 2.8% Additional Rate Increase to 30-39 year olds 3.6%
Risk Factor for remaining 19-29 year olds 1.036 Risk Factor for remaining 19-29 year olds 1.044
Risk Factor for remaining 30-39 year olds 1.028 Risk Factor for remaining 30-39 year olds 1.036
North Results South Results
Expected Change in Margin 0.16% Expected % Change in Margin 0.19%
Age/Step Factors Age/Step Factors
Age SUB ONLYSUB+SP SUB+CH SUB+CHNFAMILY Age SUB ONLYSUB+SP SUB+CH SUB+CHNFAMILY
<1 0.889 1.778 1.778 2.667 2.667 <1 0.889 1.778 1.778 2.667 2.667
1-18 0.683 1.367 1.367 2.050 2.050 1-18 0.683 1.367 1.367 2.050 2.050
19-29 0.867 1.926 1.762 2.521 2.913 19-29 0.867 1.926 1.762 2.521 2.913
30-39 1.000 2.189 2.050 2.744 3.300 30-39 1.000 2.189 2.050 2.744 3.300
40-49 1.233 2.402 2.050 2.744 3.351 40-49 1.233 2.402 2.050 2.744 3.351
50-59 1.629 3.174 2.515 2.982 3.705 50-59 1.629 3.174 2.515 2.982 3.705
60-64 1.941 3.762 2.883 3.542 4.187 60-64 1.941 3.762 2.883 3.542 4.187
New Age/Step Factors with Revenue Neutrality New Age/Step Factors with Revenue Neutrality
Age SUB ONLYSUB+SP SUB+CH SUB+CHNFAMILY Age SUB ONLYSUB+SP SUB+CH SUB+CHNFAMILY
<1 0.903 1.806 1.806 2.708 2.708 <1 0.908 1.816 1.816 2.724 2.724
1-18 0.675 1.351 1.351 2.026 2.026 1-18 0.674 1.348 1.348 2.022 2.022
19-29 0.887 1.972 1.804 2.581 2.983 19-29 0.892 1.983 1.814 2.596 2.999
30-39 1.016 2.223 2.082 2.787 3.352 30-39 1.022 2.236 2.094 2.804 3.371
40-49 1.218 2.374 2.026 2.713 3.312 40-49 1.216 2.369 2.022 2.707 3.305
50-59 1.610 3.137 2.486 2.948 3.662 50-59 1.607 3.130 2.480 2.941 3.654
60-64 1.919 3.718 2.850 3.501 4.138 60-64 1.914 3.710 2.844 3.493 4.129
Final Impact including Revenue Neutrality Final Impact including Revenue Neutrality
Age SUB ONLYSUB+SP SUB+CH SUB+CHNFAMILY Age SUB ONLYSUB+SP SUB+CH SUB+CHNFAMILY
<1 1.56% 1.56% 1.56% 1.56% 1.56% <1 2.16% 2.16% 2.16% 2.16% 2.16%
1-18 -1.16% -1.16% -1.16% -1.16% -1.16% 1-18 -1.38% -1.38% -1.38% -1.38% -1.38%
19-29 2.39% 2.39% 2.39% 2.39% 2.39% 19-29 2.95% 2.95% 2.95% 2.95% 2.95%
30-39 1.56% 1.56% 1.56% 1.56% 1.56% 30-39 2.16% 2.16% 2.16% 2.16% 2.16%
40-49 -1.16% -1.16% -1.16% -1.16% -1.16% 40-49 -1.38% -1.38% -1.38% -1.38% -1.38%
50-59 -1.16% -1.16% -1.16% -1.16% -1.16% 50-59 -1.38% -1.38% -1.38% -1.38% -1.38%
60-64 -1.16% -1.16% -1.16% -1.16% -1.16% 60-64 -1.38% -1.38% -1.38% -1.38% -1.38%

Current Pricing Units Current Pricing Change
Age SUB ONLY SUB+SP SUB+CH SUB+CHN FAMILY Age SUB ONLY SUB+SP SUB+CH SUB+CHN FAMILY Age SUB ONLYSUB+SP SUB+CH SUB+CHN FAMILY
<1 0.8889 1.7778 1.7778 2.6667 2.6667 <1 158.00 317.00 317.00 475.00 475.00 <1 0.00% 0.00% 0.00% 0.00% 0.00%
1-18 0.6834 1.3669 1.3669 2.0503 2.0503 1-18 122.00 244.00 244.00 365.00 365.00 1-18 -3.47% -3.47% -3.47% -3.47% -3.47%
19-29 0.8668 1.9262 1.7617 2.5213 2.9130 19-29 154.00 343.00 314.00 449.00 519.00 19-29 0.77% 0.77% 0.77% 0.77% 0.77%
30-39 1.0000 2.1889 2.0500 2.7444 3.3000 30-39 178.00 390.00 365.00 489.00 588.00 30-39 0.00% 0.00% 0.00% 0.00% 0.00%
40-49 1.2327 2.4016 2.0500 2.7444 3.3509 40-49 220.00 428.00 365.00 489.00 597.00 40-49 -3.47% -3.47% -3.47% -3.47% -3.47%
50-59 1.6294 3.1738 2.5149 2.9825 3.7051 50-59 290.00 565.00 448.00 531.00 660.00 50-59 -3.47% -3.47% -3.47% -3.47% -3.47%
60-64 1.9411 3.7617 2.8833 3.5421 4.1868 60-64 346.00 670.00 514.00 631.00 746.00 60-64 -3.47% -3.47% -3.47% -3.47% -3.47%
Current PSPM Cost Current Subscirbership Final Impact including Rev Neu, Trend and Ben Adj
Age SUB ONLY SUB+SP SUB+CH SUB+CHN FAMILY Age SUB ONLY SUB+SP SUB+CH SUB+CHN FAMILY Age SUB ONLYSUB+SP SUB+CH SUB+CHN FAMILY
<1 172.89 0.00 607.96 260.40 0.00 <1 623 - 22 1 - <1 2.16% 2.16% 2.16% 2.16% 2.16%
1-18 105.43 427.02 181.01 233.93 253.00 1-18 7,899 2 781 60 1 1-18 -1.38% -1.38% -1.38% -1.38% -1.38%
19-29 131.07 397.61 338.26 443.49 504.54 19-29 20,835 808 1,007 291 905 19-29 2.95% 2.95% 2.95% 2.95% 2.95%
30-39 179.58 391.21 352.68 332.13 483.85 30-39 14,400 1,864 1,126 673 3,803 30-39 2.16% 2.16% 2.16% 2.16% 2.16%
40-49 190.83 337.68 249.15 373.88 428.26 40-49 13,186 2,381 1,010 597 3,991 40-49 -1.38% -1.38% -1.38% -1.38% -1.38%
50-59 218.97 378.61 295.59 305.12 504.50 50-59 14,752 3,318 297 87 961 50-59 -1.38% -1.38% -1.38% -1.38% -1.38%
60-64 259.78 481.32 312.59 565.25 526.57 60-64 9,442 1,524 20 7 85 60-64 -1.38% -1.38% -1.38% -1.38% -1.38%
Experience Proposed Pricing Units Current Margin per cell by Units
Age SUB ONLY SUB+SP SUB+CH SUB+CHN FAMILY Age SUB ONLY SUB+SP SUB+CH SUB+CHN FAMILY Age SUB ONLYSUB+SP SUB+CH SUB+CHN FAMILY
<1 0.9627 0.0000 3.3855 1.4500 0.0000 <1 0.8889 1.7778 1.7778 2.6667 2.6667 <1 -8.31% 100.00% -90.43% 45.62% 100.00%
1-18 0.5871 2.3779 1.0080 1.3027 1.4089 1-18 0.6598 1.3195 1.3195 1.9793 1.9793 1-18 14.09% -73.96% 26.26% 36.46% 31.29%
19-29 0.7299 2.2141 1.8836 2.4696 2.8096 19-29 0.8734 1.9410 1.7753 2.5406 2.9354 19-29 15.79% -14.95% -6.92% 2.05% 3.55%
30-39 1.0000 2.1785 1.9639 1.8495 2.6944 30-39 1.0000 2.1889 2.0500 2.7444 3.3000 30-39 0.00% 0.48% 4.20% 32.61% 18.35%
40-49 1.0627 1.8804 1.3874 2.0820 2.3848 40-49 1.1899 2.3183 1.9789 2.6493 3.2347 40-49 13.79% 21.70% 32.32% 24.14% 28.83%
50-59 1.2194 2.1083 1.6460 1.6991 2.8093 50-59 1.5729 3.0638 2.4277 2.8791 3.5767 50-59 25.16% 33.57% 34.55% 43.03% 24.18%
60-64 1.4466 2.6803 1.7407 3.1476 2.9322 60-64 1.8738 3.6314 2.7834 3.4194 4.0417 60-64 25.47% 28.75% 39.63% 11.14% 29.96%
Expected PSPM Cost Expected Margin per cell
Age SUB ONLY SUB+SP SUB+CH SUB+CHN FAMILY Age SUB ONLY SUB+SP SUB+CH SUB+CHN FAMILY Current margin 19.02%
<1 172.89 0.00 607.96 260.40 0.00 <1 -4.55% 100.00% -83.83% 47.51% 100.00% Expected Margin 19.21%
1-18 105.43 427.02 181.01 233.93 253.00 1-18 14.09% -73.96% 26.26% 36.46% 31.29%
19-29 136.82 415.05 353.10 462.94 526.67 19-29 15.79% -14.95% -6.92% 2.05% 3.55%
30-39 186.03 405.25 365.34 344.05 501.23 30-39 0.00% 0.48% 4.20% 32.61% 18.35%
40-49 190.83 337.68 249.15 373.88 428.26 40-49 13.79% 21.70% 32.32% 24.14% 28.83%
50-59 218.97 378.61 295.59 305.12 504.50 50-59 25.16% 33.57% 34.55% 43.03% 24.18%
60-64 259.78 481.32 312.59 565.25 526.57 60-64 25.47% 28.75% 39.63% 11.14% 29.96%
Expected Experience Expected Subscirbership
Age SUB ONLY SUB+SP SUB+CH SUB+CHN FAMILY Age SUB ONLY SUB+SP SUB+CH SUB+CHN FAMILY
<1 0.9294 0.0000 3.2681 1.3998 0.0000 <1 623 - 22 1 -
1-18 0.5668 2.2955 0.9730 1.2575 1.3600 1-18 7,899 2 781 60 1
19-29 0.7355 2.2311 1.8981 2.4886 2.8311 19-29 18,751 727 907 262 814
30-39 1.0000 2.1785 1.9639 1.8495 2.6944 30-39 13,248 1,715 1,036 619 3,499
40-49 1.0258 1.8152 1.3393 2.0098 2.3022 40-49 13,186 2,381 1,010 597 3,991
50-59 1.1771 2.0353 1.5890 1.6402 2.7120 50-59 14,752 3,318 297 87 961
60-64 1.3965 2.5874 1.6803 3.0385 2.8306 60-64 9,442 1,524 20 7 85

Multidimension Matrix Calculations:
1. Want to value deductibles and out-of-pocket maximums for multiple party contracts
2. Need to make Actuarial assumptions
Ex., Members act independently of each other and distribution of claims are independent
3. Need to represent vectors and matrices in Excel
2-dimensional: u=(u1,u2,u3, …,um) and v=(v1,v2,v3,…,vn), each representing a vector of probabilities of claims

Multidimension Matrix Calculations:
Represent dimensional vectors and matrices in Excel
3-dimensional
Let’s take a look at a model in Excel…

Life ContingenciesExam MLC
Financial EconomicsFM

Lapse Study: Create lapse rates by cohort
CohortMonth 1/1/1999 2/1/1999 3/1/1999 4/1/1999 5/1/1999 6/1/1999 7/1/1999 8/1/1999 9/1/1999 10/1/1999 11/1/1999 12/1/1999
1 3,860 2,848 3,972 2,836 2,760 2,695 3,012 2,743 5,454 3,007 38 2,808
2 3,619 2,504 3,777 2,655 2,588 2,519 2,838 2,395 5,098 2,888 36 2,445
3 3,454 2,417 3,593 2,525 2,414 2,395 2,536 2,254 5,058 2,727 27 2,333
4 3,273 2,295 3,431 2,394 2,296 2,153 2,403 2,246 4,812 2,524 27 2,185
5 3,081 2,215 3,282 2,289 2,067 2,037 2,388 2,137 4,425 2,379 23 1,978
6 2,953 2,124 3,142 2,073 1,976 2,017 2,257 1,961 4,260 2,275 22 1,968
7 2,851 2,024 2,898 1,979 1,965 1,926 2,088 1,889 4,080 2,086 22 1,890
8 2,739 1,854 2,778 1,969 1,880 1,784 1,999 1,814 3,804 2,081 21 1,864
9 2,544 1,791 2,762 1,889 1,748 1,712 1,921 1,690 3,787 1,998 20 1,738
10 2,458 1,786 2,660 1,771 1,682 1,645 1,785 1,688 3,653 1,974 17 1,668
11 2,451 1,713 2,495 1,719 1,620 1,531 1,782 1,632 3,619 1,822 15 1,608
12 2,359 1,590 2,409 1,668 1,493 1,527 1,715 1,621 3,384 1,734 15 1,528
13 2,265 1,535 2,328 1,570 1,488 1,473 1,689 1,522 3,241 1,652 14 1,468
14 2,195 1,491 2,195 1,569 1,446 1,463 1,587 1,477 3,125 1,594 14 1,372
15 2,137 1,420 2,190 1,520 1,431 1,372 1,530 1,436 3,014 1,536 14 1,330
16 2,017 1,417 2,119 1,504 1,351 1,320 1,475 1,393 2,918 1,460 14 1,286
17 2,015 1,390 2,097 1,413 1,292 1,277 1,431 1,350 2,767 1,422 14 1,234
18 1,968 1,375 1,994 1,373 1,244 1,241 1,390 1,279 2,683 1,378 14 1,193
19 1,952 1,317 1,923 1,342 1,202 1,212 1,319 1,247 2,599 1,330 12 1,160
20 1,864 1,280 1,879 1,314 1,157 1,147 1,290 1,221 2,532 1,288 10 1,124
21 1,797 1,233 1,818 1,269 1,102 1,108 1,261 1,193 2,453 1,258 10 1,100
22 1,757 1,202 1,774 1,217 1,074 1,089 1,238 1,167 2,401 1,237 10 1,076
23 1,731 1,174 1,694 1,179 1,036 1,070 1,219 1,133 2,338 1,202 10 1,039
24 1,682 1,123 1,642 1,142 1,015 1,046 1,182 1,098 2,275 1,169 10 1,008
25 1,614 1,097 1,604 1,120 989 1,013 1,149 1,078 2,210 1,133 10 991
26 1,575 1,068 1,558 1,096 968 994 1,113 1,049 2,147 1,106 10 949
27 1,528 1,047 1,523 1,069 944 958 1,077 1,033 2,097 1,079 10 921
28 1,504 1,026 1,493 1,047 930 936 1,058 1,011 2,039 1,035 10 906
29 1,480 1,007 1,461 1,027 913 921 1,037 984 1,961 1,013 9 880
30 1,462 980 1,433 1,009 875 897 1,005 948 1,905 1,000 9 872
31 1,433 958 1,405 979 857 877 962 927 1,861 981 9 854
32 1,408 943 1,371 956 838 831 933 906 1,818 967 9 841

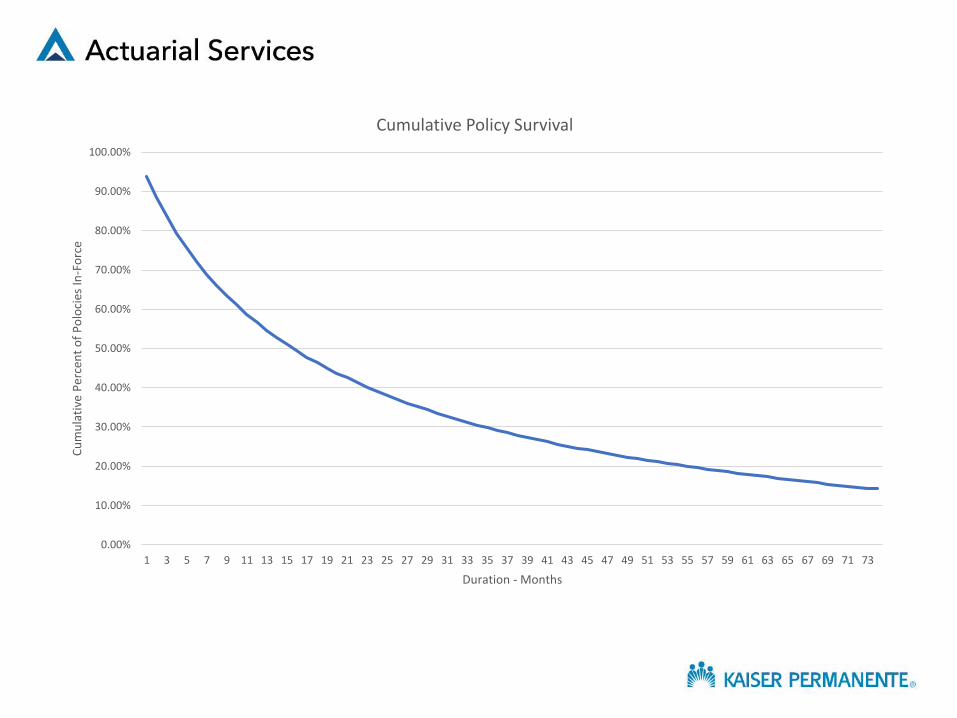
Smoothing of Lapse Rates
Average Policy Life 25.92 Months
2.16 Years
Population Total Lapse
Month 10,000 Average Survival Cumulative Survival
1 9,386 -6.14% 93.86% 93.86%
2 8,852 -5.69% 94.31% 88.52%
3 8,386 -5.26% 94.74% 83.86%
4 7,939 -5.33% 94.67% 79.39%
5 7,563 -4.73% 95.27% 75.63%
6 7,213 -4.63% 95.37% 72.13%
7 6,897 -4.38% 95.62% 68.97%
8 6,614 -4.11% 95.89% 66.14%
9 6,352 -3.96% 96.04% 63.52%
10 6,113 -3.76% 96.24% 61.13%
11 5,873 -3.93% 96.07% 58.73%
12 5,655 -3.72% 96.28% 56.55%
13 5,456 -3.52% 96.48% 54.56%
14 5,276 -3.31% 96.69% 52.76%
15 5,100 -3.33% 96.67% 51.00%
16 4,933 -3.26% 96.74% 49.33%
17 4,774 -3.22% 96.78% 47.74%
18 4,630 -3.03% 96.97% 46.30%
19 4,497 -2.87% 97.13% 44.97%
20 4,371 -2.81% 97.19% 43.71%
21 4,248 -2.80% 97.20% 42.48%
22 4,127 -2.86% 97.14% 41.27%
23 4,004 -2.97% 97.03% 40.04%
24 3,901 -2.59% 97.41% 39.01%
25 3,792 -2.79% 97.21% 37.92%
26 3,695 -2.55% 97.45% 36.95%
27 3,603 -2.48% 97.52% 36.03%
28 3,520 -2.32% 97.68% 35.20%
29 3,434 -2.44% 97.56% 34.34%
0.00%
10.00%
20.00%
30.00%
40.00%
50.00%
60.00%
70.00%
80.00%
90.00%
100.00%
1 3 5 7 9 11 13 15 17 19 21 23 25 27 29 31 33 35 37 39 41 43 45 47 49 51 53 55 57 59 61 63 65 67 69 71 73
Cu
mu
lati
ve P
erce
nt
of
Po
loci
es In
-Fo
rce
Duration - Months
Cumulative Policy Survival
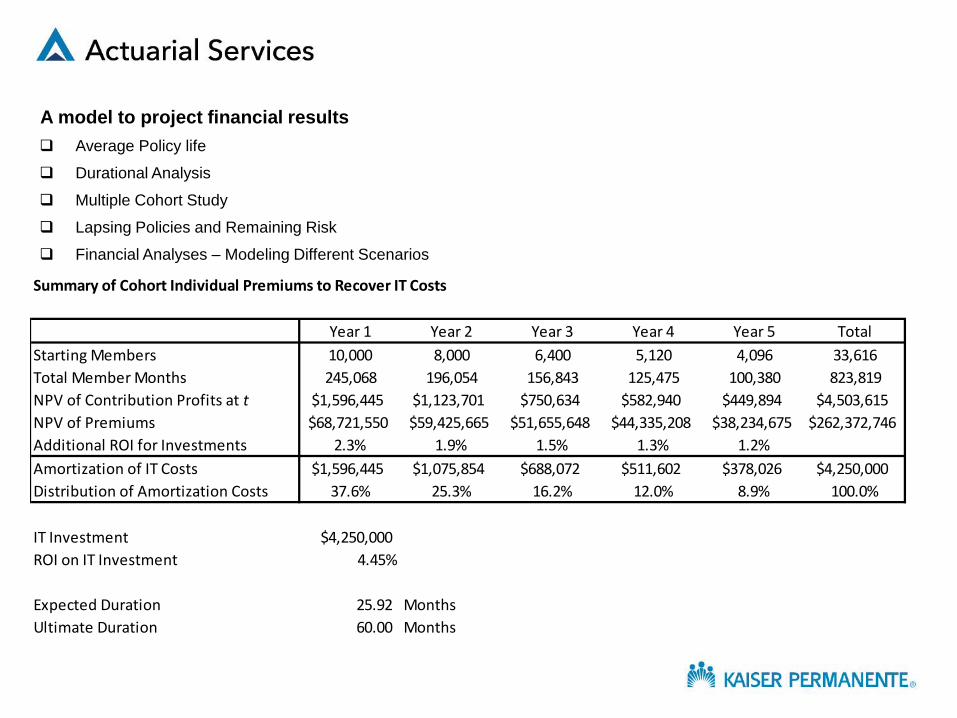
A model to project financial results
Average Policy life
Durational Analysis
Multiple Cohort Study
Lapsing Policies and Remaining Risk
Financial Analyses – Modeling Different Scenarios
Summary of Cohort Individual Premiums to Recover IT Costs
Year 1 Year 2 Year 3 Year 4 Year 5 Total
Starting Members 10,000 8,000 6,400 5,120 4,096 33,616
Total Member Months 245,068 196,054 156,843 125,475 100,380 823,819
NPV of Contribution Profits at t $1,596,445 $1,123,701 $750,634 $582,940 $449,894 $4,503,615
NPV of Premiums $68,721,550 $59,425,665 $51,655,648 $44,335,208 $38,234,675 $262,372,746
Additional ROI for Investments 2.3% 1.9% 1.5% 1.3% 1.2%
Amortization of IT Costs $1,596,445 $1,075,854 $688,072 $511,602 $378,026 $4,250,000
Distribution of Amortization Costs 37.6% 25.3% 16.2% 12.0% 8.9% 100.0%
IT Investment $4,250,000
ROI on IT Investment 4.45%
Expected Duration 25.92 Months
Ultimate Duration 60.00 Months