Embed Size (px)
Citation preview

Demonstration and Research Pest ControlOregon Pesticide Safety Education Program
Applicator Training Manual

2 | Demonstration and Research Pest Control
00 AbouT This MAnuAl | 3
This manual has been designed for research scientists, Extension agents, Extension specialists, industry representatives, employees of federal and state government, and other professionals who conduct field research with unregistered experimental pesticides or demonstrations with registered pesticides. It is intended to provide the information needed to meet the minimum standards of the U.S. Environmental Protection Agency (EPA and the Oregon Department of Agriculture (ODA) certification of Pesticide Consultants and Commercial and Public applicators in the Demonstration and Research category. These requirements have been established by EPA and ODA through the Federal Insecticide, Fungicide, and Rodenticide Act (FIFRA) (7 U.S. Code 136i), Title 40 Code of Federal Regulations part 171 (40 CFR 171), ORS 634, and OAR 603-057.This material is a supplement to the information contained in the study manuals suggested for the Laws and Safety exam or the Consultant exam. It should not be used to prepare for certification without referring to these manuals. Thorough study of the information in all study manuals will help users prepare for examinations in the
Demonstration and Research Pest Control category and for meeting ODA’s specific standards of competency established by 40 CFR 171.4(c)(10), ORS 634 and OAR 603-057. In addition to the material covered in the manual, candidates may be responsible for information contained in one or more of the category manuals that are appropriate for a particular pest control activity.Cover photos courtesy of Laurie Gordon, Oregon Department of Agriculture.
About this manual

4 | Demonstration and Research Pest Control

APPliCAToR TRAining MAnuAl | 5
AuthorsDiane Clark, University of California, DavisJanet Fults, Oregon Department of Agriculture, Pesticides DivisionLaurie Gordon, Oregon Department of Agriculture, Pesticides DivisionPatrick J. O’Connor-Marer, University of California DavisMark Matocha, The Texas A&M University SystemRoland Maynard, Oregon Department of Agriculture, Pesticides DivisionDouglass E. Stevenson, The Texas A&M University System
ReviewersRich Affeldt, Oregon State University, Jefferson County Cooperative Extension ServiceCraig Collins, Collins Agr ConsultantsJoe DeFrancisco, Oregon State University, North Willamette Research and Extension CenterGale Gingrich, Oregon State University, Cooperative Extension Service (retired)Mark Mellbye, Oregon State University, Linn County Cooperative Extension ServiceSteve Riley, Oregon Department of Agriculture, Pesticides Division
AcknowledgmentsThis manual was developed using pesticide safety education materials, Extension manuals and publications from Texas Cooperative Extension, the University of California at Davis; the Universities of Georgia, Illinois, Kentucky, Tennessee, Missouri and Nebraska; and from Iowa State, North Carolina State, Oklahoma State and Washington State Universities.Oregon Department of Agriculture reproduced portions of this manual with permission of the copyright holders: The Texas A&M University System and The Regents of the University of California. Further reproduction of this manual is prohibited without written permission of the copyright holder. Contact Oregon Department of Agriculture for more information.
Applicator training manual

6 | Demonstration and Research Pest Control
TAble of ConTenTs | 7
About this manual 3
Applicator training manual 5
1 Demonstration and research pest control laws and regulations 11
2 Good laboratory practice standards (GLPS) 21
3 Pesticide-organism interactions 25
4 Equipment calibration 29
5 Research and the scientific method 31
6 Planning experiments 33
7 Experimental design 35
8 Data collection 49
Appendix A - Review questions 55
Appendix B - Answers to review questions 61
Appendix C - Glossary 63
Appendix D - Table of random rumbers 65
Appendix E - Latin square design 67
Appendix F - Pesticide contacts 69
Table of Contents

8 | Demonstration and Research Pest Control

TAble of ConTenTs | 9

10 | Demonstration and Research Pest Control
1 DeMonsTRATion AnD ReseARCh PesT ConTRol lAws AnD RegulATions | 11
IntroductionState and federal laws and regulations govern the manufacture, sale, transportation, and use of pesticides. At the national level, the United States Environmental Protection Agency (EPA) is the primary pesticide regulatory agency. In Oregon, the State Department of Agriculture (ODA) assumes this role for most pesticide related activities. The EPA’s authority comes from the Federal Insecticide, Fungicide, and Rodenticide Act (FIFRA). Originally passed in 1947, this law has undergone several amendments and updates, including the 1992 Worker Protection Standard and the Food Quality Protection Act of 1996. Based on FIFRA, the EPA establishes regulations for pesticide registration and labeling, and for pesticide residue tolerance levels on or in food or feed. These regulations also set standards for experimental use of pesticide compounds and for certifying commercial and private pesticide applicators to use restricted-use pesticides. Other federal agencies, including the U.S. Department of Agriculture, the National Institute for Occupational Safety
and Health, the U.S. Fish and Wildlife Service, and the U.S. Food and Drug Administration may also monitor and regulate some activities involving pesticide use.Pesticide applicators in all states must comply with federal requirements. Oregon has enacted additional laws and regulations that strive to address pesticide use under the special conditions existing here. Oregon requirements are sometimes more restrictive than federal requirements but can never allow uses or activities prohibited at the federal level.ODA is the state lead agency in Oregon for regulating all aspects of pesticide registration, distribution, and use. This strict oversight begins with the registration of each pesticide product and continues with the certification and licensing of pesticide applicators, applicator trainees, dealers, and consultants. Several other state agencies in Oregon cooperate with ODA in regulating pesticide use. These include the Oregon Departments of Forestry, Transportation, Fish and Wildlife, Human Services, and Environmental Quality. Oregon Occupational Safety and Health Administration is also actively involved in pesticide regulation in Oregon.New laws and regulations can be created to address situations not covered by existing laws and regulations. For example, pesticides and pesticide application equipment are constantly being improved or modified, and these improvements often require people to use pesticides differently. In addition, pest problems and pest management techniques can differ from year to year. This affects how people use pesticides. Law and regulation changes can also address emerging health and environmental problems. For instance, the Worker Protection Standard was a change in FIFRA that strengthened requirements to protect agricultural and forest workers who handle pesticides or otherwise work in pesticide-treated areas.If you are involved in demonstration and research uses of pesticides in Oregon, you
1 Demonstration and research pest control laws and regulations
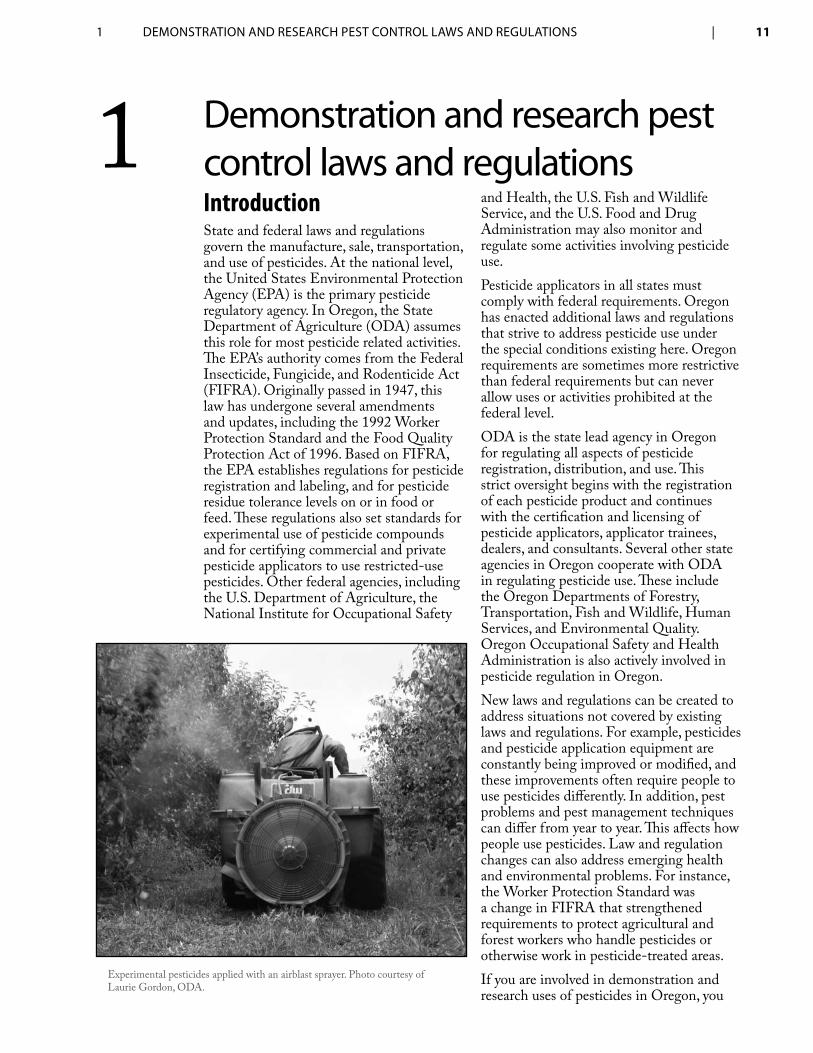
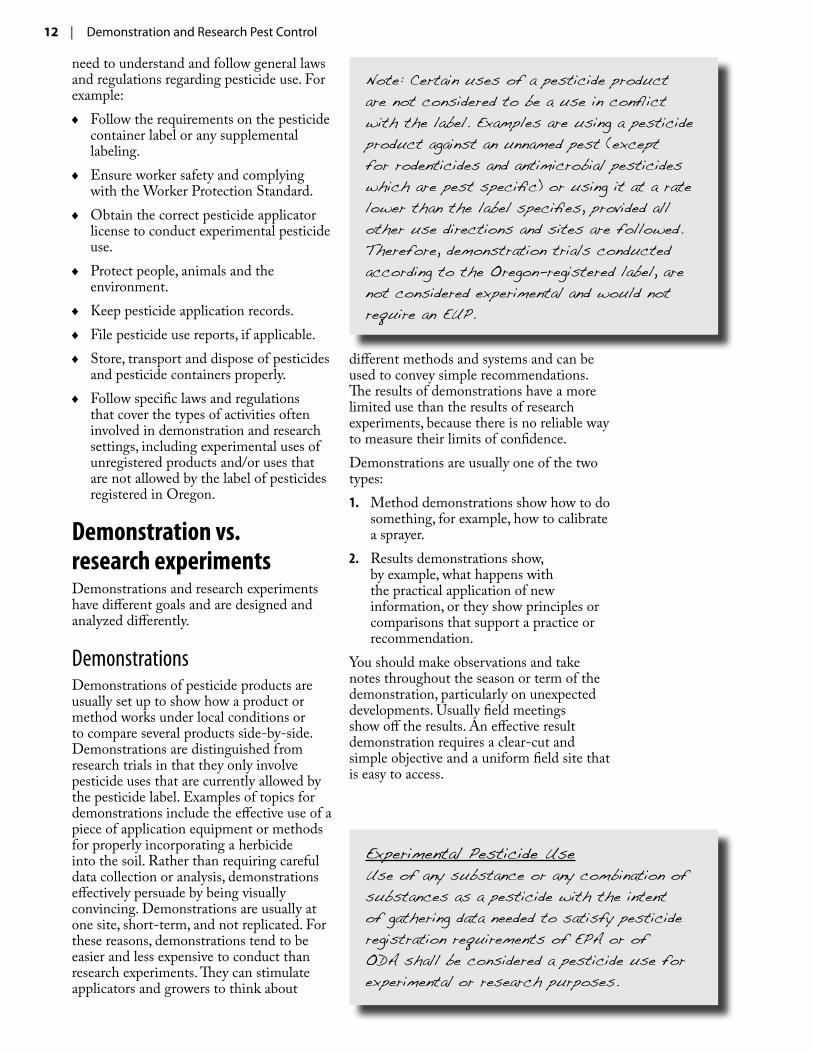
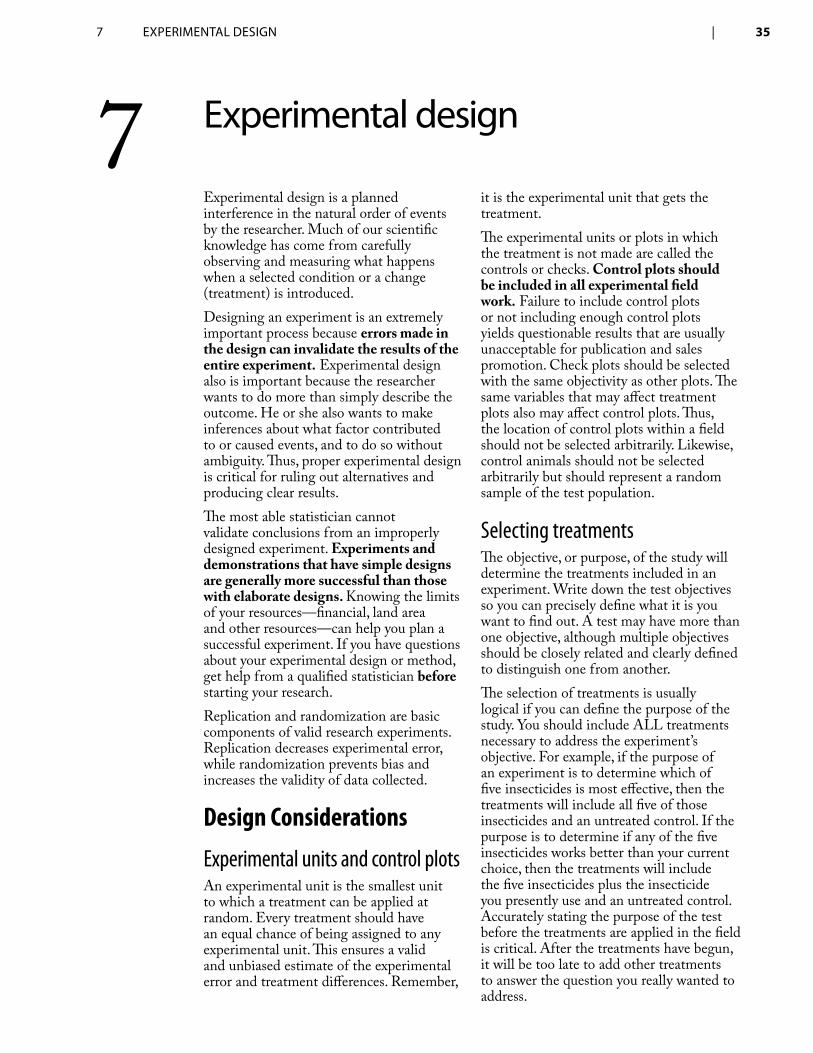
Experimental pesticides applied with an airblast sprayer. Photo courtesy of Laurie Gordon, ODA.
12 | Demonstration and Research Pest Control
need to understand and follow general laws and regulations regarding pesticide use. For example:
Follow the requirements on the pesticide ♦container label or any supplemental labeling.Ensure worker safety and complying ♦with the Worker Protection Standard.Obtain the correct pesticide applicator ♦license to conduct experimental pesticide use.Protect people, animals and the ♦environment.Keep pesticide application records. ♦
File pesticide use reports, if applicable. ♦
Store, transport and dispose of pesticides ♦and pesticide containers properly.Follow specific laws and regulations ♦that cover the types of activities often involved in demonstration and research settings, including experimental uses of unregistered products and/or uses that are not allowed by the label of pesticides registered in Oregon.
Demonstration vs. research experimentsDemonstrations and research experiments have different goals and are designed and analyzed differently.
DemonstrationsDemonstrations of pesticide products are usually set up to show how a product or method works under local conditions or to compare several products side-by-side. Demonstrations are distinguished from research trials in that they only involve pesticide uses that are currently allowed by the pesticide label. Examples of topics for demonstrations include the effective use of a piece of application equipment or methods for properly incorporating a herbicide into the soil. Rather than requiring careful data collection or analysis, demonstrations effectively persuade by being visually convincing. Demonstrations are usually at one site, short-term, and not replicated. For these reasons, demonstrations tend to be easier and less expensive to conduct than research experiments. They can stimulate applicators and growers to think about
different methods and systems and can be used to convey simple recommendations. The results of demonstrations have a more limited use than the results of research experiments, because there is no reliable way to measure their limits of confidence.Demonstrations are usually one of the two types:
Method demonstrations show how to do 1. something, for example, how to calibrate a sprayer. Results demonstrations show, 2. by example, what happens with the practical application of new information, or they show principles or comparisons that support a practice or recommendation.
You should make observations and take notes throughout the season or term of the demonstration, particularly on unexpected developments. Usually field meetings show off the results. An effective result demonstration requires a clear-cut and simple objective and a uniform field site that is easy to access.
Experimental Pesticide Use Use of any substance or any combination of substances as a pesticide with the intent of gathering data needed to satisfy pesticide registration requirements of EPA or of ODA shall be considered a pesticide use for experimental or research purposes.
Note: Certain uses of a pesticide product are not considered to be a use in conflict with the label. Examples are using a pesticide product against an unnamed pest (except for rodenticides and antimicrobial pesticides which are pest specific) or using it at a rate lower than the label specifies, provided all other use directions and sites are followed. Therefore, demonstration trials conducted according to the Oregon-registered label, are not considered experimental and would not require an EUP.
1 DeMonsTRATion AnD ReseARCh PesT ConTRol lAws AnD RegulATions | 13
Research experimentsWhen you conduct pesticide research experiments your goal is to generate data that can be used to:
Support new pesticide uses or methods, ♦such as new rates, sites, equipment or application frequencies.Add new target pest species to the label. ♦
Support existing knowledge. ♦
Close gaps in existing information. ♦
Develop new information. ♦
Unlike most demonstrations, pesticide research experiments demand careful design and close management, and you must conduct data collection and analysis in a way that will produce scientifically sound conclusions.Most research experiments follow these fundamental steps:
Formulate a hypothesis (a suggested ♦solution or explanation for a specific problem or question).Design an experiment to objectively test ♦your hypothesis.Collect data from the experiment. ♦
Interpret the data you have collected. ♦
Accept, reject, or alter your original ♦hypothesis.
Try to keep your research experiments as simple as possible while still satisfying the needed level of scientific soundness. Experimental error and bias are inherent in any experiment; therefore, one of your primary goals as a researcher is to reduce these to a minimum. Good experimental design and technique go a long way toward
minimizing bias and error and maximizing the utility of your results.Research uses of pesticide products might involve experimental or numbered compounds, new formulations, federally registered products not yet registered in Oregon, new uses of registered products (e.g., new crops, timing, rates, or methods), and some uses of genetically modified crops.
LicensingYou must be an Oregon licensed pesticide applicator, trainee or consultant with the Demonstration and Research category to make applications of pesticides used experimentally or in research situations. Licensing requirements are applicable to anyone conducting pesticide research including state and federal agency employees who are not required to obtain an EUP. Only a licensed Commercial or Public Pesticide Applicator may supervise applications made by a licensed pesticide trainee.In 2009, a category of Demonstration and Research was incorporated into the Oregon pesticide licensing program. Anyone conducting experimental pesticide trials must have this category on their pesticide license issued by the department. However, this category is not appropriate for non-pesticide related research, such as plant breeding trials or soil fertility trials, even if pesticides will be used during the experiment.Different licensing options are available depending upon what types of pesticide related activities you want to be able to do. The following licensing options are available:
Pesticide Consultant license with Demonstration and Research category This license allows the licensee to provide technical advice on any restricted-use pesticide and make demonstration and research applications. A person with this license is prohibited from supervising pesticide trainees and may not make routine “maintenance” pesticide applications.
Commercial Pesticide Applicator with Demonstration and Research categoryThis license option works well for persons who have a pesticide research business or are
Maintenance applications are made for routine purposes are not covered by the Pesticide Consultant license. These include any application made in accordance with the pesticide label where the use is not an experimental factor. An example might be conducting routine weed control in a fungicide trial.
14 | Demonstration and Research Pest Control
contracted by others to conduct pesticide applications for experimental purposes. The licensee can add other specific use categories to this license to make routine maintenance applications. The licensee may also supervise licensed trainees only in the categories listed on the license.
Public Pesticide Applicator with Demonstration and Research categoryThis license option works well for persons who are employed by a public agency (including universities and colleges) to conduct pesticide research, implement pesticide demonstration trials, or are contracted by others to conduct pesticide applications for experimental purposes as a part of their employment with their public agency. The licensee can add other specific use categories to this license to expand their application sites to make routine maintenance applications in another category. The licensee may also supervise licensed trainees only in the categories listed on the license.
Private Pesticide applicator licenseThe consultant, commercial applicator and public applicator licenses are not appropriate for the personal use of restricted-use pesticides. However, under the Private Pesticide Applicator License you may obtain and use restricted use pesticides for agricultural or forestry production on land you or your employer owns or rents. This license type is not appropriate for conducting experimental pesticide trials.
RecordkeepingRecords of pesticide applications made for experimental or demonstration purposes must be maintained by all licensed pesticide applicators, including trainees. Licensed Pesticide Consultants and licensed Commercial or Public Pesticide Applicators must prepare and maintain the following information:
The firm or individual for whom the ♦pesticide application was made.The location of the land or property ♦where application was made.The date and approximate time of ♦application.
The supplier of pesticide product(s) ♦applied.The trade name and the strength of such ♦pesticides applied.The amount or concentration (pounds or ♦gallons per acre of active ingredient or concentration per 100 gallons).The specific property, crop(s), or site(s) to ♦which the pesticide was applied.The summary information of equipment, ♦device or apparatus used and, if applied by aircraft, the F.A.A. number.Name of applicator(s) and/or trainee(s) ♦who made the application.
Records must be kept for three years.
Pesticide Use Reporting System (PURS)The Pesticide Use Reporting System (PURS) is scheduled to be implemented in 2013. It is anticipated that PURS will require reporting of all pesticide applications (including experimental use) through the ODA web site. Details are available on the ODA web site:http://oregon.gov/ODA/PEST
Crop destructCrop destruction is one of the most important parts of experimental pesticide use. You must adhere to these requirements not only because they are the law, but failing to adhere to them could cause harm to people, animals, or the environment.Unregistered pesticide products and numbered compounds usually lack an established EPA residue tolerance for the active ingredient and crop combination. Registered products used experimentally on crops or in ways not allowed by the label may exceed or lack existing tolerances. The EUP holder must destroy the food or feed item unless:
A residue tolerance has been established 1. by EPA for the pesticide-crop combination, rate, and use pattern you are testing, orThe pesticide you are testing has been 2. exempted from the requirement of a residue tolerance, or
1 DeMonsTRATion AnD ReseARCh PesT ConTRol lAws AnD RegulATions | 15
The pesticide you are testing has a time-3. limited tolerance established by EPA that is in effect.
Crop destruction means “to render unusable for food or feed, or to use for research purposes only.” The crop destruction rule applies to all treatments for crops, including dormant, fallow, and pre-plant treatments. No portion of a crop to which a pesticide product having no established pesticide residue tolerance for the crop has been applied, shall be used or distributed for food or feed. This restriction pertains to, but is not limited to, green chop, hay, pellets, meal, whole seed, cracked seed, straw, roots, bulbs, foliage or seed screenings. This restriction also includes grazing the crop, stubble, or re-growth for 365 days. If you submit a justification for harvest or use, you must include information about the pesticide product’s applicable residue tolerances, tolerance exemption, or the federally registered label that allows such use.When certain EUPs are authorized by ODA for an experimental pesticide use on a food or feed crop, ODA issues a Notice of Detainment (embargo notice) prohibiting the use of any part of the crop treated experimentally with pesticides. The EUP holder must explain the implications of a Notice of Detainment to the grower or person in control of the site. In other cases ODA may not issue a Notice of Detainment, but the EUP holder is still required to ensure that the crop is destroyed when appropriate. Food or feed plant parts are never allowed to enter the food or feed
chain without complying with established tolerances. Documentation of crop destruct becomes very important when there could be a trace-back of contaminated food/feed items to the trials you are responsible for. Documentation must include the date and the crop destruct method. Photos of the destruction process are also recommended.
Grazing restrictionIf a crop has been treated with a pesticide that does not have a tolerance established for forage or for meat and milk, the treated site must not be used for grazing of animals for a minimum of 365 days from the date of the last application. The permit holder must ensure that the grower/cooperator is informed of this restriction.If animals are allowed to graze on land that has been treated with a pesticide that does not have a tolerance for such, the animals may be harmed or may have pesticide residues in the animal’s meat or milk. In this situation, the animals, meat, milk or other contaminated commodity may not be consumed or marketed for any purpose.
Treated crops grown for seedIf you grow a specialty seed crop (other than grass grown-for-seed) for a research experiment or demonstration, you need to know your responsibilities. Know whether pesticides used on specialty seed crops have established pesticide reside tolerances. If a tolerance is lacking or the labeled rate is exceeded, you need to inform your seed conditioner which pesticides were applied to your crop. It is your responsibility to ensure no portion of a treated seed crop is used or distributed for human food or animal feed.All seed harvested from plants that have been treated experimentally must be labeled with the following statement:“This seed was produced using one or more products for which the United States Environmental Protection Agency has not established pesticide residue tolerances. This seed, in whole, as sprouts, or in any form, may not be used for human consumption or animal feed. Failure to comply with this condition may violate the requirements of the Federal Food and Drug Administration, the Oregon Department of Agriculture, and other regulatory agencies.”
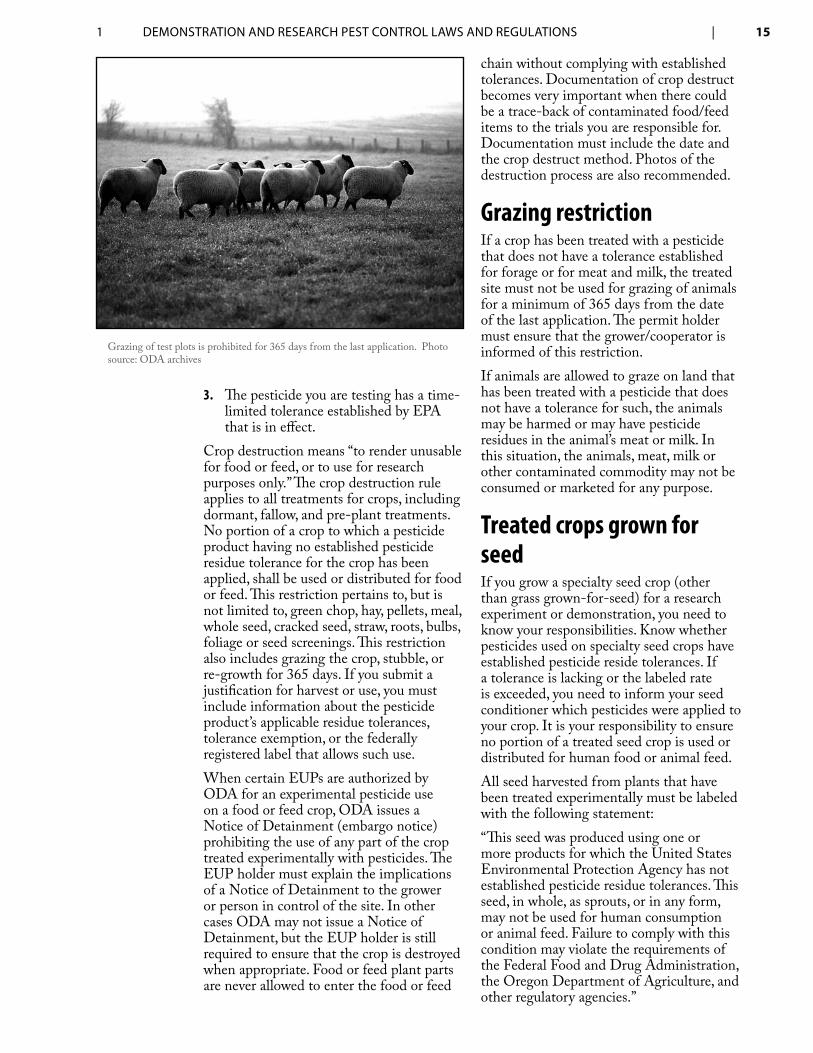
Grazing of test plots is prohibited for 365 days from the last application. Photo source: ODA archives
16 | Demonstration and Research Pest Control
Residue testingIf your trial uses a product that is a federally registered pesticide for your crop and you have used the product according to its label, it is presumed to meet the required residue tolerance without further testing. If you treat crops at higher than labeled rates, by a different application method, or use shorter pre-harvest intervals (PHI), generally you must destroy the crop. However, in some instances ODA may allow the crop to be analyzed to confirm that it is within the established tolerance. If confirmed, ODA would then provide a written release of embargo on the crop before it is harvested for food or feed purposes.
Federal and state experimental use permits (EUPs)Under Oregon law, if you are planning to use certain pesticide products for research purposes you may be required to obtain an authorization to conduct such research called an Experimental Use Permit (EUP). In some cases involving pesticide registrants conducting pesticide development research for EPA registration purposes, a federal permit for experimental use of pesticide products may also be required. The following sections outline the requirements for Oregon’s and the EPA’s Experimental Use Permits (EUPs).
Federal EUPFederal Experiment Use PermitsThe US EPA administers the Federal EUP Program. This permit is sought by entities that want to conduct experimental use on more than 10 acres or more than 1 surface acre of water in Oregon. Experiments with pheromones used at rates less than 150 grams ai/acre/year require a Federal EUP when the site exceeds 250 acres. Visit the EPA web site for information on applying for a Federal EUP: http://www.epa.gov
Using a Federal Experimental Use Permit in OregonFile an application with ODA at least 30 days prior to initiation of any trials involving a Federal Experimental Use Permit in
Oregon. ODA will determine if the trial will be permitted in Oregon and if so, a Site-Specific Oregon EUP will be issued.Federal EUP regulations require pesticide products shipped or used under federal EUP to be labeled with directions and conditions for use. In most cases, this labeling will include the following:
A prominent statement “For ♦Experimental Use Only.”The federal EUP number. ♦
The name, brand, or trademark. ♦
The name and address of the permit ♦holder, producer, or registrant.The net contents. ♦
An ingredient statement. ♦
Any appropriate limitations on entry of ♦people into treated areas.The establishment registration number ♦except in cases where application of the pesticide is made solely by the producer.The directions for use. ♦
In addition to these items, when a federal ♦EUP is used under federal conditional registration, the labeling must include the following statement: “Not for sale to any person other than a participant or cooperator of the EPA approved Experimental Use Program.”
There are situations in which it is not legally necessary for a pesticide manufacturer to obtain a federal EUP, however, an Oregon EUP would still be required and trials are limited in size and scope. In these cases,
Acreage Limitations Under an Oregon EUP, the use of a pesticide experimentally is limited to a cumulative total of 10 acres per chemical (active ingredient) per year. Testing on areas larger than this requires that a federal EUP be obtained prior to requesting an Oregon EUP. On some rare occasions, ODA may request EPA to waive the federal EUP requirement to address a specific state need to conduct experimental pesticide use on acreage over 10 acres. Upon EPA approval, an Oregon Site-Specific EUP would be issued.
1 DeMonsTRATion AnD ReseARCh PesT ConTRol lAws AnD RegulATions | 17
the EPA presumes that the nature and size of the experiment will not involve unreasonable adverse effects. Examples and guidelines that help determine when a federal EUP might not be necessary are outlined in the Code of Federal Regulations (40 CFR Section 172.3).
Oregon Experimental Use Permits (EUPs)Oregon has specific regulations regarding pesticide experiments, including unregistered uses of pesticide products. Before you conduct experiments with pesticides (including pheromones), you are required to obtain an EUP from ODA, unless you are specifically exempted (see “Oregon EUP Exemptions). Oregon EUPs are required for all sizes of experiments, including those uses covered by a federal EUP. Always understand your responsibilities when conducting trials involving pesticides. An EUP is not an exemption from pesticide registration. The purpose of the EUP program is to:
Allow for research that contributes to the ♦product registration process.Ensure that research-related crops or test ♦animals bearing illegal residues do not enter the food chain.Protect humans, animals and the ♦environment.
Oregon EUP ExemptionsIf you are currently employed by a federal or state agency and will be conducting research under their established policies for pesticide use, obtaining an Oregon EUP is not required. However, always check first with your agency to find out about their particular pesticide use and experimentation policies. Some agencies may require you to obtain an EUP even if the state regulations do not.Pesticide research conducted entirely within a greenhouse is also exempt from the requirement to obtain an Oregon EUP. Exemption from the requirement of obtaining an Oregon EUP does not exempt a person from their responsibilities under state and federal law to comply with other aspects of experimental use of pesticides. These responsibilities include:
Appropriate pesticide applicator, ♦consultant, or trainee licensing.Pesticide application recordkeeping. ♦
Pesticide reporting, if applicable. ♦
Adherence to crop destruct provisions if ♦no tolerance has been established for the pesticide applied to a specific crop.Adherence to grazing restrictions of 365 ♦days if no tolerance has been established for the pesticide applied to a specific crop or site (pasture).
Two Oregon EUP TypesTwo distinct EUPs are available to address experimental or research uses of pesticides in Oregon.
Collective Experimental Use PermitFeatures:
Allows a researcher who conducts ♦small plot trials to apply with ODA to cover all trials conducted that year. This process supports small plot research with minimum regulatory oversight.Covers experimental pesticide use that ♦does not exceed a total of one acre per pesticide and is conducted on agricultural or forest sites.Does not allow for aquatic pesticide ♦trials or experiments involving animals or livestock.Expires December 31st of the year in ♦which issued.
Requirements:Provide a summary report no later ♦than 30 days after the expiration of the permit.Keep records of pesticide application(s). ♦
Document crop destruction, if applicable. ♦
File pesticide use reports, if applicable. ♦
Site-Specific Experimental Use PermitFeatures:
Is for experimental pesticide use on ♦specific sites other than agriculture or forest or any site that exceeds one acre in total size. Approvable sites include, but are ♦not limited to, aquatic, residential, recreational and structural sites, areas
18 | Demonstration and Research Pest Control
with public access, commodity storage facilities, animals/livestock, and any area exceeding a total of one acre.Expires no more than 12 months after ♦issuance by the department.
Requirements:Research must provide a summary report ♦no later than 30 days after the expiration of the permit.Keep records of pesticide applications. ♦
Document crop destruction, if applicable. ♦
File pesticide use reports, if applicable. ♦
Applying for an Oregon EUPODA’s EUP application forms are available by calling 503-986-4635 or via ODA’s web site at http://oregon.gov/oda/pest.Submit the completed “Collective” or “Site Specific” EUP application form to ODA for approval at least 30 days prior to intended use. ODA may require additional information in order to adequately assess the potential adverse effects on workers, the public, or the environment.Each Collective Experimental Permit application must include:
Name, address, and telephone numbers ♦of the permit applicant.Name, address, telephone numbers and ♦pesticide applicator or consultant license numbers of the person(s) responsible for carrying out the provisions of the experimental use permit at each specific site and the means of locating the person in case of an emergency.A signed statement that all pesticide use ♦will comply with all of the provisions of the collective experimental use permit and of this section
Each Site-Specific Experimental Use Permit application must include:
Name, address, and telephone numbers ♦of the permit applicant.Name, address, telephone numbers and ♦pesticide applicator or consultant license numbers of the person(s) responsible for carrying out the provisions of the experimental use permit at each specific site and the means of locating the person in case of an emergency.
Identification of each pesticide to be ♦used, including: 1) the names of the active ingredients, 2) the product names (if any), and 3) the EPA Registration number (if any).The number of the current ODA ♦pesticide-related license of the person(s) making the pesticide applications and the means of locating the person in case of an emergency.The purpose of the experiment or ♦research, including a list of the intended target pest(s).The approximate date(s) of pesticide use. ♦
Specific description and location of ♦each site where pesticide use may occur, including the size (for example; acres or square feet) of each site.Disposition of any food or feed item ♦from the crop or site on which the pesticide will be used (if no tolerance has been established).Application rate(s) of the pesticide and ♦number of applications.Method of application. ♦
Timing and duration of the proposed ♦experiment or research.Total amount of pesticide to be used, ♦diluent and dilution rate.Copy of any federal EUP issued by EPA. ♦
Copy of the labeling that will accompany ♦the pesticide in the field.Documented support of the pesticide ♦registrant.Adverse properties of active ingredients. ♦
Crop/site. ♦
Pre-harvest interval (PHI). ♦
Restricted-entry interval (REI). ♦
Significant bordering landmarks. ♦
EUP notification and other requirements
72-hour advance noticeFor Site-Specific EUPs Only: You must notify ODA at least 72 hours before the first pesticide application is made. ODA prefers to be notified by e-mail. Fax or voicemail
1 DeMonsTRATion AnD ReseARCh PesT ConTRol lAws AnD RegulATions | 19
notification is also accepted. When providing notification, please give the EUP number and location of the application site intended to be treated and the date/approximate time when application is to be made.
Summary reportThe Oregon EUP process requires you to file a summary report within 30 days of the expiration of any EUP. This report must be filed by persons that have either type of Oregon EUP (Collective or Site-Specific). Each summary report must include, at a minimum, the identification number of the experimental use permit, the record information required to be maintained, any adverse effects to humans, animals or the environment and documentation of crop destruct, if applicable.
Use precautionsIf your EUP trial uses a registered pesticide, follow the use precautions and protective clothing requirements on the label. However, if your trial involves the use of experimental compounds whose toxicity has not been fully evaluated, you should use at least the following protective clothing:
Protective eyewear. ♦
Long-sleeved shirt. ♦
Long pants. ♦
Chemically-impervious gloves. ♦
Chemically-impervious boots. ♦
Other protective clothing indicated on ♦a technical bulletin or Material Safety Data Sheet.Certain pesticides may have additional ♦regulations regarding worker exposure, restricted-entry intervals, and other restrictions or limitations of use. You must be aware of and follow all
regulations that are relevant to your trial. When you work with pesticides in experimental trials, you are responsible for ensuring the legal and safe use of the materials you use.
Storage and disposalWhen you use registered pesticides in your trials, follow the requirements on the label about how to store and dispose of unused pesticides and empty pesticide containers. If your trial involves an unregistered material, follow the storage and disposal guidelines on the product’s Material Safety Data Sheet or technical bulletin.
Special conditions, regulations, and enforcementEach EUP approved by ODA may contain specific conditions under which the research is to be conducted. ODA will include those conditions on the approved EUP.ODA has the authority to terminate, amend, or refuse to issue an EUP under certain circumstances, including but not limited to:
If the research involves a hazard to ♦pesticide handlers, field workers, public health, animals or the environment.If the research is used for purposes ♦unrelated to pesticide registration data development.If the applicant has failed to provide the ♦required summary report for a previously issued EUP.
ODA Pesticides Division staff routinely monitor EUP trials that are conducted to ensure compliance with the EUP requirements and conditions of approval. If any adverse effects of the trial or any noncompliance with the conditions of the permit or of the Oregon Revised Statutes Chapter 634 (ORS 634) are determined, you risk enforcement action including fines and/or pesticide license action. In addition to any other liability or penalty provided by law, any failure by any person to comply with the provisions of this section, as determined by the Department, may be used as a basis of one or more of the following actions:
Adverse effect reporting The permit holder or person that conducted the pesticide use must immediately report to the Department any adverse, environmental, human or animal effects resulting from pesticides used for experimental or research purposes.

20 | Demonstration and Research Pest Control
To revoke or suspend or refuse to issue ♦an experimental use permit.To revoke or suspend or refuse to issue ♦any license of a permit holder or of a person that conducted a pesticide use for experimental or research purposes.To impose a civil penalty. ♦
2 gooD lAboRAToRy PRACTiCe sTAnDARDs (glPs) | 21
The most important regulation for pesticide researchers submitting data to EPA in support of FIFRA and Toxic Substances Control Act (TSCA) actions is 40 CFR 160, EPA’s Good Laboratory Practice Standards or GLPS compliance monitoring program. It applies to all researchers generating test data that will be submitted to EPA under FIFRA and TSCA. This may be the most important regulation that applies to people doing pesticide field tests in support of FIFRA section 3 registrations, section 24c registrations or section 18 uses.EPA’s GLPS compliance monitoring program ensures the quality and integrity of test data submitted to the agency under FIFRA and TSCA. All researchers who conduct a study that will be submitted to EPA must comply with GLPS regulations located at 40 CFR part 160 for data under FIFRA and 40 CFR part 792 for data under TSCA.Failure to comply with GLPS (40 CFR 160) is an actionable offense that can result in cancellation, suspension or modification of the registration, research or marketing permit; the imposition of civil penalties; or criminal prosecution under 18 U.S.C. 2 or 1001, or FIFRA section 14.
GLPS definitions40 CFR 160.3 defines the following important terms for pesticide studies.
StudyStudy means any experiment at one or more test sites, in which a test substance is studied in a test system under laboratory conditions or in the environment to determine or help predict its effects, metabolism, product performance (efficacy studies only as required by 40 CFR 158.640), environmental and chemical fate, persistence and residue, or other characteristics in humans, other living organisms, or media.
Test substanceTest substance means a substance or mixture administered or added to a test system in a study.
Test systemTest system means any animal, plant, microorganism, chemical or physical matrix, including but not limited to soil or water, or subparts thereof, to which the test, control, or reference substance is administered or added for study.
Testing facilityTesting facility means a person who actually conducts a study, i.e., actually uses the test substance in a test system. “Testing facility” encompasses only those operational units that are being or have been used to conduct studies.
Control substanceControl substance means any chemical substance or mixture, or any other material other than a test substance, that is administered to the test system in the course of a study for the purpose of establishing a basis for comparison with the test substance.
2 good laboratory practice standards (glPs)
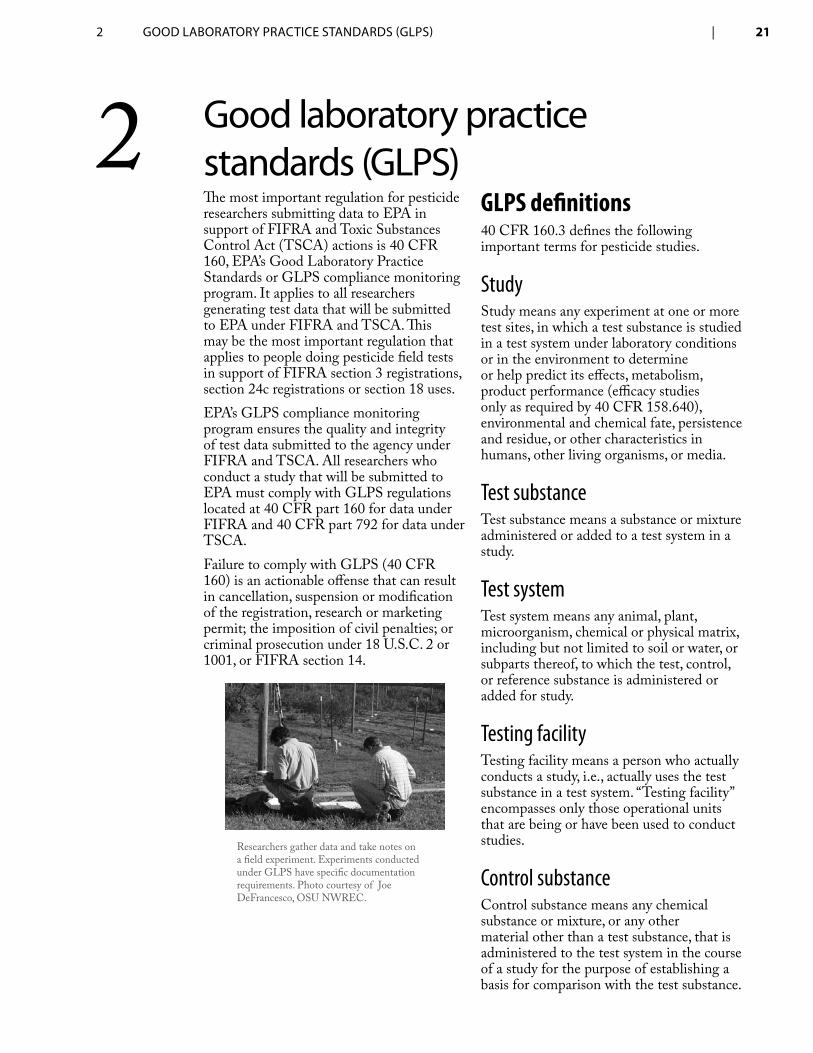
Researchers gather data and take notes on a field experiment. Experiments conducted under GLPS have specific documentation requirements. Photo courtesy of Joe DeFrancesco, OSU NWREC.
22 | Demonstration and Research Pest Control
CarrierCarrier means any material, including but not limited to feed, water, soil and nutrient media, with which the test substance is combined for administration to a test system.
Raw dataRaw data means any laboratory worksheets, records, memoranda, notes, or exact copies thereof that are the result of original observations and activities of a study and are necessary for the reconstruction and evaluation of the report of that study.
SpecimensSpecimens means any material derived from a test system for examination or analysis.
SponsorSponsor means: 1) A person who initiates and supports, by provision of financial or other resources, a study; 2) A person who submits a study to the EPA in support of an application for a research or marketing permit; or 3) A testing facility, if it both initiates and actually conducts the study.
Study directorStudy director means the individual responsible for the overall conduct of a study.For all definitions pertinent to GLPS, consult 40 CFR 160.3, in which terms are listed in alphabetical order.
Study protocol requirementsFifteen specific items of information are required for every study to which GLPS applies. The regulation states that “each study shall have an approved written protocol that clearly indicates the objectives and all methods for the conduct of the study.” The protocol for a study must contain but is not necessarily limited to these items of information. Note. The records requirements under GLPS differ from the Oregon pesticide recordkeeping requirements for consultants and commercial and public applicators. Both sets of records should be maintained separately.
Descriptive title and statement of 1. purpose.Identification of the test, control, and 2. reference substance by name, chemical abstracts service (CAS) number or code number.The name and address of the sponsor 3. and the name and address of the testing facility at which the study is being conducted.The proposed experimental start and 4. termination dates. Justification for selection of the test 5. system.In animal studies, where applicable, the 6. number, body weight range, sex, source of supply, species, strain, substrain, and age of the test system.The procedure for identification of the 7. test system.A description of the experimental 8. design, including methods for the control of bias.Where applicable, a description and/9. or identification of the diet used in the study as well as solvents, emulsifiers and/or other materials used to solubilize or suspend the test, control, or reference substances before mixing with the carrier. The description shall include specifications for acceptable levels of contaminants that are reasonably expected to be present in the dietary materials and are known to be capable of interfering with the purpose or conduct of the study if present at levels greater than established by the specifications.The route of administration and the 10. reason for its choice.Each dosage level, expressed in 11. milligrams per kilogram of body or test system weight or other appropriate units, of the test, control, or reference
Changes or Revisions All changes in or revisions of an approved GLP protocol and the reasons for them shall be documented, signed by the study director, dated, and maintained with the protocol.
2 gooD lAboRAToRy PRACTiCe sTAnDARDs (glPs) | 23
substance to be administered and the method and frequency of administration.The type and frequency of tests, analyses, 12. and measurements to be made.The records to be maintained.13.
The date of approval of the protocol by 14. the sponsor and the dated signature of the study director.A statement of the proposed statistical 15. method to be used.
Section 160.130 of 40 CFR requires that the study shall be conducted in accordance with the protocol. The test systems shall be monitored in conformity with the protocol. Specimens shall be identified by test system, study, nature, and date of collection. This information shall be located on the specimen container or shall accompany the specimen in a manner that precludes error in the recording and storage of data.Section 160.130(e) of 40 CFR requires that all data generated during the conduct of a study, except those that are generated by automated data collection systems, shall be recorded directly, promptly, and legibly in ink. All data entries shall be dated on the day of entry and signed or initialed by the person entering the data. Any change in entries shall be made so as not to obscure the original entry, shall indicate the reason for such change, and shall be dated and signed or identified at the time of the change.
All persons conducting tests of pesticides must comply with protocols and regulations governing data handling, storage and retrieval; records of equipment maintenance and calibration; and the transfer, proper placement, and identification of test systems. They must have immediately available manuals, protocols and standard operating procedures relative to the laboratory or field procedures being used in the tests (40 CFR 160.81).All raw data, documentation, records, protocols, specimens, and final reports generated as a result of a study shall be retained. Correspondence and other documents relating to interpretation and evaluation of data, other than those documents contained in the final report, also shall be retained. There shall be archives for orderly storage and expedient retrieval of all raw data, documentation, protocols, specimens, and interim and final reports (40 CFR 190). All records relating to a test shall be retained for a period of at least 5 years following the date on which the results of the study are submitted (40 CFR 195).For detailed information on compliance and monitoring of GLPS, consult 40 CFR 160, EPA Manual 2185 Good Automated Laboratory Practices, and EPA Manual 723-B-93-001 Good Laboratory Practice Standards Inspection Manual, or the American Chemical Society’s Good Laboratory Practice Standards: Applications for Field and Laboratory Studies.

24 | Demonstration and Research Pest Control
3 PesTiCiDe-oRgAnisM inTeRACTions | 25
Federal regulations (40 CFR 171.4(c)(10)) require that persons conducting demonstration and research work with pesticides should demonstrate an understanding of pesticide-organism interactions and their importance in IPM programs.Both the beneficial and harmful effects of pesticides are determined by pesticide-organism interactions. To be effective, a pesticide must 1) penetrate the organism, 2) move or be transported to the site of action, and 3) disrupt or alter a vital function. The manner in which the pesticide affects the vital function is called its mode of action. Penetration, transport and mode of action involve pesticide-organism interactions.Pesticide-organism interactions also are involved in the metabolism, accumulation and elimination of pesticides by the organism, and in biodegradation and biological magnification.
ResistancePesticide selectivity and the development of pesticide resistance are often caused by differences in pesticide-organism interactions. Selectivity is the ability of a pesticide to affect one organism and not another. Resistance is the heritable reduction in the sensitivity of a pest
population to a pesticide. Many insect and mite species have become resistant to pesticides worldwide. In addition, at least 200 species of fungi, more than 200 species of weeds, and several species of nematodes and rodents also are resistant to one or more pesticides.Resistance often develops in pest populations that have been treated frequently with pesticides that have a common mode of action. The development of resistance may sometimes be averted or delayed by reducing the number of treatments and/or alternating the use of pesticides with different modes of action.
PenetrationThe speed and extent of penetration depends on the permeability of the organism to the specific pesticide. Permeability differs significantly among plants and insects and even among different tissues of the same organism. Among animals, tissues of the respiratory and digestive system are usually much more permeable than the skin. In plants, new, succulent growth is more permeable than hardened growth and bark. The ability of a pesticide to penetrate an organism depends on its chemical nature and the formulation. Penetration can sometimes be increased by either incorporating adjuvant compounds directly into a formulated pesticide product (by the manufacturer) or adding an adjuvant product to the diluted pesticide mixture in the tank.
TransportThe ease with which a pesticide moves from the place where it entered an organism to its site of action depends on the mobility of the pesticide molecules and the efficiency of the transporting mechanism of the plant or animal. For example, systemic herbicides move throughout the plant, while other herbicides are not mobile and affect only the area they contact directly.
3 Pesticide-organism interactions
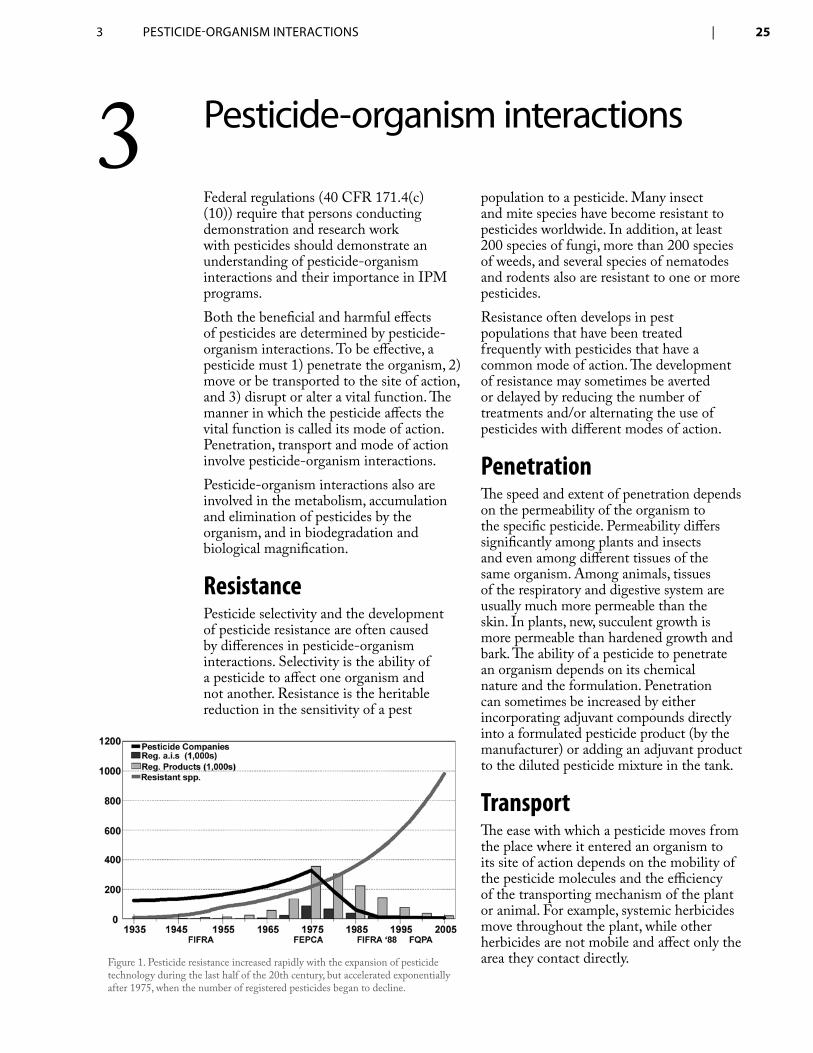
Figure 1. Pesticide resistance increased rapidly with the expansion of pesticide technology during the last half of the 20th century, but accelerated exponentially after 1975, when the number of registered pesticides began to decline.
26 | Demonstration and Research Pest Control
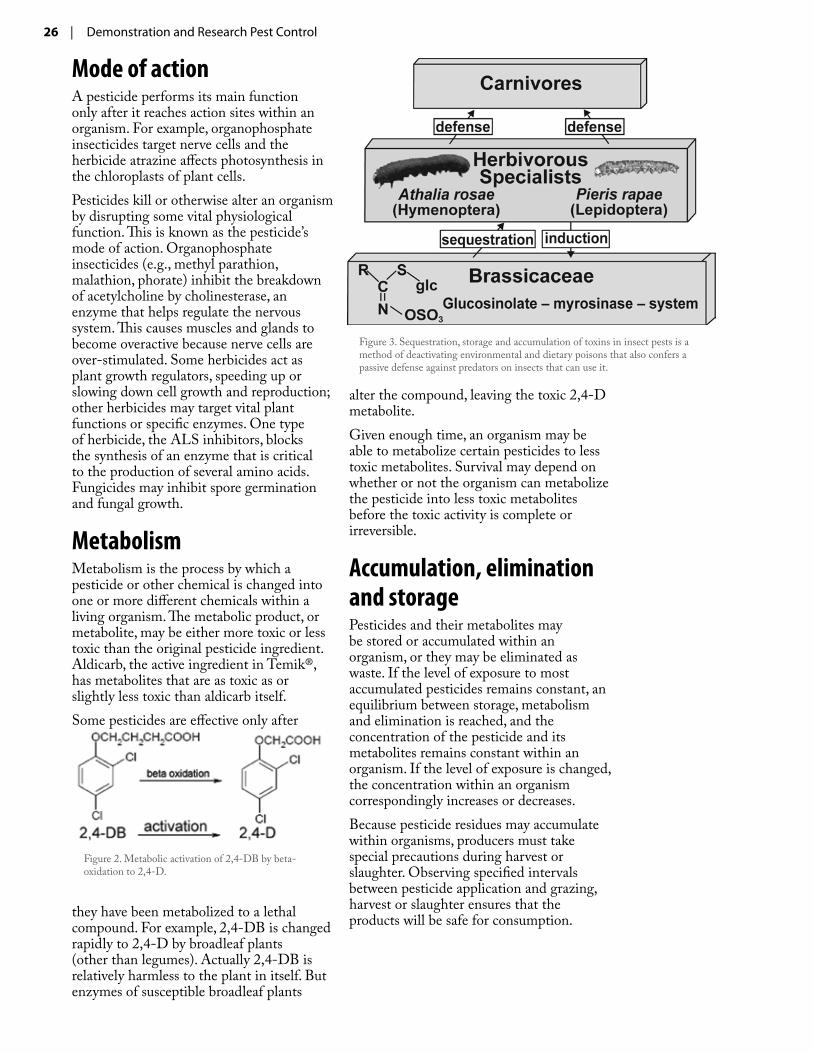
Mode of actionA pesticide performs its main function only after it reaches action sites within an organism. For example, organophosphate insecticides target nerve cells and the herbicide atrazine affects photosynthesis in the chloroplasts of plant cells.Pesticides kill or otherwise alter an organism by disrupting some vital physiological function. This is known as the pesticide’s mode of action. Organophosphate insecticides (e.g., methyl parathion, malathion, phorate) inhibit the breakdown of acetylcholine by cholinesterase, an enzyme that helps regulate the nervous system. This causes muscles and glands to become overactive because nerve cells are over-stimulated. Some herbicides act as plant growth regulators, speeding up or slowing down cell growth and reproduction; other herbicides may target vital plant functions or specific enzymes. One type of herbicide, the ALS inhibitors, blocks the synthesis of an enzyme that is critical to the production of several amino acids. Fungicides may inhibit spore germination and fungal growth.
MetabolismMetabolism is the process by which a pesticide or other chemical is changed into one or more different chemicals within a living organism. The metabolic product, or metabolite, may be either more toxic or less toxic than the original pesticide ingredient. Aldicarb, the active ingredient in Temik®, has metabolites that are as toxic as or slightly less toxic than aldicarb itself.Some pesticides are effective only after
they have been metabolized to a lethal compound. For example, 2,4-DB is changed rapidly to 2,4-D by broadleaf plants (other than legumes). Actually 2,4-DB is relatively harmless to the plant in itself. But enzymes of susceptible broadleaf plants
alter the compound, leaving the toxic 2,4-D metabolite. Given enough time, an organism may be able to metabolize certain pesticides to less toxic metabolites. Survival may depend on whether or not the organism can metabolize the pesticide into less toxic metabolites before the toxic activity is complete or irreversible.
Accumulation, elimination and storagePesticides and their metabolites may be stored or accumulated within an organism, or they may be eliminated as waste. If the level of exposure to most accumulated pesticides remains constant, an equilibrium between storage, metabolism and elimination is reached, and the concentration of the pesticide and its metabolites remains constant within an organism. If the level of exposure is changed, the concentration within an organism correspondingly increases or decreases.Because pesticide residues may accumulate within organisms, producers must take special precautions during harvest or slaughter. Observing specified intervals between pesticide application and grazing, harvest or slaughter ensures that the products will be safe for consumption.
Figure 2. Metabolic activation of 2,4-DB by beta-oxidation to 2,4-D.
Figure 3. Sequestration, storage and accumulation of toxins in insect pests is a method of deactivating environmental and dietary poisons that also confers a passive defense against predators on insects that can use it.
3 PesTiCiDe-oRgAnisM inTeRACTions | 27
BiodegradationPesticides in the environment can be affected by
Soil microorganisms. ♦
Soil organic matter. ♦
Soil pH. ♦
Soil texture. ♦
Soil moisture. ♦
Temperature. ♦
Humidity. ♦
Ultraviolet light (affects microbial ♦populations).
These factors can affect not only the efficacy of a pesticide but also the manner and rate of its biodegradation—the decomposition of pesticide residues in the environment by bacteria and other microorganisms.
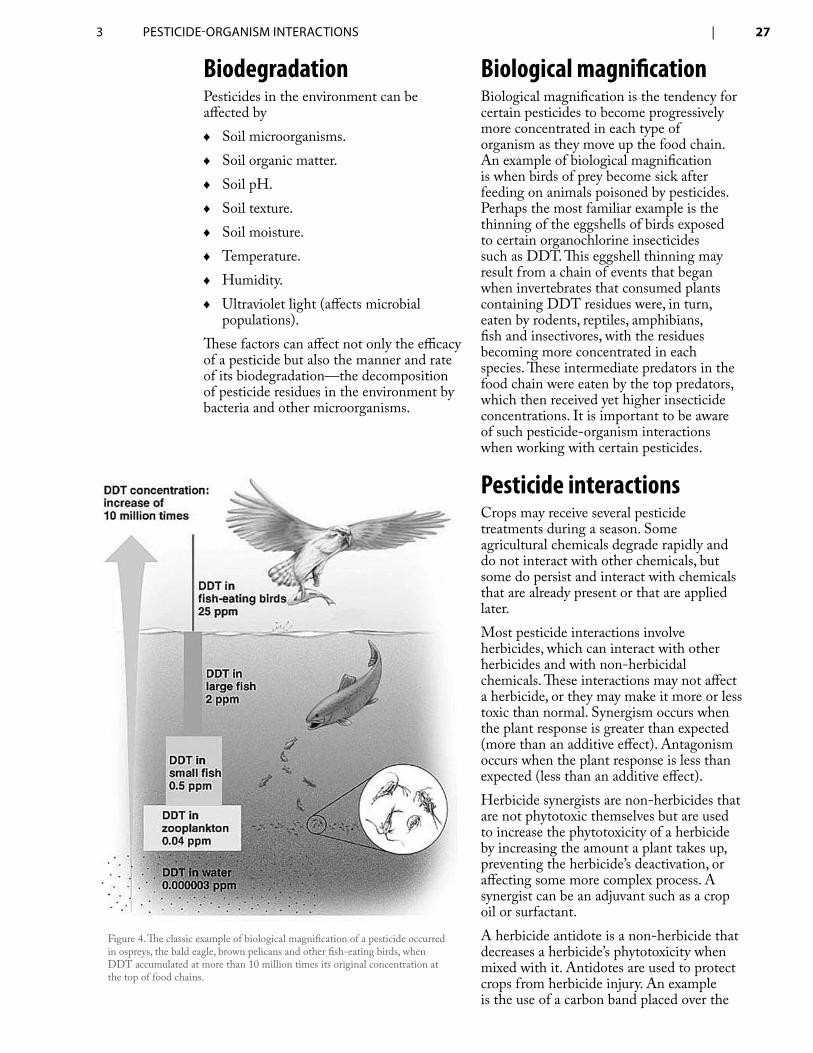
Biological magnificationBiological magnification is the tendency for certain pesticides to become progressively more concentrated in each type of organism as they move up the food chain. An example of biological magnification is when birds of prey become sick after feeding on animals poisoned by pesticides. Perhaps the most familiar example is the thinning of the eggshells of birds exposed to certain organochlorine insecticides such as DDT. This eggshell thinning may result from a chain of events that began when invertebrates that consumed plants containing DDT residues were, in turn, eaten by rodents, reptiles, amphibians, fish and insectivores, with the residues becoming more concentrated in each species. These intermediate predators in the food chain were eaten by the top predators, which then received yet higher insecticide concentrations. It is important to be aware of such pesticide-organism interactions when working with certain pesticides.
Pesticide interactionsCrops may receive several pesticide treatments during a season. Some agricultural chemicals degrade rapidly and do not interact with other chemicals, but some do persist and interact with chemicals that are already present or that are applied later.Most pesticide interactions involve herbicides, which can interact with other herbicides and with non-herbicidal chemicals. These interactions may not affect a herbicide, or they may make it more or less toxic than normal. Synergism occurs when the plant response is greater than expected (more than an additive effect). Antagonism occurs when the plant response is less than expected (less than an additive effect).Herbicide synergists are non-herbicides that are not phytotoxic themselves but are used to increase the phytotoxicity of a herbicide by increasing the amount a plant takes up, preventing the herbicide’s deactivation, or affecting some more complex process. A synergist can be an adjuvant such as a crop oil or surfactant.A herbicide antidote is a non-herbicide that decreases a herbicide’s phytotoxicity when mixed with it. Antidotes are used to protect crops from herbicide injury. An example is the use of a carbon band placed over the
Figure 4. The classic example of biological magnification of a pesticide occurred in ospreys, the bald eagle, brown pelicans and other fish-eating birds, when DDT accumulated at more than 10 million times its original concentration at the top of food chains.

28 | Demonstration and Research Pest Control
seed row to protect the new seedling from the application of diuron herbicide.Research has shown that phytotoxic interactions between major pesticide groups are infrequent, but not rare. Using insecticides with herbicides can increase or decrease the herbicidal activity. Most herbicide-insecticide mixtures increase the injury to the crop. Herbicidal interaction with fungicides is generally antagonistic.
4 equiPMenT CAlibRATion | 29
The correct calibration of equipment and the accurate measuring and mixing of pesticides are extremely important in demonstration and research pest control work. In small plots the hazards of application may be reduced and the chances of non-target pollution minimized, but the probability of applying a pesticide at the wrong rate is generally greater than in large areas. Small errors in measuring the experimental material, for example, may cause over- or under-dosing of the treatment plot. An extra 2 fluid ounces of herbicide added to a 100-gallon tank of water for general field application may not be significant. However, an extra 2 ounces added to 2 quarts of water in small plot research may produce inaccurate or unexpected results.Small-plot experiments often demand that the researcher work with measurements of grams, milliliters or ounces rather than pints or pounds. In demonstration and research, it is not acceptable to use rough estimates or round off measurements.Liquid measurements should be made with graduated cylinders or pipettes. Automatic dispensers should be used with pipettes to avoid getting the pesticide into the researcher’s mouth. Dry materials should be measured on properly adjusted scales that
measure in milligrams, grams or ounces. Conversion tables are provided in Appendix A.Because demonstration and research plots are often relatively small, hand-held equipment is usually used for pesticide application. The equipment must be calibrated to apply pesticides precisely so that research results will be accurate. Before calibration, check all nozzles for uniform output. Replace a nozzle if the amount it delivers varies more than 5 percent from the average output of all the nozzles on the boom.Small sprayers can be calibrated by using the following method:
Based on the manufacturer’s broadcast 1. recommendations on gallons per acre (gpa) application rates, and on nozzle type for the specific situation, select a suitable spray tip size from catalogs. Note information on various combinations of pressure, nozzle spacing, ground speed, spray angle, and the gallons per minute (gpm) or gpa delivered for the nozzle tip you choose.Select the ground speed based on 2. what you consider to be a comfortable operating speed. A common speed is 3 miles per hour (mph) for plot work with hand-held sprayers. At this point, the nozzle type, tip 3. size, angle, spacing, pressure, and sprayer speed that closely deliver the recommended gpa rate have been established. Now determine the actual spray delivery in gpm or gpa output by collecting the output from a nozzle over a timed period and by using one of the following formulas. For the greatest accuracy, use a graduated cylinder to collect the sprayer output.
gpm =gpa x mph x W
5,940
gpa =5,940 x gpm (per nozzle)
mph x W
4 equipment calibration
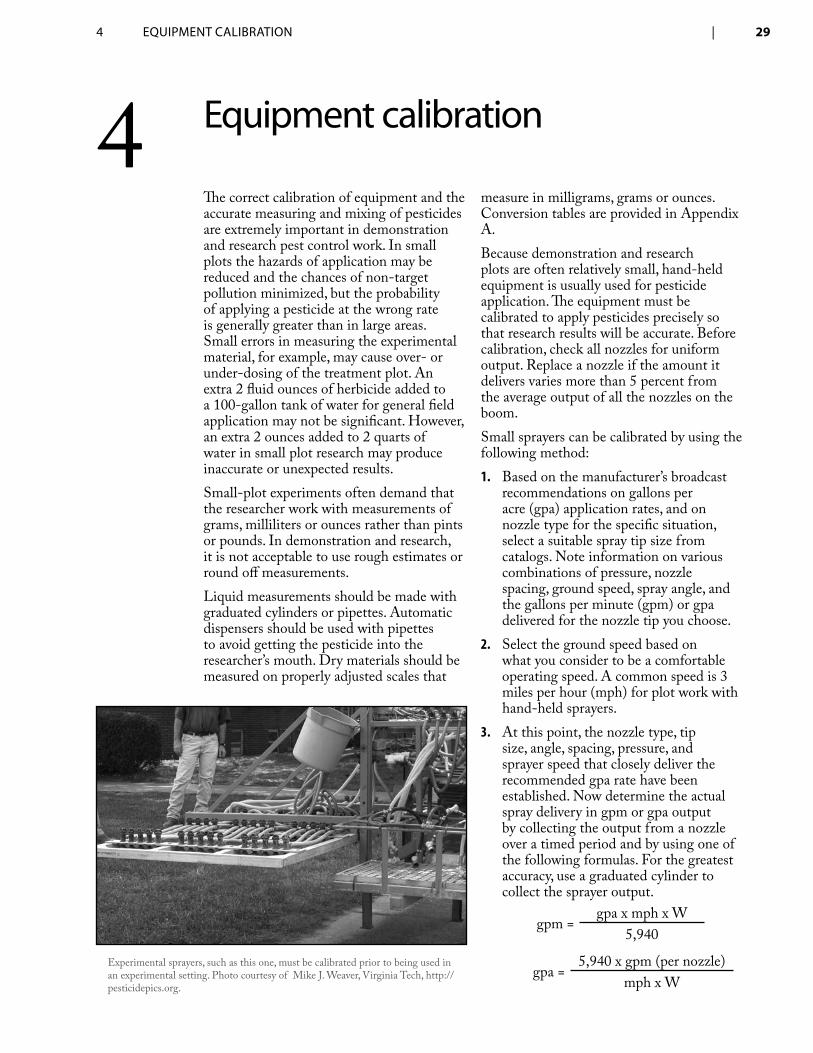
Experimental sprayers, such as this one, must be calibrated prior to being used in an experimental setting. Photo courtesy of Mike J. Weaver, Virginia Tech, http://pesticidepics.org.
30 | Demonstration and Research Pest Control
where W = spacing in inches between nozzles on a boom and 5,940 is a constant used in sprayer calibration calculations. If using a single nozzle, W is the spray band width in inches.milliliters per minute ÷ 3,785 ml/gal = gpmNote: Output can be collected for less than a minute.If 180 ml is collected in 30 seconds, what is the output in ml/min? In gpm?180 ml / 30 sec = 6 ml/sec x 60 sec/min = 360 ml/min 360 ml/min ÷ 3,785 ml/gal = 0.095 gpmSample calculations using gpm and gpa 4. formulasIf your goal is to apply 30 gpa using a CO2 backpack sprayer with a 4-nozzle boom, with 20-inch nozzle spacing, while walking at 3 mph, how many milliliters should be collected in 30 seconds?
gpm =
30 gpa x 3 mph x 20
in = 0.3 gpm
5,940 0.3 gpm x 3,785 ml/gal = 1,147 ml/min 1,147 ml/min ÷ 2 = 573.5 ml/30 secIf you collect 0.25 gpm from one nozzle using the same variables as above, what is the sprayer’s gpa rate?
gpa =5,940 x 0.25
gpm = 24.75 gpa delivered
3 mph x 20 inFinal adjustments in pressure or 5. variation in ground speed can fine tune the output to the desired amount. For major changes in spray output, replace nozzle tips.
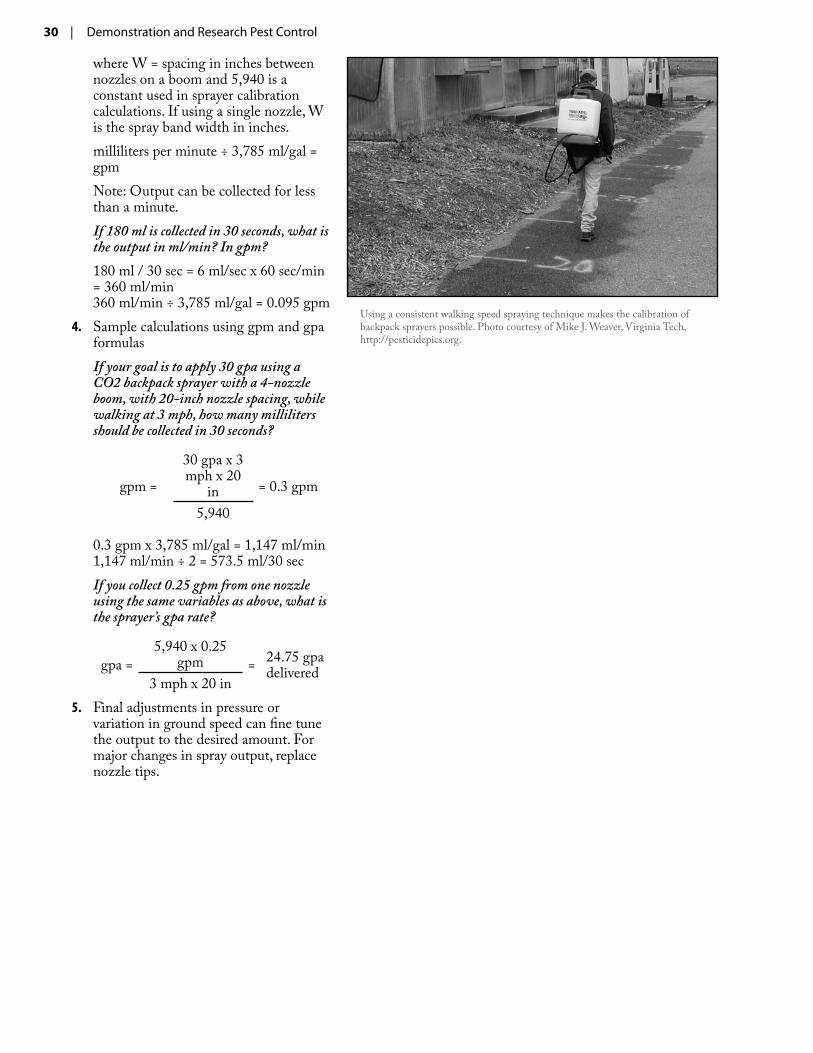
Using a consistent walking speed spraying technique makes the calibration of backpack sprayers possible. Photo courtesy of Mike J. Weaver, Virginia Tech, http://pesticidepics.org.
5 ReseARCh AnD The sCienTifiC MeThoD | 31
Research involves the use of the scientific method to discover facts or principles. All scientific research is conducted by using the following sequence of steps:
Making observations from which to ♦develop a hypothesis.Formulating a hypothesis or a predicted ♦outcome.Designing an experiment to test the ♦hypothesis objectively.Carefully conducting the experiment. ♦
Collecting data. ♦
Analyzing and interpreting data. ♦
Accepting, rejecting or altering the ♦original hypothesis based on data analysis.Drawing conclusions (inferences) about ♦results.
A well-designed experiment should be simple and precise and contain no systematic error (e.g., the plots receiving one treatment should not differ systematically from the plots receiving another treatment). The researcher should follow the scientific method meticulously when designing an experiment.A hypothesis can’t truly be proved because you never know if there isn’t one more experiment that will prove it wrong. For a simple example, say that your hypothesis is that all the beans in a cloth bag are white. You pull out a bean and it is white. Have you proved your hypothesis? No, all you have done is not disproved it. If you pull out a red bean, you know your hypothesis is wrong. If you pull out all the beans you can prove your hypothesis. However, you can’t do all the possible experiments on a topic; hence the scientific method.There is a world of difference between failing to disprove and proving a hypothesis. Make sure you understand this distinction. It is the foundation of the scientific method. All research relies on it and it is important in complying with GLPS requirements.
It is important to realize, however, that no answer is absolute and that all generalizations drawn from an experiment should be made with care.
InferenceA process called “inference” is used to test a hypothesis. Inference is the process of drawing a conclusion based solely on what you already know. It means reading all the clues and making your best guess. These clues come from the analysis of experimental data. When drawing conclusions from an experiment, you will have to use both deductive and inductive reasoning.Deductive reasoning is inference in which the conclusion is no more general than the experimental data. In essence, it is the failure to reject or the rejection of the hypothesis based upon the experimental data. Inductive reasoning is inference in which the premises of an argument support the conclusion but do not prove the point. Induction is the process of drawing broader conclusions from an experiment based upon the failure to reject or the rejection of the hypothesis.Statistical inference involves using data drawn from a portion of an unknown population or process to draw a conclusion about a property of that population or process. The most common type of inference involves getting an approximation of a property of interest by collecting a set of measurements from a restricted portion of the unknown population or process. This set of measurements is sometimes called a “sample” or sometimes a “representative sample.”Statisticians have developed formal rules for inference from both observational and empirical data. The rules are based on the likelihood (probability) that substantially similar data will result from additional observations made in the same way. In statistical inference, experimenters use deduction to accept or reject hypotheses based upon experimental data and induction
5 Research and the scientific method
32 | Demonstration and Research Pest Control
to generalize from observed information after the analysis of sample data from experiments.
On-farm researchWhen planning an experiment, the researcher has the option of conducting it on a research farm or cooperating with a private farm. The benefits and drawbacks of each should be considered.A research station might be a better place to screen riskier alternatives (such as unregistered pesticides), to conduct experiments that may make a field look bad, or to do experiments that could leave producers with a lingering problem, such as weeds. Some pests are best studied under very controlled conditions on a research farm because of highly variable populations. The researcher may decide to conduct an experiment on a private farm if the farm location offers physical conditions that are not found at a research station (e.g., a particular soil type, climate or pest infestation). Also, some pest problems may be very difficult to create artificially on a research farm (e.g. established perennial weeds). In these cases, private farm studies are more appropriate.Other factors may influence a decision to conduct an experiment at a private farm rather than a research station. Often private farm research is more credible and accessible to producers, particularly if it is done with large, machine-harvested plots. The researcher should keep in mind that the two sites (private farm vs. research station) may require different degrees of intensiveness in monitoring the experimental plots.
It is important to distinguish producers’ and researchers’ respective responsibilities. It is not fair to expect extra work from producers or meticulous station-type data collection during busy seasons. The researchers must adapt the experiment to what they judge each producer can conveniently do.Decisions must be made on experimental designs, such as the number of treatments and replications or the size of the plots, to accommodate the constraints of a private farming operation. Producers tend to favor private farm trials that use standard machinery and require little extra time to implement and maintain.One private farm method that has become acceptable to many producers uses long, narrow, strip plots. The plots are arranged in randomized blocks to accommodate large machinery. All strips are managed identically throughout the growing season except for the treatments being tested.
ExampleIf a trial is testing different methods of weed control, all strips should receive the same primary tillage, seedbed preparation, fertilizer application, insect control, and so on. The only difference in management over the entire test area would be the weed control treatment used on individual strip plots.Once a cooperator has been selected, efforts should be made to compensate him or her fairly for time and effort in a manner appropriate to each individual situation.
The principles of the scientific method should be applied in every experimetal pesticide trial. Photo courtesy of Laurie Gordon., ODA
6 PlAnning exPeRiMenTs | 33
In research there are two broad types of experiments—empirical and observational.Empirical experiments always involve two or more treatments and have as their goal the making of one or more comparisons. Empirical experiments can produce ambiguous results unless they are properly designed. (See Experimental Design).Observational experiments involve making measurements at one or more points in space or time. Space or time is the only “experimental” variable or “treatment.” Observational experiments can produce uninterpretable results unless the sampling method, scheme and strategy are carefully designed. (See Sampling Design.)Each type of experiment is planned differently because different analytical methods are used to interpret the data. Observational experiments try to establish relationships by rejecting the hypothesis that no relationship exists. Empirical experiments try to establish comparative differences between treatments by rejecting the hypothesis that no differences exist.
All effective experiments involve these basic design principles:
Replication—reduces error. ♦
Randomization—prevents bias. ♦
Blocking—increases precision. ♦
Control—permits assessment of change. ♦
Design—builds in the analytical method. ♦
These principles will be explored in the following sections.
Determining objectivesBefore you conduct a field experiment with pesticides, answer the following questions:
What are the objectives? (What do you ♦want to prove?)What is the design? (How are the ♦treatments, plots, replications and controls arranged?)What sources of variation are there ♦within either the experiment or the plot area? (Are there soil or varietal differences?)How many replications are needed? ♦
What is the sampling procedure? ♦(Number of weeds per square foot, yield, etc.)When and how will the data be taken? ♦
How will the data be analyzed? ♦
How will the results of the experiment ♦be used? (Publication, sales or demonstration?)
The last question is very important because the way you intend to use the data from the experiment greatly affects the answers to the other questions. For example, an experiment designed to show that a pesticide increases yield will involve a different experimental plot design (a greater number of replications) and a different sampling procedure than an experiment designed to illustrate the possible use of a pesticide in combination with a new tillage practice.
6 Planning experiments
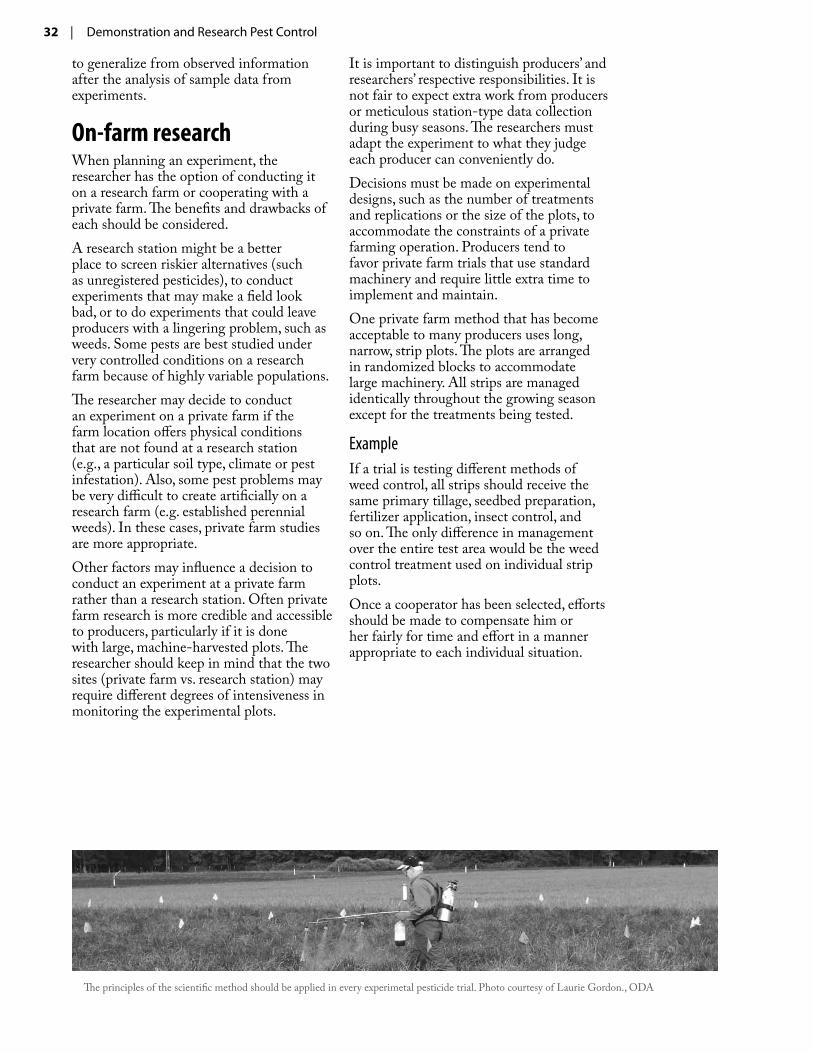
Figure 5. Example results from an empirical experiment to determine the differences in delayed corn emergence produced by different corn herbicides.
34 | Demonstration and Research Pest Control
Determining the analytical methodObservational experiments usually look for predictable levels of an effect at differing levels of a single variable (time, space, etc.). The design of observational experiments relies almost exclusively on “sampling design.”Empirical experiments usually look for differences between two or more treatments. The design of empirical experiments relies almost exclusively on “experimental design.”Good experimental technique goes a long way toward minimizing error and bias. Every effort should be made to eliminate these problems through appropriate experimental designs. The characteristics of good experiments are:
Simplicity. ♦
Degree of precision. ♦
Absence of systematic error. ♦
Range of validity of conclusions. ♦
Calculation of degree of uncertainty. ♦
SimplicityThe selection of treatments and the experimental arrangement should be as simple as possible, consistent with the objectives of the experiment.
Degree of precisionThe probability should be high that the experiment will measure treatment differences with the degree of precision the researcher desires. This requires an appropriate design and sufficient replication.
Absence of systematic errorThe experiment must be designed to ensure that experimental units receiving one treatment differ in no systematic way from those receiving another treatment so that an unbiased estimate of the effect of each treatment can be made.
Range of validity of conclusionsConclusions should have as wide a range of validity as possible. Replications increase the range of validity of conclusions. A factorial set of treatments is another way to increase
the range of validity of an experiment. In a factorial experiment, the effects of one factor are evaluated under varying levels of a second factor.
Calculation of degree of uncertaintyIn any experiment there is always some degree of uncertainty about the validity of the outcome or conclusions. The experiment should be designed so that it is possible to calculate the probability that the results could have occurred by chance alone. It is important to realize, however, that no answer is absolute and that all generalizations drawn from an experiment should be made with care.
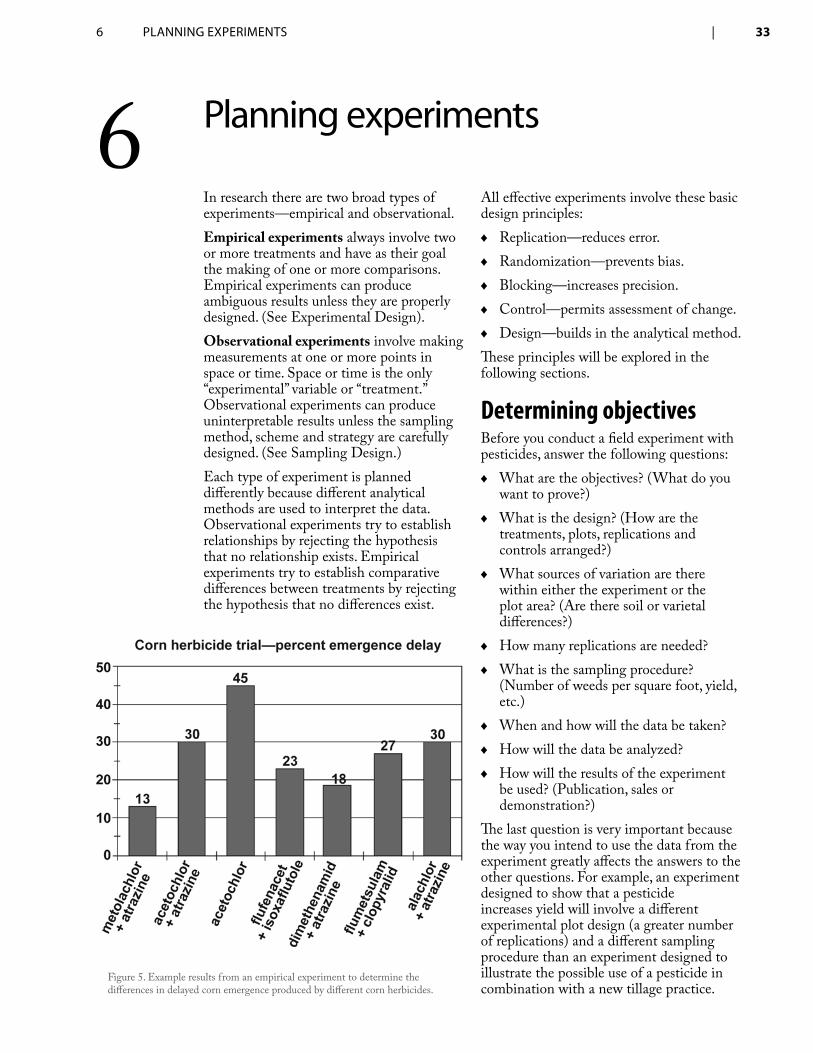
Figure 6. Example results from an observational experiment to determine the relationship of delayed corn emergence to the time after application of a corn herbicide to the soil.
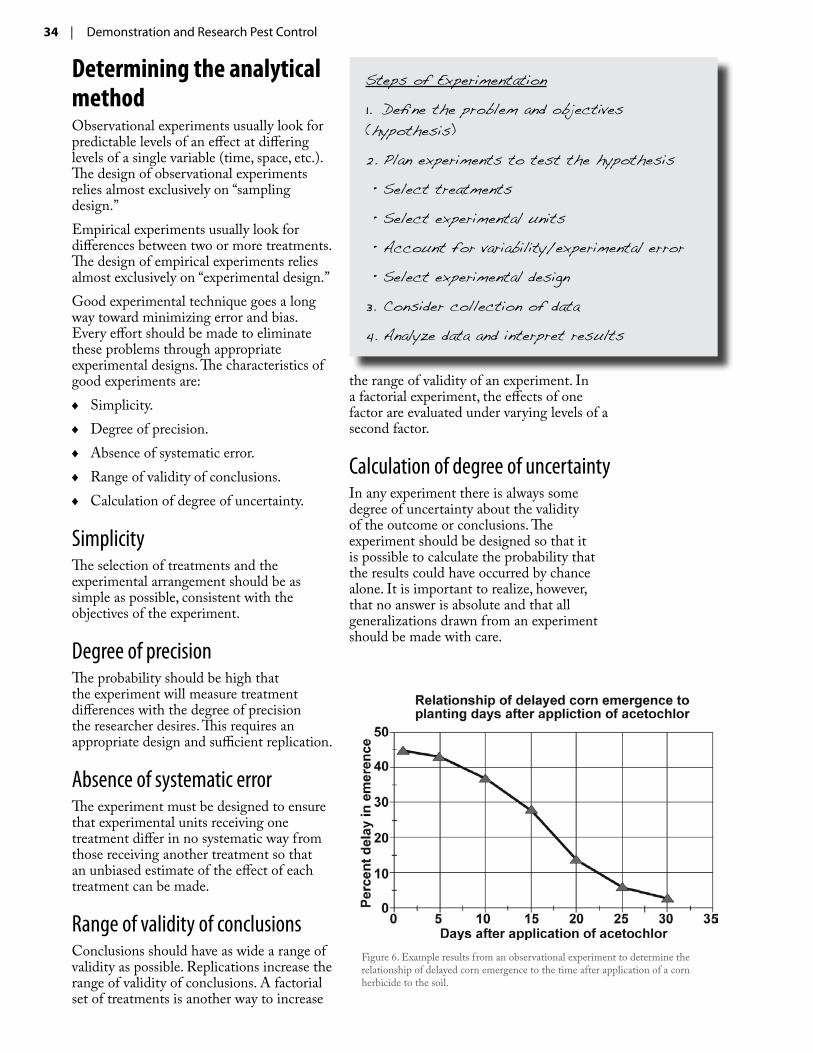
Steps of Experimentation
Define the problem and objectives 1. (hypothesis)
Plan experiments to test the hypothesis2.
Select treatments•
Select experimental units•
Account for variability/experimental error•
Select experimental design•
Consider collection of data3.
Analyze data and interpret results4.
7 exPeRiMenTAl Design | 35
Experimental design is a planned interference in the natural order of events by the researcher. Much of our scientific knowledge has come from carefully observing and measuring what happens when a selected condition or a change (treatment) is introduced.Designing an experiment is an extremely important process because errors made in the design can invalidate the results of the entire experiment. Experimental design also is important because the researcher wants to do more than simply describe the outcome. He or she also wants to make inferences about what factor contributed to or caused events, and to do so without ambiguity. Thus, proper experimental design is critical for ruling out alternatives and producing clear results.The most able statistician cannot validate conclusions from an improperly designed experiment. Experiments and demonstrations that have simple designs are generally more successful than those with elaborate designs. Knowing the limits of your resources—financial, land area and other resources—can help you plan a successful experiment. If you have questions about your experimental design or method, get help from a qualified statistician before starting your research.Replication and randomization are basic components of valid research experiments. Replication decreases experimental error, while randomization prevents bias and increases the validity of data collected.
Design Considerations
Experimental units and control plotsAn experimental unit is the smallest unit to which a treatment can be applied at random. Every treatment should have an equal chance of being assigned to any experimental unit. This ensures a valid and unbiased estimate of the experimental error and treatment differences. Remember,
it is the experimental unit that gets the treatment.The experimental units or plots in which the treatment is not made are called the controls or checks. Control plots should be included in all experimental field work. Failure to include control plots or not including enough control plots yields questionable results that are usually unacceptable for publication and sales promotion. Check plots should be selected with the same objectivity as other plots. The same variables that may affect treatment plots also may affect control plots. Thus, the location of control plots within a field should not be selected arbitrarily. Likewise, control animals should not be selected arbitrarily but should represent a random sample of the test population.
Selecting treatmentsThe objective, or purpose, of the study will determine the treatments included in an experiment. Write down the test objectives so you can precisely define what it is you want to find out. A test may have more than one objective, although multiple objectives should be closely related and clearly defined to distinguish one from another.The selection of treatments is usually logical if you can define the purpose of the study. You should include ALL treatments necessary to address the experiment’s objective. For example, if the purpose of an experiment is to determine which of five insecticides is most effective, then the treatments will include all five of those insecticides and an untreated control. If the purpose is to determine if any of the five insecticides works better than your current choice, then the treatments will include the five insecticides plus the insecticide you presently use and an untreated control. Accurately stating the purpose of the test before the treatments are applied in the field is critical. After the treatments have begun, it will be too late to add other treatments to answer the question you really wanted to address.
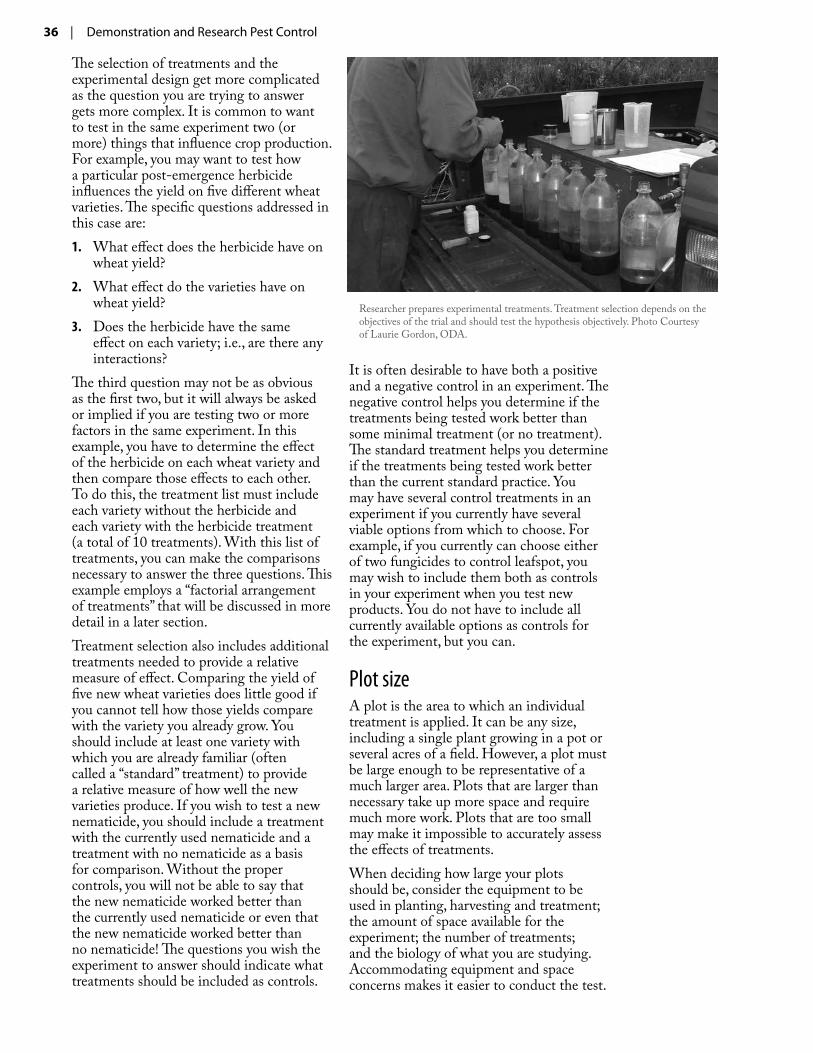
7 experimental design
36 | Demonstration and Research Pest Control
The selection of treatments and the experimental design get more complicated as the question you are trying to answer gets more complex. It is common to want to test in the same experiment two (or more) things that influence crop production. For example, you may want to test how a particular post-emergence herbicide influences the yield on five different wheat varieties. The specific questions addressed in this case are:
What effect does the herbicide have on 1. wheat yield?What effect do the varieties have on 2. wheat yield?Does the herbicide have the same 3. effect on each variety; i.e., are there any interactions?
The third question may not be as obvious as the first two, but it will always be asked or implied if you are testing two or more factors in the same experiment. In this example, you have to determine the effect of the herbicide on each wheat variety and then compare those effects to each other. To do this, the treatment list must include each variety without the herbicide and each variety with the herbicide treatment (a total of 10 treatments). With this list of treatments, you can make the comparisons necessary to answer the three questions. This example employs a “factorial arrangement of treatments” that will be discussed in more detail in a later section.Treatment selection also includes additional treatments needed to provide a relative measure of effect. Comparing the yield of five new wheat varieties does little good if you cannot tell how those yields compare with the variety you already grow. You should include at least one variety with which you are already familiar (often called a “standard” treatment) to provide a relative measure of how well the new varieties produce. If you wish to test a new nematicide, you should include a treatment with the currently used nematicide and a treatment with no nematicide as a basis for comparison. Without the proper controls, you will not be able to say that the new nematicide worked better than the currently used nematicide or even that the new nematicide worked better than no nematicide! The questions you wish the experiment to answer should indicate what treatments should be included as controls.
It is often desirable to have both a positive and a negative control in an experiment. The negative control helps you determine if the treatments being tested work better than some minimal treatment (or no treatment). The standard treatment helps you determine if the treatments being tested work better than the current standard practice. You may have several control treatments in an experiment if you currently have several viable options from which to choose. For example, if you currently can choose either of two fungicides to control leafspot, you may wish to include them both as controls in your experiment when you test new products. You do not have to include all currently available options as controls for the experiment, but you can.
Plot sizeA plot is the area to which an individual treatment is applied. It can be any size, including a single plant growing in a pot or several acres of a field. However, a plot must be large enough to be representative of a much larger area. Plots that are larger than necessary take up more space and require much more work. Plots that are too small may make it impossible to accurately assess the effects of treatments.When deciding how large your plots should be, consider the equipment to be used in planting, harvesting and treatment; the amount of space available for the experiment; the number of treatments; and the biology of what you are studying. Accommodating equipment and space concerns makes it easier to conduct the test.
Researcher prepares experimental treatments. Treatment selection depends on the objectives of the trial and should test the hypothesis objectively. Photo Courtesy of Laurie Gordon, ODA.
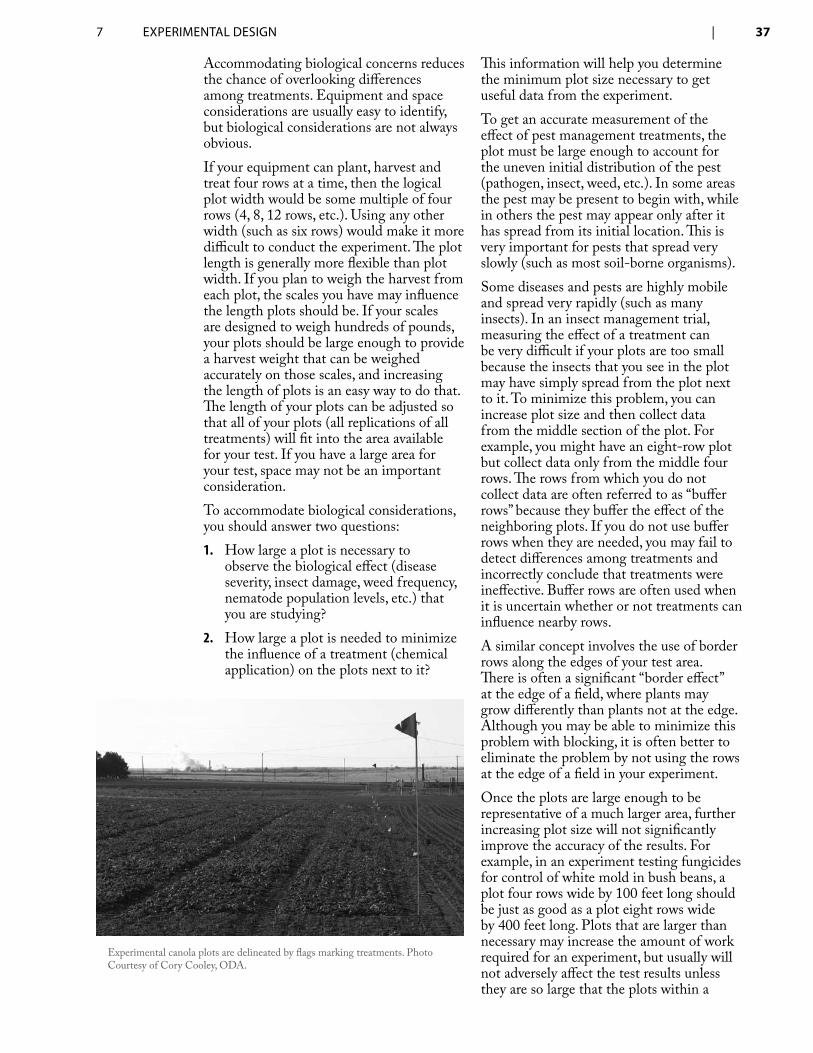
7 exPeRiMenTAl Design | 37
Accommodating biological concerns reduces the chance of overlooking differences among treatments. Equipment and space considerations are usually easy to identify, but biological considerations are not always obvious.If your equipment can plant, harvest and treat four rows at a time, then the logical plot width would be some multiple of four rows (4, 8, 12 rows, etc.). Using any other width (such as six rows) would make it more difficult to conduct the experiment. The plot length is generally more flexible than plot width. If you plan to weigh the harvest from each plot, the scales you have may influence the length plots should be. If your scales are designed to weigh hundreds of pounds, your plots should be large enough to provide a harvest weight that can be weighed accurately on those scales, and increasing the length of plots is an easy way to do that. The length of your plots can be adjusted so that all of your plots (all replications of all treatments) will fit into the area available for your test. If you have a large area for your test, space may not be an important consideration.To accommodate biological considerations, you should answer two questions:
How large a plot is necessary to 1. observe the biological effect (disease severity, insect damage, weed frequency, nematode population levels, etc.) that you are studying?How large a plot is needed to minimize 2. the influence of a treatment (chemical application) on the plots next to it?
This information will help you determine the minimum plot size necessary to get useful data from the experiment.To get an accurate measurement of the effect of pest management treatments, the plot must be large enough to account for the uneven initial distribution of the pest (pathogen, insect, weed, etc.). In some areas the pest may be present to begin with, while in others the pest may appear only after it has spread from its initial location. This is very important for pests that spread very slowly (such as most soil-borne organisms).Some diseases and pests are highly mobile and spread very rapidly (such as many insects). In an insect management trial, measuring the effect of a treatment can be very difficult if your plots are too small because the insects that you see in the plot may have simply spread from the plot next to it. To minimize this problem, you can increase plot size and then collect data from the middle section of the plot. For example, you might have an eight-row plot but collect data only from the middle four rows. The rows from which you do not collect data are often referred to as “buffer rows” because they buffer the effect of the neighboring plots. If you do not use buffer rows when they are needed, you may fail to detect differences among treatments and incorrectly conclude that treatments were ineffective. Buffer rows are often used when it is uncertain whether or not treatments can influence nearby rows.A similar concept involves the use of border rows along the edges of your test area. There is often a significant “border effect” at the edge of a field, where plants may grow differently than plants not at the edge. Although you may be able to minimize this problem with blocking, it is often better to eliminate the problem by not using the rows at the edge of a field in your experiment.Once the plots are large enough to be representative of a much larger area, further increasing plot size will not significantly improve the accuracy of the results. For example, in an experiment testing fungicides for control of white mold in bush beans, a plot four rows wide by 100 feet long should be just as good as a plot eight rows wide by 400 feet long. Plots that are larger than necessary may increase the amount of work required for an experiment, but usually will not adversely affect the test results unless they are so large that the plots within a
Experimental canola plots are delineated by flags marking treatments. Photo Courtesy of Cory Cooley, ODA.
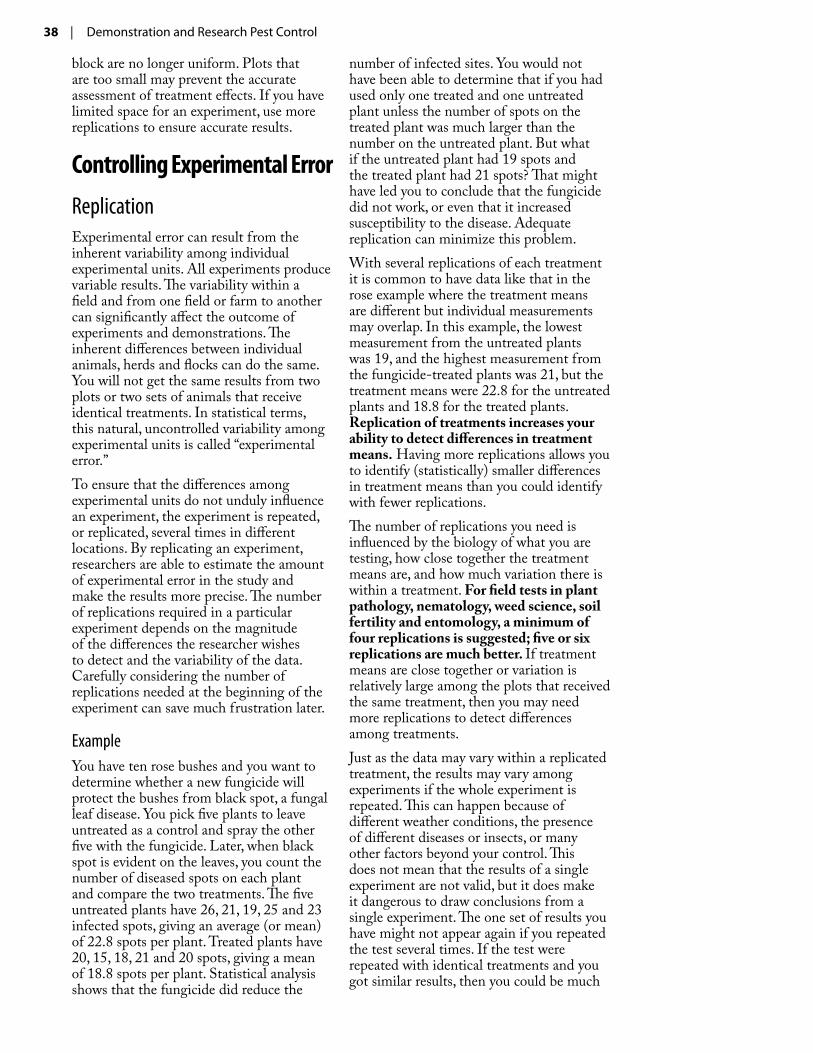
38 | Demonstration and Research Pest Control
block are no longer uniform. Plots that are too small may prevent the accurate assessment of treatment effects. If you have limited space for an experiment, use more replications to ensure accurate results.
Controlling Experimental Error
ReplicationExperimental error can result from the inherent variability among individual experimental units. All experiments produce variable results. The variability within a field and from one field or farm to another can significantly affect the outcome of experiments and demonstrations. The inherent differences between individual animals, herds and flocks can do the same. You will not get the same results from two plots or two sets of animals that receive identical treatments. In statistical terms, this natural, uncontrolled variability among experimental units is called “experimental error.”To ensure that the differences among experimental units do not unduly influence an experiment, the experiment is repeated, or replicated, several times in different locations. By replicating an experiment, researchers are able to estimate the amount of experimental error in the study and make the results more precise. The number of replications required in a particular experiment depends on the magnitude of the differences the researcher wishes to detect and the variability of the data. Carefully considering the number of replications needed at the beginning of the experiment can save much frustration later.
ExampleYou have ten rose bushes and you want to determine whether a new fungicide will protect the bushes from black spot, a fungal leaf disease. You pick five plants to leave untreated as a control and spray the other five with the fungicide. Later, when black spot is evident on the leaves, you count the number of diseased spots on each plant and compare the two treatments. The five untreated plants have 26, 21, 19, 25 and 23 infected spots, giving an average (or mean) of 22.8 spots per plant. Treated plants have 20, 15, 18, 21 and 20 spots, giving a mean of 18.8 spots per plant. Statistical analysis shows that the fungicide did reduce the
number of infected sites. You would not have been able to determine that if you had used only one treated and one untreated plant unless the number of spots on the treated plant was much larger than the number on the untreated plant. But what if the untreated plant had 19 spots and the treated plant had 21 spots? That might have led you to conclude that the fungicide did not work, or even that it increased susceptibility to the disease. Adequate replication can minimize this problem.With several replications of each treatment it is common to have data like that in the rose example where the treatment means are different but individual measurements may overlap. In this example, the lowest measurement from the untreated plants was 19, and the highest measurement from the fungicide-treated plants was 21, but the treatment means were 22.8 for the untreated plants and 18.8 for the treated plants. Replication of treatments increases your ability to detect differences in treatment means. Having more replications allows you to identify (statistically) smaller differences in treatment means than you could identify with fewer replications.The number of replications you need is influenced by the biology of what you are testing, how close together the treatment means are, and how much variation there is within a treatment. For field tests in plant pathology, nematology, weed science, soil fertility and entomology, a minimum of four replications is suggested; five or six replications are much better. If treatment means are close together or variation is relatively large among the plots that received the same treatment, then you may need more replications to detect differences among treatments.Just as the data may vary within a replicated treatment, the results may vary among experiments if the whole experiment is repeated. This can happen because of different weather conditions, the presence of different diseases or insects, or many other factors beyond your control. This does not mean that the results of a single experiment are not valid, but it does make it dangerous to draw conclusions from a single experiment. The one set of results you have might not appear again if you repeated the test several times. If the test were repeated with identical treatments and you got similar results, then you could be much
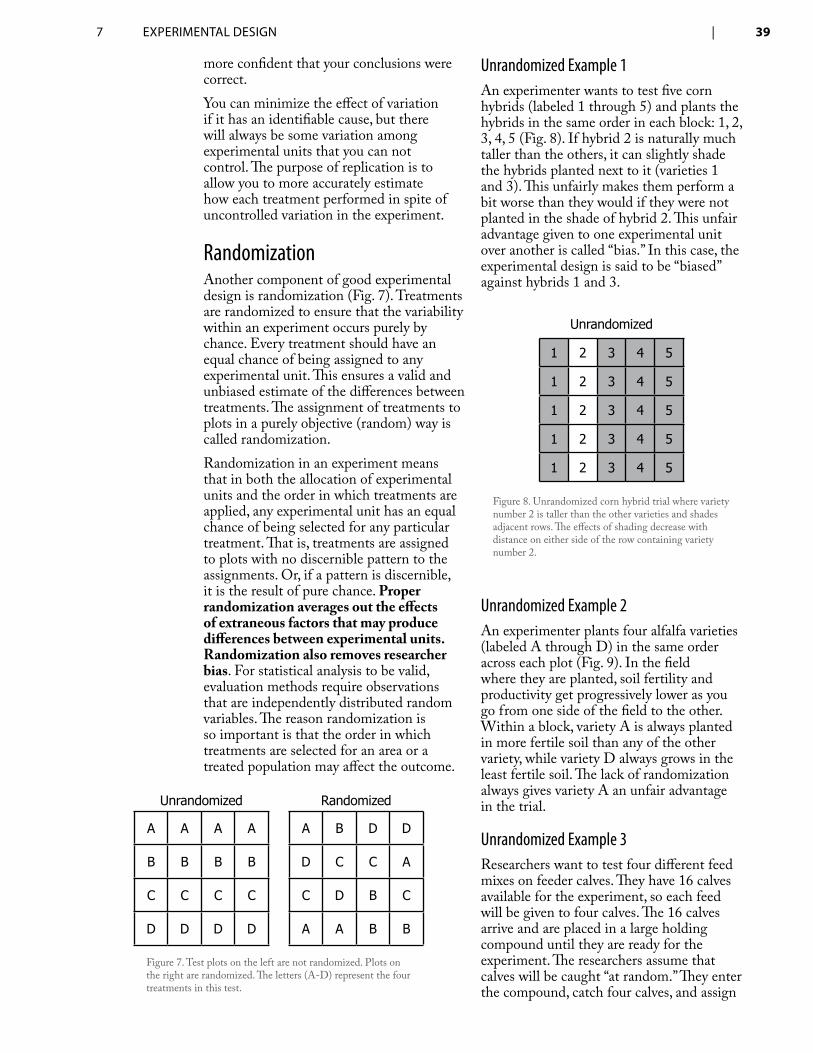
7 exPeRiMenTAl Design | 39
more confident that your conclusions were correct.You can minimize the effect of variation if it has an identifiable cause, but there will always be some variation among experimental units that you can not control. The purpose of replication is to allow you to more accurately estimate how each treatment performed in spite of uncontrolled variation in the experiment.
RandomizationAnother component of good experimental design is randomization (Fig. 7). Treatments are randomized to ensure that the variability within an experiment occurs purely by chance. Every treatment should have an equal chance of being assigned to any experimental unit. This ensures a valid and unbiased estimate of the differences between treatments. The assignment of treatments to plots in a purely objective (random) way is called randomization.Randomization in an experiment means that in both the allocation of experimental units and the order in which treatments are applied, any experimental unit has an equal chance of being selected for any particular treatment. That is, treatments are assigned to plots with no discernible pattern to the assignments. Or, if a pattern is discernible, it is the result of pure chance. Proper randomization averages out the effects of extraneous factors that may produce differences between experimental units. Randomization also removes researcher bias. For statistical analysis to be valid, evaluation methods require observations that are independently distributed random variables. The reason randomization is so important is that the order in which treatments are selected for an area or a treated population may affect the outcome.
Unrandomized Example 1An experimenter wants to test five corn hybrids (labeled 1 through 5) and plants the hybrids in the same order in each block: 1, 2, 3, 4, 5 (Fig. 8). If hybrid 2 is naturally much taller than the others, it can slightly shade the hybrids planted next to it (varieties 1 and 3). This unfairly makes them perform a bit worse than they would if they were not planted in the shade of hybrid 2. This unfair advantage given to one experimental unit over another is called “bias.” In this case, the experimental design is said to be “biased” against hybrids 1 and 3.
Unrandomized Example 2An experimenter plants four alfalfa varieties (labeled A through D) in the same order across each plot (Fig. 9). In the field where they are planted, soil fertility and productivity get progressively lower as you go from one side of the field to the other. Within a block, variety A is always planted in more fertile soil than any of the other variety, while variety D always grows in the least fertile soil. The lack of randomization always gives variety A an unfair advantage in the trial.
Unrandomized Example 3Researchers want to test four different feed mixes on feeder calves. They have 16 calves available for the experiment, so each feed will be given to four calves. The 16 calves arrive and are placed in a large holding compound until they are ready for the experiment. The researchers assume that calves will be caught “at random.” They enter the compound, catch four calves, and assign
Figure 8. Unrandomized corn hybrid trial where variety number 2 is taller than the other varieties and shades adjacent rows. The effects of shading decrease with distance on either side of the row containing variety number 2.
Unrandomized
1 2 3 4 5
1 2 3 4 5
1 2 3 4 5
1 2 3 4 5
1 2 3 4 5
Figure 7. Test plots on the left are not randomized. Plots on the right are randomized. The letters (A-D) represent the four treatments in this test.
Unrandomized Randomized
A A A A
B B B B
C C C C
D D D D
A B D D
D C C A
C D B C
A A B B
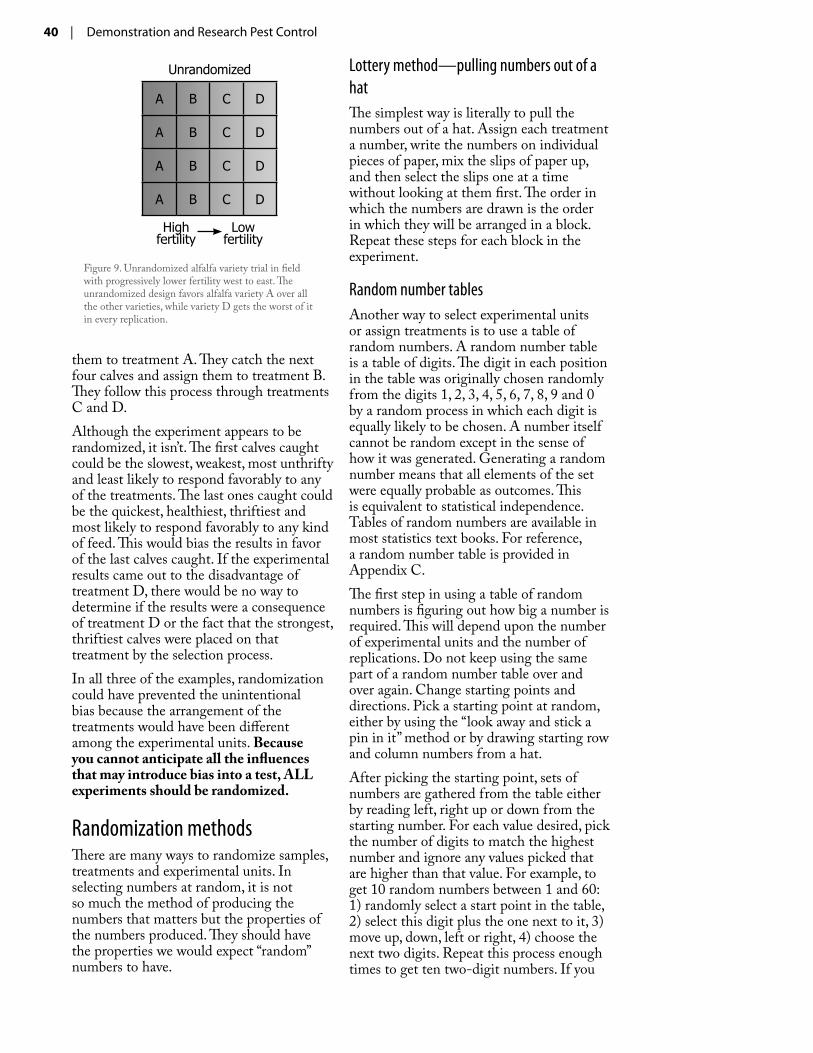
40 | Demonstration and Research Pest Control
them to treatment A. They catch the next four calves and assign them to treatment B. They follow this process through treatments C and D.Although the experiment appears to be randomized, it isn’t. The first calves caught could be the slowest, weakest, most unthrifty and least likely to respond favorably to any of the treatments. The last ones caught could be the quickest, healthiest, thriftiest and most likely to respond favorably to any kind of feed. This would bias the results in favor of the last calves caught. If the experimental results came out to the disadvantage of treatment D, there would be no way to determine if the results were a consequence of treatment D or the fact that the strongest, thriftiest calves were placed on that treatment by the selection process.In all three of the examples, randomization could have prevented the unintentional bias because the arrangement of the treatments would have been different among the experimental units. Because you cannot anticipate all the influences that may introduce bias into a test, ALL experiments should be randomized.
Randomization methodsThere are many ways to randomize samples, treatments and experimental units. In selecting numbers at random, it is not so much the method of producing the numbers that matters but the properties of the numbers produced. They should have the properties we would expect “random” numbers to have.
Lottery method—pulling numbers out of a hatThe simplest way is literally to pull the numbers out of a hat. Assign each treatment a number, write the numbers on individual pieces of paper, mix the slips of paper up, and then select the slips one at a time without looking at them first. The order in which the numbers are drawn is the order in which they will be arranged in a block. Repeat these steps for each block in the experiment.
Random number tablesAnother way to select experimental units or assign treatments is to use a table of random numbers. A random number table is a table of digits. The digit in each position in the table was originally chosen randomly from the digits 1, 2, 3, 4, 5, 6, 7, 8, 9 and 0 by a random process in which each digit is equally likely to be chosen. A number itself cannot be random except in the sense of how it was generated. Generating a random number means that all elements of the set were equally probable as outcomes. This is equivalent to statistical independence. Tables of random numbers are available in most statistics text books. For reference, a random number table is provided in Appendix C. The first step in using a table of random numbers is figuring out how big a number is required. This will depend upon the number of experimental units and the number of replications. Do not keep using the same part of a random number table over and over again. Change starting points and directions. Pick a starting point at random, either by using the “look away and stick a pin in it” method or by drawing starting row and column numbers from a hat.After picking the starting point, sets of numbers are gathered from the table either by reading left, right up or down from the starting number. For each value desired, pick the number of digits to match the highest number and ignore any values picked that are higher than that value. For example, to get 10 random numbers between 1 and 60: 1) randomly select a start point in the table, 2) select this digit plus the one next to it, 3) move up, down, left or right, 4) choose the next two digits. Repeat this process enough times to get ten two-digit numbers. If you
Figure 9. Unrandomized alfalfa variety trial in field with progressively lower fertility west to east. The unrandomized design favors alfalfa variety A over all the other varieties, while variety D gets the worst of it in every replication.
Unrandomized
A B C D
A B C D
A B C D
A B C D
High fertility
Low fertility
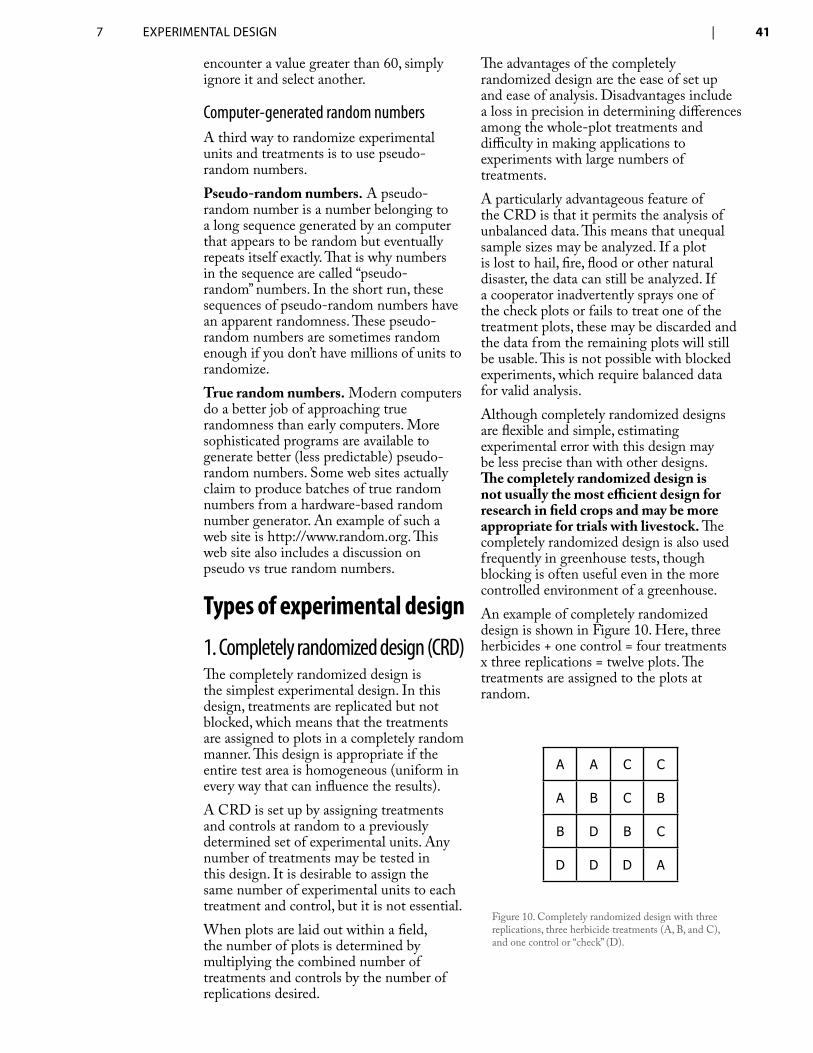
7 exPeRiMenTAl Design | 41
encounter a value greater than 60, simply ignore it and select another.
Computer-generated random numbersA third way to randomize experimental units and treatments is to use pseudo-random numbers.Pseudo-random numbers. A pseudo-random number is a number belonging to a long sequence generated by an computer that appears to be random but eventually repeats itself exactly. That is why numbers in the sequence are called “pseudo-random” numbers. In the short run, these sequences of pseudo-random numbers have an apparent randomness. These pseudo-random numbers are sometimes random enough if you don’t have millions of units to randomize.True random numbers. Modern computers do a better job of approaching true randomness than early computers. More sophisticated programs are available to generate better (less predictable) pseudo-random numbers. Some web sites actually claim to produce batches of true random numbers from a hardware-based random number generator. An example of such a web site is http://www.random.org. This web site also includes a discussion on pseudo vs true random numbers.
Types of experimental design
1. Completely randomized design (CRD)The completely randomized design is the simplest experimental design. In this design, treatments are replicated but not blocked, which means that the treatments are assigned to plots in a completely random manner. This design is appropriate if the entire test area is homogeneous (uniform in every way that can influence the results).A CRD is set up by assigning treatments and controls at random to a previously determined set of experimental units. Any number of treatments may be tested in this design. It is desirable to assign the same number of experimental units to each treatment and control, but it is not essential.When plots are laid out within a field, the number of plots is determined by multiplying the combined number of treatments and controls by the number of replications desired.
The advantages of the completely randomized design are the ease of set up and ease of analysis. Disadvantages include a loss in precision in determining differences among the whole-plot treatments and difficulty in making applications to experiments with large numbers of treatments.A particularly advantageous feature of the CRD is that it permits the analysis of unbalanced data. This means that unequal sample sizes may be analyzed. If a plot is lost to hail, fire, flood or other natural disaster, the data can still be analyzed. If a cooperator inadvertently sprays one of the check plots or fails to treat one of the treatment plots, these may be discarded and the data from the remaining plots will still be usable. This is not possible with blocked experiments, which require balanced data for valid analysis.Although completely randomized designs are flexible and simple, estimating experimental error with this design may be less precise than with other designs. The completely randomized design is not usually the most efficient design for research in field crops and may be more appropriate for trials with livestock. The completely randomized design is also used frequently in greenhouse tests, though blocking is often useful even in the more controlled environment of a greenhouse.An example of completely randomized design is shown in Figure 10. Here, three herbicides + one control = four treatments x three replications = twelve plots. The treatments are assigned to the plots at random.
Figure 10. Completely randomized design with three replications, three herbicide treatments (A, B, and C), and one control or “check” (D).
A A C C
A B C B
B D B C
D D D A
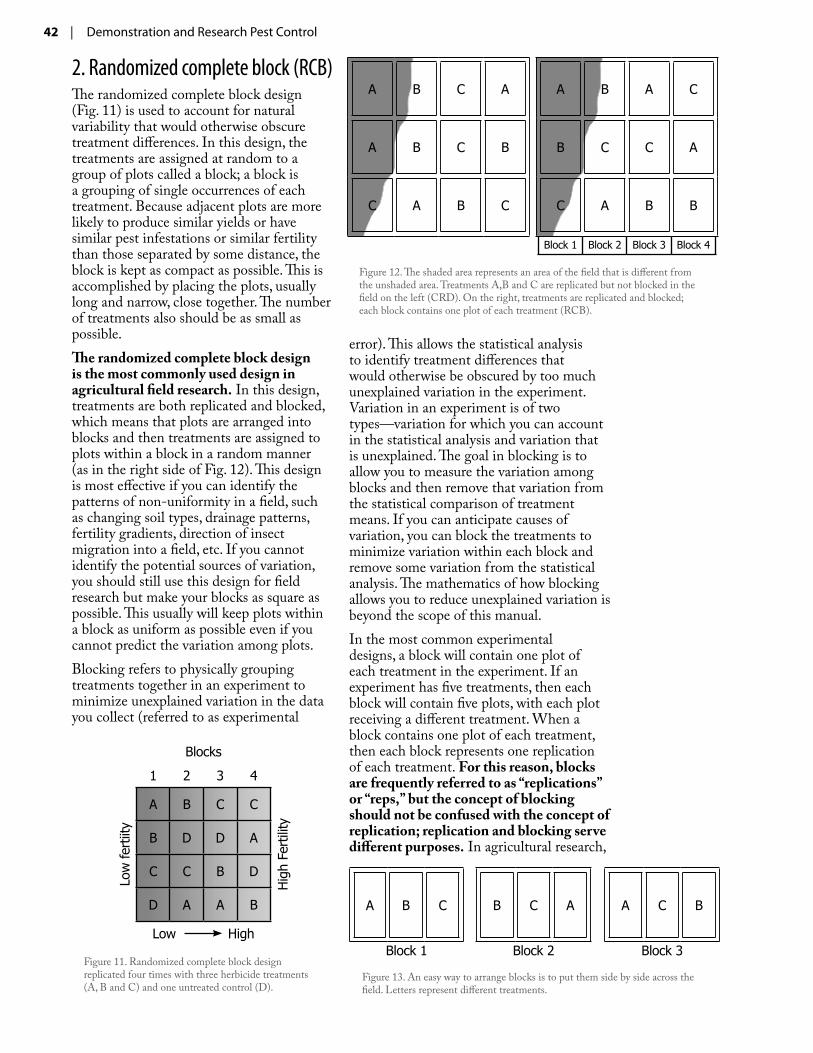
42 | Demonstration and Research Pest Control
2. Randomized complete block (RCB)The randomized complete block design (Fig. 11) is used to account for natural variability that would otherwise obscure treatment differences. In this design, the treatments are assigned at random to a group of plots called a block; a block is a grouping of single occurrences of each treatment. Because adjacent plots are more likely to produce similar yields or have similar pest infestations or similar fertility than those separated by some distance, the block is kept as compact as possible. This is accomplished by placing the plots, usually long and narrow, close together. The number of treatments also should be as small as possible.The randomized complete block design is the most commonly used design in agricultural field research. In this design, treatments are both replicated and blocked, which means that plots are arranged into blocks and then treatments are assigned to plots within a block in a random manner (as in the right side of Fig. 12). This design is most effective if you can identify the patterns of non-uniformity in a field, such as changing soil types, drainage patterns, fertility gradients, direction of insect migration into a field, etc. If you cannot identify the potential sources of variation, you should still use this design for field research but make your blocks as square as possible. This usually will keep plots within a block as uniform as possible even if you cannot predict the variation among plots.Blocking refers to physically grouping treatments together in an experiment to minimize unexplained variation in the data you collect (referred to as experimental
error). This allows the statistical analysis to identify treatment differences that would otherwise be obscured by too much unexplained variation in the experiment. Variation in an experiment is of two types—variation for which you can account in the statistical analysis and variation that is unexplained. The goal in blocking is to allow you to measure the variation among blocks and then remove that variation from the statistical comparison of treatment means. If you can anticipate causes of variation, you can block the treatments to minimize variation within each block and remove some variation from the statistical analysis. The mathematics of how blocking allows you to reduce unexplained variation is beyond the scope of this manual.In the most common experimental designs, a block will contain one plot of each treatment in the experiment. If an experiment has five treatments, then each block will contain five plots, with each plot receiving a different treatment. When a block contains one plot of each treatment, then each block represents one replication of each treatment. For this reason, blocks are frequently referred to as “replications” or “reps,” but the concept of blocking should not be confused with the concept of replication; replication and blocking serve different purposes. In agricultural research,
A B C A A B A C
A B C B B C C A
C A B C C A B B
Block 1 Block 2 Block 3 Block 4
Figure 12. The shaded area represents an area of the field that is different from the unshaded area. Treatments A,B and C are replicated but not blocked in the field on the left (CRD). On the right, treatments are replicated and blocked; each block contains one plot of each treatment (RCB).
Figure 13. An easy way to arrange blocks is to put them side by side across the field. Letters represent different treatments.
A B C B C A A C B
Block 1 Block 2 Block 3Figure 11. Randomized complete block design replicated four times with three herbicide treatments (A, B and C) and one untreated control (D).
Blocks
1 2 3 4
Low
fert
iity
A B C C
Hig
h Fe
rtili
ty
B D D A
C C B D
D A A B
Low High
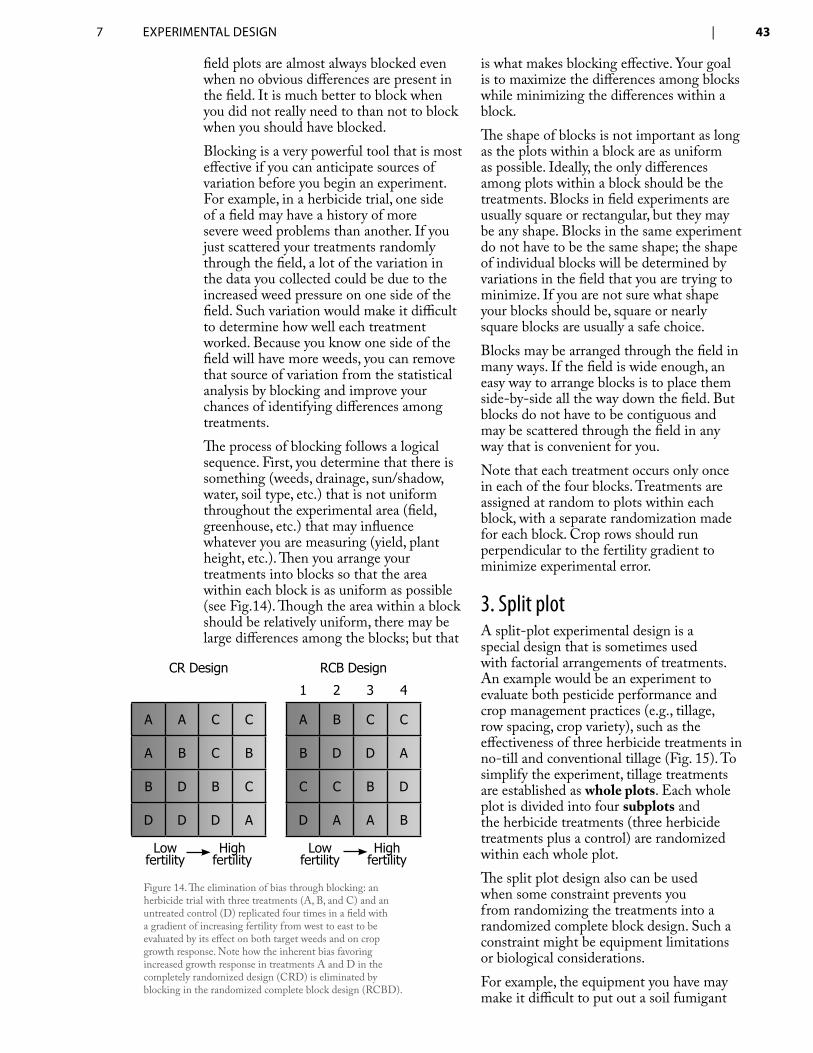
7 exPeRiMenTAl Design | 43
field plots are almost always blocked even when no obvious differences are present in the field. It is much better to block when you did not really need to than not to block when you should have blocked.Blocking is a very powerful tool that is most effective if you can anticipate sources of variation before you begin an experiment. For example, in a herbicide trial, one side of a field may have a history of more severe weed problems than another. If you just scattered your treatments randomly through the field, a lot of the variation in the data you collected could be due to the increased weed pressure on one side of the field. Such variation would make it difficult to determine how well each treatment worked. Because you know one side of the field will have more weeds, you can remove that source of variation from the statistical analysis by blocking and improve your chances of identifying differences among treatments.The process of blocking follows a logical sequence. First, you determine that there is something (weeds, drainage, sun/shadow, water, soil type, etc.) that is not uniform throughout the experimental area (field, greenhouse, etc.) that may influence whatever you are measuring (yield, plant height, etc.). Then you arrange your treatments into blocks so that the area within each block is as uniform as possible (see Fig.14). Though the area within a block should be relatively uniform, there may be large differences among the blocks; but that
is what makes blocking effective. Your goal is to maximize the differences among blocks while minimizing the differences within a block.The shape of blocks is not important as long as the plots within a block are as uniform as possible. Ideally, the only differences among plots within a block should be the treatments. Blocks in field experiments are usually square or rectangular, but they may be any shape. Blocks in the same experiment do not have to be the same shape; the shape of individual blocks will be determined by variations in the field that you are trying to minimize. If you are not sure what shape your blocks should be, square or nearly square blocks are usually a safe choice.Blocks may be arranged through the field in many ways. If the field is wide enough, an easy way to arrange blocks is to place them side-by-side all the way down the field. But blocks do not have to be contiguous and may be scattered through the field in any way that is convenient for you.Note that each treatment occurs only once in each of the four blocks. Treatments are assigned at random to plots within each block, with a separate randomization made for each block. Crop rows should run perpendicular to the fertility gradient to minimize experimental error.
3. Split plotA split-plot experimental design is a special design that is sometimes used with factorial arrangements of treatments. An example would be an experiment to evaluate both pesticide performance and crop management practices (e.g., tillage, row spacing, crop variety), such as the effectiveness of three herbicide treatments in no-till and conventional tillage (Fig. 15). To simplify the experiment, tillage treatments are established as whole plots. Each whole plot is divided into four subplots and the herbicide treatments (three herbicide treatments plus a control) are randomized within each whole plot.The split plot design also can be used when some constraint prevents you from randomizing the treatments into a randomized complete block design. Such a constraint might be equipment limitations or biological considerations. For example, the equipment you have may make it difficult to put out a soil fumigant
Figure 14. The elimination of bias through blocking: an herbicide trial with three treatments (A, B, and C) and an untreated control (D) replicated four times in a field with a gradient of increasing fertility from west to east to be evaluated by its effect on both target weeds and on crop growth response. Note how the inherent bias favoring increased growth response in treatments A and D in the completely randomized design (CRD) is eliminated by blocking in the randomized complete block design (RCBD).
CR Design RCB Design
1 2 3 4
A A C C
A B C B
B D B C
D D D A
A B C C
B D D A
C C B D
D A A B
Low fertility
High fertility
Low fertility
High fertility
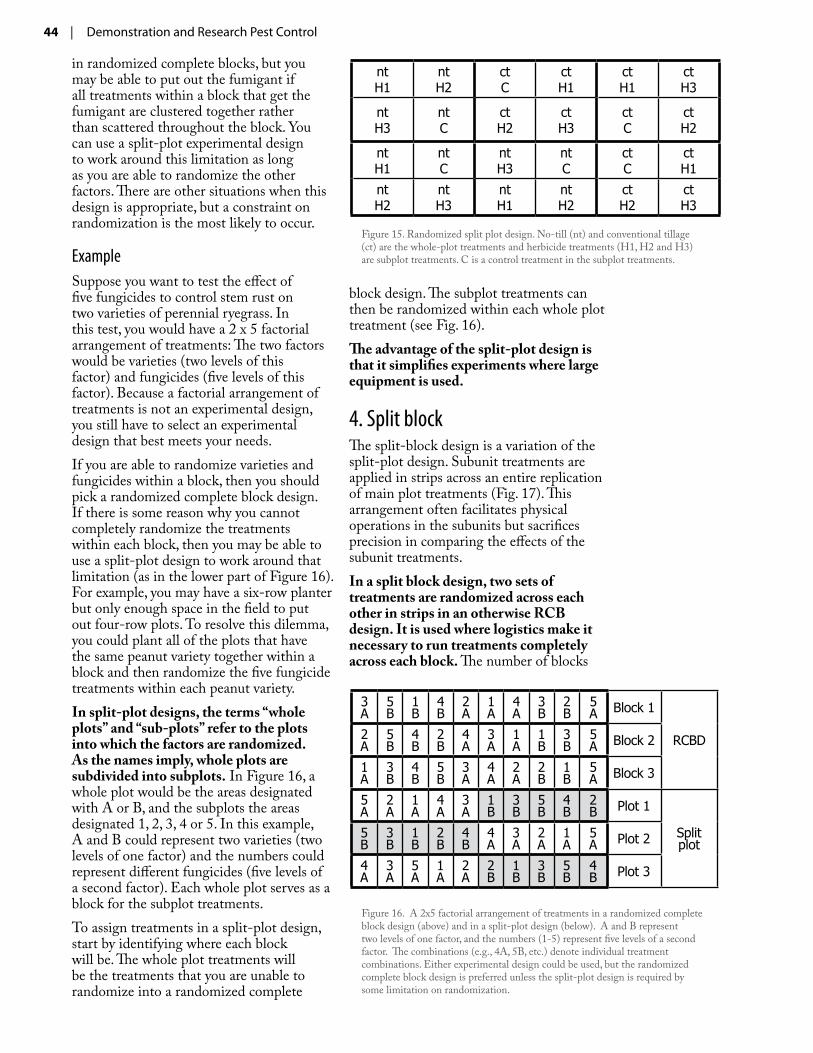
44 | Demonstration and Research Pest Control
in randomized complete blocks, but you may be able to put out the fumigant if all treatments within a block that get the fumigant are clustered together rather than scattered throughout the block. You can use a split-plot experimental design to work around this limitation as long as you are able to randomize the other factors. There are other situations when this design is appropriate, but a constraint on randomization is the most likely to occur.
ExampleSuppose you want to test the effect of five fungicides to control stem rust on two varieties of perennial ryegrass. In this test, you would have a 2 x 5 factorial arrangement of treatments: The two factors would be varieties (two levels of this factor) and fungicides (five levels of this factor). Because a factorial arrangement of treatments is not an experimental design, you still have to select an experimental design that best meets your needs.If you are able to randomize varieties and fungicides within a block, then you should pick a randomized complete block design. If there is some reason why you cannot completely randomize the treatments within each block, then you may be able to use a split-plot design to work around that limitation (as in the lower part of Figure 16). For example, you may have a six-row planter but only enough space in the field to put out four-row plots. To resolve this dilemma, you could plant all of the plots that have the same peanut variety together within a block and then randomize the five fungicide treatments within each peanut variety.In split-plot designs, the terms “whole plots” and “sub-plots” refer to the plots into which the factors are randomized. As the names imply, whole plots are subdivided into subplots. In Figure 16, a whole plot would be the areas designated with A or B, and the subplots the areas designated 1, 2, 3, 4 or 5. In this example, A and B could represent two varieties (two levels of one factor) and the numbers could represent different fungicides (five levels of a second factor). Each whole plot serves as a block for the subplot treatments.To assign treatments in a split-plot design, start by identifying where each block will be. The whole plot treatments will be the treatments that you are unable to randomize into a randomized complete
block design. The subplot treatments can then be randomized within each whole plot treatment (see Fig. 16).The advantage of the split-plot design is that it simplifies experiments where large equipment is used.
4. Split blockThe split-block design is a variation of the split-plot design. Subunit treatments are applied in strips across an entire replication of main plot treatments (Fig. 17). This arrangement often facilitates physical operations in the subunits but sacrifices precision in comparing the effects of the subunit treatments.In a split block design, two sets of treatments are randomized across each other in strips in an otherwise RCB design. It is used where logistics make it necessary to run treatments completely across each block. The number of blocks
3A
5B
1B
4B
2A
1A
4A
3B
2B
5A Block 1
RCBD2A
5B
4B
2B
4A
3A
1A
1B
3B
5A Block 2
1A
3B
4B
5B
3A
4A
2A
2B
1B
5A Block 3
5A
2A
1A
4A
3A
1B
3B
5B
4B
2B Plot 1
Split plot
5B
3B
1B
2B
4B
4A
3A
2A
1A
5A Plot 2
4A
3A
5A
1A
2A
2B
1B
3B
5B
4B Plot 3
Figure 16. A 2x5 factorial arrangement of treatments in a randomized complete block design (above) and in a split-plot design (below). A and B represent two levels of one factor, and the numbers (1-5) represent five levels of a second factor. The combinations (e.g., 4A, 5B, etc.) denote individual treatment combinations. Either experimental design could be used, but the randomized complete block design is preferred unless the split-plot design is required by some limitation on randomization.
Figure 15. Randomized split plot design. No-till (nt) and conventional tillage (ct) are the whole-plot treatments and herbicide treatments (H1, H2 and H3) are subplot treatments. C is a control treatment in the subplot treatments.
ntH1
ntH2
ctC
ctH1
ctH1
ctH3
ntH3
ntC
ctH2
ctH3
ctC
ctH2
ntH1
ntC
ntH3
ntC
ctC
ctH1
ntH2
ntH3
ntH1
ntH2
ctH2
ctH3
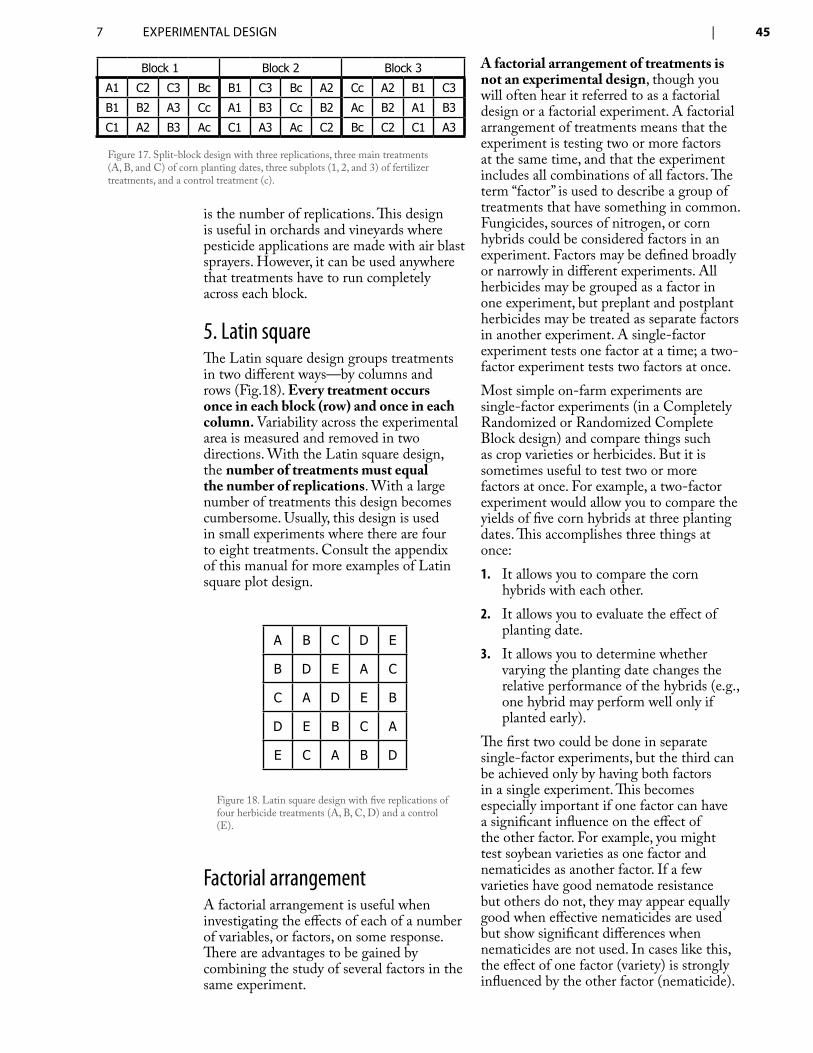
7 exPeRiMenTAl Design | 45
is the number of replications. This design is useful in orchards and vineyards where pesticide applications are made with air blast sprayers. However, it can be used anywhere that treatments have to run completely across each block.
5. Latin squareThe Latin square design groups treatments in two different ways—by columns and rows (Fig.18). Every treatment occurs once in each block (row) and once in each column. Variability across the experimental area is measured and removed in two directions. With the Latin square design, the number of treatments must equal the number of replications. With a large number of treatments this design becomes cumbersome. Usually, this design is used in small experiments where there are four to eight treatments. Consult the appendix of this manual for more examples of Latin square plot design.
Factorial arrangementA factorial arrangement is useful when investigating the effects of each of a number of variables, or factors, on some response. There are advantages to be gained by combining the study of several factors in the same experiment.
A factorial arrangement of treatments is not an experimental design, though you will often hear it referred to as a factorial design or a factorial experiment. A factorial arrangement of treatments means that the experiment is testing two or more factors at the same time, and that the experiment includes all combinations of all factors. The term “factor” is used to describe a group of treatments that have something in common. Fungicides, sources of nitrogen, or corn hybrids could be considered factors in an experiment. Factors may be defined broadly or narrowly in different experiments. All herbicides may be grouped as a factor in one experiment, but preplant and postplant herbicides may be treated as separate factors in another experiment. A single-factor experiment tests one factor at a time; a two-factor experiment tests two factors at once.Most simple on-farm experiments are single-factor experiments (in a Completely Randomized or Randomized Complete Block design) and compare things such as crop varieties or herbicides. But it is sometimes useful to test two or more factors at once. For example, a two-factor experiment would allow you to compare the yields of five corn hybrids at three planting dates. This accomplishes three things at once:
It allows you to compare the corn 1. hybrids with each other.It allows you to evaluate the effect of 2. planting date.It allows you to determine whether 3. varying the planting date changes the relative performance of the hybrids (e.g., one hybrid may perform well only if planted early).
The first two could be done in separate single-factor experiments, but the third can be achieved only by having both factors in a single experiment. This becomes especially important if one factor can have a significant influence on the effect of the other factor. For example, you might test soybean varieties as one factor and nematicides as another factor. If a few varieties have good nematode resistance but others do not, they may appear equally good when effective nematicides are used but show significant differences when nematicides are not used. In cases like this, the effect of one factor (variety) is strongly influenced by the other factor (nematicide).
Figure 18. Latin square design with five replications of four herbicide treatments (A, B, C, D) and a control (E).
A B C D E
B D E A C
C A D E B
D E B C A
E C A B D
Figure 17. Split-block design with three replications, three main treatments (A, B, and C) of corn planting dates, three subplots (1, 2, and 3) of fertilizer treatments, and a control treatment (c).
Block 1 Block 2 Block 3
A1 C2 C3 Bc B1 C3 Bc A2 Cc A2 B1 C3
B1 B2 A3 Cc A1 B3 Cc B2 Ac B2 A1 B3
C1 A2 B3 Ac C1 A3 Ac C2 Bc C2 C1 A3
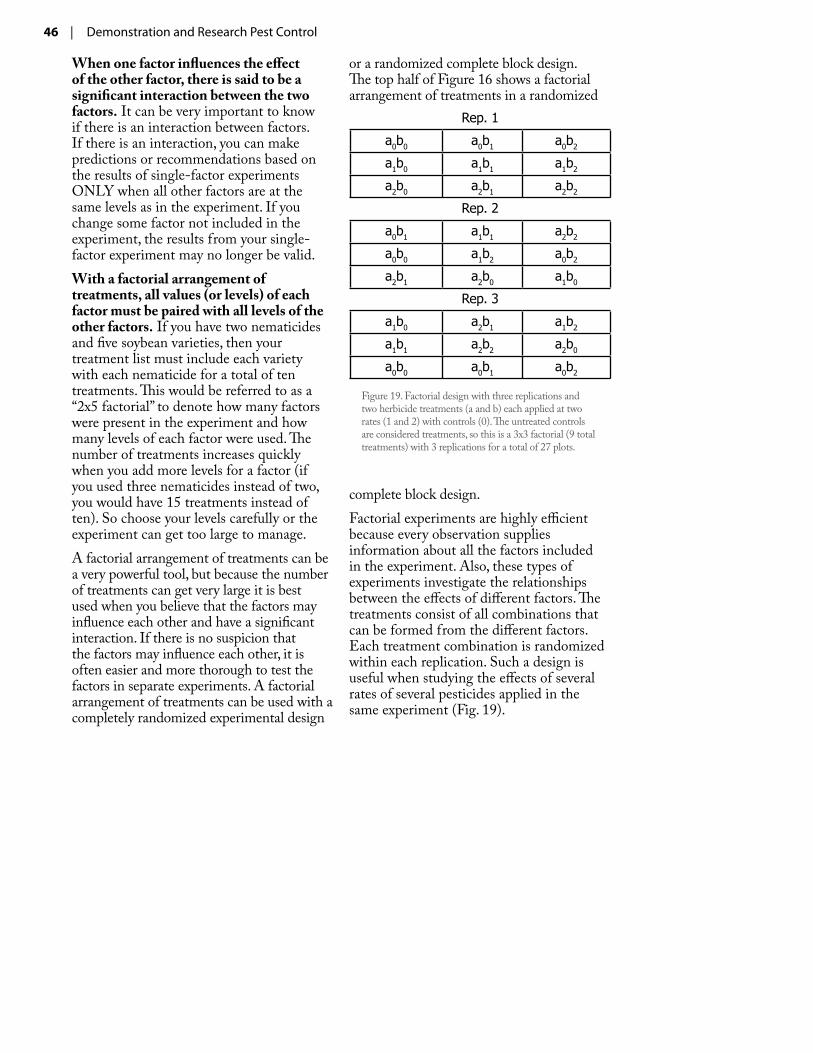
46 | Demonstration and Research Pest Control
When one factor influences the effect of the other factor, there is said to be a significant interaction between the two factors. It can be very important to know if there is an interaction between factors. If there is an interaction, you can make predictions or recommendations based on the results of single-factor experiments ONLY when all other factors are at the same levels as in the experiment. If you change some factor not included in the experiment, the results from your single-factor experiment may no longer be valid.With a factorial arrangement of treatments, all values (or levels) of each factor must be paired with all levels of the other factors. If you have two nematicides and five soybean varieties, then your treatment list must include each variety with each nematicide for a total of ten treatments. This would be referred to as a “2x5 factorial” to denote how many factors were present in the experiment and how many levels of each factor were used. The number of treatments increases quickly when you add more levels for a factor (if you used three nematicides instead of two, you would have 15 treatments instead of ten). So choose your levels carefully or the experiment can get too large to manage.A factorial arrangement of treatments can be a very powerful tool, but because the number of treatments can get very large it is best used when you believe that the factors may influence each other and have a significant interaction. If there is no suspicion that the factors may influence each other, it is often easier and more thorough to test the factors in separate experiments. A factorial arrangement of treatments can be used with a completely randomized experimental design
or a randomized complete block design. The top half of Figure 16 shows a factorial arrangement of treatments in a randomized
complete block design.Factorial experiments are highly efficient because every observation supplies information about all the factors included in the experiment. Also, these types of experiments investigate the relationships between the effects of different factors. The treatments consist of all combinations that can be formed from the different factors. Each treatment combination is randomized within each replication. Such a design is useful when studying the effects of several rates of several pesticides applied in the same experiment (Fig. 19).
Figure 19. Factorial design with three replications and two herbicide treatments (a and b) each applied at two rates (1 and 2) with controls (0). The untreated controls are considered treatments, so this is a 3x3 factorial (9 total treatments) with 3 replications for a total of 27 plots.
Rep. 1
a0b0 a0b1 a0b2
a1b0 a1b1 a1b2
a2b0 a2b1 a2b2
Rep. 2
a0b1 a1b1 a2b2
a0b0 a1b2 a0b2
a2b1 a2b0 a1b0
Rep. 3
a1b0 a2b1 a1b2
a1b1 a2b2 a2b0
a0b0 a0b1 a0b2
7 exPeRiMenTAl Design | 47
Summarizing experimental designThe following checklist can be used in designing an experiment. These items may be addressed in any order.Good experimental technique goes a long way toward minimizing error and bias. Every effort should be made to eliminate these problems through appropriate experimental designs. To help eliminate experimental error and bias:
Apply all treatments uniformly. ♦
Measure all treatment effects in an ♦unbiased way.Prevent gross errors. ♦
Control external influences so that all ♦treatments are affected equally.
Properly designing and implementing a field trial may seem complex the first time, but it is really a logical process that should not be intimidating. You may need help the first time you design a trial to ensure that you are not overlooking something important, but if you learn the principles involved in the process, you should quickly gain confidence in your ability to conduct experiments on your own.
Experimental design checklist3 Determine the objective of the
test.3 Select treatments that address
the objective. Consider including positive and negative controls.
3 Determine what data should be collected, and when it should be collected, to address the objective.
3 Select the number of replications to use. Consider four replications a minimum.
3 Determine how big individual plots will be.
3 Select an experimental design.3 Determine how blocks should
be arranged in the field.3 Randomize treatments within
blocks.

48 | Demonstration and Research Pest Control
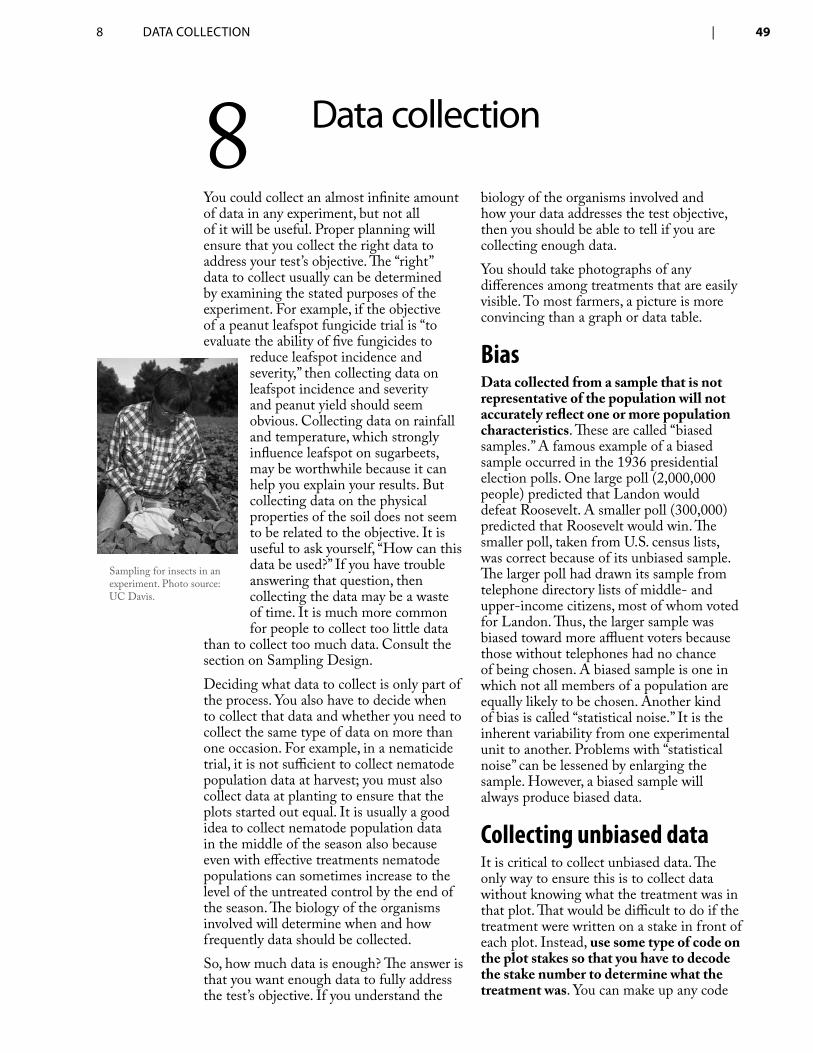
8 DATA ColleCTion | 49
You could collect an almost infinite amount of data in any experiment, but not all of it will be useful. Proper planning will ensure that you collect the right data to address your test’s objective. The “right” data to collect usually can be determined by examining the stated purposes of the experiment. For example, if the objective of a peanut leafspot fungicide trial is “to evaluate the ability of five fungicides to
reduce leafspot incidence and severity,” then collecting data on leafspot incidence and severity and peanut yield should seem obvious. Collecting data on rainfall and temperature, which strongly influence leafspot on sugarbeets, may be worthwhile because it can help you explain your results. But collecting data on the physical properties of the soil does not seem to be related to the objective. It is useful to ask yourself, “How can this data be used?” If you have trouble answering that question, then collecting the data may be a waste of time. It is much more common for people to collect too little data
than to collect too much data. Consult the section on Sampling Design.Deciding what data to collect is only part of the process. You also have to decide when to collect that data and whether you need to collect the same type of data on more than one occasion. For example, in a nematicide trial, it is not sufficient to collect nematode population data at harvest; you must also collect data at planting to ensure that the plots started out equal. It is usually a good idea to collect nematode population data in the middle of the season also because even with effective treatments nematode populations can sometimes increase to the level of the untreated control by the end of the season. The biology of the organisms involved will determine when and how frequently data should be collected.So, how much data is enough? The answer is that you want enough data to fully address the test’s objective. If you understand the
biology of the organisms involved and how your data addresses the test objective, then you should be able to tell if you are collecting enough data.You should take photographs of any differences among treatments that are easily visible. To most farmers, a picture is more convincing than a graph or data table.
BiasData collected from a sample that is not representative of the population will not accurately reflect one or more population characteristics. These are called “biased samples.” A famous example of a biased sample occurred in the 1936 presidential election polls. One large poll (2,000,000 people) predicted that Landon would defeat Roosevelt. A smaller poll (300,000) predicted that Roosevelt would win. The smaller poll, taken from U.S. census lists, was correct because of its unbiased sample. The larger poll had drawn its sample from telephone directory lists of middle- and upper-income citizens, most of whom voted for Landon. Thus, the larger sample was biased toward more affluent voters because those without telephones had no chance of being chosen. A biased sample is one in which not all members of a population are equally likely to be chosen. Another kind of bias is called “statistical noise.” It is the inherent variability from one experimental unit to another. Problems with “statistical noise” can be lessened by enlarging the sample. However, a biased sample will always produce biased data.
Collecting unbiased dataIt is critical to collect unbiased data. The only way to ensure this is to collect data without knowing what the treatment was in that plot. That would be difficult to do if the treatment were written on a stake in front of each plot. Instead, use some type of code on the plot stakes so that you have to decode the stake number to determine what the treatment was. You can make up any code
8 Data collection
Sampling for insects in an experiment. Photo source: UC Davis.
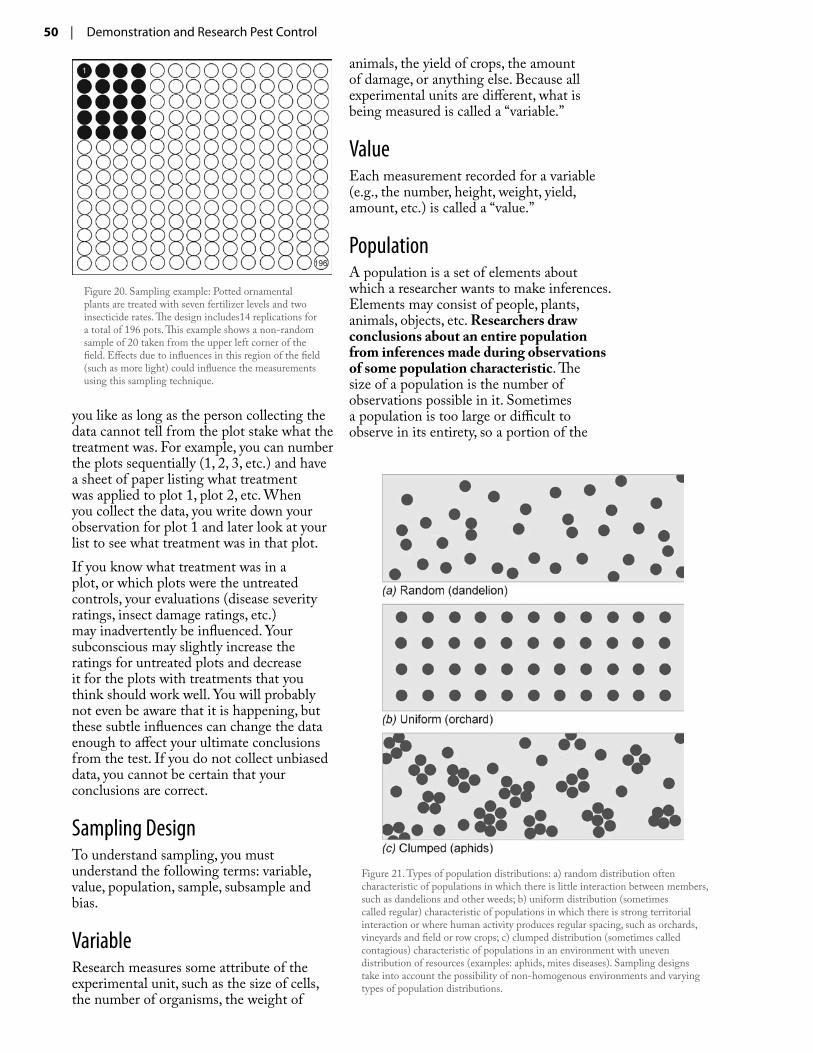
50 | Demonstration and Research Pest Control
you like as long as the person collecting the data cannot tell from the plot stake what the treatment was. For example, you can number the plots sequentially (1, 2, 3, etc.) and have a sheet of paper listing what treatment was applied to plot 1, plot 2, etc. When you collect the data, you write down your observation for plot 1 and later look at your list to see what treatment was in that plot.If you know what treatment was in a plot, or which plots were the untreated controls, your evaluations (disease severity ratings, insect damage ratings, etc.) may inadvertently be influenced. Your subconscious may slightly increase the ratings for untreated plots and decrease it for the plots with treatments that you think should work well. You will probably not even be aware that it is happening, but these subtle influences can change the data enough to affect your ultimate conclusions from the test. If you do not collect unbiased data, you cannot be certain that your conclusions are correct.
Sampling DesignTo understand sampling, you must understand the following terms: variable, value, population, sample, subsample and bias.
VariableResearch measures some attribute of the experimental unit, such as the size of cells, the number of organisms, the weight of
animals, the yield of crops, the amount of damage, or anything else. Because all experimental units are different, what is being measured is called a “variable.”
ValueEach measurement recorded for a variable (e.g., the number, height, weight, yield, amount, etc.) is called a “value.”
PopulationA population is a set of elements about which a researcher wants to make inferences. Elements may consist of people, plants, animals, objects, etc. Researchers draw conclusions about an entire population from inferences made during observations of some population characteristic. The size of a population is the number of observations possible in it. Sometimes a population is too large or difficult to observe in its entirety, so a portion of the
Figure 21. Types of population distributions: a) random distribution often characteristic of populations in which there is little interaction between members, such as dandelions and other weeds; b) uniform distribution (sometimes called regular) characteristic of populations in which there is strong territorial interaction or where human activity produces regular spacing, such as orchards, vineyards and field or row crops; c) clumped distribution (sometimes called contagious) characteristic of populations in an environment with uneven distribution of resources (examples: aphids, mites diseases). Sampling designs take into account the possibility of non-homogenous environments and varying types of population distributions.
Figure 20. Sampling example: Potted ornamental plants are treated with seven fertilizer levels and two insecticide rates. The design includes14 replications for a total of 196 pots. This example shows a non-random sample of 20 taken from the upper left corner of the field. Effects due to influences in this region of the field (such as more light) could influence the measurements using this sampling technique.
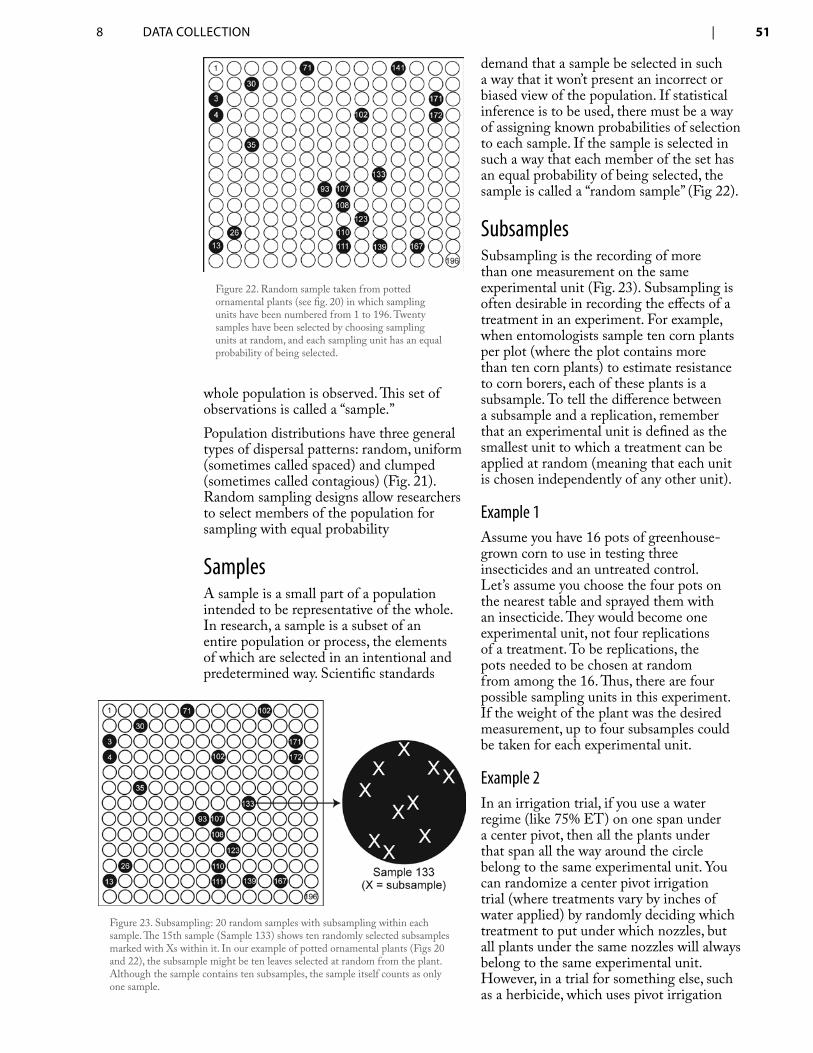
8 DATA ColleCTion | 51
whole population is observed. This set of observations is called a “sample.”Population distributions have three general types of dispersal patterns: random, uniform (sometimes called spaced) and clumped (sometimes called contagious) (Fig. 21). Random sampling designs allow researchers to select members of the population for sampling with equal probability
SamplesA sample is a small part of a population intended to be representative of the whole. In research, a sample is a subset of an entire population or process, the elements of which are selected in an intentional and predetermined way. Scientific standards
demand that a sample be selected in such a way that it won’t present an incorrect or biased view of the population. If statistical inference is to be used, there must be a way of assigning known probabilities of selection to each sample. If the sample is selected in such a way that each member of the set has an equal probability of being selected, the sample is called a “random sample” (Fig 22).
SubsamplesSubsampling is the recording of more than one measurement on the same experimental unit (Fig. 23). Subsampling is often desirable in recording the effects of a treatment in an experiment. For example, when entomologists sample ten corn plants per plot (where the plot contains more than ten corn plants) to estimate resistance to corn borers, each of these plants is a subsample. To tell the difference between a subsample and a replication, remember that an experimental unit is defined as the smallest unit to which a treatment can be applied at random (meaning that each unit is chosen independently of any other unit).
Example 1Assume you have 16 pots of greenhouse-grown corn to use in testing three insecticides and an untreated control. Let’s assume you choose the four pots on the nearest table and sprayed them with an insecticide. They would become one experimental unit, not four replications of a treatment. To be replications, the pots needed to be chosen at random from among the 16. Thus, there are four possible sampling units in this experiment. If the weight of the plant was the desired measurement, up to four subsamples could be taken for each experimental unit.
Example 2In an irrigation trial, if you use a water regime (like 75% ET) on one span under a center pivot, then all the plants under that span all the way around the circle belong to the same experimental unit. You can randomize a center pivot irrigation trial (where treatments vary by inches of water applied) by randomly deciding which treatment to put under which nozzles, but all plants under the same nozzles will always belong to the same experimental unit. However, in a trial for something else, such as a herbicide, which uses pivot irrigation
Figure 22. Random sample taken from potted ornamental plants (see fig. 20) in which sampling units have been numbered from 1 to 196. Twenty samples have been selected by choosing sampling units at random, and each sampling unit has an equal probability of being selected.
Figure 23. Subsampling: 20 random samples with subsampling within each sample. The 15th sample (Sample 133) shows ten randomly selected subsamples marked with Xs within it. In our example of potted ornamental plants (Figs 20 and 22), the subsample might be ten leaves selected at random from the plant. Although the sample contains ten subsamples, the sample itself counts as only one sample.
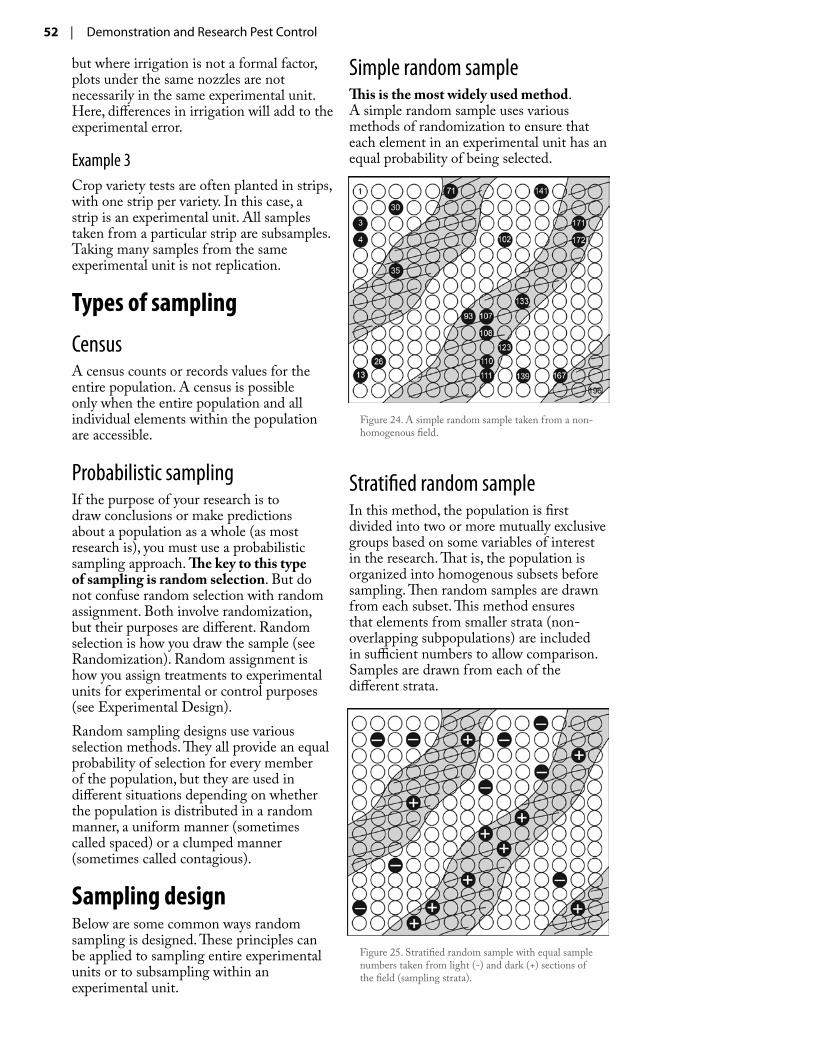
52 | Demonstration and Research Pest Control
but where irrigation is not a formal factor, plots under the same nozzles are not necessarily in the same experimental unit. Here, differences in irrigation will add to the experimental error.
Example 3Crop variety tests are often planted in strips, with one strip per variety. In this case, a strip is an experimental unit. All samples taken from a particular strip are subsamples. Taking many samples from the same experimental unit is not replication.
Types of sampling
CensusA census counts or records values for the entire population. A census is possible only when the entire population and all individual elements within the population are accessible.
Probabilistic samplingIf the purpose of your research is to draw conclusions or make predictions about a population as a whole (as most research is), you must use a probabilistic sampling approach. The key to this type of sampling is random selection. But do not confuse random selection with random assignment. Both involve randomization, but their purposes are different. Random selection is how you draw the sample (see Randomization). Random assignment is how you assign treatments to experimental units for experimental or control purposes (see Experimental Design).Random sampling designs use various selection methods. They all provide an equal probability of selection for every member of the population, but they are used in different situations depending on whether the population is distributed in a random manner, a uniform manner (sometimes called spaced) or a clumped manner (sometimes called contagious).
Sampling designBelow are some common ways random sampling is designed. These principles can be applied to sampling entire experimental units or to subsampling within an experimental unit.
Simple random sampleThis is the most widely used method. A simple random sample uses various methods of randomization to ensure that each element in an experimental unit has an equal probability of being selected.
Stratified random sampleIn this method, the population is first divided into two or more mutually exclusive groups based on some variables of interest in the research. That is, the population is organized into homogenous subsets before sampling. Then random samples are drawn from each subset. This method ensures that elements from smaller strata (non-overlapping subpopulations) are included in sufficient numbers to allow comparison. Samples are drawn from each of the different strata.
Figure 24. A simple random sample taken from a non-homogenous field.
Figure 25. Stratified random sample with equal sample numbers taken from light (-) and dark (+) sections of the field (sampling strata).
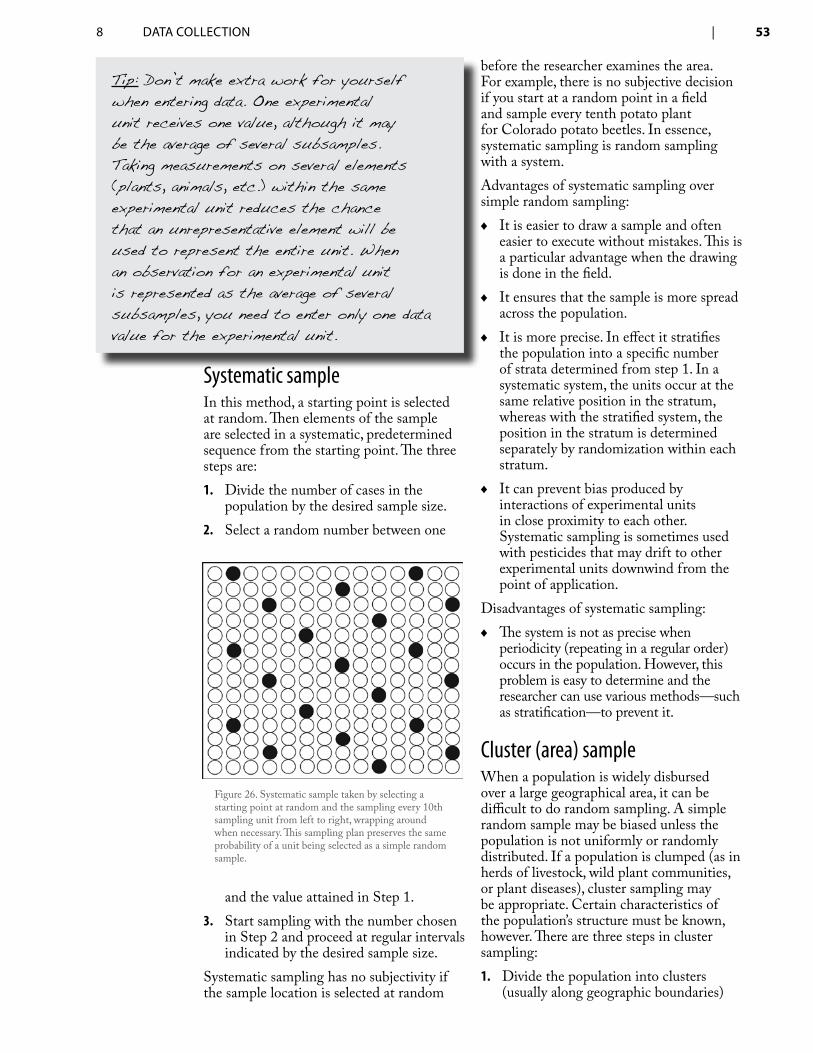
8 DATA ColleCTion | 53
Systematic sampleIn this method, a starting point is selected at random. Then elements of the sample are selected in a systematic, predetermined sequence from the starting point. The three steps are:
Divide the number of cases in the 1. population by the desired sample size.Select a random number between one 2.
and the value attained in Step 1.Start sampling with the number chosen 3. in Step 2 and proceed at regular intervals indicated by the desired sample size.
Systematic sampling has no subjectivity if the sample location is selected at random
before the researcher examines the area. For example, there is no subjective decision if you start at a random point in a field and sample every tenth potato plant for Colorado potato beetles. In essence, systematic sampling is random sampling with a system.Advantages of systematic sampling over simple random sampling:
It is easier to draw a sample and often ♦easier to execute without mistakes. This is a particular advantage when the drawing is done in the field.It ensures that the sample is more spread ♦across the population.It is more precise. In effect it stratifies ♦the population into a specific number of strata determined from step 1. In a systematic system, the units occur at the same relative position in the stratum, whereas with the stratified system, the position in the stratum is determined separately by randomization within each stratum.It can prevent bias produced by ♦interactions of experimental units in close proximity to each other. Systematic sampling is sometimes used with pesticides that may drift to other experimental units downwind from the point of application.
Disadvantages of systematic sampling:The system is not as precise when ♦periodicity (repeating in a regular order) occurs in the population. However, this problem is easy to determine and the researcher can use various methods—such as stratification—to prevent it.
Cluster (area) sampleWhen a population is widely disbursed over a large geographical area, it can be difficult to do random sampling. A simple random sample may be biased unless the population is not uniformly or randomly distributed. If a population is clumped (as in herds of livestock, wild plant communities, or plant diseases), cluster sampling may be appropriate. Certain characteristics of the population’s structure must be known, however. There are three steps in cluster sampling:
Divide the population into clusters 1. (usually along geographic boundaries)
Tip: Don’t make extra work for yourself when entering data. One experimental unit receives one value, although it may be the average of several subsamples. Taking measurements on several elements (plants, animals, etc.) within the same experimental unit reduces the chance that an unrepresentative element will be used to represent the entire unit. When an observation for an experimental unit is represented as the average of several subsamples, you need to enter only one data value for the experimental unit.
Figure 26. Systematic sample taken by selecting a starting point at random and the sampling every 10th sampling unit from left to right, wrapping around when necessary. This sampling plan preserves the same probability of a unit being selected as a simple random sample.
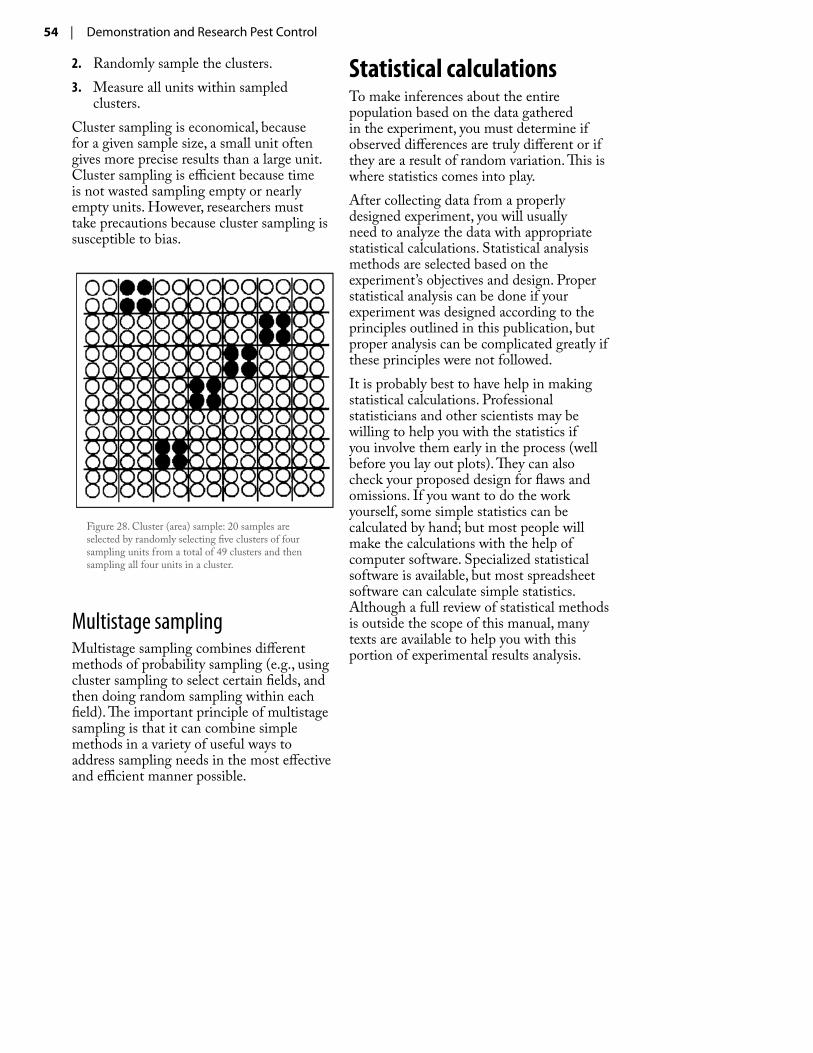
54 | Demonstration and Research Pest Control
Randomly sample the clusters.2.
Measure all units within sampled 3. clusters.
Cluster sampling is economical, because for a given sample size, a small unit often gives more precise results than a large unit. Cluster sampling is efficient because time is not wasted sampling empty or nearly empty units. However, researchers must take precautions because cluster sampling is susceptible to bias.
Multistage samplingMultistage sampling combines different methods of probability sampling (e.g., using cluster sampling to select certain fields, and then doing random sampling within each field). The important principle of multistage sampling is that it can combine simple methods in a variety of useful ways to address sampling needs in the most effective and efficient manner possible.
Statistical calculationsTo make inferences about the entire population based on the data gathered in the experiment, you must determine if observed differences are truly different or if they are a result of random variation. This is where statistics comes into play.After collecting data from a properly designed experiment, you will usually need to analyze the data with appropriate statistical calculations. Statistical analysis methods are selected based on the experiment’s objectives and design. Proper statistical analysis can be done if your experiment was designed according to the principles outlined in this publication, but proper analysis can be complicated greatly if these principles were not followed. It is probably best to have help in making statistical calculations. Professional statisticians and other scientists may be willing to help you with the statistics if you involve them early in the process (well before you lay out plots). They can also check your proposed design for flaws and omissions. If you want to do the work yourself, some simple statistics can be calculated by hand; but most people will make the calculations with the help of computer software. Specialized statistical software is available, but most spreadsheet software can calculate simple statistics. Although a full review of statistical methods is outside the scope of this manual, many texts are available to help you with this portion of experimental results analysis.
Figure 28. Cluster (area) sample: 20 samples are selected by randomly selecting five clusters of four sampling units from a total of 49 clusters and then sampling all four units in a cluster.
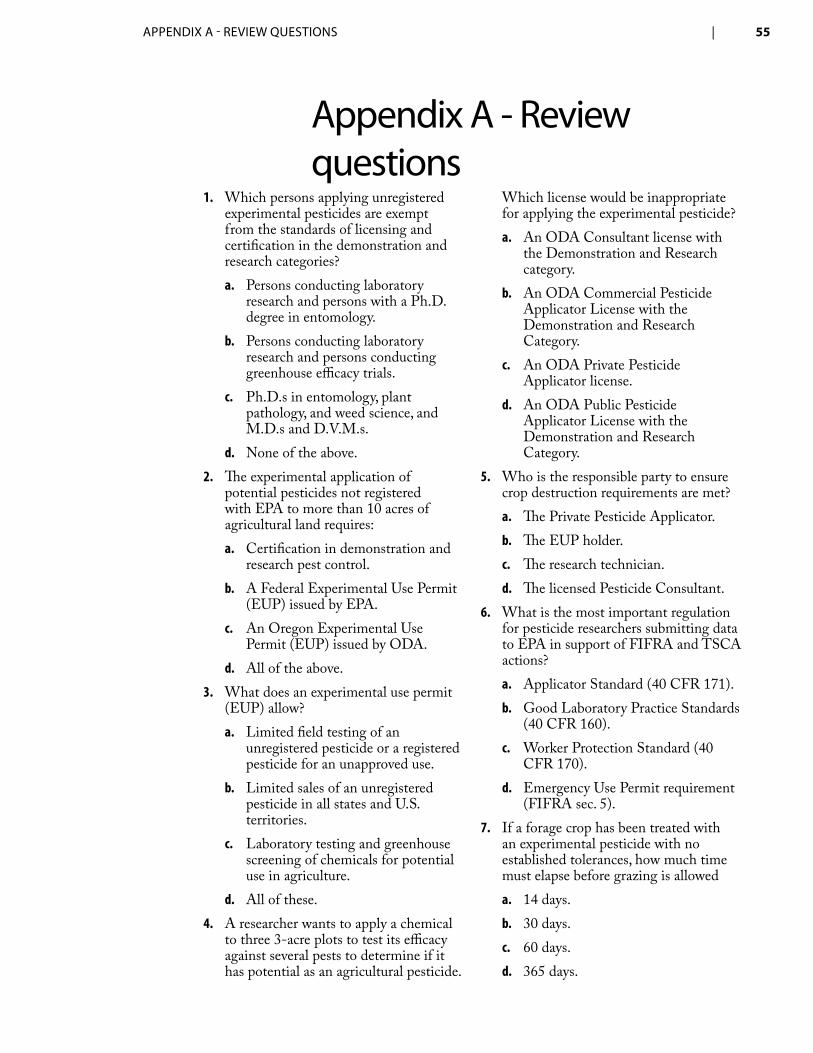
APPenDix A - Review quesTions | 55
Which persons applying unregistered 1. experimental pesticides are exempt from the standards of licensing and certification in the demonstration and research categories?
Persons conducting laboratory a. research and persons with a Ph.D. degree in entomology.Persons conducting laboratory b. research and persons conducting greenhouse efficacy trials.Ph.D.s in entomology, plant c. pathology, and weed science, and M.D.s and D.V.M.s.None of the above.d.
The experimental application of 2. potential pesticides not registered with EPA to more than 10 acres of agricultural land requires:
Certification in demonstration and a. research pest control.A Federal Experimental Use Permit b. (EUP) issued by EPA.An Oregon Experimental Use c. Permit (EUP) issued by ODA.All of the above.d.
What does an experimental use permit 3. (EUP) allow?
Limited field testing of an a. unregistered pesticide or a registered pesticide for an unapproved use.Limited sales of an unregistered b. pesticide in all states and U.S. territories.Laboratory testing and greenhouse c. screening of chemicals for potential use in agriculture.All of these.d.
A researcher wants to apply a chemical 4. to three 3-acre plots to test its efficacy against several pests to determine if it has potential as an agricultural pesticide.
Which license would be inappropriate for applying the experimental pesticide?
An ODA Consultant license with a. the Demonstration and Research category.An ODA Commercial Pesticide b. Applicator License with the Demonstration and Research Category.An ODA Private Pesticide c. Applicator license.An ODA Public Pesticide d. Applicator License with the Demonstration and Research Category.
Who is the responsible party to ensure 5. crop destruction requirements are met?
The Private Pesticide Applicator.a.
The EUP holder.b.
The research technician.c.
The licensed Pesticide Consultant.d.
What is the most important regulation 6. for pesticide researchers submitting data to EPA in support of FIFRA and TSCA actions?
Applicator Standard (40 CFR 171).a.
Good Laboratory Practice Standards b. (40 CFR 160).Worker Protection Standard (40 c. CFR 170).Emergency Use Permit requirement d. (FIFRA sec. 5).
If a forage crop has been treated with 7. an experimental pesticide with no established tolerances, how much time must elapse before grazing is allowed
14 days.a.
30 days.b.
60 days.c.
365 days.d.
Appendix A - Review questions
56 | Demonstration and Research Pest Control
When making a pesticide application under an 8. experimental use permit, the permit holder must notify ODA at least:
24 hours prior to application.a.
48 hours prior to application.b.
72 hours prior to application.c.
Notification is not required.d.
A demonstration differs from a research 9. experiment in that:
Demonstrations require an EUP.a.
Research experiments are not usually b. statistically valid. Demonstrations have only registered uses of c. registered products.Research experiments may only be conducted d. on OSU research farms.
To meet GLPS requirements under 40 CFR 10. 160.12, what must all pesticide studies submitted to EPA in support of FIFRA sec. 5 EUPs, sec. 3 registrations and 24(c) and sec. 18 uses include?
Statement of compliance or non-compliance.a.
Name of trial sponsor.b.
Name of state lead agency.c.
All of these.d.
What can result from failure to comply with 11. applicable GLPS?
Cancellation, suspension or modification of a. the research or marketing permit.Imposition of civil penalties under FIFRA b. section 14.Criminal prosecution under 18 U.S.C. 2 or c. 1001 or FIFRA section 14.All of these.d.
For purposes of GLPS compliance, the protocol 12. for a field trial of a pesticide requires which of the following?
Justification for selection of the test system.a.
A statement of the proposed statistical b. method to be used.A description of the experimental design, c. including methods for the control of bias.All of these.d.
For purposes of GLPS compliance, what do 13. changes in an approved protocol require?
Telephone call to an EPA regional office.a.
A study protocol can not be changed after it is b. approved.Re-submission of the protocol for approval.c.
Changes must be documented, signed by the d. study director, dated, and maintained with the protocol.
Where must specimen information be located, 14. such as date of collection, nature and test system, to satisfy GLPS compliance?
On the specimen container or accompanying a. the specimen.In the protocol.b.
In a secure file cabinet.c.
In confidential files.d.
To comply with GLPS, how must all data be 15. recorded except data recorded by automated data retrieval systems?
In ANSI data files.a.
In pencil.b.
In ink.c.
In ASCII text files.d.
If an item of erroneous data was recorded, what 16. must accompany the correction to comply with GLPS requirements?
Telephone call to an EPA regional office.a.
A permit to change data from EPA Office of b. Pesticides and Toxic Substances (OPTS).The reason for the change, date and signature c. of person making the change.Changes to data are not permitted under d. GLPS.
Which factor is NOT important in the ability of 17. a pesticide to be effective?
Penetration.a.
Transport.b.
Mode of action.c.
Molecular weight.d.
APPenDix A - Review quesTions | 57
The conversion of 2,4-DB to 2,4-D by beta-18. oxidation in plants is an example of __________.
Metabolic deactivation.a.
Mode of action.b.
Metabolic activation.c.
Biological magnification.d.
Eggshell thinning of predatory birds induced by 19. DDT is an example of ___________.
Metabolism.a.
Activation.b.
Biodegradation.c.
Biological magnification.d.
Your goal is to apply 30 gallons per acre using a 20. CO2 backpack sprayer with a 4-nozzle boom and 20-inch nozzle spacing. Your measured walking speed with the tank half full is 3 miles per hour. How many milliliters should be collected in 30 seconds? (See formula on page 7.)
154.0 ml.a.
271.5 ml.b.
573.5 ml.c.
1,147.0 ml.d.
Questions 21-30 (experimental design)Researchers want to use a completely randomized design (CRD) to compare three different larvicide treatments formulated in a free-choice mineral mix to be fed to feeder calves to control flies. The larvicides are S-methoprene (Altosid®), tetrachlorvinphos (Rabon Oral Larvicide® = ROL®), and diflubenzuron (Vigilante®). This necessitates four treatments, which are labeled treatment A (Altosid®), treatment B (ROL®), treatment C (Vigilante®), and treatment D (untreated control). The researchers will measure the treatment effects by periodically counting the number of flies on each calf. They will compare the effect of each treatment to the others and to the untreated control. They have 16 calves available for the experiment, so four calves will receive each treatment. The 16 calves arrive and are placed in a large holding compound until they are ready for the experiment. Because flies readily switch from one animal to another, the calves will be transferred to pens at the time of treatment.
The researchers assume that calves will be 21. caught “at random.” They enter the compound, catch four calves, and assign them to treatment A. They catch the next four calves and assign them to treatment B. They follow this process through treatments C and D. Because the calves were caught at random, the researchers assume that this constitutes a CRD and they analyze the results accordingly. Which of the following statements best characterizes the nature of this experiment?
The experiment has inadequate replication.a.
The experiment has inadequate b. randomization.The experiment is a CRD with serious bias.c.
The experiment is a RCB not a CRD.d.
The researchers catch all the calves and label 22. them 1 to 16. Using a random number table, they select four pens at random to receive the calves to which treatments will be assigned. Then, using a random number table, they select numbers corresponding to each numbered calf to receive the first treatment. They place these calves in the appropriate pen to receive treatment A. Then they select another four calf numbers at random and put them in the corresponding pen to receive treatment B. They continue until they have four pens with four calves each. Each pen receives a different treatment, and the experiment is analyzed as a completely randomized experiment. Which of the following statements best characterizes the nature of this experiment?
The experiment has inadequate replication.a.
The experiment has inadequate b. randomization.The experiment is a CRD with serious bias.c.
The experiment is a RCB not a CRD.d.
58 | Demonstration and Research Pest Control
From the following experimental designs, select 23. the best design for a CRD for the 16 calves to test the effects of free-choice oral larvicide mineral mixes for fly control. The design should take into account both the variability in calves and the placement of pens.
Number calves and pens from 1 to 16. Use a. a random number table to assign a number to each calf, which corresponds to a pen number. Use a random number table to assign treatment A to the first four randomly selected calves. Repeat this procedure without replacement until all calves have received a treatment. Place oral larvicides in mineral feeders in each pen according to the treatment number assigned to calves. Then introduce calves according to pen number. Periodically record the number of flies per animal.Number pens 1 to 16, but do not number b. calves. Put 16 slips of paper in a hat, each numbered 1 to 16. In a second hat, put 16 slips of paper, four each of which have been labeled with one of the four treatments. Catch a calf and assign a pen and treatment at random by drawing one slip from the first hat and one slip from the second hat. Repeat without replacement until all calves have received a pen and a treatment. Periodically record the number of flies per animal.Place slips of paper in a hat with the letters c. A, B, C and D printed on four slips each. Catch the first calf, pick a slip at random from the hat, and assign the calf to the treatment letter on the slip. Do not replace the slip. Catch a second calf and select another slip from the remaining three slips. Assign that treatment to the second calf. Continue until the first four calves have receive one of the four treatments. Then replace the slips and repeat the process until all 16 calves have a treatment. Periodically record the number of flies per animal.Number calves from 1 to 16, but do not d. number pens. Use a random number table to select the first four calves at random for the first treatment. Place these calves in a pen with treatment A. Repeat this procedure until all calves have been caught and placed in a pen for treatments B through D. Periodically record the number of flies per animal.
What is an advantage of an RCB over a CRD 24. experimental design?
Permits testing of equality between treatments a. by comparing sample variations.Permits the analysis of unbalanced data b. (unequal replicates or samples).Permits detection of treatment differences in c. the presence of a single extraneous source of variability.Permits detection of differences between d. treatments without replication.
What is the value of randomization in an 25. experimental design?
It averages out the effect of all unknown, a. uncontrollable factors in all treatment groups.It makes the experiment powerful enough to b. detect treatment effects in all groups.It removes the influence of all unknown, c. uncontrollable factors in all treatment groups.It permits comparisons between all treatment d. groups.
Under what condition or conditions would 26. Completely Randomized Designs (CRD) be better than Randomized Complete Block (RCB) designs?
Data is from more than one field or more a. than one farm.Data is from field and row crop studies rather b. than livestock feeding studies.Data is unbalanced (replications or sample c. numbers differ between treatment groups).Data is balanced (replications or sample d. numbers are equal in all treatment groups).
Four different insecticides are to be evaluated 27. for their control of plant bugs in cotton. The data might differ from one location in a field to another because plant bug population distributions are highly clumped. Other factors such as soil, irrigation and fertility are comparatively homogenous. Which experimental design would be most appropriate?
Latin square.a.
CRD.b.
Split plot.c.
RCB.d.
APPenDix A - Review quesTions | 59
Four different dosage rates of a plant growth 28. regulator are to be evaluated on Pima and upland cotton. The effect will be measured in pounds of lint from each treatment. Which experimental design is most appropriate?
RCB.a.
Latin squares.b.
CRD.c.
Split plot.d.
Potential phytotoxicity of eight different 29. concentrations of lime-sulfur orchard spray is evaluated on eight blocks of trees containing eight different varieties. Each variety must receive applications of all eight concentrations of chemical. Experimenters want to control for variability from varieties and for variability from the location within the orchard of a particular treatment within a variety. Which experimental design is most appropriate?
Split plot.a.
CRD.b.
Latin square.c.
RCB.d.
Researchers want to evaluate two herbicide 30. treatments (A and B), each applied at a high and low rate (1 and 2) to be compared with untreated controls (0). Which experimental design is most appropriate?
RCB.a.
Factorial.b.
Latin square.c.
Split plot.d.

60 | Demonstration and Research Pest Control
APPenDix b - AnsweRs To Review quesTions | 61
d1.
d2.
a3.
c4.
b5.
b6.
d7.
c8.
c9.
a10.
d11.
d12.
d 13.
a14.
c15.
c16.
d17.
c18.
d19.
d20.
b 21. The experiment has inadequate randomization. The first calves caught could be the slowest, weakest, least physically active, least able to escape capture, and possibly least inclined to use physical activity to avoid annoyance by flies. This would bias the results. If the experimental results came out to the disadvantage of treatment A, there would be no way to determine if the results were a consequence of treatment A or the fact that the weakest calves were placed on that treatment by the selection process.a 22. The experiment is a seriously flawed CRD. It completely lacks replication. There are 16 calves, but the calves in
each pen are not independent. One calf consuming a lot of the larvicidal formulation may achieve fly control, while others in that pen eating less may not get as much fly control. There is no way to separate the effect of the high larvicide consumption rate from the lower levels of control in calves eating less. The experimental unit is the smallest unit of experimental matter to which the treatment is applied at random. In this case, the pens are the experimental units. For a CRD, each calf must have its own pen.b 23. For a CRD, label the pens 1 through 16. Do not number calves. Place 16 slips of paper numbered from 1 to 16 in a hat. In a second hat, place 16 slips of paper corresponding to treatments, four each labeled A, B, C and D. Catch a calf. Select a number and a letter from each hat. Place the calf in the location indicated by the number and feed it the treatment assigned by the letter. Repeat without replacement until all calves have been assigned a treatment and pen.c 24. It permits detection of treatment differences in the presence of a single extraneous source of variability. The RCB design improves precision (relative to CRD) by enabling the experimenter to detect and control a single extraneous, non-random source of variation between and among experimental units and to remove its effect from the estimate of experimental error. This increases scope of inference and allows the experimenter to make broader conclusions.a 25. It averages out the effects of all unknown, uncontrollable factors in all treatment groups. Randomization is used to control random variability among individual experimental units.c 26. Data is unbalanced (replications or sample numbers differ between
Appendix b - Answers to review questions
62 | Demonstration and Research Pest Control
treatment groups). The advantages of the completely randomized design are that it is flexible and simple. It is the only design that permits the analysis of unbalanced data, which consists of unequal numbers of replications or samples between treatment groups. This is particularly advantageous when weather or other factors destroy one or more of the replications in the experiment.d 27. When a single source of natural variability exists within an otherwise homogenous field, in this case the clumped distribution of plant bugs, a randomized complete block (RCB) design is most appropriate.d 28. A split plot design is most appropriate when experiments evaluate both pesticide performance and crop management practices (in this case two different species of cotton that may react differently to varying treatment rates of a plant growth regulator), because it controls for the variability between Pima and upland cotton. It also is applicable in the performance of different cotton varieties.c 29. A Latin square design is most appropriate when evaluating the effects of different treatment rates of the same pesticide on an equal number of experimental units. It is very useful in controlling experimental error from two sources, in this case tree varieties and their treatment location within the orchard. It groups treatments in two different ways—by columns and rows (Fig. 17). Every treatment occurs once in each block (row = tree variety) and once in each column (treatment rate). Variability across the experimental area is measured and removed in two directions. With the Latin square design, the number of treatments must equal the number of replications. With a large number of treatments this design becomes cumbersome. Usually, this design is used for experiments where there are four to eight treatments.b 30. A factorial design is most appropriate when investigating the effects and possible interaction of each of a number
of variables, or factors, on some response. There are advantages to combining the study of several factors in the same factorial experiment. The treatments consist of all combinations that can be formed from the different factors. Each treatment combination is randomized within each replication. Such a design is useful when studying the effects of several rates of several pesticides applied in the same experiment.
APPenDix C - glossARy | 63
Acetolactate synthase (ALS) inhibitorsGroup of herbicides that inhibit an enzyme that is required in the process of forming several essential plant amino acids.
AcetylcholineAn enzyme that transmits nerve signals between nerves and muscles, sensory organs, or other nerves.
Amino acidsBasic building blocks of proteins in plants and animals.
AntagonismReduced toxicity or effectiveness as a result of combining one pesticide with another. Antidote. Substance that detoxifies the effects of a particular pesticide.
BiodegradationThe decomposition of pesticide residues in the environment by bacteria and other microorganisms that use the residues as nutrient sources.
Biological magnificationThe tendency of certain pesticides to become progressively more concentrated in each type of organism when moving from the bottom to the top organism in a food chain.
CalibrationThe process of measuring the output of pesticide application equipment so that the proper amount of pesticide can be applied to a given area.
Chloroacetamide herbicideFamily of herbicides, including acetochlor, alachlor, metolachlor and propachlor; they are most commonly soil-applied and inhibit emerging roots and shoots.
ChloroplastOrganelles present in large numbers within plant cells; they contain protein, lipids and pigments.
CholinesteraseThe enzyme that destroys acetylcholine.
Colloidal fractionThat portion of a soil consisting of clay and organic matter, in which most of the surface reactions take place.
Dithiocarbamate fungicideGroup of sulfur-containing, broad-spectrum, synthetic organic contact fungicides used to prevent many fungal diseases.
EnzymeProteins, formed in plant and animal cells or made synthetically, that act as organic catalysts in initiating or speeding up specific chemical reactions.
FumigantLiquid or solid chemical that forms a gas and kills organisms.
FungicideA pesticide used to prevent, repel or mitigate fungal infections.
Growth regulatorA hormonal chemical that changes the growth of a plant or animal.
HerbicideA pesticide used to prevent or destroy plants that grow where they are not wanted.
InsecticideA pesticide used to prevent, destroy, repel, mitigate or attract insects and their relatives.
Appendix C - glossary
64 | Demonstration and Research Pest Control
IonizationProcess in which a chemical takes on a positive or negative electrical charge because of losing or gaining electrons through a chemical reaction.
MetabolismThe total chemical process that takes place in a living organism to utilize food and manage wastes, grow and reproduce, and accomplish all other life functions.
MetaboliteA substance produced in a living organism through metabolism.
Mode of actionThe mechanism(s) by which pesticides injure or kill pests.
NematicideA pesticide used to prevent, repel, destroy or mitigate the effects of nematodes.
Organic matterPortion of soil containing carbon and hydrogen.
Organochlorine compoundA class of pesticides, commonly used as insecticides, that contain a chlorine atom incorporated into an organic molecule. Organochlorines are often highly persistent.
Organophosphate (OP)A commonly used class of pesticides containing various esters of phosphoric and related acids, which break down rapidly in the environment.
PermeabilityReferring to a surface or membrane that is porous, allowing certain substances to pass through.
PesticideA chemical or mixture of chemicals used to destroy, prevent, repel or attract any animal, plant, or disease considered a pest.
Photosynthesis
The biological production of organic substances, chiefly sugars, in green plant cells in the presence of light.
PhytotoxicityAn effect that is injurious or lethal to plants.
Postemergence herbicideA herbicide applied after emergence of the specified weed or crop.
Pre-emergence herbicideA herbicide applied to the soil before emergence of the specified weed or crop.
ResistanceGenetic qualities of some individuals in a pest population that enable them to resist the effects of certain types of pesticides that are toxic to other members of that species.
Restricted-use pesticideA pesticide that can be sold only to or applied only by individuals licensed as commercial or private applicators, or persons under their direct supervision.
SelectivityThe ability of a pesticide to kill some pests but not others.
Soil textureRelative content percentages of clay, sand and silt in any given soil.
SynergismThe action of two pesticides that produces a greater cumulative effect when the pesticides are used together than when they are used individually.
Systemic herbicideA herbicide that is absorbed by treated plants and translocated to other tissues by the vascular system.
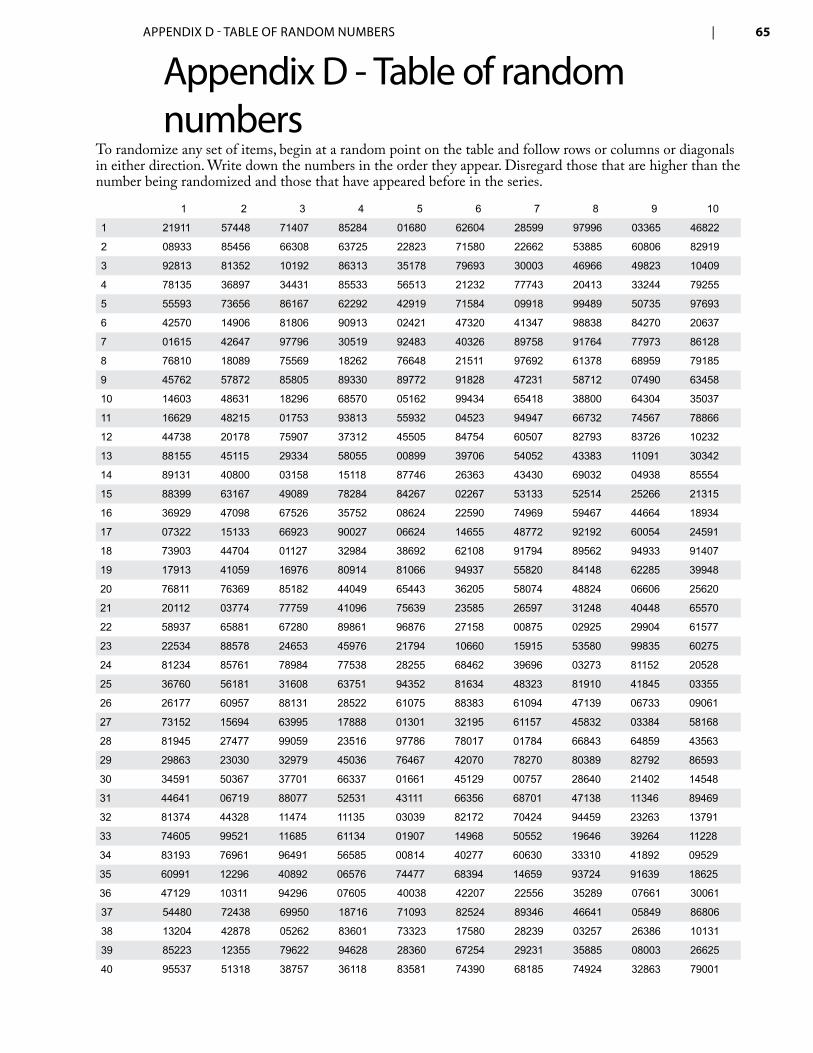
APPenDix D - TAble of RAnDoM nuMbeRs | 65
To randomize any set of items, begin at a random point on the table and follow rows or columns or diagonals in either direction. Write down the numbers in the order they appear. Disregard those that are higher than the number being randomized and those that have appeared before in the series.
1 2 3 4 5 6 7 8 9 10
1 21911 57448 71407 85284 01680 62604 28599 97996 03365 46822
2 08933 85456 66308 63725 22823 71580 22662 53885 60806 82919
3 92813 81352 10192 86313 35178 79693 30003 46966 49823 10409
4 78135 36897 34431 85533 56513 21232 77743 20413 33244 79255
5 55593 73656 86167 62292 42919 71584 09918 99489 50735 97693
6 42570 14906 81806 90913 02421 47320 41347 98838 84270 20637
7 01615 42647 97796 30519 92483 40326 89758 91764 77973 86128
8 76810 18089 75569 18262 76648 21511 97692 61378 68959 79185
9 45762 57872 85805 89330 89772 91828 47231 58712 07490 63458
10 14603 48631 18296 68570 05162 99434 65418 38800 64304 35037
11 16629 48215 01753 93813 55932 04523 94947 66732 74567 78866
12 44738 20178 75907 37312 45505 84754 60507 82793 83726 10232
13 88155 45115 29334 58055 00899 39706 54052 43383 11091 30342
14 89131 40800 03158 15118 87746 26363 43430 69032 04938 85554
15 88399 63167 49089 78284 84267 02267 53133 52514 25266 21315
16 36929 47098 67526 35752 08624 22590 74969 59467 44664 18934
17 07322 15133 66923 90027 06624 14655 48772 92192 60054 24591
18 73903 44704 01127 32984 38692 62108 91794 89562 94933 91407
19 17913 41059 16976 80914 81066 94937 55820 84148 62285 39948
20 76811 76369 85182 44049 65443 36205 58074 48824 06606 25620
21 20112 03774 77759 41096 75639 23585 26597 31248 40448 65570
22 58937 65881 67280 89861 96876 27158 00875 02925 29904 61577
23 22534 88578 24653 45976 21794 10660 15915 53580 99835 60275
24 81234 85761 78984 77538 28255 68462 39696 03273 81152 20528
25 36760 56181 31608 63751 94352 81634 48323 81910 41845 03355
26 26177 60957 88131 28522 61075 88383 61094 47139 06733 09061
27 73152 15694 63995 17888 01301 32195 61157 45832 03384 58168
28 81945 27477 99059 23516 97786 78017 01784 66843 64859 43563
29 29863 23030 32979 45036 76467 42070 78270 80389 82792 86593
30 34591 50367 37701 66337 01661 45129 00757 28640 21402 14548
31 44641 06719 88077 52531 43111 66356 68701 47138 11346 89469
32 81374 44328 11474 11135 03039 82172 70424 94459 23263 13791
33 74605 99521 11685 61134 01907 14968 50552 19646 39264 11228
34 83193 76961 96491 56585 00814 40277 60630 33310 41892 09529
35 60991 12296 40892 06576 74477 68394 14659 93724 91639 18625
36 47129 10311 94296 07605 40038 42207 22556 35289 07661 30061
37 54480 72438 69950 18716 71093 82524 89346 46641 05849 86806
38 13204 42878 05262 83601 73323 17580 28239 03257 26386 10131
39 85223 12355 79622 94628 28360 67254 29231 35885 08003 26625
40 95537 51318 38757 36118 83581 74390 68185 74924 32863 79001
Appendix D - Table of random numbers

66 | Demonstration and Research Pest Control
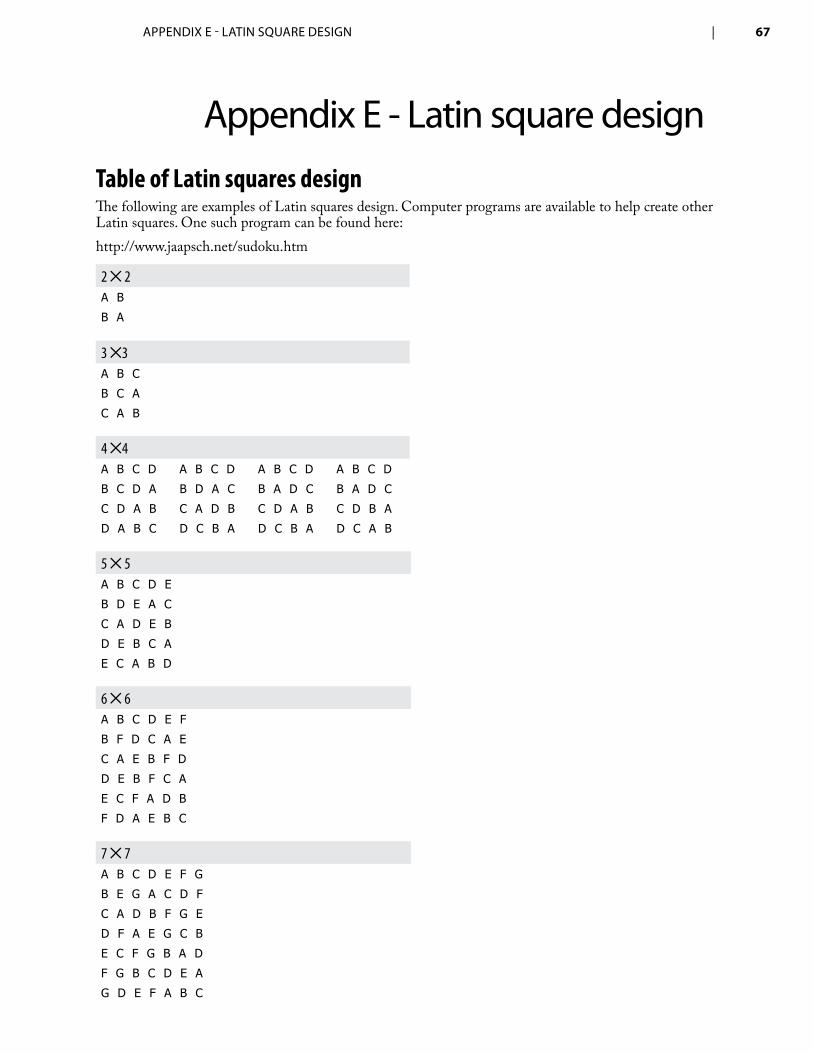
APPenDix e - lATin squARe Design | 67
Table of Latin squares designThe following are examples of Latin squares design. Computer programs are available to help create other Latin squares. One such program can be found here: http://www.jaapsch.net/sudoku.htm
2 5 2A B
B A
3 53A B C
B C A
C A B
4 54A B C D A B C D A B C D A B C D
B C D A B D A C B A D C B A D C
C D A B C A D B C D A B C D B A
D A B C D C B A D C B A D C A B
5 5 5A B C D E
B D E A C
C A D E B
D E B C A
E C A B D
6 5 6A B C D E F
B F D C A E
C A E B F D
D E B F C A
E C F A D B
F D A E B C
7 5 7 A B C D E F G
B E G A C D F
C A D B F G E
D F A E G C B
E C F G B A D
F G B C D E A
G D E F A B C
Appendix e - latin square design

68 | Demonstration and Research Pest Control
85 8A B C D E F G H
B D A H G C E F
C E G F A B H D
D A B C H G F E
E C H A F D B G
F G D E B H A C
G H F B C E D A
H F E G D A C B
95 9A B C D E F G H I
B H F E C A I D G
C A H I D B E G F
D I B C G E A F H
E C I F B G H A D
F G E A H I D B C
G D A B I H F C E
H E D G F C B I A
I F G H A D C E B
10 510A B C D E F G H I J
B F J I A C E D G H
C A G E D J I B H F
D H I A C E B J F G
E C A F J G H I B D
F D E B G H A C J I
G J D C H I F A E B
H I B G F A J E D C
I G H J B D C F A E
J E F H I B D G C A

APPenDix f - PesTiCiDe ConTACTs
Pesticide emergency information
Oregon Poison Control Center 1-800-222-1222The Oregon Poison Control Center provides emergency treatment information for cases of poisonings or toxic exposures. Access to this health care advice is available to both the public and health care providers in the state. This is a 24-hour toll-free resource that provides access to a network of nurses, pharmacists, paramedics and physicians who have extensive education, training and expertise in the field of toxicology. The Poison Control Center also provides public education activities for teachers, students and citizens, as well as educational opportunities for Oregon health care providers.
Oregon Emergency Response Center 1-800-452-0311OERS was established in 1972 by the Governor of Oregon to improve communications and coordination between government agencies responding to hazardous materials incidents (including pesticides) across the state.Since that time OERS has become an “all-hazards” system, responding to other types of emergencies: Natural Hazards such as floods, wildfire and earthquakes and Search and Rescue missions. OERS operates under Oregon Revised Statutes (ORS) 401, Executive Order of the Governor and Oregon Administrative Rules Chapter 104, Division 40.
National Pesticide Safety Team Network (Chemtrec) 1-800-424-9300The National Agricultural Chemicals Association has a telephone network. This network can tell the applicator the correct contamination procedures to use to send a local safety team to clean up a spill. An applicator can call the network toll free at any time.
The National Pesticide Information Center (NPIC) 1-800-858-7378The National Pesticide Information Center (NPIC) can provide information about pesticide products and their toxicity.
U.S. Environmental Protection Agency (EPA), Region VI Spill Reporting 1-800-832-8224All major pesticide spills must by law be reported immediately to the U.S. Environmental Protection Agency, Region 10 Office, 1200 Sixth Ave Suite 900, Seattle, WA, by calling 1-800-424-4EPA or 206-253-1250. EPA Region 10 emergency response to chemical spills may be accessed 24 hours a day at the Region VI Emergency Response Center: 1-866-EPASPILL (866-372-7745). The following information should be reported:
Name, address and telephone number of person 1. reportingExact location of spill2.
Name of company involved and location3.
Specific pesticide spilled4.
Estimated quantity of pesticide spilled5.
Source of spill6.
Cause of spill7.
Name of body of water involved, or nearest body 8. of water to the spill areaAction taken for containment and cleanup9.
Appendix f - Pesticide contacts