Embed Size (px)
Citation preview
Head Start and Early Head Start: Structure, Demographics, Services and Outcomes
Lauren H. Supplee, Ph.D.Office of Planning, Research and
EvaluationAdministration for Children and Families
Why context matters…
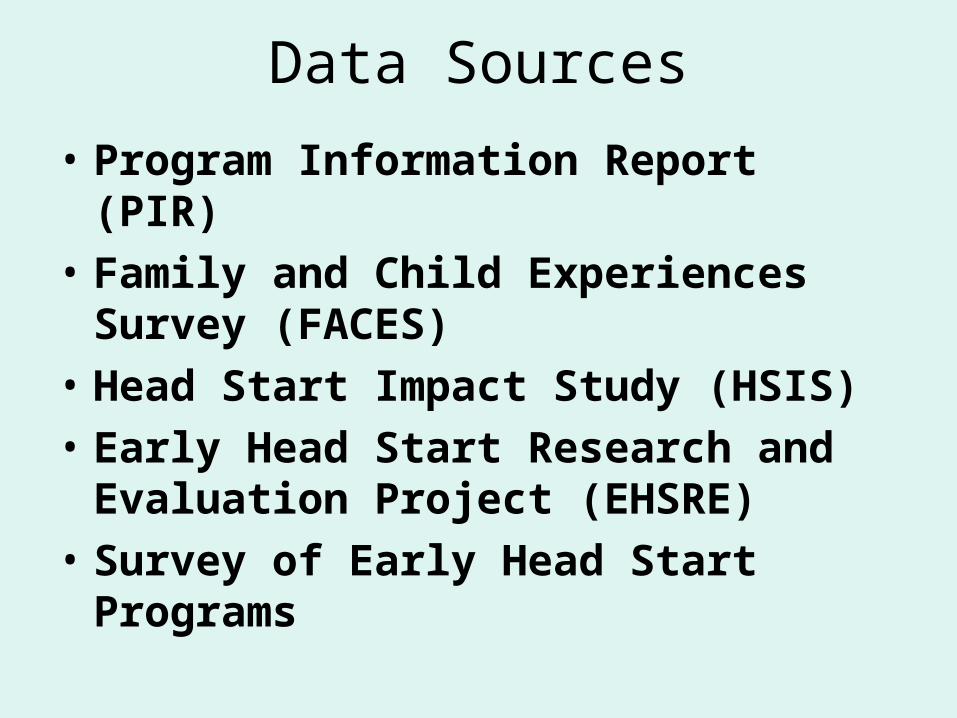
Data Sources
• Program Information Report (PIR)
• Family and Child Experiences Survey (FACES)
• Head Start Impact Study (HSIS)
• Early Head Start Research and Evaluation Project (EHSRE)
• Survey of Early Head Start Programs
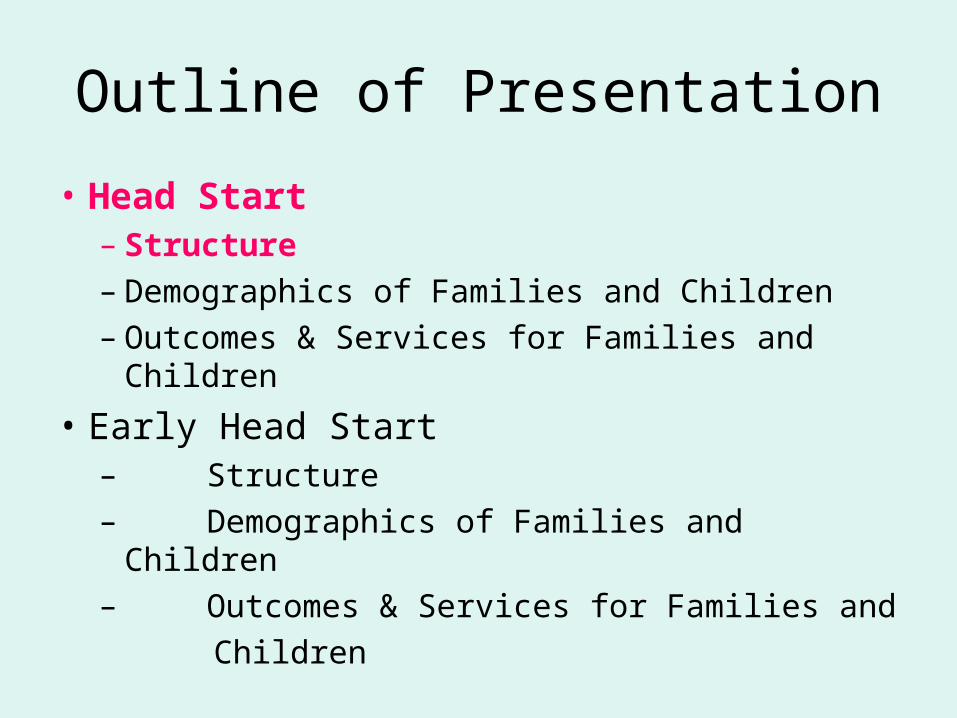
Outline of Presentation
• Head Start– Structure– Demographics of Families and Children– Outcomes & Services for Families and
Children
• Early Head Start– Structure– Demographics of Families and Children– Outcomes & Services for Families and
Children
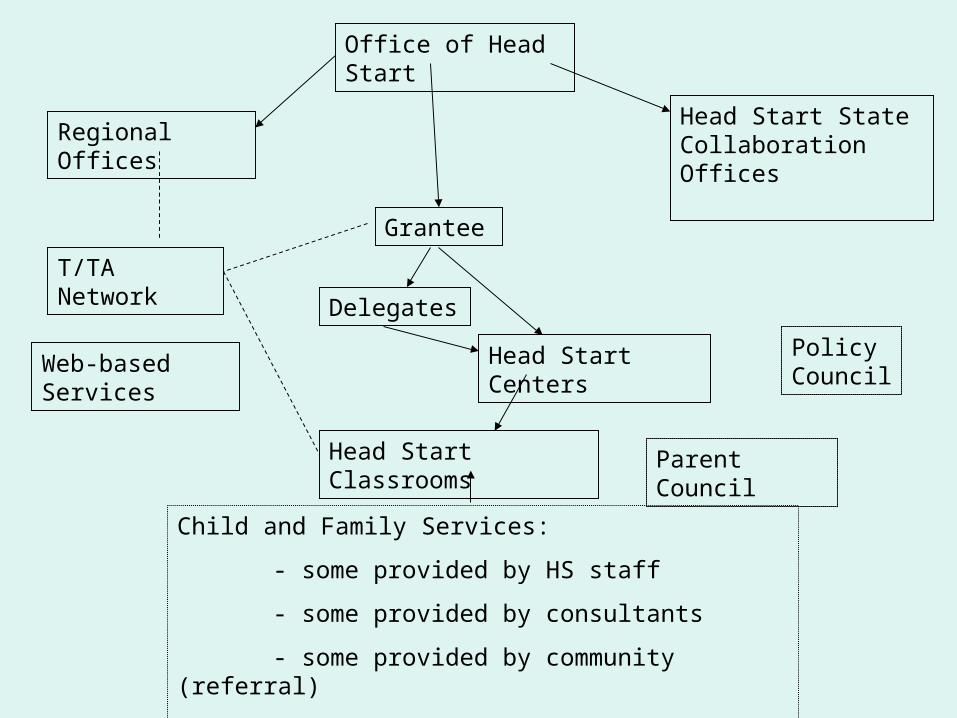
Office of Head Start
Regional Offices
Grantee
Head Start Centers
Head Start Classrooms
Head Start State Collaboration Offices
Delegates
T/TA Network
Policy Council
Child and Family Services:
- some provided by HS staff
- some provided by consultants
- some provided by community (referral)
- some provided in classroom, some at home
Parent Council
Web-based Services
Policy Councils & Committees• Each grantee and delegate agency is required to
establish a policy group and a well-functioning governing body to share the responsibility for overseeing the delivery of high quality services to children and families.
• Involvement in the Policy Council and the local Parent Committees empowers the active participation of parents and other community representatives.
• At least 51% of the members of these policy groups must be the parents of currently enrolled children.
Parent Committee
• Established at the program level, the Parent Committee must carry out at least the following minimum responsibilities: – Advise staff in developing and implementing local
program policies, activities, and services; – Plan, conduct, and participate in informal as well as
formal programs and activities for parents and staff; and
– Participate in the recruitment and screening of Early Head Start and Head Start employees.
Family Involvement in HS
• In addition to the policy councils/parent committees:– In center-based programs teachers must offer
at least 2 home visits a year at times convenient for parents & 2 parent-teacher conferences per year
– Staff work with parents to develop family partnership agreements that identify goals and responsibilities for achieving these goals
Program Performance Standards
• Health Services
• Nutritional Services
• Safe Environments
• Disabilities Services
• Mental Health Services
• Family and Community Services
• Transportation Services
• Education and Early Childhood Development Services
• Fiscal Management
• Program Design and Management
Head Start Performance Review• Conducted by the national office tri-annually by a team of trained
reviewers
• Reviewers spend approximately 3-5 days with a program
• Review of compliance of Head Start grantees with regulations
• Reviews include:
– Classroom observation and interviews with staff
– Review of curriculum for components required by the Head Start regulations
– Review of assessment and screening measures, to the extent there are regulations written about them,
– Review of how the grantee is in compliance with health, mental health, disabilities, education/early childhood development, fiscal and governance regulations
• If a program is found non-compliant or deficient they have a period of time to make changes before funding is cut or other action is taken, this may result in an outside administrative team taking over in extreme situations (replacement grantee) to provide continuity of services
Additional Structural Characteristics• Operational Calendar
• Full Time vs. Part Time
• 3-year-olds versus 4-year-olds
• Staff to Child Ratio
• Staff Credentials/Training
• Local Control (Curriculum/Assessment)
• Child Care outside of Head Start hours
Migrant and AI/AN programs• American Indian/Alaskan Native (AI/AN) and
the Migrant & Seasonal Head Start (MSHS) programs, in general, are the same as other Head Start programs and must follow the same Performance Standards and regulations.
• However, they do have some notable differences.– AI/AN programs
– MSHS programs
Outline of Presentation
• Head Start– Structure– Demographics of Families and Children– Outcomes & Services for Families and
Children
• Early Head Start– Structure– Demographics of Families and Children– Outcomes & Services for Families and
Children
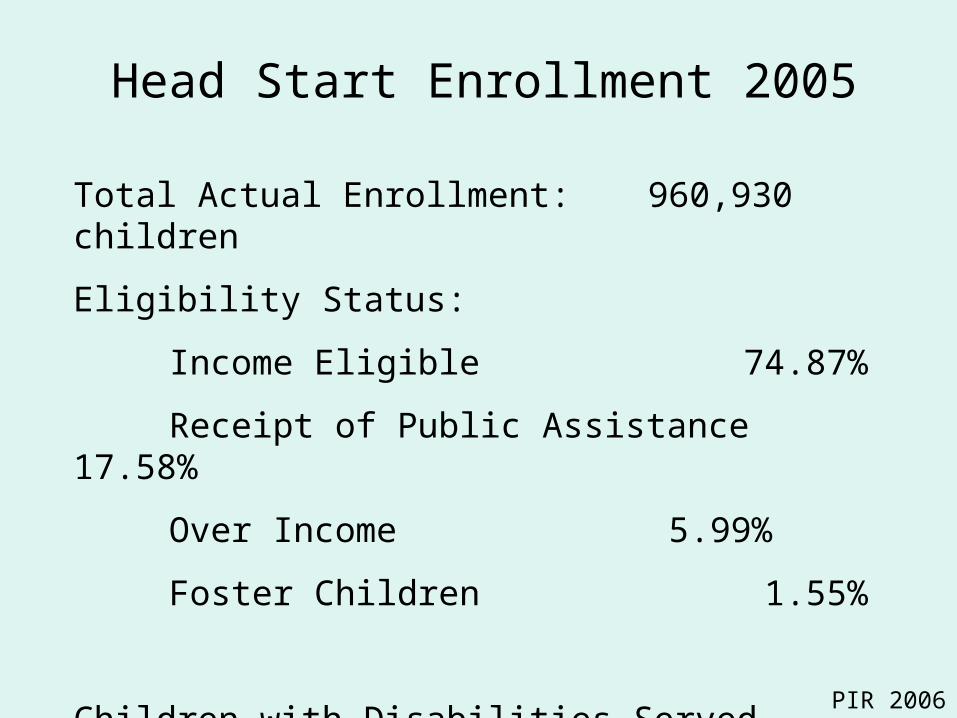
Head Start Enrollment 2005
Total Actual Enrollment: 960,930 children
Eligibility Status:
Income Eligible 74.87%
Receipt of Public Assistance 17.58%
Over Income 5.99%
Foster Children 1.55%
Children with Disabilities Served 12.3%
PIR 2006
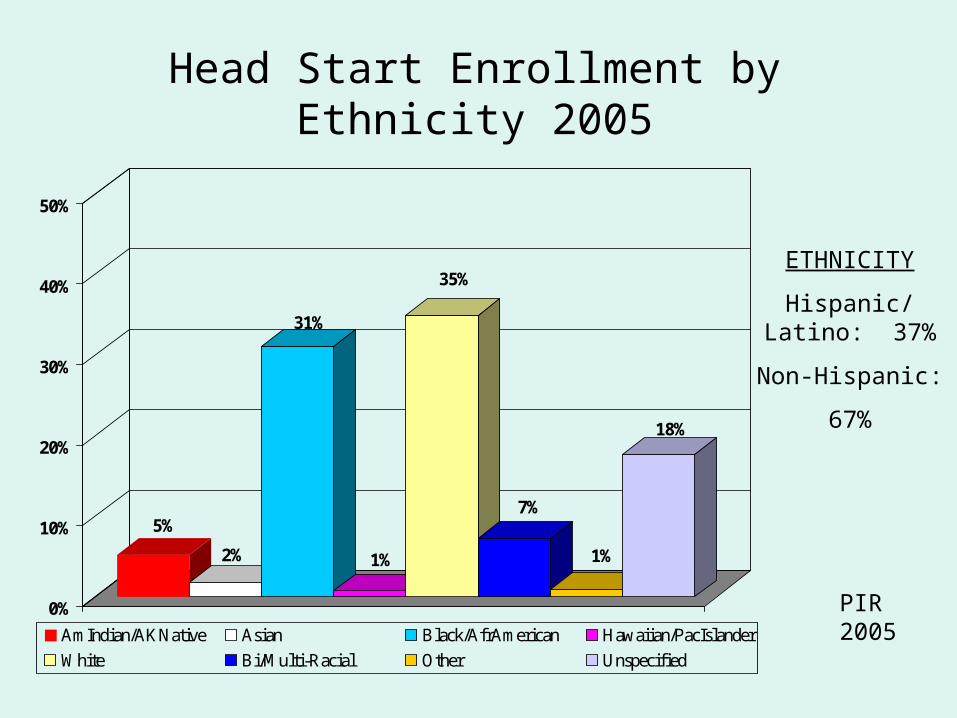
Head Start Enrollment by Ethnicity 2005
5%
2%
31%
1%
35%
7%
1%
18%
0%
10%
20%
30%
40%
50%
AmIndian/AKNative Asian Black/AfrAmerican Hawaiian/PacIslander
White Bi/Multi-Racial Other Unspecified
ETHNICITY
Hispanic/Latino: 37%
Non-Hispanic:
67%
PIR 2005
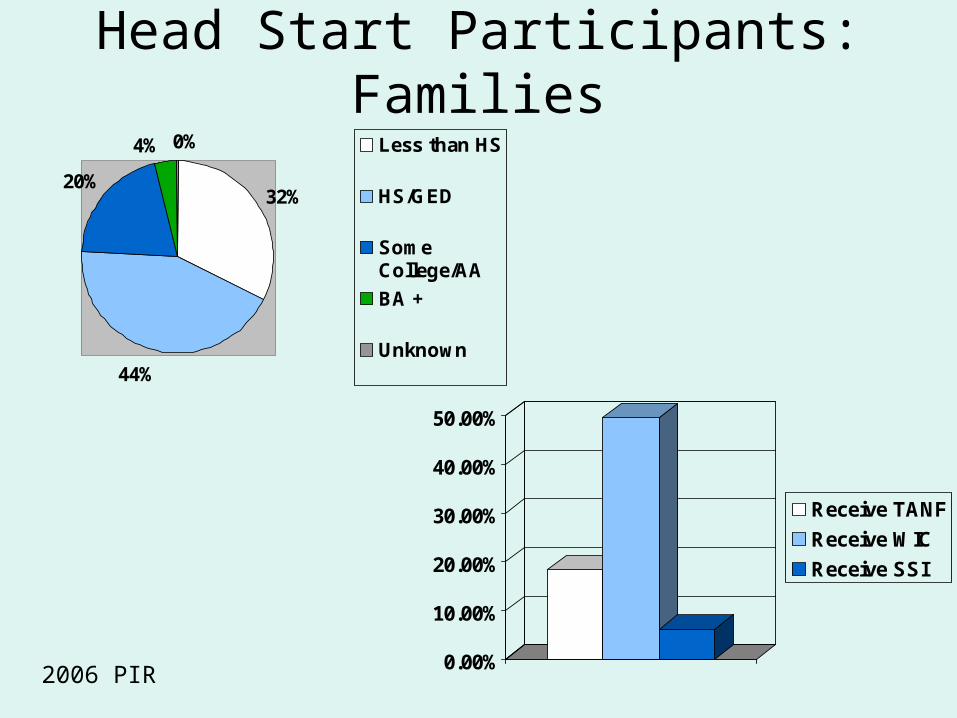
Head Start Participants: Families
32%
44%
20%
4% 0% Less than HS
HS/GED
SomeCollege/AA
BA +
Unknown
0.00%
10.00%
20.00%
30.00%
40.00%
50.00%
Receive TANF
Receive WIC
Receive SSI
2006 PIR
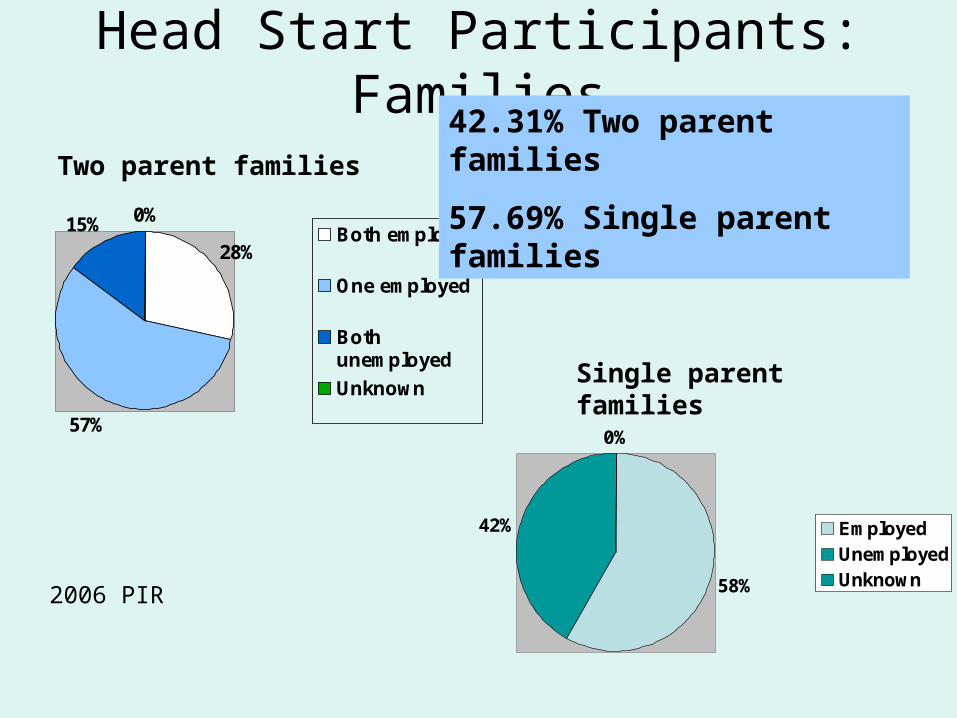
Head Start Participants: Families
28%
57%
15% 0%Both employed
One employed
Bothunemployed
Unknown
Two parent families
58%
42%
0%
EmployedUnemployedUnknown
Single parent families
42.31% Two parent families
57.69% Single parent families
2006 PIR
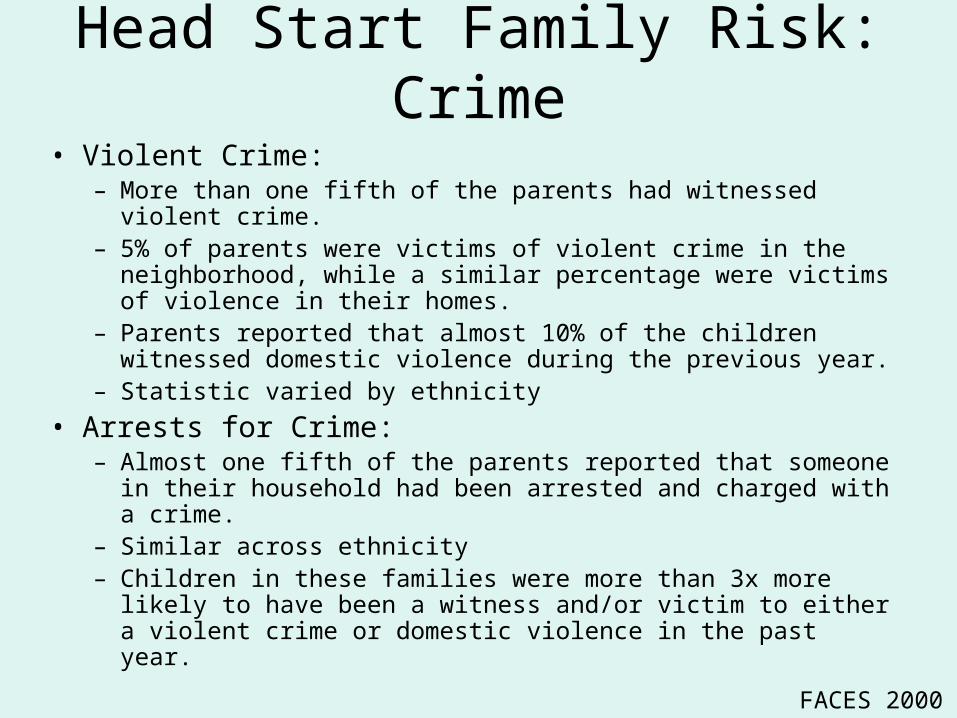
Head Start Family Risk: Crime
• Violent Crime:– More than one fifth of the parents had witnessed violent crime. – 5% of parents were victims of violent crime in the neighborhood,
while a similar percentage were victims of violence in their homes.
– Parents reported that almost 10% of the children witnessed domestic violence during the previous year.
– Statistic varied by ethnicity
• Arrests for Crime:– Almost one fifth of the parents reported that someone in their
household had been arrested and charged with a crime. – Similar across ethnicity – Children in these families were more than 3x more likely to have
been a witness and/or victim to either a violent crime or domestic violence in the past year.
FACES 2000
Head Start Family Risk: Depression & Substance Use
• Depression
• Smoking
• Alcohol
• Other Drugs
FACES 2000
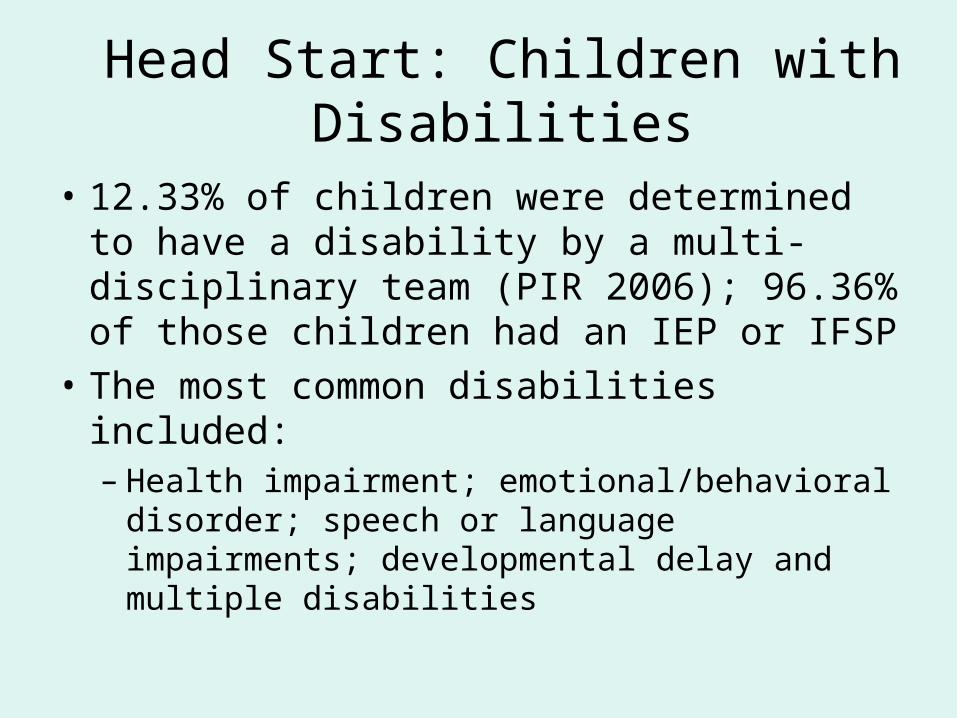
Head Start: Children with Disabilities
• 12.33% of children were determined to have a disability by a multi-disciplinary team (PIR 2006); 96.36% of those children had an IEP or IFSP
• The most common disabilities included:– Health impairment; emotional/behavioral
disorder; speech or language impairments; developmental delay and multiple disabilities
Outline of Presentation
• Head Start– Structure– Demographics of Families and Children– Outcomes for Families and Children
• Early Head Start– Structure– Demographics of Families and Children– Outcomes for Families and Children
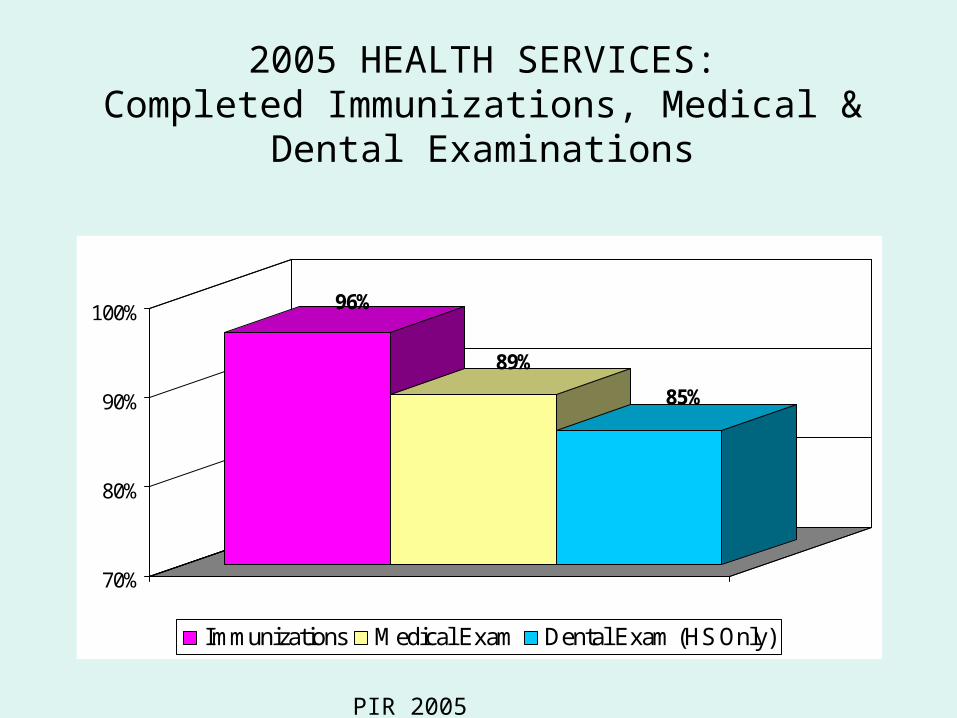
2005 HEALTH SERVICES:Completed Immunizations, Medical & Dental
Examinations
96%
89%
85%
70%
80%
90%
100%
Immunizations Medical Exam Dental Exam (HS Only)
PIR 2005
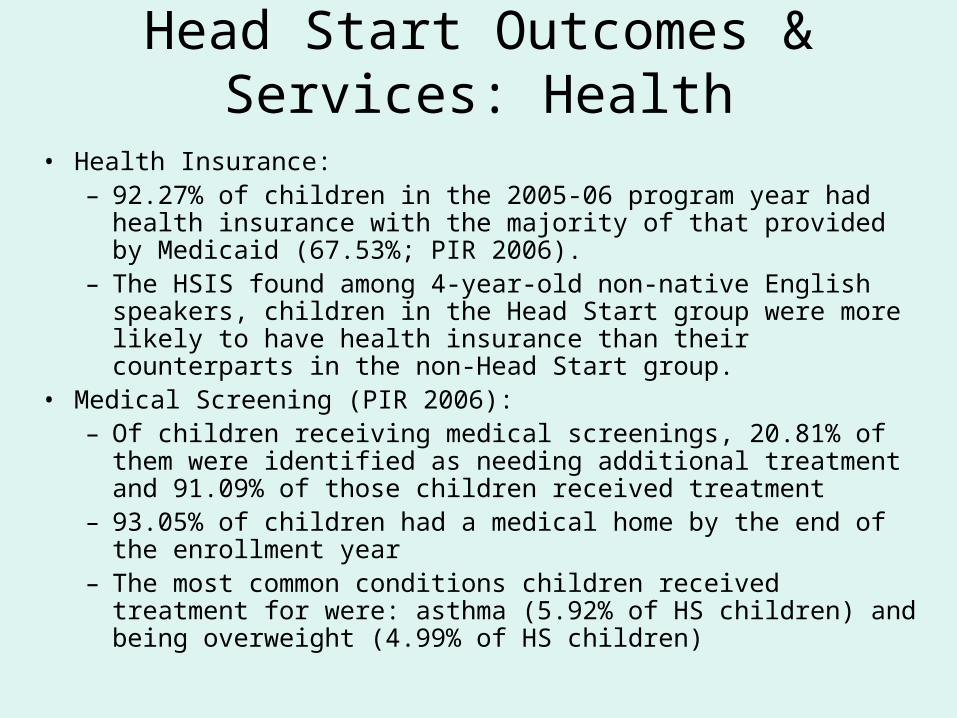
Head Start Outcomes & Services: Health
• Health Insurance:– 92.27% of children in the 2005-06 program year had health
insurance with the majority of that provided by Medicaid (67.53%; PIR 2006).
– The HSIS found among 4-year-old non-native English speakers, children in the Head Start group were more likely to have health insurance than their counterparts in the non-Head Start group.
• Medical Screening (PIR 2006):– Of children receiving medical screenings, 20.81% of them were
identified as needing additional treatment and 91.09% of those children received treatment
– 93.05% of children had a medical home by the end of the enrollment year
– The most common conditions children received treatment for were: asthma (5.92% of HS children) and being overweight (4.99% of HS children)
Head Start Outcomes & Services: Health
• Dental Care:
– According to the PIR, 85.68% of children had a dental home by the end of the enrollment year;
– Of children receiving a dental screening, 82.60% of those received preventative care and 25.16% were identified as needing treatment (with 79.79% receiving that treatment; PIR 2006)
Head Start Outcomes & Services: Health
• According to the HSIS:– For children in both the 3- and 4-year-old
group, Head Start children were more likely to have received dental care than non-Head Start children.
– For children whose native language was not English:
• For children in the 3-year-old group, positive impacts on parental reports of their child’s health status.
• For children in the 4-year-old group, there was a significant impact on whether the child had health insurance.
Head Start Outcomes & Services: Health
• Overall Health:
– HSIS found that overall more 3-year-olds in the Head Start group were rated as in excellent or very good health compared to those in the non-Head Start group
– In FACES 2003, the majority of parents report their children in excellent or very good health.
Head Start Outcomes & Services: Nutrition
• Head Start programs prepare meals for children that provide between 1/3 and 2/3 of the child’s nutritional needs depending on the length of the school day (Descriptive Study of Head Start Health Activities, 1997).
• In 1997, Nutritional Coordinators reported 96% of the children received a nutritional screening during the school year (DSHSHA, 1997).
• Approximately 5% of the children were described as being in need of nutritional services in 1997.
• During the DSHSHA study, 61.4% of the time that meals were observed staff were providing children information about the food on the table.
• Currently there is a strong movement to work on obesity prevention (IM/IL)
Head Start Outcomes & Services: Disabilities
• 94% of Head Start programs were rated as having full inclusion practices in their classrooms (FACES 2000)
• As a subgroup, children with disabilities showed significant decreases in hyperactive behavior during the Head Start year (FACES 2000).
• For children with special needs, the HSIS found for both 3- and 4-year-old children in the Head Start group, parents reported a more favorable health status than the non-Head Start parents
Head Start Outcomes & Services: Mental Health
• Mental Health Service Provision:– Families– Children
• For parents, from fall to spring, there was a small decline in the overall mean depression scores for caregivers, but the difference was not statistically significant (FACES 2000).
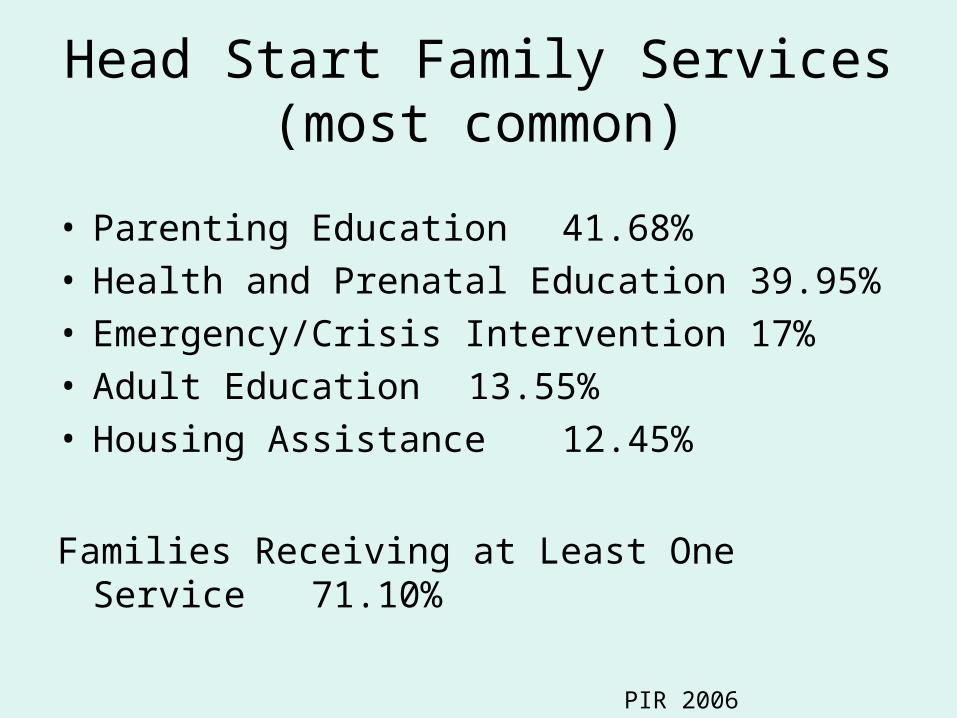
Head Start Family Services (most common)
• Parenting Education 41.68%• Health and Prenatal Education 39.95%• Emergency/Crisis Intervention 17%• Adult Education 13.55%• Housing Assistance 12.45%
Families Receiving at Least One Service 71.10%
PIR 2006
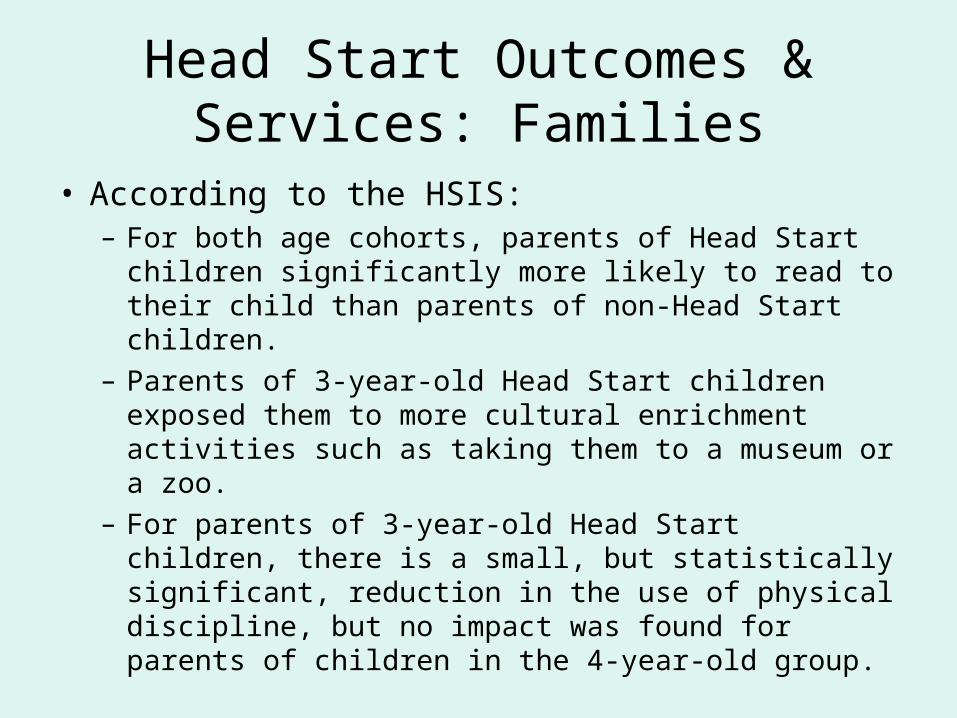
Head Start Outcomes & Services: Families
• According to the HSIS:– For both age cohorts, parents of Head Start children
significantly more likely to read to their child than parents of non-Head Start children.
– Parents of 3-year-old Head Start children exposed them to more cultural enrichment activities such as taking them to a museum or a zoo.
– For parents of 3-year-old Head Start children, there is a small, but statistically significant, reduction in the use of physical discipline, but no impact was found for parents of children in the 4-year-old group.
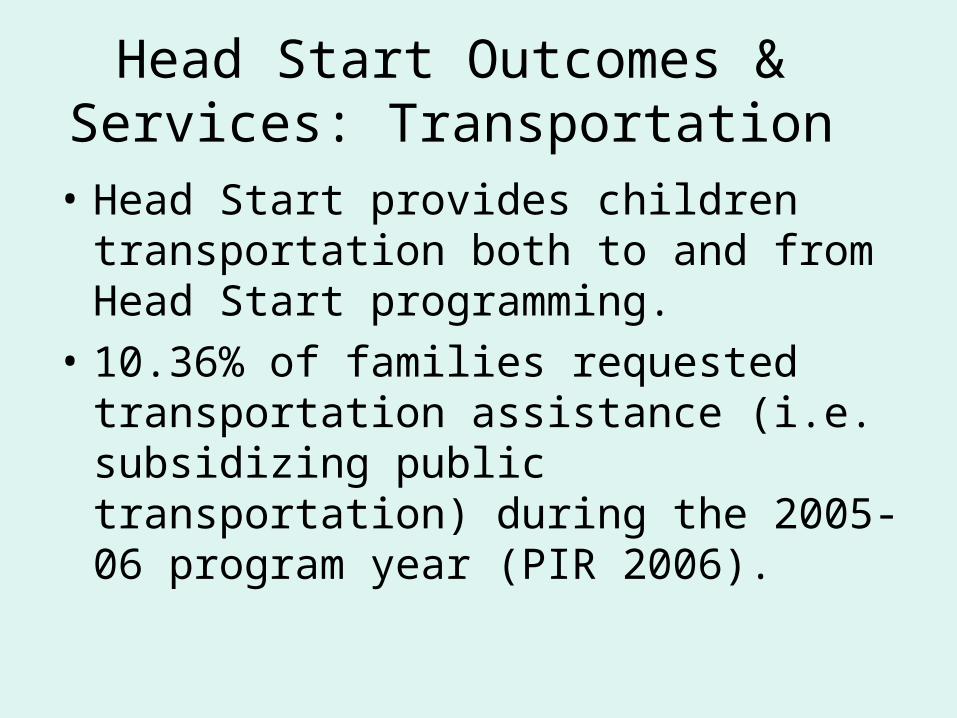
Head Start Outcomes & Services: Transportation
• Head Start provides children transportation both to and from Head Start programming.
• 10.36% of families requested transportation assistance (i.e. subsidizing public transportation) during the 2005-06 program year (PIR 2006).
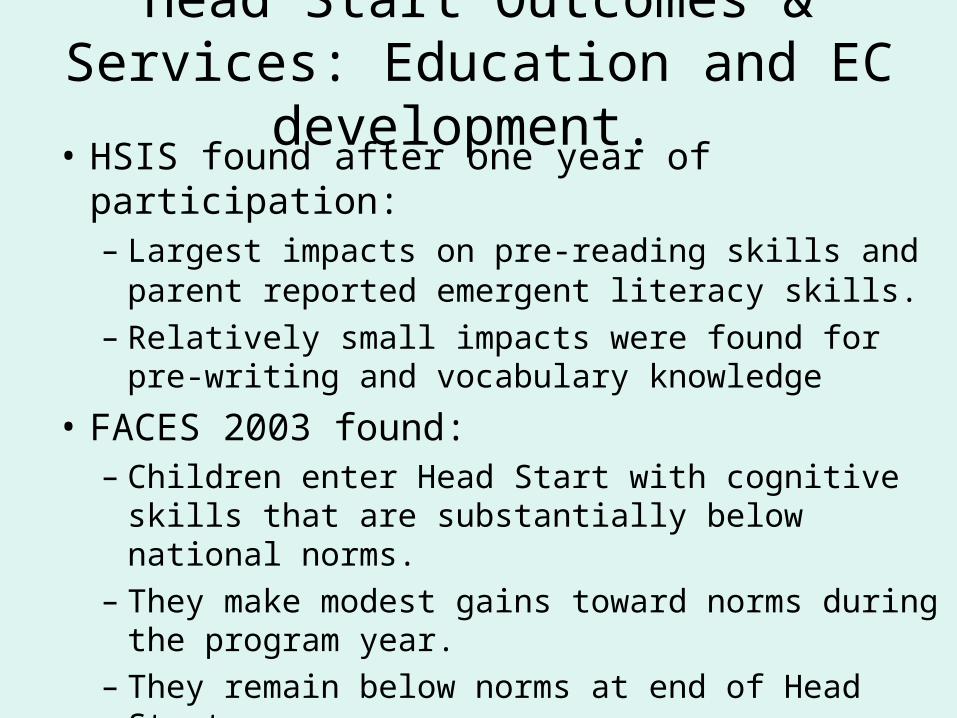
Head Start Outcomes & Services: Education and EC development.
• HSIS found after one year of participation:– Largest impacts on pre-reading skills and parent
reported emergent literacy skills. – Relatively small impacts were found for pre-writing
and vocabulary knowledge
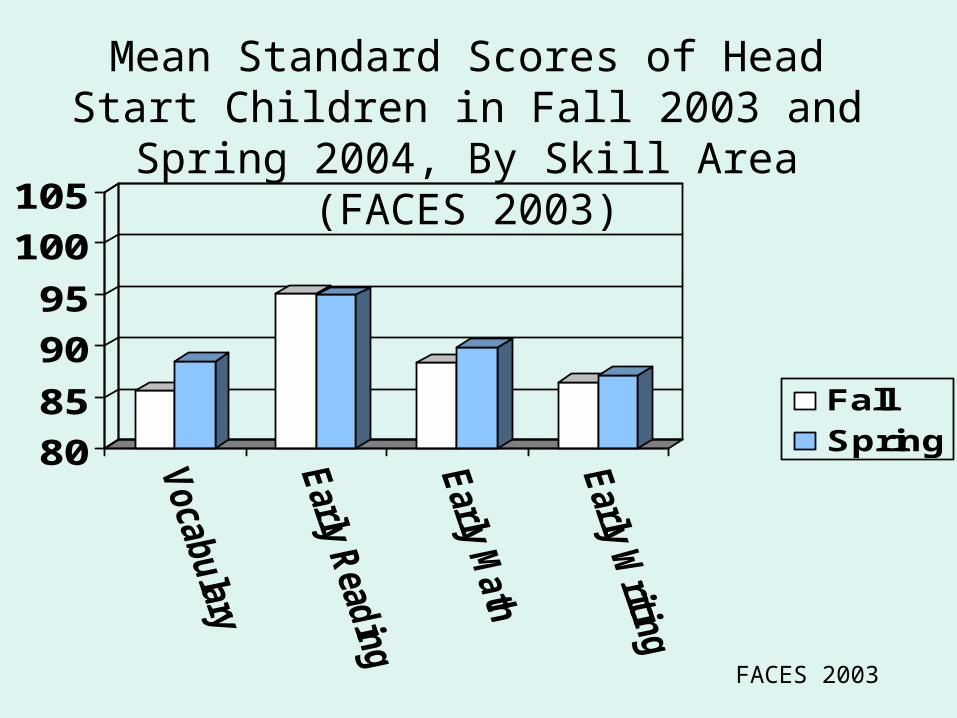
• FACES 2003 found:– Children enter Head Start with cognitive skills that
are substantially below national norms.
– They make modest gains toward norms during the program year.
– They remain below norms at end of Head Start.
FACES 2003
Mean Standard Scores of Head Start Children in Fall 2003 and Spring 2004, By
Skill Area (FACES 2003)
80
85
90
95
100
105
FallSpring
Head Start Outcomes & Services: Skill Levels at End of Kindergarten
• Average Head Start graduate reached national norms in letter/word identification but not pre-writing (FACES 2003).
• Average Head Start graduate continues to be significantly below national norms in skill areas such as vocabulary, general knowledge, and solving simple math word problems.
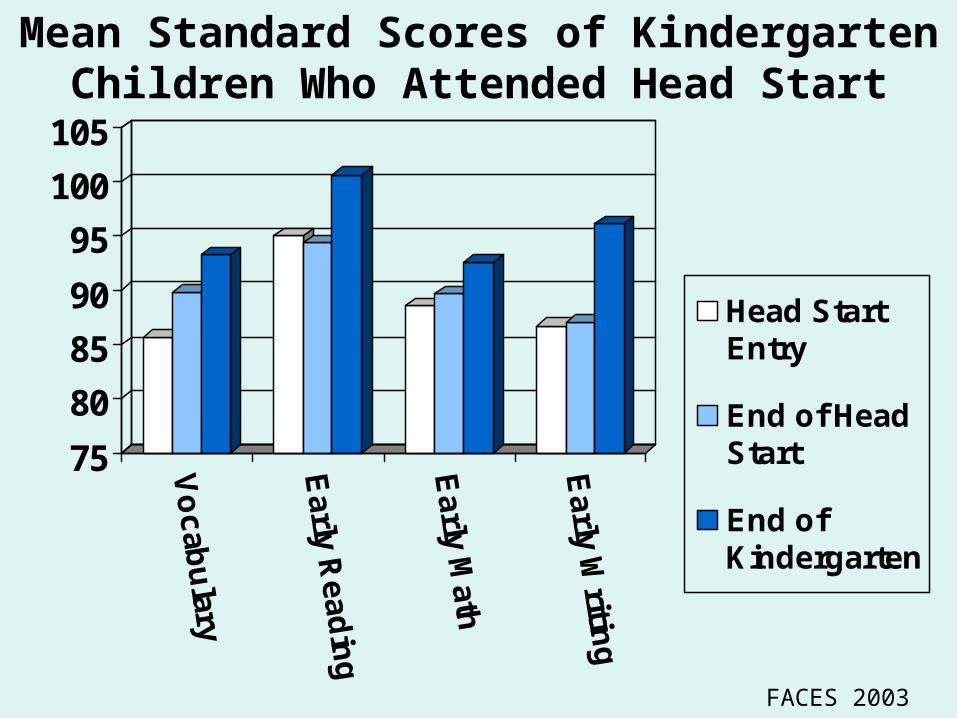
Mean Standard Scores of Kindergarten Children Who Attended Head Start
75
80
85
90
95
100
105
Vo
cab
ulary
Ea
rly Re
ad
ing
Ea
rly Math
Ea
rly Writin
gHead StartEntry
End of HeadStart
End ofKindergarten
FACES 2003
Head Start Outcomes & Services: Education and EC development.
• From HSIS on gains parent-reported social-emotional behavior:– For 3-year-old Head Start children– For 4-year-old English-speaking families
only
• From FACES 2003:– Children showed increases in teacher-
reported cooperative classroom behavior, and decreases in hyperactive behavior.
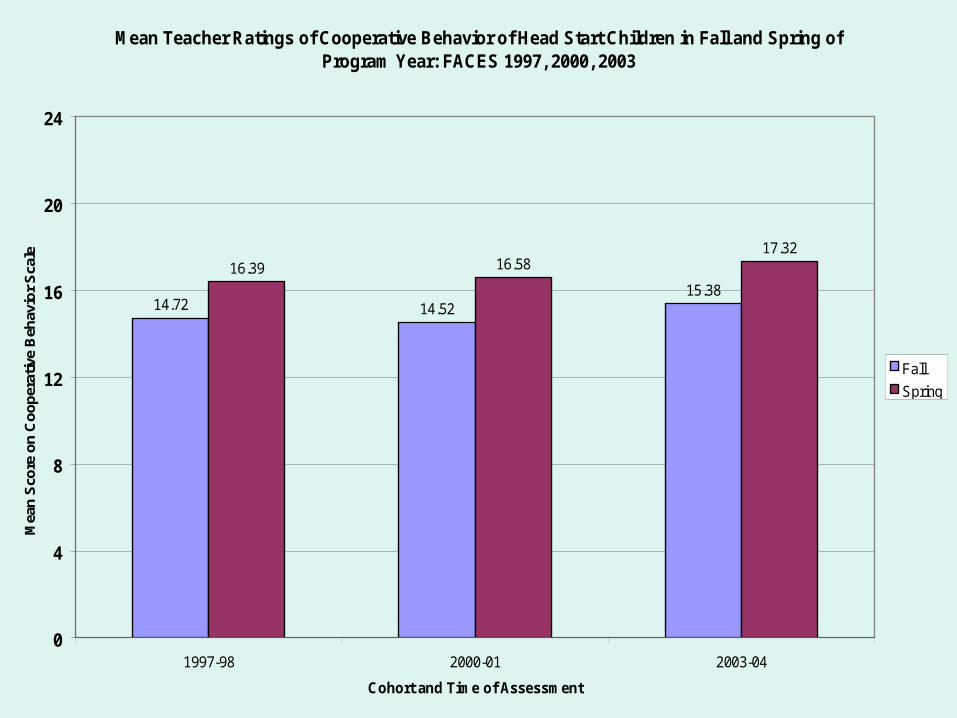
Mean Teacher Ratings of Cooperative Behavior of Head Start Children in Fall and Spring of Program Year: FACES 1997, 2000, 2003
14.72 14.5215.38
16.39 16.5817.32
0
4
8
12
16
20
24
1997-98 2000-01 2003-04
Cohort and Time of Assessment
Mea
n S
core
on
Co
op
erat
ive
Beh
avio
r S
cale
Fall
Spring
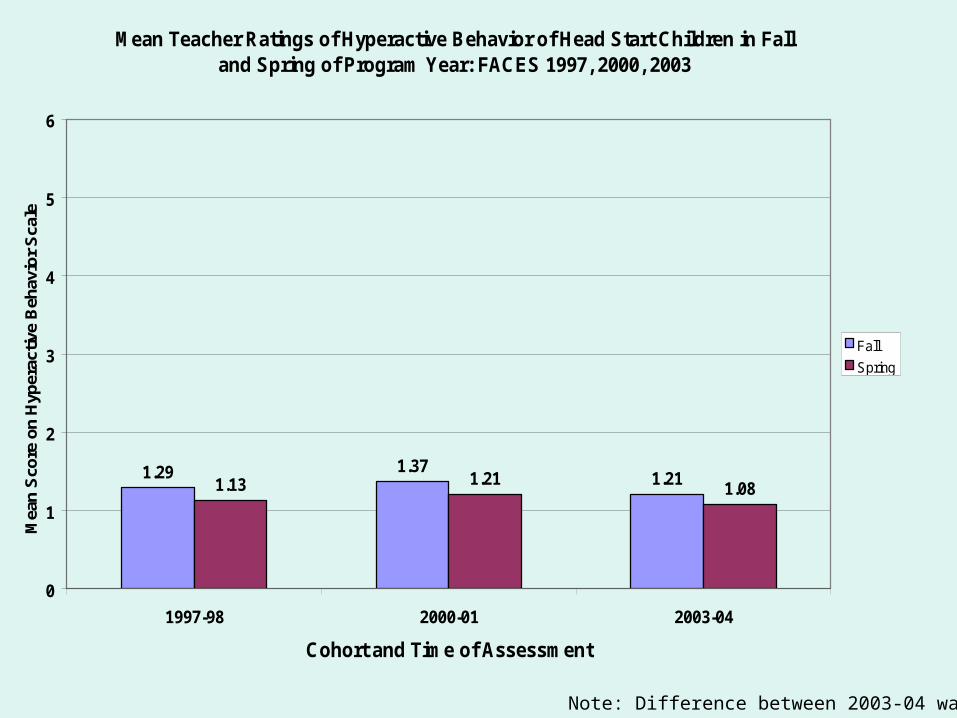
Mean Teacher Ratings of Hyperactive Behavior of Head Start Children in Fall and Spring of Program Year: FACES 1997, 2000, 2003
1.29 1.371.211.13 1.21
1.08
0
1
2
3
4
5
6
1997-98 2000-01 2003-04
Cohort and Time of Assessment
Mea
n S
core
on
Hyp
erac
tive
Beh
avio
r S
cale
Fall
Spring
Note: Difference between 2003-04 was NS
Outline of Presentation
• Head Start– Structure– Demographics of Families and Children– Outcomes & Services for Families and
Children
• Early Head Start– Structure– Demographics of Families and Children– Outcomes & Services for Families and
Children
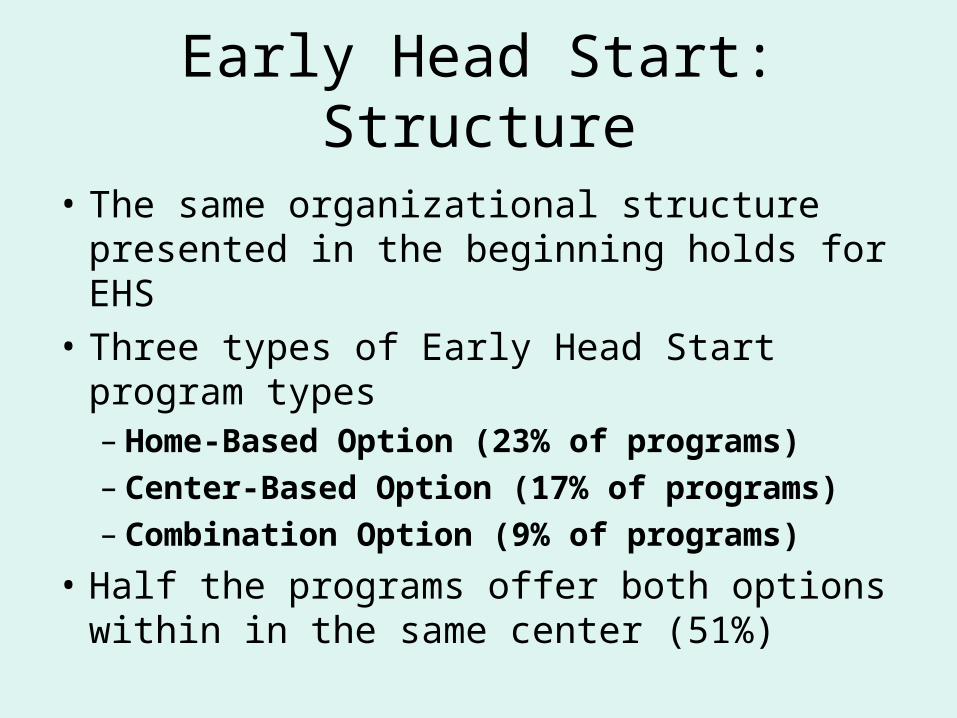
Early Head Start: Structure
• The same organizational structure presented in the beginning holds for EHS
• Three types of Early Head Start program types– Home-Based Option (23% of programs)– Center-Based Option (17% of programs)– Combination Option (9% of programs)
• Half the programs offer both options within in the same center (51%)
Outline of Presentation
• Head Start– Structure– Demographics of Families and Children– Outcomes & Services for Families and
Children
• Early Head Start– Structure– Demographics of Families and
Children– Outcomes & Services for Families and
Children
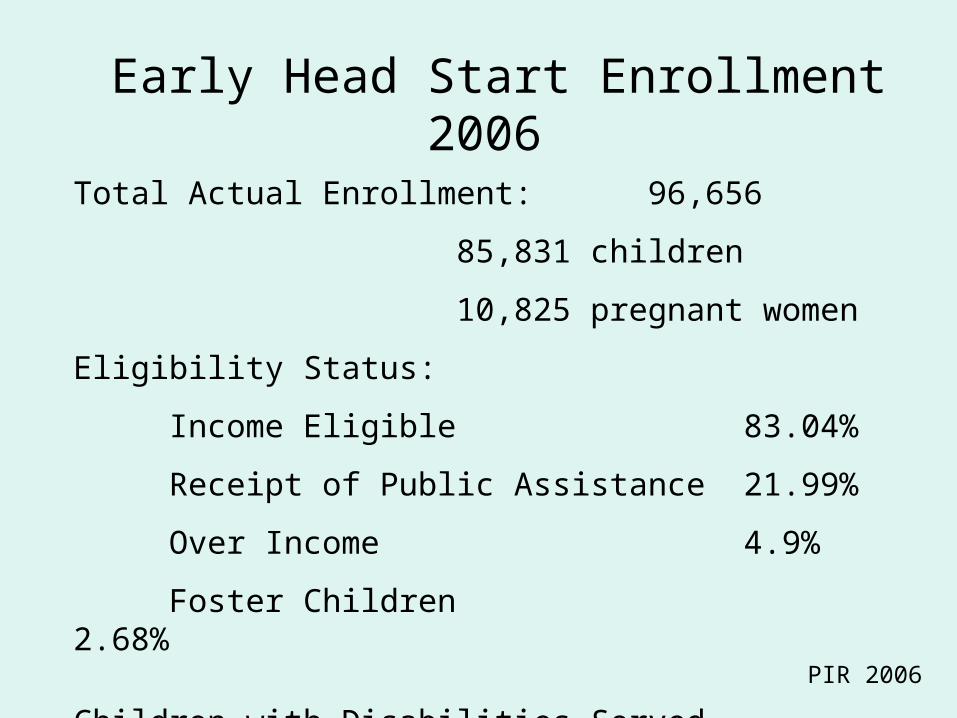
Early Head Start Enrollment 2006
Total Actual Enrollment: 96,656
85,831 children
10,825 pregnant women
Eligibility Status:
Income Eligible 83.04%
Receipt of Public Assistance 21.99%
Over Income 4.9%
Foster Children 2.68%
Children with Disabilities Served 12.9% PIR 2006
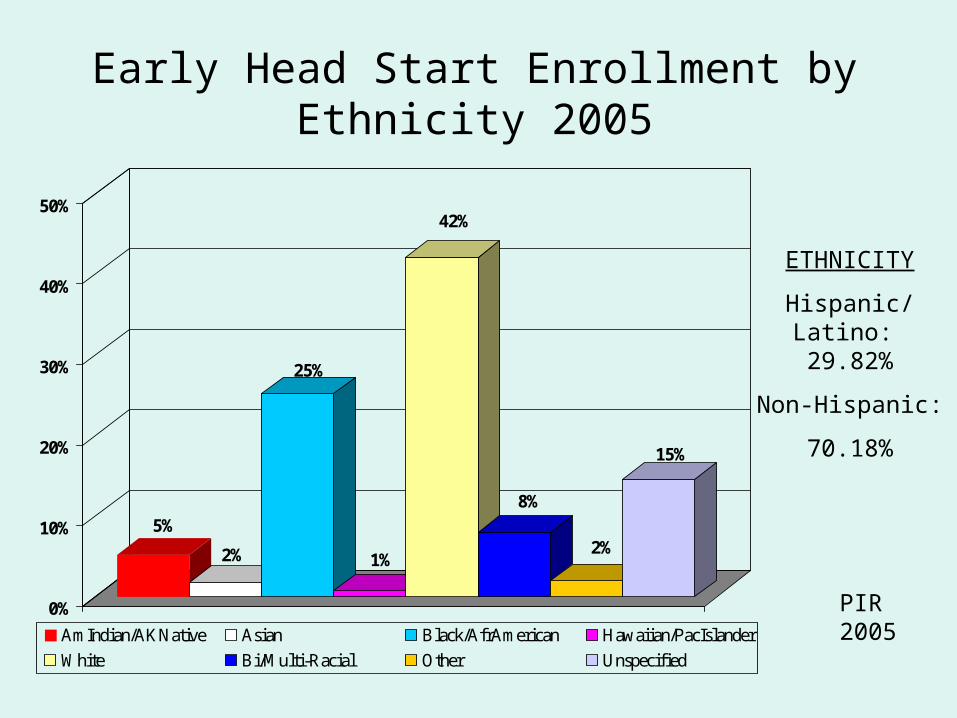
Early Head Start Enrollment by Ethnicity 2005
5%
2%
25%
1%
42%
8%
2%
15%
0%
10%
20%
30%
40%
50%
AmIndian/AKNative Asian Black/AfrAmerican Hawaiian/PacIslander
White Bi/Multi-Racial Other Unspecified
ETHNICITY
Hispanic/Latino: 29.82%
Non-Hispanic:
70.18%
PIR 2005
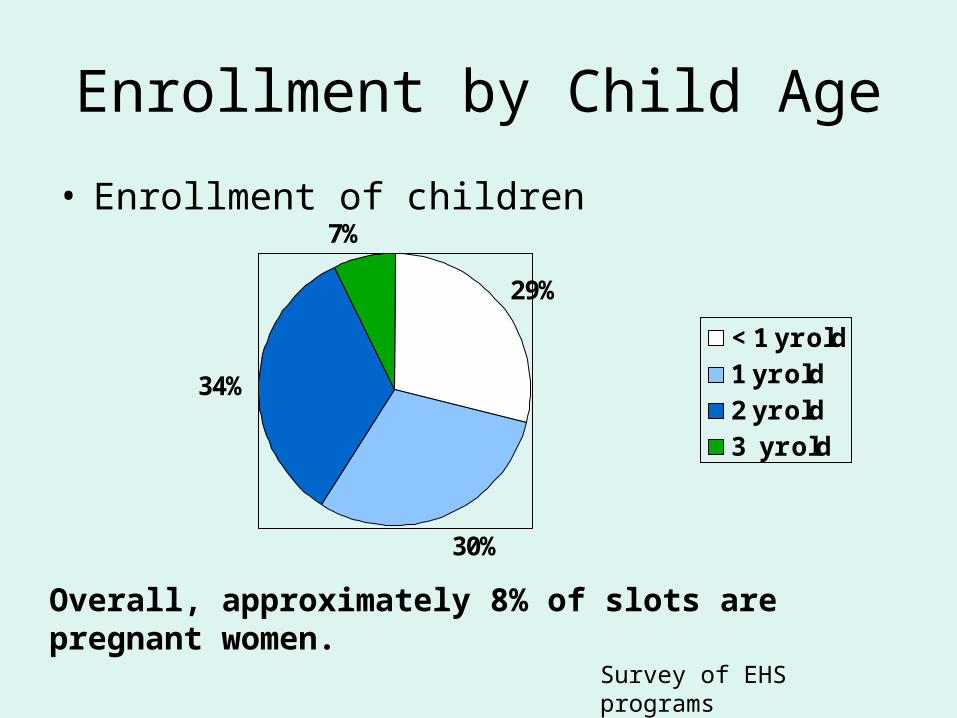
Enrollment by Child Age
• Enrollment of children
29%
30%
34%
7%
< 1 yr old1 yr old2 yr old3 yr old
Survey of EHS programs
Overall, approximately 8% of slots are pregnant women.
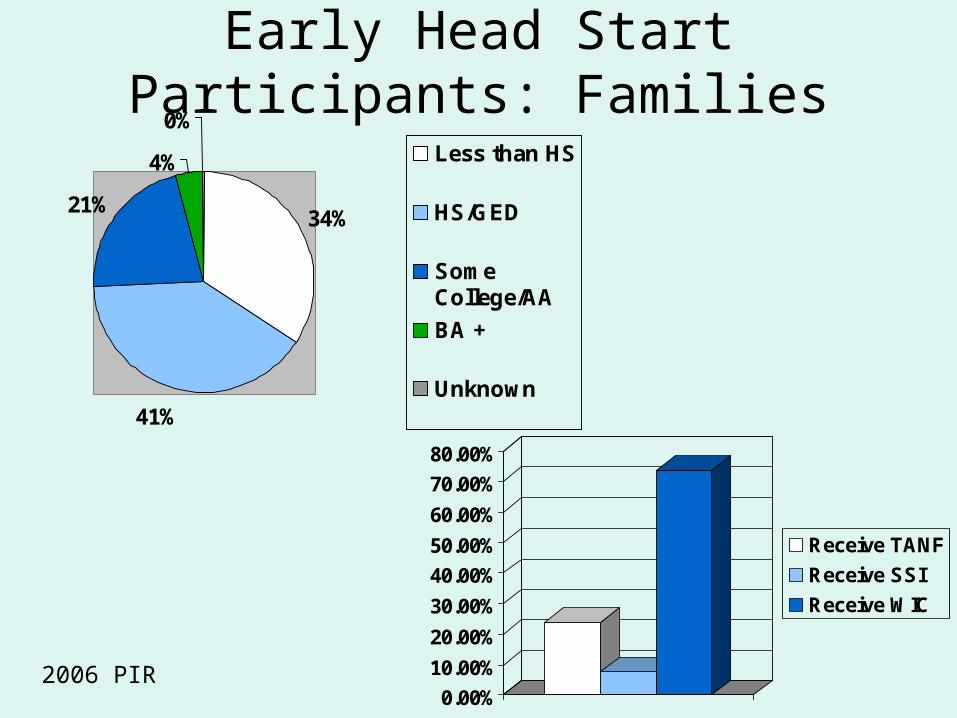
Early Head Start Participants: Families
34%
41%
21%
4%
0%
Less than HS
HS/GED
SomeCollege/AA
BA +
Unknown
0.00%
10.00%
20.00%
30.00%
40.00%
50.00%
60.00%
70.00%
80.00%
Receive TANF
Receive SSI
Receive WIC
2006 PIR
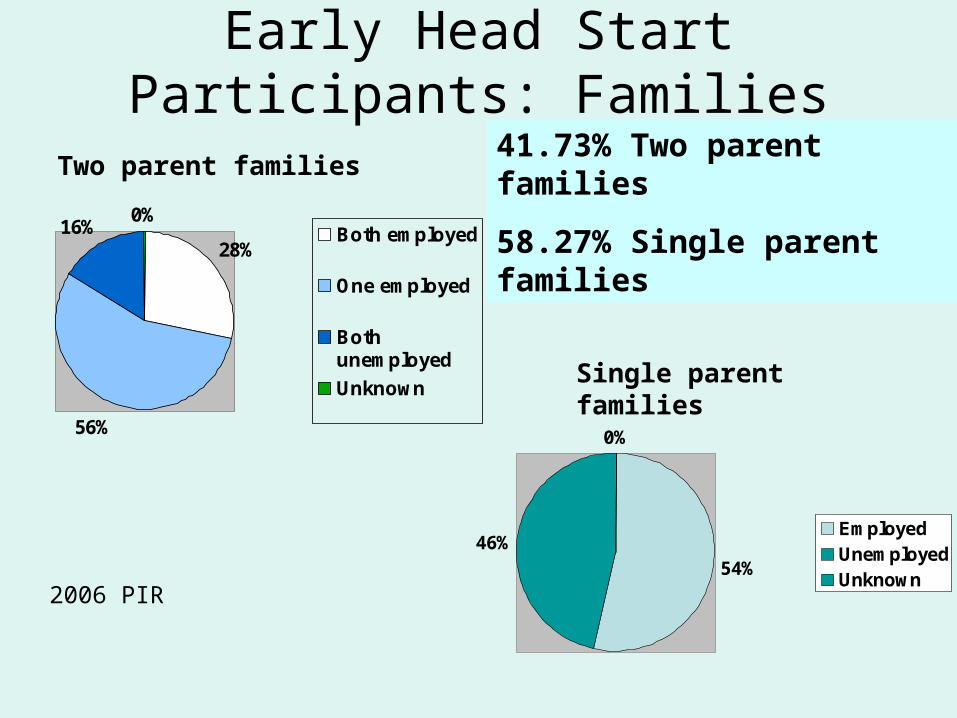
Early Head Start Participants: Families
28%
56%
16%0%
Both employed
One employed
Bothunemployed
Unknown
Two parent families
54%46%
0%
EmployedUnemployedUnknown
Single parent families
41.73% Two parent families
58.27% Single parent families
2006 PIR
Early Head Start Family Risk: Depression & Substance Use
• Maternal depressive symptoms
• Paternal depressive symptoms
• Smoking behaviors
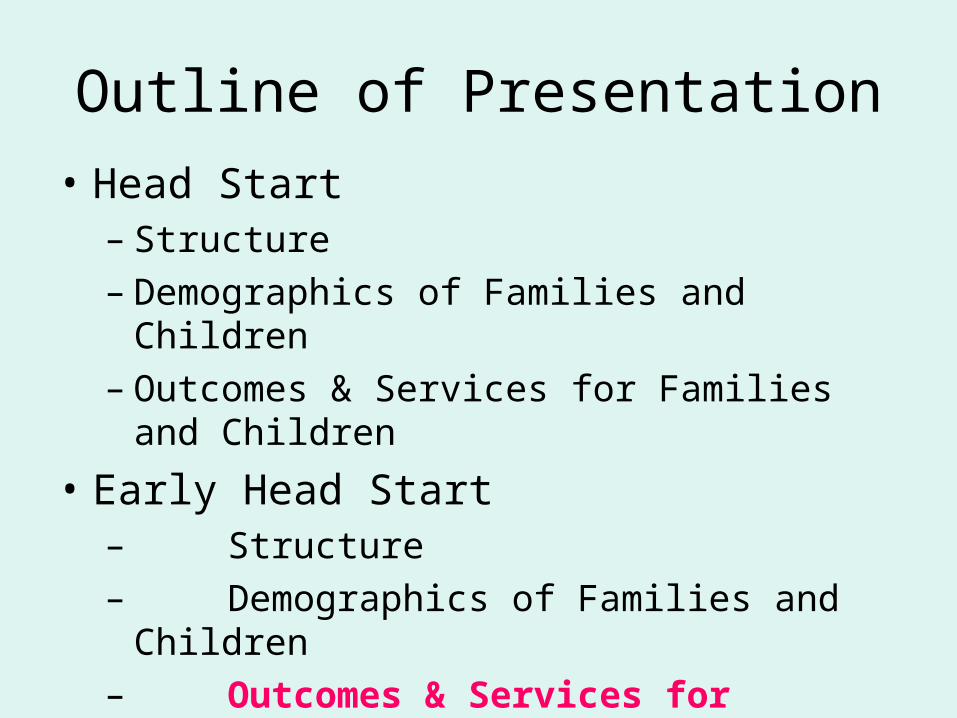
Outline of Presentation
• Head Start– Structure– Demographics of Families and Children– Outcomes & Services for Families and
Children
• Early Head Start– Structure– Demographics of Families and Children– Outcomes & Services for Families
and Children
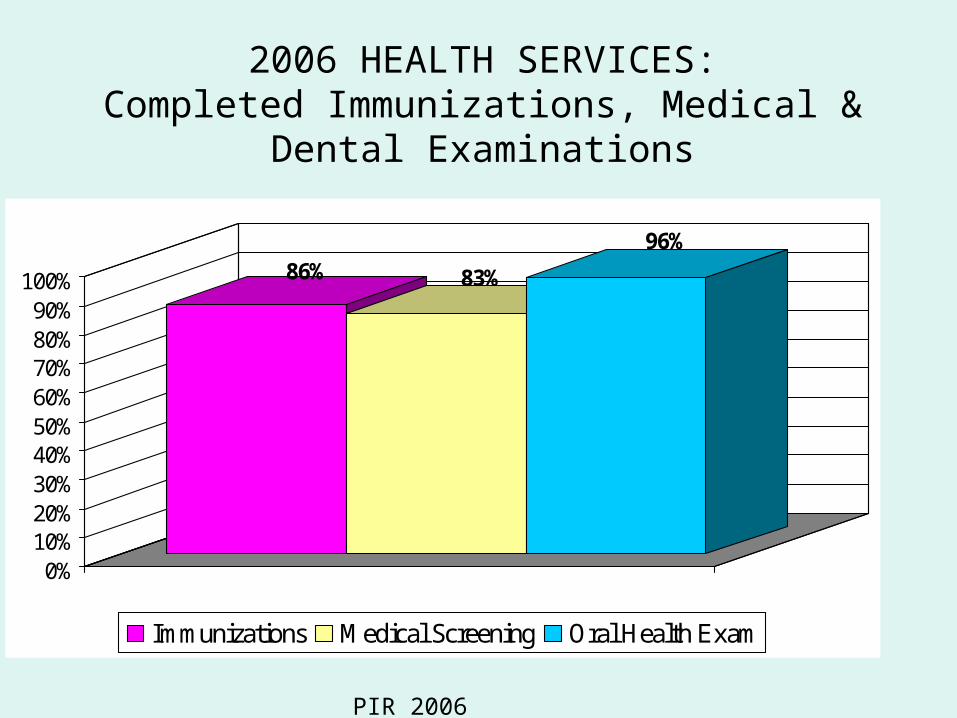
2006 HEALTH SERVICES:Completed Immunizations, Medical & Dental
Examinations
86% 83%
96%
0%10%20%30%40%50%60%70%80%90%
100%
Immunizations Medical Screening Oral Health Exam
PIR 2006
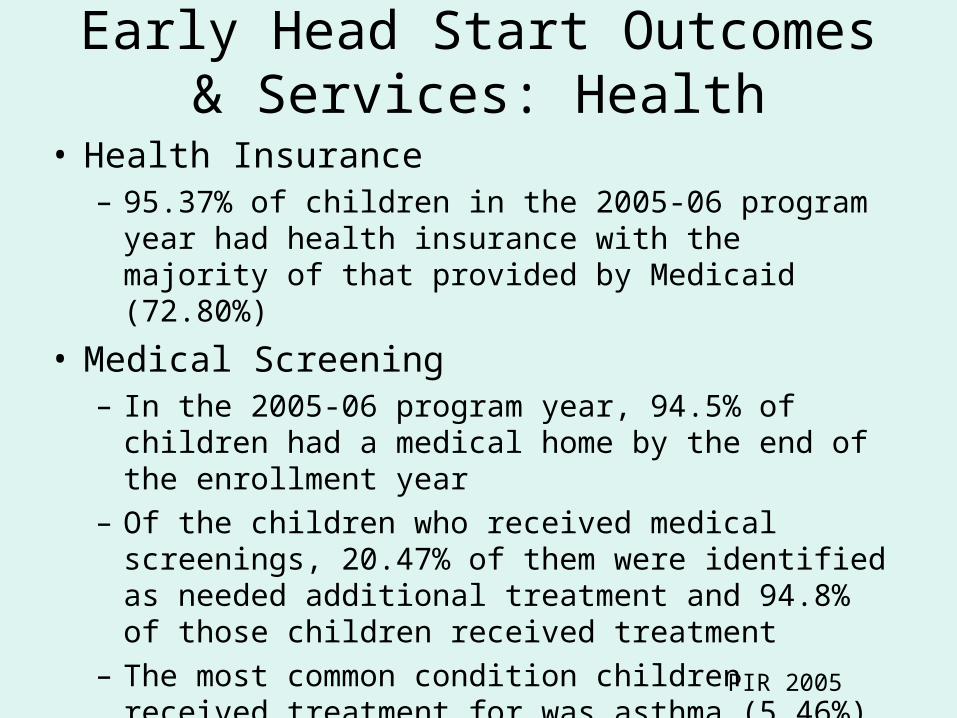
Early Head Start Outcomes & Services: Health
• Health Insurance– 95.37% of children in the 2005-06 program year had
health insurance with the majority of that provided by Medicaid (72.80%)
• Medical Screening– In the 2005-06 program year, 94.5% of children had a
medical home by the end of the enrollment year– Of the children who received medical screenings,
20.47% of them were identified as needed additional treatment and 94.8% of those children received treatment
– The most common condition children received treatment for was asthma (5.46%) PIR 2005
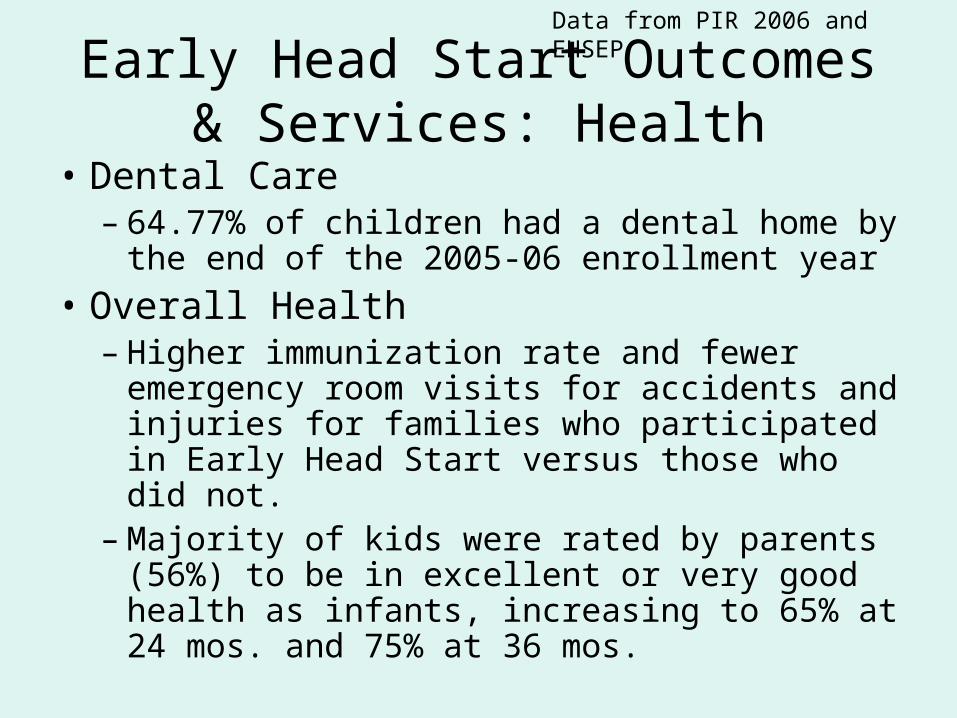
Early Head Start Outcomes & Services: Health
• Dental Care– 64.77% of children had a dental home by the
end of the 2005-06 enrollment year
• Overall Health– Higher immunization rate and fewer
emergency room visits for accidents and injuries for families who participated in Early Head Start versus those who did not.
– Majority of kids were rated by parents (56%) to be in excellent or very good health as infants, increasing to 65% at 24 mos. and 75% at 36 mos.
Data from PIR 2006 and EHSEP
Early Head Start Outcomes & Services: Safe environments
• At 2 years of age, there were no impacts on parent-reported safety practices in the home in general:– There were significant effects for those
parents who were enrolled in TANF in improving their safety practices (EHSEP).
• EHS did not increase parents use of car seats both at age 2 and 3 (EHSEP)
Early Head Start Outcomes & Services: Disabilities
• Early Head Start children were significantly more likely to receive Part C services than control children (ACF, 2002b). – Higher rates of identification are attributed to program
screening and referral services and coordination with Part C partners.
– Approximately 5.4% of families in Early Head Start reported receiving Part C services and having IFSPs. This contrasts to 3.8% in the control group.
– The most common reasons for identification were speech problems; disabilities related to mobility, vision, and hearing; and other serious conditions such as spina bifida.
EHS: Mental Health Outcomes & Services
• 16% of parents requested mental health services from the EHS program; 6.88% requested substance abuse prevention or treatment; 6.54% requested domestic violence services (PIR 2006)
• 1.95% of children were referred for mental health services outside of the program and 72.44% of those children received those services (PIR 2006)
• Families in home-based and combination programs (24%) were more likely to receive mental health services than those in center-based programs (19%) (EHSRE)
Early Head Start: Family Services (most common)
• Parenting Education 64.68%• Health and Prenatal Education 59.98%• Emergency/Crisis Intervention 23.63%• Transportation Assistance 19.71%• Adult Education 17.40%• Housing Assistance 17.46%
Families Receiving at Least One Service 83.65%
(2006 PIR)
Early Head Start Outcomes & Services: Family (at Age 3)
• More positive (and less negative) parenting observed in parent-child play: both mothers and fathers
• More stimulating home environments, support for learning
• More daily reading
• Less spanking: both mother and father report
EHSRE
Early Head Start Outcomes & Services: Community partnerships (at Age 3).
• Parents had more hours in education and job training
• Parents had a higher probability of being employed (trend)
EHSRE
Early Head Start Outcomes & Services: Transportation
• 21% of families reported transportation to be a need for their family (2nd only to child care) (EHSRE)
• 19.71% of families requested transportation services from EHS (subsidized public transit, etc.) (PIR 2006)
• Significantly more families in EHS than control families had accessed transportation assistance (29 vs 19%). – This was true for all three program types (EHSRE).
EHS Outcomes & Services: Education and EC development (at
Age 3).• Early Head Start children were significantly less
likely than control group children to score in the at-risk range of developmental functioning in cognitive and language functioning.
• EHS children had higher scores in learning behaviors such as engagement and attention at age 3
• EHS children were rated as less aggressive at age 3
EHSRE
EHS Important Subgroup Stories: Programs
• All program approaches had favorable impacts. Combination option had broadest.
• Consistent with programs’ theories of change, when children were 24 months old:– Home-based programs tended to have impacts on parent
outcomes– Center-based programs tended to have impacts on child
outcomes– Combination-option programs had impacts on both.
• Larger impacts in some subgroups– African American
– Enrolled during pregnancy
– Moderate demographic risk
• No impacts: highest level of demographic riskEHSRE

For access to all of the reports cited in this presentation go to:
http://www.acf.dhhs.gov/programs/opre/
To contact me :