Embed Size (px)
Citation preview
Demographical Priors for Health ConditionsDiagnosis Using Medicare Data
Fahad AlhasounCenter for Computational
EngineeringMIT
May AlhazzaniCenter for Complex
Engineering Systems atKACST and [email protected]
Marta C. GonzálezDepartment of Civil and
Environmental EngineeringMIT
Abstract
This paper presents an example of how demographical characteristics of patientsinfluence their susceptibility to certain medical conditions. In this paper, weinvestigate the association of health conditions to age of patients in a heterogeneouspopulation. We show that besides the symptoms a patients is having, the age hasthe potential of aiding the diagnostic process in hospitals. Working with ElectronicHealth Records (EHR), we show that medical conditions group into clusters thatshare distinctive population age densities. We use Electronic Health Records fromBrazil for a period of 15 months from March of 2013 to July of 2014. The numberof patients in the data is 1.7 million patients and the number of records is 47million records. The findings have the potential of helping in a setting where anautomated system undergoes the task of predicting the condition of a patient giventheir symptoms and demographical information.
1 Introduction
Studies of comorbidities and diseases correlations have been mainly focusing on few diseases usingtechniques of hypothesis-testing [2, 12, 14, 13, 18, 5] or with focus on certain co-morbidities toindex diseases[16]. Recently, researchers started studying massive health records to uncover theassociations and patterns in complex diseases demonstrating the potentials of studying health records[10, 1, 14, 3]. However, medical conditions data originate from various sources have a narrowedset of the general population of patients. Studies used statistical techniques to produce fine grainedpatient stratification and disease co-occurence statistic of patients in the Sct. Hans Hospital (thelargest Danish psychiatric hospital) [17]. Studies used a network approach to analyze data covering3 years of medical care claims, of patients who are 65 years or older, which biased the analysistowards the population of the elderly[8]. However, recently studies were conducted on data of moreheterogeneous populations. The studies focused on uncovering patterns centered on a small numberof key diagnoses to detect diseases earlier in a patients life [9]. Another study analyzed the structureof co-morbidity networks on five predefined age intervals of patients [4].The wisdom of doctors when it comes to assessing the susceptibility to medical conditions have beeninfluenced by the years of practice and observation of many cases on daily basis. Doctors’ knowledgeof the susceptibility of diseases to different ages/genders serves as an essential prior to performdiagnostics of incoming patients. Similar symptoms for patients might lead to different diagnosisdepending on the age and gender of the patient, a patient who is 70 years old is more probable to besuffering a heart attack than that of a 10 years old even if both patients are suffering the symptomof chest pain. We show here that besides the symptoms a patient is having, age has the potentialof significantly aiding the diagnostic process. In this paper, we aim at uncovering the relationshipbetween health conditions and the age of a patient. We stratify health conditions that share similarpopulation age densities.
30th Conference on Neural Information Processing Systems (NIPS 2016), Barcelona, Spain.
arX
iv:1
612.
0246
0v2
[st
at.A
P] 9
Jan
201
7
2 Age Densities Signatures
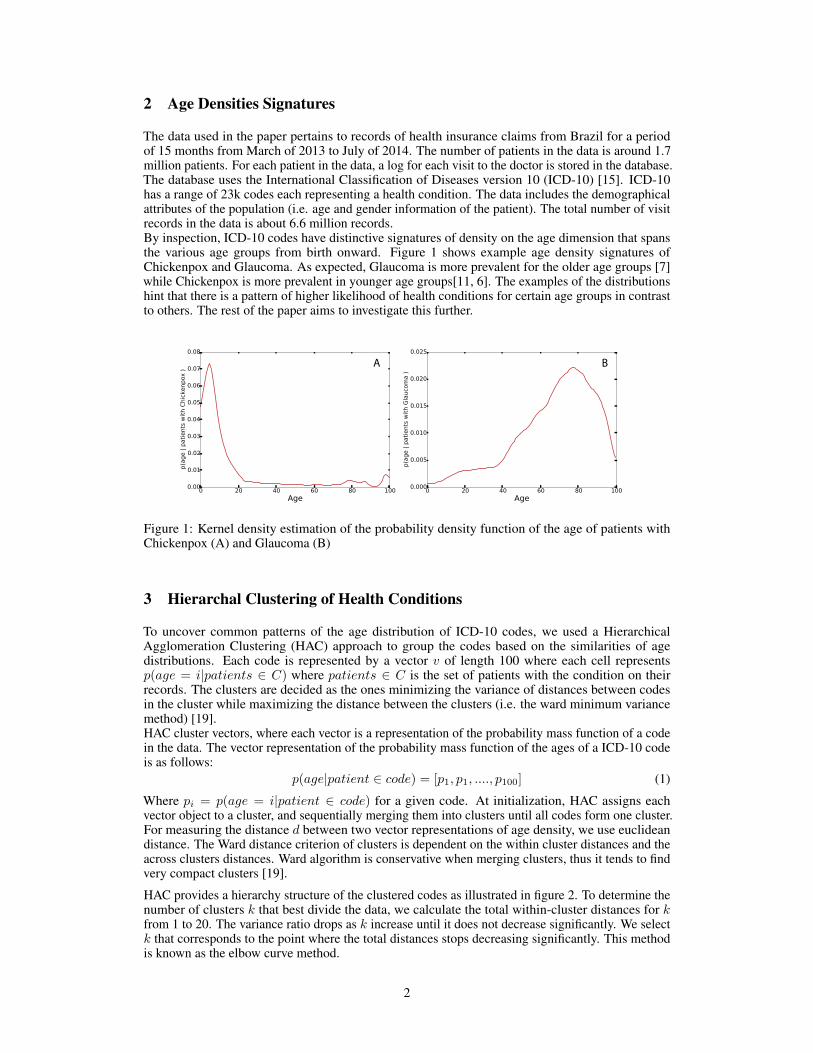
The data used in the paper pertains to records of health insurance claims from Brazil for a periodof 15 months from March of 2013 to July of 2014. The number of patients in the data is around 1.7million patients. For each patient in the data, a log for each visit to the doctor is stored in the database.The database uses the International Classification of Diseases version 10 (ICD-10) [15]. ICD-10has a range of 23k codes each representing a health condition. The data includes the demographicalattributes of the population (i.e. age and gender information of the patient). The total number of visitrecords in the data is about 6.6 million records.By inspection, ICD-10 codes have distinctive signatures of density on the age dimension that spansthe various age groups from birth onward. Figure 1 shows example age density signatures ofChickenpox and Glaucoma. As expected, Glaucoma is more prevalent for the older age groups [7]while Chickenpox is more prevalent in younger age groups[11, 6]. The examples of the distributionshint that there is a pattern of higher likelihood of health conditions for certain age groups in contrastto others. The rest of the paper aims to investigate this further.
A B
Figure 1: Kernel density estimation of the probability density function of the age of patients withChickenpox (A) and Glaucoma (B)
3 Hierarchal Clustering of Health Conditions
To uncover common patterns of the age distribution of ICD-10 codes, we used a HierarchicalAgglomeration Clustering (HAC) approach to group the codes based on the similarities of agedistributions. Each code is represented by a vector v of length 100 where each cell representsp(age = i|patients ∈ C) where patients ∈ C is the set of patients with the condition on theirrecords. The clusters are decided as the ones minimizing the variance of distances between codesin the cluster while maximizing the distance between the clusters (i.e. the ward minimum variancemethod) [19].HAC cluster vectors, where each vector is a representation of the probability mass function of a codein the data. The vector representation of the probability mass function of the ages of a ICD-10 codeis as follows:
p(age|patient ∈ code) = [p1, p1, ...., p100] (1)
Where pi = p(age = i|patient ∈ code) for a given code. At initialization, HAC assigns eachvector object to a cluster, and sequentially merging them into clusters until all codes form one cluster.For measuring the distance d between two vector representations of age density, we use euclideandistance. The Ward distance criterion of clusters is dependent on the within cluster distances and theacross clusters distances. Ward algorithm is conservative when merging clusters, thus it tends to findvery compact clusters [19].
HAC provides a hierarchy structure of the clustered codes as illustrated in figure 2. To determine thenumber of clusters k that best divide the data, we calculate the total within-cluster distances for kfrom 1 to 20. The variance ratio drops as k increase until it does not decrease significantly. We selectk that corresponds to the point where the total distances stops decreasing significantly. This methodis known as the elbow curve method.
2
B C
D E
A
F
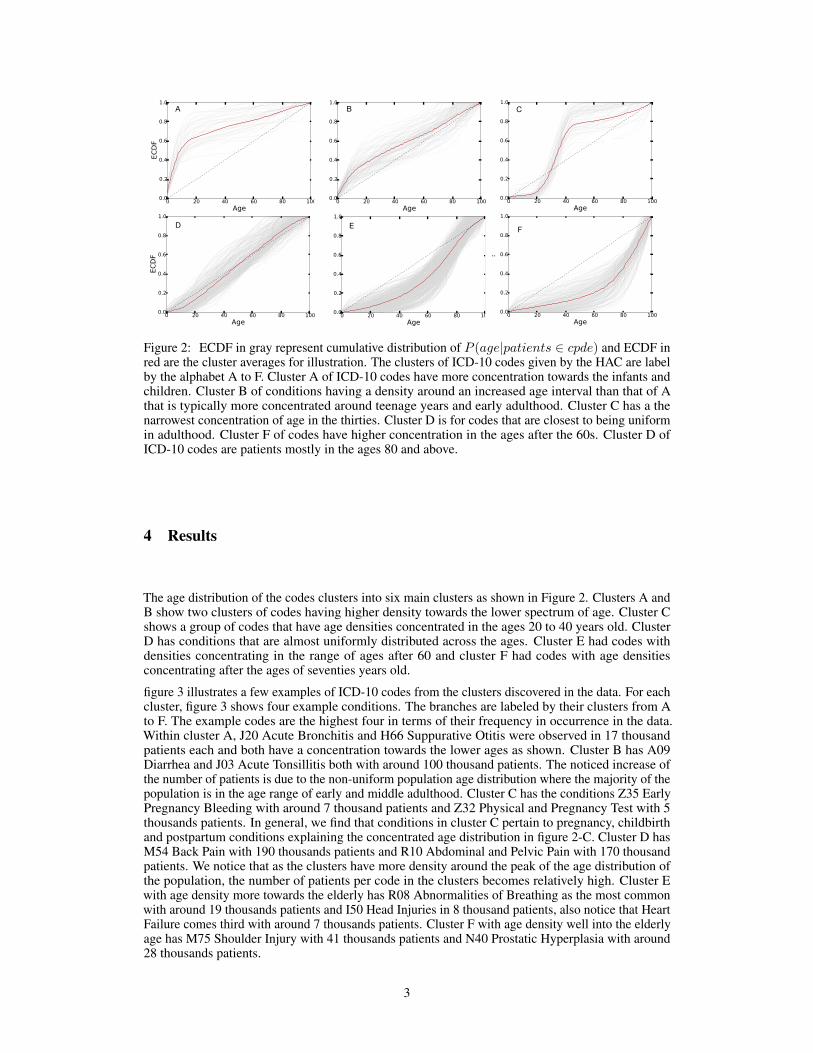
Figure 2: ECDF in gray represent cumulative distribution of P (age|patients ∈ cpde) and ECDF inred are the cluster averages for illustration. The clusters of ICD-10 codes given by the HAC are labelby the alphabet A to F. Cluster A of ICD-10 codes have more concentration towards the infants andchildren. Cluster B of conditions having a density around an increased age interval than that of Athat is typically more concentrated around teenage years and early adulthood. Cluster C has a thenarrowest concentration of age in the thirties. Cluster D is for codes that are closest to being uniformin adulthood. Cluster F of codes have higher concentration in the ages after the 60s. Cluster D ofICD-10 codes are patients mostly in the ages 80 and above.
4 Results
The age distribution of the codes clusters into six main clusters as shown in Figure 2. Clusters A andB show two clusters of codes having higher density towards the lower spectrum of age. Cluster Cshows a group of codes that have age densities concentrated in the ages 20 to 40 years old. ClusterD has conditions that are almost uniformly distributed across the ages. Cluster E had codes withdensities concentrating in the range of ages after 60 and cluster F had codes with age densitiesconcentrating after the ages of seventies years old.
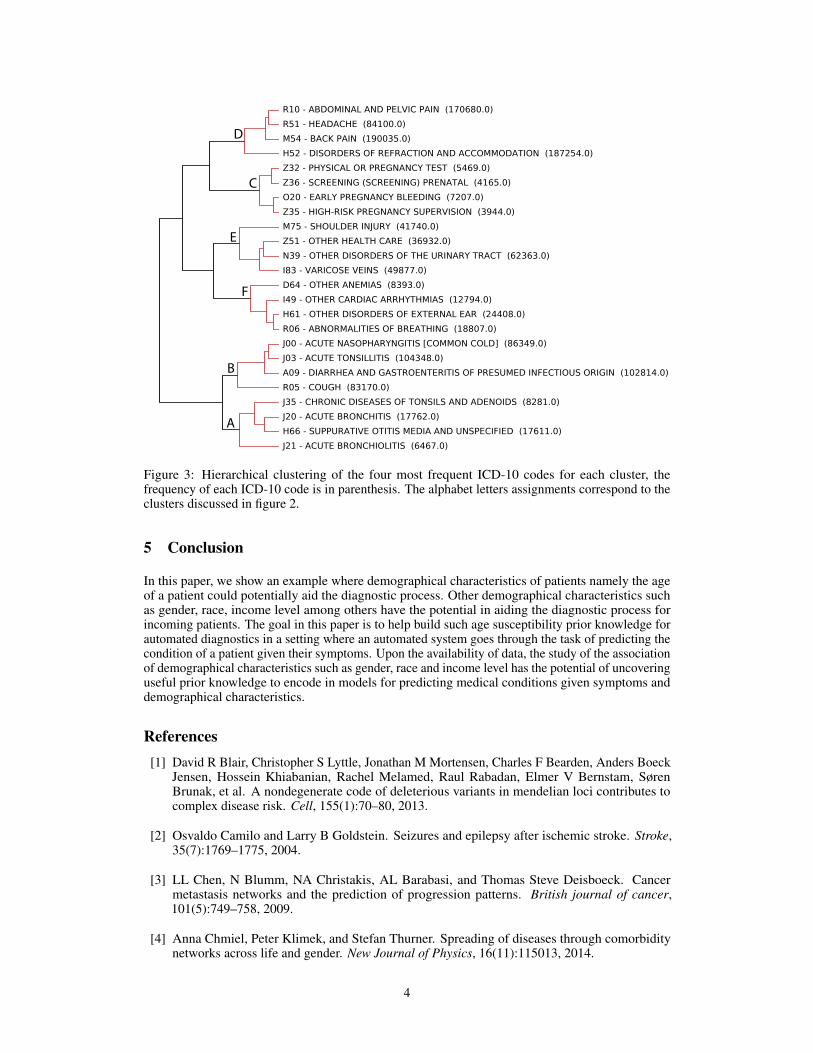
figure 3 illustrates a few examples of ICD-10 codes from the clusters discovered in the data. For eachcluster, figure 3 shows four example conditions. The branches are labeled by their clusters from Ato F. The example codes are the highest four in terms of their frequency in occurrence in the data.Within cluster A, J20 Acute Bronchitis and H66 Suppurative Otitis were observed in 17 thousandpatients each and both have a concentration towards the lower ages as shown. Cluster B has A09Diarrhea and J03 Acute Tonsillitis both with around 100 thousand patients. The noticed increase ofthe number of patients is due to the non-uniform population age distribution where the majority of thepopulation is in the age range of early and middle adulthood. Cluster C has the conditions Z35 EarlyPregnancy Bleeding with around 7 thousand patients and Z32 Physical and Pregnancy Test with 5thousands patients. In general, we find that conditions in cluster C pertain to pregnancy, childbirthand postpartum conditions explaining the concentrated age distribution in figure 2-C. Cluster D hasM54 Back Pain with 190 thousands patients and R10 Abdominal and Pelvic Pain with 170 thousandpatients. We notice that as the clusters have more density around the peak of the age distribution ofthe population, the number of patients per code in the clusters becomes relatively high. Cluster Ewith age density more towards the elderly has R08 Abnormalities of Breathing as the most commonwith around 19 thousands patients and I50 Head Injuries in 8 thousand patients, also notice that HeartFailure comes third with around 7 thousands patients. Cluster F with age density well into the elderlyage has M75 Shoulder Injury with 41 thousands patients and N40 Prostatic Hyperplasia with around28 thousands patients.
3
A
B
F
E
C
D
Figure 3: Hierarchical clustering of the four most frequent ICD-10 codes for each cluster, thefrequency of each ICD-10 code is in parenthesis. The alphabet letters assignments correspond to theclusters discussed in figure 2.
5 Conclusion
In this paper, we show an example where demographical characteristics of patients namely the ageof a patient could potentially aid the diagnostic process. Other demographical characteristics suchas gender, race, income level among others have the potential in aiding the diagnostic process forincoming patients. The goal in this paper is to help build such age susceptibility prior knowledge forautomated diagnostics in a setting where an automated system goes through the task of predicting thecondition of a patient given their symptoms. Upon the availability of data, the study of the associationof demographical characteristics such as gender, race and income level has the potential of uncoveringuseful prior knowledge to encode in models for predicting medical conditions given symptoms anddemographical characteristics.
References[1] David R Blair, Christopher S Lyttle, Jonathan M Mortensen, Charles F Bearden, Anders Boeck
Jensen, Hossein Khiabanian, Rachel Melamed, Raul Rabadan, Elmer V Bernstam, SørenBrunak, et al. A nondegenerate code of deleterious variants in mendelian loci contributes tocomplex disease risk. Cell, 155(1):70–80, 2013.
[2] Osvaldo Camilo and Larry B Goldstein. Seizures and epilepsy after ischemic stroke. Stroke,35(7):1769–1775, 2004.
[3] LL Chen, N Blumm, NA Christakis, AL Barabasi, and Thomas Steve Deisboeck. Cancermetastasis networks and the prediction of progression patterns. British journal of cancer,101(5):749–758, 2009.
[4] Anna Chmiel, Peter Klimek, and Stefan Thurner. Spreading of diseases through comorbiditynetworks across life and gender. New Journal of Physics, 16(11):115013, 2014.
4
[5] Joseph Finkelstein, Eunme Cha, and Steven M Scharf. Chronic obstructive pulmonary diseaseas an independent risk factor for cardiovascular morbidity. International journal of chronicobstructive pulmonary disease, 4:337, 2009.
[6] Centers for Disease Control, Prevention, et al. Epidemiology and prevention of vaccine-preventable diseases. Washington DC: Public Health Foundation, 12, 2011.
[7] Centers for Disease Control, Prevention, et al. The state of vision, aging, and public health inamerica. Atlanta: US Department of Health and Human Services, 2011.
[8] César A Hidalgo, Nicholas Blumm, Albert-László Barabási, and Nicholas A Christakis. A dy-namic network approach for the study of human phenotypes. PLoS Comput Biol, 5(4):e1000353,2009.
[9] Anders Boeck Jensen, Pope L Moseley, Tudor I Oprea, Sabrina Gade Ellesøe, Robert Eriksson,Henriette Schmock, Peter Bjødstrup Jensen, Lars Juhl Jensen, and Søren Brunak. Temporaldisease trajectories condensed from population-wide registry data covering 6.2 million patients.Nature communications, 5, 2014.
[10] Peter B Jensen, Lars J Jensen, and Søren Brunak. Mining electronic health records: towardsbetter research applications and clinical care. Nature Reviews Genetics, 13(6):395–405, 2012.
[11] Robert Kliegman, Richard E Behrman, Waldo E Nelson, et al. Nelson textbook of pediatrics,2016.
[12] Scott A Murray, Marilyn Kendall, Kirsty Boyd, and Aziz Sheikh. Illness trajectories andpalliative care. Int Perspect Public Health Palliat Care, 30:2017–19, 2012.
[13] Fliss EM Murtagh, Emma Murphy, and Neil S Sheerin. Illness trajectories: an important conceptin the management of kidney failure. Nephrology Dialysis Transplantation, 23(12):3746–3748,2008.
[14] Fliss EM Murtagh, Neil S Sheerin, Julia Addington-Hall, and Irene J Higginson. Trajectories ofillness in stage 5 chronic kidney disease: a longitudinal study of patient symptoms and concernsin the last year of life. Clinical Journal of the American Society of Nephrology, 6(7):1580–1590,2011.
[15] World Health Organization et al. International statistical classification of diseases and healthrelated problems (The) ICD-10. PhD thesis, World Health Organization, 2004.
[16] Hans Petri, Debra Maldonato, and Noah Jamie Robinson. Data-driven identification of co-morbidities associated with rheumatoid arthritis in a large us health plan claims database. BMCmusculoskeletal disorders, 11(1):1, 2010.
[17] Francisco S Roque, Peter B Jensen, Henriette Schmock, Marlene Dalgaard, Massimo Andreatta,Thomas Hansen, Karen Søeby, Søren Bredkjær, Anders Juul, Thomas Werge, et al. Usingelectronic patient records to discover disease correlations and stratify patient cohorts. PLoSComput Biol, 7(8):e1002141, 2011.
[18] Joan M Teno, Sherry Weitzen, Mary L Fennell, and Vincent Mor. Dying trajectory in thelast year of life: does cancer trajectory fit other diseases? Journal of palliative medicine,4(4):457–464, 2001.
[19] Joe H Ward Jr. Hierarchical grouping to optimize an objective function. Journal of the Americanstatistical association, 58(301):236–244, 1963.
5


![Predictive Subnetwork Extraction with Structural Priors ...hamarneh/ecopy/miccai2016b.pdf · Predictive Subnetwork Extraction with Structural Priors for Infant Connectomes ... [4,6]](https://img.pdfslide.us/doc/110x75/5af11d8d7f8b9a8b4c8e5910/predictive-subnetwork-extraction-with-structural-priors-hamarnehecopy-subnetwork.jpg)