Embed Size (px)
Citation preview
Prepared by the Community Service Council of Greater Tulsa
Presented to Tulsa Area United WayCommunity Investments Volunteers
Community Profile 2006Okmulgee County
Prepared for The Tulsa Area United WayCommunity Investments Process
By The Community Service Council of Greater Tulsa
Prepared by the Community Service Council of Greater Tulsa
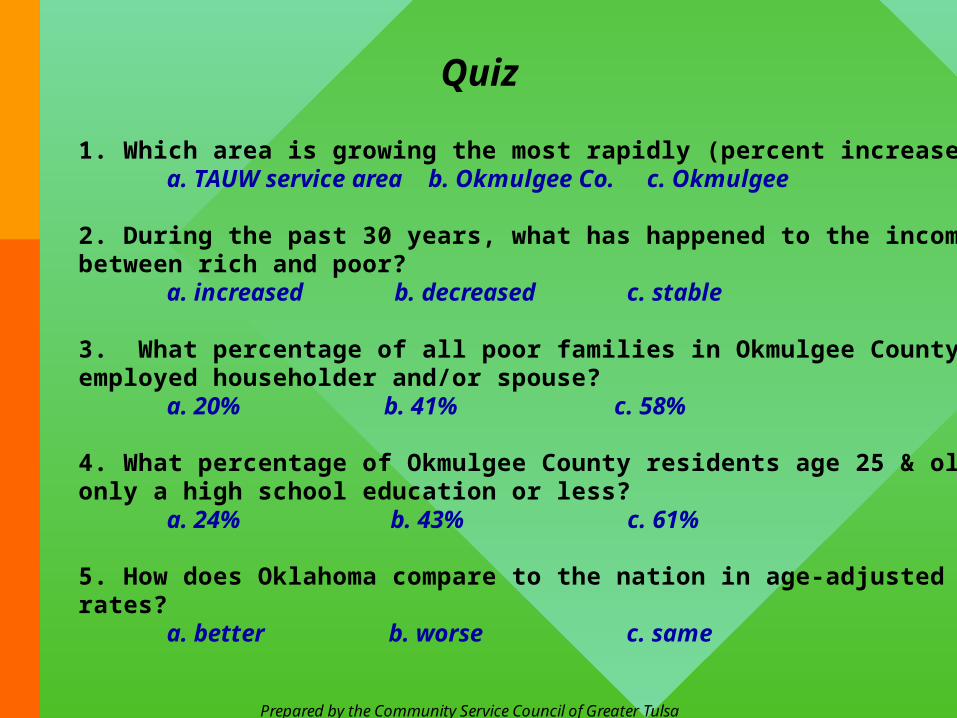
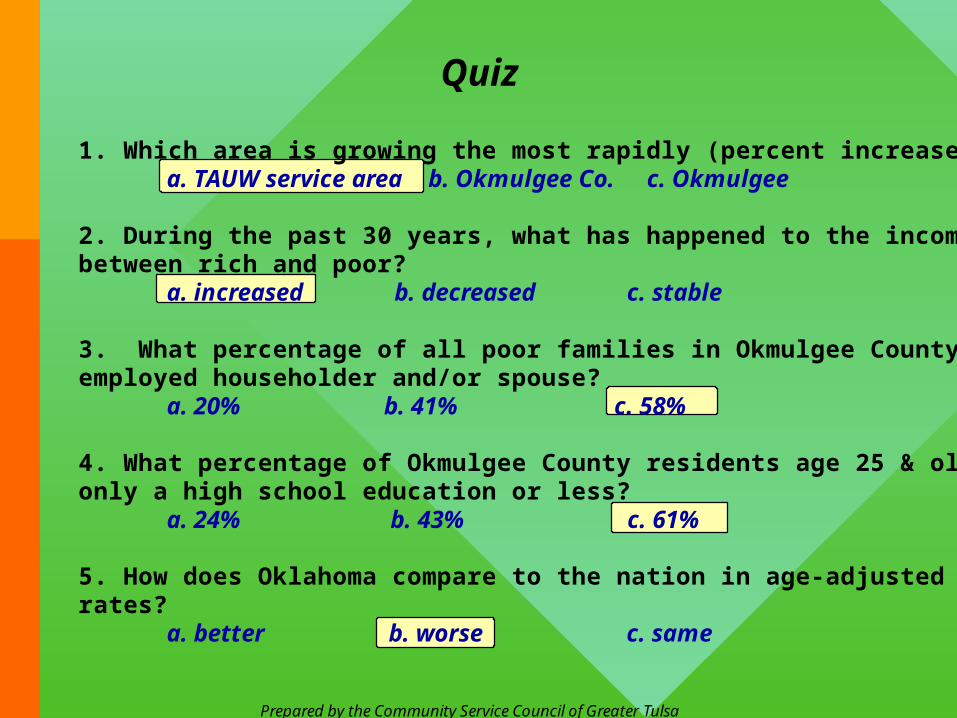
Quiz
1. Which area is growing the most rapidly (percent increase)? a. TAUW service area b. Okmulgee Co. c. Okmulgee
2. During the past 30 years, what has happened to the income gap between rich and poor?
a. increased b. decreased c. stable
3. What percentage of all poor families in Okmulgee County have an employed householder and/or spouse?
a. 20% b. 41% c. 58%
4. What percentage of Okmulgee County residents age 25 & older have only a high school education or less?
a. 24% b. 43% c. 61%
5. How does Oklahoma compare to the nation in age-adjusted deaths rates?
a. better b. worse c. same
Prepared by the Community Service Council of Greater Tulsa
Community Profile 2006
Demographic TrendsHuman DevelopmentPanel TopicsBest Practices
����
Prepared by the Community Service Council of Greater Tulsa
Demographic Trends
Population growthAgeRace and Hispanic originLiving arrangementsMedian family incomeResidential mobility
>>>>>>
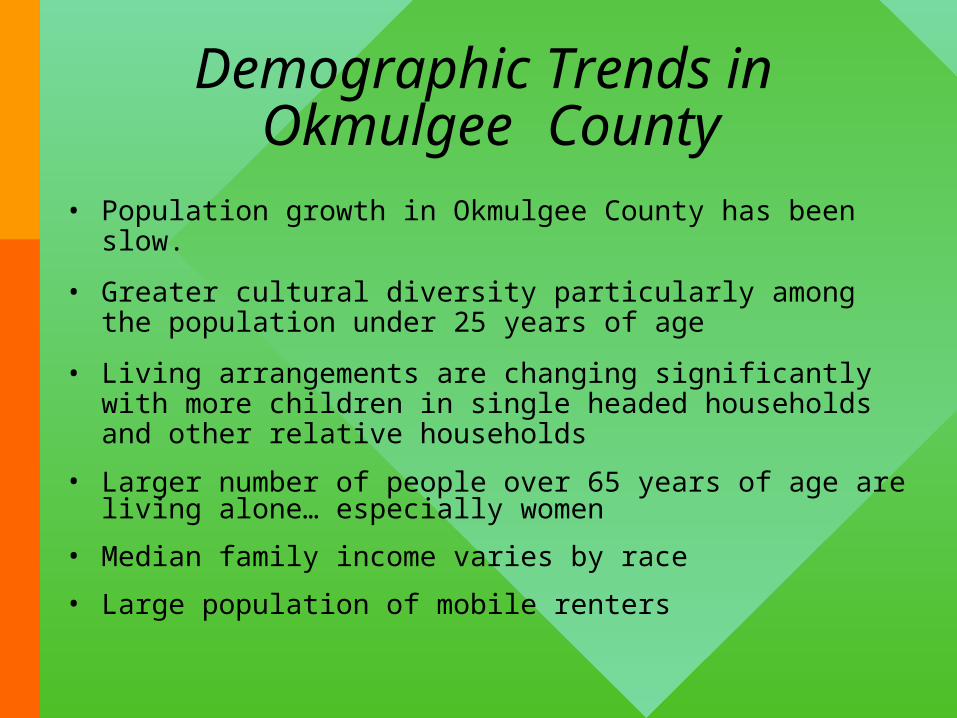
Demographic Trends in Okmulgee County
• Population growth in Okmulgee County has been slow.
• Greater cultural diversity particularly among the population under 25 years of age
• Living arrangements are changing significantly with more children in single headed households and other relative households
• Larger number of people over 65 years of age are living alone… especially women
• Median family income varies by race
• Large population of mobile renters
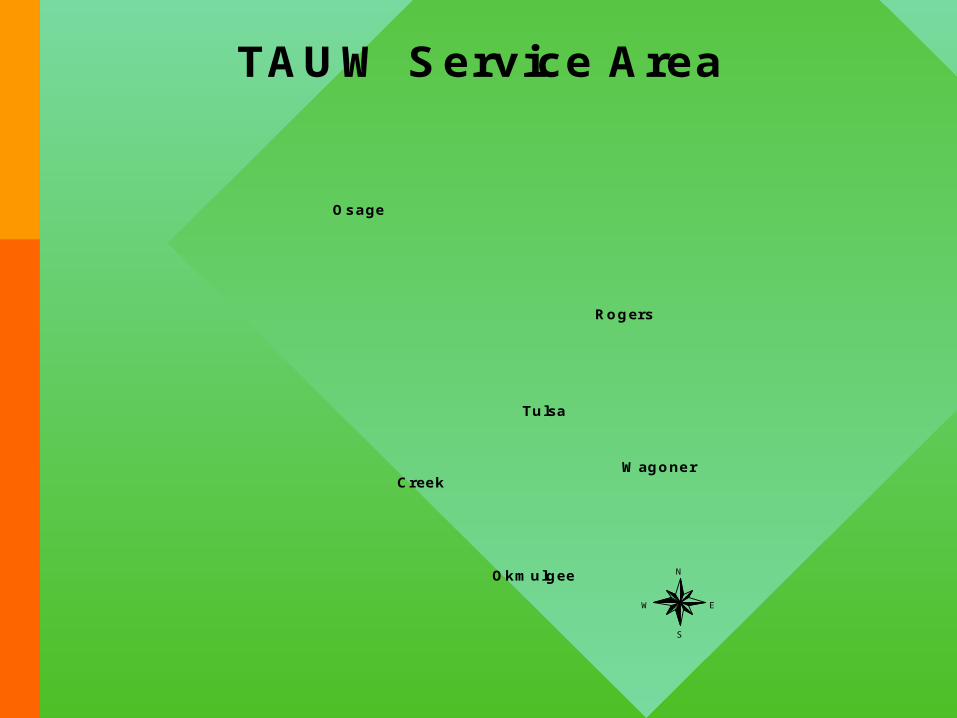
Osage
Creek
Tulsa
Rogers
Okmulgee
Wagoner
N
EW
S
TAUW Service Area
Prepared by the Community Service Council of Greater Tulsa
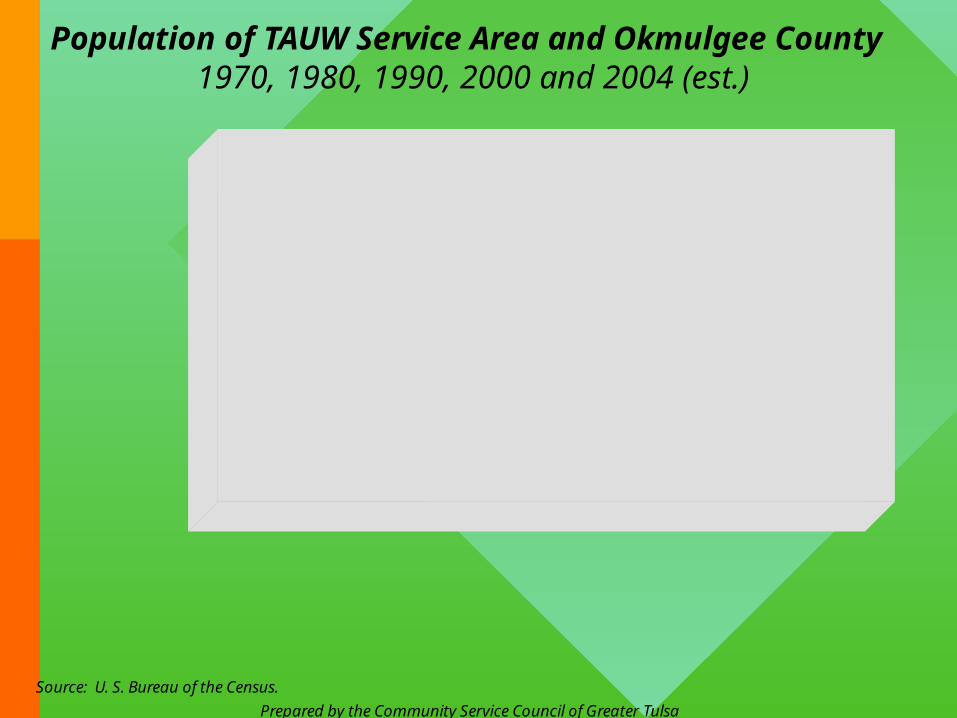
Population of TAUW Service Area and Okmulgee County1970, 1980, 1990, 2000 and 2004 (est.)
Source: U. S. Bureau of the Census.
1970 1980 1990 2000 2004(est.)
0
100,000
200,000
300,000
400,000
500,000
600,000
700,000
800,000
900,000
1,000,000Okmulgee Co.
TAUW
Okmulgee Co. 35,358 39,169 36,490 39,685 39,890
TAUW 561,210 696,342 745,444 842,920 864,981
TAUW service area’s population increased 3% between 2000 and 2004, while that of Okmulgee County grew only about 1%.
Prepared by the Community Service Council of Greater Tulsa
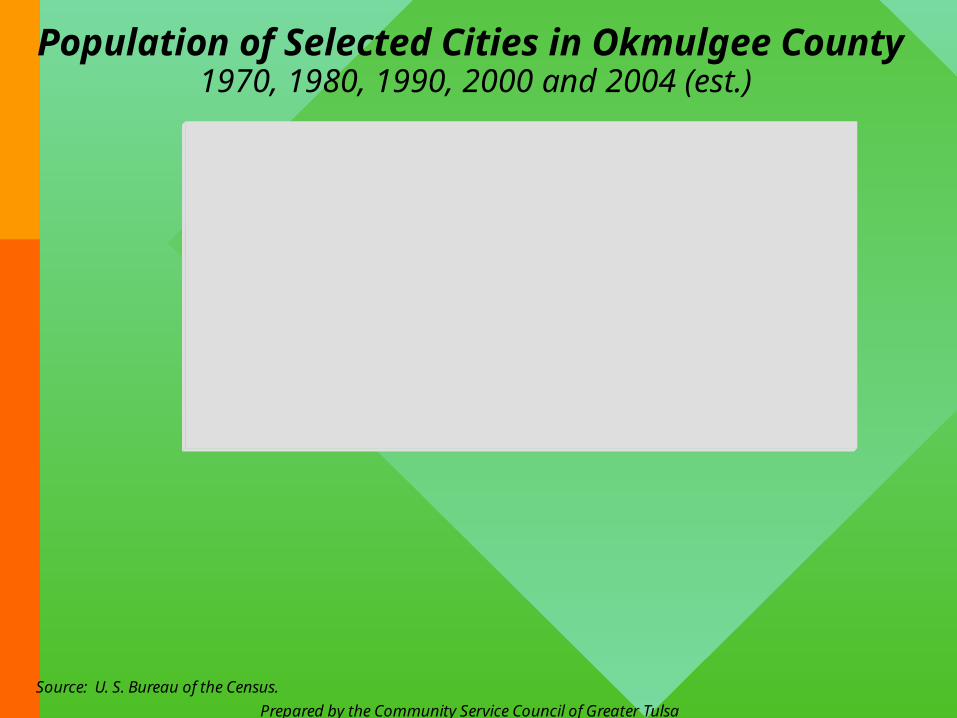
Population of Selected Cities in Okmulgee County1970, 1980, 1990, 2000 and 2004 (est.)
Source: U. S. Bureau of the Census.
Okmulgee
Henryetta
Morris
Beggs
0 5,000 10,000 15,000 20,000
1970
1980
1990
2000
2004 (est.)
Okmulgee Henryetta Morris Beggs
1970 15,180 6,430 1,119 1,107
1980 16,263 6,432 1,288 1,428
1990 13,441 5,872 1,216 1,150
2000 13,022 6,096 1,294 1,364
2004 (est.) 12,850 6,080 1,330 1,380
Most places in Okmulgee County either lost population or experienced very slight growth between 2000 and 2004.
Prepared by the Community Service Council of Greater Tulsa
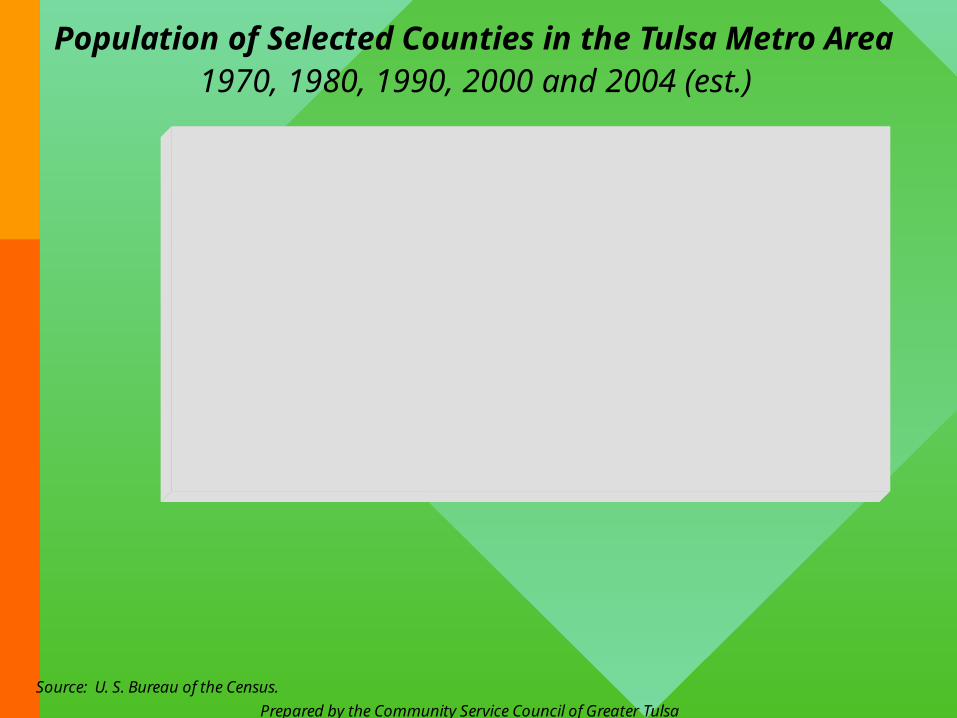
Population of Selected Counties in the Tulsa Metro Area1970, 1980, 1990, 2000 and 2004 (est.)
Source: U. S. Bureau of the Census.
Creek Co. Okmulgee Co. Osage Co. Rogers Co. Wagoner Co.0
20,000
40,000
60,000
80,000
100,000 1970 1980 1990 2000 2004 (est.)
1970 45,532 35,358 29,750 28,425 22,163
1980 59,016 39,169 39,327 46,436 41,801
1990 60,915 36,490 41,645 55,170 47,883
2000 67,367 39,685 44,437 70,641 57,491
2004 (est.) 68,666 39,890 45,181 79,042 63,054
Prepared by the Community Service Council of Greater Tulsa
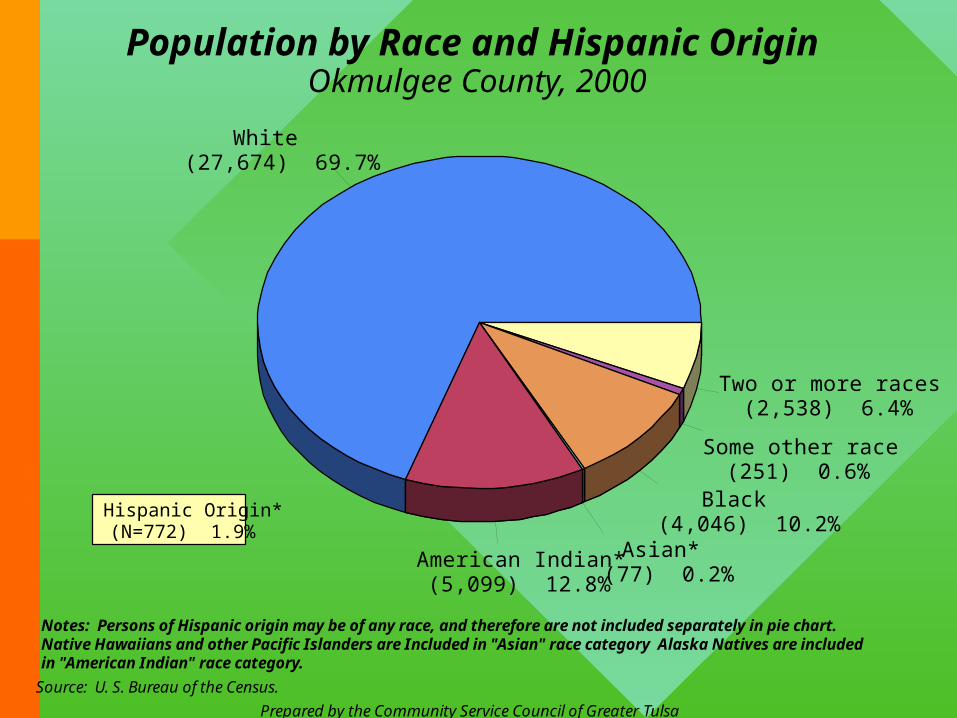
Population by Race and Hispanic OriginOkmulgee County, 2000
Source: U. S. Bureau of the Census.
White(27,674) 69.7%
American Indian*(5,099) 12.8%
Asian*(77) 0.2%
Black(4,046) 10.2%
Some other race(251) 0.6%
Two or more races(2,538) 6.4%
Notes: Persons of Hispanic origin may be of any race, and therefore are not included separately in pie chart. Native Hawaiians and other Pacific Islanders are Included in "Asian" race category Alaska Natives are included in "American Indian" race category.
Hispanic Origin*(N=772) 1.9%
Prepared by the Community Service Council of Greater Tulsa
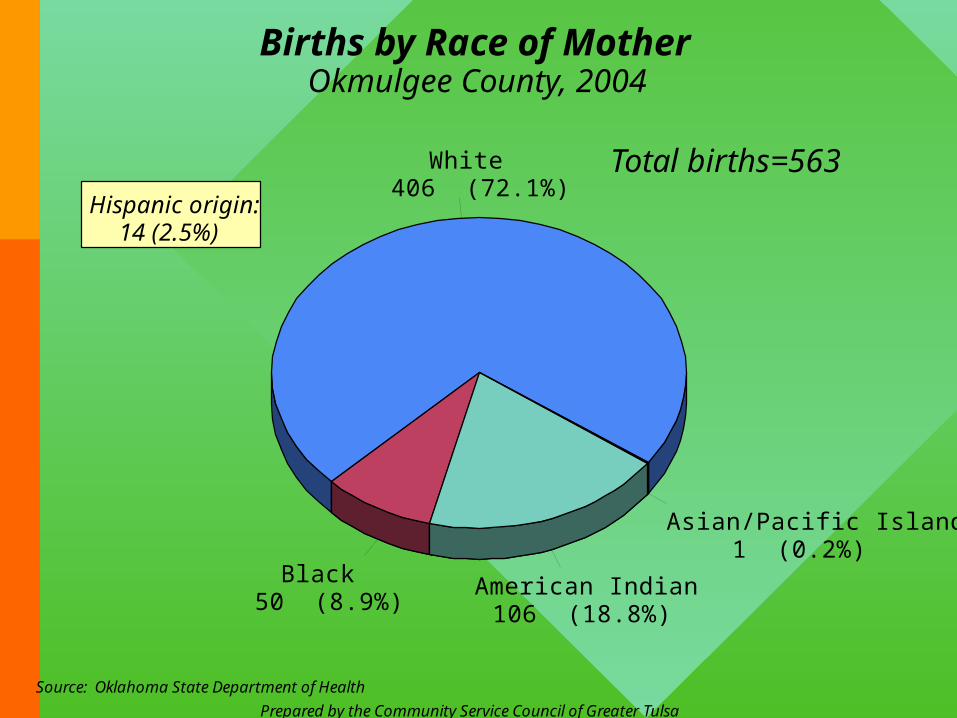
Births by Race of MotherOkmulgee County, 2004
Source: Oklahoma State Department of Health
White406 (72.1%)
Black50 (8.9%)
American Indian106 (18.8%)
Asian/Pacific Islander1 (0.2%)
Total births=563Hispanic origin:
14 (2.5%)
Prepared by the Community Service Council of Greater Tulsa
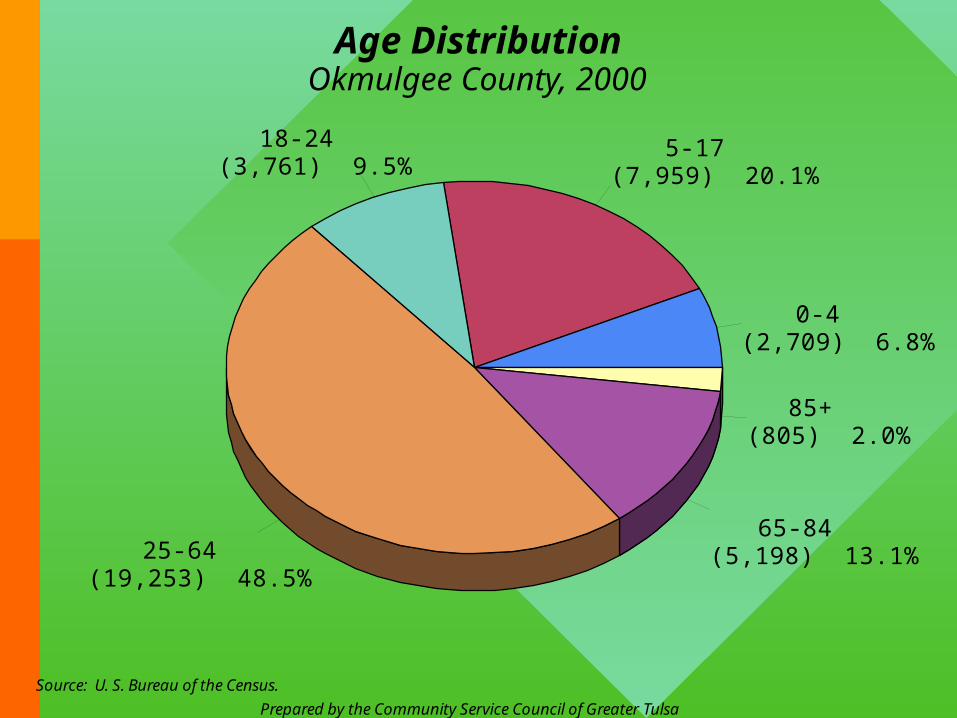
Age DistributionOkmulgee County, 2000
Source: U. S. Bureau of the Census.
0-4(2,709) 6.8%
5-17(7,959) 20.1%
18-24(3,761) 9.5%
25-64(19,253) 48.5%
65-84(5,198) 13.1%
85+(805) 2.0%
Prepared by the Community Service Council of Greater Tulsa
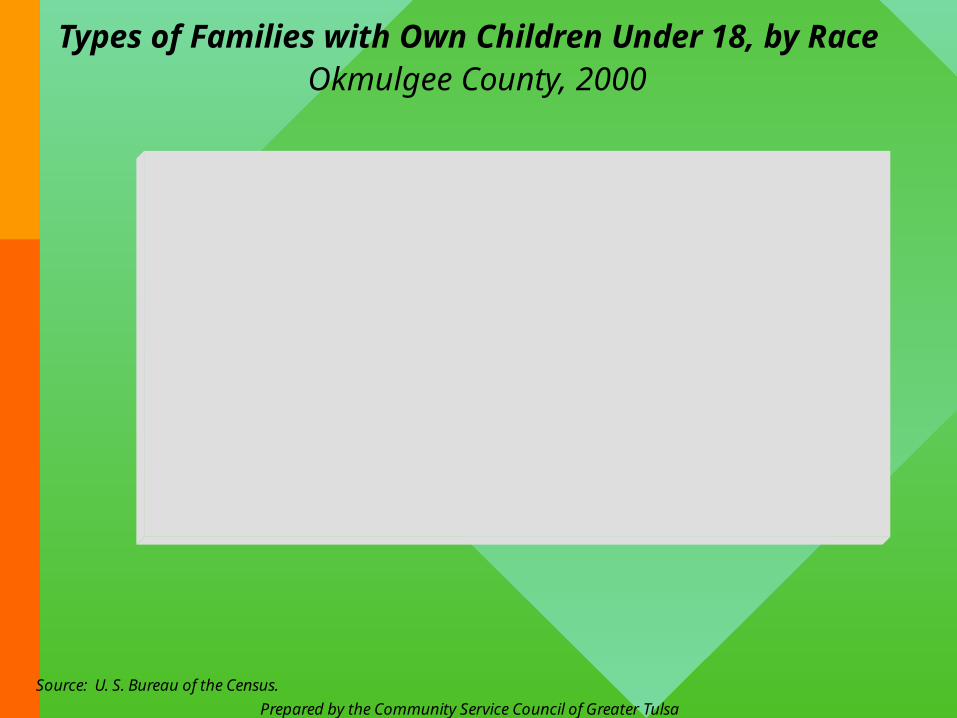
Types of Families with Own Children Under 18, by RaceOkmulgee County, 2000
Source: U. S. Bureau of the Census.
74.6%
45.3%
62.6%
87.5%
63.3%
6.8%4.4%
10.1%
0%
7.8%
18.6%
50.3%
27.3%
12.5%
28.9%
White Black American Indian Asian Hispanic0%
20%
40%
60%
80%
100%Percent of families within each race
Married Couple Male-headed Female-headed
Note: "Own Children" refers to children (including step and adopted) of the householder in a family.
Prepared by the Community Service Council of Greater Tulsa
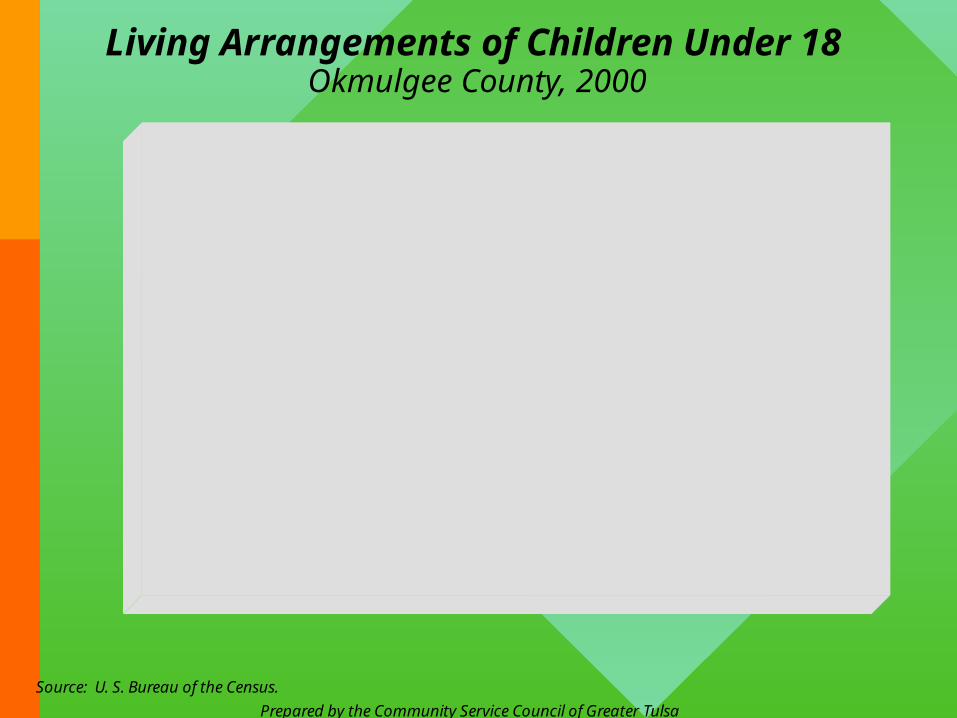
Living Arrangements of Children Under 18Okmulgee County, 2000
Source: U. S. Bureau of the Census.
61.6%
5.3%
19.3%
11.3%
Married Couple Male-headed Female-headed Other relatives0%
10%
20%
30%
40%
50%
60%
70%
Prepared by the Community Service Council of Greater Tulsa
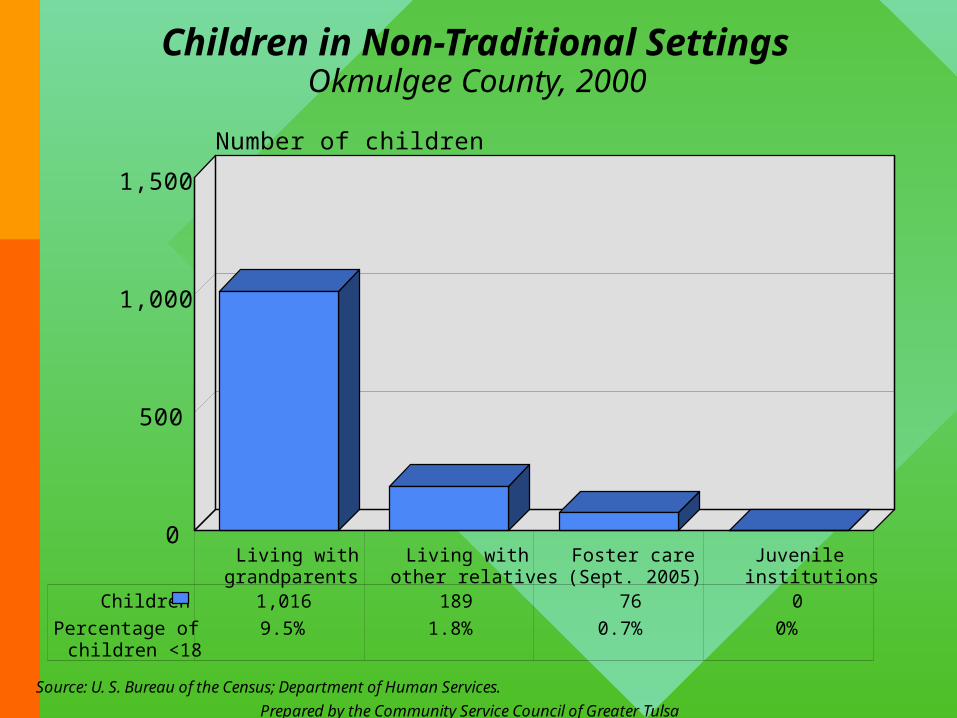
Children in Non-Traditional SettingsOkmulgee County, 2000
Source: U. S. Bureau of the Census; Department of Human Services.
Living withgrandparents
Living withother relatives
Foster care(Sept. 2005)
Juvenileinstitutions
0
500
1,000
1,500
Number of children
Children 1,016 189 76 0
Percentage ofchildren <18
9.5% 1.8% 0.7% 0%
Prepared by the Community Service Council of Greater Tulsa
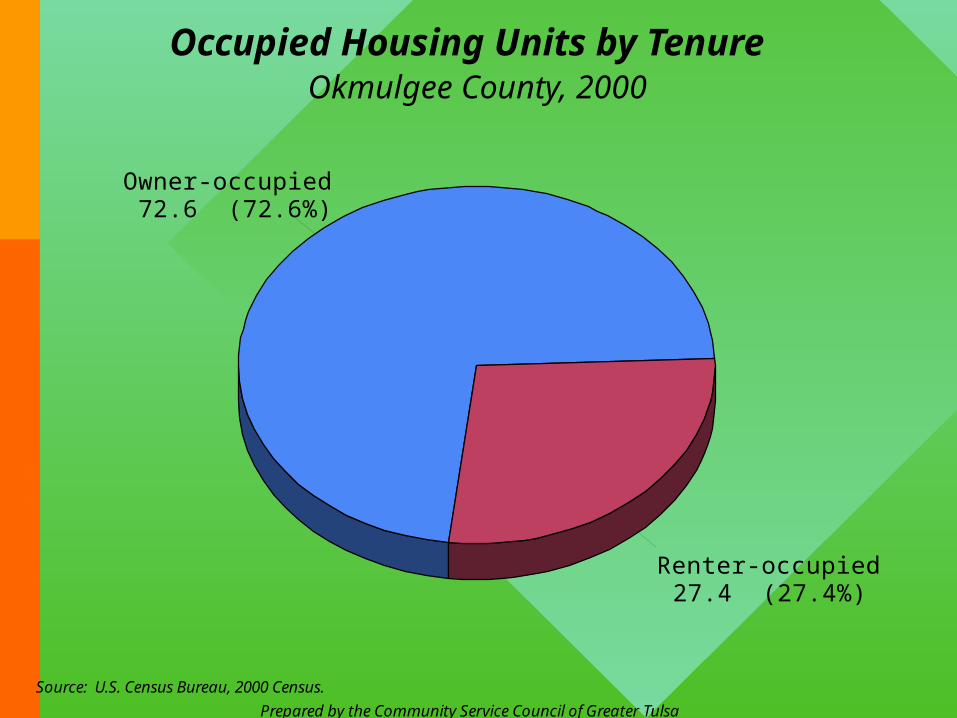
Occupied Housing Units by TenureOkmulgee County, 2000
Source: U.S. Census Bureau, 2000 Census.
Owner-occupied72.6 (72.6%)
Renter-occupied27.4 (27.4%)
Prepared by the Community Service Council of Greater Tulsa
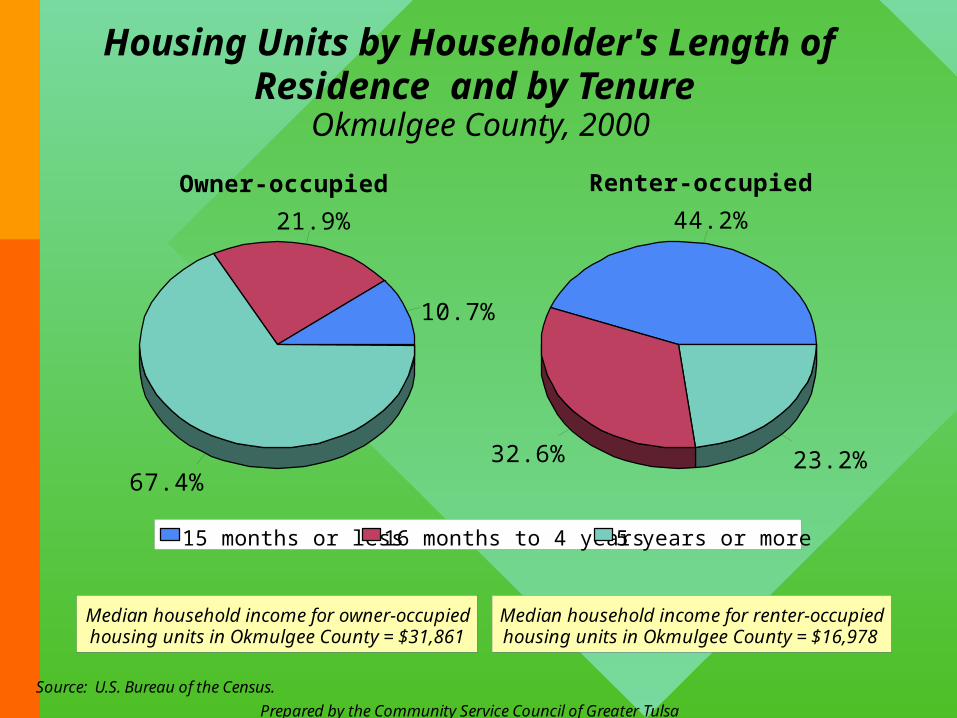
Housing Units by Householder's Length of Residence and by Tenure
Okmulgee County, 2000
Source: U.S. Bureau of the Census.
10.7%
21.9%
67.4%
44.2%
32.6% 23.2%
15 months or less 16 months to 4 years 5 years or more
Owner-occupied Renter-occupied
Median household income for owner-occupied housing units in Okmulgee County = $31,861
Median household income for renter-occupied housing units in Okmulgee County = $16,978
Prepared by the Community Service Council of Greater Tulsa
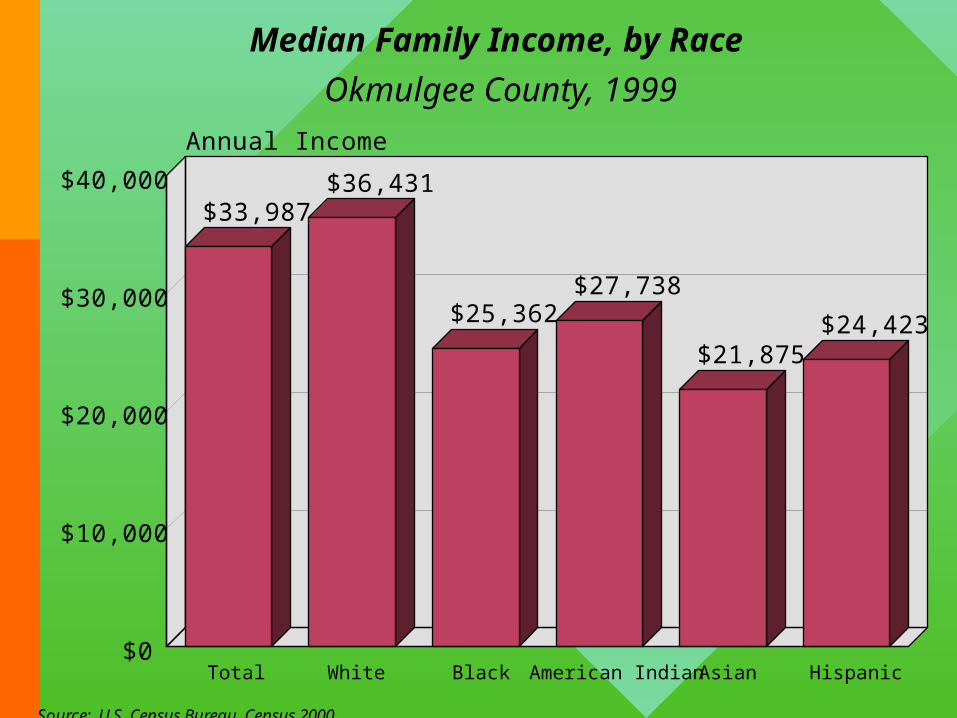
Median Family Income, by Race
Okmulgee County, 1999
Source: U.S. Census Bureau, Census 2000.
$33,987$36,431
$25,362$27,738
$21,875$24,423
Total White Black American Indian Asian Hispanic$0
$10,000
$20,000
$30,000
$40,000
Annual Income
Prepared by the Community Service Council of Greater Tulsa
Human Development
Prepared by the Community Service Council of Greater Tulsa
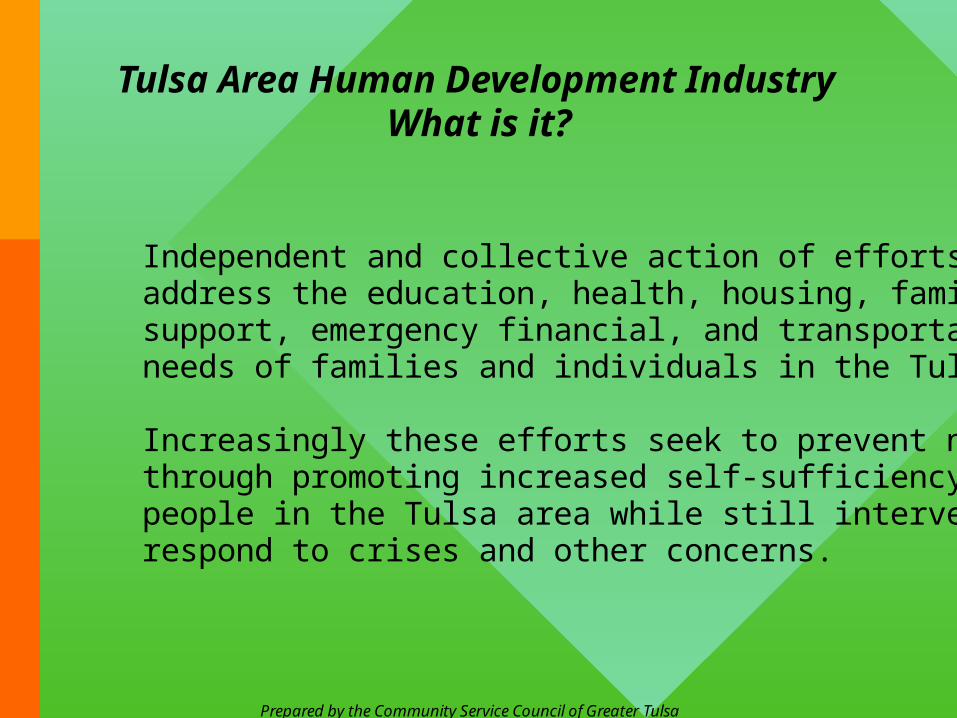
Tulsa Area Human Development Industry What is it?
Independent and collective action of efforts to address the education, health, housing, family support, emergency financial, and transportation needs of families and individuals in the Tulsa area.
Increasingly these efforts seek to prevent needs through promoting increased self-sufficiency among people in the Tulsa area while still intervening to respond to crises and other concerns.
�
�
Prepared by the Community Service Council of Greater Tulsa
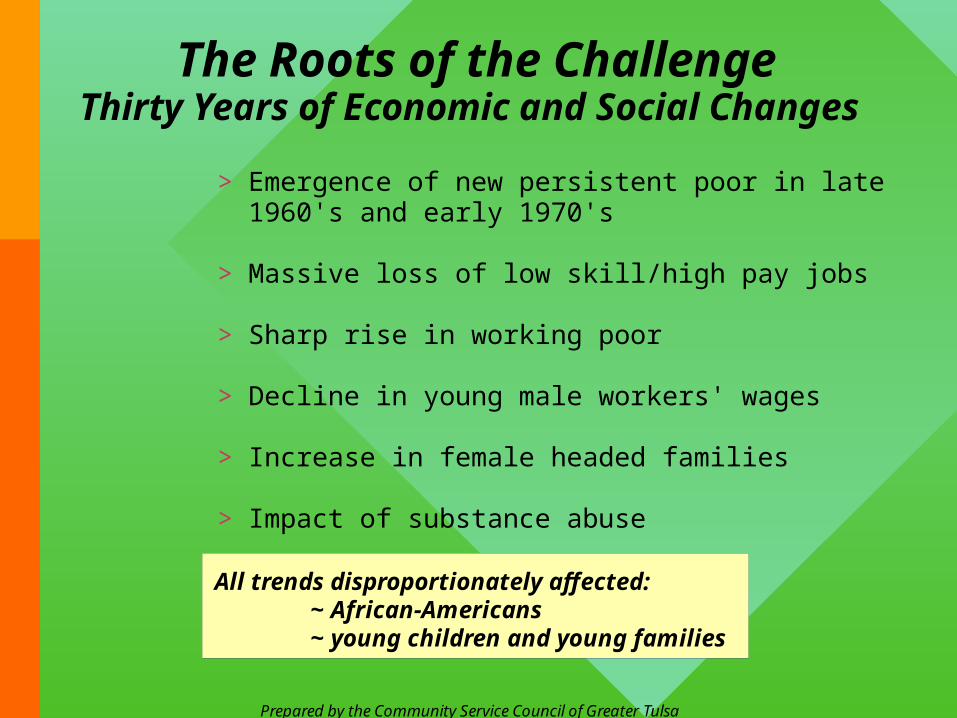
The Roots of the Challenge Thirty Years of Economic and Social Changes
Emergence of new persistent poor in late 1960's and early 1970's
Massive loss of low skill/high pay jobs
Sharp rise in working poor
Decline in young male workers' wages
Increase in female headed families
Impact of substance abuse
>
>
>
>
>
>
All trends disproportionately affected:~ African-Americans~ young children and young families

Human Development: Key Points
• Middle class is disappearing
• Many households lack adequate income
• Stress of inadequate income and related conditions is widespread
• Starting life in Okmulgee County for many is risky business
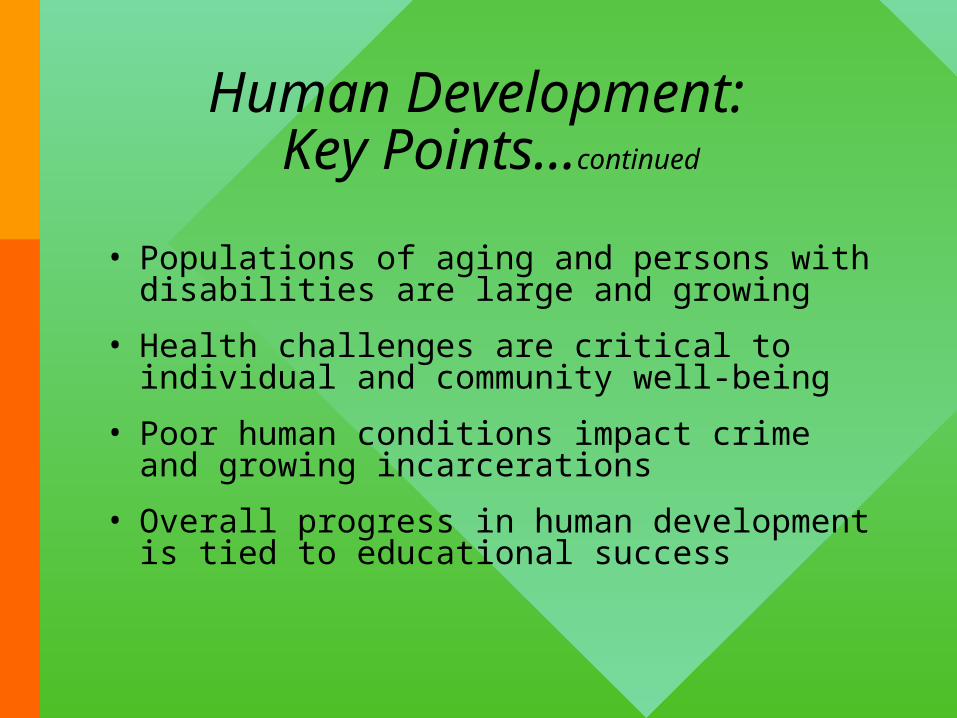
Human Development: Key Points…continued
• Populations of aging and persons with disabilities are large and growing
• Health challenges are critical to individual and community well-being
• Poor human conditions impact crime and growing incarcerations
• Overall progress in human development is tied to educational success
The Middle Class is Disappearing
~Lower income groups greatly expand, middle shrinks,
highest income group increases dramatically

Prepared by the Community Service Council of Greater Tulsa
Source: Hodgkinson, Harold, "The Client," Education Demographer, 1988.
1900 - 1940 1940 - 1990 1990 - ?0%
20%
40%
60%
80%
100%
Poor - 75%
Poor - 20%Poor - 10%
Rich - 20%
Middle - 60%
Rich - 5% Rich - 10%
Middle - 20%
Middle - 80%
The trend: housing patterns and income mirror the job structure, with more rich, more poor, and fewer in the middle -- the "hourglass effect"
The Overall Dominant Trend...The Shrinking Middle Class
Prepared by the Community Service Council of Greater Tulsa
Source: U.S. Census Bureau, 2000 Census.
Distribution of Wealth: Household IncomeU.S., Oklahoma, TAUW Service Area, Okmulgee County, 1999
47.4%58.4% 52.7%
66.9%
40.3%
35%38.6%
29.6%
12.3% 6.6% 8.7% 3.5%
U.S. Oklahoma TAUW Okmulgee Co.0%
20%
40%
60%
80%
100%
<$40,000/year
$40,000-$99,999/year
$100,000+/year
1% of U.S. households have
39.3% of the assets, making the U.S. the #1 country in the
world in inequality of income.
Prepared by the Community Service Council of Greater Tulsa
Income disparity between rich and poor grows wider beyond 1993
Mean Family Income by Quintile and Top 5% (2003 dollars)United States, 1966-2003
Source: Economic Policy Institute website.
1966
1968
1970
1972
1974
1976
1978
1980
1982
1984
1986
1988
1990
1992
1994
1996
1998
2000
2002
$0
$50,000
$100,000
$150,000
$200,000
$250,000
$300,000
Real hourly wage (2003 dollars)
Lowest Second Middle Fourth Highest Top 5%
Many Households Lack Adequate Income
~More and more households lack adequate income to meet living needs
Prepared by the Community Service Council of Greater Tulsa
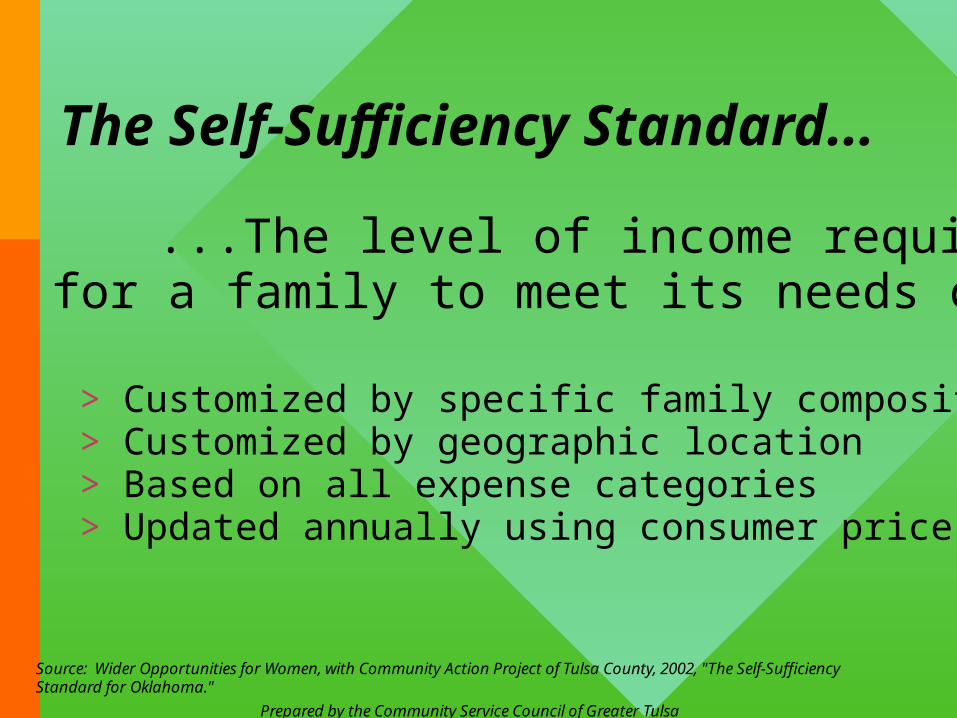
The Self-Sufficiency Standard...
...The level of income requiredfor a family to meet its needs on its own.
Source: Wider Opportunities for Women, with Community Action Project of Tulsa County, 2002, "The Self-Sufficiency Standard for Oklahoma."
Customized by specific family compositionCustomized by geographic locationBased on all expense categoriesUpdated annually using consumer price index
>>>>
Prepared by the Community Service Council of Greater Tulsa
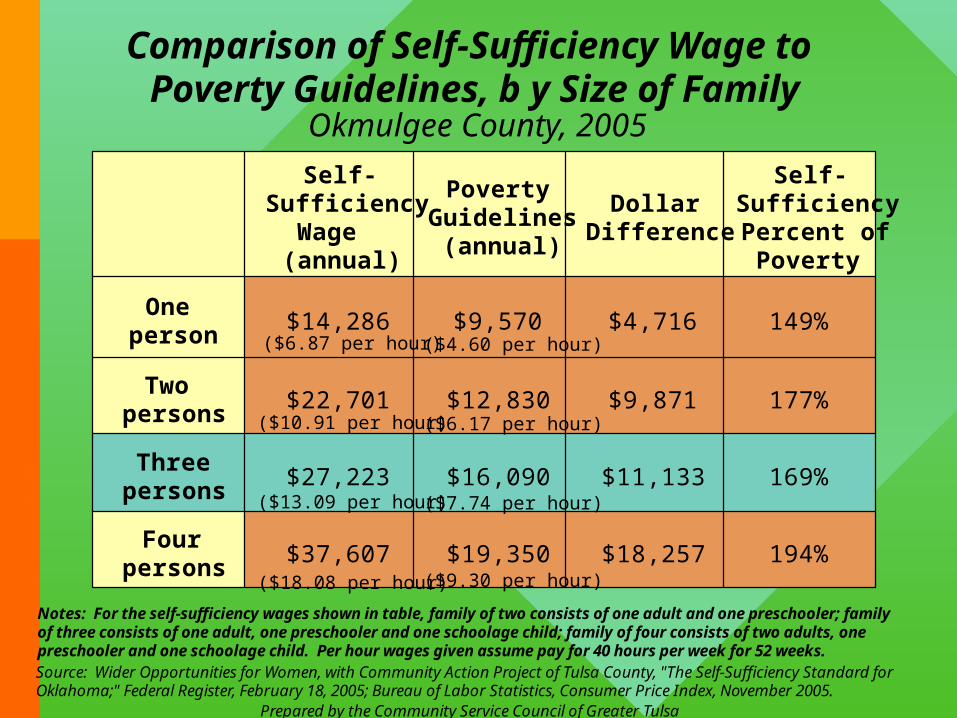
Self-Sufficiency
Wage(annual)
Poverty Guidelines
(annual)
Dollar Difference
Self-SufficiencyPercent of
Poverty
One person
$14,286 $9,570 $4,716 149%
Two persons
$22,701 $12,830 $9,871 177%
Three persons
$27,223 $16,090 $11,133 169%
Four persons
$37,607 $19,350 $18,257 194%
Comparison of Self-Sufficiency Wage to Poverty Guidelines, by Size of Family
Okmulgee County, 2005
Source: Wider Opportunities for Women, with Community Action Project of Tulsa County, "The Self-Sufficiency Standard for Oklahoma;" Federal Register, February 18, 2005; Bureau of Labor Statistics, Consumer Price Index, November 2005.
($6.87 per hour)
($10.91 per hour)
($13.09 per hour)
($18.08 per hour)
Notes: For the self-sufficiency wages shown in table, family of two consists of one adult and one preschooler; family of three consists of one adult, one preschooler and one schoolage child; family of four consists of two adults, one preschooler and one schoolage child. Per hour wages given assume pay for 40 hours per week for 52 weeks.
($4.60 per hour)
($6.17 per hour)
($7.74 per hour)
($9.30 per hour)
Prepared by the Community Service Council of Greater Tulsa
Family of Three, Okmulgee County, 2005
Source: Wider Opportunities for Women, with Community Action Project of Tulsa Tulsa County, "The Self-Sufficiency Standard for Oklahoma;" Federal Register, February 18, 2005; Oklahoma State Dept. of Human Services, Bureau of Labor Statistics; U.S. Census Bureau, 2000 Census; U.S. Census Bureau.
$8,292$10,712
$16,090
$29,767$33,987
WelfareWage
MinimumWage
PovertyWage
185% PovertyWage
Median FamilyIncome(1999)
$0
$10,000
$20,000
$30,000
$40,000
$50,000Annual Wage
Self-Sufficiency Wage = $27,223 ($13.09/hr.)
Note: For the self-sufficiency wage, family of three consists of one adult, one preschooler and one schoolage child.The hourly wages given assume employment at 40 hours per week and 52 weeks per year.
Comparison of Wages: Self-Sufficiency, Welfare, Minimum, Poverty, 185% of Poverty, and Median Family Income
($3.99/hr.)($5.15/hr.)
($7.74/hr.)
($14.31/hr.)
Married-couple w/ kids: $42,615
Male-headed w/ kids: $19,671
Female-headed w/ kids: $13,992
All families
($16.34/hr.)
Prepared by the Community Service Council of Greater Tulsa
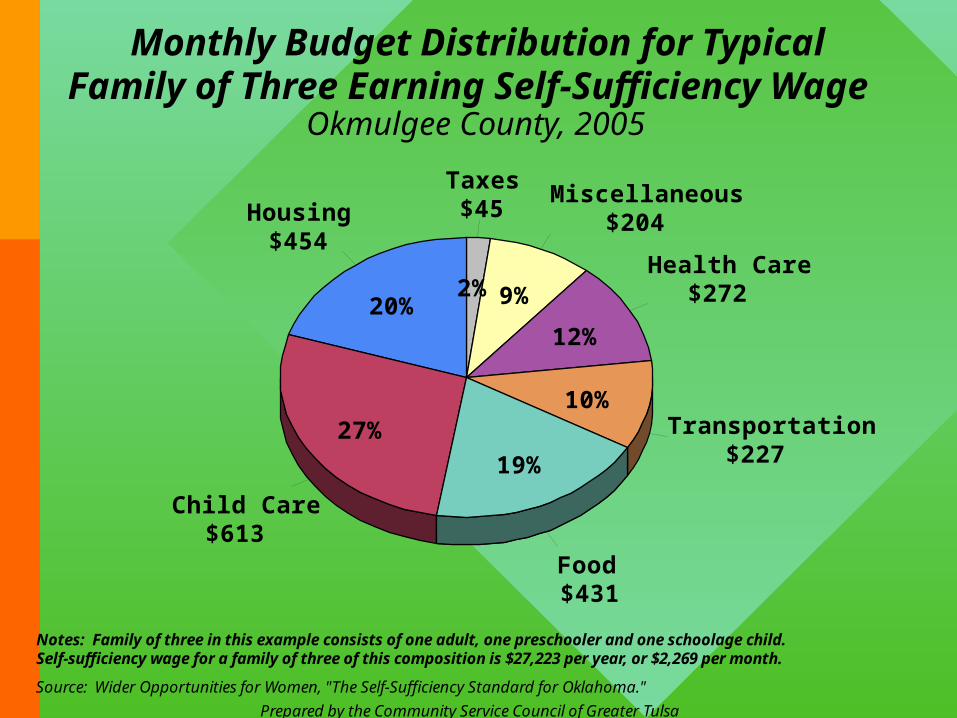
Monthly Budget Distribution for Typical Family of Three Earning Self-Sufficiency Wage
Okmulgee County, 2005
Source: Wider Opportunities for Women, "The Self-Sufficiency Standard for Oklahoma."
Housing$454
Child Care$613
Food$431
Transportation$227
Health Care$272
Miscellaneous$204
Taxes$45
20%
27%
19%
10%
12%
9%2%
Notes: Family of three in this example consists of one adult, one preschooler and one schoolage child. Self-sufficiency wage for a family of three of this composition is $27,223 per year, or $2,269 per month.
Prepared by the Community Service Council of Greater Tulsa
Ratio of Income to Poverty LevelPercentage of Total Population and Selected Age Groups
Okmulgee County, 1999
Source: U.S. Census Bureau, Census 2000.
Total population
Under 18 Under 5 5-17 18-64 65+0%
10%
20%
30%
40%
50%
60%
Percentage of population
100% 130% 185%
100% 18.9% 25.2% 30.2% 23.5% 16.8% 15.5%
130% 27.4% 34.8% 40% 33.1% 24.1% 26.8%
185% 41.5% 50.6% 57.9% 48.2% 36.3% 44.8%
Prepared by the Community Service Council of Greater Tulsa
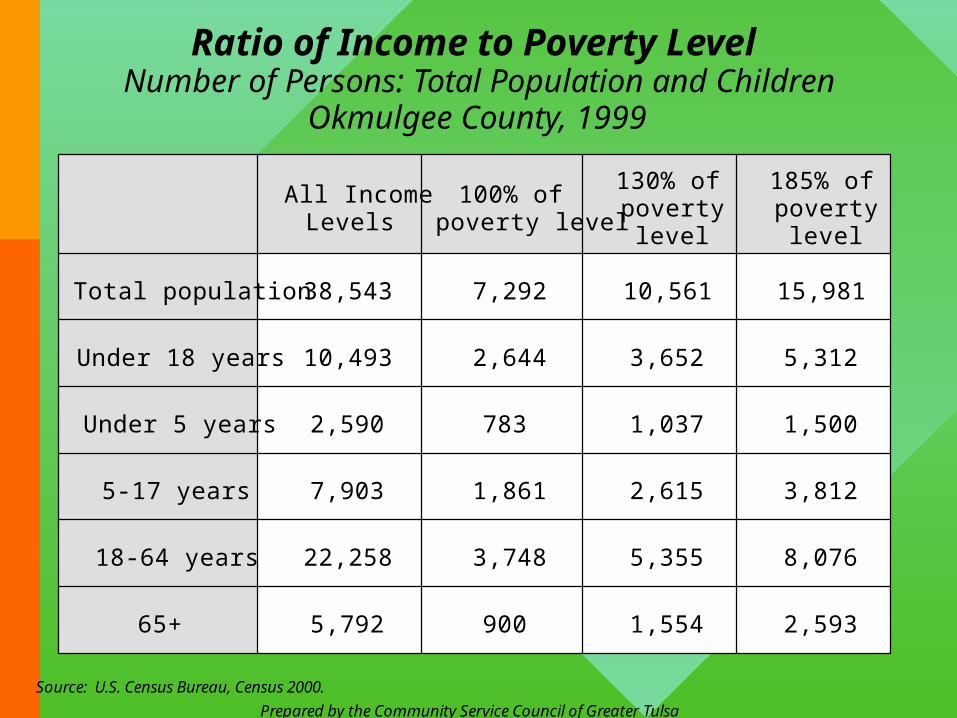
Ratio of Income to Poverty LevelNumber of Persons: Total Population and Children
Okmulgee County, 1999
Source: U.S. Census Bureau, Census 2000.
All Income Levels
100% of poverty level
130% of poverty
level
185% of poverty
level
Total population 38,543 7,292 10,561 15,981
Under 18 years 10,493 2,644 3,652 5,312
Under 5 years 2,590 783 1,037 1,500
5-17 years 7,903 1,861 2,615 3,812
18-64 years 22,258 3,748 5,355 8,076
65+ 5,792 900 1,554 2,593
Prepared by the Community Service Council of Greater Tulsa
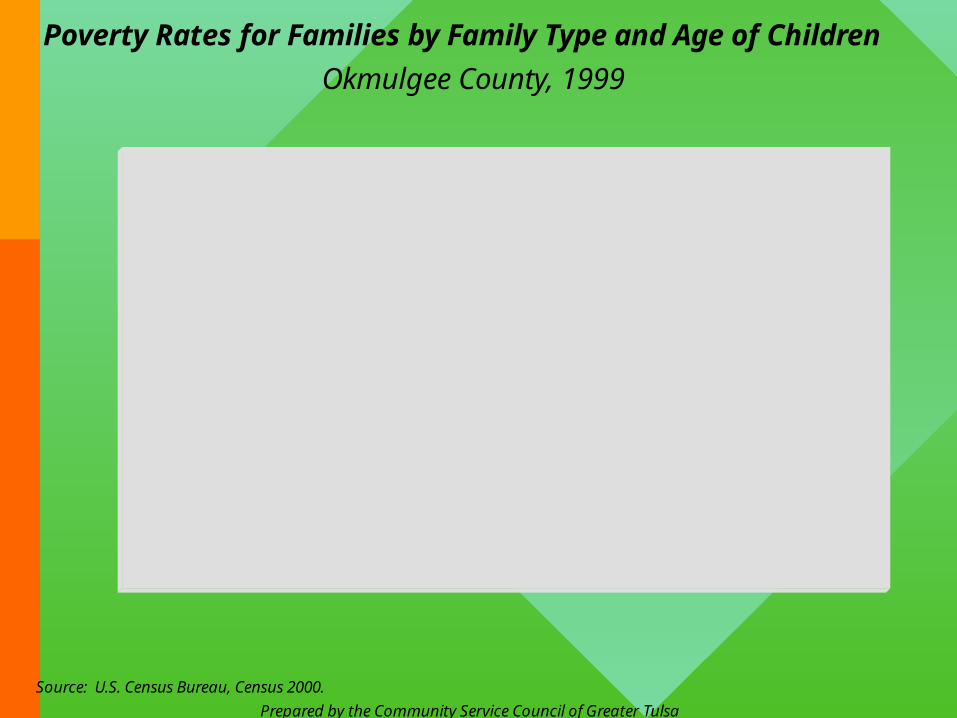
Poverty Rates for Families by Family Type and Age of Children
Okmulgee County, 1999
Source: U.S. Census Bureau, Census 2000.
12%
17.1%18.9%
8.2%5.6%
31.5%
53.5%
10.7%
27.7% 26.3%
47.8%
54%
67%
40.3%
12.9%
w/ children <18w/ children <5 only
w/ children <5 & 5-17w/ children 5-17 only
no children
0%
10%
20%
30%
40%
50%
60%
70%
80%Poverty rate
Married-couple
Male-headed
Female-headed
Prepared by the Community Service Council of Greater Tulsa
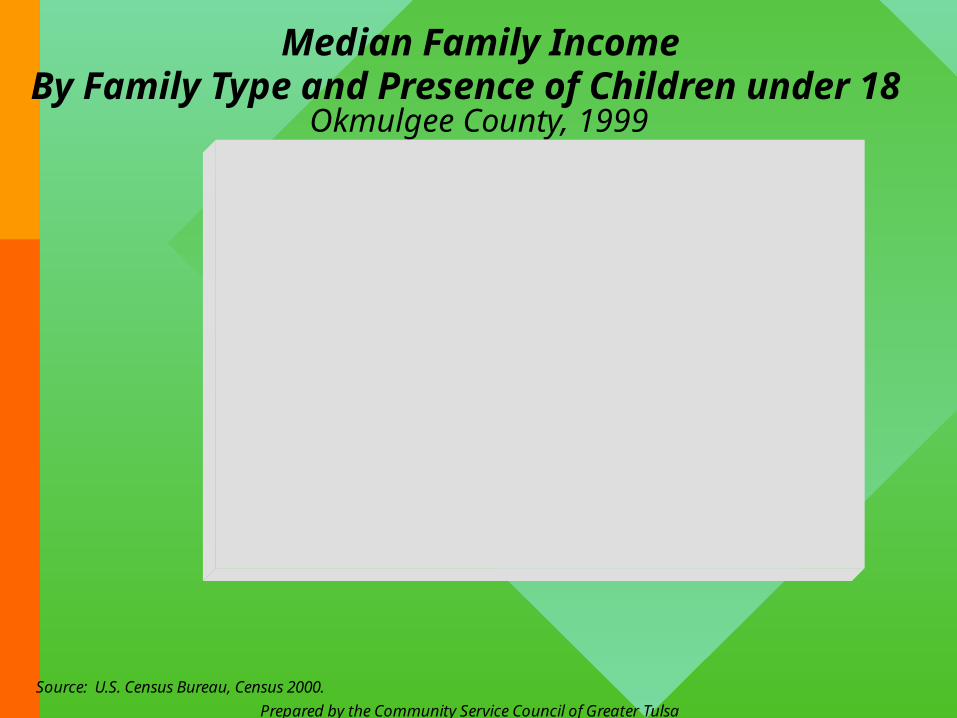
Median Family IncomeBy Family Type and Presence of Children under 18
Okmulgee County, 1999
Source: U.S. Census Bureau, Census 2000.
$33,713
$42,615
$13,992
$19,671
$34,239
$36,635
$24,439
$28,819
All families
Married-couplefamilies
Female-headedfamilies
Male-headedfamilies
$0$20,000$40,000$60,000
Families WITH children
$0 $20,000 $40,000 $60,000
Families WITHOUT children
Prepared by the Community Service Council of Greater Tulsa
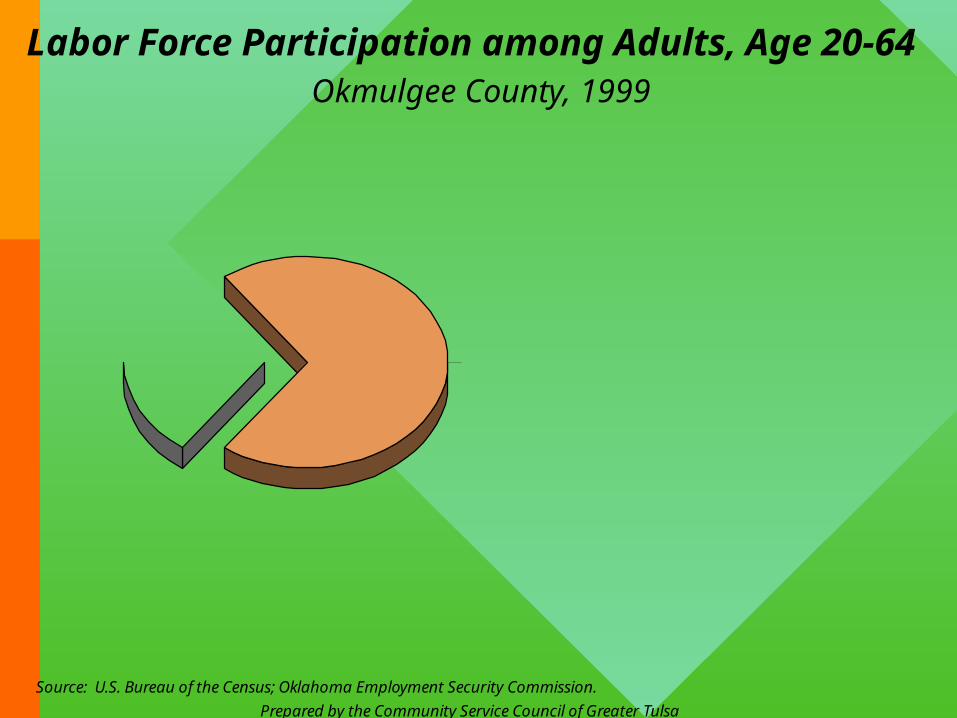
Labor Force Participation among Adults, Age 20-64Okmulgee County, 1999
Source: U.S. Bureau of the Census; Oklahoma Employment Security Commission.
15,06569.9%
6,49030.1%
In armed forces
Employed
Unemployed
28 (0.2%)
13,984 (92.8%)
1,053 (7.0%)
NOT in labor force
In labor force
Unemployment rate (all ages) for October 2005 = 5.4%.
Prepared by the Community Service Council of Greater Tulsa
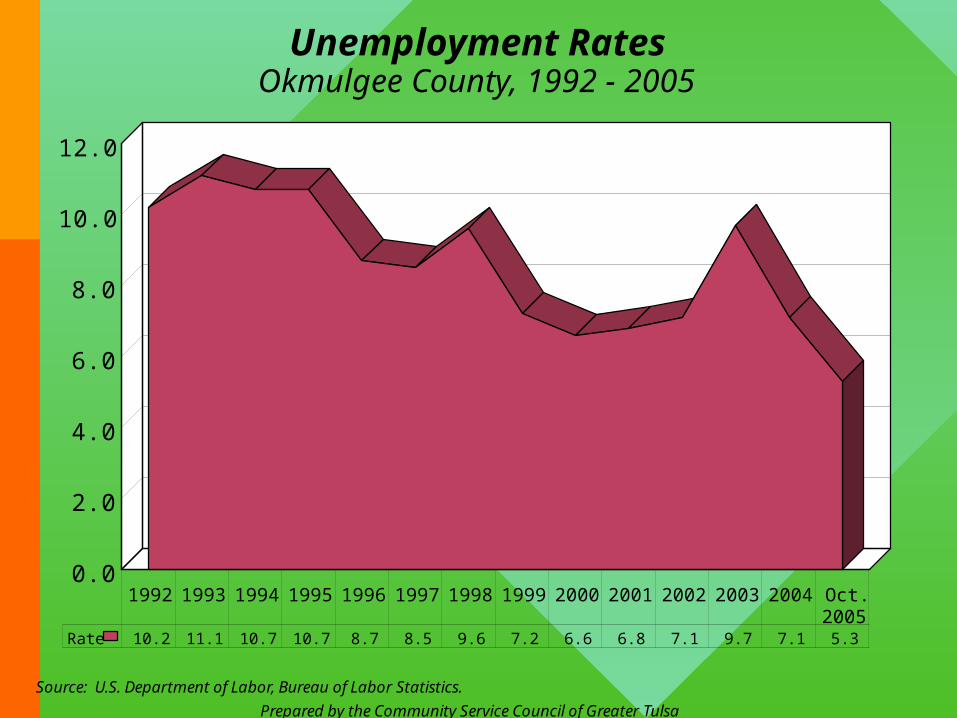
Unemployment RatesOkmulgee County, 1992 - 2005
Source: U.S. Department of Labor, Bureau of Labor Statistics.
1992 1993 1994 1995 1996 1997 1998 1999 2000 2001 2002 2003 2004 Oct.2005
0.0
2.0
4.0
6.0
8.0
10.0
12.0
Rate 10.2 11.1 10.7 10.7 8.7 8.5 9.6 7.2 6.6 6.8 7.1 9.7 7.1 5.3
Prepared by the Community Service Council of Greater Tulsa
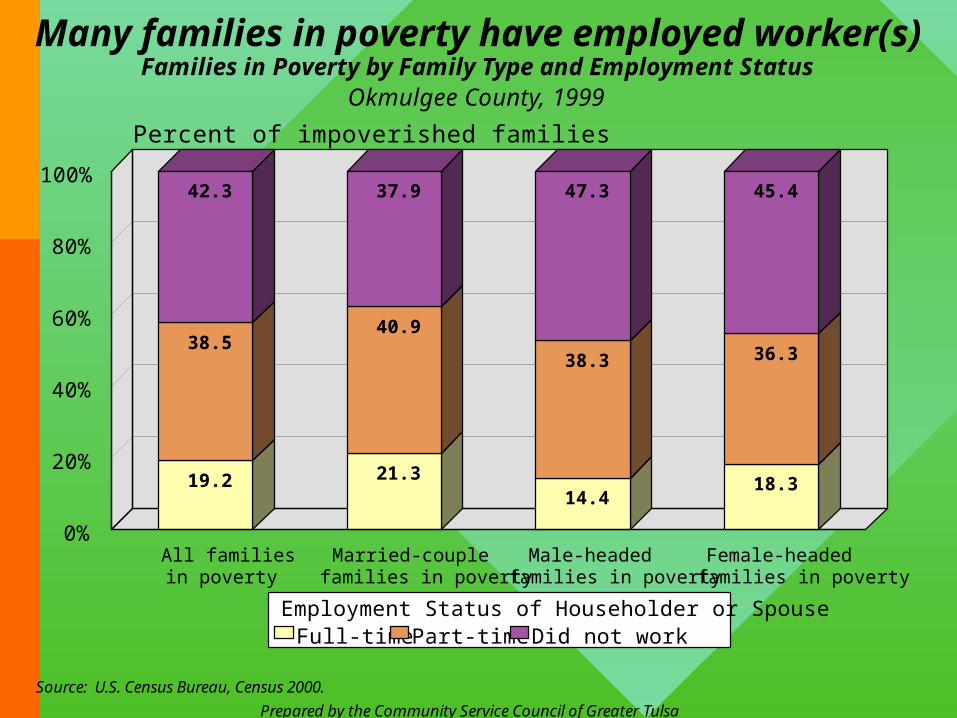
Many families in poverty have employed worker(s)Families in Poverty by Family Type and Employment Status
Okmulgee County, 1999
Source: U.S. Census Bureau, Census 2000.
19.2 21.314.4
18.3
38.540.9
38.3 36.3
42.3 37.9 47.3 45.4
All familiesin poverty
Married-couplefamilies in poverty
Male-headedfamilies in poverty
Female-headedfamilies in poverty
0%
20%
40%
60%
80%
100%
Percent of impoverished families
Employment Status of Householder or SpouseFull-time Part-time Did not work
Prepared by the Community Service Council of Greater Tulsa
Poverty Rates by Race and Hispanic OriginTotal Population and Under Age 5, Okmulgee County, 1999
Source: U.S. Census Bureau, Census 2000.
Total White Black AmericanIndian
Asian Hispanic0%
20%
40%
60%
80%
100%
Percentage of population
Total population Under 5
Total population 18.9% 15.6% 27.3% 26.4% 55.4% 34.9%
Under 5 30.2% 25.5% 38.4% 40.7% 100% 43.6%
Prepared by the Community Service Council of Greater Tulsa
Education increasingly impacts wagesReal Hourly Wage by Educational Attainment
United States, 1973-2003
Source: Economic Policy Institute website.
1973
1975
1977
1979
1981
1983
1985
1987
1989
1991
1993
1995
1997
1999
2001
2003
$0
$5
$10
$15
$20
$25
$30
$35
Real hourly wage (2003 dollars)
Less than high school High school College degree Advanced degree

Prepared by the Community Service Council of Greater Tulsa
Real Hourly Wage by Educational Attainment for MenUnited States, 1973-2003
Source: Economic Policy Institute website.
1973
1975
1977
1979
1981
1983
1985
1987
1989
1991
1993
1995
1997
1999
2001
2003
$0
$5
$10
$15
$20
$25
$30
$35
Real hourly wage (2003 dollars)
Less than high school High school College degree Advanced degree
Prepared by the Community Service Council of Greater Tulsa
Real Hourly Wage by Educational Attainment for WomenUnited States, 1973-2003
Source: Economic Policy Institute website.
1973
1975
1977
1979
1981
1983
1985
1987
1989
1991
1993
1995
1997
1999
2001
2003
$0
$5
$10
$15
$20
$25
$30
$35
Real hourly wage (2003 dollars)
Less than high school High school College degree Advanced degree
Prepared by the Community Service Council of Greater Tulsa
Additional Indicators of Economic Distress
Public assistance programsFree & reduced school lunch programHomeless sheltersHelpline and Babyline referrals
>>>>
Prepared by the Community Service Council of Greater Tulsa
Participation in Public Assistance ProgramsNumber of Participants and Percentage of Population Participating
Okmulgee County, September 2005
Source: Oklahoma Dept. of Human Services, Statistical Bulletin, Sept. 2005; Oklahoma State Dept. of Education, Low Income Report for 2004-2005; Pop. Estimates Division - U.S. Census Bureau; Oklahoma State Department of Health.
9,056
1,787
5,366
934
244
574
223
8,030
191
2,231
544
22.7%
69%
53.5%
16%
47.1%
22%
8.6%
20.1%
1.9%
56.8%
13.9%
Medicaid Total
Medicaid <5
Medicaid <18
Medicaid 65+
WIC Infants (Oct. 05)
WIC age 1-5 (Oct. 05)
Child Care Subsidy <5
Food Stamps Total
TANF <18
Elem. School Free Lunch(2004-05)
Elem. School Reduced Lunch(2004-05)
05,00010,00015,000
Number of Participants
0% 20% 40% 60% 80%
Percent of Population
Prepared by the Community Service Council of Greater Tulsa
Elementary School Students Eligible for Free and Reduced Lunch Program
By School District, Okmulgee County, 2004-2005 School Year
Source: Oklahoma State Dept. of Education, Low Income Report for 2003-2004.
57%
70%
68%
54%
60%
49%
53%
49%
39%
39%
14%
15%
12%
19%
9%
19%
15%
10%
15%
14%
Okmulgee County Total
Okmulgee
Henryetta
Schulter
Beggs
Dewar
Wilson
Twin Hills
Preston
Morris
0% 20% 40% 60% 80% 100%
Percent of Students Eligible
Free Reduced
Free lunch eligibility requirement: annual household income below 130% of poverty, which currently is $20,917 for a family of three.
Reduced lunch eligibility requirement: annual household income below 185% of poverty, which currently is $29,767 for a family of three.
Prepared by the Community Service Council of Greater Tulsa
Selected Helpline Service Requests, by Type of Service
2001 through 2005
Source: Community Service Council of Greater Tulsa.
2001 2002 2003 2004 20050
5,000
10,000
15,000
20,000
Number of Service Requests
Food
Health & Medical Services
Financial Assistance
Food 1,945 1,913 2,152 2,019 3,339
Health & Medical Services 2,688 2,852 3,404 4,074 7,720
Financial Assistance 12,376 12,173 13,269 12,035 17,847
Total incoming calls to Helpline rose to 49,952 in 2005, up
from 28,741 in 2004 (74% increase); while
assessments of caller needs and referrals rose to
101,180 in 2005, up from 50,784 in 2004
(99% increase).
Prepared by the Community Service Council of Greater Tulsa
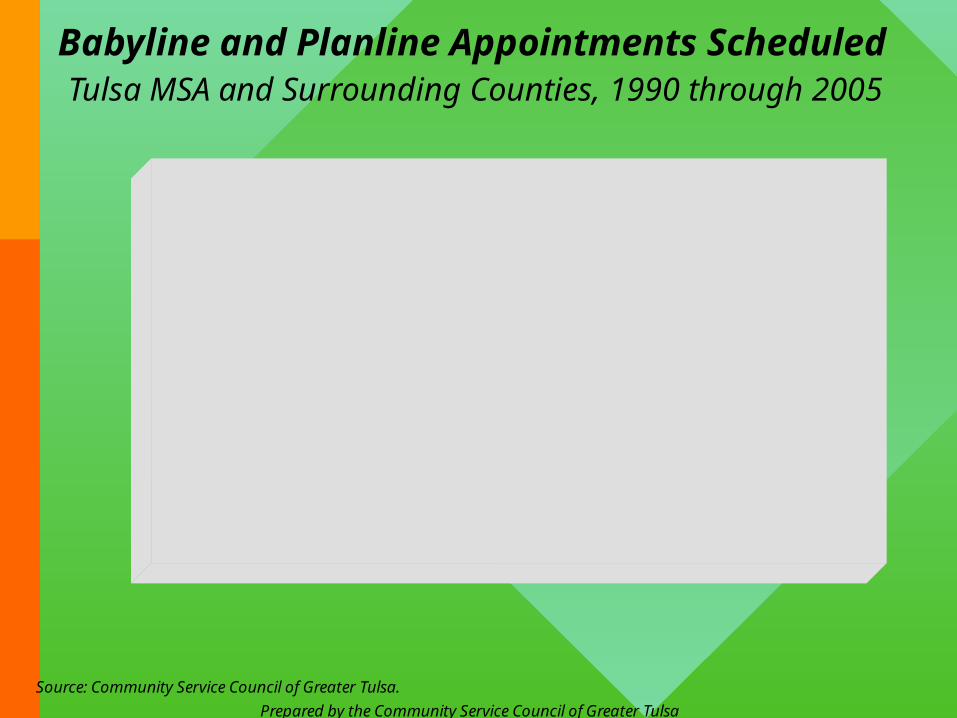
Babyline and Planline Appointments ScheduledTulsa MSA and Surrounding Counties, 1990 through 2005
Source: Community Service Council of Greater Tulsa.
1,9972,107 2,212
3,004
2,6052,369 2,342
2,662 2,767
3,525
3,998
4,4234,604
4,795 4,692
4,355
0 0 0 0 0
631
1,409
858 872
1,1931,432 1,345
1,789
1,333
909
1,500
1990 1991 1992 1993 1994 1995 1996 1997 1998 1999 2000 2001 2002 2003 2004 20050
1,000
2,000
3,000
4,000
5,000
Number of Appointments Scheduled
Family Planning Appointments Prenatal Appointments
Starting Life in Okmulgee County for Many is Risky Business
~Combination of many risk factors takes heavy toll and early screening
for risk level is inadequate
Prepared by the Community Service Council of Greater Tulsa
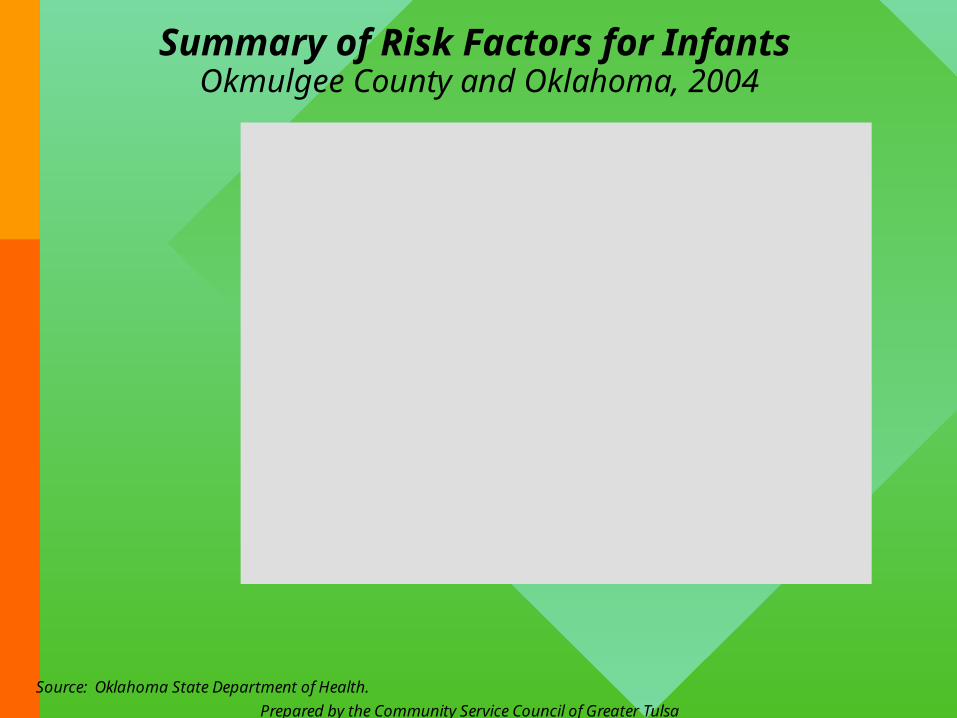
Summary of Risk Factors for InfantsOkmulgee County and Oklahoma, 2004
Source: Oklahoma State Department of Health.
16.3%
44.4%
4.6%
24.7%
6.2%
1.4%
31.2%
16.2%
9.1%
13.4%
38.5%
4.7%
22.8%
6.7%
1.3%
25.7%
12.7%
10.4%
Teen mother(age 15-19)
Unmarried mother
Poor prenatal care(3rd trimester/no care)
Mother w/ <12th gradeeducation
Low birthweight(1500-2499 grams)
Very low birthweight(<1500 grams)
Short birth spacing(<24 mos. apart)
Very short birth spacing(<18 mos. apart)
Premature(<37 weeks gest.)
0% 10% 20% 30% 40% 50%
Percent of Births
Okmulgee Co.
Oklahoma
Okmulgee County births: 563Oklahoma births: 51,157
Prepared by the Community Service Council of Greater Tulsa
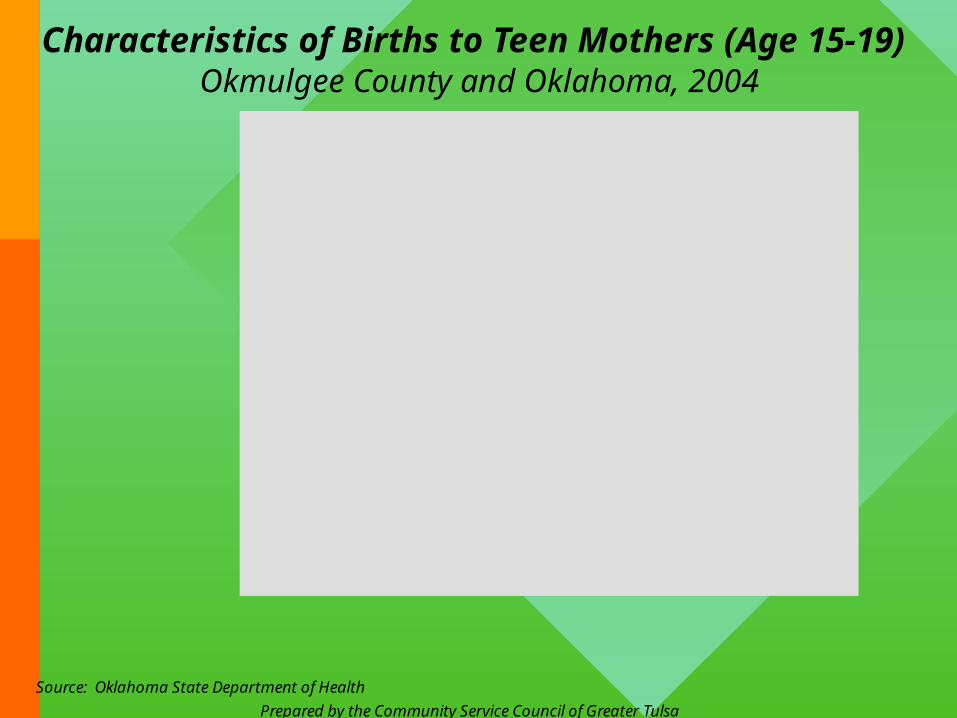
Characteristics of Births to Teen Mothers (Age 15-19)Okmulgee County and Oklahoma, 2004
Source: Oklahoma State Department of Health
70.7%
2.2%
52.2%
4.4%
1.1%
68.4%
47.4%
6.5%
22.8%
3.3%
77%
7.2%
57.4%
7.5%
1.6%
61.3%
39.4%
10.5%
21%
3.3%
Unmarried
Poor prenatal care(3rd trimester/no care)
Mother w/ <12th gradeeducation
Low birthweight(1500-2499 grams)
Very low birthweight(<1500 grams)
Short birth spacing(<24 mos. apart)
Very short birth spacing(<18 mos. apart)
Premature(<37 weeks gest.)
1+ previous births
2+ previous births
0% 20% 40% 60% 80% 100%
Percent of Teen Births
Okmulgee Co.
Oklahoma
Okmulgee County births to teens: 92Okmulgee County teen birth rate: 63.8 (per 100,000 females age 15-19)
Oklahoma births to teens: 6,849Oklahoma teen birth rate: 55.5 (per 100,000 females age 15-19)
Adequate Early Screening Essential for All Children to Assess Impact of Risk Factors
• Some evidence indicates only small portion of children receive needed screening
• Sufficient data do not exist to clearly indicate extent and nature of problem
What is early intervention?
• Early intervention applies to children of school age or younger who are discovered to have or be at risk of developing a handicapping condition or other special need that may effect their development.
• Early intervention consists of the provision of services such children and their families need for the purpose of lessening the effects of the condition. Early intervention can be remedial or preventive in nature – premeditating existing developmental problems or preventing their occurrence.
Prepared by the Community Service Council of Greater Tulsa
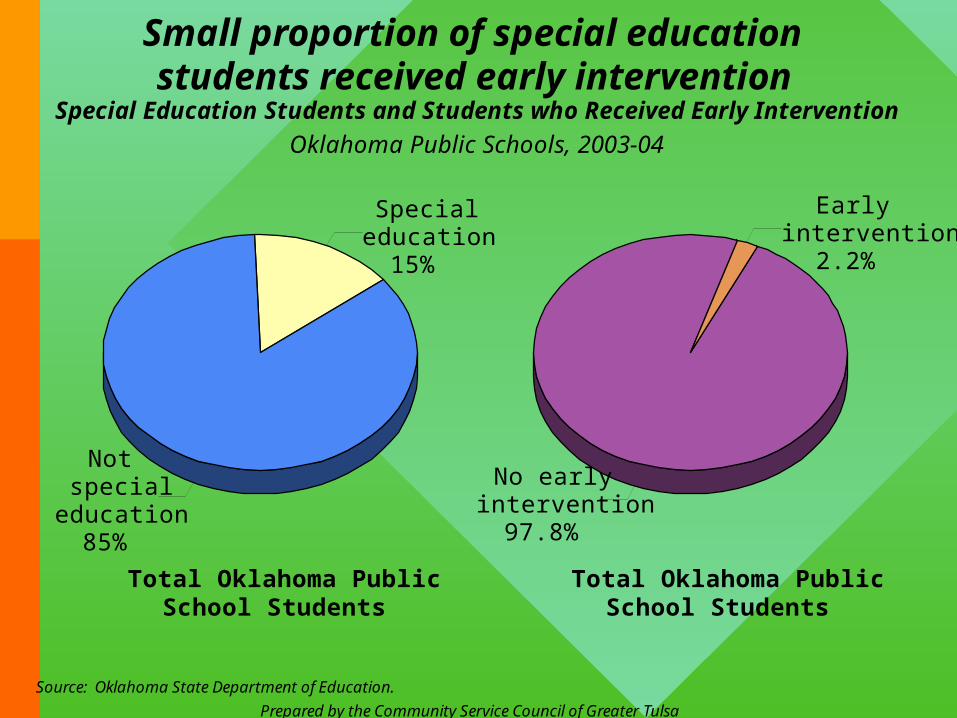
Special Education Students and Students who Received Early Intervention
Oklahoma Public Schools, 2003-04
Source: Oklahoma State Department of Education.
Notspecial
education85%
Specialeducation
15%
Earlyintervention
2.2%
No earlyintervention
97.8%
Small proportion of special education students received early intervention
Total Oklahoma Public School Students
Total Oklahoma Public School Students
Populations of Aging and Populations of Aging and Persons with Disabilities Persons with Disabilities are Large and Growingare Large and Growing
~~These populations will significantly These populations will significantly test the capacity of resources needed test the capacity of resources needed
to enable them to be most self-to enable them to be most self-sufficientsufficient
Prepared by the Community Service Council of Greater Tulsa
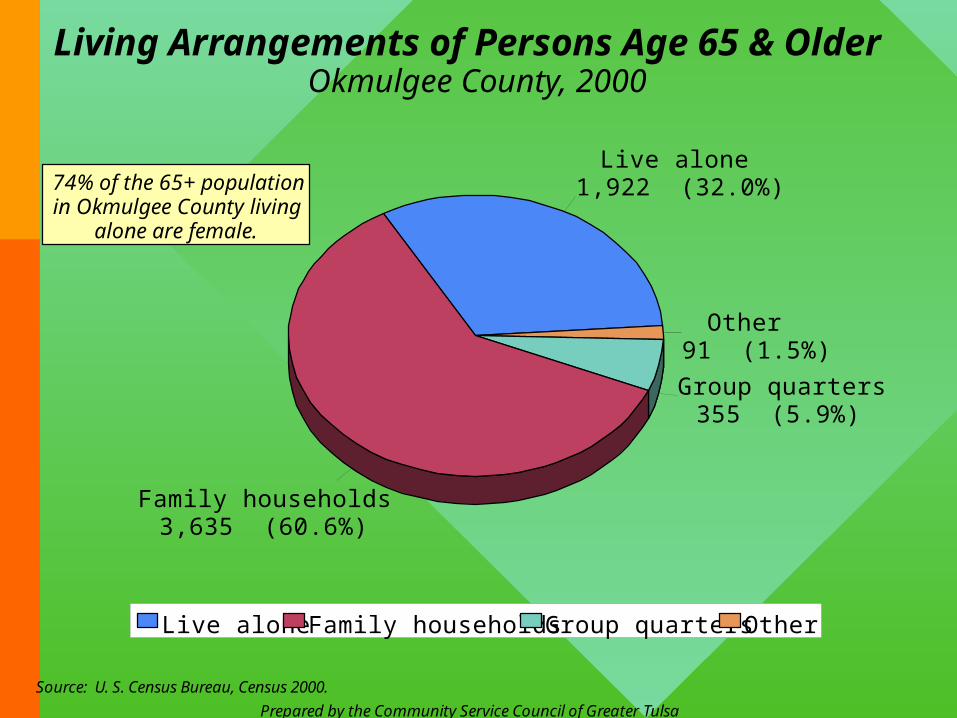
Living Arrangements of Persons Age 65 & OlderOkmulgee County, 2000
Source: U. S. Census Bureau, Census 2000.
Live alone1,922 (32.0%)
Family households3,635 (60.6%)
Group quarters355 (5.9%)
Other91 (1.5%)
Live alone Family households Group quarters Other
74% of the 65+ population in Okmulgee County living
alone are female.
Prepared by the Community Service Council of Greater Tulsa
Disabilities affect all agesDisability Prevalence by Age and Level of Disability
Oklahoma, 1997
Source: U.S. Bureau of the Census, 2001, Americans with Disabilities: 1997 (Aug.-Nov. 1997 data from Survey of Income and Program Participation).
2%
3.4%
11.2%
10.7%
13.4%
22.6%
35.7%
49%
73.6%
4.8%
5.3%
8.1%
13.9%
24.2%
31.8%
57.6%
0 to 2
3 to 5
6 to 14
15-24
25-44
45-54
55-64
65-79
80+
Age Group
0% 20% 40% 60% 80% 100%
Percent with Specified Level of Disability
Level of disabilityAny Severe
Health Challenges are Critical to Individual and Community Well-being
~Inadequate income, high risks of starting life and poor lifestyle
choices contribute to major health concerns
800850900950
1,0001,0501,100
1980 1984 1988 1992 1996 2000
Rat
e
Tulsa Co OK US
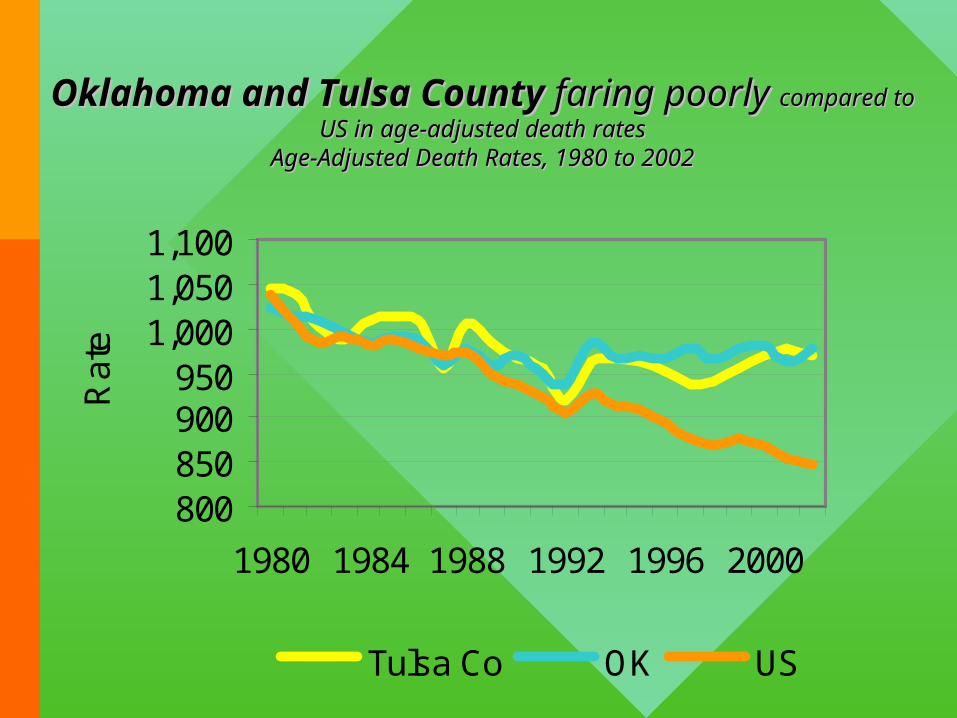
Oklahoma and Tulsa County Oklahoma and Tulsa County faring poorly faring poorly compared to US in age-adjusted death ratescompared to US in age-adjusted death rates
Age-Adjusted Death Rates, 1980 to 2002Age-Adjusted Death Rates, 1980 to 2002
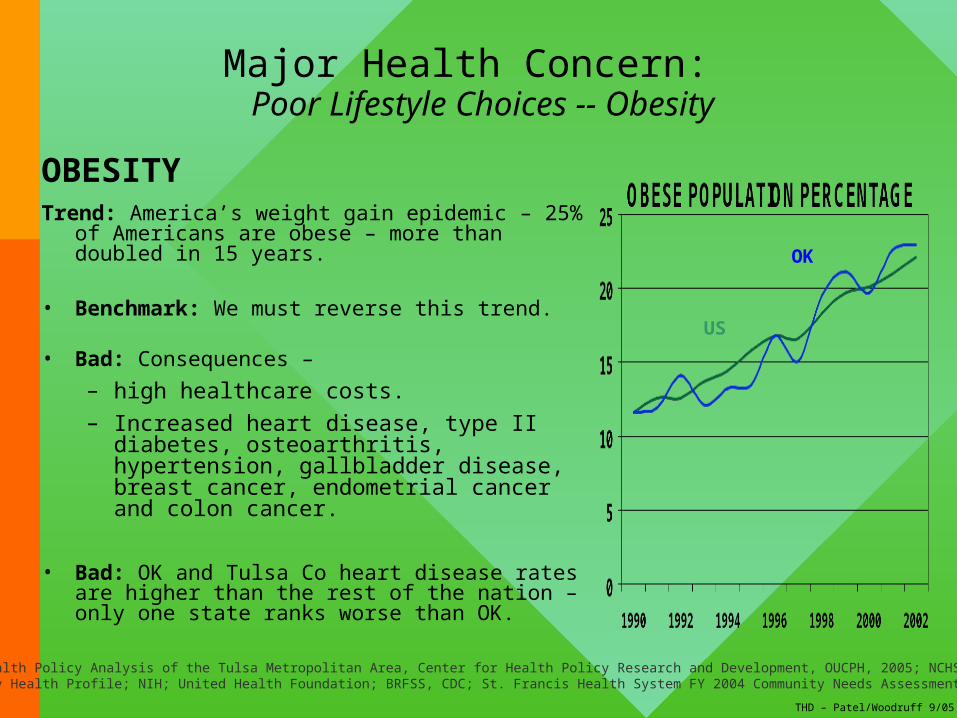
OBESITYTrend: America’s weight gain epidemic – 25% of
Americans are obese – more than doubled in 15 years.
• Benchmark: We must reverse this trend.
• Bad: Consequences –
– high healthcare costs.
– Increased heart disease, type II diabetes, osteoarthritis, hypertension, gallbladder disease, breast cancer, endometrial cancer and colon cancer.
• Bad: OK and Tulsa Co heart disease rates are higher than the rest of the nation – only one state ranks worse than OK.
Lapolla, Health Policy Analysis of the Tulsa Metropolitan Area, Center for Health Policy Research and Development, OUCPH, 2005; NCHS, CDC; THD;Tulsa County Health Profile; NIH; United Health Foundation; BRFSS, CDC; St. Francis Health System FY 2004 Community Needs Assessment.
OK
US
THD – Patel/Woodruff 9/05
Major Health Concern: Poor Lifestyle Choices -- Obesity
Trend: Percent of adult smokers (2003): 22.7(Tulsa Co), 25.1(OK), 22.0(US), state rank=36.
Benchmark: Smoking bans in public venues, smoking cessation programs, and increasing cigarette taxes = curtailed adult smoking and youth take-up rate.
Good: OK youth smoking percent is below the national average— 26.5(OK) and 27.5(US); adult smokers declining locally, statewide and nationally (2003).
Bad: Smoking is a major cause of premature death, cardiovascular and pulmonary system disease including heart attack, stroke and cancer.
THD – Patel/Woodruff 9/05
NCHS, CDC; THD;Tulsa County Health Profile; NIH; BRFSS, CDC
22.7%
25.1%
22%
20030%
5%
10%
15%
20%
25%
30%
Percent adult smokers
Tulsa Co. Oklahoma US
Major Health Concern: Poor Lifestyle Choices -- Smoking
THD – Patel/Woodruff 9/05
NCHS, CDC; THD;Tulsa County Health Profile; NIH; BRFSS, CDC
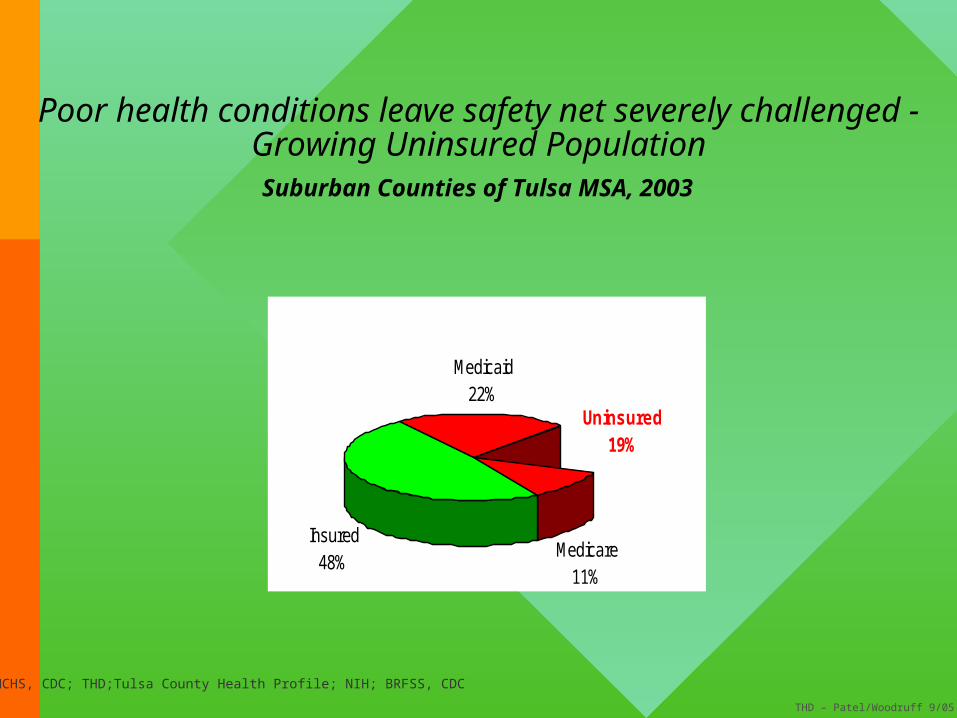
Poor health conditions leave safety net severely challenged - Growing Uninsured PopulationSuburban Counties of Tulsa MSA, 2003
Medicare11%
Medicaid22%
Insured48%
Uninsured19%
Prepared by the Community Service Council of Greater Tulsa
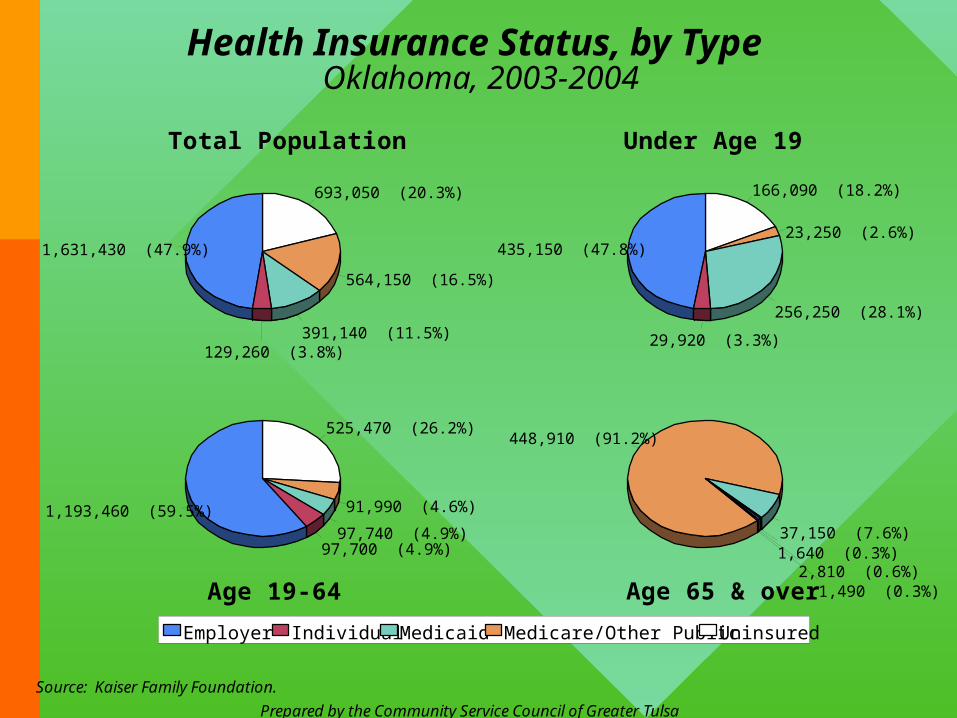
Health Insurance Status, by TypeOklahoma, 2003-2004
Source: Kaiser Family Foundation.
1,631,430 (47.9%)
129,260 (3.8%)391,140 (11.5%)
564,150 (16.5%)
693,050 (20.3%)
435,150 (47.8%)
29,920 (3.3%)
256,250 (28.1%)
23,250 (2.6%)
166,090 (18.2%)
1,193,460 (59.5%)
97,700 (4.9%)97,740 (4.9%)
91,990 (4.6%)
525,470 (26.2%)
2,810 (0.6%)1,640 (0.3%)37,150 (7.6%)
448,910 (91.2%)
1,490 (0.3%)
Employer Individual Medicaid Medicare/Other Public Uninsured
Total Population Under Age 19
Age 19-64 Age 65 & over
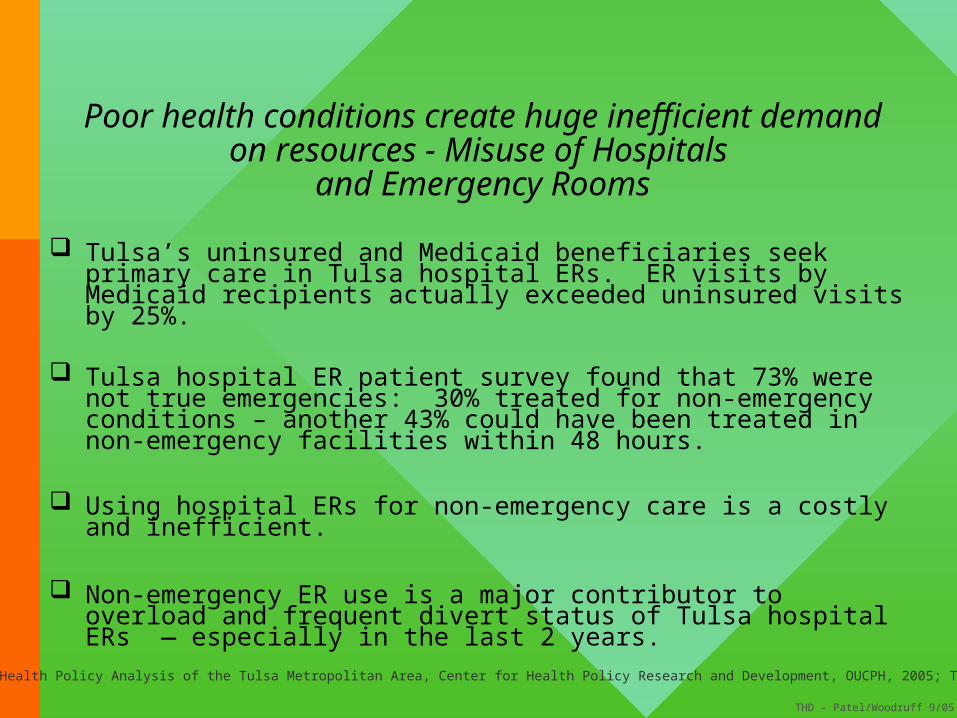
Tulsa’s uninsured and Medicaid beneficiaries seek primary care in Tulsa hospital ERs. ER visits by Medicaid recipients actually exceeded uninsured visits by 25%.
Tulsa hospital ER patient survey found that 73% were not true emergencies: 30% treated for non-emergency conditions – another 43% could have been treated in non-emergency facilities within 48 hours.
Using hospital ERs for non-emergency care is a costly and inefficient.
Non-emergency ER use is a major contributor to overload and frequent divert status of Tulsa hospital ERs — especially in the last 2 years.
THD – Patel/Woodruff 9/05
Lapolla, Health Policy Analysis of the Tulsa Metropolitan Area, Center for Health Policy Research and Development, OUCPH, 2005; THD CAP
Poor health conditions create huge inefficient demand on resources - Misuse of Hospitals
and Emergency Rooms
Poor Human Conditions Poor Human Conditions Impact Crime and Impact Crime and
Growing IncarcerationsGrowing Incarcerations
~Trends greatly affected by substance abuse
0
2,500
5,000
7,500
10,000
12,500
15,000
17,500
20,000
22,500
25,000
'50
'52
'54
'56
'58
'60
'62
'64
'66
'68
'70
'72
'74
'76
'78
'80
'82
'84
'86
'88
'90
'92
'94
'96
'98
'00
'02
'04
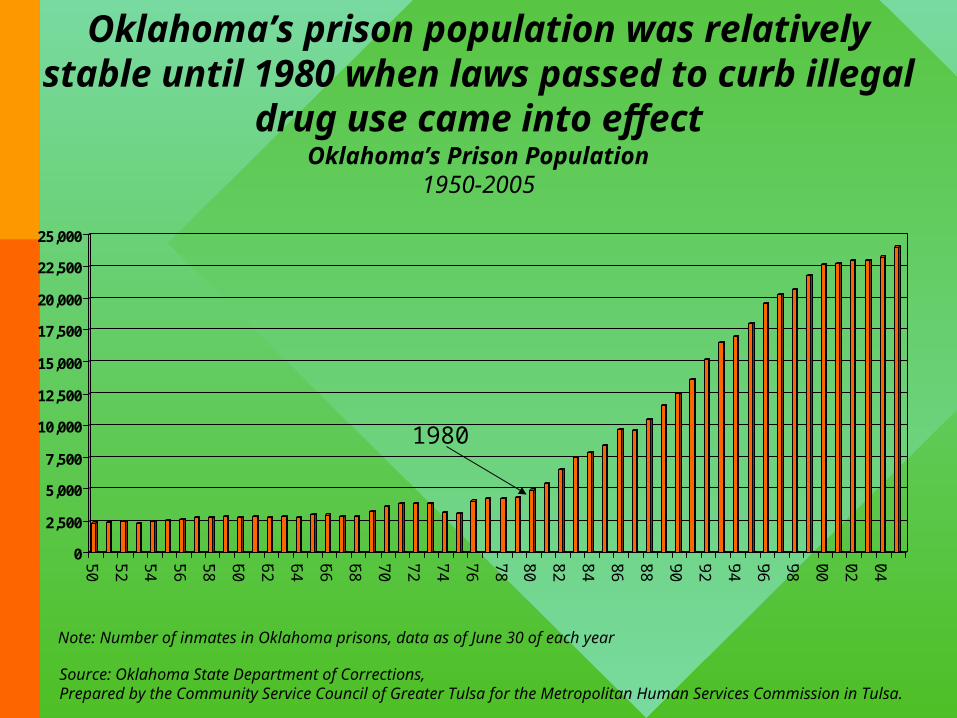
Oklahoma’s prison population was relatively stable until 1980 when laws passed to curb
illegal drug use came into effectOklahoma’s Prison Population
1950-2005
Source: Oklahoma State Department of Corrections, Prepared by the Community Service Council of Greater Tulsa for the Metropolitan Human Services Commission in Tulsa.
1980
Note: Number of inmates in Oklahoma prisons, data as of June 30 of each year
Prepared by the Community Service Council of Greater Tulsa
Methamphetamine Labs Seized by AuthoritiesOklahoma and City of Tulsa, 1994 - 2004
Source: Oklahoma State Bureau of Narcotics and Dangerous Drugs Website, Tulsa Police Department Website.
10 34
125
241 275
781
946
1,1931,254 1,235
812
0 0 6 13 47132 150 124
178214
131
1994 1995 1996 1997 1998 1999 2000 2001 2002 2003 20040
200
400
600
800
1,000
1,200
1,400
Number of labs discovered
Tulsa
Oklahoma

Overall Progress in Human Overall Progress in Human Development is Tied to Development is Tied to
Educational SuccessEducational Success
~From preschool through post secondary education
Prepared by the Community Service Council of Greater Tulsa
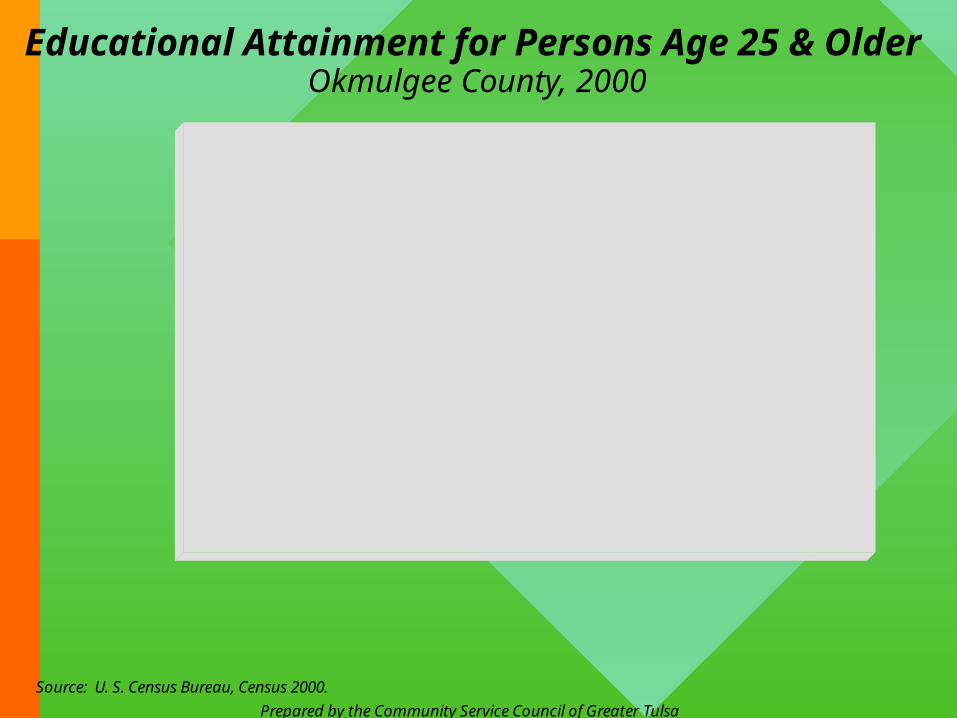
Educational Attainment for Persons Age 25 & OlderOkmulgee County, 2000
Source: U. S. Census Bureau, Census 2000.
25.3%
35.3%
20.1%
8%
7.8%
2.5%
0.7%
0.4%
Less than high school
High school graduate
Some college
Associate degree
Bachelor's degree
Master's degree
Professional school degree
Doctorate degree
0% 10% 20% 30% 40%
Percent of persons 25+
Prepared by the Community Service Council of Greater Tulsa
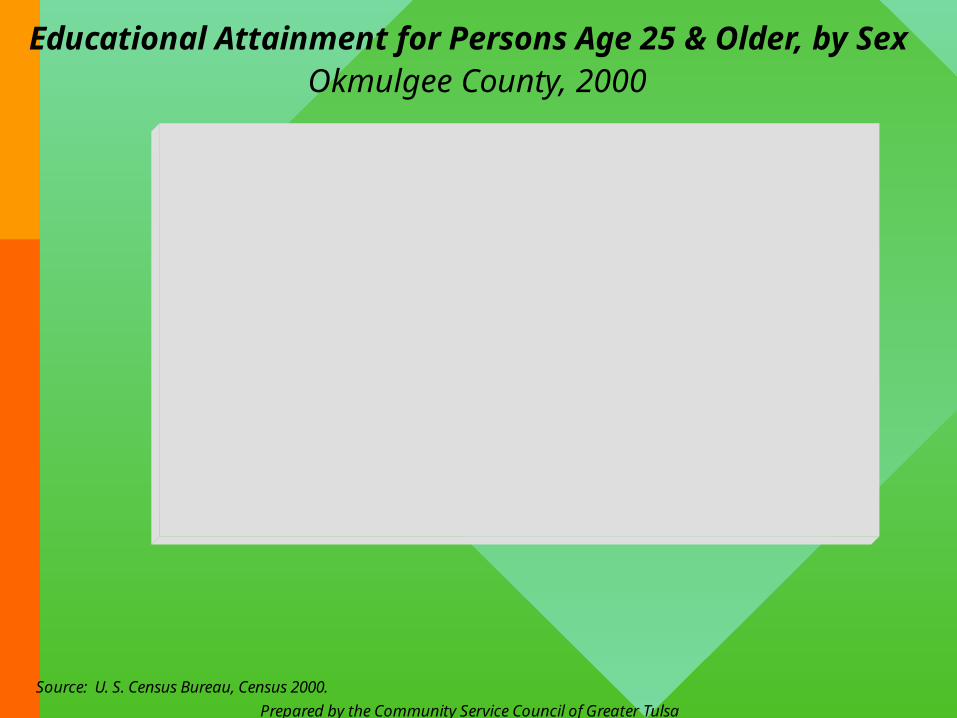
Educational Attainment for Persons Age 25 & Older, by SexOkmulgee County, 2000
Source: U. S. Census Bureau, Census 2000.
25.2%
34.7%
20.1%
8.3%
7.5%
2.6%
1%
0.7%
25.3%
35.8%
20.1%
7.7%
8%
2.4%
0.5%
0.2%
Less than high school
High school graduate
Some college
Associate degree
Bachelor's degree
Master's degree
Professional school degree
Doctorate degree
0%10%20%30%40%50% 0% 10% 20% 30% 40% 50%
Males Females
Percent of persons 25+

Education Success: Post-Secondary-Higher
Education
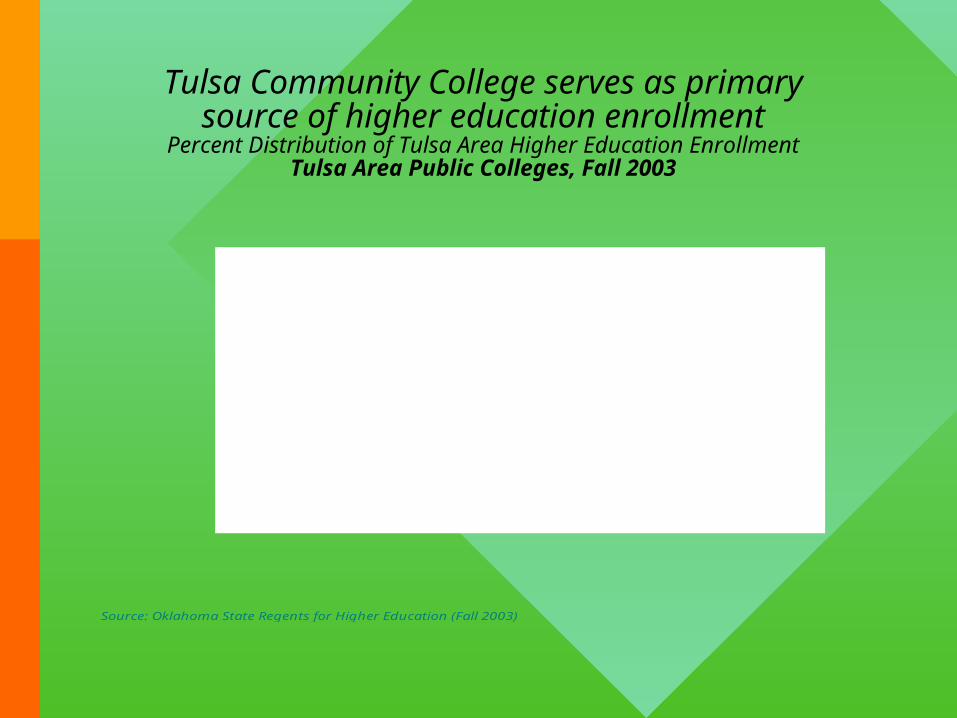
Tulsa Community College serves as primary source of higher education enrollment
Percent Distribution of Tulsa Area Higher Education EnrollmentTulsa Area Public Colleges, Fall 2003
Source: Oklahoma State Regents for Higher Education (Fall 2003)
63.9
13.1
9.4
8
3.2
2.4
TCC
RSU
OSU-Tulsa
NSU-BA
OU-Tulsa
LU-Tulsa
0 10 20 30 40 50 60 70 80
Percent of Enrollment
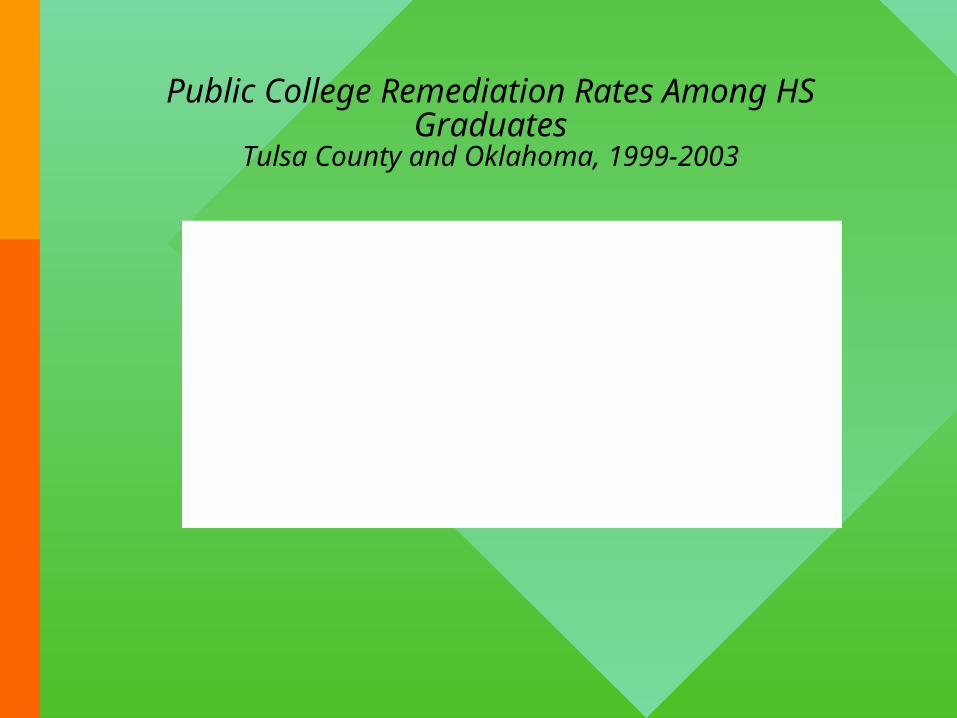
Public College Remediation Rates Among HS Graduates
Tulsa County and Oklahoma, 1999-2003
37
32.435.1
38.1
33.636.5
34.136.5 36.2 35
1999 2000 2001 2002 2003
Academic Year
0
10
20
30
40
50
Per
cent
Req
uiri n
g R
emed
i ati o
n
Tulsa State
Source: Oklahoma State Regents for Higher Education (Fall 2003)
Human Development: Key Points
• Middle class is disappearing
• Many households lack adequate income
• Stress of inadequate income and related conditions is widespread
• Starting life in Okmulgee County for many is risky business
Human Development: Key Points…continued
• Populations of aging and persons with disabilities are large and growing
• Health challenges are critical to individual and community well-being
• Poor human conditions impact crime and growing incarcerations
• Overall progress in human development is tied to educational success
Prepared by the Community Service Council of Greater Tulsa
At-Risk Populations
Infants and Young Children at RiskAdolescents at RiskFamilies at Risk
>>>
Prepared by the Community Service Council of Greater Tulsa
...Infants and Young Children at Risk
Infants and Young Children at Risk…
Child Abuse & Neglect

Prepared by the Community Service Council of Greater Tulsa
Child Abuse and NeglectOklahoma, FY 2004
Source: Oklahoma Department of Human Services.
59,329
36,232
12,347
Reports of abuseor neglect
Reports accepted for investigation or assessment
Children confirmedabused or neglected
0
10,000
20,000
30,000
40,000
50,000
60,000
70,000
Of these 12,347 children, 1,414 were abused, 8,953 were neglected, and 1,980 were abused and neglected.
(duplicated count)
Prepared by the Community Service Council of Greater Tulsa
Child Abuse and NeglectOkmulgee County, FY 2004
Source: Oklahoma Department of Human Services.
760
447
108
Reports of abuseor neglect
Reports accepted for investigation or assessment
Children confirmedabused or neglected
0
200
400
600
800
1,000
Of these 108 children, 12 were abused, 82 were neglected, and 14 were abused and neglected.
Prepared by the Community Service Council of Greater Tulsa
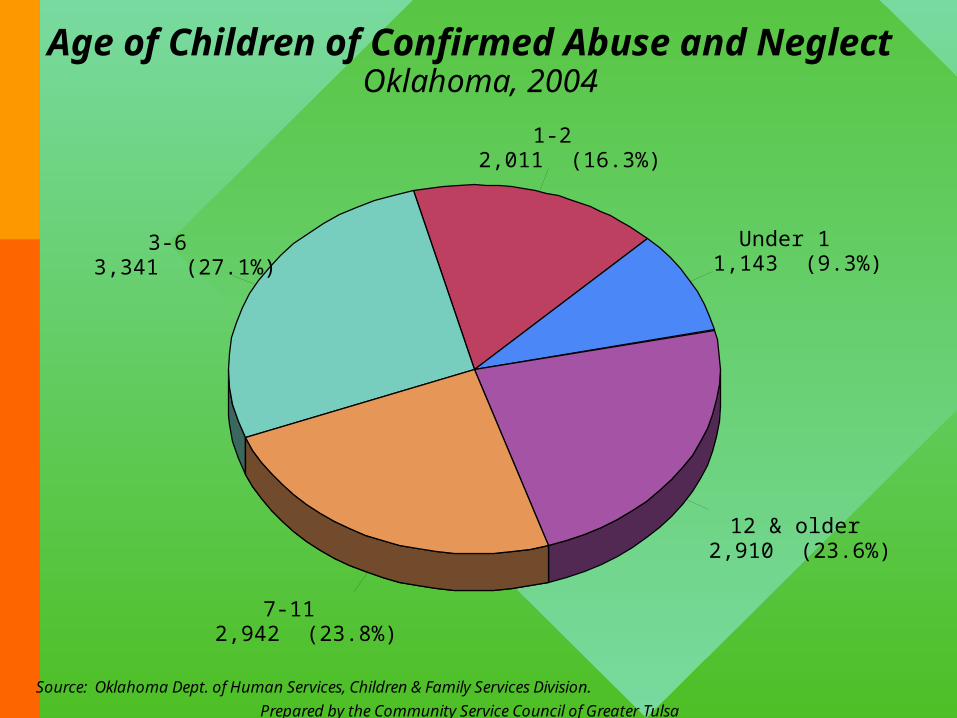
Age of Children of Confirmed Abuse and NeglectOklahoma, 2004
Source: Oklahoma Dept. of Human Services, Children & Family Services Division.
Under 11,143 (9.3%)
1-22,011 (16.3%)
3-63,341 (27.1%)
7-112,942 (23.8%)
12 & older2,910 (23.6%)
Prepared by the Community Service Council of Greater Tulsa
Perpetrators of Confirmed Abuse and NeglectTop 6, Oklahoma, FY 2004
Source: Oklahoma Department of Human Services.
46.4%
27.9%
7.7% 6.6%3.8%
1.3%
Mother Father Stepparent No relation Grandparent Foster parent0%
10%
20%
30%
40%
50%
60%
Prepared by the Community Service Council of Greater Tulsa
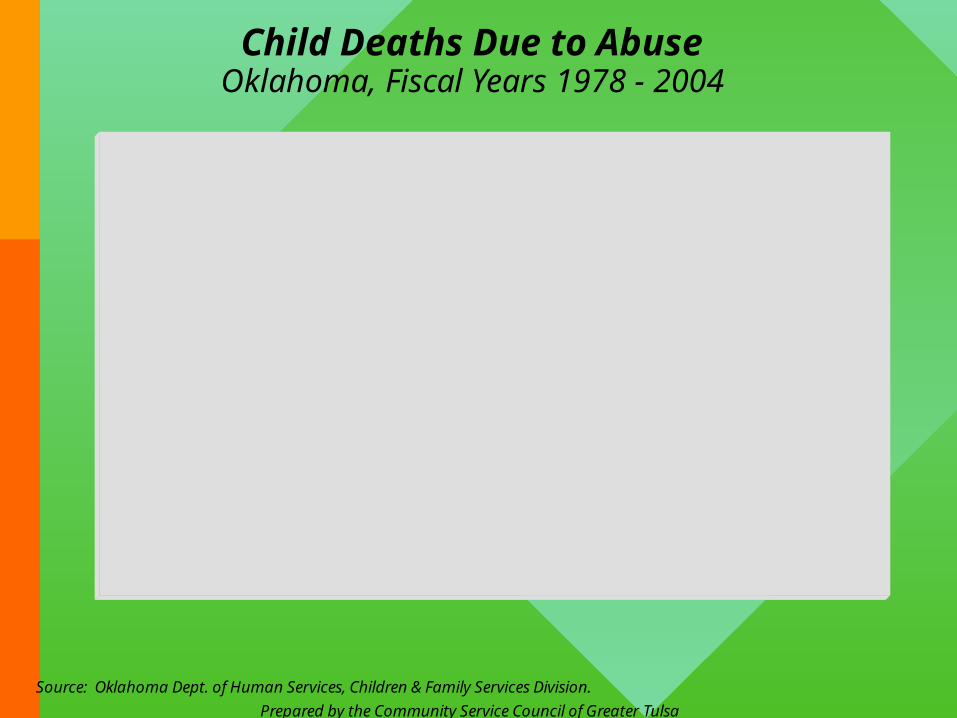
Child Deaths Due to AbuseOklahoma, Fiscal Years 1978 - 2004
Source: Oklahoma Dept. of Human Services, Children & Family Services Division.
75
12 13
1821
16 16
24
31
2325
18
38
2023
3134
29
4245
47 48
3835
27
51
1978
1979
1980
1981
1982
1983
1984
1985
1986
1987
1988
1989
1990
1991
1992
1993
1994
1995
1996
1997
1998
1999
2000
2001
2002
2003
2004
0
10
20
30
40
50
60
Prepared by the Community Service Council of Greater Tulsa
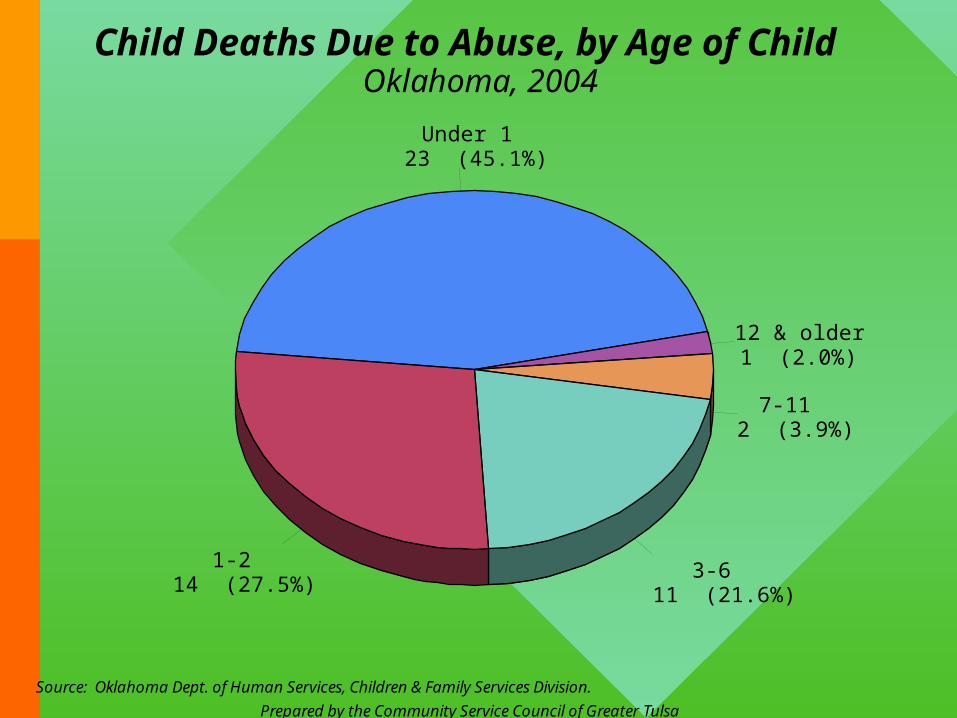
Child Deaths Due to Abuse, by Age of ChildOklahoma, 2004
Source: Oklahoma Dept. of Human Services, Children & Family Services Division.
Under 123 (45.1%)
1-214 (27.5%)
3-611 (21.6%)
7-112 (3.9%)
12 & older1 (2.0%)
Prepared by the Community Service Council of Greater Tulsa
...Adolescents at Risk
Adolescents at Risk…
Disconnected youth
Prepared by the Community Service Council of Greater Tulsa
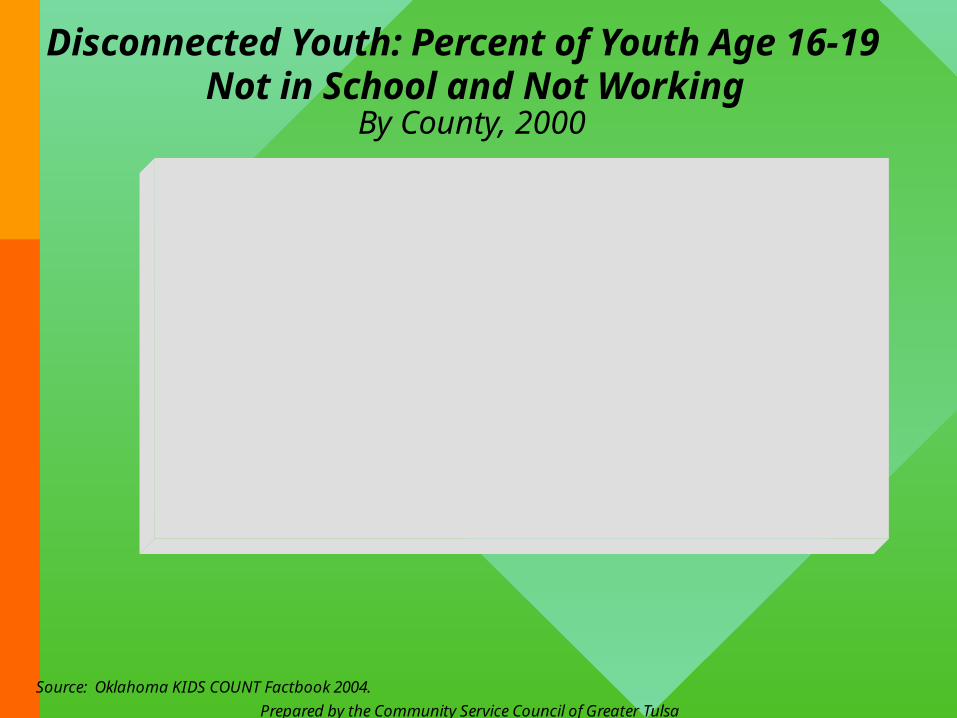
Disconnected Youth: Percent of Youth Age 16-19 Not in School and Not Working
By County, 2000
Source: Oklahoma KIDS COUNT Factbook 2004.
Tulsa Co. Creek Co. Okmulgee Co. Osage Co. Rogers Co. Wagoner Co.0%
2%
4%
6%
8%
10%
12%
14%
Rate 9.7% 6.7% 12.1% 7.3% 8.1% 7.7%
Number 3,090 278 325 194 340 274
#65
#46
#24 #27#31 #28
Note: County ranking shown at top of bars (#1=best, #77=worst).
Prepared by the Community Service Council of Greater Tulsa
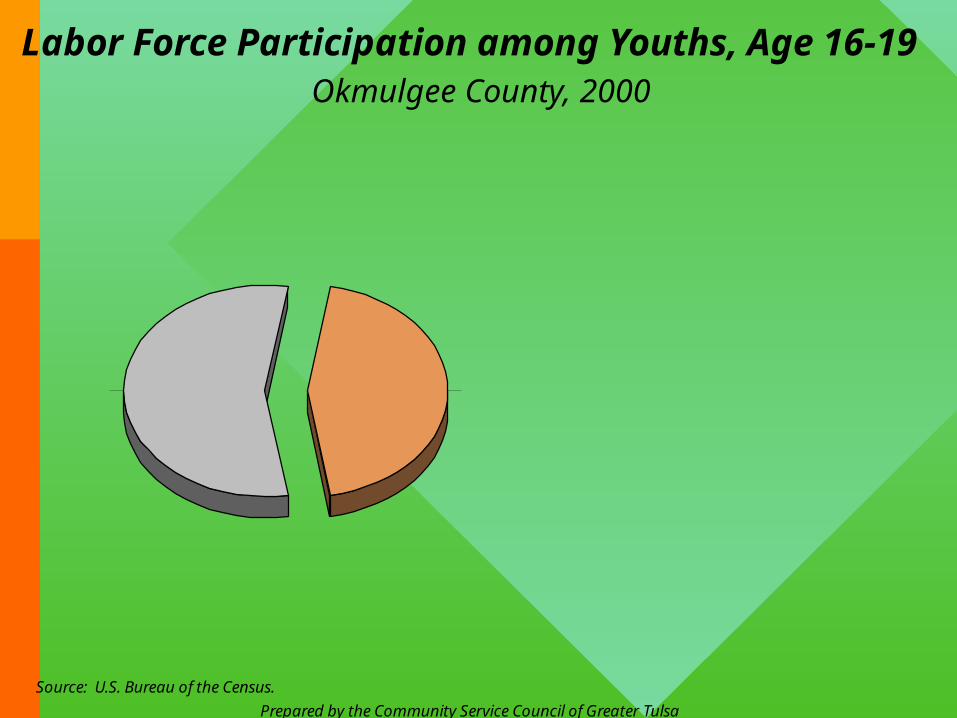
Labor Force Participation among Youths, Age 16-19Okmulgee County, 2000
Source: U.S. Bureau of the Census.
1,20444.9%
1,47855.1%
In armed forces
Employed
Unemployed
3 (0.2%)
969 (80.5%)
232 (19.3%)
NOT in labor force
In labor force
Adolescents at Risk…
Teen Mothers
Prepared by the Community Service Council of Greater Tulsa
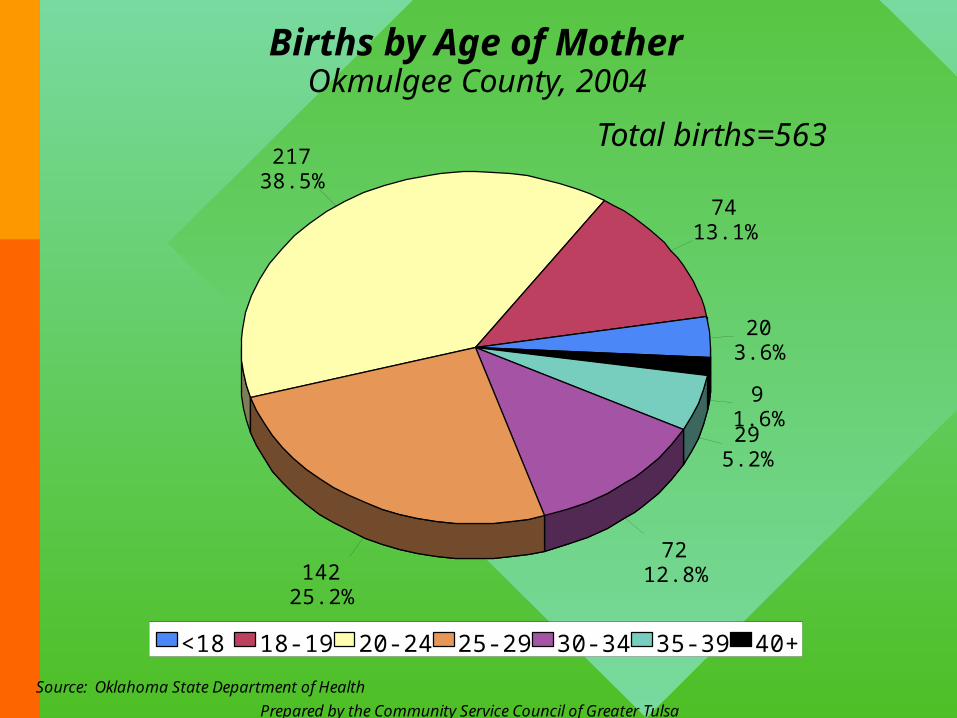
Births by Age of MotherOkmulgee County, 2004
Source: Oklahoma State Department of Health
203.6%
7413.1%
21738.5%
14225.2%
7212.8%
295.2%
91.6%
<18 18-19 20-24 25-29 30-34 35-39 40+
Total births=563
Prepared by the Community Service Council of Greater Tulsa
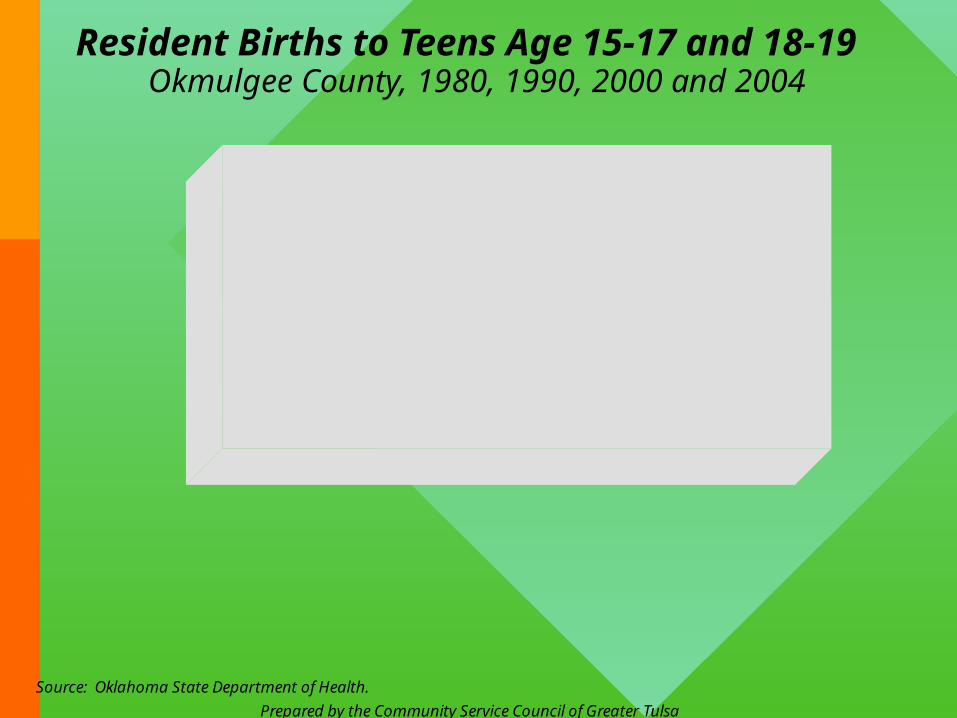
Resident Births to Teens Age 15-17 and 18-19Okmulgee County, 1980, 1990, 2000 and 2004
Source: Oklahoma State Department of Health.
1980 1990 2000 20040
50
100
150
Number of births
0
50
100
150Birth rate
Births 15-17 52 32 26 18
Births 18-19 104 73 82 74
Birth rate 15-17 50.1 41.6 28.8 20.1
Birth rate 18-19 150.3 134.4 130.4 135.3
Note: Age-specific birth rates are calculated as the number of births to females in specific age group per 1,000 females in that age group.
Adolescents at Risk…
Youth Risk Behavior Survey
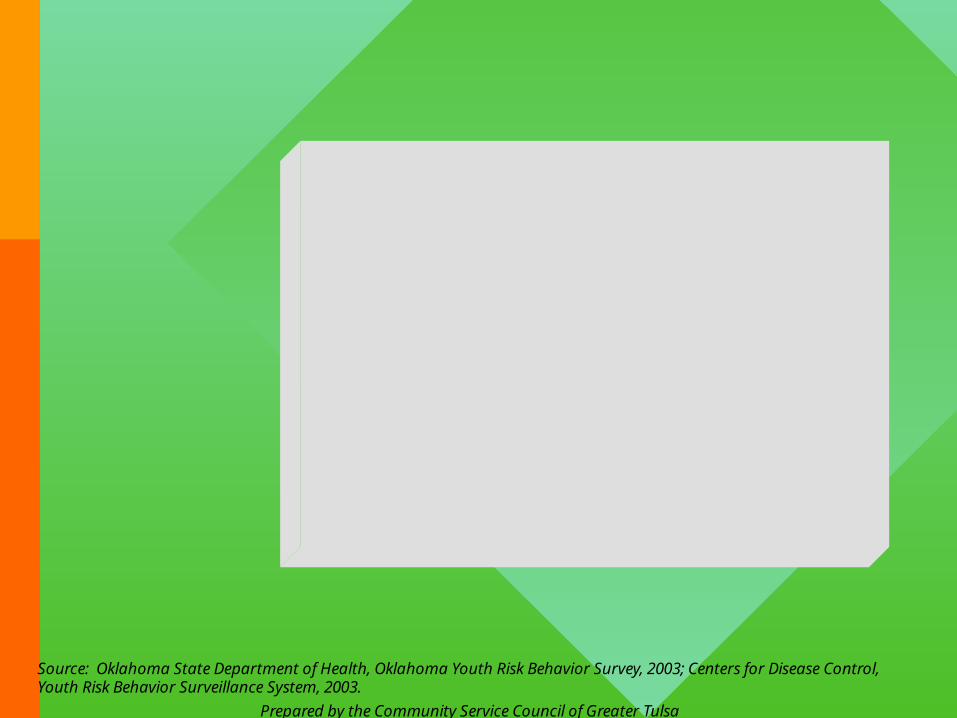
Prepared by the Community Service Council of Greater Tulsa
Source: Oklahoma State Department of Health, Oklahoma Youth Risk Behavior Survey, 2003; Centers for Disease Control, Youth Risk Behavior Surveillance System, 2003.
64%
27%
13%
34%
58%
22%
10%
28%
Ever triedcigarette smoking
Smoked cigarettesduring past month
Smoked cigarettes on 20+ days during past month
Used any tobacco productsduring past month
0%20%40%60%80%100% 0% 20% 40% 60% 80% 100%
Oklahoma U.S.
Results of 2003 Youth Risk Behavior Survey: Tobacco Use
High School Students, Oklahoma and U.S., 2003
Prepared by the Community Service Council of Greater Tulsa
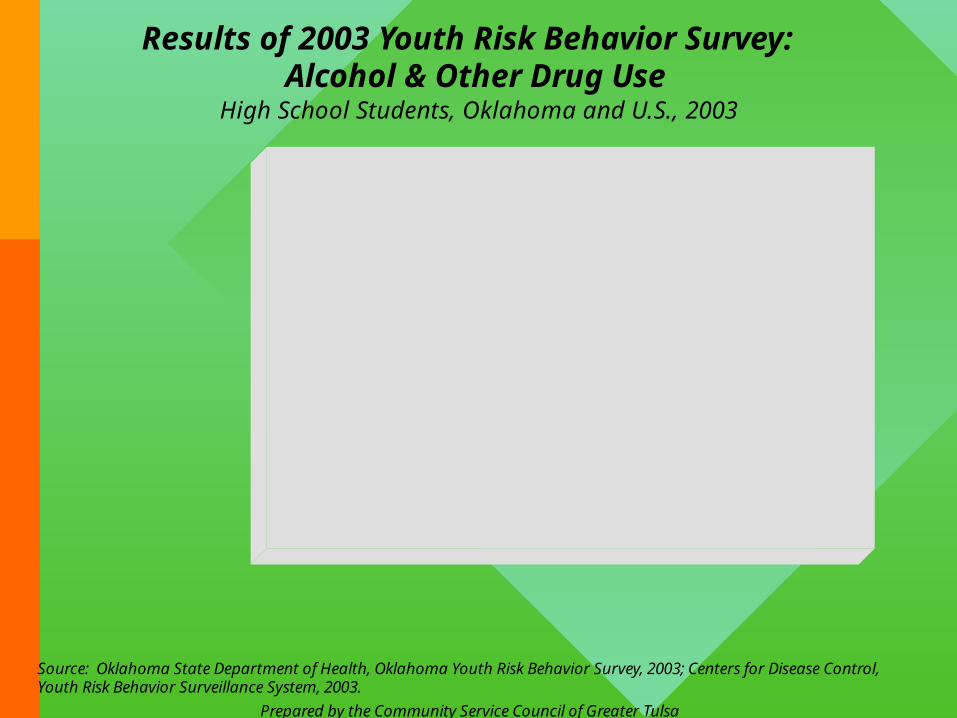
Results of 2003 Youth Risk Behavior Survey: Alcohol & Other Drug Use
High School Students, Oklahoma and U.S., 2003
Source: Oklahoma State Department of Health, Oklahoma Youth Risk Behavior Survey, 2003; Centers for Disease Control, Youth Risk Behavior Surveillance System, 2003.
48%
22%
10%
9%
10%
22%
45%
22%
12%
9%
8%
29%
Alcohol
Marijuana
Inhalants
Cocaine
Methamphetamine
Offered/sold/givenillegal drugs at school
0%20%40%60%80%100% 0% 20% 40% 60% 80% 100%
Oklahoma U.S.
Used once or more during
prior 30 days...
Everused...
Prepared by the Community Service Council of Greater Tulsa
Source: Oklahoma State Department of Health, Oklahoma Youth Risk Behavior Survey, 2003; Centers for Disease Control, Youth Risk Behavior Surveillance System, 2003.
11%
18%
31%
8%
15%
7%
18%
12%
30%
6%
17%
9%
Never or rarely wearseatbelt w/ other driver
Drove after drinkingalcohol in past month
Rode with drinkingdriver in past month
Carried weapon toschool in past month
Seriously consideredsuicide in past year
Attempted suicidein past year
0%20%40%60%80%100% 0% 20% 40% 60% 80% 100%
Oklahoma U.S.
Results of 2003 Youth Risk Behavior Survey: Unintentional Injuries and ViolenceHigh School Students, Oklahoma and U.S., 2003
Prepared by the Community Service Council of Greater Tulsa
Source: Oklahoma State Department of Health, Oklahoma Youth Risk Behavior Survey, 2003; Centers for Disease Control, Youth Risk Behavior Surveillance System, 2003.
50%
37%
6%
16%
4%
25%
36%
82%
47%
34%
7%
14%
4%
25%
37%
83%
Ever had sexual intercourse
Had sex in past 3 months
Had sex before age 13
Have had 4+ sex partners
Have been or havegotten someone pregnant
Had alcohol or drugsbefore last sexual encounter
Did not usecondom last time
Did not usebirth control pills last time
0%20%40%60%80%100% 0% 20% 40% 60% 80% 100%
Oklahoma U.S.
Results of 2003 Youth Risk Behavior Survey: Sexual Behaviors
High School Students, Oklahoma and U.S., 2003
Prepared by the Community Service Council of Greater Tulsa
Source: Oklahoma State Department of Health, Oklahoma Youth Risk Behavior Survey, 2003; Centers for Disease Control, Youth Risk Behavior Surveillance System, 2003.
14%
11%
31%
44%
86%
87%
36%
75%
37%
15%
14%
30%
44%
78%
83%
37%
75%
56%
At risk of overweight(according to BMI)
Overweight(according to BMI)
Perceive selfas overweight
Trying to lose weight
Ate < 5 fruits& veggies daily
Drank < 3 glassesmilk daily
Insufficient vigorousphysical activity
Insufficient moderatephysical activity
Attended PE class1+ days/week
0%20%40%60%80%100% 0% 20% 40% 60% 80% 100%
Oklahoma U.S.
Results of 2003 Youth Risk Behavior Survey: Overweight, Dietary Behaviors and Physical Activity
High School Students, Oklahoma and U.S., 2003

Adolescents at Risk…
Juvenile Crime
Prepared by the Community Service Council of Greater Tulsa
Juvenile Arrests, by Type of CrimeOkmulgee County, 2001 through 2003
Source: Oklahoma State Bureau of Investigation.
91
22 24
99
55
5
31
100
75
20
31
73
Index crimes Drug related Alcohol related Other crimes0
20
40
60
80
100
120
Number of arrests
2001 2002 2003
Includes murder, rape, robbery aggravated assault, burglary,
larceny, and motor vehicle theft.
Includes sale/manufacturing
and possession of drugs.
Includes driving under the influence, liquor law violations, and
drunkenness.
A total of 199 juvenile arrests were made in Okmulgee County in 2003, for a rate of 40.5 per 1,000 juveniles age 10-17, down from 236 arrests
and rate of 46.4 in 2001.
Adolescents at Risk…
Youth Suicide
Prepared by the Community Service Council of Greater Tulsa
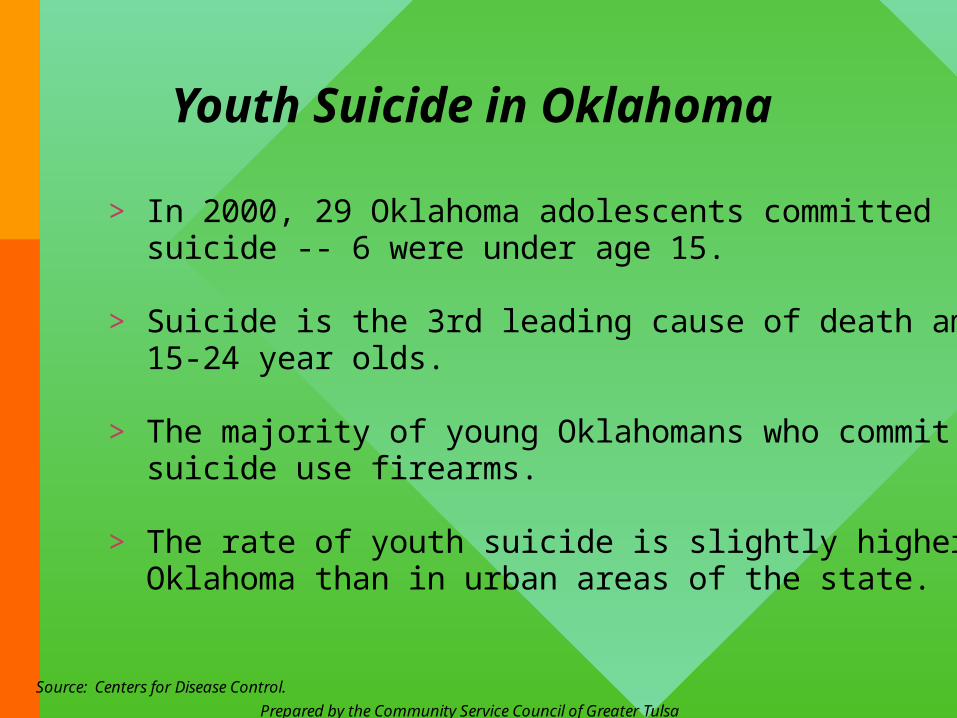
Youth Suicide in Oklahoma
Source: Centers for Disease Control.
In 2000, 29 Oklahoma adolescents committed suicide -- 6 were under age 15.
Suicide is the 3rd leading cause of death among 15-24 year olds.
The majority of young Oklahomans who commit suicide use firearms.
The rate of youth suicide is slightly higher in rural Oklahoma than in urban areas of the state.
>
>
>
>
Prepared by the Community Service Council of Greater Tulsa
...Families at Risk
Families at Risk…
Literacy
Prepared by the Community Service Council of Greater Tulsa
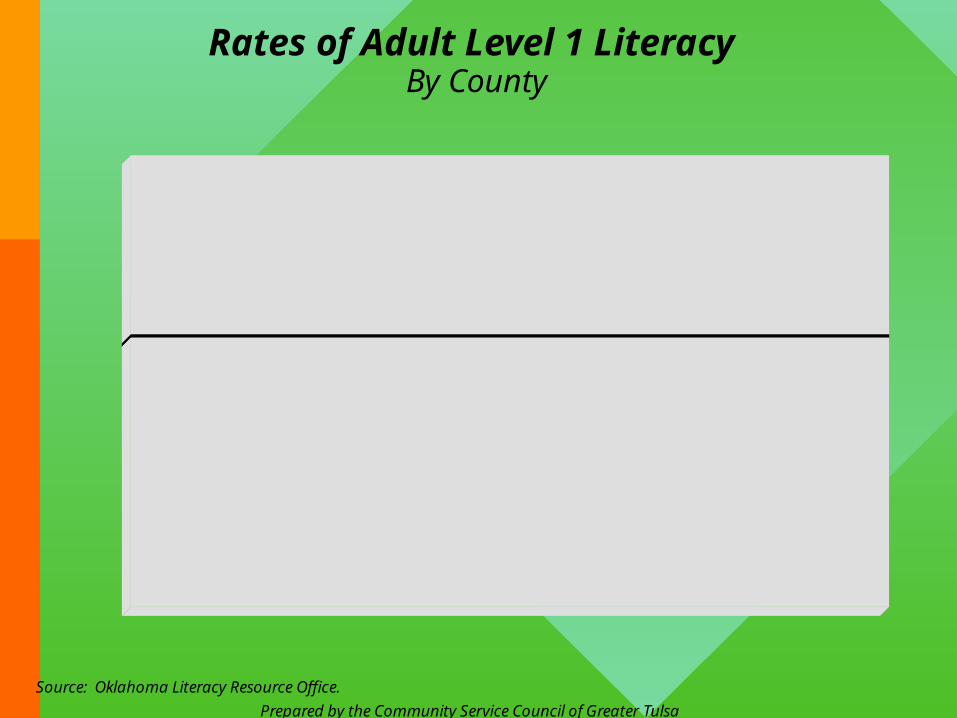
Rates of Adult Level 1 LiteracyBy County
Source: Oklahoma Literacy Resource Office.
15%16%
25%
19%
13% 13%
Tulsa Co. Creek Co. Okmulgee Co. Osage Co. Rogers Co. Wagoner Co.0%
5%
10%
15%
20%
25%
30%Percent of adults at Level 1 Literacy
Level 1 Literacy is the lowest literacy level. Adults at this level display difficulty using certain reading, writing, and computational skills considered necessary for functioning in everyday life.
Oklahoma has a rate of 18%.
Prepared by the Community Service Council of Greater Tulsa
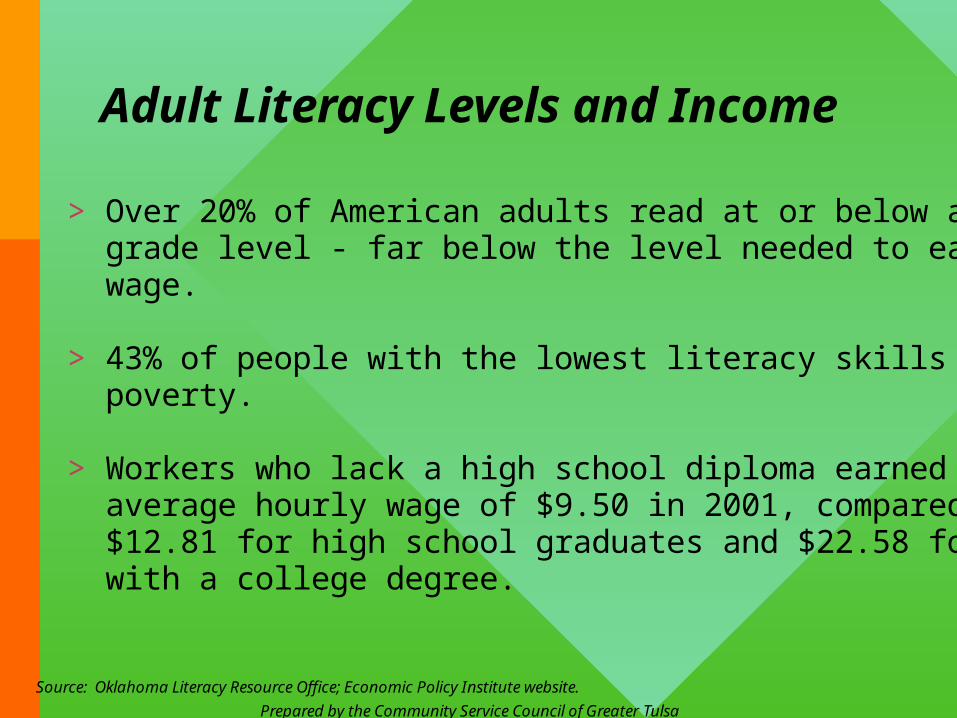
Adult Literacy Levels and Income
Source: Oklahoma Literacy Resource Office; Economic Policy Institute website.
Over 20% of American adults read at or below a 5th grade level - far below the level needed to earn a living wage.
43% of people with the lowest literacy skills live in poverty.
Workers who lack a high school diploma earned an average hourly wage of $9.50 in 2001, compared to $12.81 for high school graduates and $22.58 for those with a college degree.
>
>
>
Prepared by the Community Service Council of Greater Tulsa
Impact of Adult Literacy & Education Levels on Children
Source: Oklahoma Literacy Resource Office.
As the educational level of adults improves, so does their children's success in school; helping low-literate adults improve their basic skills has a direct and measurable impact on both the education and quality of life of their children.
Children of adults who participate in literacy programs improve their grades and test scores, improve their reading skills and are less likely to drop out.
Children's literacy levels are strongly linked to educational level of their parents, especially their mothers.
Children of parents who are unemployed and have not completed high school are five times more likely to drop out than children of employed parents.
>
>
>
>
Prepared by the Community Service Council of Greater Tulsa
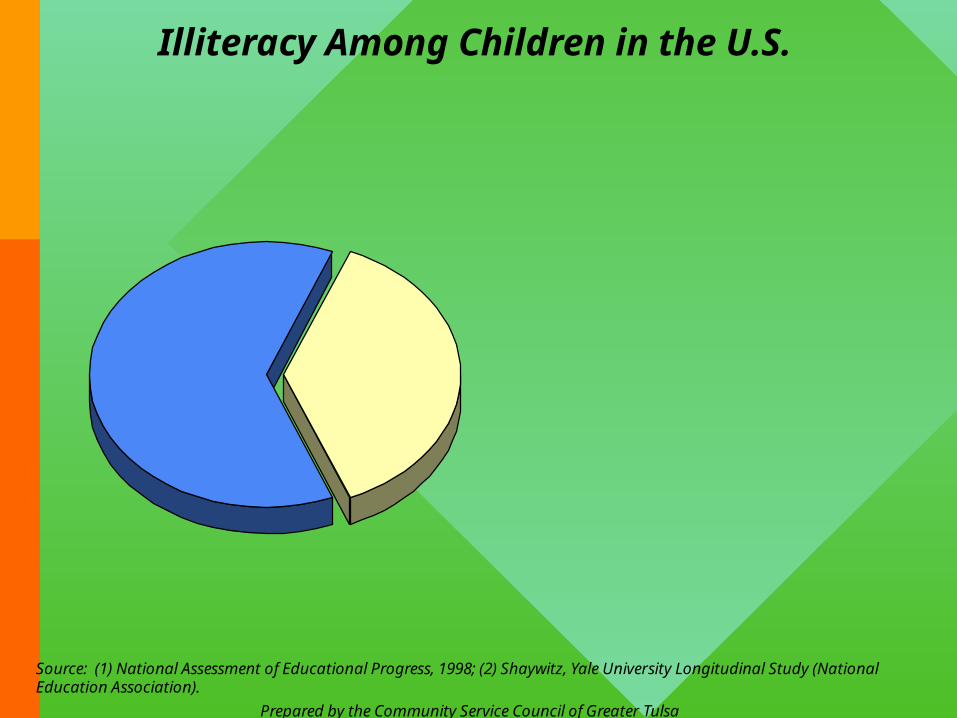
Illiteracy Among Children in the U.S.
Source: (1) National Assessment of Educational Progress, 1998; (2) Shaywitz, Yale University Longitudinal Study (National Education Association).
38%75%
38% of 4th grade students cannot read at grade level.
Of children who cannot read at grade level in 4th grade, 75% never become successful readers.
1 2
All 4th Graders4th Graders Not Reading at
Grade Level
Families at Risk…
Domestic Violence
Prepared by the Community Service Council of Greater Tulsa
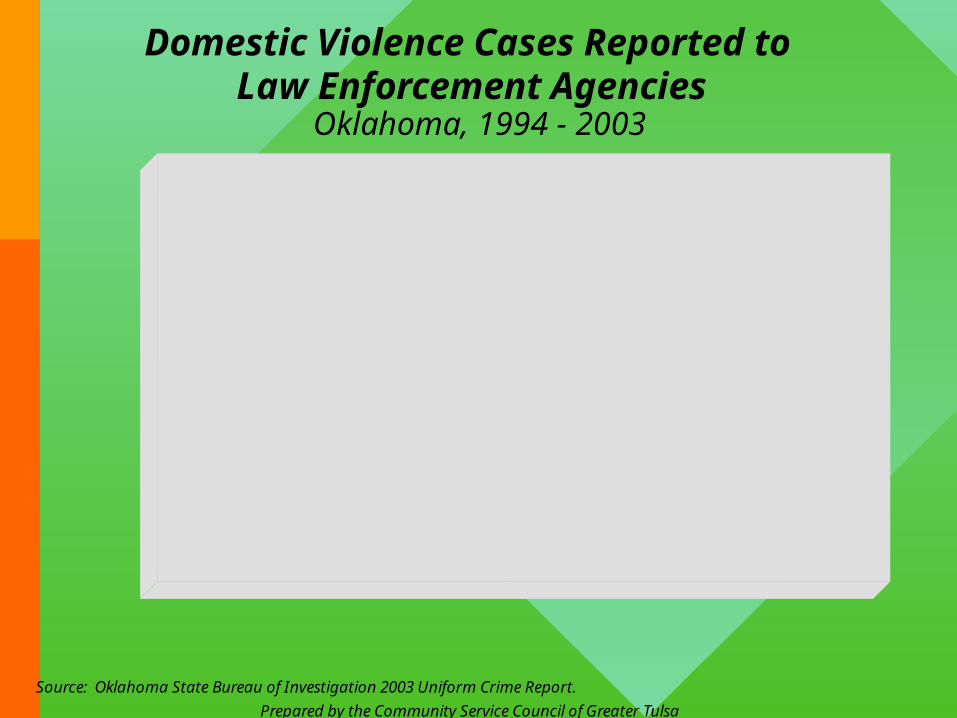
Domestic Violence Cases Reported toLaw Enforcement Agencies
Oklahoma, 1994 - 2003
Source: Oklahoma State Bureau of Investigation 2003 Uniform Crime Report.
1994 1995 1996 1997 1998 1999 2000 2001 2002 20030
5,000
10,000
15,000
20,000
25,000
30,000
Cases 18,153 18,621 21,683 23,087 21,435 21,211 22,065 23,687 25,157 23,773
Prepared by the Community Service Council of Greater Tulsa
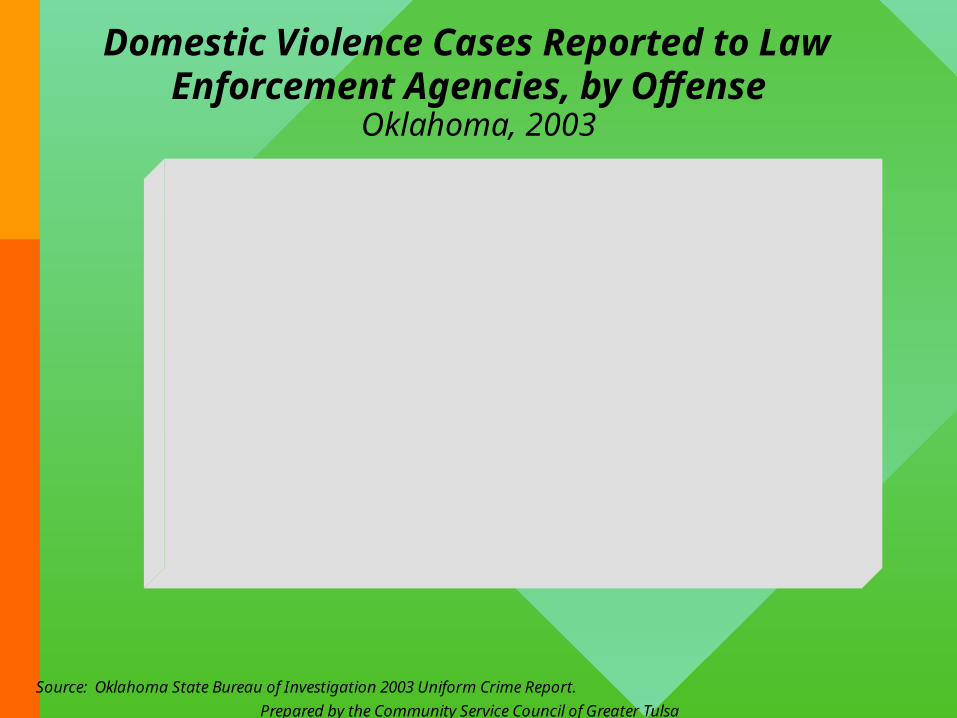
Domestic Violence Cases Reported to Law Enforcement Agencies, by Offense
Oklahoma, 2003
Source: Oklahoma State Bureau of Investigation 2003 Uniform Crime Report.
57 406
5,282
18,028
Homicides Violent sex crimes Felony assaults Felony assaults& battery
0
5,000
10,000
15,000
20,000
A total of 23,773 domestic violence cases were reported to Oklahoma law enforcement agencies in 2003.
Prepared by the Community Service Council of Greater Tulsa
A Research Based Approach
Best Practices... Doing What Works
Prepared by the Community Service Council of Greater Tulsa
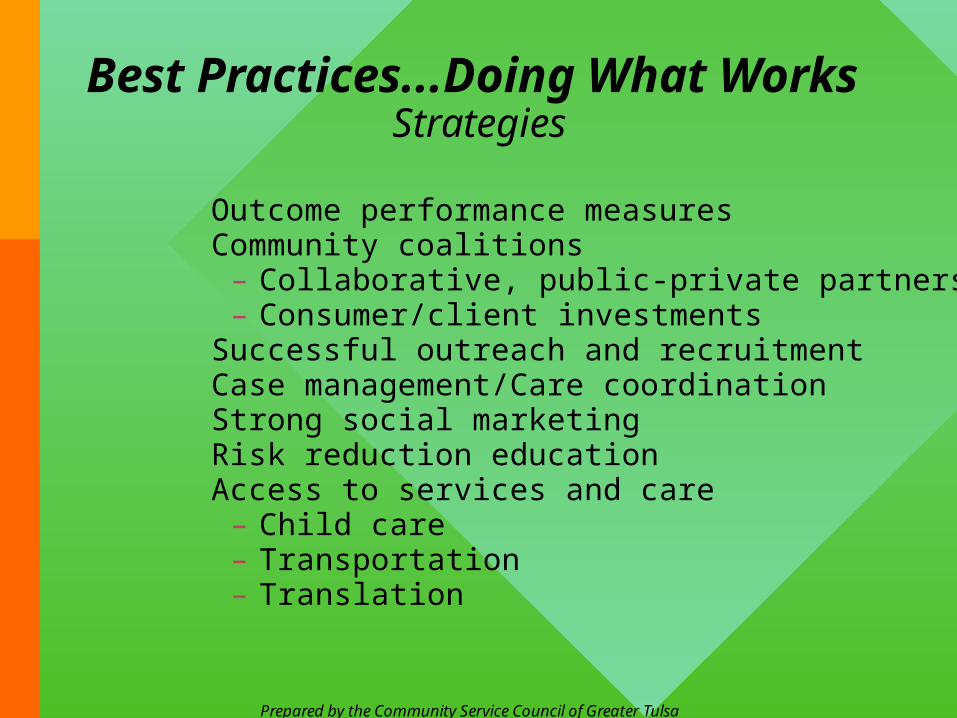
Best Practices...Doing What WorksStrategies
Outcome performance measuresCommunity coalitions
Collaborative, public-private partnershipsConsumer/client investments
Successful outreach and recruitmentCase management/Care coordinationStrong social marketingRisk reduction educationAccess to services and care
Child careTransportationTranslation
��
––
�����
–––
Prepared by the Community Service Council of Greater Tulsa
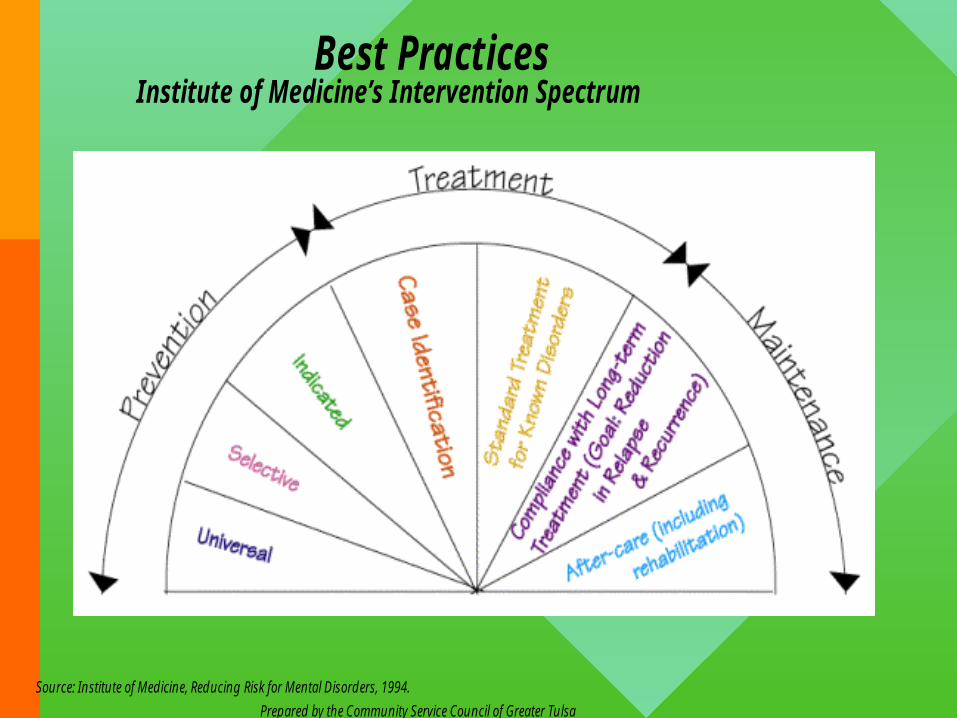
Best Practices
Source: Institute of Medicine, Reducing Risk for Mental Disorders, 1994.
Institute of Medicine’s Intervention Spectrum
Prepared by the Community Service Council of Greater Tulsa
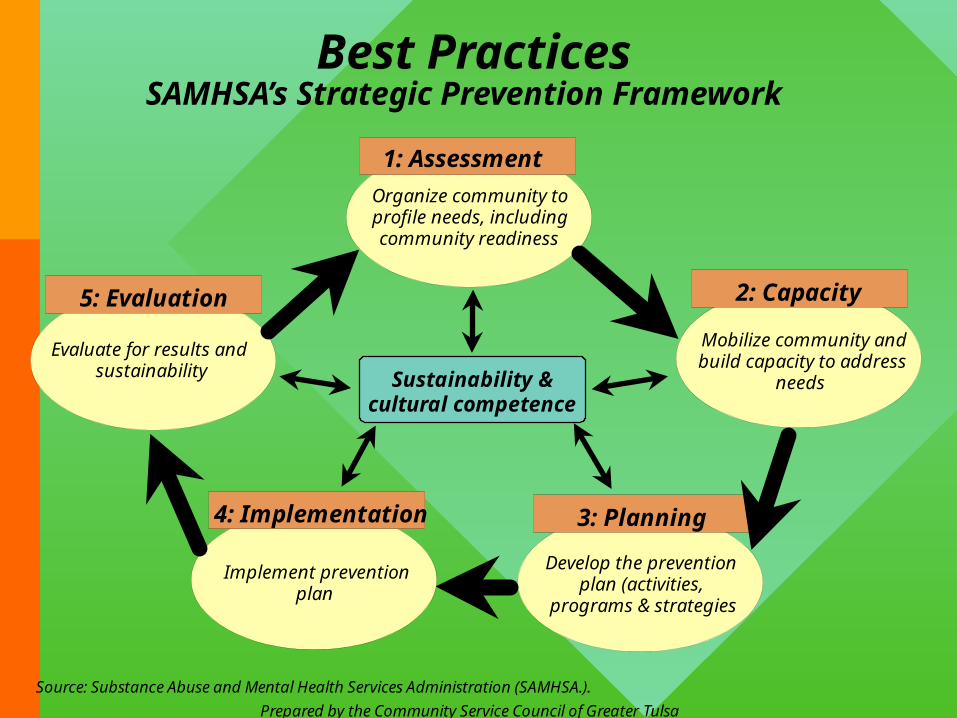
Best PracticesSAMHSA’s Strategic Prevention Framework
Source: Substance Abuse and Mental Health Services Administration (SAMHSA.).
Organize community to profile needs, including community readiness
Mobilize community and build capacity to address
needs
Develop the prevention plan (activities,
programs & strategies
Implement prevention plan
Evaluate for results and sustainability
1: Assessment
2: Capacity
3: Planning4: Implementation
5: Evaluation
Sustainability & cultural competence
Prepared by the Community Service Council of Greater Tulsa
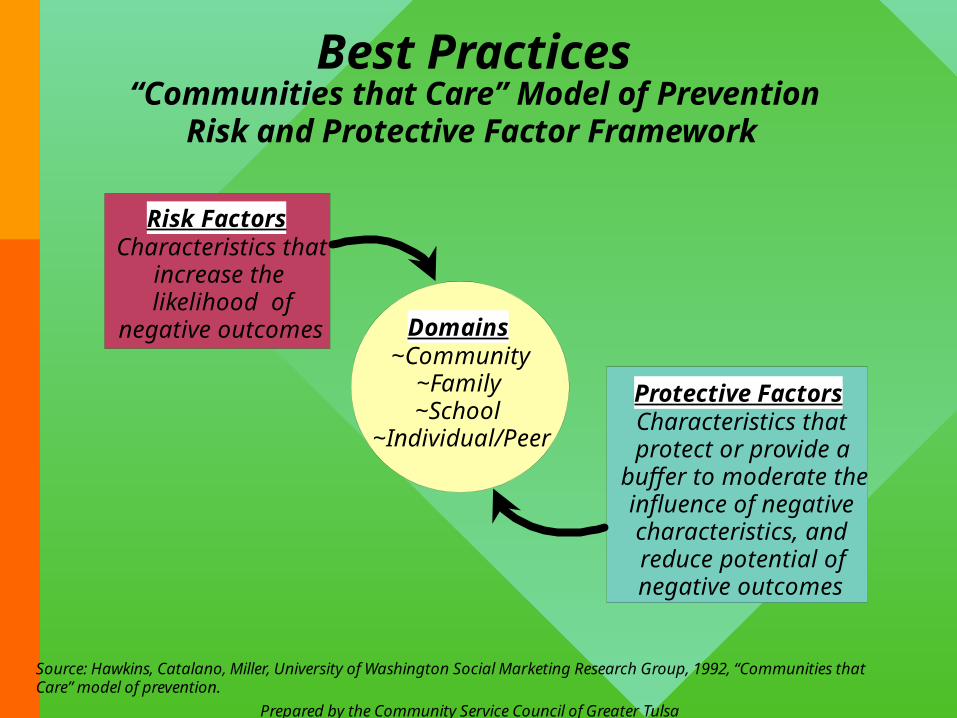
Best Practices“Communities that Care” Model of Prevention
Risk and Protective Factor Framework
Source: Hawkins, Catalano, Miller, University of Washington Social Marketing Research Group, 1992, “Communities that Care” model of prevention.
Risk FactorsCharacteristics that
increase the likelihood of
negative outcomes
Protective FactorsCharacteristics that protect or provide a
buffer to moderate the influence of negative characteristics, and reduce potential of negative outcomes
Domains~Community
~Family~School
~Individual/Peer

Prepared by the Community Service Council of Greater Tulsa
...There is hope when United Way
invests in important long-term change and we all work together.
Prepared by the Community Service Council of Greater Tulsa
Quiz
1. Which area is growing the most rapidly (percent increase)? a. TAUW service area b. Okmulgee Co. c. Okmulgee
2. During the past 30 years, what has happened to the income gap between rich and poor?
a. increased b. decreased c. stable
3. What percentage of all poor families in Okmulgee County have an employed householder and/or spouse?
a. 20% b. 41% c. 58%
4. What percentage of Okmulgee County residents age 25 & older have only a high school education or less?
a. 24% b. 43% c. 61%
5. How does Oklahoma compare to the nation in age-adjusted deaths rates?
a. better b. worse c. same
Prepared by the Community Service Council of Greater Tulsa
TAUW Community Investments Strategy Mission Statement
To take a leadership role in community building by investing TAUW's community resourcesin the most efficient and effective delivery systems for health and human services.
Prepared by the Community Service Council of Greater Tulsa
Community Profile 2006
...now available on the website ofThe Community Service Council of Greater Tulsa
www.csctulsa.org