Embed Size (px)
Citation preview
POPULATION
Mau
CChhaapptteerr 11:: PPooppuullaattiioonn
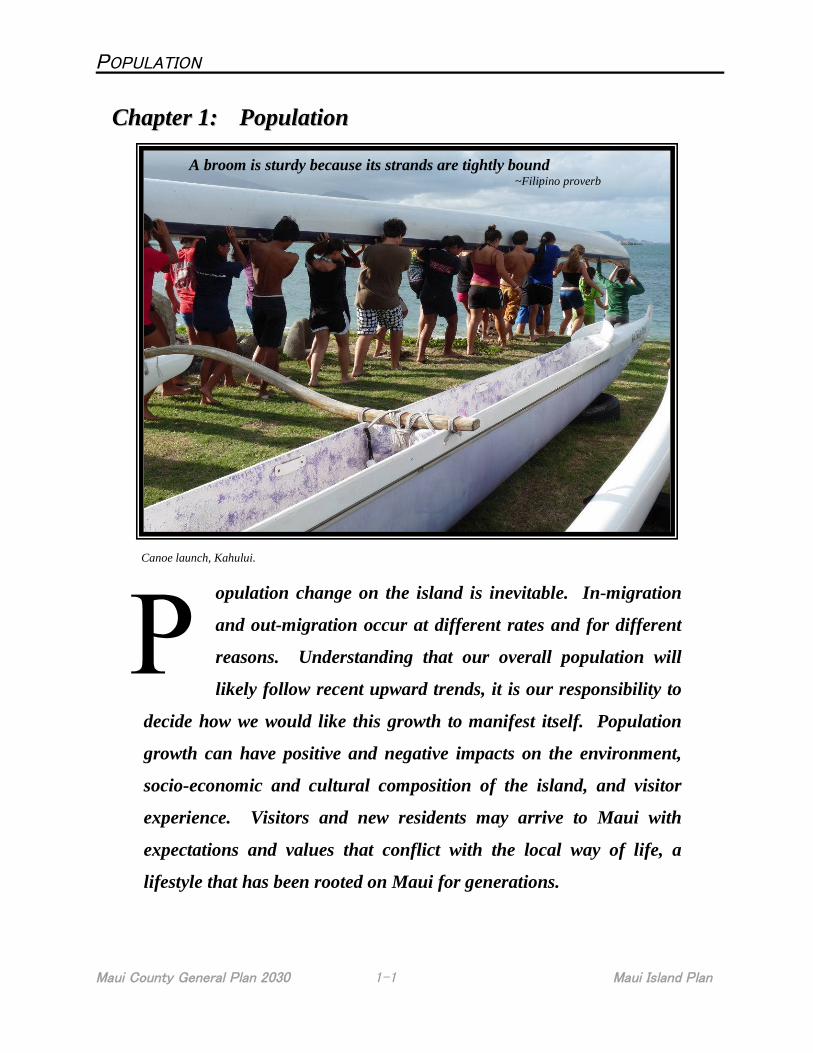
A broom is sturdy because its strands are tightly bound~Filipino proverb
Canoe launch, Kahului.
i County General Plan 2030 1-1 Maui Island Plan
opulation change on the island is inevitable. In-migration
and out-migration occur at different rates and for different
reasons. Understanding that our overall population will
likely follow recent upward trends, it is our responsibility to
decide how we would like this growth to manifest itself. Population
growth can have positive and negative impacts on the environment,
socio-economic and cultural composition of the island, and visitor
experience. Visitors and new residents may arrive to Maui with
expectations and values that conflict with the local way of life, a
lifestyle that has been rooted on Maui for generations.
POPULATION
Maui County General Plan 2030 1-2 Maui Island Plan
The policies that are adopted to address the impacts of population change will ultimately define ourexpectations for the future, and are far more important than the population change itself.
Background Information
The 2030 Socio-Economic Forecast is a planning tool; it identifies future options for the community toconsider. The community may want to adopt policies to achieve a specific outcome that differs from theforecasted outcome, and to minimize the undesirable impacts of current trends. The populationprojections are based on trends and model assumptions that are absent of policy changes or directives.The forecast affects both ongoing planning (project review and approval) and the desired futurearticulated by Maui’s residents and political leaders (General Plan and Community Plans). Because along-term forecast identifies long-term trends and omits short-term variations, there will be manysurprises along the way, even if a forecast turns out to be highly accurate.
The forecast was based on projections developed by the State of Hawai`i Department of Business,Economic Development & Tourism (DBEDT). The forecast allocates expected countywide change tolocal areas. The DBEDT long-term econometric model draws on historical data over three decades, plusprojections from DBEDT and national sources. The DBEDT model (and accordingly, the allocationmodel) is economically driven: industries that attract capital are taken as crucial to economic growth,which in turn leads to new jobs and increased population.
Historic Population Trends
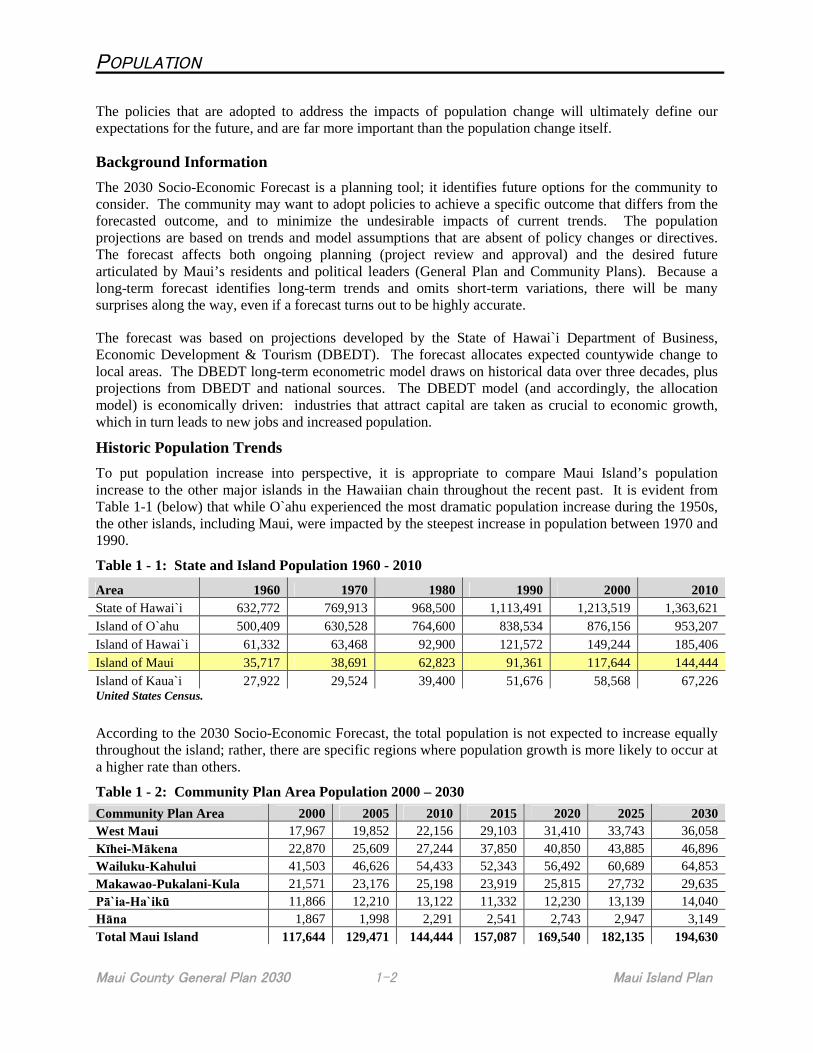
To put population increase into perspective, it is appropriate to compare Maui Island’s populationincrease to the other major islands in the Hawaiian chain throughout the recent past. It is evident fromTable 1-1 (below) that while O`ahu experienced the most dramatic population increase during the 1950s,the other islands, including Maui, were impacted by the steepest increase in population between 1970 and1990.
Table 1 - 1: State and Island Population 1960 - 2010
Area 1960 1970 1980 1990 2000 2010
State of Hawai`i 632,772 769,913 968,500 1,113,491 1,213,519 1,363,621
Island of O`ahu 500,409 630,528 764,600 838,534 876,156 953,207
Island of Hawai`i 61,332 63,468 92,900 121,572 149,244 185,406
Island of Maui 35,717 38,691 62,823 91,361 117,644 144,444
Island of Kaua`i 27,922 29,524 39,400 51,676 58,568 67,226United States Census.
According to the 2030 Socio-Economic Forecast, the total population is not expected to increase equallythroughout the island; rather, there are specific regions where population growth is more likely to occur ata higher rate than others.
Table 1 - 2: Community Plan Area Population 2000 – 2030
Community Plan Area 2000 2005 2010 2015 2020 2025 2030
West Maui 17,967 19,852 22,156 29,103 31,410 33,743 36,058
Kīhei-Mākena 22,870 25,609 27,244 37,850 40,850 43,885 46,896
Wailuku-Kahului 41,503 46,626 54,433 52,343 56,492 60,689 64,853
Makawao-Pukalani-Kula 21,571 23,176 25,198 23,919 25,815 27,732 29,635
Pā`ia-Ha`ikū 11,866 12,210 13,122 11,332 12,230 13,139 14,040
Hāna 1,867 1,998 2,291 2,541 2,743 2,947 3,149
Total Maui Island 117,644 129,471 144,444 157,087 169,540 182,135 194,630
POPULATION
Maui County General Plan 2030 1-3 Maui Island Plan
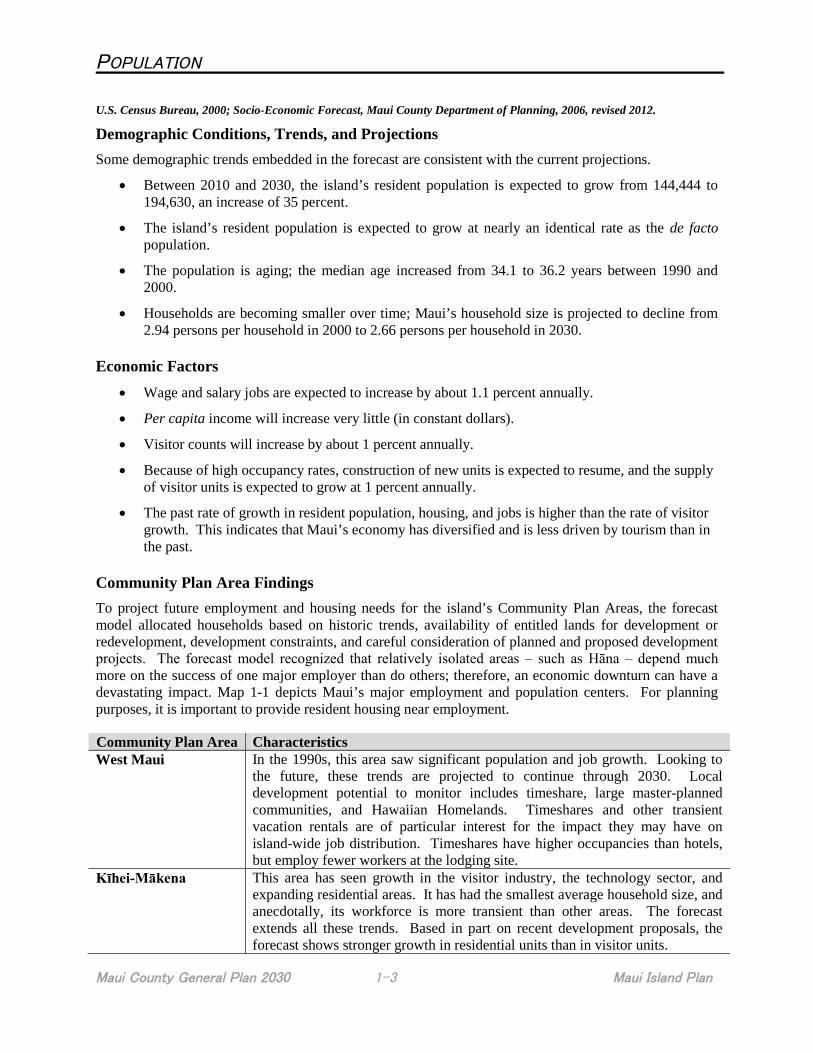
U.S. Census Bureau, 2000; Socio-Economic Forecast, Maui County Department of Planning, 2006, revised 2012.
Demographic Conditions, Trends, and Projections
Some demographic trends embedded in the forecast are consistent with the current projections.
Between 2010 and 2030, the island’s resident population is expected to grow from 144,444 to194,630, an increase of 35 percent.
The island’s resident population is expected to grow at nearly an identical rate as the de factopopulation.
The population is aging; the median age increased from 34.1 to 36.2 years between 1990 and2000.
Households are becoming smaller over time; Maui’s household size is projected to decline from2.94 persons per household in 2000 to 2.66 persons per household in 2030.
Economic Factors
Wage and salary jobs are expected to increase by about 1.1 percent annually.
Per capita income will increase very little (in constant dollars).
Visitor counts will increase by about 1 percent annually.
Because of high occupancy rates, construction of new units is expected to resume, and the supplyof visitor units is expected to grow at 1 percent annually.
The past rate of growth in resident population, housing, and jobs is higher than the rate of visitorgrowth. This indicates that Maui’s economy has diversified and is less driven by tourism than inthe past.
Community Plan Area Findings
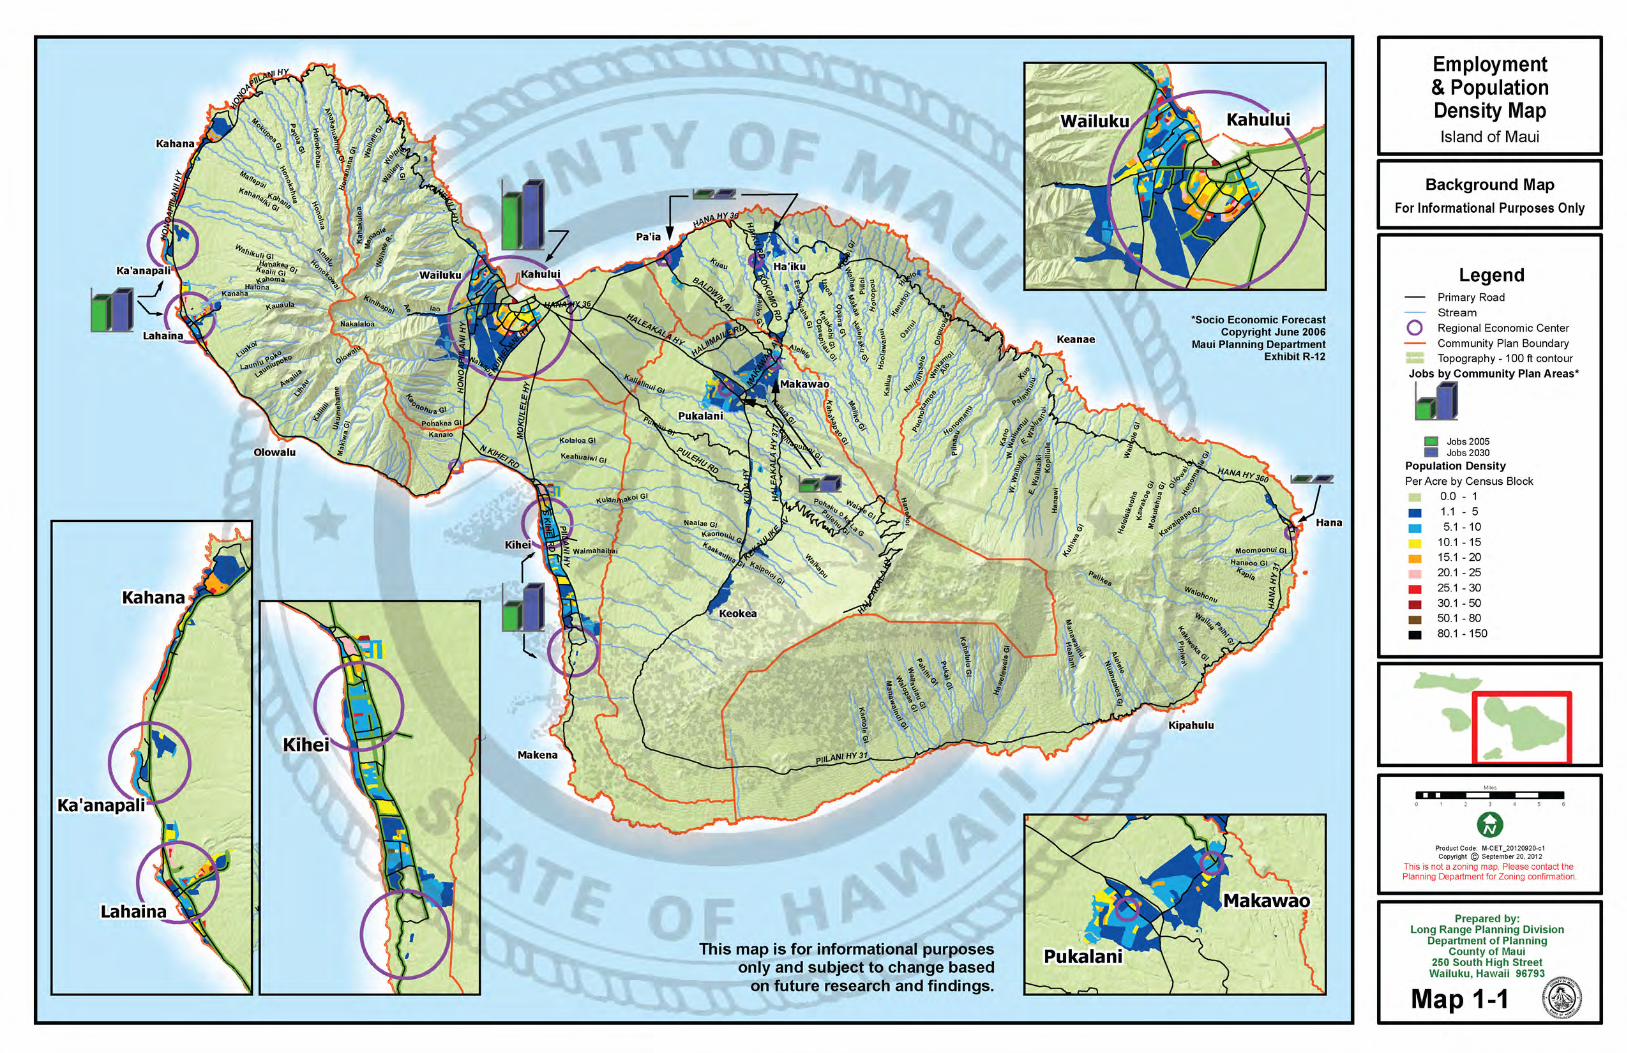
To project future employment and housing needs for the island’s Community Plan Areas, the forecastmodel allocated households based on historic trends, availability of entitled lands for development orredevelopment, development constraints, and careful consideration of planned and proposed developmentprojects. The forecast model recognized that relatively isolated areas – such as Hāna – depend much more on the success of one major employer than do others; therefore, an economic downturn can have adevastating impact. Map 1-1 depicts Maui’s major employment and population centers. For planningpurposes, it is important to provide resident housing near employment.
Community Plan Area CharacteristicsWest Maui In the 1990s, this area saw significant population and job growth. Looking to
the future, these trends are projected to continue through 2030. Localdevelopment potential to monitor includes timeshare, large master-plannedcommunities, and Hawaiian Homelands. Timeshares and other transientvacation rentals are of particular interest for the impact they may have onisland-wide job distribution. Timeshares have higher occupancies than hotels,but employ fewer workers at the lodging site.
Kīhei-Mākena This area has seen growth in the visitor industry, the technology sector, andexpanding residential areas. It has had the smallest average household size, andanecdotally, its workforce is more transient than other areas. The forecastextends all these trends. Based in part on recent development proposals, theforecast shows stronger growth in residential units than in visitor units.
POPULATION
Maui County General Plan 2030 1-4 Maui Island Plan
Community Plan Area CharacteristicsWailuku-Kahului This area remains the economic and population center of the island. In the
1990s, this area saw significant increases in trade, transportation,communications and utilities, and government jobs. Kahului Harbor is the portthrough which most cruise ship visitors reach Maui. The 2030 Socio-EconomicForecast suggests the Wailuku-Kahului Community Plan Area will grow fasterthan other parts of Maui, as former sugar lands are developed into residentialsubdivisions. Wailuku-Kahului is expected to maintain its status as home tomore than a third of Maui’s households.
Makawao-Pukalani-Kula
This area saw significant increases in population in the 1980s, but less growthsubsequently. New development slowed because of water supply problems.Job growth occurred at a much faster rate, but the forecast calls for economicgrowth to continue at a slower pace. With only 1 job located in this area forevery 2.5 households, most of the area’s residents commute outside the area forwork. This will continue to be the case; by 2030, the forecast shows only 2.1local jobs per household .
Pā`ia-Ha`ikū Since windsurfing became popular in the 1980s, this area has taken on newimportance as the home of this sport. In the 1990s, upland regions saw newdevelopment of homes on large agricultural lots, with the area populationincreasing by 52 percent. In light of limited availability of suitable land for newhomes, the forecast calls for much slower growth in housing and population.
Hāna In recent years, this area has seen job losses and a decrease of children andyoung adults. Slow growth is projected over the planning period, provided thevisitor economy remains healthy. Hāna has experienced new population resulting from in-migration.
CHALLENGES AND OPPORTUNITIES
PopulationGrowth
The growth of Maui’s resident and visitor population will create both challenges andopportunities. Population growth can exacerbate existing infrastructure-capacitydeficiencies, place additional demands on environmental resources, foster shifts in thecultural and ethnic makeup of the population, and change the landscape. In addition, theloss of cultural identity and diversity has created social tensions that have increased overat least the last 20 years. The cultural understanding and sensitivity of new residents tothe host culture has been a constant point of discussion throughout the MIP’s public-engagement process.
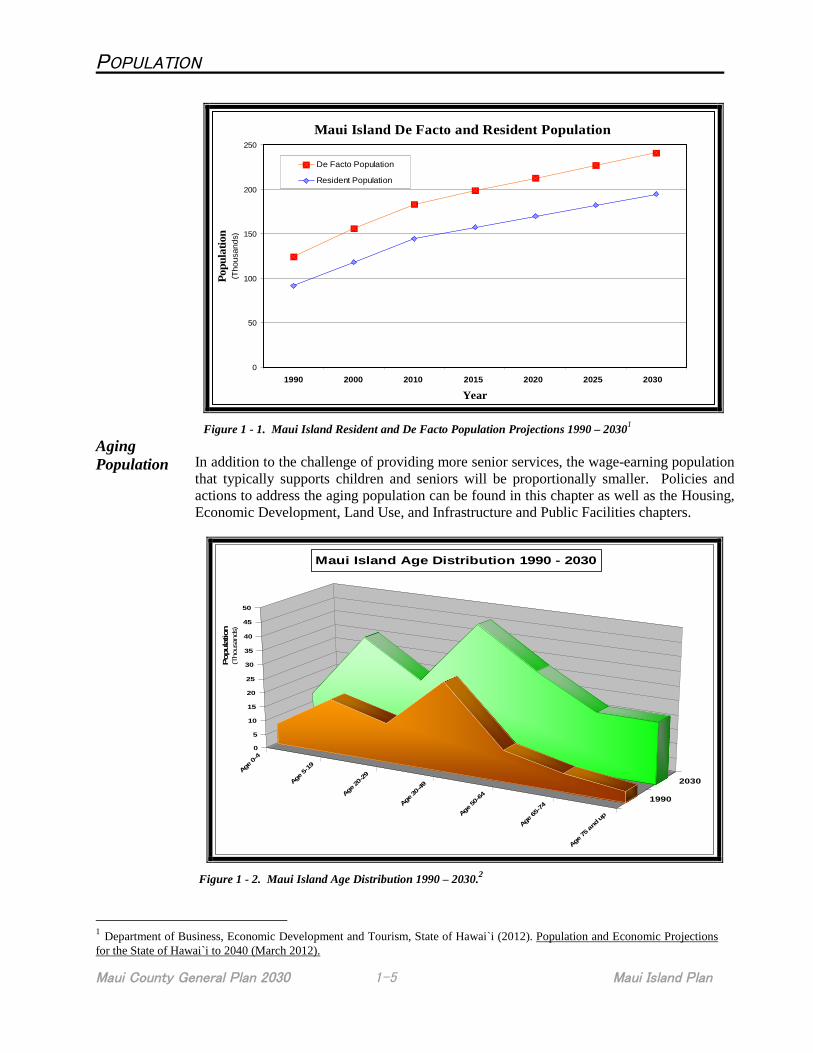
Population growth can also contribute to the health of the community. Population growthis often necessary to maintain a growing economy, an expanding tax base, andemployment opportunities. A host of negative social and economic conditions, such asunemployment, crime, family disintegration, and substance abuse, can be found incommunities with longstanding population loss. Policies and actions to addresspopulation growth on Maui can be found throughout the MIP. Figure 1-1 depicts theprojected growth in Maui’s resident and de facto population to 2030.
Maui’s population is aging; and recent data shows that trends related to Maui’s agingpopulation will be similar to the trends on the Mainland. Figure 1-2 portrays Maui’s agedistribution over time. This demographic change has significant impacts to publicservices as they relate to the elderly, including housing, transportation, health care, andelder care services.
POPULATION
Maui County General Plan 2030 1-5 Maui Island Plan
Maui Island De Facto and Resident Population
0
50
100
150
200
250
1990 2000 2010 2015 2020 2025 2030
(Thousands)
Year
Pop
ula
tion
De Facto Population
Resident Population
Figure 1 - 1. Maui Island Resident and De Facto Population Projections 1990 – 20301
AgingPopulation In addition to the challenge of providing more senior services, the wage-earning population
that typically supports children and seniors will be proportionally smaller. Policies andactions to address the aging population can be found in this chapter as well as the Housing,Economic Development, Land Use, and Infrastructure and Public Facilities chapters.
Age
0-4
Age
5-19
Age
20-29
Age
30-49
Age
50-64
Age
65-74
Age
75an
dup
1990
2030
0
5
10
15
20
25
30
35
40
45
50
Popula
tion
(Thousa
nds)
Maui Island Age Distribution 1990 - 2030
Figure 1 - 2. Maui Island Age Distribution 1990 – 2030.2
1Department of Business, Economic Development and Tourism, State of Hawai`i (2012). Population and Economic Projections
for the State of Hawai`i to 2040 (March 2012).
POPULATION
Maui County General Plan 2030 1-6 Maui Island Plan
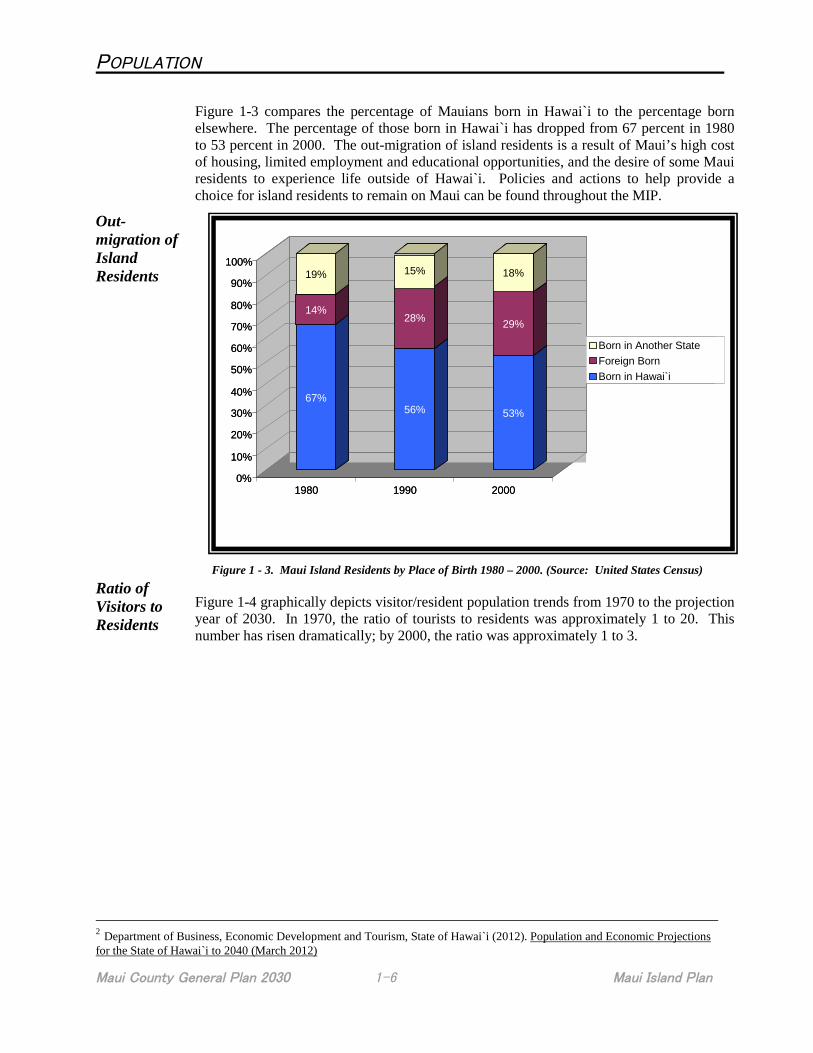
Figure 1-3 compares the percentage of Mauians born in Hawai`i to the percentage bornelsewhere. The percentage of those born in Hawai`i has dropped from 67 percent in 1980to 53 percent in 2000. The out-migration of island residents is a result of Maui’s high costof housing, limited employment and educational opportunities, and the desire of some Mauiresidents to experience life outside of Hawai`i. Policies and actions to help provide achoice for island residents to remain on Maui can be found throughout the MIP.
Out-migration ofIslandResidents
Ratio ofVisitors toResidents
Figure 1 - 3. Maui Island Residents by Place of Birth 1980 – 2000. (Source: United States Census)
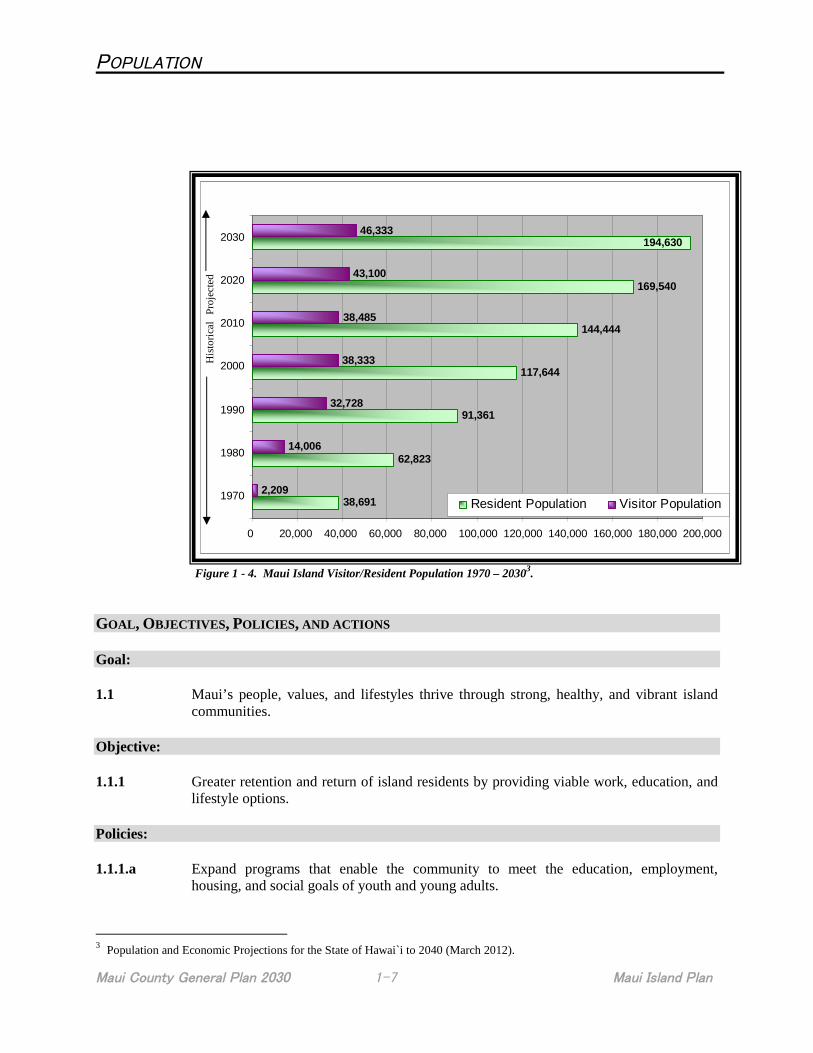
Figure 1-4 graphically depicts visitor/resident population trends from 1970 to the projectionyear of 2030. In 1970, the ratio of tourists to residents was approximately 1 to 20. Thisnumber has risen dramatically; by 2000, the ratio was approximately 1 to 3.
2Department of Business, Economic Development and Tourism, State of Hawai`i (2012). Population and Economic Projections
for the State of Hawai`i to 2040 (March 2012)
67%
14%
19%
56%
28%
15%
53%
29%
18%
0%
10%
20%
30%
40%
50%
60%
70%
80%
90%
100%
1980 1990 2000
Born in another US State
Foreign Born
Born in Hawai‘i
67%
14%
19%
56%
28%
15%
53%
29%
18%
0%
10%
20%
30%
40%
50%
60%
70%
80%
90%
100%
1980 1990 2000
Born in Another State
Foreign Born
Born in Hawai`i
POPULATION
Maui County General Plan 2030 1-7 Maui Island Plan
Figure 1 - 4. Maui Island Visitor/Resident Population 1970 – 20303.
GOAL, OBJECTIVES, POLICIES, AND ACTIONS
Goal:
1.1 Maui’s people, values, and lifestyles thrive through strong, healthy, and vibrant islandcommunities.
Objective:
1.1.1 Greater retention and return of island residents by providing viable work, education, andlifestyle options.
Policies:
1.1.1.a Expand programs that enable the community to meet the education, employment,housing, and social goals of youth and young adults.
3Population and Economic Projections for the State of Hawai`i to 2040 (March 2012).
38,691
62,823
91,361
117,644
144,444
169,540
2,209
14,006
32,728
38,333
38,485
43,100
46,333194,630
0 20,000 40,000 60,000 80,000 100,000 120,000 140,000 160,000 180,000 200,000
1970
1980
1990
2000
2010
2020
2030
Resident Population Visitor Population
Pro
ject
edH
isto
rica
l
POPULATION
Maui County General Plan 2030 1-8 Maui Island Plan
1.1.1.b Expand housing, transportation, employment, and social opportunities to ensure residentsare able to comfortably age within their communities.
1.1.1.c Measure and track resident satisfaction through surveys and community indicators.
1.1.1.d Support funding for transportation, housing, health care, recreation, and social serviceprograms that help those with special needs (including the elderly and disabled).
Implementing Actions:
1.1.1-Action 1 Use an existing agency to facilitate education, employment, housing, socialservices, and other programs that help retain young adults on Maui.
1.1.1-Action 2 Identify existing and develop new funding sources for youth and family services(e.g., recreation, health care, education, housing, child care, etc.) and integratesuch resources to achieve an effective outcome.
1.1.1-Action 3 Develop and regularly conduct a Community Satisfaction Survey to measureresidents’ quality-of-life, facilitate the development of informedpolicies/programs, and improve service delivery.