Embed Size (px)
Citation preview
PROGRAM ON THE GLOBAL DEMOGRAPHY OF AGING
Working Paper Series
Demographic Change, Institutional Settings, and Labor Supply
David E. Bloom, David Canning, Günther Fink, Jocelyn E. Finlay
July 2007
PGDA Working Paper No. 42 http://www.hsph.harvard.edu/pgda/working.htm
The views expressed in this paper are those of the author(s) and not necessarily those of the Harvard Initiative for Global Health. The Program on the Global Demography of Aging receives funding from the National Institute on Aging, Grant No. 1 P30 AG024409-06.
Demographic Change, Institutional Settings, and
Labor Supply1
David E. Bloom David Canning Günther Fink
Jocelyn E. Finlay
Program on the Global Demography of Aging Harvard School of Public Health
July 2007
1 This paper will be presented at the Social Security Workshop of the NBER’s Summer Institute 2007. The authors are grateful to Meghan Tieu for assistance in assembling the data.
Demographic Change, Institutional Settings, and Labor Supply
David E. Bloom
David Canning Günther Fink
Jocelyn E. Finlay
Abstract
We analyze cross-country panel data to examine the effect of key institutional features of
social security systems on male labor supply. Our findings indicate that the labor supply
of older males covaries negatively with replacement rates and system coverage, with the
replacement rate effects being stronger for pay-as-you-go systems than for fully funded
systems. The results also reveal a surprisingly small and often negative response of the
labor supply of older males to improvements in life expectancy.
1
1. Introduction
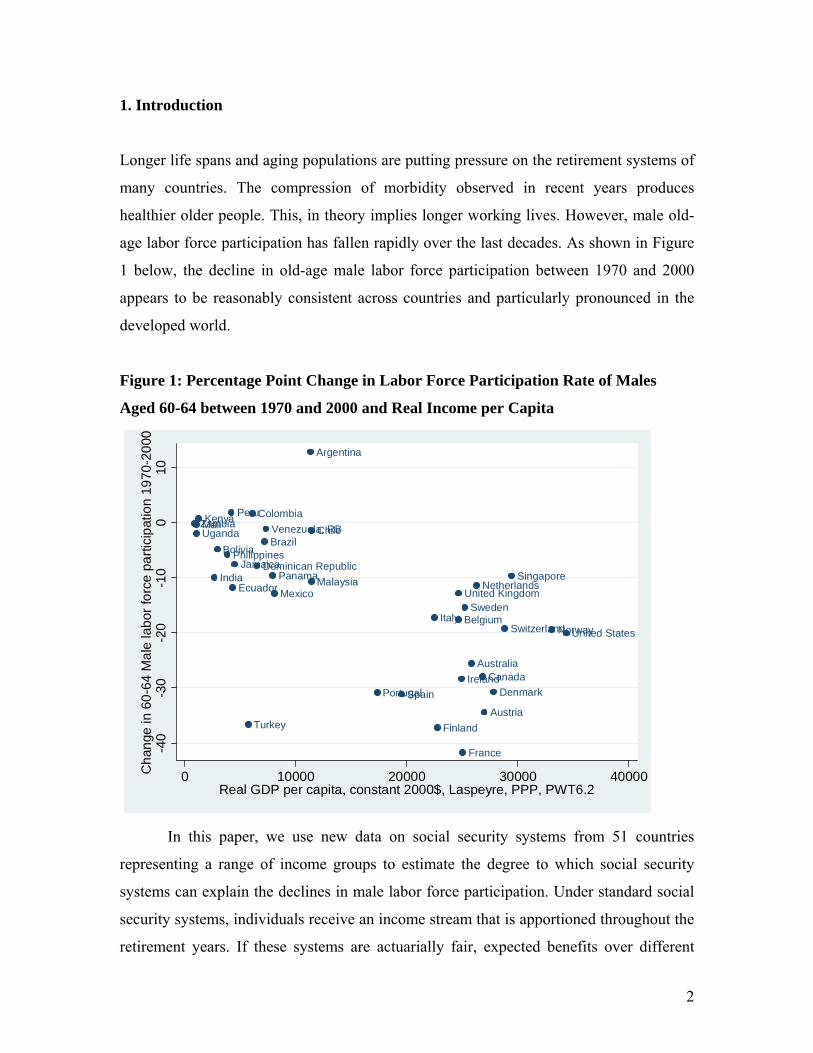
Longer life spans and aging populations are putting pressure on the retirement systems of
many countries. The compression of morbidity observed in recent years produces
healthier older people. This, in theory implies longer working lives. However, male old-
age labor force participation has fallen rapidly over the last decades. As shown in Figure
1 below, the decline in old-age male labor force participation between 1970 and 2000
appears to be reasonably consistent across countries and particularly pronounced in the
developed world.
Figure 1: Percentage Point Change in Labor Force Participation Rate of Males
Aged 60-64 between 1970 and 2000 and Real Income per Capita
Argentina
Australia
Austria
Belgium
BoliviaBrazil
Canada
ChileColombia
Denmark
Dominican Republic
Ecuador
Finland
France
India
Ireland
Italy
Jamaica
Kenya
Malaysia
Mali
MexicoNetherlands
Norway
Panama
Peru
Philippines
Portugal
Singapore
Spain
Sweden
Switzerland
Turkey
Uganda
United Kingdom
United States
Venezuela, RBZambia
-40
-30
-20
-10
010
Cha
nge
in 6
0-64
Mal
e la
bor f
orce
par
ticip
atio
n 19
70-2
000
0 10000 20000 30000 40000Real GDP per capita, constant 2000$, Laspeyre, PPP, PWT6.2
In this paper, we use new data on social security systems from 51 countries
representing a range of income groups to estimate the degree to which social security
systems can explain the declines in male labor force participation. Under standard social
security systems, individuals receive an income stream that is apportioned throughout the
retirement years. If these systems are actuarially fair, expected benefits over different
2

retirement periods would perfectly match contributions and thus not have any direct
influence on old-age labor market decisions (Stock and Wise, 1990; Cremer, Lozachmeur
and Pestieau, 2006). However, actuarial fairness is not a feature of most pension systems,
and retirement incentives are often quite pronounced (Gruber and Wise, 2004). When
there is little to no financial incentive to continue working beyond the minimum
retirement age, only those with strong preferences for working continue to do so (Blondal
and Scarpetta, 1999).
To better understand the magnitude of the labor force participation effects of
social security systems, we separately estimate male labor supply equations for each five-
year cohort in a five-year panel. To control for year- and country-specific factors, we
allow for both country and time-fixed effects in our specifications. We find that life
expectancy and social security arrangements have little effect on labor supply below age
55. For the 55–59 and 60–64 age groups we find that higher wages lead to earlier
retirement, indicating that the income effect dominates. Our results show a surprisingly
small and often negative response of old-age male labor force participation to
improvements in life expectancy. On the other hand, social security systems strongly
affect old-age labor supply; high replacement rates under pay-as-you-go systems
significantly lower old age male labor force participation.
Our results are consistent with a set of recent country studies, many of which are
summarized in two recent volumes by Gruber and Wise (1999; 2004). Our results imply
that the negative effect of social security systems extends to an even broader set of
countries than those focused on in the Gruber and Wise volumes. This is an important
finding, because social security systems have been growing rapidly both in size and in
their diffusion across the developing world and are likely to become a key factor in
economic development.
Our analysis follows most of the existing literature in assuming social security
systems to be independent from labor supply trends. As pointed out by Gruber and Wise
(1998), this assumption may be problematic if governments use social security schemes
3

to accommodate public demand for social assistance for an aging population struggling in
the labor market. For the purpose of our analysis this is only a minor issue. We give two
reasons: first, individual country studies (e.g. Börsch-Supan and Schnabel, 1998) have
shown that changes in policy generally precede changes in labor supply; second, and
more importantly, in contrast to the aggregate ILO measures used in most previous
studies, our social security measures describe old-age retirement systems only and thus
exclude the early retirement schemes commonly used as broad substitute for old-age
unemployment insurance.
The results presented in this paper complement a more general literature on the
effects of social security systems on economic growth. Social security systems distort
savings incentives (Zhang and Zhang, 2004; Bloom, Canning, Mansfield and Moore,
2007), fertility decisions (Cremer, Gahvari and Pestieau, 2006), labor supply (Burtless
and Moffitt, 1985; Krueger and Pischke, 1992; Coile and Gruber, 2000; Coile and
Gruber, 2000), and economic growth (Zhang and Zhang, 2004; Ehrlich and Kim, 2005).
In this paper we show that the effect of social security arrangements on male labor supply
is significant and is therefore an important factor in understanding the long-term
relationship between social security and economic development. For the most part, this
paper does not address female labor supply, which follows different patterns than male
labor supply. As shown in Bloom, Canning, Fink, and Finlay (2007), decreases in fertility
rates combined with general social trends have led to significant increases in female
workforce participation over the last decades.
The rest of the paper is structured as follows: we discuss the data in section two of
the paper and present the empirical results in section three. We conclude with a short
summary and discussion of our main results.
2. Data
The dataset we use in our empirical work is an unbalanced five-year panel
covering the period from 1970 to 2000 for 51 countries2 that range from low to high
2 For a full list of countries, please see the Appendix.
4
income. The dependent variable in our empirical analysis is the male labor force
participation rate. Labor market participation data are from the ILO Bureau of Statistics
(2007) and are based on national labor market surveys and censuses. The participation
rate is the number of economically active individuals divided by the total population in a
given age group. Although definitions vary slightly across countries, those persons
classified as “economically active” are either employed or actively looking for work (ILO
Bureau of Statistics, 2007). Participation rates are provided for each five-year age group
from age group 15–19 up to age group 60–64, and as an average for the population over
age 64.
Our explanatory variables are life expectancy, the percentage of the population
living in urban areas, physical capital per working-age person, lagged economic growth,
average years of schooling, and, of most interest for the purposes of this study, four
variables describing the institutional settings of domestic social security systems.
Life expectancy and urbanization data are from the World Development
Indicators (World Bank, 2006). The physical capital stock is imputed based on the real
capital investment rates from the Penn World Tables 6.2 (Heston, Summers and Aten,
2006), which is also the source for the lagged growth in real GDP per capita. To avoid
potential simultaneity biases in the estimation, we adjust the capital stock by the working-
age population rather than the number of workers. Our human capital measures are the
average years of schooling in the male and female population aged 25 and older as
calculated by Barro and Lee (2000).
Data on social security systems were compiled based on the Social Security
Administration’s “Social Security Programs Throughout the World.”3 The data
originated from a survey conducted by the Social Security Administration that
summarized the key features of national social security systems. We generate four
variables based on each individual country report.
3 http://www.ssa.gov/policy/docs/progdesc/ssptw/
5
The first variable is a basic indicator that takes on a value of one if the system
provides universal coverage. A system is assessed as “universal” if all employees are
covered under the system. The variable is also coded to one if workers in a specific sector
(e.g., agriculture or the public sector) are not covered by the general social security
system, but receive similar coverage through related schemes.
Our second main variable is an indicator variable that takes on a value of one if
the system provides retirement incentives. As discussed extensively in Gruber and Wise
(1999; 2004), retirement incentives come in many forms that generally translate into very
high net effective tax rates on income earned once the worker passes some set retirement
age. Typically, pension payments will only start once the contributor retires, or only be
(fully) paid if earnings do not exceed some given threshold. The U.S. system prior to
2001 provides an example of this system: an earning test used to reduce pension receipts
up until age 70. In 2001 the law was changed and now the test only applies for early
retirement, between ages 62 and 65. We code our variable to one if the social security
system provides explicit incentives to retire and to zero in all other cases, independent of
the actuarial fairness of the system.
In addition to these two broad indicator variables we calculate average
replacement rates as a measure of the size or generosity of social security systems. The
replacement rate is given by the size of the annual pension an average worker receives
upon retirement relative to the typical pre-retirement income.4 Distinguishing between
the two broad types of pension systems, we calculate separate replacement rates for pay-
as-you-go and fully funded systems. In pay-as-you-go systems, the government uses
contributions of current workers to pay the pensions of current retirees following some
intergenerational contract. In a fully funded system, contributions are invested in the
capital market and the earned income is used later to pay pensions. Although funded
pensions are common in defined contribution programs and pay-as-you-go systems are
often associated with defined benefit programs, these pairings do not always hold.
4 In our calculations we assume that workers enter the labor force at age 16 and that the average earnings correspond to two-thirds of GDP per worker.
6

Defined contributions are sometimes part of pay-as-you-go systems, and some defined-
benefit schemes are at least partially based on capital accounts. We assess a system as
funded if social security assets are held by either an independent fund or private
companies that invest freely in a portfolio of assets. Systems like the Sri Lankan one,
where the social security fund holds only debt, essentially mimic basic pay-as-you-go
systems and are coded as such.
In many cases ─ for example, the United States ─ pension systems are
redistributive, so that replacement rates vary considerably across income groups. We
normalize our measure to the average worker so as to have some comparable measure
across countries. For fully funded systems we assume that the contributions in the fund
earn a real rate of return of 3% a year, and are paid out as a constant real annuity upon
retirement. This implies that for the average worker a 1% contribution over the working
life should generate a pension corresponding to 5.7% of income.
The coding is particularly difficult for countries (such as Colombia and Peru
during the 1990s) that introduced new pension schemes over time and left the choice
between the two systems to the worker. To promote comparability, we assume that all
workers eventually fall under the new system, and calculate our measures accordingly.
For countries that have multi-pillar systems with both a funded and a pay-as-you-go
component (such as Australia, Denmark, and Switzerland) we calculate both replacement
rates.
We report descriptive statistics on the dataset we use in Table 1 below. The
countries in the sample are drawn from each of the six major continents and cover a wide
development spectrum. Income per capita (PPP) ranges from US$ 669 (Mali 1970) to
US$ 34,364 (US 2000). Similar differences characterize educational attainment and life
expectancy. For example, male life expectancy at birth ranges in 2000 between 38.1 years
in Zambia and 77.4 years in Sweden.
7
Male labor force participation rates in the age group 55–59 are generally around
90% in developing countries and in the 70–80% range in industrialized countries. In
2000, Belgium had the lowest participation rate (53.8%) in this age group, followed
closely by Italy (53.9%) and Turkey (58.4%). Participation rates are significantly lower
in the 60–64 age group, with a sample mean of 66.1%. A number of countries, such as
Austria, Belgium, and France, display participation rates below 20% in 2000.
Roughly three quarters of the social security systems we considered are classified
as universal, and 57% are classified as providing retirement incentives. Average
replacement rates in our sample are 13% and 52% for fully funded and pay-as-you go
systems, respectively. Singapore is the big outlier within the fully funded systems. Due to
total (employer plus employee) contribution rates exceeding 50% in the 1970s, pensions
up to 285% of wages were paid in the late 1970s and early 1980s. In 2000, replacement
rates had dropped to a more moderate, but still quite impressive 135%. All other
countries have average replacement rates below 100% over the sample period.5
5 There are three cases where replacement rates temporarily exceed 100%: India and Malaysia in 2000 and New Zealand in 1975.
8
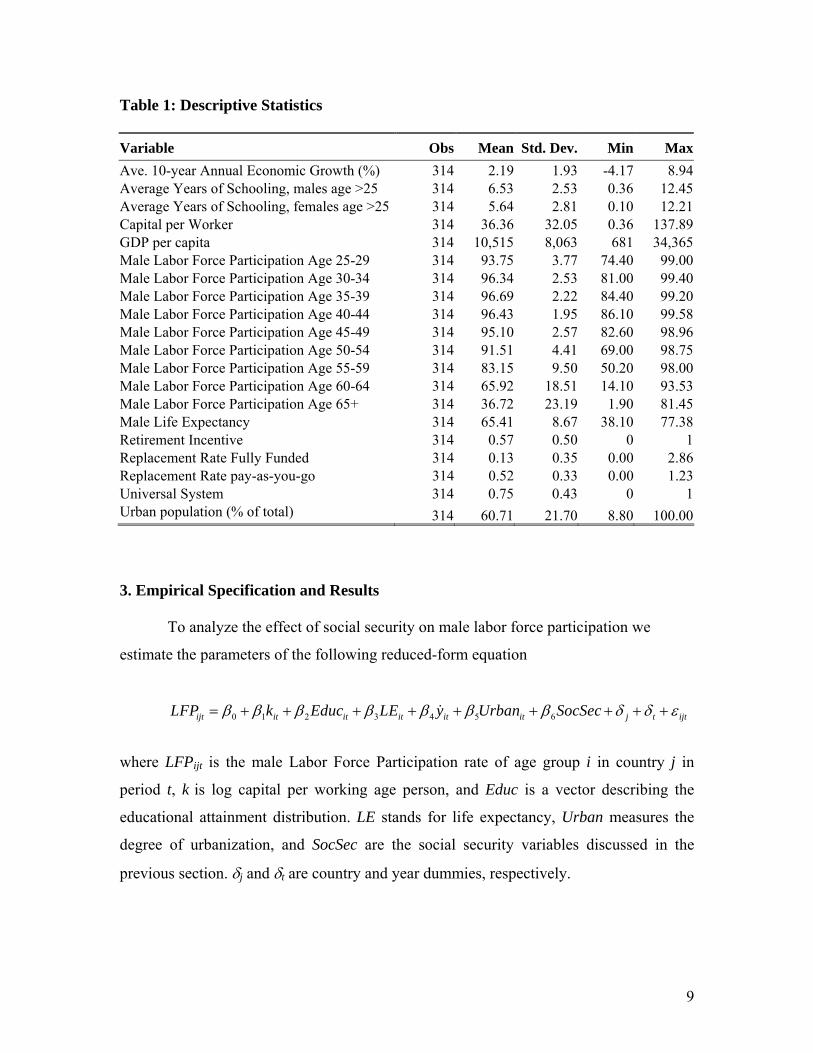
Table 1: Descriptive Statistics Variable Obs Mean Std. Dev. Min MaxAve. 10-year Annual Economic Growth (%) 314 2.19 1.93 -4.17 8.94Average Years of Schooling, males age >25 314 6.53 2.53 0.36 12.45Average Years of Schooling, females age >25 314 5.64 2.81 0.10 12.21Capital per Worker 314 36.36 32.05 0.36 137.89GDP per capita 314 10,515 8,063 681 34,365Male Labor Force Participation Age 25-29 314 93.75 3.77 74.40 99.00Male Labor Force Participation Age 30-34 314 96.34 2.53 81.00 99.40Male Labor Force Participation Age 35-39 314 96.69 2.22 84.40 99.20Male Labor Force Participation Age 40-44 314 96.43 1.95 86.10 99.58Male Labor Force Participation Age 45-49 314 95.10 2.57 82.60 98.96Male Labor Force Participation Age 50-54 314 91.51 4.41 69.00 98.75Male Labor Force Participation Age 55-59 314 83.15 9.50 50.20 98.00Male Labor Force Participation Age 60-64 314 65.92 18.51 14.10 93.53Male Labor Force Participation Age 65+ 314 36.72 23.19 1.90 81.45Male Life Expectancy 314 65.41 8.67 38.10 77.38Retirement Incentive 314 0.57 0.50 0 1Replacement Rate Fully Funded 314 0.13 0.35 0.00 2.86Replacement Rate pay-as-you-go 314 0.52 0.33 0.00 1.23Universal System 314 0.75 0.43 0 1Urban population (% of total) 314 60.71 21.70 8.80 100.00 3. Empirical Specification and Results
To analyze the effect of social security on male labor force participation we
estimate the parameters of the following reduced-form equation
0 1 2 3 4 5 6ijt it it it it it j t ijtLFP k Educ LE y Urban SocSecβ β β β β β β δ δ ε= + + + + + + + + +&
where LFPijt is the male Labor Force Participation rate of age group i in country j in
period t, k is log capital per working age person, and Educ is a vector describing the
educational attainment distribution. LE stands for life expectancy, Urban measures the
degree of urbanization, and SocSec are the social security variables discussed in the
previous section. δj and δt are country and year dummies, respectively.
9

We use capital per working age person (kit) and education as our proxies for
domestic wage rates or potential earnings. To limit endogeneity concerns we normalize
the capital stock to the population of working age rather than the actual number of
workers. For education, we use both the mean and the variance of educational attainment
in our empirical specifications to capture the full educational distribution, and allow for
different coefficients on male and female education. For a given average years of
education, a higher variance of attainment implies a more uneven distribution of
educational benefits, and thus a smaller fraction of the population profiting from higher
wages. With income and substitution effects working in opposite directions the priors on
the wage proxies are ambiguous. A negative coefficient on the average levels implies that
the income effect dominates the substitution effect. A similar, yet slightly more subtle,
argument applies to life expectancy. Although lifetime utility maximization generally
implies a positive effect of life expectancy on retirement age (Bloom, Canning et al.,
2007), this may not necessarily be true if longer life spans are associated with lower
degrees of uncertainty regarding the actual length of life (Kalemli-Ozcan and Weil,
2005).
To capture recent trends in the economy, we also include the average annual
economic growth rate over the ten years preceding each observation. Higher economic
growth implies a larger set of labor market opportunities and thus increases old-age labor
market participation rates.
Last, we estimate the effect of our three principal retirement variables: the
retirement incentive indicator and the replacement rates in fully funded and pay-as-you-
go pension systems, respectively. Because fully funded systems essentially replace
private savings, and because the link between actual contributions and benefits is often
weak in pay-as-you-go systems, the latter system should lead to greater distortions
keeping everything else constant.
As shown in our presentation of the results, we have particular interest in the three
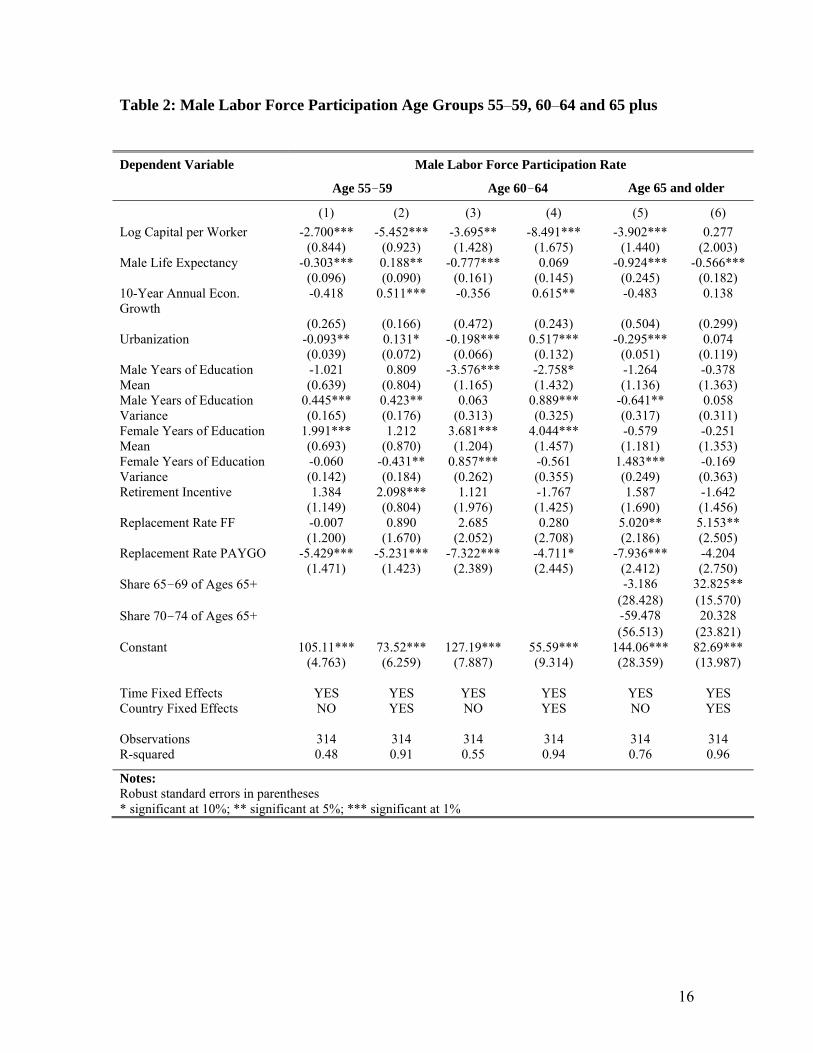
age groups over 55, i.e., those who are eligible for retirement benefits. In Table 2 we
10
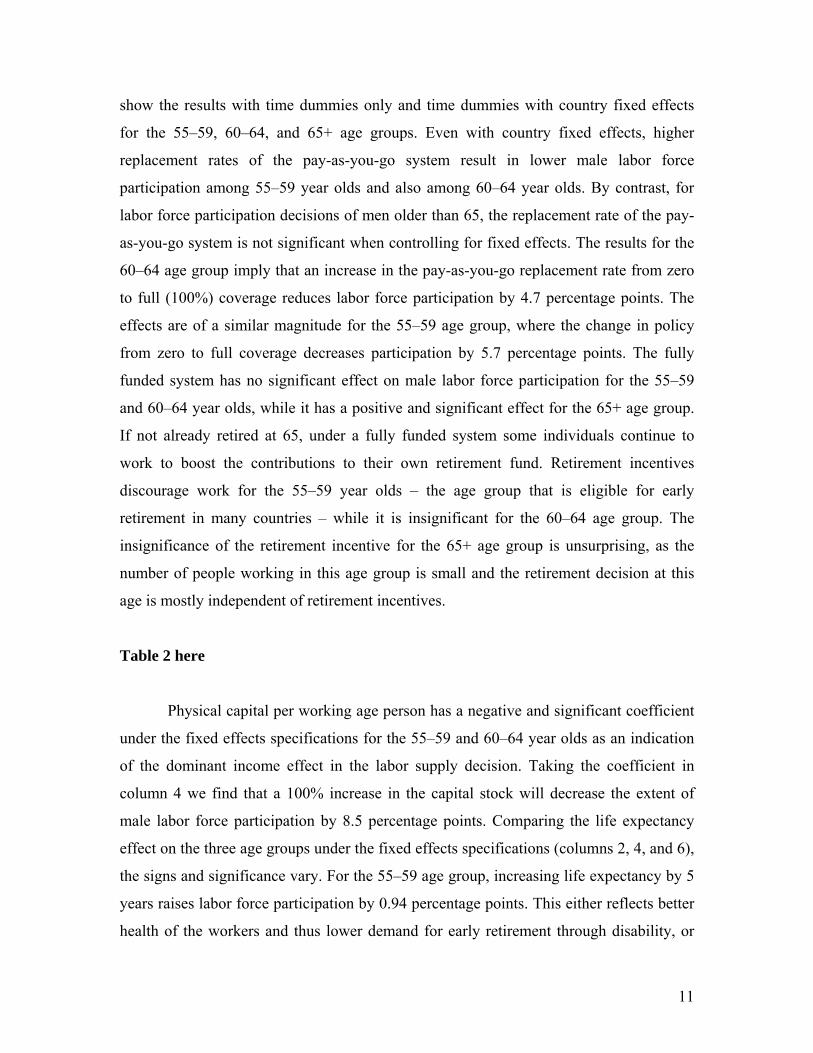
show the results with time dummies only and time dummies with country fixed effects
for the 55–59, 60–64, and 65+ age groups. Even with country fixed effects, higher
replacement rates of the pay-as-you-go system result in lower male labor force
participation among 55–59 year olds and also among 60–64 year olds. By contrast, for
labor force participation decisions of men older than 65, the replacement rate of the pay-
as-you-go system is not significant when controlling for fixed effects. The results for the
60–64 age group imply that an increase in the pay-as-you-go replacement rate from zero
to full (100%) coverage reduces labor force participation by 4.7 percentage points. The
effects are of a similar magnitude for the 55–59 age group, where the change in policy
from zero to full coverage decreases participation by 5.7 percentage points. The fully
funded system has no significant effect on male labor force participation for the 55–59
and 60–64 year olds, while it has a positive and significant effect for the 65+ age group.
If not already retired at 65, under a fully funded system some individuals continue to
work to boost the contributions to their own retirement fund. Retirement incentives
discourage work for the 55–59 year olds – the age group that is eligible for early
retirement in many countries – while it is insignificant for the 60–64 age group. The
insignificance of the retirement incentive for the 65+ age group is unsurprising, as the
number of people working in this age group is small and the retirement decision at this
age is mostly independent of retirement incentives.
Table 2 here
Physical capital per working age person has a negative and significant coefficient
under the fixed effects specifications for the 55–59 and 60–64 year olds as an indication
of the dominant income effect in the labor supply decision. Taking the coefficient in
column 4 we find that a 100% increase in the capital stock will decrease the extent of
male labor force participation by 8.5 percentage points. Comparing the life expectancy
effect on the three age groups under the fixed effects specifications (columns 2, 4, and 6),
the signs and significance vary. For the 55–59 age group, increasing life expectancy by 5
years raises labor force participation by 0.94 percentage points. This either reflects better
health of the workers and thus lower demand for early retirement through disability, or
11

that males in this age group continue to work to maintain a constant consumption stream
over an extended number of years. Turning to column 4, life expectancy does not have a
significant effect on male labor force participation of the 60–64 year olds once we control
for country fixed effects. By contrast, for the 65+ age group, shown in columns 5 and 6,
increasing life expectancy by 5 years will lower labor force participation of this age
group by 2.83 percentage points once we control for country fixed effects.
The ten-year annual economic growth coefficients show a reversal of sign when
country fixed effects are introduced into the specification. For the 55–59 age group, a
country with economic growth 1 percentage point higher than another country will have a
0.5 percentage point higher male labor force participation. A similar order of magnitude
is seen for the 60-64 year olds, with a 1 percentage point increase in economic growth
leading to an increase in male labor force participation of this age group of 0.6 percentage
points. By contrast, under the fixed effects specification for the 65+ age group, the
economic growth has no significant effect. The coefficient on urbanization also
experiences a reversal of the sign when fixed effects are introduced into the specification.
While the effect of urbanization appears negative in the specifications without fixed
effects, the fixed specification displayed in column 2 of Table 2 implies that a 10%
higher urbanization rate is associated with a 1.3% higher male labor force participation in
the age group 55-59. The magnitude is even higher for the 60–64 age group, where
countries with 10% higher proportion of urban population will have a 5.2% higher male
force participation rate.
With the prior that more education tends to lead to a higher wage, the negative
sign on the average male years of schooling indicates that the income effect dominates in
the labor supply decision for the 60–64 year olds. A higher variance of the male years of
schooling is associated with a higher male labor force participation rate; a mean
preserving spread in the wage distribution decreases the number of workers profiting
from high wages and thus increases labor force participation. On the other hand, female
education has a positive effect on male labor force participation. Given the positive
12
correlation between female education and female labor supply, this result may provide
evidence of a joint, complementary, household decision about labor force participation.
Table 3 here
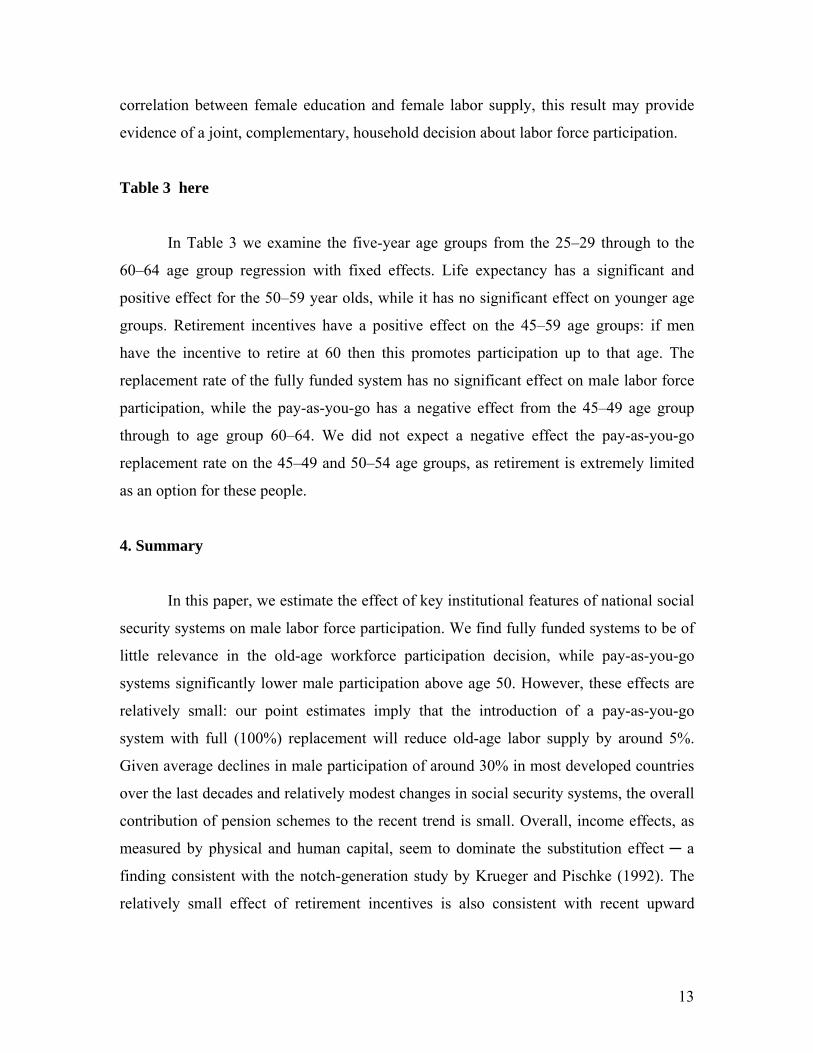
In Table 3 we examine the five-year age groups from the 25–29 through to the
60–64 age group regression with fixed effects. Life expectancy has a significant and
positive effect for the 50–59 year olds, while it has no significant effect on younger age
groups. Retirement incentives have a positive effect on the 45–59 age groups: if men
have the incentive to retire at 60 then this promotes participation up to that age. The
replacement rate of the fully funded system has no significant effect on male labor force
participation, while the pay-as-you-go has a negative effect from the 45–49 age group
through to age group 60–64. We did not expect a negative effect the pay-as-you-go
replacement rate on the 45–49 and 50–54 age groups, as retirement is extremely limited
as an option for these people.
4. Summary
In this paper, we estimate the effect of key institutional features of national social
security systems on male labor force participation. We find fully funded systems to be of
little relevance in the old-age workforce participation decision, while pay-as-you-go
systems significantly lower male participation above age 50. However, these effects are
relatively small: our point estimates imply that the introduction of a pay-as-you-go
system with full (100%) replacement will reduce old-age labor supply by around 5%.
Given average declines in male participation of around 30% in most developed countries
over the last decades and relatively modest changes in social security systems, the overall
contribution of pension schemes to the recent trend is small. Overall, income effects, as
measured by physical and human capital, seem to dominate the substitution effect ─ a
finding consistent with the notch-generation study by Krueger and Pischke (1992). The
relatively small effect of retirement incentives is also consistent with recent upward
13

trends in female old-age labor supply, which exist in contrast to downward trends among
men despite women facing the same social security benefits.
14

Appendix Country List
Argentina, Australia, Austria, Belgium, Bolivia, Brazil, Canada, Chile, Colombia,
Denmark, Dominican Republic, Ecuador, Egypt (Arab Rep.), Finland, France, Ghana,
India, Indonesia, Ireland, Israel, Italy, Jamaica, Kenya, Korea (Rep. of), Malaysia, Mali,
Mexico, Netherlands, Norway, Panama, Peru, Philippines, Portugal, Senegal, Singapore,
South Africa, Spain, Sri Lanka, Sweden, Switzerland, Tunisia, Turkey, Uganda, United
Kingdom, United States, Uruguay, Venezuela, Zambia, Zimbabwe
15
16
Table 2: Male Labor Force Participation Age Groups 55–59, 60–64 and 65 plus Dependent Variable Male Labor Force Participation Rate
Age 55–59 Age 60–64 Age 65 and older
(1) (2) (3) (4) (5) (6) Log Capital per Worker -2.700*** -5.452*** -3.695** -8.491*** -3.902*** 0.277 (0.844) (0.923) (1.428) (1.675) (1.440) (2.003) Male Life Expectancy -0.303*** 0.188** -0.777*** 0.069 -0.924*** -0.566*** (0.096) (0.090) (0.161) (0.145) (0.245) (0.182) 10-Year Annual Econ. Growth
-0.418 0.511*** -0.356 0.615** -0.483 0.138
(0.265) (0.166) (0.472) (0.243) (0.504) (0.299) Urbanization -0.093** 0.131* -0.198*** 0.517*** -0.295*** 0.074 (0.039) (0.072) (0.066) (0.132) (0.051) (0.119) Male Years of Education -1.021 0.809 -3.576*** -2.758* -1.264 -0.378 Mean (0.639) (0.804) (1.165) (1.432) (1.136) (1.363) Male Years of Education 0.445*** 0.423** 0.063 0.889*** -0.641** 0.058 Variance (0.165) (0.176) (0.313) (0.325) (0.317) (0.311) Female Years of Education 1.991*** 1.212 3.681*** 4.044*** -0.579 -0.251 Mean (0.693) (0.870) (1.204) (1.457) (1.181) (1.353) Female Years of Education -0.060 -0.431** 0.857*** -0.561 1.483*** -0.169 Variance (0.142) (0.184) (0.262) (0.355) (0.249) (0.363) Retirement Incentive 1.384 2.098*** 1.121 -1.767 1.587 -1.642 (1.149) (0.804) (1.976) (1.425) (1.690) (1.456) Replacement Rate FF -0.007 0.890 2.685 0.280 5.020** 5.153** (1.200) (1.670) (2.052) (2.708) (2.186) (2.505) Replacement Rate PAYGO -5.429*** -5.231*** -7.322*** -4.711* -7.936*** -4.204 (1.471) (1.423) (2.389) (2.445) (2.412) (2.750) Share 65–69 of Ages 65+ -3.186 32.825** (28.428) (15.570) Share 70–74 of Ages 65+ -59.478 20.328 (56.513) (23.821) Constant 105.11*** 73.52*** 127.19*** 55.59*** 144.06*** 82.69*** (4.763) (6.259) (7.887) (9.314) (28.359) (13.987) Time Fixed Effects YES YES YES YES YES YES Country Fixed Effects NO YES NO YES NO YES Observations 314 314 314 314 314 314 R-squared 0.48 0.91 0.55 0.94 0.76 0.96
Notes: Robust standard errors in parentheses * significant at 10%; ** significant at 5%; *** significant at 1%
17
Table 3: Male Labor Force Participation All Age Groups: Year and Country Fixed Effects Dependent Variable: Male Labor Force Participation Rate Age Group
Age Group: 25–29 30–34 35–39 40–44 45–49 50–54 55–59 60–64 Log (Capital per Working Age) -1.290** -0.381 -0.543 -0.527 -0.739* -1.918*** -5.452*** -8.491*** (0.548) (0.391) (0.350) (0.339) (0.391) (0.595) (0.923) (1.675) Male Life Expectancy -0.049 0.049 0.025 -0.005 0.037 0.114** 0.188** 0.069 (0.055) (0.047) (0.044) (0.037) (0.033) (0.051) (0.090) (0.145) Economic Growth (Avg. last 10Y) 0.229** 0.177** 0.086 0.080* 0.100* 0.130 0.511*** 0.615** (0.095) (0.071) (0.066) (0.047) (0.051) (0.089) (0.166) (0.243) Urbanization 0.099** -0.016 0.010 0.075*** 0.034 0.037 0.131* 0.517*** (0.049) (0.044) (0.032) (0.018) (0.026) (0.046) (0.072) (0.132) Mean Male Years of Education 0.760 0.553 0.415 -0.449** -0.809*** 0.270 0.809 -2.758* (0.509) (0.478) (0.380) (0.212) (0.250) (0.445) (0.804) (1.432) Variance Male Years of Education -0.093 -0.144 -0.129* 0.011 0.051 0.186** 0.423** 0.889*** (0.110) (0.106) (0.077) (0.050) (0.060) (0.091) (0.176) (0.325) Mean Female Years of Education -0.224 -0.321 -0.443 0.559** 1.066*** 0.863* 1.212 4.044*** (0.486) (0.439) (0.355) (0.217) (0.272) (0.496) (0.870) (1.457) Variance Female Years of Education 0.223 0.322** 0.368*** 0.140*** 0.090 -0.133 -0.431** -0.561 (0.147) (0.148) (0.100) (0.053) (0.064) (0.096) (0.184) (0.355) Retirement Incentive 0.235 0.510 0.526* 0.206 0.816** 1.663*** 2.098*** -1.767 (0.355) (0.309) (0.286) (0.287) (0.363) (0.537) (0.804) (1.425) Replacement Rate FF 0.680 0.178 0.549 0.304 0.455 1.071 0.890 0.280 (0.719) (0.411) (0.608) (0.532) (0.565) (0.986) (1.670) (2.708) Replacement Rate PAYGO 0.046 0.438 0.397 -0.359 -1.384** -4.170*** -5.231*** -4.711* (0.755) (0.498) (0.462) (0.437) (0.600) (0.963) (1.423) (2.445) Constant 80.79*** 89.64*** 90.97*** 92.26*** 93.03*** 85.87*** 73.52*** 55.59*** (3.811) (2.987) (2.780) (2.196) (2.322) (3.785) (6.259) (9.314) Time Fixed Effects YES YES YES YES YES YES YES YES Country Fixed Effects YES YES YES YES YES YES YES YES Observations 314 314 314 314 314 314 314 314 R-squared 0.84 0.76 0.80 0.84 0.85 0.86 0.91 0.94 Notes: Robust standard errors in parentheses * significant at 10%; ** significant at 5%; *** significant at 1%
References:
Barro, R. J. and J.-W. Lee (2000). "International Data on Educational Attainment: Updates and Implications." CID Working Paper 42.
Blondal, S. and S. Scarpetta (1999). "The Retirement Decision in OECD Countries." OECD Economics Department Working Paper 202.
Bloom, D. E., D. Canning, G. Fink and J. E. Finlay (2007). "Fertility and Female Labor Supply." Mimeo, PGDA, Harvard University.
Bloom, D. E., D. Canning, R. K. Mansfield and M. Moore (2007). "Demographic Change, Social Security Systems and Savings." Journal of Monetary Economics 54: 92-114.
Börsch-Supan, A. and R. Schnabel (1998). "Social Security and Declining Labor-Force Participation in Germany." American Economic Review 88(2): 173-178.
Burtless, G. and R. A. Moffitt (1985). "The Joint Choice of Retirement Age and Postretirement Hours of Work " Journal of Labor Economics 3(2): 209-236.
Coile, C. and J. Gruber (2000). "Social Security and Retirement." NBER Working Paper 7830. Coile, C. and J. Gruber (2000). "Social Security Incentives for Retirement." NBER Working
Paper 7651. Cremer, H., F. Gahvari and P. Pestieau (2006). "Pensions with Endogenous and Stochastic
Fertility." Journal of Public Economics 90: 2303-2321. Cremer, H., J.-M. Lozachmeur and P. Pestieau (2006). "Social Security and Retirement
Decisions: A Positive and Normative Approach." CPER Working Paper. Ehrlich, I. and J. Kim (2005). "Social Security, Demographic Trends, and Economic Growth:
Theory and Evidence from the International Experience." NBER Working Paper 11121. Gruber, J. and D. Wise (1998). "Social Security and Retirement: An International Comparison."
The American Economic Review 88(2): 158-163. Gruber, J. and D. A. Wise (1999). Social Security and Retirement around the World. Chicago,
The University of Chicago Press. Gruber, J. and D. A. Wise (2004). Social Security Programs and Retirement around the World:
Micro-Estimation. Chicago, The University of Chicago Press. Heston, A., R. Summers and B. Aten (2006). "Penn World Table Version 6.2." Center for
International Comparisons of Production, Income and Prices at the University of Pennsylvania.
ILO Bureau of Statistics (2007). ILO Database on Labour Statistics, International Labour Organization.
Kalemli-Ozcan, S. and D. N. Weil (2005). "Mortality Change, the Uncertainty Effect, and Retirement " Mimeo.
Krueger, A. B. and J.-S. Pischke (1992). "The Effect of Social Security on Labor Supply: A Cohort Analysis of the Notch Generation." Journal of Labor Economics 10(4): 412-437.
Stock, J. H. and D. A. Wise (1990). "Pensions, the Option Value of Work, and Retirement." Econometrica 58(5): 1151-1180.
World Bank (2006). "World Bank Development Indicators CD-ROM." Zhang, J. and J. Zhang (2004). "How Does Social Security Affect Economic Growth? Evidence
from Cross-Country Data." Journal of Population Economics 17: 473-500.
18


![C:\Documents And Settings\David\Mis Documentos\Historia Y Evolucion De Los Documentos[1]](https://img.pdfslide.us/doc/110x75/558eb9641a28ab04068b45b5/cdocuments-and-settingsdavidmis-documentoshistoria-y-evolucion-de-los-documentos1.jpg)