Embed Size (px)
Citation preview
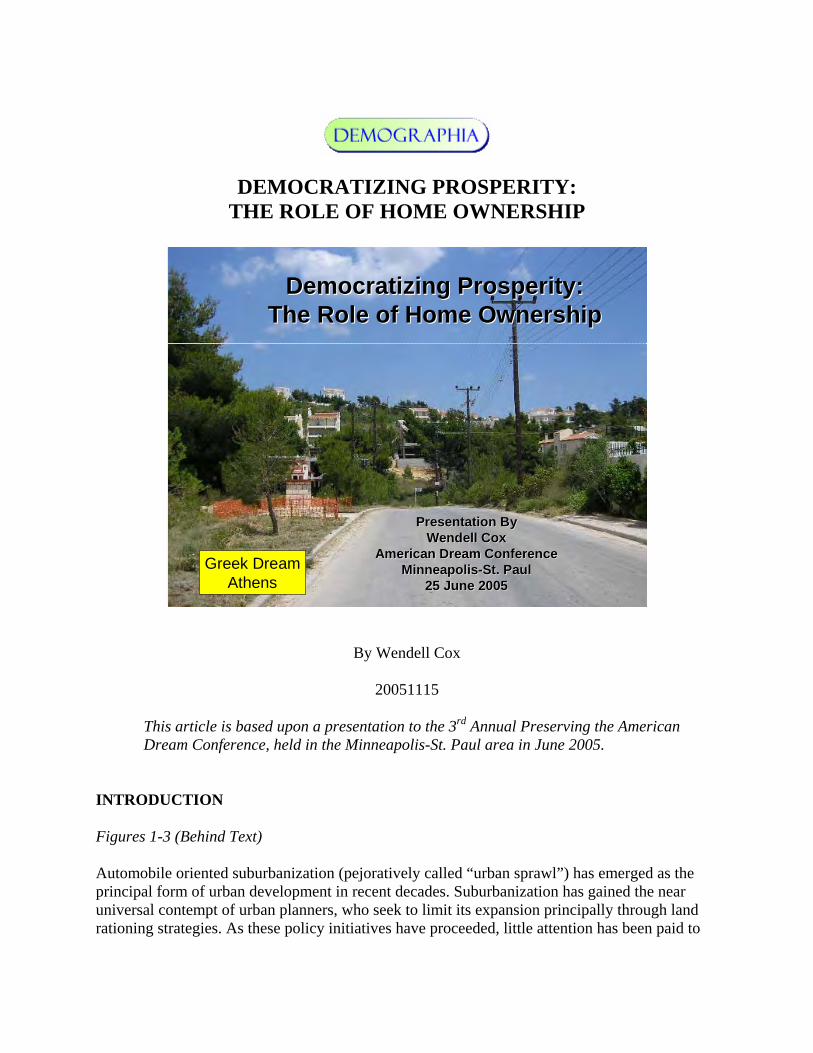
DEMOCRATIZING PROSPERITY: THE ROLE OF HOME OWNERSHIP
Democratizing Prosperity:Democratizing Prosperity:The Role of Home OwnershipThe Role of Home Ownership
Presentation ByPresentation ByWendell CoxWendell Cox
American Dream ConferenceAmerican Dream ConferenceMinneapolisMinneapolis--St. PaulSt. Paul
25 June 200525 June 2005Greek Dream
Athens
By Wendell Cox
20051115
This article is based upon a presentation to the 3rd Annual Preserving the American Dream Conference, held in the Minneapolis-St. Paul area in June 2005.
INTRODUCTION Figures 1-3 (Behind Text) Automobile oriented suburbanization (pejoratively called “urban sprawl”) has emerged as the principal form of urban development in recent decades. Suburbanization has gained the near universal contempt of urban planners, who seek to limit its expansion principally through land rationing strategies. As these policy initiatives have proceeded, little attention has been paid to
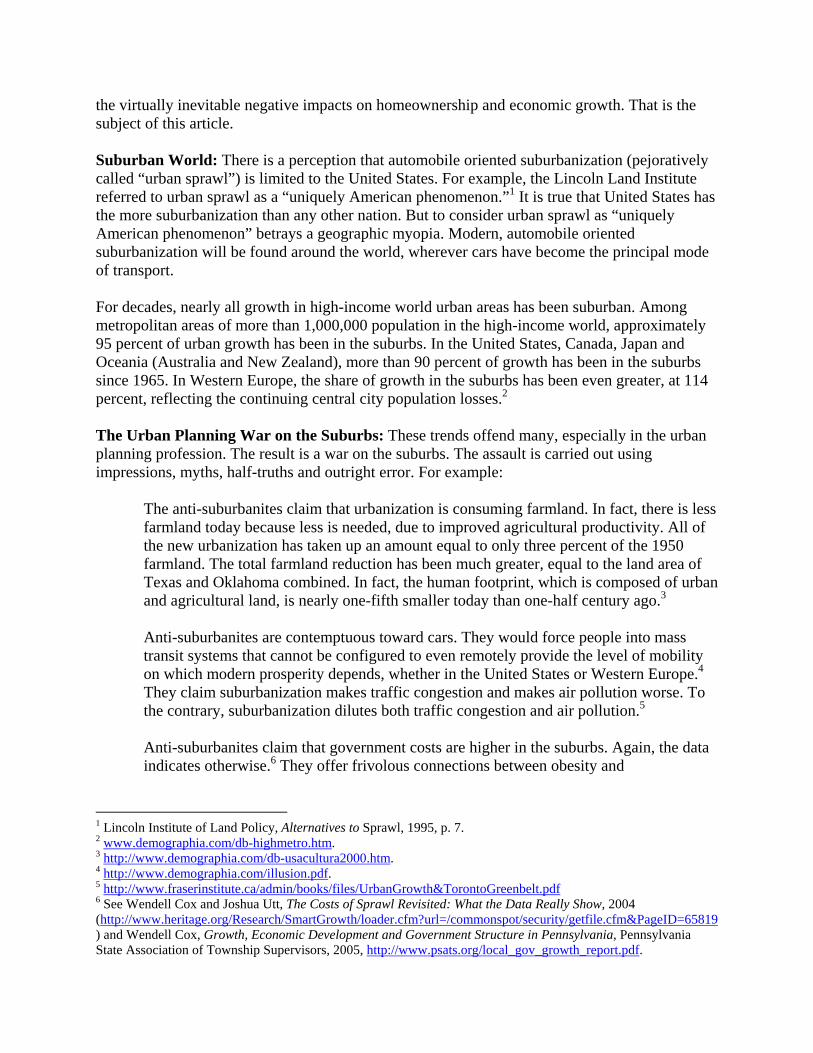
the virtually inevitable negative impacts on homeownership and economic growth. That is the subject of this article. Suburban World: There is a perception that automobile oriented suburbanization (pejoratively called “urban sprawl”) is limited to the United States. For example, the Lincoln Land Institute referred to urban sprawl as a “uniquely American phenomenon.”1 It is true that United States has the more suburbanization than any other nation. But to consider urban sprawl as “uniquely American phenomenon” betrays a geographic myopia. Modern, automobile oriented suburbanization will be found around the world, wherever cars have become the principal mode of transport. For decades, nearly all growth in high-income world urban areas has been suburban. Among metropolitan areas of more than 1,000,000 population in the high-income world, approximately 95 percent of urban growth has been in the suburbs. In the United States, Canada, Japan and Oceania (Australia and New Zealand), more than 90 percent of growth has been in the suburbs since 1965. In Western Europe, the share of growth in the suburbs has been even greater, at 114 percent, reflecting the continuing central city population losses.2 The Urban Planning War on the Suburbs: These trends offend many, especially in the urban planning profession. The result is a war on the suburbs. The assault is carried out using impressions, myths, half-truths and outright error. For example:
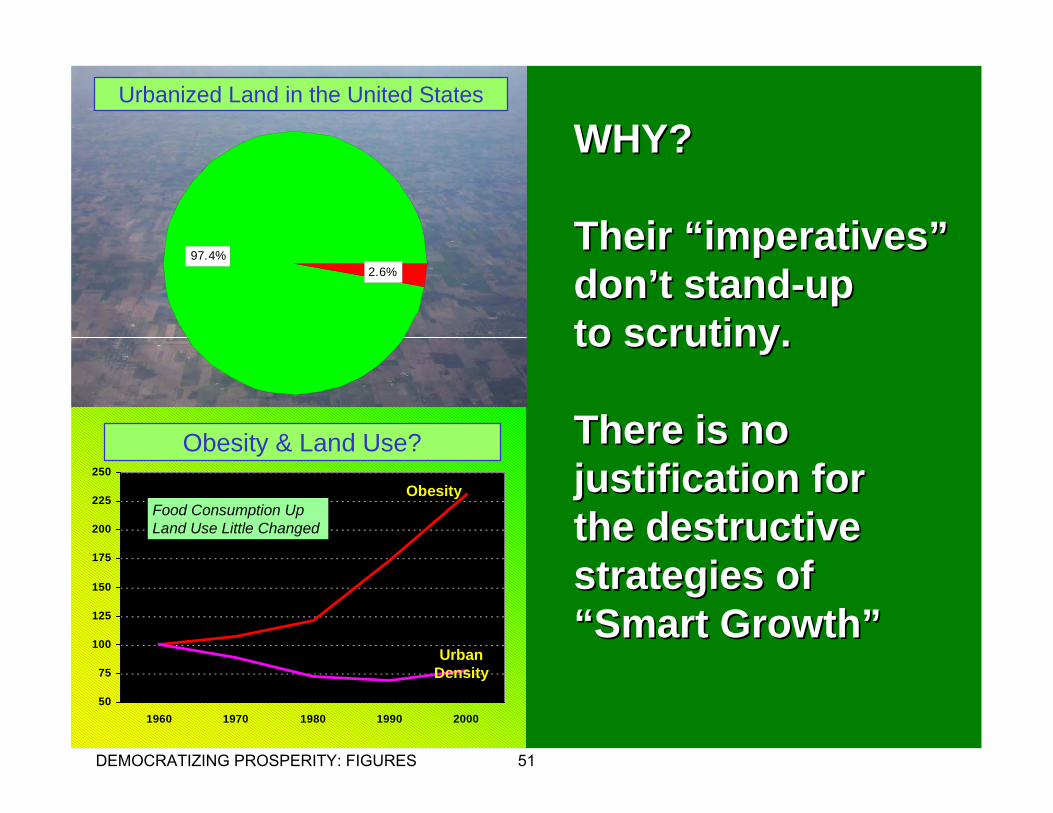
The anti-suburbanites claim that urbanization is consuming farmland. In fact, there is less farmland today because less is needed, due to improved agricultural productivity. All of the new urbanization has taken up an amount equal to only three percent of the 1950 farmland. The total farmland reduction has been much greater, equal to the land area of Texas and Oklahoma combined. In fact, the human footprint, which is composed of urban and agricultural land, is nearly one-fifth smaller today than one-half century ago.3
Anti-suburbanites are contemptuous toward cars. They would force people into mass transit systems that cannot be configured to even remotely provide the level of mobility on which modern prosperity depends, whether in the United States or Western Europe.4 They claim suburbanization makes traffic congestion and makes air pollution worse. To the contrary, suburbanization dilutes both traffic congestion and air pollution.5
Anti-suburbanites claim that government costs are higher in the suburbs. Again, the data indicates otherwise.6 They offer frivolous connections between obesity and
1 Lincoln Institute of Land Policy, Alternatives to Sprawl, 1995, p. 7. 2 www.demographia.com/db-highmetro.htm. 3 http://www.demographia.com/db-usacultura2000.htm. 4 http://www.demographia.com/illusion.pdf. 5 http://www.fraserinstitute.ca/admin/books/files/UrbanGrowth&TorontoGreenbelt.pdf 6 See Wendell Cox and Joshua Utt, The Costs of Sprawl Revisited: What the Data Really Show, 2004 (http://www.heritage.org/Research/SmartGrowth/loader.cfm?url=/commonspot/security/getfile.cfm&PageID=65819) and Wendell Cox, Growth, Economic Development and Government Structure in Pennsylvania, Pennsylvania State Association of Township Supervisors, 2005, http://www.psats.org/local_gov_growth_report.pdf.
suburbanization, apparently oblivious to the bigger diets of lower quality that have become typical.7
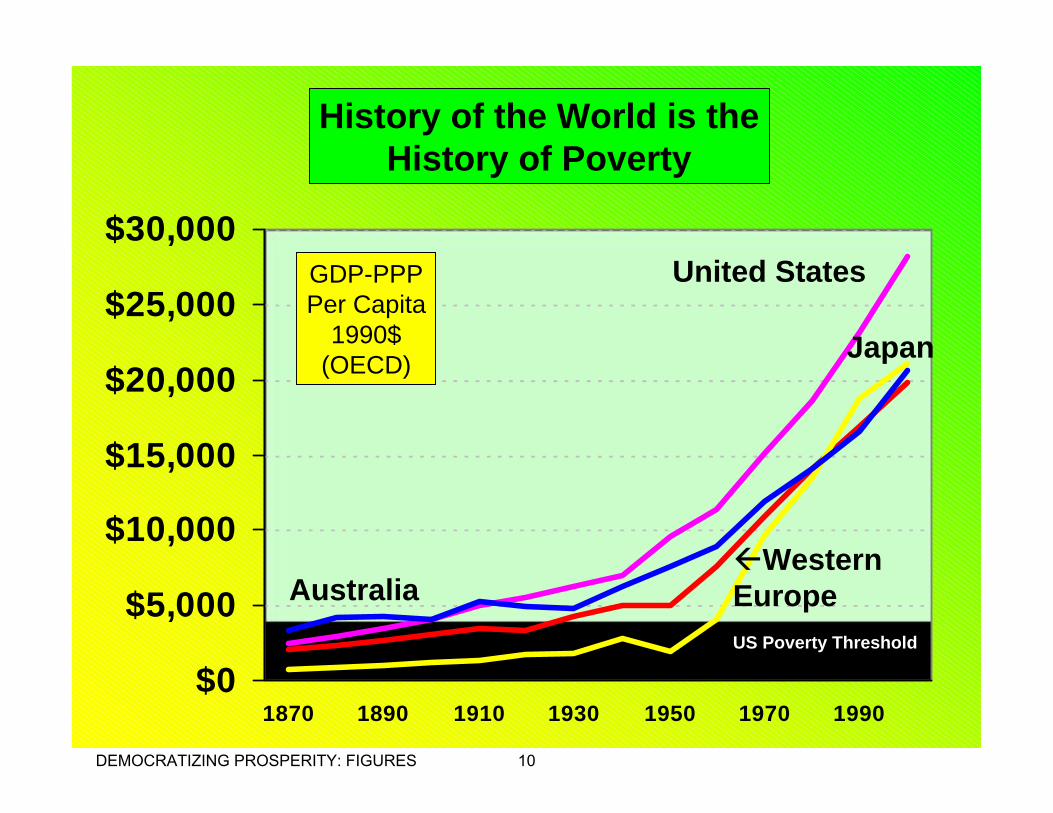
This might appear to be a benign issue --- a simple choice between two visions of what an urban area should look like. However, the stakes are much higher. The price of a tidy urban area that is more pleasing to planners is less home ownership and less personal mobility, both of which mean less prosperity and greater poverty. This broader context of the choices being masked by currently fashionable urban planning doctrines must be addressed. It starts with economic history. DEMOCRATIZING PROSPERITY Figures 4-17 Economics: A History of Poverty: Suburbanization has been associated with much higher incomes and a substantial increase in affluence. It may seem that today’s modern affluent society has been a reality for many generations. But, the unprecedented wealth of high-income nations, whether Canada, the United States, Japan or the countries of Western Europe is of relatively recent vintage. Poverty dominates economic history. This may not seem obvious from a 2006 perspective. However, it was not long ago that the nation was considerably less affluent than today. Just before World War II, US annual incomes (inflation adjusted) were 75 percent lower than today. Per capita income was near the present poverty threshold. Western Europe lived near the present US poverty threshold, and Japan well below it. However, since that time, the high-income world --- principally made up of the United States, Western Europe, Japan, Canada and Australia --- has enjoyed unprecedented and widely distributed economic growth. Economic growth and prosperity are not inevitable. A high standard of living is relatively new to the world. The history of economics and the quality of life is largely a history of poverty. This is illustrated by the work of economist Angus Maddison8 who estimated historical economic performance for the Organization for Economic Cooperation and Development (OECD). These inflation adjusted estimates show indicate that much of the world continues to live at levels below the 2000 poverty threshold in the United States. This includes the two most populous countries in the world, China and India. In Africa, nearly all nations had income per capita below the US poverty threshold, including the ancient rich nation of Egypt. In addition, most Latin American nations had incomes per capita below the US poverty threshold. But the history of poverty is not confined to Asia, Africa and Latin America. During the 19th century and into the early 20th century, much of the population of the now high-income world was in poverty.
7 http://www.heritage.org/Research/SmartGrowth/wm343.cfm. 8 Angus Maddison, The World Economy: Historical Statistics, Paris: Organization for Economic Cooperation and Development, 2003.
But strong economic growth has not been universal. Less than 15 percent of the world’s population lives in high-income nations, while 85 percent live in middle-income and lower-income nations. Per capita economic growth since World War II stagnated in Asia and Latin America, at less than 20 percent, and at less than 10 percent in the former USSR and Africa. A high standard of living cannot be achieved without a strong economy. Economics matters a great deal. The Rise of High Income Economies: Prosperity is well on the way to being democratized in the high-income economies. The overwhelming majority of households in the high-income world live well. At the same time, the democratized economies produce enough income to provide, by world standards, comparatively generous levels of government financial assistance to low-income households. The democratization of prosperity is different from socialization of prosperity. In fact, socialist economies produced little no prosperity to democratize, which is one reason that they have largely been consigned to history. Around the time of the Soviet Union’s demise, Mikhail Gorbachev noted that wealth must be created before it is redistributed. One of the most important legacies of his friend Ronald Reagan was to illustrate, in simple terms, how people have considerably less incentive to create wealth that they know will be taxed away. Democratization of prosperity requires equality of economic opportunity, regardless of economic, ethnic, family or hereditary status. At the same time, the democratization of prosperity is a continuing process. Even in high-income countries, it has not yet been fully achieved. But the extent to which prosperity has been democratized in high-income nations is unprecedented in history. Virtually all economies, high, middle and low-income, have their rich. Luxury condominiums can be found on New York’s upper east side and adjacent to the poverty of the Rocinda favela in Rio de Janeiro. Economic stagnation will reduce the ranks of the rich far less than it will expand the ranks of the poor. What separates high-income economies from their middle and low-income counterparts is the extent of poverty. Virtually all economies have poverty, but high-income economies have much less. Where prosperity has been democratized, there is much less poverty and many more people live a comparatively comfortable life. The principal beneficiaries of democratized prosperity are not the rich --- who prosper whatever the economic system, but rather the hundreds of millions who would otherwise be poor. How Prosperity has been Democratized: A number of factors contributed to the democratization of prosperity.
Rule of Law, Free Markets and Economic Growth: One of the most important requirements is the comparatively liberal economic markets that have developed and operate in the high-income world. This relationship emerges strongly from reports by the
Fraser Institute and the Heritage Foundation.9 These arrangements allow human ingenuity to create the economic growth that increases the “size of the economic pie.” There is no other way to materially or sustainably reduce poverty.
The Great Migration: Rural to Urban: For decades, people have been moving out of rural areas, especially to larger urban areas where larger. This has been the principal source of suburban growth, rather than the reduction in core populations so often cited by analysts. This “great migration” is now moving to middle and low-income nations, some of which remain considerably more rural than urban (such as China and India). Urban areas are magnets of opportunity. In recent decades, urban areas have accounted for most overall economic growth, which has made them even more attractive to residents of small urban and rural areas. At the same time, technological advances in agriculture have substantially reduced labor requirements, which hastened migration to urban areas. No nation has achieved modern high-income status without a major movement of its population from small towns and rural areas to larger urban areas.
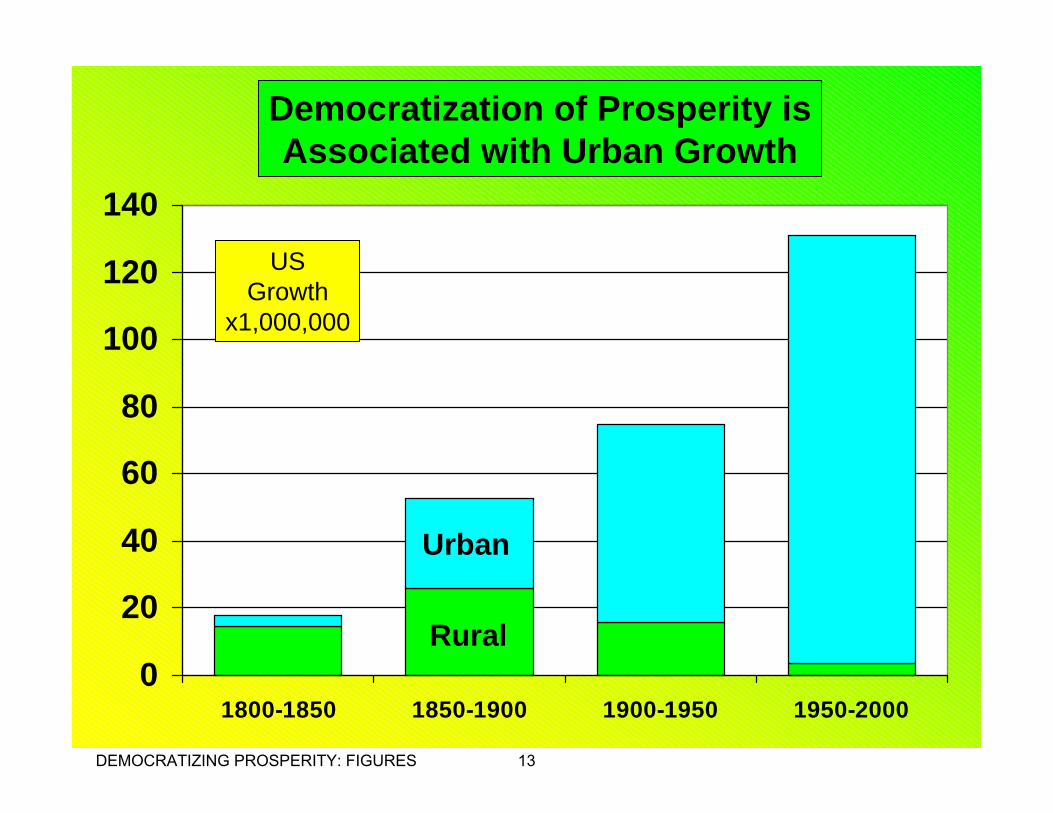
Nearly all population growth in the United States has been in urban areas since World War II. Since 1950, nearly 130,000,000 people have been added to urban areas, compared to only 2,000,000 in rural areas.10 A major factor was the exodus of African-Americans from the rural South to metropolitan areas principally in the Northeast, Midwest and California.
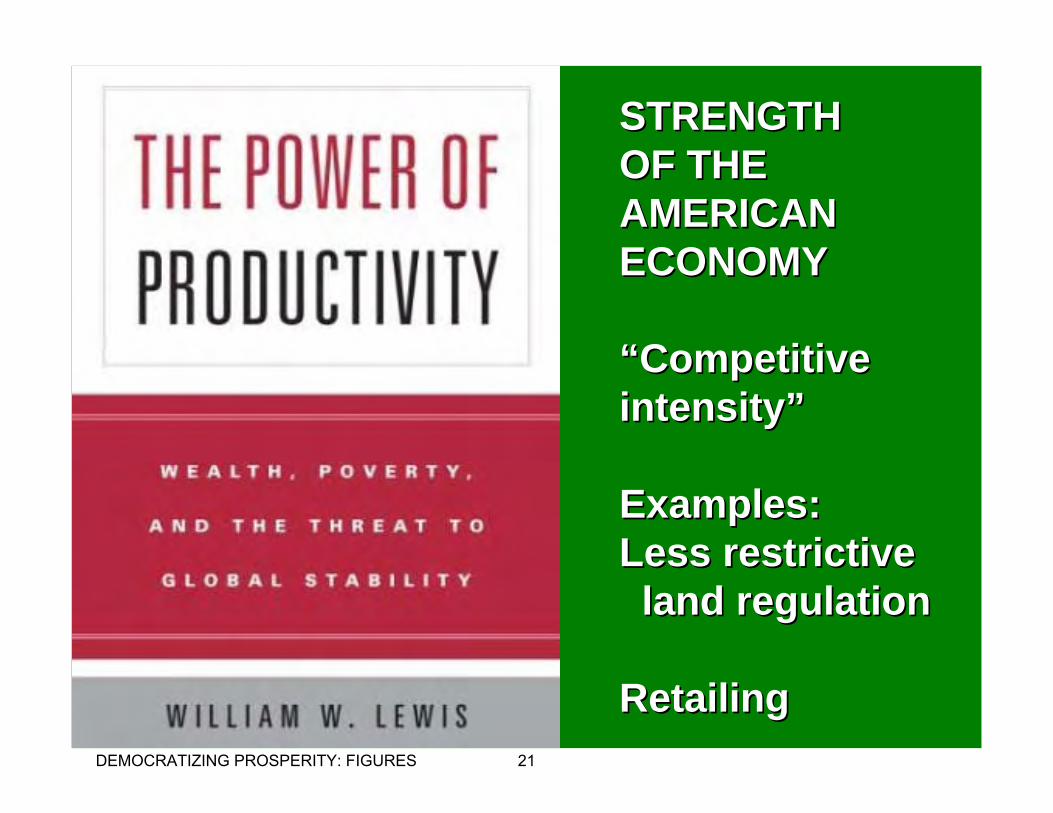
Commercial Growth: Employment has expanded substantially since World War II. In the United States, employment rose at a rate more than 1.5 times that of the population from 1950 to 2000. Moreover, the nature of the new commercial development was much different. Large commercial buildings and factories became more horizontal, often spread out (sprawling) in single-story configurations. This generally made commercial operations more efficient, lowering product prices for consumers. The more horizontal structures required more land, which was available at much lower prices than in the core or even the inner suburbs. Data is available for the Paris area, where the automobile oriented outer ring suburbs that have developed since 1950 have commercial development that occupies more than twice the land area per employee as in the inner ring mass transit oriented suburbs that largely developed from in what was the pre-automobile era in France between 1920 to 1950.11 Retailing: William Lewis documents the importance of the home building industry to economic growth in his book, The Power of Productivity. Lewis concludes that the more successful and more affluent economies are characterized by more intense competition for consumer goods and services (“competitive intensity”), and less economic
9 James Gwartney and Robert Lawson, Economic Freedom of the World: 2004 Annual Report, Vancouver, BC: Fraser Institute, 2004 and Marc A. Miles, Edwin J. Fuelner and Mary Anastasia O’Grady, 2005 Index of Economic Freedom, Washington: Heritage Foundation, 2005. 10 Calculated from US Census data. 11 http://www.demographia.com/db-paris-comml.htm.
regulation.12 He attributes the failure of Western Europe and Japan to close the economic gap in recent decades with the United States on insufficient competitive intensity. He says that lightly regulated retailing and homebuilding (described later) are important reasons.
McKinsey also found the comparative freedom of retail development to be an important contributor to US economic performance. Again, the driving factor was land use regulation. The larger, lower cost retailers found it much more difficult to build stores in the United Kingdom, France, Germany and Japan. As a result, there is less retail competitive intensity, and households pay higher prices for their goods. Lewis notes that where markets include the most efficient competitors, competition is less intense and there is less economic growth.13
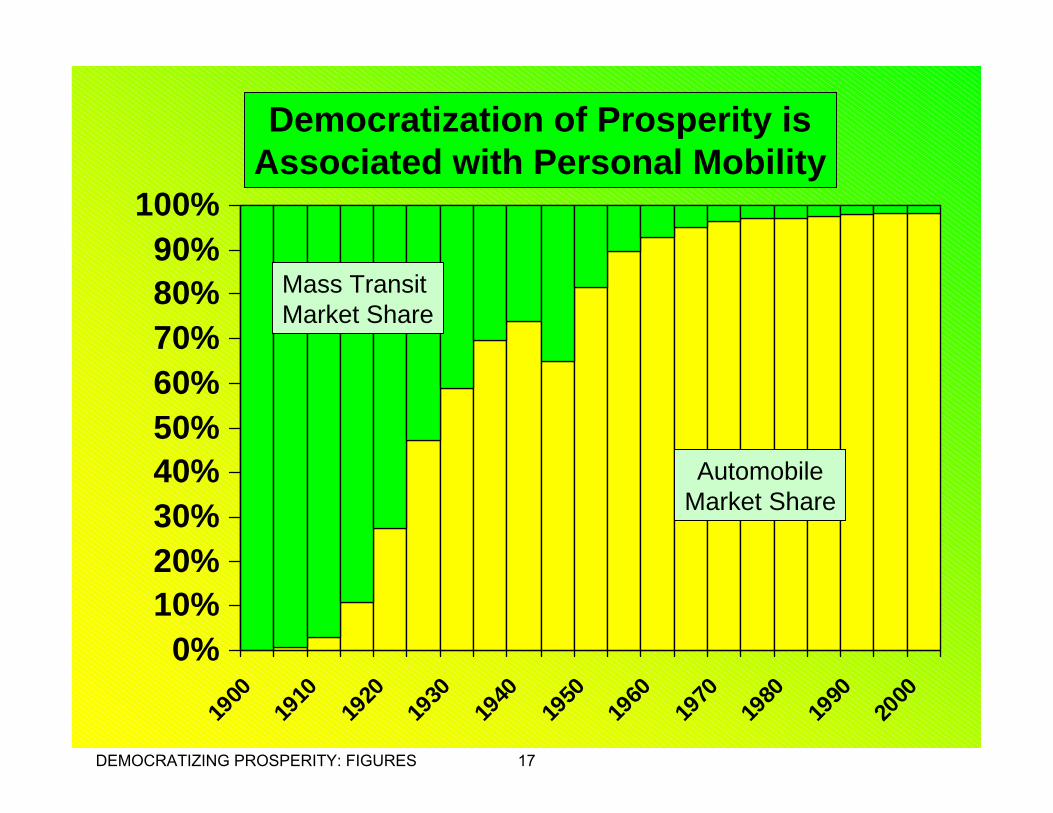
Personal Mobility: The automobile has played a pivotal role in democratizing prosperity. It has, according to Alan Pisarski, “democratized mobility.” 14 Before the car, urban residents were dependent on walking and transit, which took longer. Much of the urban area was beyond practical reach for people by transit (public transport), because of fixed schedules, slow speeds, congestion on streetcar lines and transferring from one line to another to get anywhere but downtown. However, the car changed everything. The car made it possible to travel throughout the urban area far more quickly and less expensively than had been possible before. Before the car, transit limited where people could go and when they could go. The car liberated people to go where they wanted when they wanted. This democratization of mobility contributed substantially to the democratization of prosperity.
The car made it possible for shoppers to travel throughout the urban area for more merchandise and lower prices. No longer were they captive of the high-priced, limited inventory local retailers within the narrow range of walking or transit. Even today, whether in Western Europe or the United States, people in neighborhoods with few cars pay much more for purchases made locally. The car was a principal facilitator of employment for women, who would have found their multiple purpose trips --- to drop off children at day car or for shopping on the way from work --- impractical by foot or transit. Western Europeans have been abandoning transit for cars for decades despite gasoline prices near or above $5.00 per gallon. At least 85 percent of urban travel in Western Europe is by car rather than transit.
12 William W. Lewis, The Power of Productivity: Wealth, Poverty, and the Threat to Global Stability. Chicago, IL: University of Chicago Press, 2004. 13 Lewis, p. 13. 14 Alan E. Pisarski, Cars, Women and Minorities: The Democratization of Mobility in America, Washington: Competitive Enterprise Institute, 1999.

At the same time, an efficiently functioning highway system makes it possible for trucks to move freight more quickly, reducing consumer costs. The Chinese appreciate the economic value of a highly mobile society. Already, China has more miles of freeways than any nation other than the United States. Its plans call for expansions that will nearly equal the length of the US system by 2010. Longer-term plans call for doubling the present US length. However, the car’s greatest contribution may have been to make it possible for more people to own their own homes and join and broadening economic mainstream.
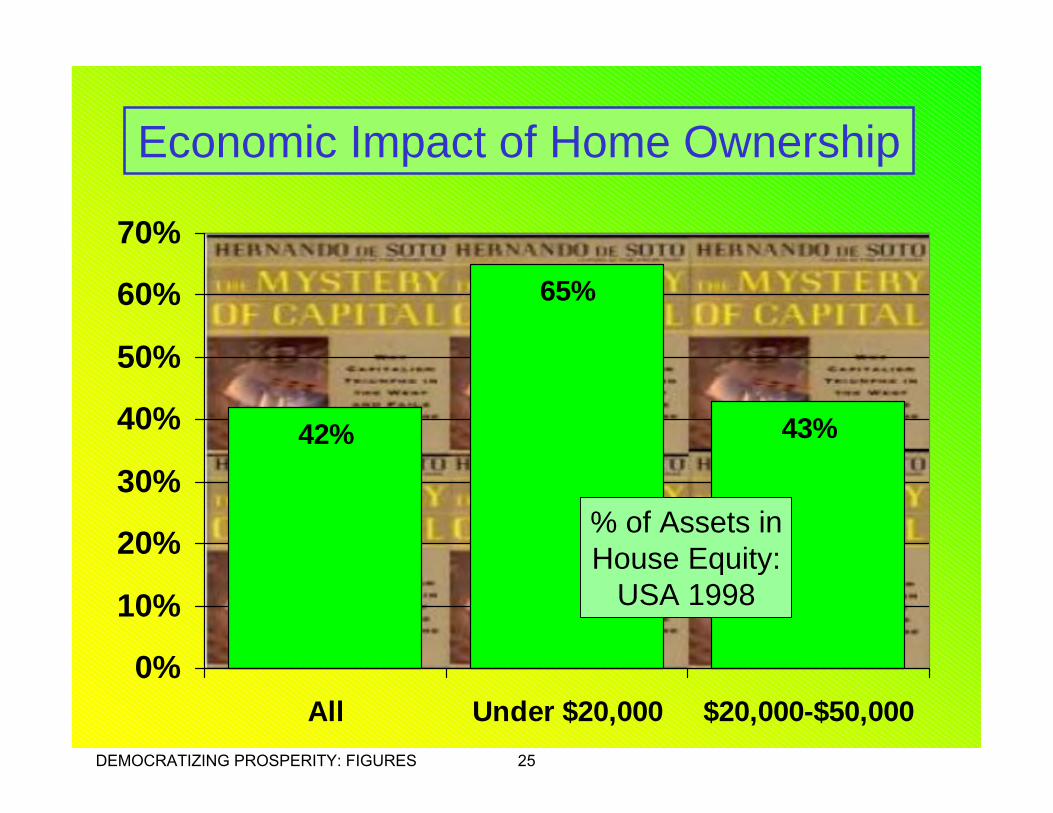
THE ROLE OF HOMEOWNERSHIP Figures 18-25 Home ownership is a principal mechanism for creating wealth, and is a principal mechanism for democratizing prosperity. There is a fundamental difference between purchasing a home and paying rent. By purchasing a home, a household adds to its wealth. Part of the monthly mortgage payment is used to reduce the amount owed and becomes a part of the owner’s equity in the home. In contrast, all of the money paid to rent a home that the household does not own goes to the property owner. There is no potential equity for the renter in the rented home. In the United States, the home owning households have a net worth more than 30 times greater than that of renters. Much of the net worth of middle-income households is in housing equity. A Federal Reserve Bank survey found that:15
House equity accounted for 65 percent of net worth among households with less than $20,000 in annual income. House equity accounted for more than 40 percent of net worth among households with $20,000 to $50,000 in annual income. House equity accounted for approximately one-third of net worth among households with $50,000 to $100,000 in annual income.
Home ownership also makes communities more stable and cohesive. Robert C. Weaver, the first US Secretary of Housing and Urban Development said:
“Home ownership creates a pride of possession, engenders responsibility and stability.”16
15 Heritage Foundation Center for Data Analysis calculations from U.S. Federal Reserve Board, Survey of Consumer Finance, 1998 as cited in Wendell Cox and Ronald D. Utt, Smart Growth, Housing Costs and Home Ownership, Washington: Heritage Foundation, April 6, 2001. 16 As cited in Wendell Cox and Ronald D. Utt, Smart Growth, Housing Costs and Home Ownership, Washington: Heritage Foundation, April 6, 2001.

Home ownership broadens and deepens affluence. An economy is richer because of home ownership and more of its households participate in its mainstream. This recognition has been at the base of public policies intended to expand home ownership under national administrations of all political stripes, from Franklin D. Roosevelt to Ronald Reagan and from Margaret Thatcher to Tony Blair. McKinsey’s William Lewis found finds that home building industry in the United States to be significantly more productive than in Western Europe or Japan and that this is one of the principal reasons why US economic dominance has continued. The principal reason is that land use regulation is far less severe in the United States. More land can be legally purchased for development of housing. The larger plots of land allow greater standardization and lower costs. The lower costs and efficiencies of this structure make it possible for smaller companies to operate in the market, with the increased competition reducing prices. Similar industry and regulatory structures were found to produce American style productivity in the Netherlands and Australia.17 At the other end of the spectrum was Japan, with home building productivity 55 percent below the United States, the Netherlands and Australia. This is because of a regulatory system that discourages large scale housing subdivisions and an industry geared toward custom building and little standardization. If the Japanese built cars in the pre-Henry Ford way that local builders construct houses, Toyota and Honda would not be household names outside Japan. THREATENING THE DREAM Figures 26-29 Land Rationing: The most destructive anti-suburban policies would make the home building industry much less competitive by subjecting residential land development to rationing. Virtually all economists agree that rationing tends to raise prices. The following land rationing strategies are advocated by anti-suburban interests, and have come into much wider use in recent years:
Densification policies, which includes urban growth boundaries, greenbelts, urban consolidation (the Australian term), urban service areas and other strategies that remove significant amounts of land from potential development and attempt to force building instead into already developed areas (infill). Paradoxically, suburban large lot zoning is also proposed by anti-suburbanites, in the hope that making land more scarce will force make it harder for people to settle in the suburbs. Excessive Development Impact Fees: Some communities have imposed fees on the construction of new houses and apartments to recover purported costs to the community for schools, roads, sewers, water and other community services. Often these fees are considerably higher than justified.
17 The Australian research was completed before wide adoption of urban consolidation policies.

Mandated Amenities: Zoning regulations may require expensive and unnecessary amenities as a part of new house construction. These may range from sodded lawns to new urbanist (early 20th century) design requirements.
Anti-suburban have published what might be called “sun rises in the West” studies to prove that land rationing does not raise housing prices. A study by the Brookings Institution, lead by Dr. Arthur C. Nelson, has been frequently cited as to prove that house prices are not increased by anti-suburban policies. However, a close reading of the study renders a different conclusion. The Brookings team commented:
“The housing price effects of growth management policies depend heavily on how they are designed and implemented. If the policies tend to restrict land supplies then housing price increases are expected.”18
CONSEQUENCES Figures 28-44 As the evidence below indicates, restricting land supplies, or rationing land does indeed raise housing prices. Even leading New Urbanist architect Andres Duany admitted as much. In a message to an anti-suburban e-mail list he wrote:
“There is NO question that urban growth boundaries and that elaborate environmental studies and elaborate public processes increase the cost of housing by creating scarcity. (And don’t tell me otherwise, because I am not stupid, nor am I inexperienced, nor do I have underdeveloped powers of observation).”19
Research: University research supports the general contention that land use restrictions increase the price of housing. Edward Glaeser and Joseph Gyourko, 20 in work published by Harvard University, reported that the principal cause of differences in housing affordability between US metropolitan areas is zoning and land regulation. This is a particularly stark finding, since average house prices in US markets range from over $600,000 in the San Francisco Bay area to under $150,000 in a number of Midwestern and Southern metropolitan areas.21 Based upon their findings, Glaeser and Gyourko concluded that there was no national housing affordability crisis in a Federal Reserve Bank article. 18 Arthur C. Nelson, Rolf Pendall, Casey J. Dawkins and Gerrit J. Knaap, The Link Between Growth Management and Housing Affordability: The Academic Evidence, Washington: The Brookings Institution Center on Urban and Metropolitan Policy, February 2002, p. 24 (emphasis in original) 19 Email from Andres Duany to Congress of New Urbanism mailing list ([email protected]), Subject: Affordable Housing and New Urbanist Principles, July 15, 2004. Emphasis in original 20 Edward L. Glaeser and Joseph Gyourko (2002). The Impact of Zoning on Housing Affordability, Cambridge, MA: Harvard Institute of Economic Research. 21 National Association of Realtors, www.realtor.org, 2nd quarter 2004.

America is not facing a nationwide affordable housing crisis. In most of the country, home prices appear to be fairly close to the physical costs of construction. In some of the country, home prices are even far below the physical costs of construction. Only in particular areas—especially New York City and California—do housing prices diverge substantially from the costs of new construction.22
Nonetheless, there are a number of urban areas in which housing costs have escalated substantially. Most of these areas also have land rationing policies that have driven up housing prices by creating scarcity. A United States Department of Housing and Urban Development report refers to “misuse of smart growth:”
“A number of communities, however, have used smart growth rhetoric to justify restricting growth and limiting developable land supply, which lead to housing cost increases.” 23
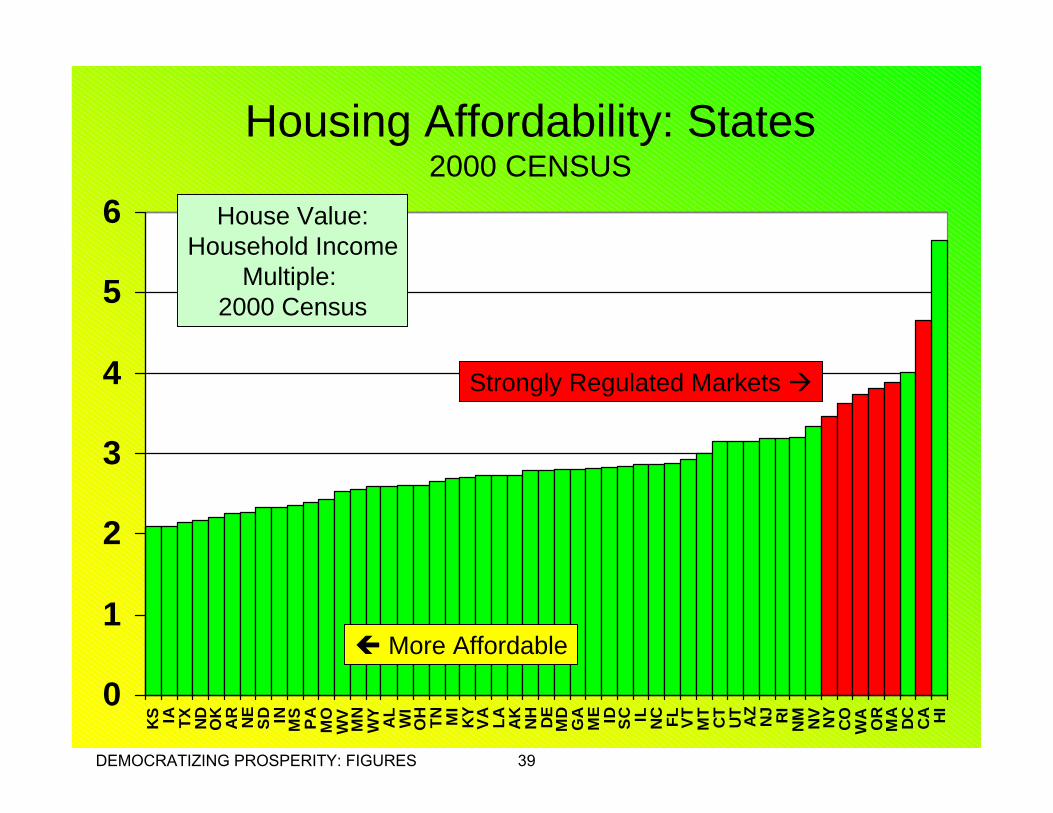
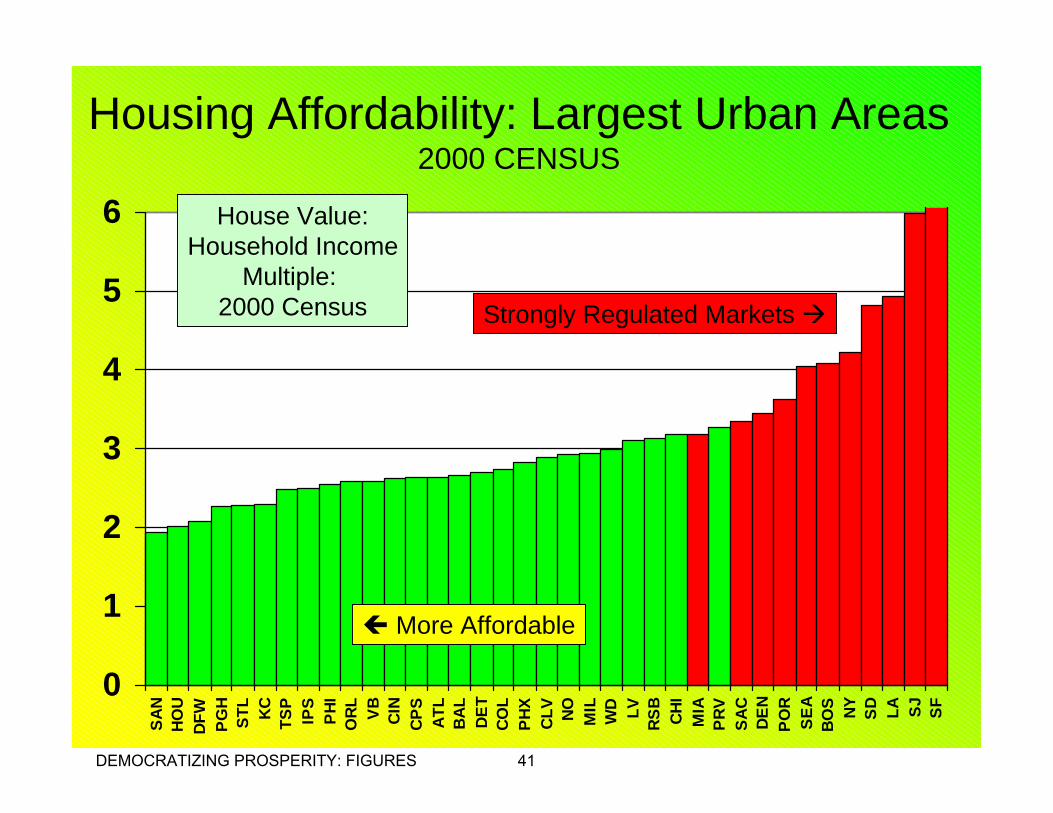
The Reality: Current housing prices demonstrate the strong association between higher housing prices and land rationing. Generally, median house prices or values have been less than three times median household incomes. In recent years, there has been an unprecedented escalation of this housing price multiple, principally in areas engaging in the most stringent land rationing. In the United States, the worst housing affordability is in Southern California, with the highest multiples in Los Angeles (10.1) and San Diego (10.0). Other California markets are also high. The San Francisco multiple is 7.8, while the Sacramento multiple is 5.6. Each of these multiples has risen rapidly in recent years, as land rationing has become more severe.24 The extremely high housing multiples now evident in some urban areas have developed only in recent decades. This is illustrated by California, where the 1970 housing multiple was 20 percent higher than the national average. By 2004, California’s housing multiple was 1.25 times above the national average.25 While the national housing multiple rose 34 percent, the California housing multiple rose 150 percent. The loss in housing affordability was greatest in Oregon, where land rationing policies have been required for decades by state law. The same relationship is found in Canada, Australia and New Zealand. Sydney has the third worst housing multiple, following Los Angeles and San Diego, at 8.8. Housing has become so unaffordable in Sydney that the Governor of the Reserve Bank, Ian MacFarlane told a parliamentary committee young people would have to leave the Sydney area to go elsewhere, where “their life style is more affordable.”26 Land rationing has led to substantial housing affordability losses in other urban areas in Australia and New Zealand. 22 http://www.newyorkfed.org/research/epr/03v09n2/0306glae.pdf 20041212 p35 journal 23 United States Department of Housing and Urban Development, Why Not in Our Backyard: Removing Barriers to Affordable Housing: An Update to the Report of the Advisory Commission on Regulatory Barriers to Affordable Housing, Washington, 2005, p.5. http://www.huduser.org/Publications/pdf/wnioc.pdf, accessed March 7, 2005. 24 Demographia International Housing Affordability Ratings and Rankings (http://www.demographia.com/dhi-rank200502.htm). 25 Calculated from US Bureau of the Census data. 26 http://www.aph.gov.au/hansard/reps/commttee/R8516.pdf.
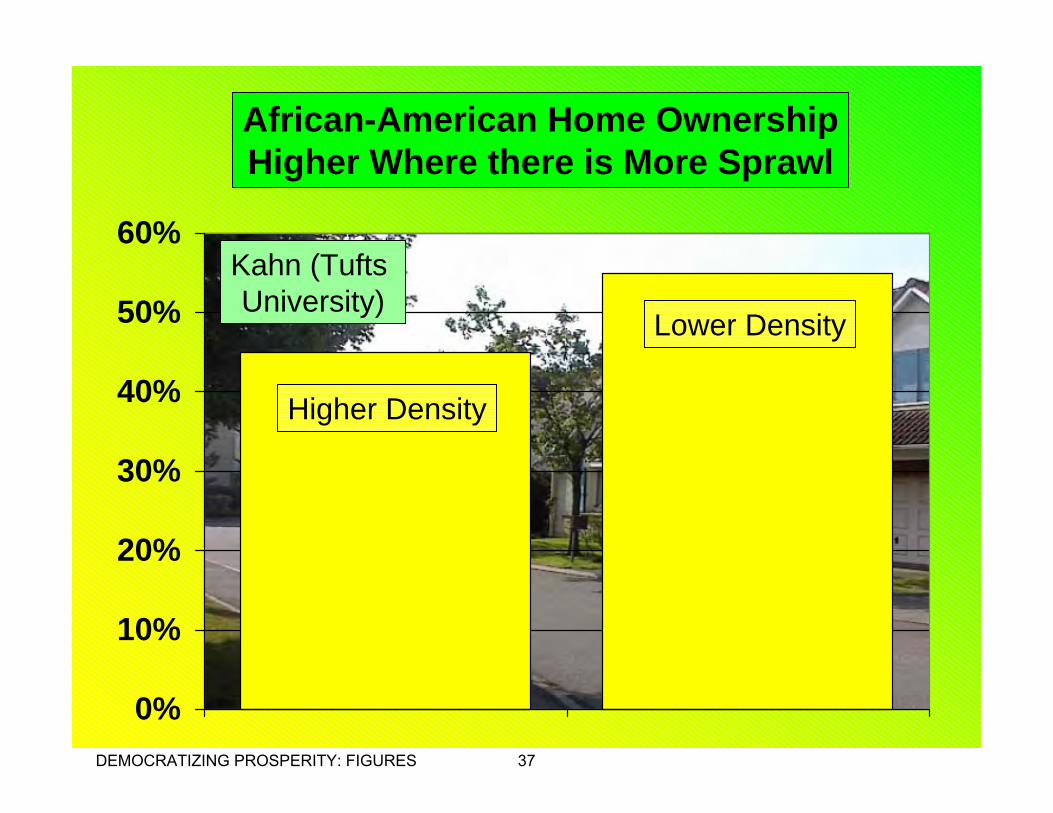
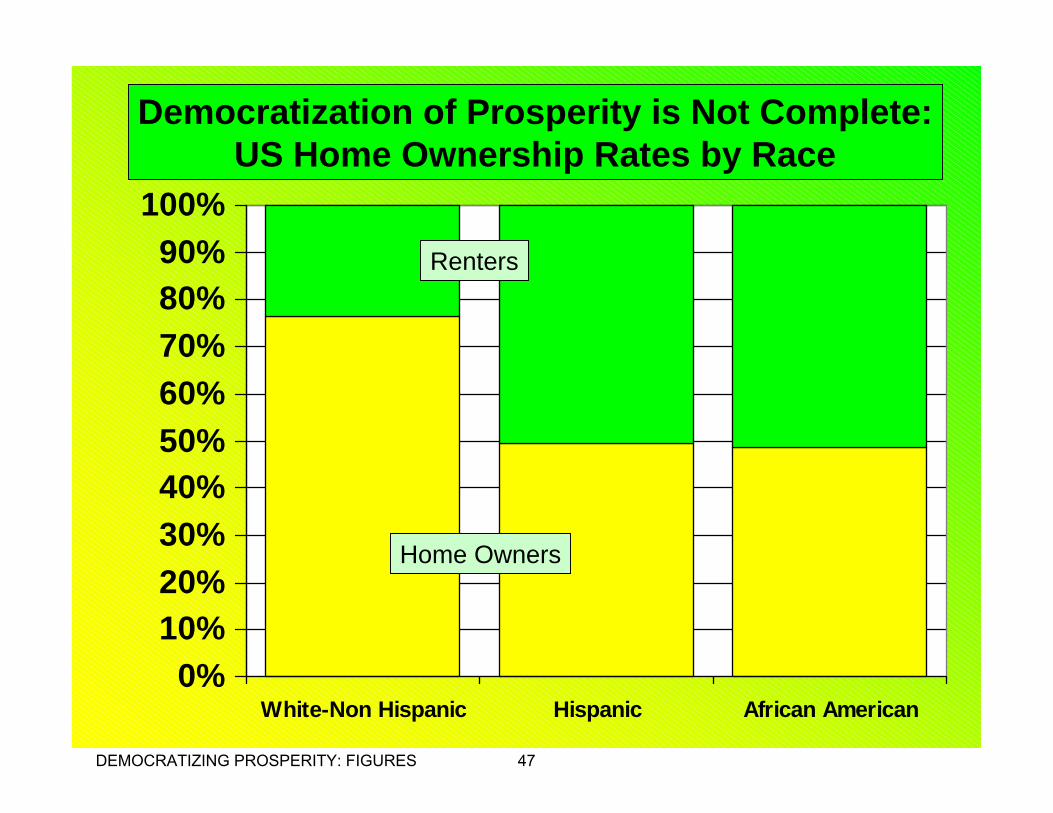
Vancouver, with Canada’s strongest land rationing policies, has that nation’s worst housing affordability, with a multiple of 5.1. At the same time, housing remains affordable in US metropolitan areas that have not implemented land rationing. In Atlanta, Dallas-Fort Worth and Houston, which are the first, third and fourth fastest growing large urban areas in the high-income world,27 have extraordinary housing demand. Nonetheless, the housing multiples in Atlanta (2.6), Dallas-Fort Worth (2.6) and Houston (2.7) remain very competitive. Land rationing policies, if comprehensively adopted, are likely to lead to a nation of renters. In the long run, the US homeownership rate of nearly 70 percent would decline toward 50 percent at the Portland, Oregon multiple, homeownership rates could be expected to fall toward 50 percent. At the higher California multiples, the home ownership rate could drop toward 20 percent.28 Minority Homeownership: Even in the affluent economies, there is still room for democratizing prosperity. For example, in the United States, minority home ownership rates remain well below majority rates. The Hispanic and African-American home ownership rates are a full third less than the White-non-Hispanic homeownership rate. It is essential that minority homeownership rates be materially improved, ideally to equal the majority rate. This is more than an economic matter, as the recent minority disorders in France (and those in previous decades in the United States) illustrate. Young people do not burn businesses and cars in neighborhoods where they have an economic stake. Homeownership is a critical element in creating the social cohesion that results from the entry of all into the mainstream of economic life. In the United States, more liberal housing markets are associated with greater prosperity for both minority populations and the nation as a whole. Matthew Kahn at Tufts University in Massachusetts found that more sprawling urban areas have higher rates of African-American home-ownership.29 Moreover, in California, with its intense land regulation, a Hispanic research institute, the Tomas Rivera Foundation has found anti-suburban growth controls and excessive development impact fees to be a principal barrier to greater Hispanic home ownership.30 PRESERVING THE DREAM Figures 45-55 Living in the “Future Tense:” New York Times columnist David Brooks wrote about how Americans live in “the future tense” in his book On Paradise Drive. Living in the future tense involves always striving for and anticipating a better future. But this is not a uniquely American 27 http://www.demographia.com/db-econ-uaintl.htm. 28 Based upon an analysis of the distribution of income by households and an assumption that housing costs should should average no more than 29 percent of income (a typical lending standard). 29 Matthew E. Kahn, “Does Sprawl Reduce the Black/White Housing Consumption Gap?” Housing Policy Debate, Volume 12, Issue 1. 30 Waldo Lopez-Aqueres, Joelle Skaga and Tadeusz Kugler (2002). Housing California’s Latino Population in the 21st Century: The Challenge Ahead. Los Angeles, CA: The Tomas Rivera Policy Institute.

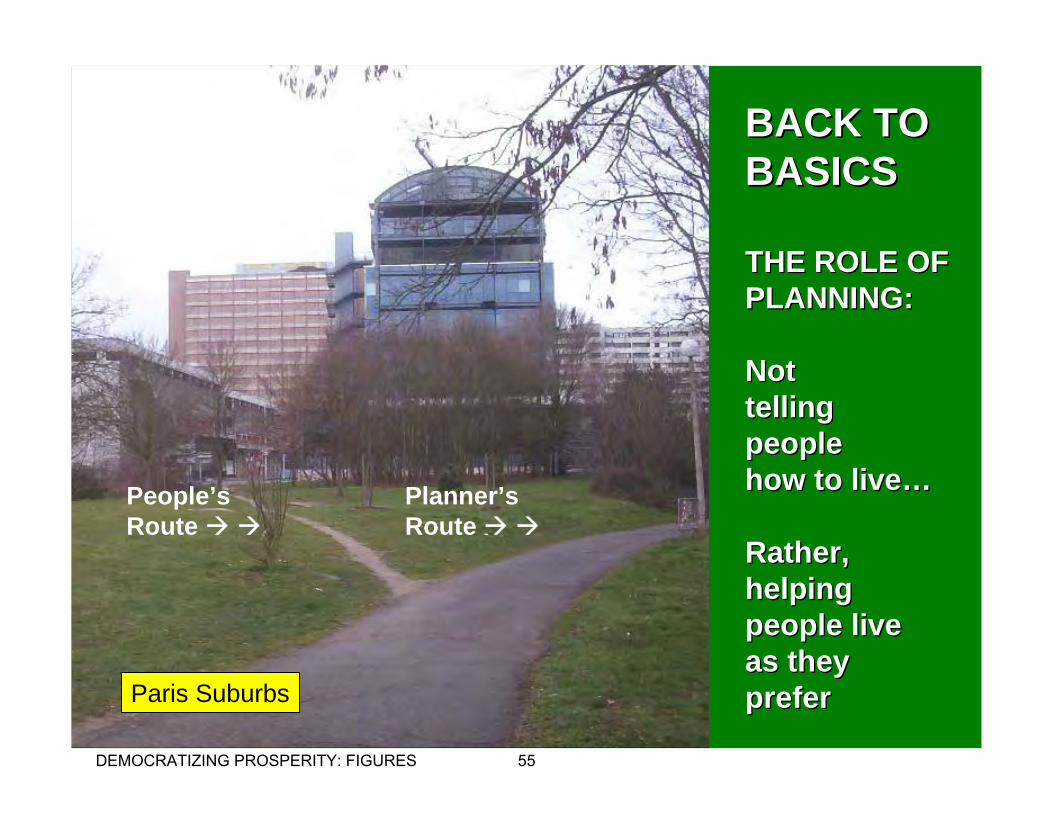
phenomenon. All people would live in the future tense, given the chance. It is just easier in the United States and other democracies in which the legal and regulatory structure allows people to pursue a better future, rather than rationing the future to a privileged minority. The American Dream is also the Great Australian Dream, the Kiwi Dream and the European Dream. As former Secretary of Housing and Urban Development Jack Kemp noted, it has become the “universal dream.” And, there is every reason that it should be. Home ownership and mobility can and should be used to democratize prosperity around the globe. Required: An Urban Planning Reformation: Assemblyman Ray Haynes of California once told me that the urban areas of that state actually worked much better before there was a state requirement for comprehensive urban planning. Until the 1970s, California built the roadways that were required, following a blueprint that was the vision of Governor Edmund G. (Pat) Brown.31 Since comprehensive planning was adopted, traffic congestion has become much worse, and housing is much less affordable. Before comprehensive planning, the state experienced its greatest growth, approximately 100 percent from 1950 to 1975, yet managed to more successfully handle its problems. From 1975 to 2000, growth was barely 50 percent. It is legitimate to ask whether urban planning should follow the “command and control” model currently in vogue. People tend to make their own plans and do what they prefer to do. Government may tell people where they cannot live or where they cannot work. However, democratic governments cannot tell people where they must live or work. Urban planning was not always as it is today. Pre-urban renewal planners were content to facilitate the growth that they expected and the travel patterns that would be preferred by the growing community. There was a time that planners even lived in the future tense. German professor Thomas Sieverts objects to the current “in vogue” view that urban areas are not planned unless urban planners do the job. Rather, the modern urban area and its predecessors is the amalgamation of planning by the households and businesses in the area.32 Urban planning should be restored as a facilitative, supportive discipline, stripping it of the inappropriate social engineering component. The role of urban planning is not to tell people what to do, but rather to assist them in pursuing their preferences. Figure $$$ provides a vivid example. The wide, paved path is how planners intended for people to reach the suburban rail station in Evry, France. The less formal path across the grass is how people choose to get there. None of this is intended to suggest that suburbanization or urban sprawl is inherently good. It is rather to reaffirm the truth that where people are allowed to pursue their preferences without unnecessary restrictions, the results tend to be superior. So long as this can be accomplished without “material threat to others and the community,” as the Lone Mountain Compact suggests, then there is no harm worthy of regulation.
31 His son, Jerry, did not share this optimism and popularized the term “era of limits” as governor two decades later. 32 Thomas Sieverts, Cities without Cities: An Interpretation of the Zwischenstadt, London, UK: Spon Press, 2003, p. vii.
… absent a material threat to other individuals or the community, people should be allowed to live and work where and how they like. 33
Rationing Land, Rationing Economic Growth, Rationing the Future: There are significant economic challenges on the horizon. Most high-income nations are facing significant funding shortfalls in pension and social welfare programs. At a minimum, greater economic growth is required if prosperity is to be further democratized. However, the land rationing policies that have become so fashionable are likely to result in lower rates of economic growth. This is already evident from both the research and the experience. A paper by Raven Saks, published by the JFK School of Government at Harvard concluded:
“metropolitan areas with stringent development regulations generate less employment growth than expected given their industrial bases”34
In the same vein, Australian Reserve Bank Governor MacFarland blamed part of Sydney’s recent anemic economic performance on high housing costs. 35 As is usual, the economic losses would “trickle down” to people with lower income, who will find their housing choices and mobility more restricted, along with a the less prosperous economy incapable of providing the subsidy assistance they would not need if destructive anti-suburban policies had not been implemented. Anti-suburbanism is a matter of values. To the anti-suburbanite, a tidy urban area is more important than one in which there is broad prosperity. The dreams of the anti-suburbanites can be achieved only by imposing lowering the standard of living for middle and lower income households. This was expressed by Lewis:
“Most people consider the ‘social objectives’ motivating zoning laws and small bus subsidies to be “good.” However we can’t have it both ways. These measures distort markets severely and limit overall productivity growth, slow overall economic growth and cause unemployment.”36
Perhaps the ultimate accomplishment of the first world has been to democratize prosperity. Yet, the task is not complete. Many households remain outside the economic mainstream and many are unable to buy their first homes. The overwhelming consequence of containing urban areas is to extinguish opportunity. It is far too high a price.
33 http://www.perc.org/publications/articles/lone_mountain_full.php, accessed February 28, 2005. 34 http://www.jchs.harvard.edu/publications/markets/w04-10_saks.pdf. 35 http://www.aph.gov.au/hansard/reps/commttee/R8516.pdf. 36 Lewis, p. 14.
Democratizing Prosperity:Democratizing Prosperity:The Role of Home OwnershipThe Role of Home Ownership
Presentation ByPresentation ByWendell CoxWendell Cox
American Dream ConferenceAmerican Dream ConferenceMinneapolisMinneapolis--St. PaulSt. Paul
25 June 200525 June 2005Greek Dream
Athens
DEMOCRATIZING PROSPERITY: FIGURES 1

AABROADERBROADERCONTEXTCONTEXT
HomeHomeOwnershipOwnership&&Land Use:Land Use:
FutureFutureof theof theeconomyeconomyandandthethequalityqualityofoflifelife
DEMOCRATIZING PROSPERITY: FIGURES 2
Swedish DreamStockholm
Democratizing Prosperity
Japanese DreamSapporo
The Role of Home Ownership
Threatening the Dream
Mexican DreamGuadalajara
Consequences
Spanish DreamBarcelona
Preserving the Dream
Portuguese DreamPorto
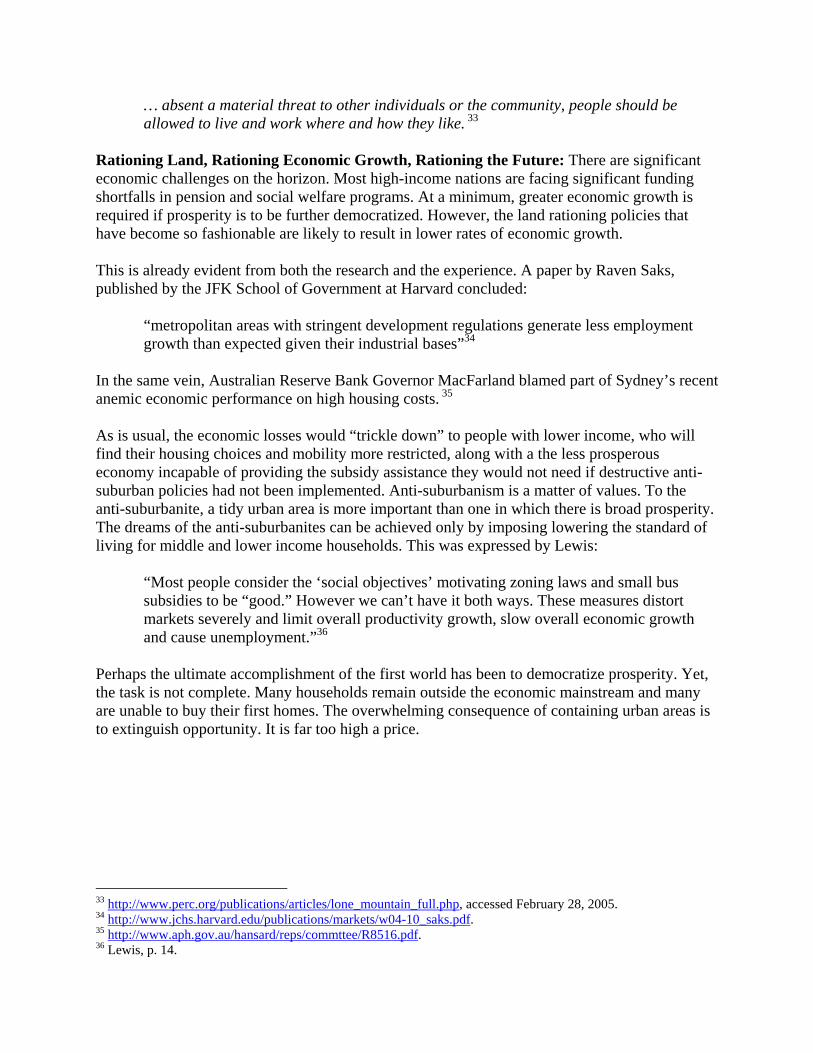
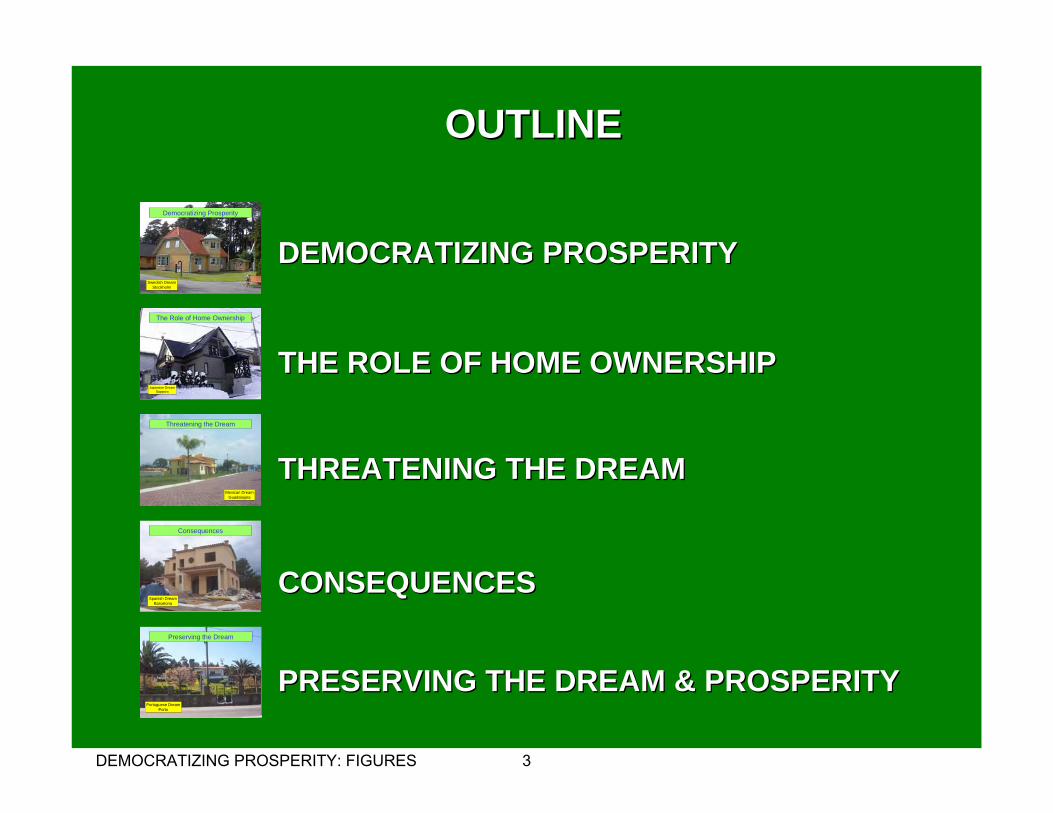
DEMOCRATIZING PROSPERITYDEMOCRATIZING PROSPERITY
THE ROLE OF HOME OWNERSHIPTHE ROLE OF HOME OWNERSHIP
THREATENING THE DREAMTHREATENING THE DREAM
CONSEQUENCESCONSEQUENCES
PRESERVING THE DREAM & PROSPERITYPRESERVING THE DREAM & PROSPERITY
OUTLINEOUTLINE
DEMOCRATIZING PROSPERITY: FIGURES 3
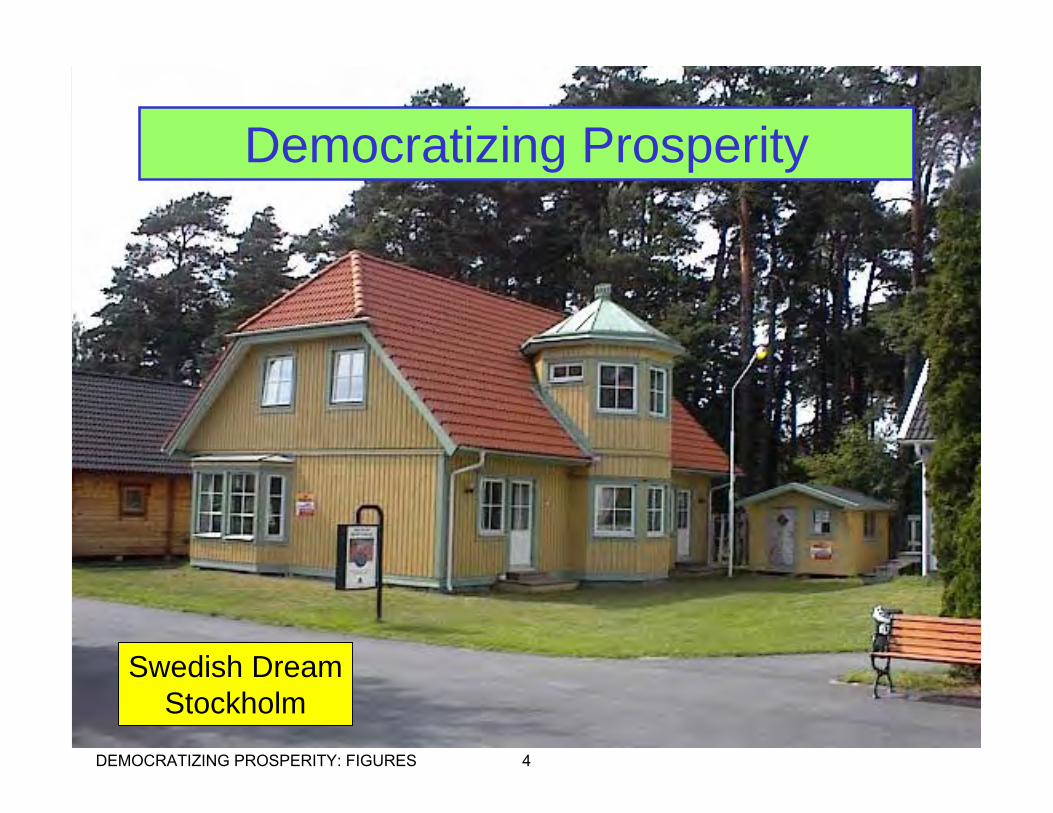
Swedish DreamStockholm
Democratizing Prosperity
DEMOCRATIZING PROSPERITY: FIGURES 4
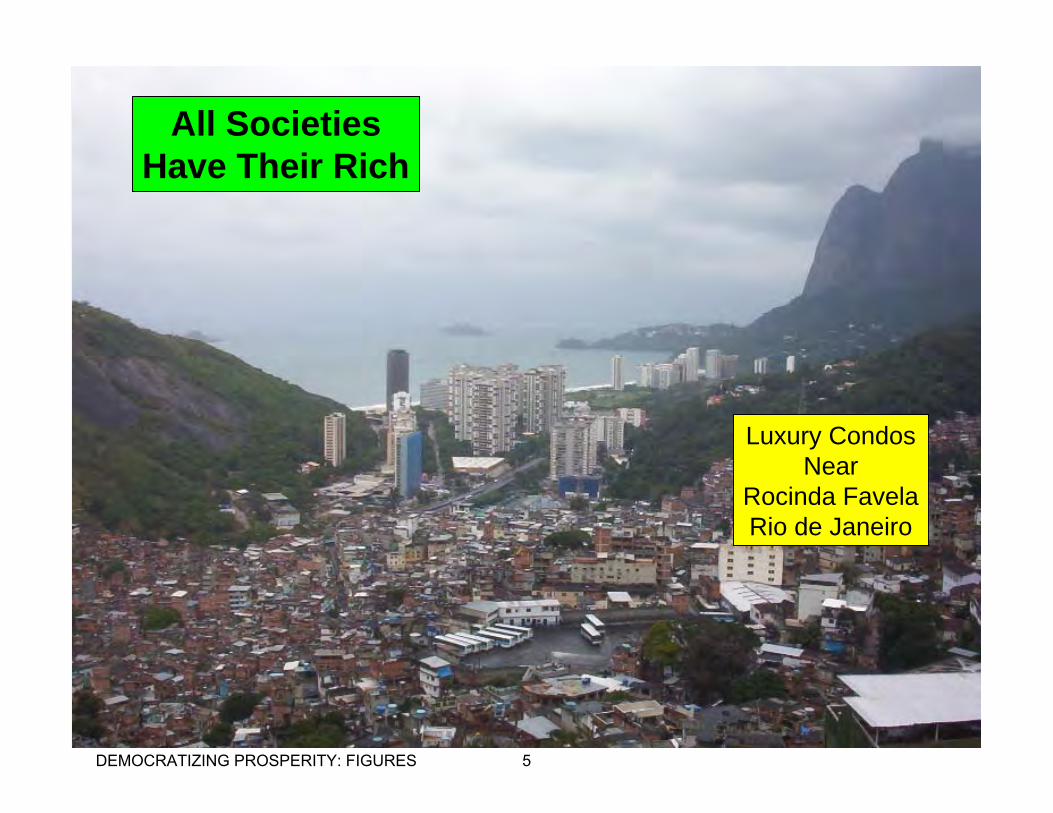
Luxury CondosNear
Rocinda FavelaRio de Janeiro
All SocietiesHave Their Rich
DEMOCRATIZING PROSPERITY: FIGURES 5
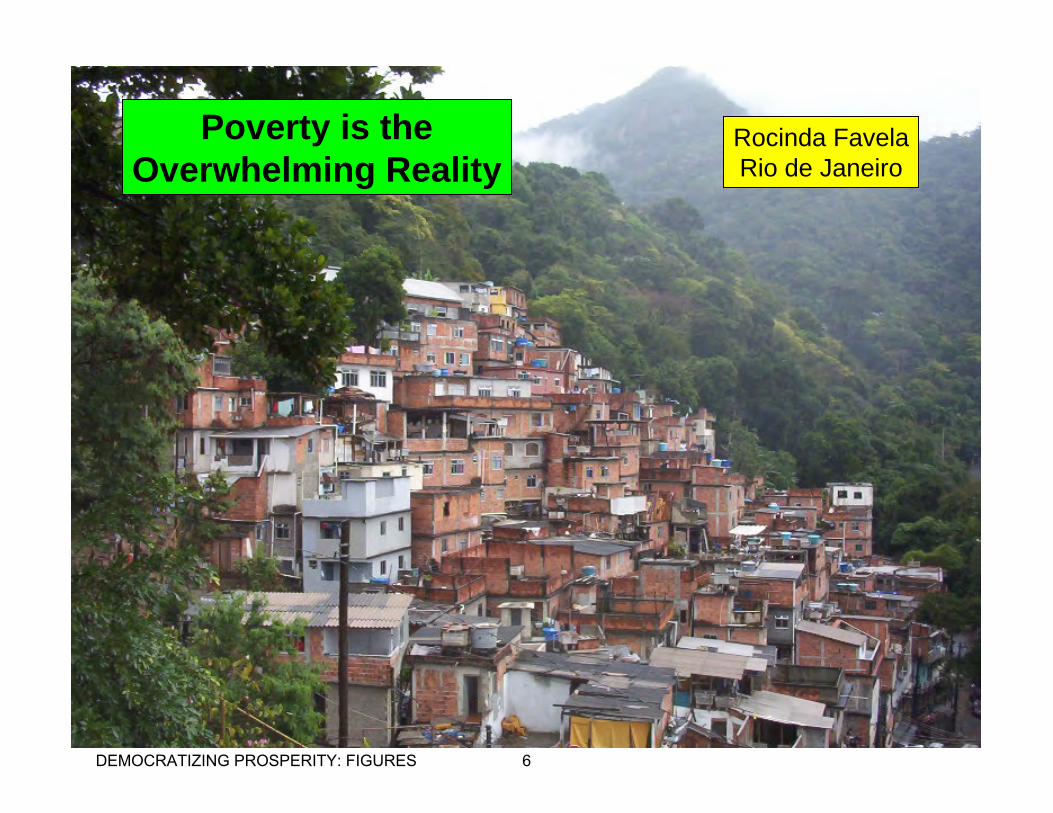
Rocinda FavelaRio de Janeiro
Poverty is theOverwhelming Reality
DEMOCRATIZING PROSPERITY: FIGURES 6
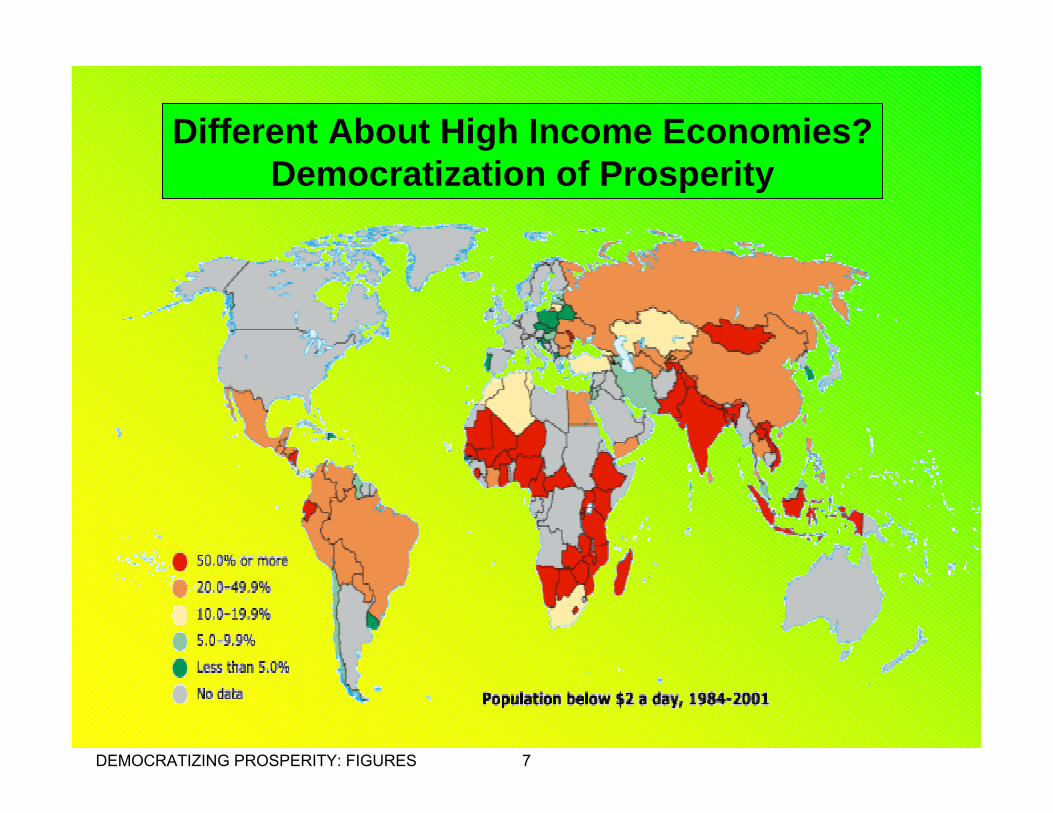
Different About High Income Economies?Democratization of Prosperity
DEMOCRATIZING PROSPERITY: FIGURES 7
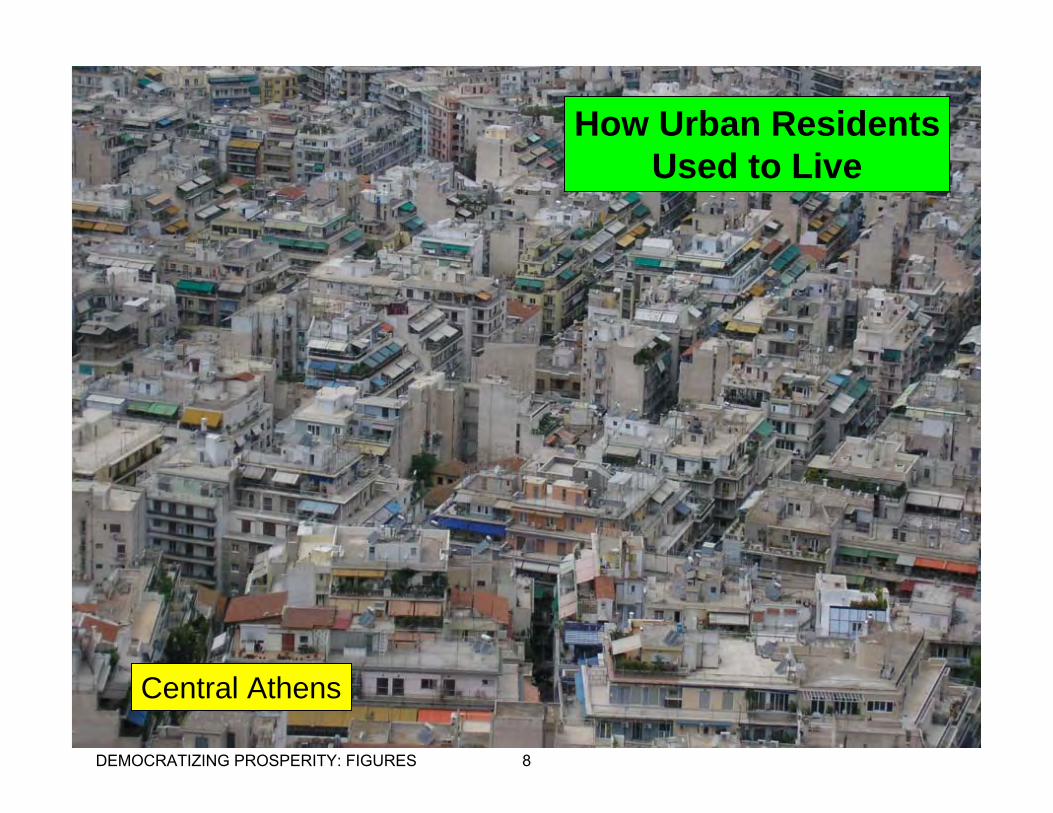
Central Athens
How Urban ResidentsUsed to Live
DEMOCRATIZING PROSPERITY: FIGURES 8
0
50,000
100,000
150,000
200,000
250,000
300,000
350,0000
300
600
900
1,200
1,500
1,800
2,100
2,400
2,700
3,000
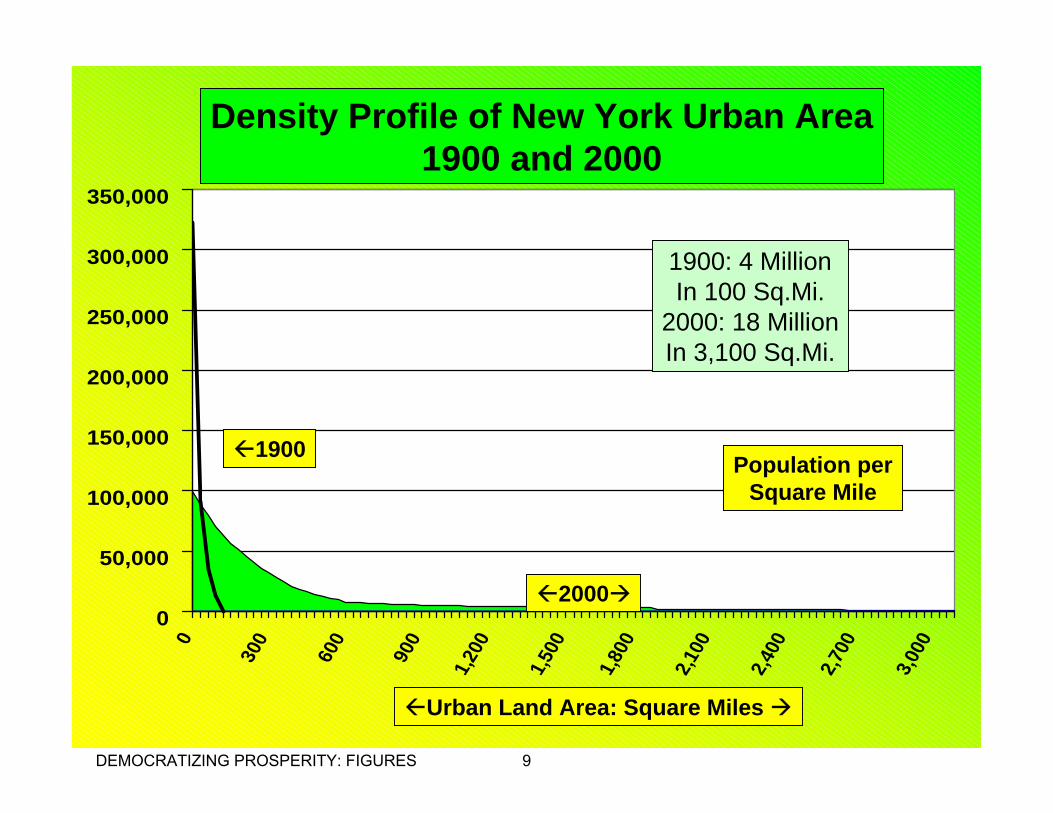
1900: 4 MillionIn 100 Sq.Mi.
2000: 18 MillionIn 3,100 Sq.Mi.
Density Profile of New York Urban Area1900 and 2000
1900
2000
Population perSquare Mile
Urban Land Area: Square Miles
DEMOCRATIZING PROSPERITY: FIGURES 9
$0
$5,000
$10,000
$15,000
$20,000
$25,000
$30,000
1870 1890 1910 1930 1950 1970 1990
United States
Japan
WesternEuropeAustraliaUS Poverty Threshold
History of the World is theHistory of Poverty
GDP-PPPPer Capita
1990$(OECD)
DEMOCRATIZING PROSPERITY: FIGURES 10
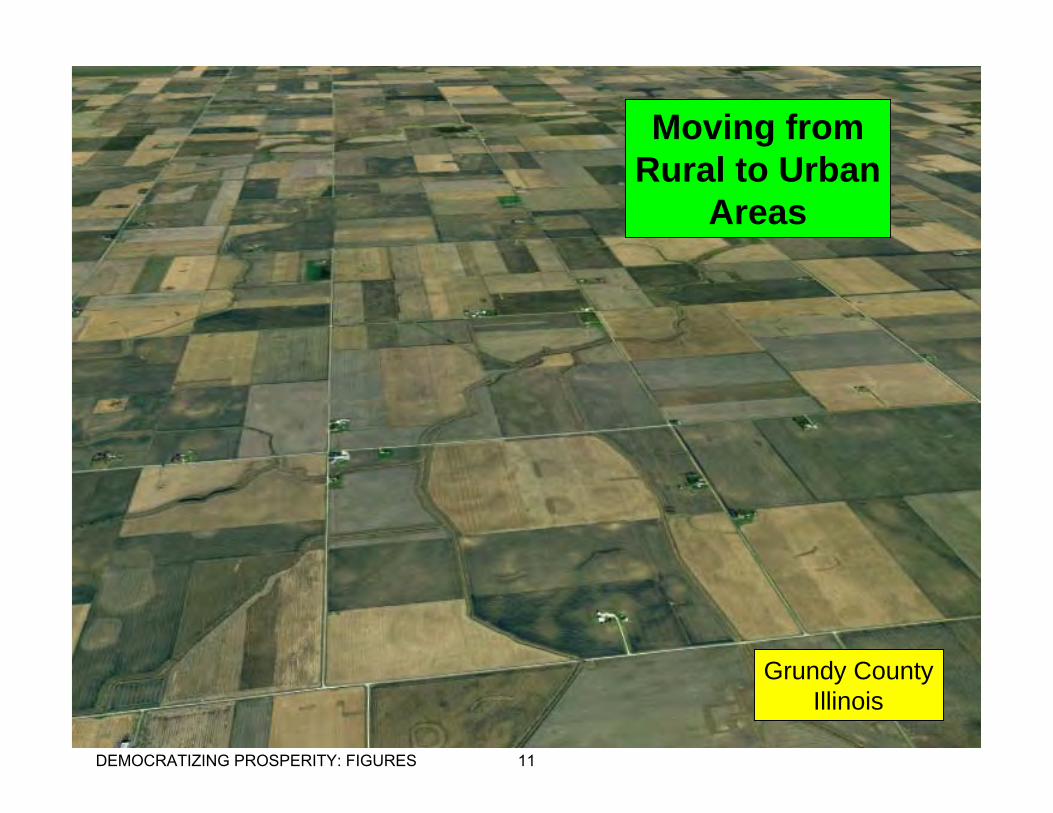
Grundy CountyIllinois
Moving fromRural to Urban
Areas
DEMOCRATIZING PROSPERITY: FIGURES 11
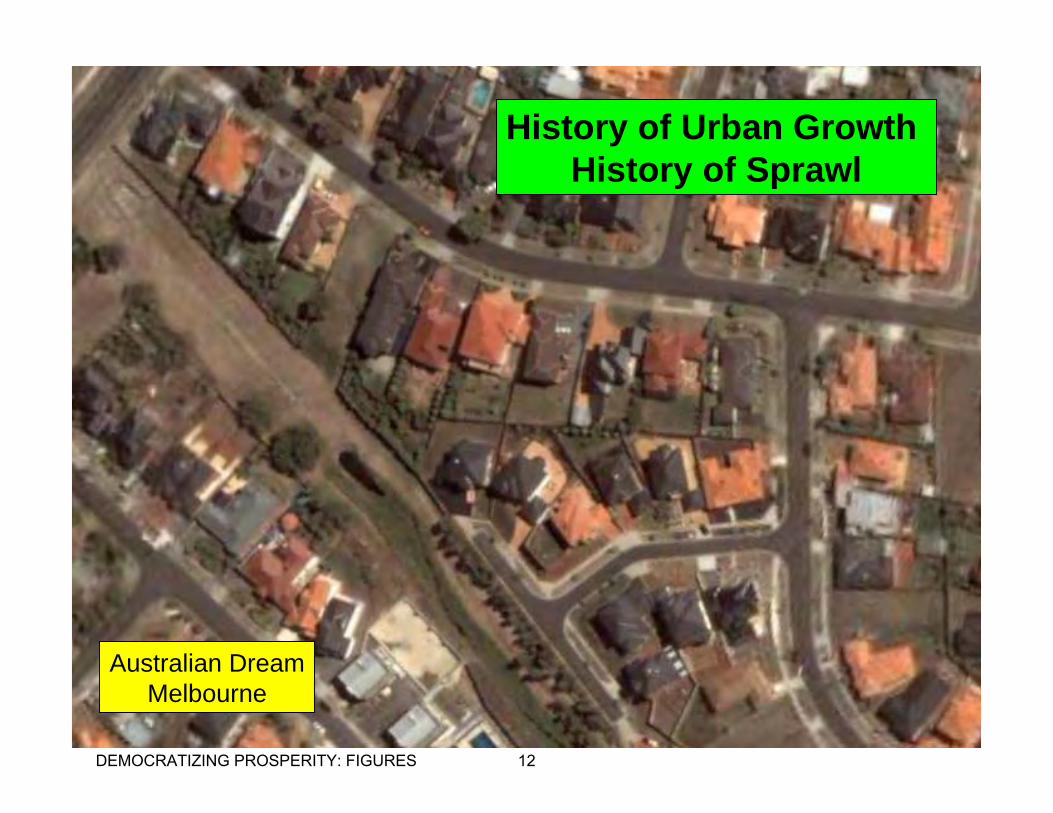
History of Urban Growth History of Sprawl
Australian DreamMelbourne
DEMOCRATIZING PROSPERITY: FIGURES 12
0
20
40
60
80
100
120
140
1800-1850 1850-1900 1900-1950 1950-2000
USGrowth
x1,000,000
Democratization of Prosperity isAssociated with Urban Growth
Urban
Rural
DEMOCRATIZING PROSPERITY: FIGURES 13

0%
20%
40%
60%
80%
100%
120%
Canada UnitedStates
WesternEurope
Japan Australasia
Canada from 1951, US from 1950
Others from 1965
Democratization of Prosperity isAssociated with Suburbanization
DEMOCRATIZING PROSPERITY: FIGURES 14
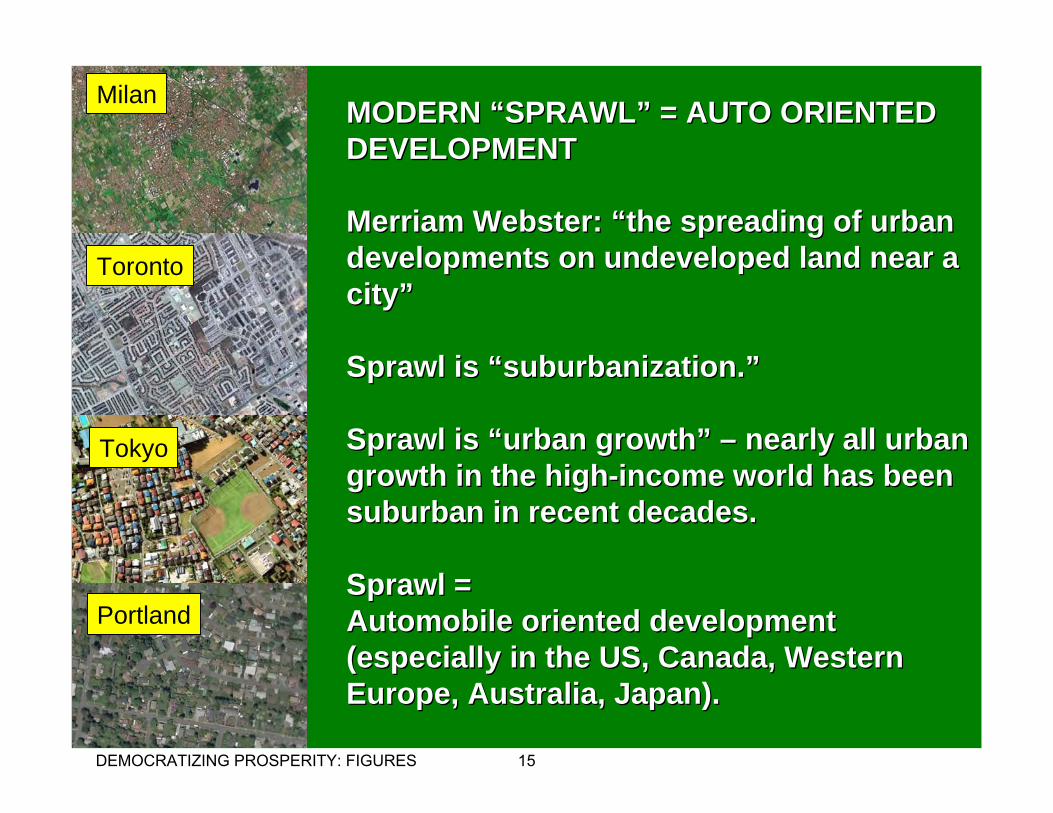
MODERN MODERN ““SPRAWLSPRAWL”” = AUTO ORIENTED= AUTO ORIENTEDDEVELOPMENTDEVELOPMENT
Merriam Webster: Merriam Webster: ““the spreading of urban the spreading of urban developments on undeveloped land near a developments on undeveloped land near a citycity””
Sprawl is Sprawl is ““suburbanization.suburbanization.””
Sprawl is Sprawl is ““urban growthurban growth”” –– nearly all urban nearly all urban growth in the highgrowth in the high--income world has been income world has been suburban in recent decades.suburban in recent decades.
Sprawl = Sprawl = Automobile oriented development Automobile oriented development (especially in the US, Canada, Western (especially in the US, Canada, Western Europe, Australia, Japan).Europe, Australia, Japan).
Milan
Toronto
Tokyo
Portland
DEMOCRATIZING PROSPERITY: FIGURES 15
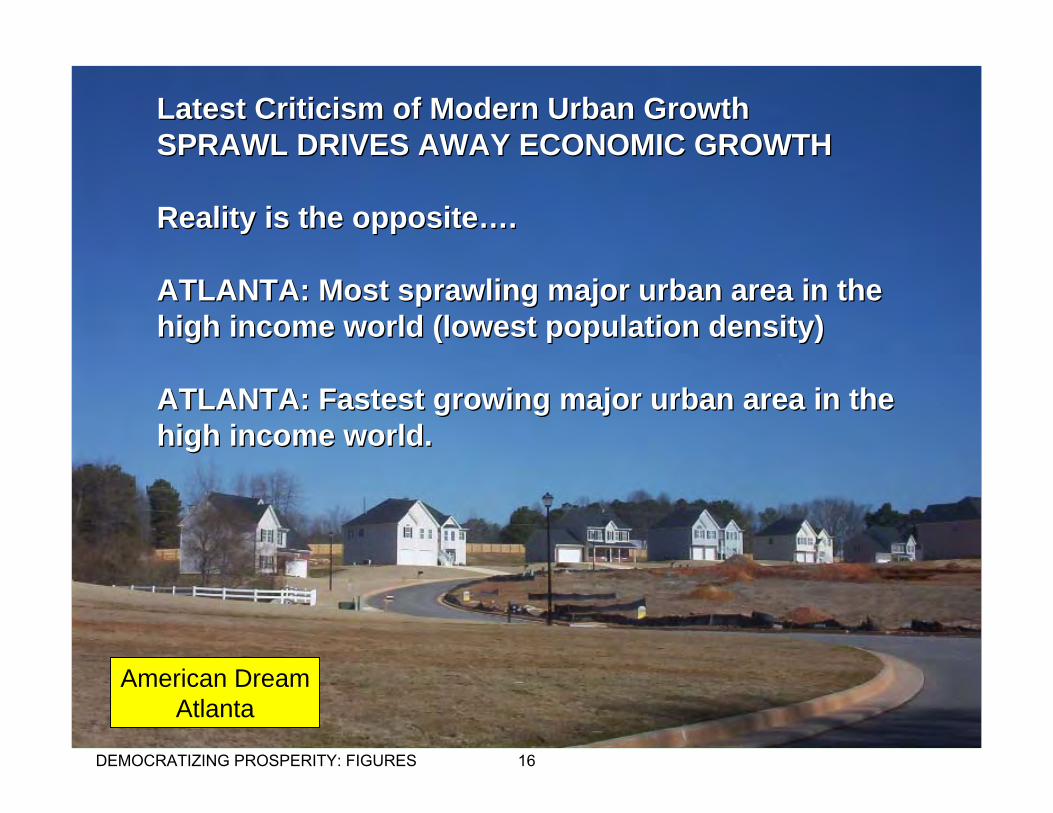
Latest Criticism of Modern Urban GrowthLatest Criticism of Modern Urban GrowthSPRAWL DRIVES AWAY ECONOMIC GROWTHSPRAWL DRIVES AWAY ECONOMIC GROWTH
Reality is the oppositeReality is the opposite……..
ATLANTA: Most sprawling major urban area in the ATLANTA: Most sprawling major urban area in the high income world (lowest population density)high income world (lowest population density)
ATLANTA: Fastest growing major urban area in the ATLANTA: Fastest growing major urban area in the high income world.high income world.
American DreamAtlanta
DEMOCRATIZING PROSPERITY: FIGURES 16
0%10%20%30%40%50%60%70%80%90%
100%
1900
1910
1920
1930
1940
1950
1960
1970
1980
1990
2000
Mass Transit Market Share
Democratization of Prosperity isAssociated with Personal Mobility
AutomobileMarket Share
DEMOCRATIZING PROSPERITY: FIGURES 17
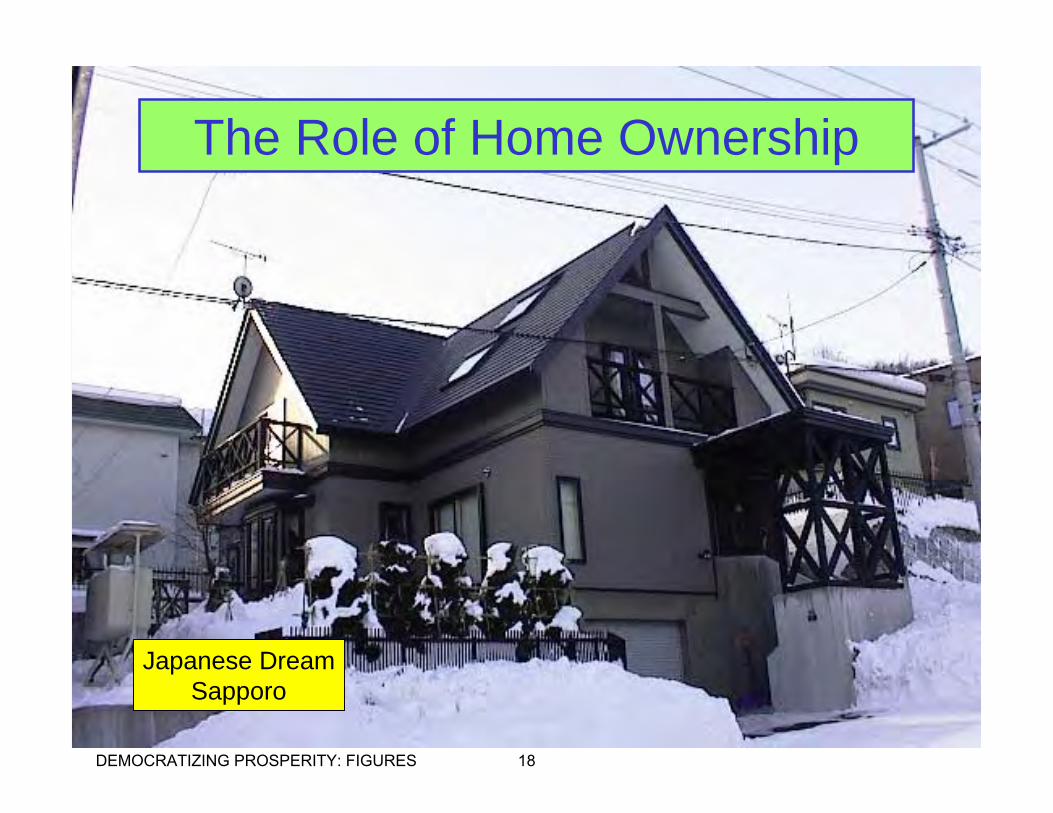
Japanese DreamSapporo
The Role of Home Ownership
DEMOCRATIZING PROSPERITY: FIGURES 18
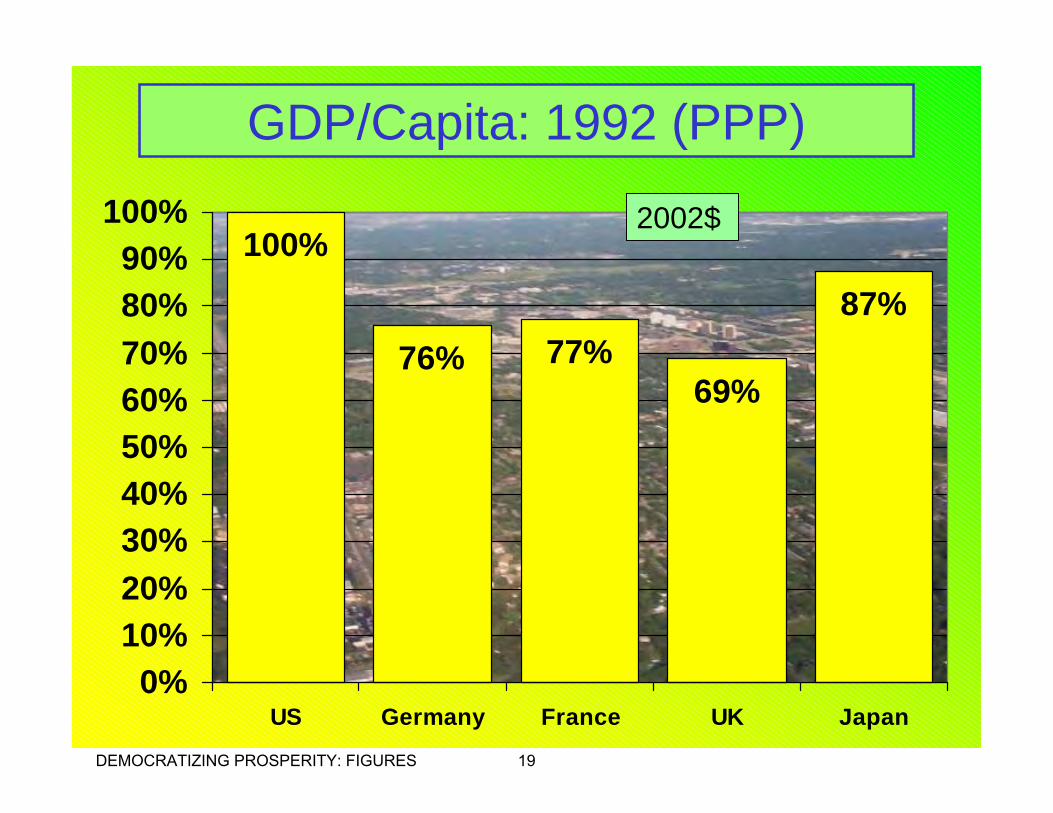
GDP/Capita: 1992 (PPP)
76% 77%69%
87%
100%
0%10%20%30%40%50%60%70%80%90%
100%
US Germany France UK Japan
2002$
DEMOCRATIZING PROSPERITY: FIGURES 19
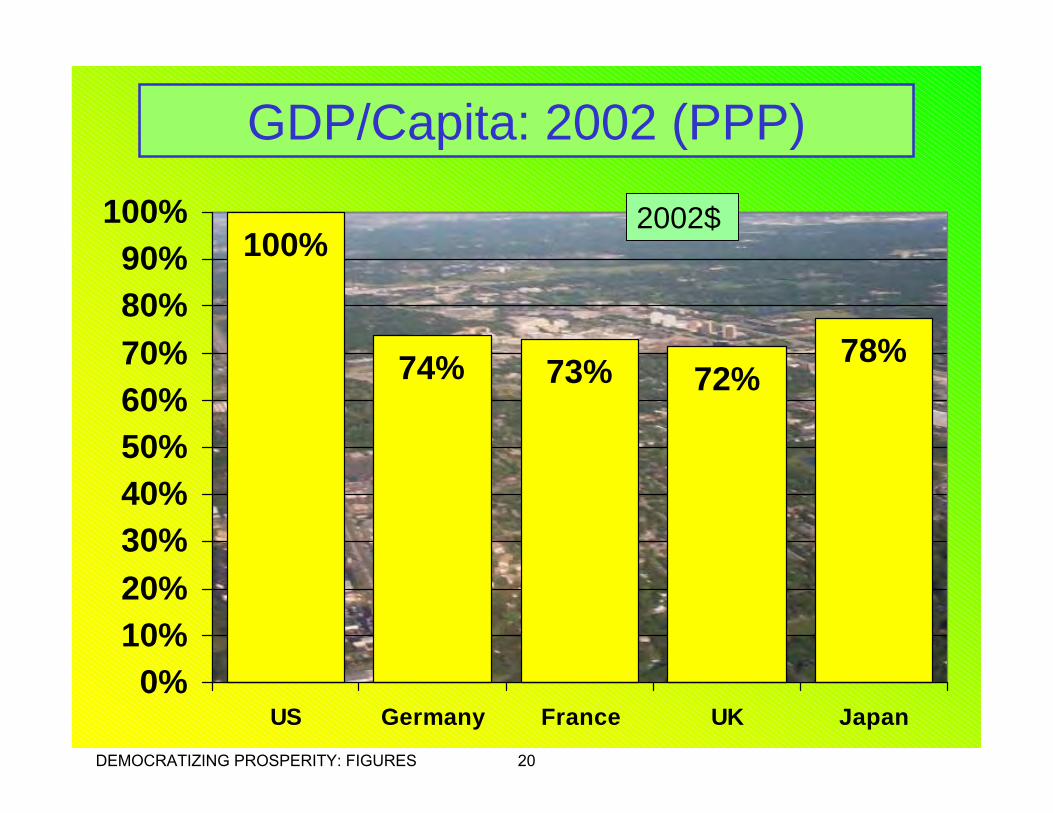
GDP/Capita: 2002 (PPP)
74% 73% 72%78%
100%
0%10%20%30%40%50%60%70%80%90%
100%
US Germany France UK Japan
2002$
DEMOCRATIZING PROSPERITY: FIGURES 20
STRENGTHSTRENGTHOF THEOF THEAMERICANAMERICANECONOMYECONOMY
“Competitive“Competitiveintensity”intensity”
Examples:Examples:Less restrictiveLess restrictive
land regulation land regulation
RetailingRetailingDEMOCRATIZING PROSPERITY: FIGURES 21
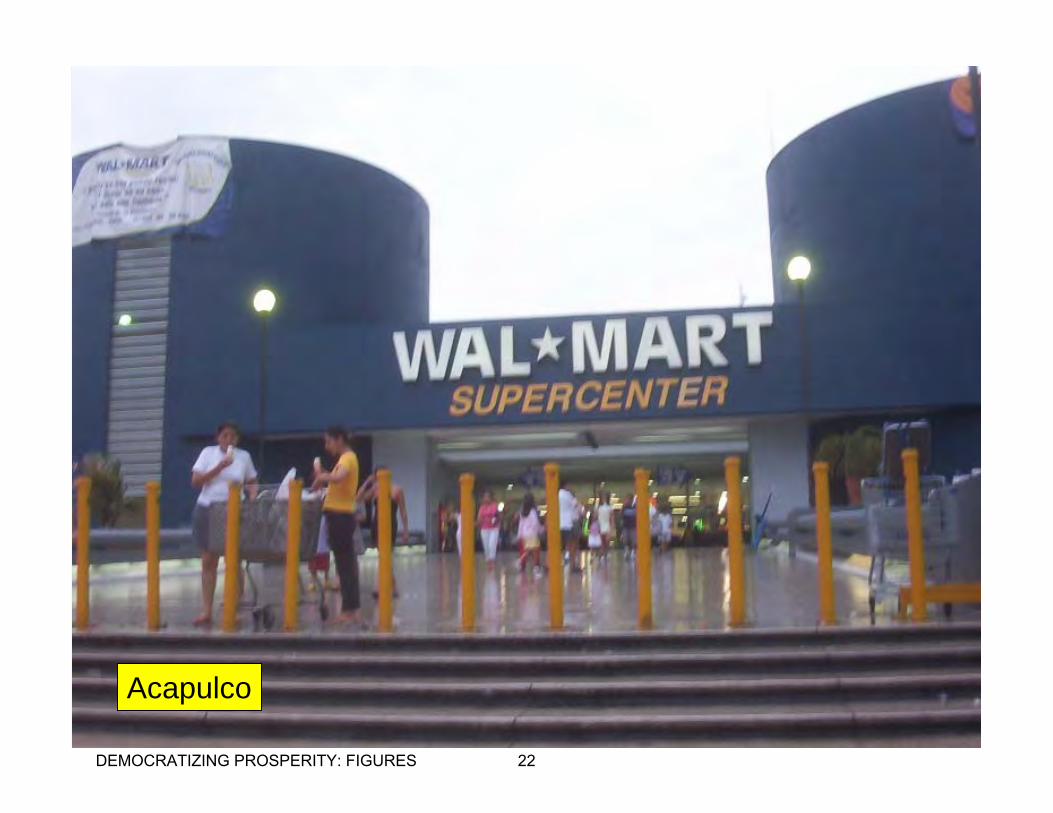
Acapulco
DEMOCRATIZING PROSPERITY: FIGURES 22

Bucharest
DEMOCRATIZING PROSPERITY: FIGURES 23

0%10%20%30%40%50%60%70%80%90%
100%
1900 1910 1920 1930 1940 1950 1960 1970 1980 1990 2000
Renters
Democratization of Prosperity isAssociated with Rising Home Ownership
Home Owners
DEMOCRATIZING PROSPERITY: FIGURES 24
65%
43%42%
0%
10%
20%
30%
40%
50%
60%
70%
All Under $20,000 $20,000-$50,000
% of Assets inHouse Equity:
USA 1998
Economic Impact of Home Ownership
DEMOCRATIZING PROSPERITY: FIGURES 25
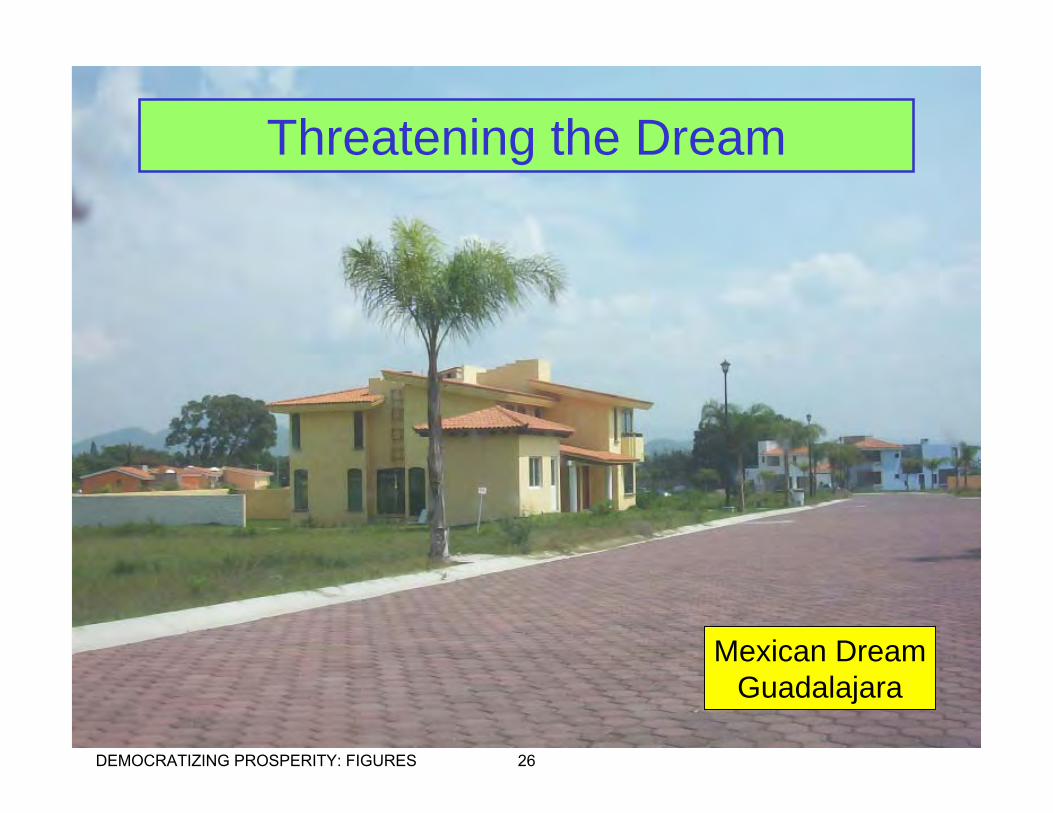
Threatening the Dream
Mexican DreamGuadalajara
DEMOCRATIZING PROSPERITY: FIGURES 26
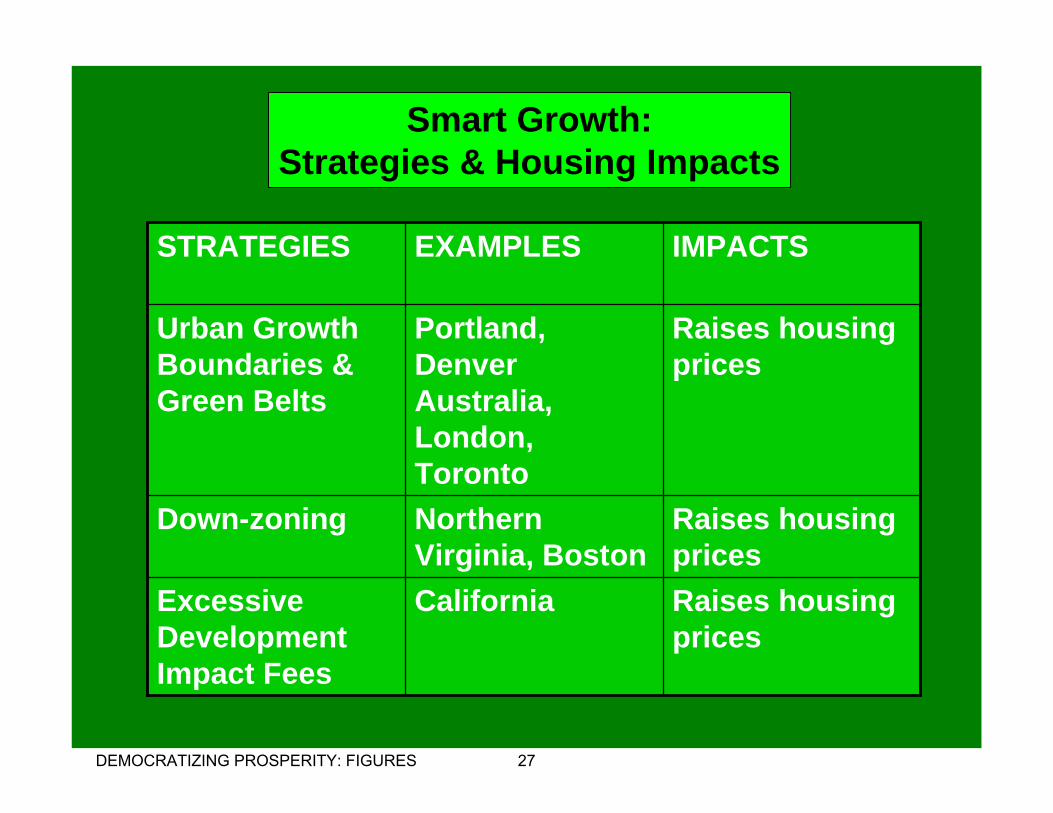
Raises housing prices
Portland, Denver Australia, London, Toronto
Urban Growth Boundaries & Green Belts
Raises housing prices
CaliforniaExcessive Development Impact Fees
Raises housing prices
Northern Virginia, Boston
Down-zoning
IMPACTSEXAMPLESSTRATEGIES
Smart Growth:Strategies & Housing Impacts
DEMOCRATIZING PROSPERITY: FIGURES 27
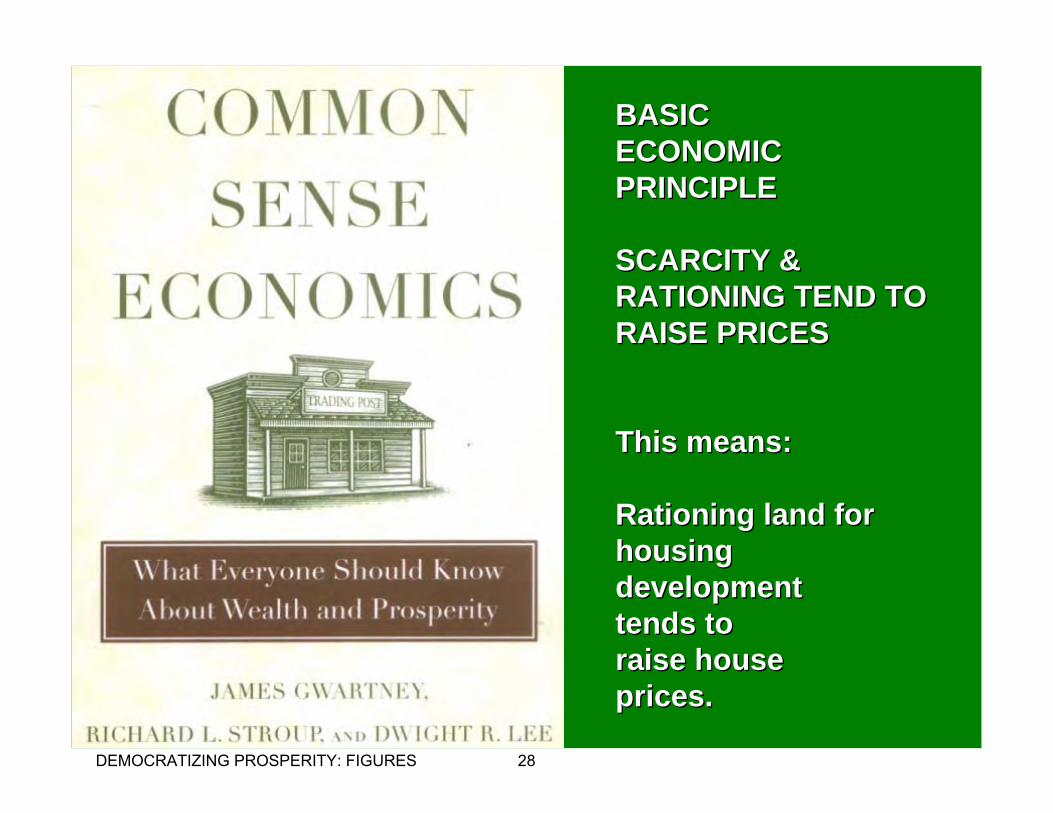
BASICBASICECONOMICECONOMICPRINCIPLEPRINCIPLE
SCARCITY &SCARCITY &RATIONING TEND TORATIONING TEND TORAISE PRICESRAISE PRICES
This means:This means:
Rationing land forRationing land forhousing housing development development tends to tends to raise house raise house prices. prices.
DEMOCRATIZING PROSPERITY: FIGURES 28

BASICBASICECONOMICECONOMICPRINCIPLEPRINCIPLE
HIGHER PRICESHIGHER PRICESTEND TO MEANTEND TO MEANFEWER BUYERSFEWER BUYERS
This means:This means:
Higher housingHigher housingprices tend toprices tend tolead to lowerlead to lowerrates of homerates of homeownership.ownership.
DEMOCRATIZING PROSPERITY: FIGURES 29
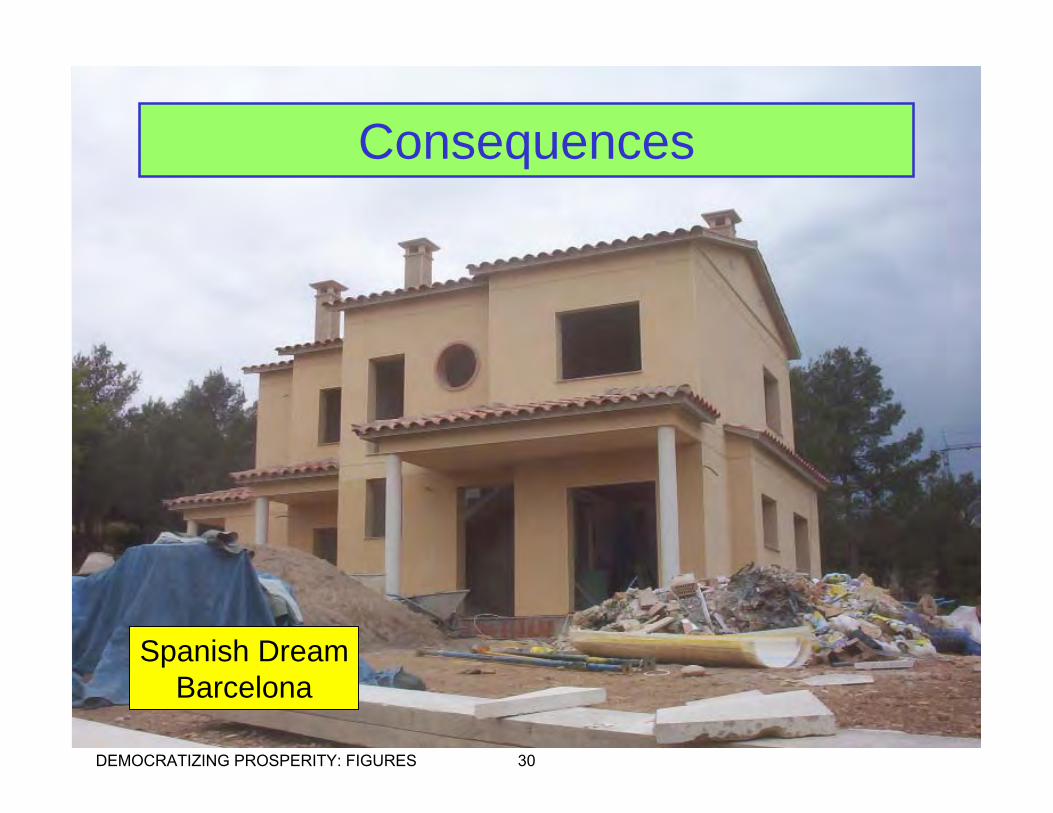
Consequences
Spanish DreamBarcelona
DEMOCRATIZING PROSPERITY: FIGURES 30

ANDRES DUANYANDRES DUANY
There is NO There is NO question that question that urban growth boundariesurban growth boundariesand that elaborate and that elaborate environmental public environmental public processes processes increase the cost of increase the cost of housing by creating housing by creating scarcity. (And donscarcity. (And don’’t t tell me otherwise, tell me otherwise, because I am not stupid, because I am not stupid, nor am I inexperienced, nor am I inexperienced, nor do I have nor do I have underdeveloped powers underdeveloped powers of observation).of observation).
Italian DreamMilan
“Sun Rises
in the West”
studies
DEMOCRATIZING PROSPERITY: FIGURES 31

BROOKINGSBROOKINGS(Nelson et al)(Nelson et al)
““the housing the housing price effects of price effects of growth growth management management policies depend policies depend heavily on how heavily on how they are designed they are designed and implemented. and implemented. If the policies If the policies tend to restrict tend to restrict land supplies land supplies then housing then housing price increases price increases are expected.are expected.””
DEMOCRATIZING PROSPERITY: FIGURES 32
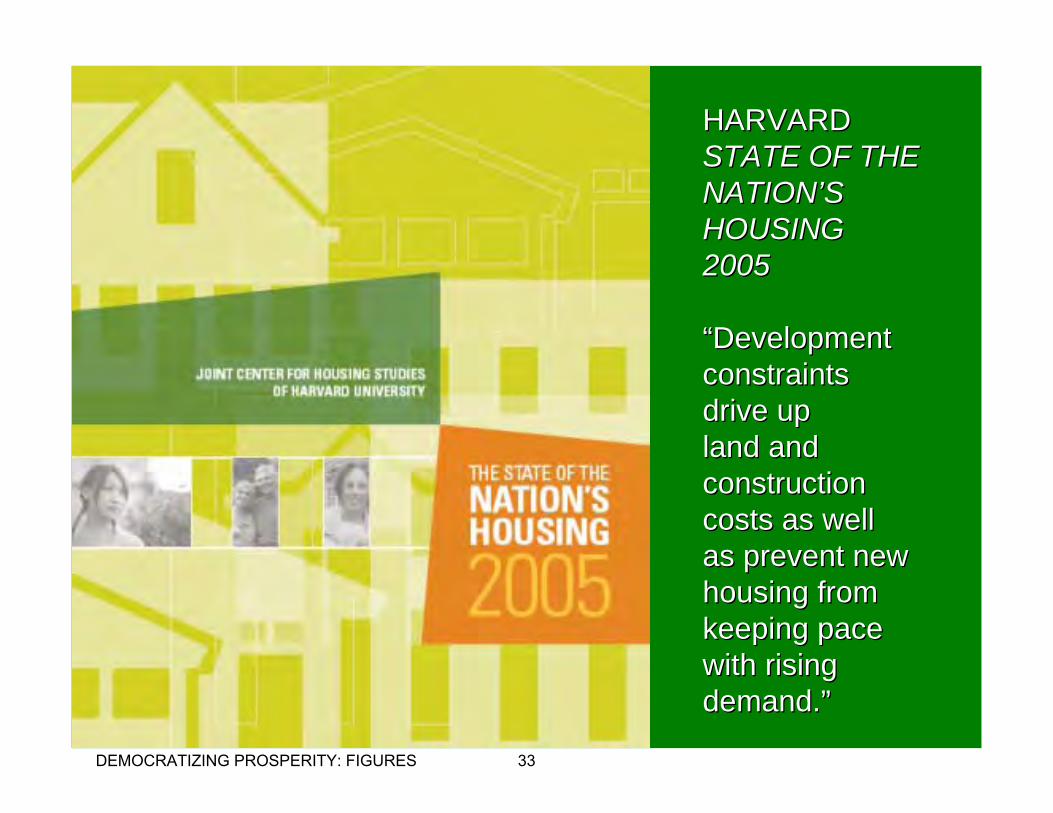
HARVARDHARVARDSTATE OF THESTATE OF THENATION’S NATION’S HOUSINGHOUSING20052005
“Development “Development constraints constraints drive up drive up land and land and construction construction costs as well costs as well as prevent new as prevent new housing from housing from keeping pace keeping pace with rising with rising demand.”demand.”
DEMOCRATIZING PROSPERITY: FIGURES 33
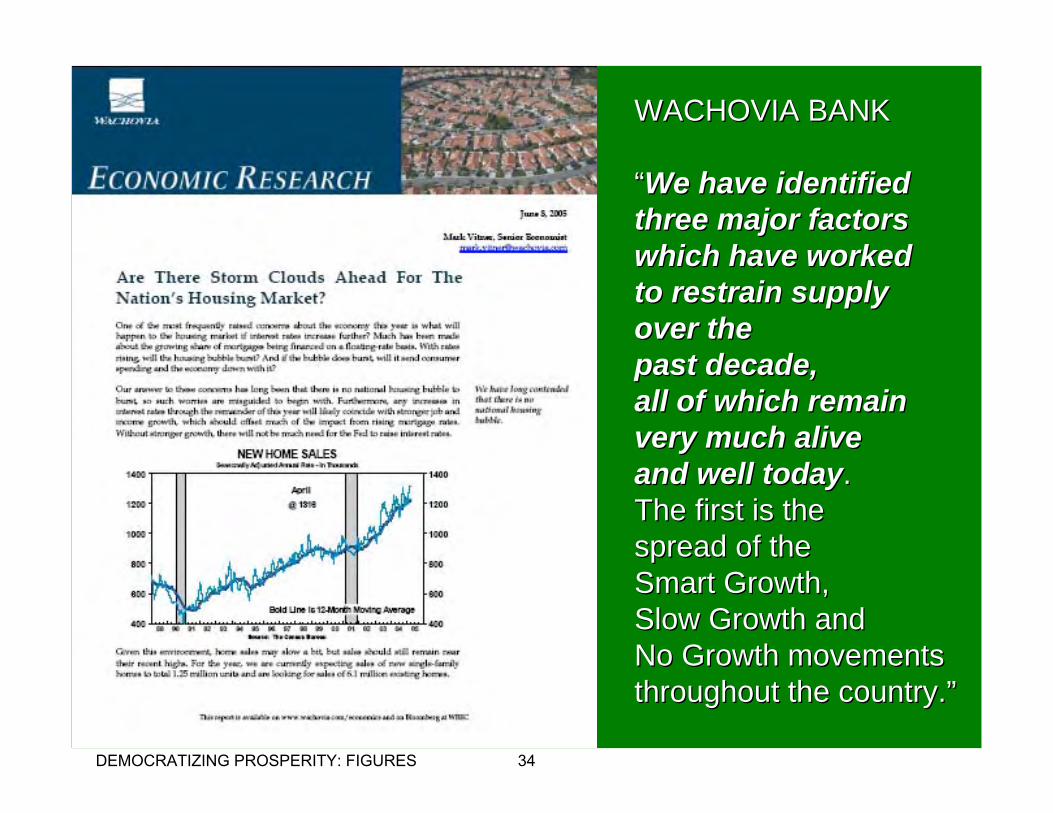
WACHOVIA BANKWACHOVIA BANK
““We have identified We have identified three major factors three major factors which have worked which have worked to restrain supply to restrain supply over theover thepast decade, past decade, all of which remain all of which remain very much alive very much alive and well todayand well today. . The first is the The first is the spread of the spread of the Smart Growth, Smart Growth, Slow Growth and Slow Growth and No Growth movements No Growth movements throughout the country.throughout the country.””
DEMOCRATIZING PROSPERITY: FIGURES 34
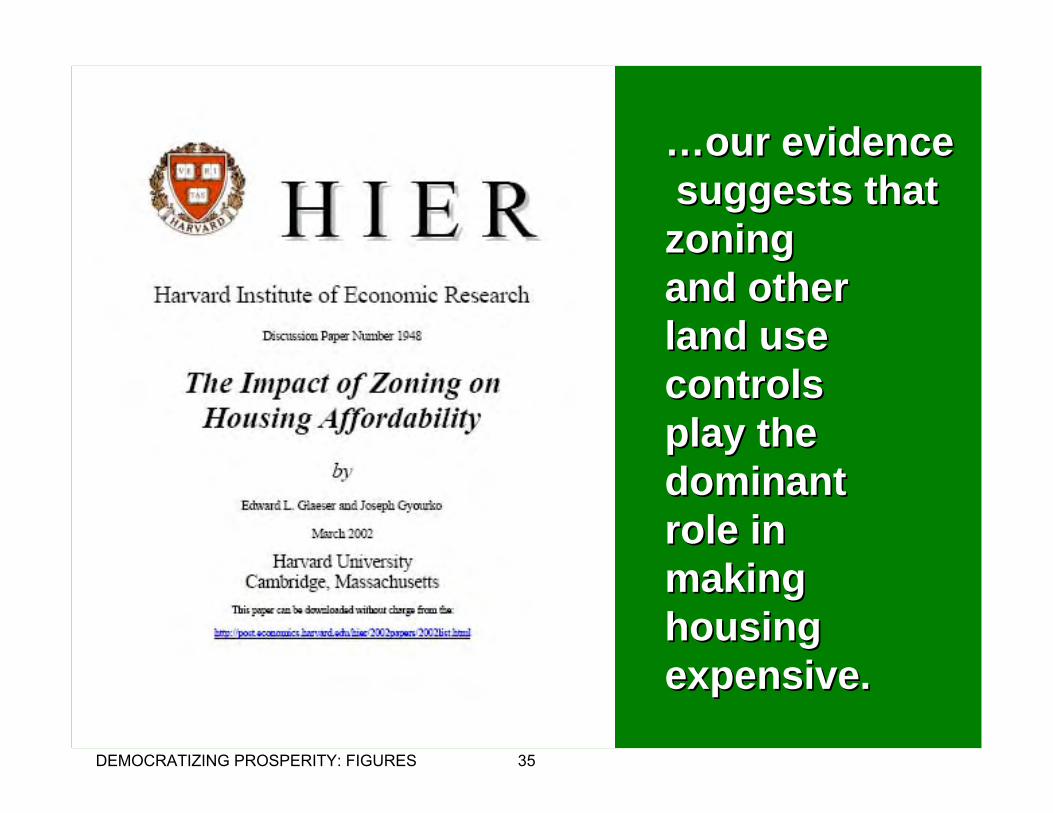
……our evidenceour evidencesuggests that suggests that
zoning zoning and other and other land use land use controls controls play the play the dominant dominant role in role in making making housing housing expensive.expensive.
DEMOCRATIZING PROSPERITY: FIGURES 35
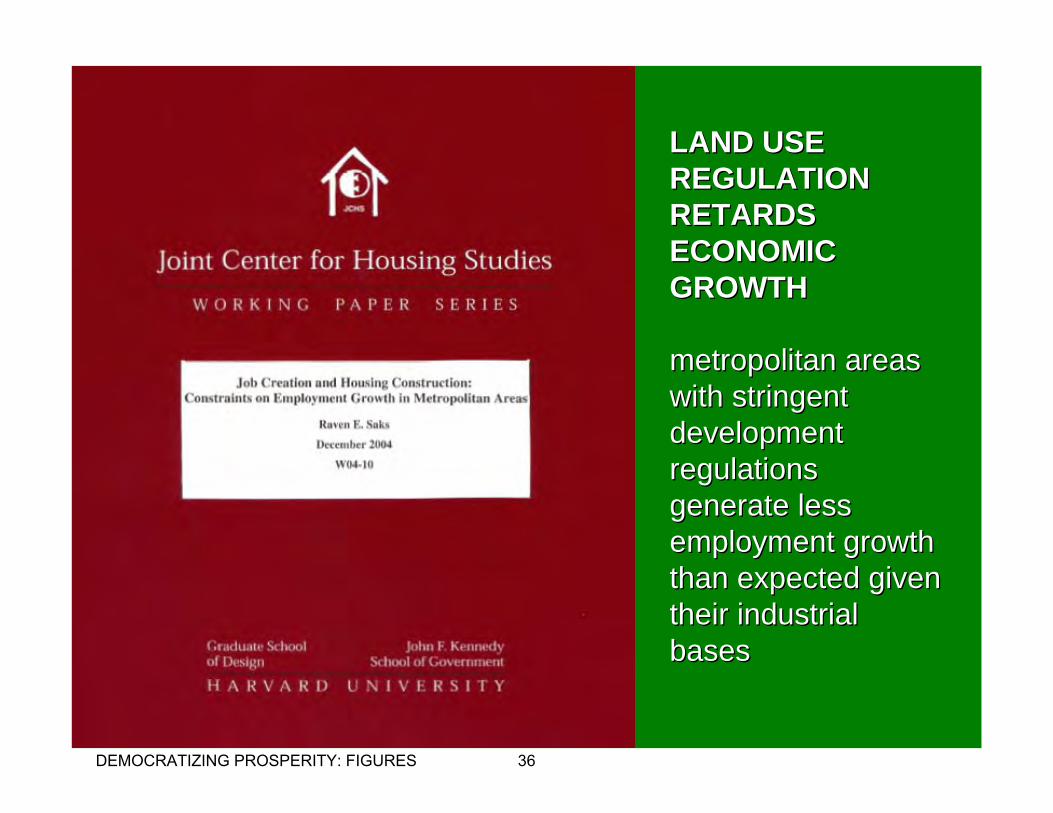
LAND USELAND USEREGULATIONREGULATIONRETARDSRETARDSECONOMICECONOMICGROWTHGROWTH
metropolitan areas metropolitan areas with stringent with stringent development development regulations regulations generate less generate less employment growth employment growth than expected given than expected given their industrial their industrial basesbases
DEMOCRATIZING PROSPERITY: FIGURES 36
0%
10%
20%
30%
40%
50%
60%Kahn (Tufts University)
Higher Density
Lower Density
African-American Home OwnershipHigher Where there is More Sprawl
DEMOCRATIZING PROSPERITY: FIGURES 37
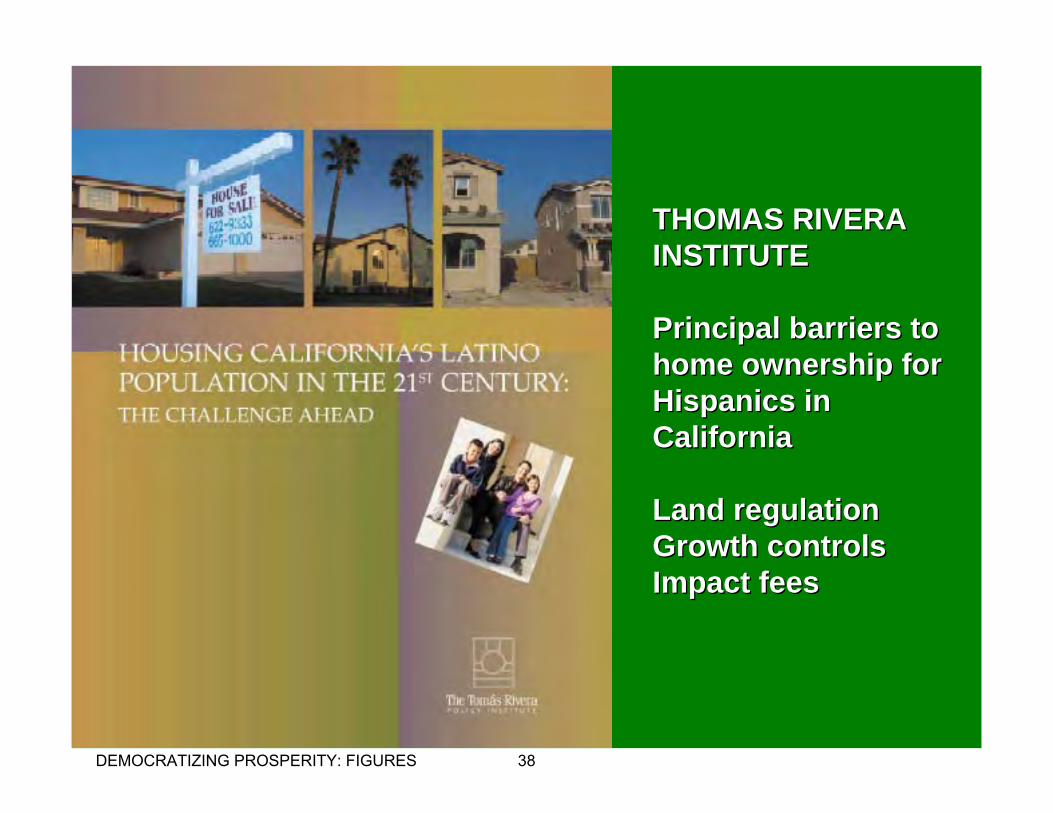
THOMAS RIVERATHOMAS RIVERAINSTITUTEINSTITUTE
Principal barriers toPrincipal barriers tohome ownership forhome ownership forHispanics in Hispanics in CaliforniaCalifornia
Land regulationLand regulationGrowth controlsGrowth controlsImpact feesImpact fees
DEMOCRATIZING PROSPERITY: FIGURES 38
0
1
2
3
4
5
6
KS IA TX ND OK AR NE SD IN MS PA MO
WV
MN
WY AL WI
OH TN MI
KY VA LA AK NH DE MD
GA
ME ID SC IL NC FL VT MT CT UT AZ NJ RI NM NV NY CO WA OR
MA DC CA HI
House Value:Household Income
Multiple: 2000 Census
Housing Affordability: States2000 CENSUS
Strongly Regulated Markets
More Affordable
DEMOCRATIZING PROSPERITY: FIGURES 39

US Housing Cost MultipleCHANGE: 1970-2000
-20%-10%
0%10%20%30%40%50%60%70%
Aver
age
Alab
ama
Alas
kaAr
izon
aAr
kans
asCa
lifor
nia
Colo
rado
Conn
ectic
utDe
law
are
D.C
Flor
ida
Geo
rgia
Haw
aii
Idah
oIll
inoi
sIn
dian
aIo
wa
Kans
asKe
ntuc
kyLo
uisi
ana
Mai
neM
aryl
and
Mas
sach
uset
tsM
ichi
gan
Min
neso
taM
issi
ssip
piM
isso
uri
Mon
tana
Nebr
aska
Neva
daNe
w H
amps
hire
New
Jer
sey
New
Mex
ico
New
Yor
kNo
rth C
arol
ina
North
Dak
ota
Ohi
oO
klah
oma
Ore
gon
Pen
nsyl
vani
aR
hode
Isla
ndS
outh
Car
olin
aS
outh
Dak
ota
Tenn
esse
eTe
xas
Utah
Ver
mon
tV
irgin
iaW
ashi
ngto
nW
est V
irgin
iaW
isco
nsin
Wyo
min
g
Policy DrivenLand Scarcity
(Red)
DEMOCRATIZING PROSPERITY: FIGURES 40
0
1
2
3
4
5
6
SAN
HOU
DFW
PGH
STL
KC TSP
IPS
PHI
ORL VB CI
NCP
SAT
LBA
LDE
TCO
LPH
XCL
VNO MIL
WD LV
RSB
CHI
MIA
PRV
SAC
DEN
POR
SEA
BOS NY SD LA SJ SF
House Value:Household Income
Multiple: 2000 Census
Housing Affordability: Largest Urban Areas2000 CENSUS
Strongly Regulated Markets
More Affordable
DEMOCRATIZING PROSPERITY: FIGURES 41
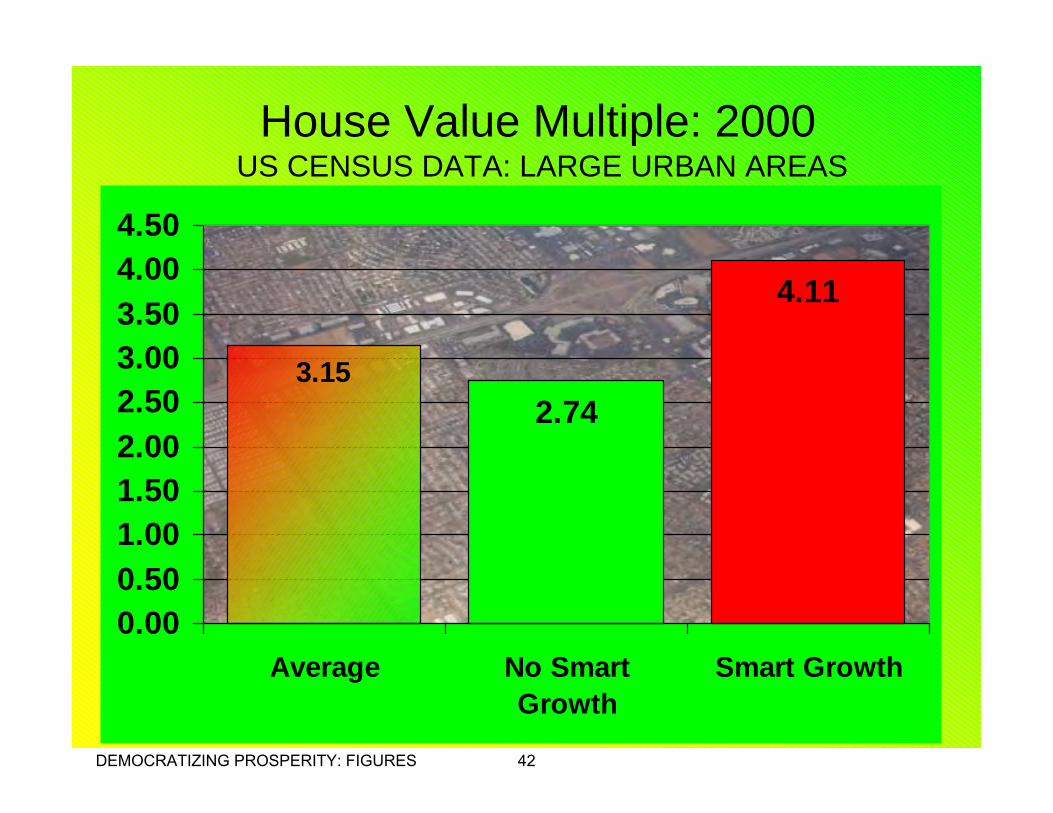
2.74
4.11
3.15
0.000.501.001.502.002.503.003.504.004.50
Average No SmartGrowth
Smart Growth
House Value Multiple: 2000US CENSUS DATA: LARGE URBAN AREAS
DEMOCRATIZING PROSPERITY: FIGURES 42
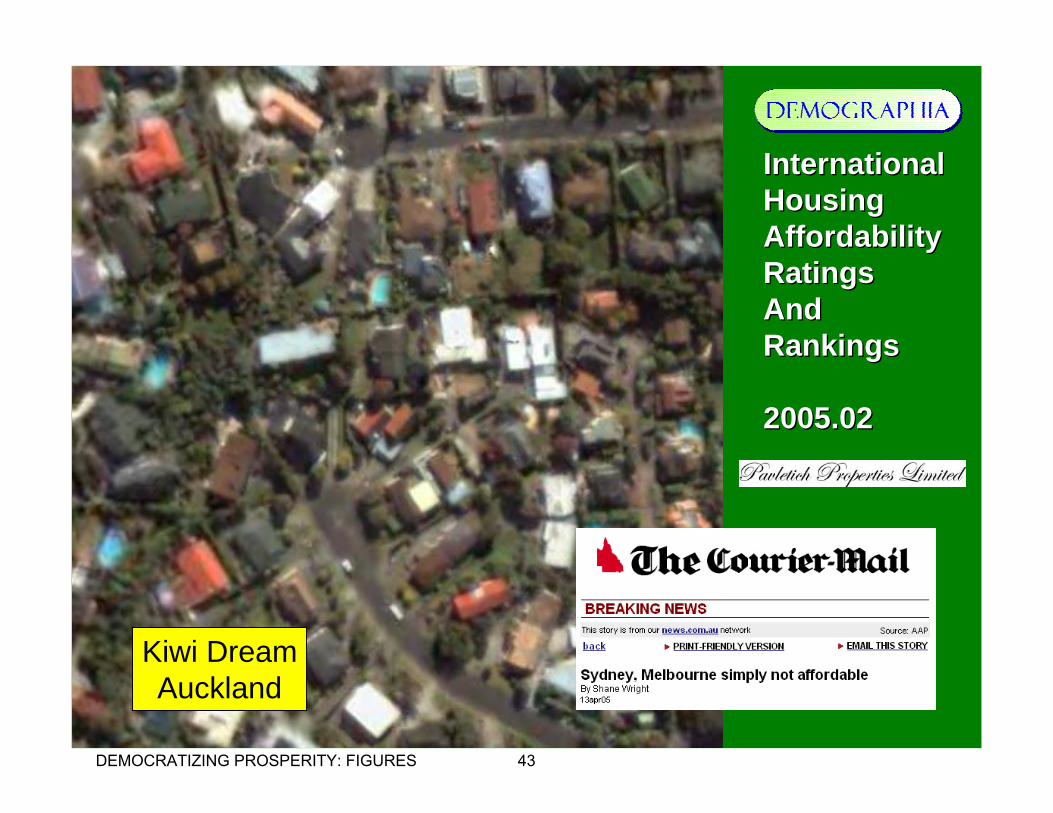
InternationalInternationalHousingHousingAffordabilityAffordabilityRatingsRatingsAndAndRankingsRankings
2005.022005.02
Kiwi DreamAuckland
DEMOCRATIZING PROSPERITY: FIGURES 43
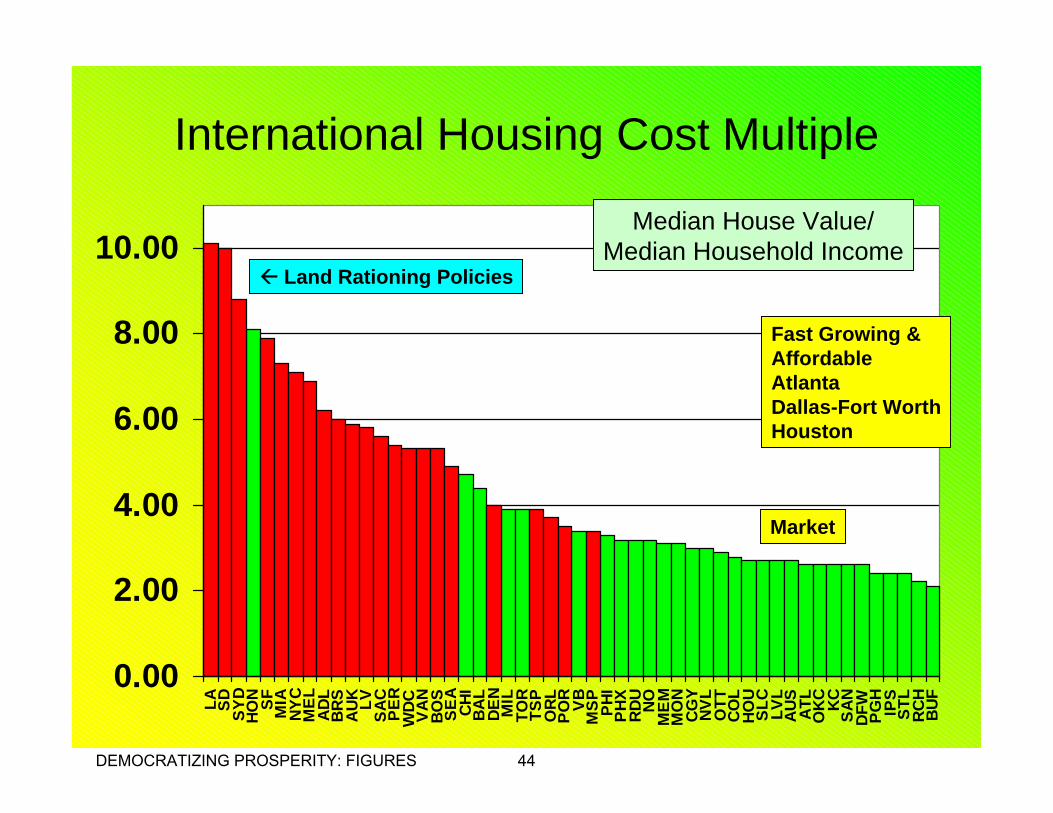
International Housing Cost Multiple
0.00
2.00
4.00
6.00
8.00
10.00LA SD SY
DHO
N SF MIA
NYC
MEL
ADL
BRS
AUK LV
SAC
PER
WDC VA
NBO
SSE
ACH
IBA
LDE
NM
ILTO
RTS
PO
RLPO
RVB
MSP PH
IPH
XRD
UNO
MEM
MO
NCG
YNV
LO
TTCO
LHO
USL
CLV
LAU
SAT
LO
KC KC SAN
DFW
PGH
IPS
STL
RCH
BUF
Median House Value/Median Household Income
Land Rationing Policies
Market
Fast Growing &AffordableAtlantaDallas-Fort WorthHouston
DEMOCRATIZING PROSPERITY: FIGURES 44

Preserving the Dream
Portuguese DreamPorto
DEMOCRATIZING PROSPERITY: FIGURES 45

0%10%20%30%40%50%60%70%80%90%
100%
US Present Oregon: 2000 California & Sydney:2004
HomeOwners
Renters EventualRates Based
Upon HousingPrice Multiples
Smart Growth:Toward a Nation of Renters
70% 50% 15%
DEMOCRATIZING PROSPERITY: FIGURES 46
0%10%20%30%40%50%60%70%80%90%
100%
White-Non Hispanic Hispanic African American
Renters
Democratization of Prosperity is Not Complete:US Home Ownership Rates by Race
Home Owners
DEMOCRATIZING PROSPERITY: FIGURES 47
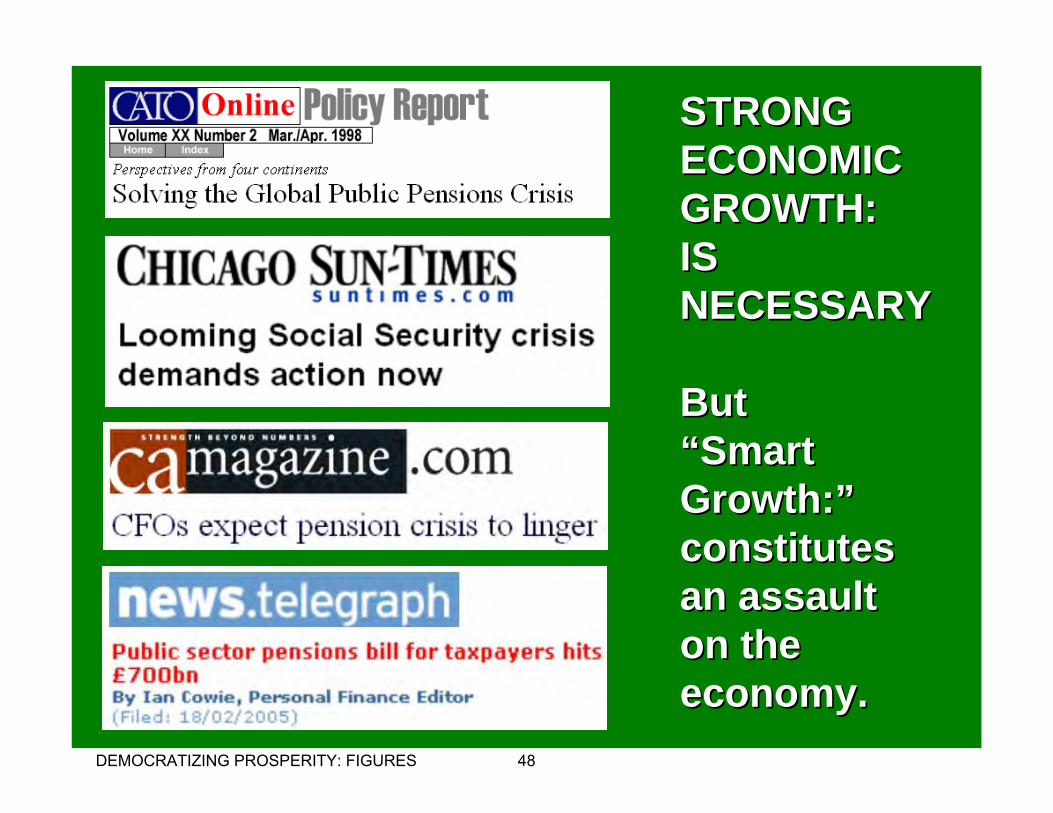
STRONGSTRONGECONOMIC ECONOMIC GROWTH:GROWTH:ISISNECESSARYNECESSARY
ButBut“Smart“SmartGrowth:” Growth:” constitutes constitutes an assaultan assaulton theon theeconomy.economy.
DEMOCRATIZING PROSPERITY: FIGURES 48

Urban Areas: Pre-Auto & Now
0
10,000
20,000
30,000
40,000
50,000
Pre-Auto Japan W. Europe Australia Canada US
1900 Now
WHY?WHY?
TheirTheir“Vision”“Vision”doesn’tdoesn’tadd upadd up
AutoAuto--basedbasedsprawlsprawlis hereis hereto stay to stay
UrbanPopulation
Denstiy
DEMOCRATIZING PROSPERITY: FIGURES 49

Tourist (&Planner’s)
Map of Paris
Paris AtlasWhere People Live
and Work
DEMOCRATIZING PROSPERITY: FIGURES 50
WHY?WHY?
Their “imperatives”Their “imperatives”don’t standdon’t stand--upupto scrutiny.to scrutiny.
There is noThere is nojustification for justification for the destructivethe destructivestrategies ofstrategies of“Smart Growth”“Smart Growth”
97.4%2.6%
Urbanized Land in the United States
50
75
100
125
150
175
200
225
250
1960 1970 1980 1990 2000
Obesity
UrbanDensity
Obesity & Land Use?
Food Consumption UpLand Use Little Changed
DEMOCRATIZING PROSPERITY: FIGURES 51
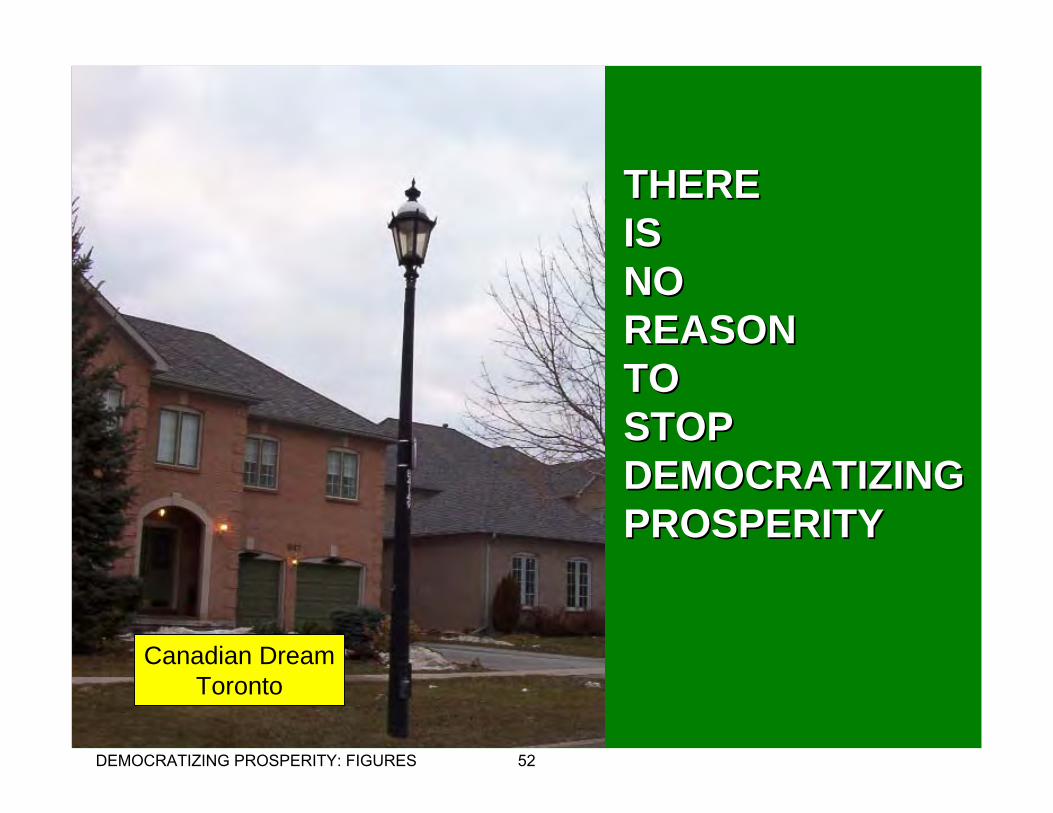
Canadian DreamToronto
THERETHEREISISNO NO REASONREASONTOTOSTOPSTOPDEMOCRATIZINGDEMOCRATIZINGPROSPERITYPROSPERITY
DEMOCRATIZING PROSPERITY: FIGURES 52
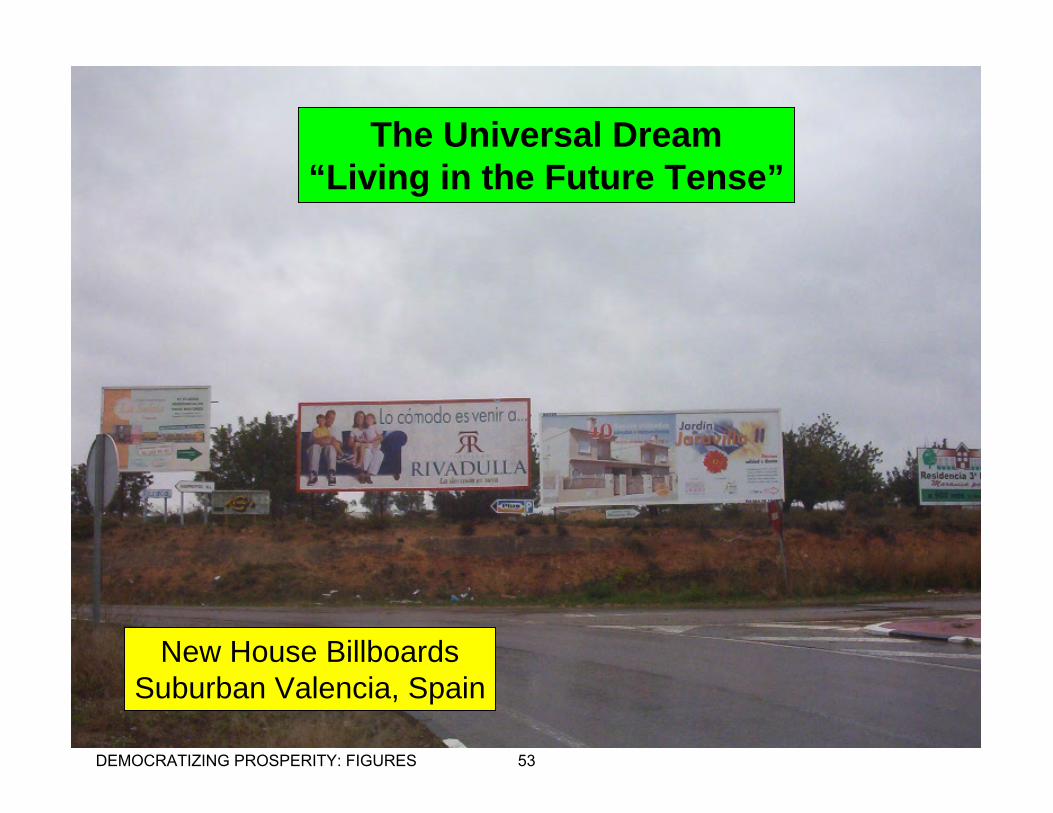
New House BillboardsSuburban Valencia, Spain
The Universal Dream“Living in the Future Tense”
DEMOCRATIZING PROSPERITY: FIGURES 53
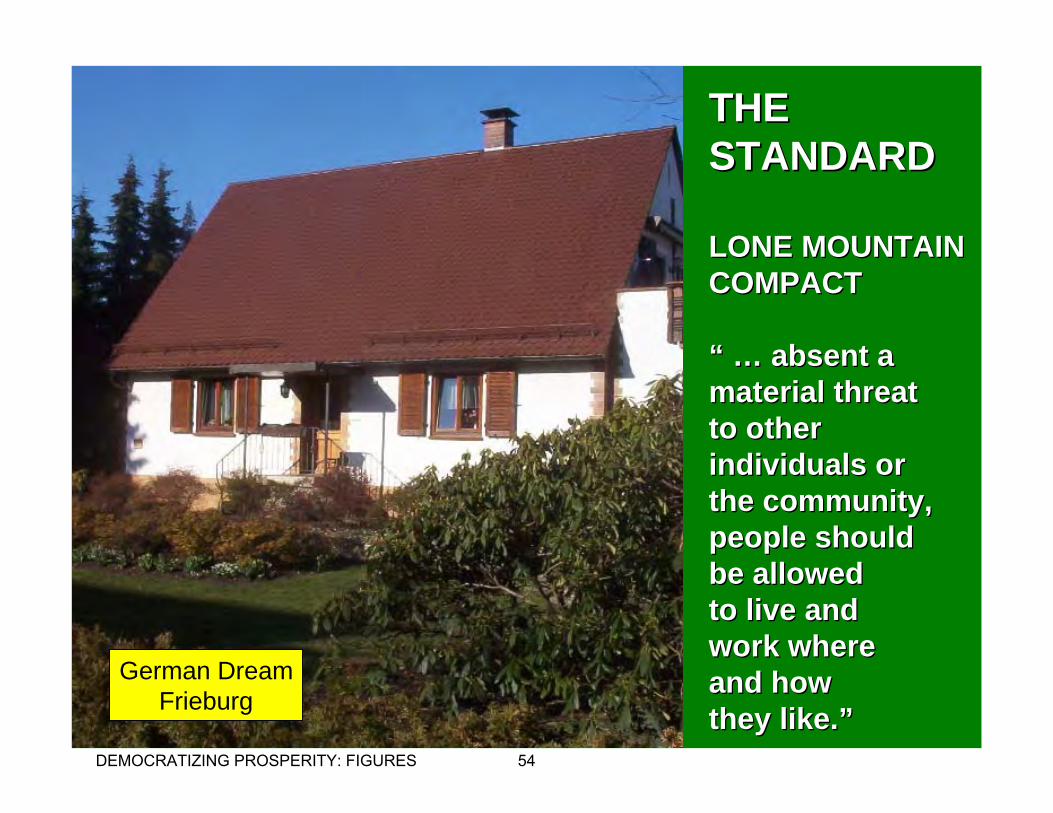
THE THE STANDARDSTANDARD
LONE MOUNTAINLONE MOUNTAINCOMPACTCOMPACT
“ … absent a “ … absent a material threatmaterial threatto otherto otherindividuals orindividuals orthe community, the community, people shouldpeople shouldbe allowedbe allowedto live andto live andwork wherework whereand how and how they like.”they like.”
German DreamFrieburg
DEMOCRATIZING PROSPERITY: FIGURES 54
BACK TOBACK TOBASICSBASICS
THE ROLE OFTHE ROLE OFPLANNING:PLANNING:
Not Not telling telling peoplepeoplehow to live…how to live…
Rather,Rather,helping helping people livepeople liveas theyas theypreferpreferParis Suburbs
People’sRoute
Planner’sRoute
DEMOCRATIZING PROSPERITY: FIGURES 55