Embed Size (px)
Citation preview
Democracy and Light:Electoral Accountability and the Provision of Public Goods
Brian Min†
Department of Political ScienceUniversity of California, Los Angeles
This Version: April 28, 2008
PLEASE DO NOT CITECOMMENTS WELCOME
Abstract
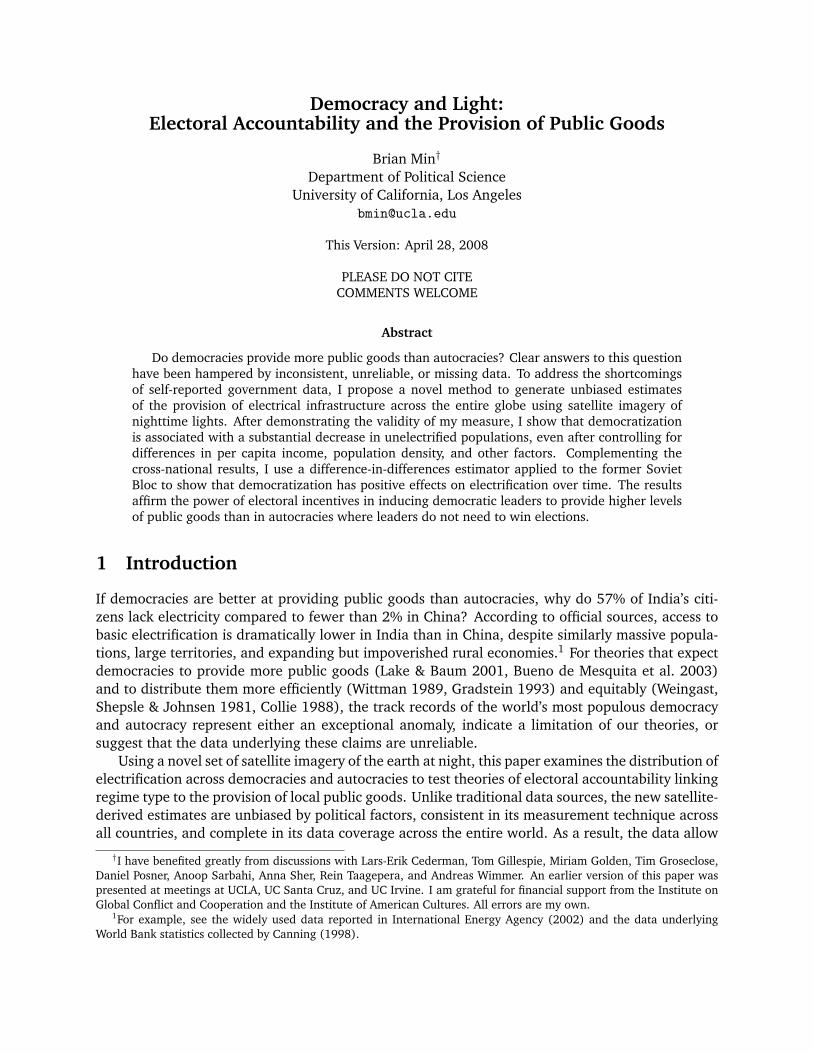
Do democracies provide more public goods than autocracies? Clear answers to this questionhave been hampered by inconsistent, unreliable, or missing data. To address the shortcomingsof self-reported government data, I propose a novel method to generate unbiased estimatesof the provision of electrical infrastructure across the entire globe using satellite imagery ofnighttime lights. After demonstrating the validity of my measure, I show that democratizationis associated with a substantial decrease in unelectrified populations, even after controlling fordifferences in per capita income, population density, and other factors. Complementing thecross-national results, I use a difference-in-differences estimator applied to the former SovietBloc to show that democratization has positive effects on electrification over time. The resultsaffirm the power of electoral incentives in inducing democratic leaders to provide higher levelsof public goods than in autocracies where leaders do not need to win elections.
1 Introduction
If democracies are better at providing public goods than autocracies, why do 57% of India’s citi-zens lack electricity compared to fewer than 2% in China? According to official sources, access tobasic electrification is dramatically lower in India than in China, despite similarly massive popula-tions, large territories, and expanding but impoverished rural economies.1 For theories that expectdemocracies to provide more public goods (Lake & Baum 2001, Bueno de Mesquita et al. 2003)and to distribute them more efficiently (Wittman 1989, Gradstein 1993) and equitably (Weingast,Shepsle & Johnsen 1981, Collie 1988), the track records of the world’s most populous democracyand autocracy represent either an exceptional anomaly, indicate a limitation of our theories, orsuggest that the data underlying these claims are unreliable.
Using a novel set of satellite imagery of the earth at night, this paper examines the distribution ofelectrification across democracies and autocracies to test theories of electoral accountability linkingregime type to the provision of local public goods. Unlike traditional data sources, the new satellite-derived estimates are unbiased by political factors, consistent in its measurement technique acrossall countries, and complete in its data coverage across the entire world. As a result, the data allow
†I have benefited greatly from discussions with Lars-Erik Cederman, Tom Gillespie, Miriam Golden, Tim Groseclose,Daniel Posner, Anoop Sarbahi, Anna Sher, Rein Taagepera, and Andreas Wimmer. An earlier version of this paper waspresented at meetings at UCLA, UC Santa Cruz, and UC Irvine. I am grateful for financial support from the Institute onGlobal Conflict and Cooperation and the Institute of American Cultures. All errors are my own.
1For example, see the widely used data reported in International Energy Agency (2002) and the data underlyingWorld Bank statistics collected by Canning (1998).
for a more credible analysis of how governments differ in the provision of a basic public servicethat 1.6 billion continue to lack (International Energy Agency 2002).
The new data reveal a large and significant positive effect of democracy on the provision ofelectrification that is unlikely to have been produced by chance or by differences in country wealth,demographics, natural resources, or geography. Complementing the cross-sectional results, I showthat democratization leads to increased electrification over time by exploiting a quasi-natural ex-periment of regime change in the former Soviet Bloc after the fall of Communism. These results areespecially surprising given that they cannot be replicated using “official” statistics on electrificationwhich rely on traditional data collection strategies including government self-reports.
The paper proceeds as follows. In the next section, I discuss theories of local public goodsprovision. After discussing the role of the state in providing electrification, I introduce the satellitedata and describe the method to estimate the level and distribution of electrification around theworld. Using regression analysis, I next present cross-national evidence showing that democracy isassociated with a significant and substantial decline in unelectrified populations and also presenta difference-in-differences estimation evaluating changes in electrification across the former SovietBloc. I end with some concluding observations.
2 Explaining the Provision of Local Public Goods
Basic infrastructure and public services are the building blocks of development. Places withoutelectrification, clean water, public health, and education are unlikely to escape from poverty orfoster high quality of life. Yet even given their high social and economic value, basic infrastructureand public services are difficult to supply. Theories of collective action show that when the benefitsof basic services are broad, the incentive for individuals to contribute to their costs are low. Asgroup size increases, the costs of provision scale up just as the incentives to contribute scale down.Free-riding problems undermine the incentive for voluntary collective action and infrastructure andbasic public services go underprovided.
Governments are unique in their ability to raise revenues and coordinate expenditures, andthus the central role they play in the provision of public services is widely acknowledged. Yetthere is no consensus on what kinds of governments provide basic infrastructure and services mosteffectively. Institutional theories emphasize the role of political institutions in creating differentincentives for democratic and autocratic leaders to provide public goods and services. Democraticleaders are expected to differ in their behavior in office because they are held accountable by votersfor their performance. Lipset (1959, p. 71) defines democracy “as a political system which suppliesregular constitutional opportunities for changing the governing officials, and a social mechanismwhich permits the largest possible part of the population to influence major decisions by choosingamong contenders for political office.” Elections provide voters with the power to replace theirleaders when they do not serve the best interests of the public. Similarly, Schmitter & Karl (1991,p. 76) argue that “modern political democracy is a system of governance in which rulers are heldaccountable for their actions in the public realm by citizens.”
Given the mechanism of electoral accountability that is embedded in democracy, it is naturalto assume that democratic leaders should be more responsive to the needs of its citizenry thandictators who do not face competitive elections. To stay in office, democratic politicians mustconvince their constituents that they are better able to serve their needs than any other challenger.Because democratic politicians are likely to be evaluated on their ability to provide basic benefits,democratic leaders should provide higher levels of local public goods than dictators (Lake & Baum2001). Elections also invite a larger portion of the citizenry to participate in the selection of their
2
leaders than in non-electoral environments. As Gandhi & Przeworski (2006, p. 2) state “dictatorsare dictators because they cannot win elections.” Thus, democratic leaders must secure a muchbroader base of political support than autocrats. When the size of the minimum winning coalitionis large, Bueno de Mesquita et al. (2003) argue that provision of public goods is more cost effectivethan private transfers to win support. A similar theme is echoed by Acemoglu & Robinson (2006,p. 18) who state: “We argue that democracy, which is generally a situation of political equality,looks after the interests of the majority more than nondemocracy, which is generally dominated byan elite and is more likely to look after its interests. Stated simply and extremely, nondemocracyis generally a regime for the elite and the privileged; comparatively, democracy is a regime morebeneficial to the majority of the populace, resulting in policies relatively more favorable to themajority.” Given the institutional incentives of democracy, elected leaders are more likely to investin the provision of broad-reaching classes of public goods and services than dictators.
Yet despite this clear theoretical expectation, competitive elections alone might fail to inducepoliticians to provide an efficient level of public goods provision. The relatively short time horizonsfaced by elected leaders might decrease the incentive for longer term investments in capital projectsand other services that take years to build. Touting the success of Singapore’s state-planned econ-omy, Lee Kuan Yew describes, “Our job was to plan the broad economic objectives and the targetperiods within which to achieve them. Infrastructure and the training and education of workers tomeet the needs of employers had to be planned years in advance” (Lee 2000, p. 66). Meanwhile,the logic of majority rule might lead to the persistent deprivation of peripheral minority groupswho never enjoy the spoils of office (Guinier 1994). And a bevy of country studies have observedmany pathologies in otherwise democratic settings. In her study of the power of political machinesin Argentina, Stokes (2005) suggests that when democratic leaders have the ability to monitor con-stituents votes, a “perverse” accountability takes over, and rather than practicing oversight, citizensuse their vote to seek out rewards and avoid punishment. Clientelistic and patrimonial practicesare said to undermine the supposed virtues of electoral accountability across the developing world(see e.g., Bratton & van de Walle 1994, Chandra 2004) as well as in the industrialized world (seee.g., Scheiner 2006).
While democracies are expected to produce more local public goods, there is less consensus onwhether democracies distribute them any differently than autocracies. According to some, the po-litical competition associated with democracy should yield efficient and equitable policy outcomes(Wittman 1989, Gradstein 1993). Median voter theory suggests that if the median voter has lessincome than the average voter, governments will be larger with more social expenditures bene-fiting the poor (Meltzer & Richard 1981). Given that the income distribution is typically skewedtowards the high end of the spectrum in most countries, democracy should thus benefit the poor.Lindert (2004) finds strong historical evidence that democracy leads to an increase in redistribu-tive spending. Many note that democracies seem to work harder to meet the needs of historicallydisadvantaged groups (Pande 2003).
Explicit models of legislative behavior pivot around whether lawmakers cooperate or not indeciding distributional allocations. Non-cooperative models assume that public good distributionsare decided by minimum winning coalitions in legislatures. Since the votes of those outside thecoalition are not necessary to maintain power, only those within the power-holding alliance willhave a say in determining public spending. Implicitly, legislative districts outside of the minimumwinning coalition are unlikely to receive the same level of public spending as districts within thecoalition. This logic is a central feature to many models of vote buying and coalition formation(Austen-Smith & Banks 1988, Baron & Ferejohn 1989). On the other hand, a cooperative legislativenorm is likely to induce much broader distributions of public goods. Inspired by observations
3
of legislative log-rolling in the U.S. Congress, Weingast, Shepsle & Johnsen (1981) propose thatresource allocation will obey a norm of universalism in which each district gets what they want solong as all other districts do as well. Larger legislative coalitions may also be likely because theyare cheaper to maintain (Groseclose & Snyder 1996) and because of strategic interaction betweenpoliticians and voters (Besley & Coate 2003).
Empirical support for the distributional benefits of democracy has been mixed. Many cross-national studies do not find systematic evidence that the higher levels of social expenditures madeby democracies actually reach the poorest or most vulnerable segments of society (Keefer 2005,Ross 2006). Keefer & Khemani (2005, p. 2) observe that “policymakers in poor democraciesregularly divert spending away from areas that most benefit the poor or fail to implement policiesthat improve the services that are known to disproportionately benefit poor people.” A recentevaluation of 120 World Bank rural electrification projects reports that “the larger share of benefitsfrom rural electrification is captured by the non-poor” (World Bank 2008, p. xv). Some argue thatrepresentative democracies are vulnerable to several types of “political failures” and are unlikely toproduce economically efficient distributions (Besley & Coate 1998).
A separate literature emphasizes the ability of some citizen groups to overcome collective actionproblems because of shared preferences or the presence of social norms that punish defectors andfree-riders. These arguments suggest that groups can overcome coordination problems where socialcapital is high, perhaps by the presence of civil society groups (Boix & Posner 1998, Tsai 2007) orbecause of shared kinship networks (Bates 1974). In this context, places where a voting bloc cancredibly communicate their policy preferences are more likely to receive the local public goods theywant. Empirical research has linked higher ethnic diversity to lower public goods provision at boththe cross-national (Easterly & Levine 1997, Posner 2004, Montalvo & Reynal-Querol 2005) andsub-national levels (Alesina, Baqir & Easterly 1999, Wantchekon 2003, Besley et al. 2004, Miguel2004, Banerjee, Somanathan & Iyer 2005).
Yet both the institutional and social capital theories explain only a portion of the variance inthe distribution of public goods in the developing world: greater variation exists on the dependentvariable than in electoral institutions; and the mechanisms by which ethnic diversity affect publicgoods provision are not well understood (Habyarimana et al. 2007). The result is that the provisionof public goods remains poorly understood in the developing world, even though politics plays adominant role in the distribution of public infrastructure in rural lands.
Drawing on new detailed data on the provision of electrification, this paper seeks to identifyand measure differences in the provision of a critical local public good across democracies anddictatorships. While many scholars have evaluated the differences in electoral rules across democ-racies, these differences are likely to be small compared to the expected variation across regimetypes, which I focus on here.2
If governments are accountable to voters in democracies, than all else equal, politicians whoincrease voter welfare by providing more public goods should fare better in elections than thosethat do not. This accountability mechanism suggests a long-term positive effect of democracy,since incumbents who fail to act in the best interests of voters are likely to be replaced. Thecentral hypothesis evaluated here is that over the long-term, countries under democratic rule wherepolitical leaders are regularly evaluated at the polling booth should have more citizens enjoying thebenefits of basic public services and goods than those living in autocracies.
2For studies of within-democracy differences, see Persson & Tabellini (2000), Lizzeri & Persico (2001), Milesi-Ferretti,Perotti & Rostagno (2002), and Persson & Tabellini (2003); for differences across autocracies, see Gandhi & Przeworski(2006)).
4
3 Electrification and the State
Electricity and lighting is ubiquitous across the industrialized world. But more than a century afterthe introduction of electric power transmission, at least a quarter of the world’s population still livewithout electricity and rely instead on kerosene, wood, and agricultural residues to meet their en-ergy needs (International Energy Agency 2002). More than simply a modern convenience, accessto electricity is a life-altering transformation that improves quality of life and enables economicdevelopment. Electric light extends a day’s productive hours, allowing children to study after thesun has set and enhancing the safety of women at night. Refrigeration allows for the preservationof food and medicines. Powered water pumps reduce the effort needed to collect clean water. Elec-trical cooking stoves reduces the amount of time needed to gather wood and other biomass fuels.3
Electrical power enables the development of industries and creates new jobs. For communities,electrification improves safety at night via streetlights, enables irrigation and drainage systems toimprove agricultural productivity, and encourages entrepreneurship.
No country has ever completed rural electrification without the intensive financial support ofits government (Barnes & Floor 1996, p. 519). At the founding of the Soviet Union in the 1920s,Vladimir Lenin famously placed electricity at the center of his vision of the future: “Communismis Soviet power plus the electrification of the whole country.” His State Commission for Electrifi-cation of Russia (GOELRO) sought to extend the power grid to the entire country and formed thebasis of the first Soviet plan for national economic recovery. The plan reflected Lenin’s belief ina reorganized industry based “. . . on electrification which will put an end to the division betweentown and country and . . . overcome, even in the most remote corners of land, backwardness,ignorance, poverty, disease, and barbarism.” Implementation of GOELRO led to a near doublingof the country’s total national power output by 1931 (Kromm 1970) and full electrification of theentire Soviet Union in the years that followed. Meanwhile, in Germany, Holland, and Scandinavia,the electrification of every home was seen as a desirable political goal and 90% of homes wereelectrified by 1930 (Nye 1992, p. 140).
In the U.S., however, electric power distribution had been dominated by private utilities whofocused their business in urban centers. Extending the power grid from cities to rural areas requireshigh fixed cost investments in infrastructure including new power plants, long haul transmissionlines, substations, and shorter distribution lines to the end user. Rural areas with low customerdensities were unattractive markets to profit-minded firms. By the time of the Great Depression,only one in ten rural Americans had access to electricity compared to 90% of city dwellers. Withthe collapse of the economy, even private power utilities in the most lucrative urban markets werestruggling to stay solvent. Farmers seemed destined to stay in the dark had it not been for FranklinRoosevelt’s celebrated establishment of the Tennessee Valley Authority (TVA) in 1933 and RuralElectrification Administration (REA) in 1935. At the end of 1934, only 12.1% of all U.S. farms hadelectricity, while only 3% were electrified in Tennessee and less than 1% in Mississippi. By 1943,the TVA and REA had brought electricity to four out of ten American farms (see Figure 1). Withinone more decade, nine out of ten were connected (U.S. Census Bureau 1975, p. 827). Former U.S.Secretary of Agriculture Bob Bergland recalled, “The day the lights finally came on at our farm, Iremember my mother cried.” Another farmer reminisced, “I remember singing with robust glee incelebration as our little strip of houses along a dirt road was connected to electricity. We sang outwith joy and no small amount of amazement: Oh the lights, the lights, Lottie Mae got light and wegot lights! Oh the lights, the lights.”4
3In rural Africa, many women carry 20 kilograms of fuelwood an average of 5 kilometers every day (InternationalEnergy Agency 2002, p. 367).
4Campbell, Dan, “When the lights came on,” http://www.rurdev.usda.gov/rbs/pub/aug00/light.htm
5
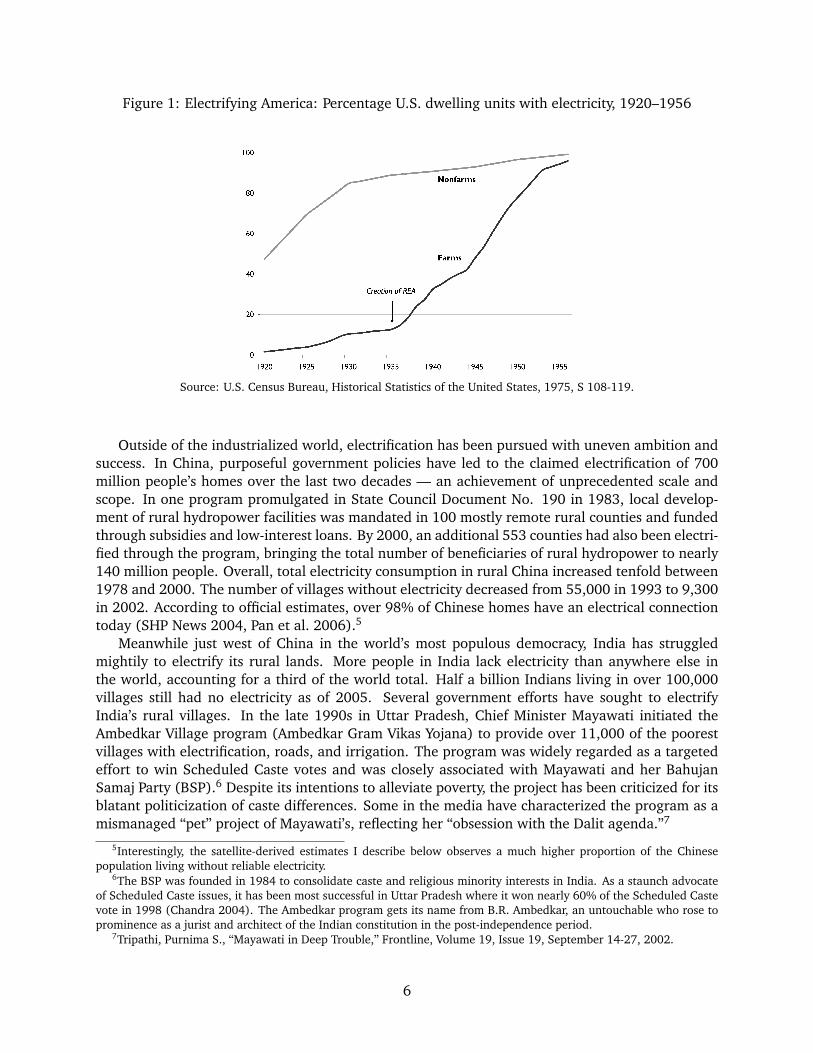
Figure 1: Electrifying America: Percentage U.S. dwelling units with electricity, 1920–1956
Source: U.S. Census Bureau, Historical Statistics of the United States, 1975, S 108-119.
Outside of the industrialized world, electrification has been pursued with uneven ambition andsuccess. In China, purposeful government policies have led to the claimed electrification of 700million people’s homes over the last two decades — an achievement of unprecedented scale andscope. In one program promulgated in State Council Document No. 190 in 1983, local develop-ment of rural hydropower facilities was mandated in 100 mostly remote rural counties and fundedthrough subsidies and low-interest loans. By 2000, an additional 553 counties had also been electri-fied through the program, bringing the total number of beneficiaries of rural hydropower to nearly140 million people. Overall, total electricity consumption in rural China increased tenfold between1978 and 2000. The number of villages without electricity decreased from 55,000 in 1993 to 9,300in 2002. According to official estimates, over 98% of Chinese homes have an electrical connectiontoday (SHP News 2004, Pan et al. 2006).5
Meanwhile just west of China in the world’s most populous democracy, India has struggledmightily to electrify its rural lands. More people in India lack electricity than anywhere else inthe world, accounting for a third of the world total. Half a billion Indians living in over 100,000villages still had no electricity as of 2005. Several government efforts have sought to electrifyIndia’s rural villages. In the late 1990s in Uttar Pradesh, Chief Minister Mayawati initiated theAmbedkar Village program (Ambedkar Gram Vikas Yojana) to provide over 11,000 of the poorestvillages with electrification, roads, and irrigation. The program was widely regarded as a targetedeffort to win Scheduled Caste votes and was closely associated with Mayawati and her BahujanSamaj Party (BSP).6 Despite its intentions to alleviate poverty, the project has been criticized for itsblatant politicization of caste differences. Some in the media have characterized the program as amismanaged “pet” project of Mayawati’s, reflecting her “obsession with the Dalit agenda.”7
5Interestingly, the satellite-derived estimates I describe below observes a much higher proportion of the Chinesepopulation living without reliable electricity.
6The BSP was founded in 1984 to consolidate caste and religious minority interests in India. As a staunch advocateof Scheduled Caste issues, it has been most successful in Uttar Pradesh where it won nearly 60% of the Scheduled Castevote in 1998 (Chandra 2004). The Ambedkar program gets its name from B.R. Ambedkar, an untouchable who rose toprominence as a jurist and architect of the Indian constitution in the post-independence period.
7Tripathi, Purnima S., “Mayawati in Deep Trouble,” Frontline, Volume 19, Issue 19, September 14-27, 2002.
6
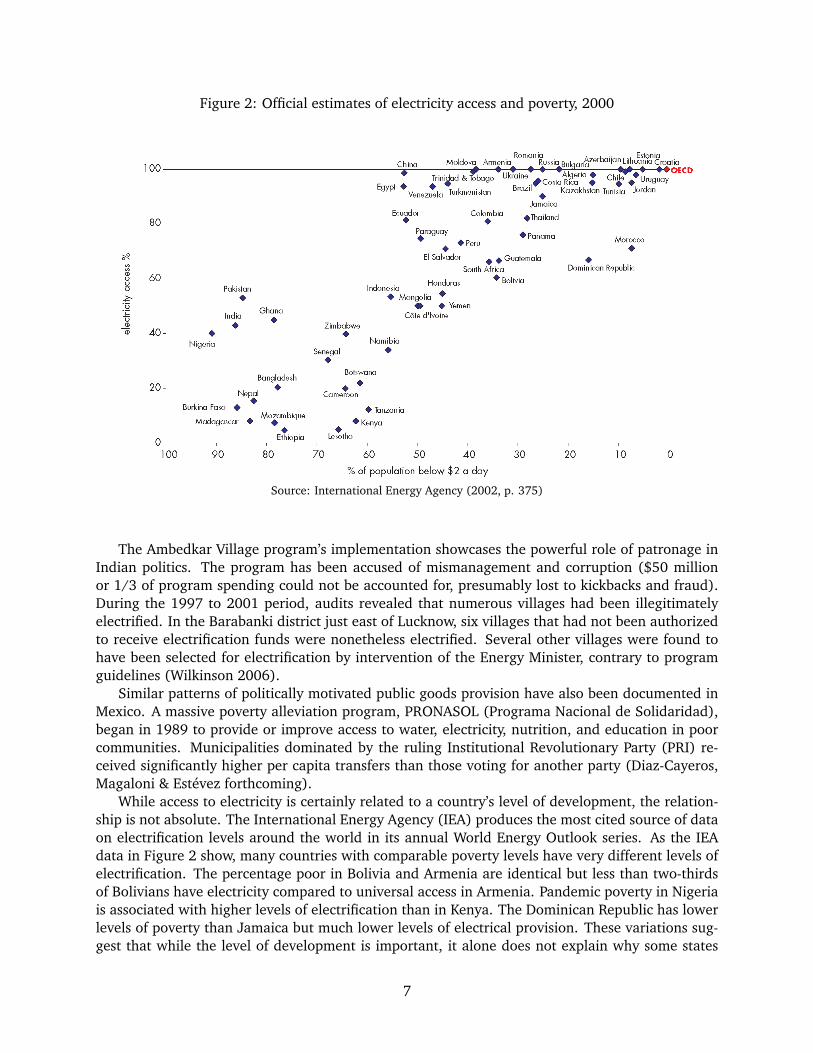
Figure 2: Official estimates of electricity access and poverty, 2000
Source: International Energy Agency (2002, p. 375)
The Ambedkar Village program’s implementation showcases the powerful role of patronage inIndian politics. The program has been accused of mismanagement and corruption ($50 millionor 1/3 of program spending could not be accounted for, presumably lost to kickbacks and fraud).During the 1997 to 2001 period, audits revealed that numerous villages had been illegitimatelyelectrified. In the Barabanki district just east of Lucknow, six villages that had not been authorizedto receive electrification funds were nonetheless electrified. Several other villages were found tohave been selected for electrification by intervention of the Energy Minister, contrary to programguidelines (Wilkinson 2006).
Similar patterns of politically motivated public goods provision have also been documented inMexico. A massive poverty alleviation program, PRONASOL (Programa Nacional de Solidaridad),began in 1989 to provide or improve access to water, electricity, nutrition, and education in poorcommunities. Municipalities dominated by the ruling Institutional Revolutionary Party (PRI) re-ceived significantly higher per capita transfers than those voting for another party (Diaz-Cayeros,Magaloni & Estevez forthcoming).
While access to electricity is certainly related to a country’s level of development, the relation-ship is not absolute. The International Energy Agency (IEA) produces the most cited source of dataon electrification levels around the world in its annual World Energy Outlook series. As the IEAdata in Figure 2 show, many countries with comparable poverty levels have very different levels ofelectrification. The percentage poor in Bolivia and Armenia are identical but less than two-thirdsof Bolivians have electricity compared to universal access in Armenia. Pandemic poverty in Nigeriais associated with higher levels of electrification than in Kenya. The Dominican Republic has lowerlevels of poverty than Jamaica but much lower levels of electrical provision. These variations sug-gest that while the level of development is important, it alone does not explain why some states
7
are better able to provide electrification than others.The IEA data also illustrates some of the potential weaknesses that affect many commonly
used datasets in cross-national analysis. Given the impossibility of manually collecting data usinga single consistent and coherent process across the world, IEA’s data are derived from dozens ofsources, including self-reported government data, NGO estimates, World Bank studies, and regionalorganization reports. Since no universal definition of electricity access exists, the comparability ofcountry-specific estimates is difficult to gauge. Official definitions of electrification can differ evenwithin the same country. For decades in India, a village was officially declared electrified if it hada single electrical connection used for any purpose. But in 2004, the official definition changed,requiring the presence of basic infrastructure, electrification of public buildings, and at least a 10%household electrification rate. As an artifact of this definitional change, official government reportsshow an improbable decline in India’s village electrification rates over the last decade. In additionto differences in methodology in data collection, the bureaucratic capacity to collect dependablestatistics varies by country. It is likely that the precision and reliability of electrification estimatesis lower in poorer countries, places overwhelmed by civil war, and closed regimes inaccessible tooutsiders. Finally, the IEA lists data for only 85 countries, resulting in missing data that is unlikelyto be random.
4 Measuring Electrification from Above
High levels of uncertainty pervade official estimates of the portion of the global population withoutaccess to electricity, a vital and basic public service that is typically provided by governments inmost of the rural world. I propose a new method to estimate the provision of electrification thatrelies on the analysis of satellite images of the earth at night to identify all lit and unlit populatedareas across the globe. Since 1970, the Defense Meteorological Satellite Program’s OperationalLinescan System (DMSP-OLS) has been flying in polar orbit capturing high resolution images of theentire earth each night between 20:00 and 21:30 local time. Captured at an altitude of 830 kmabove the earth, these images reveal concentrations of outdoor lights, fires, and gas flares at a fineresolution of 0.56 km and a smoothed resolution of 2.7 km.
Beginning in 1992, all DMSP-OLS images were digitized, facilitating their analysis and use bythe scientific community. While daily images are available, the primary data products used bymost scientists are a series of annual composite images. These are created by overlaying all imagescaptured during a calendar year, dropping images where lights are shrouded by cloud cover oroverpowered by the aurora or solar glare (near the poles), and removing ephemeral lights like firesand other noise.8 The result is a series of images of time stable night lights covering the globefor each year from 1992 to 2006 (Elvidge et al. 1997a, Imhoff et al. 1997, Elvidge et al. 2001).Since the DMSP program may have more than one satellite in orbit at a time, some years havetwo annual images created from composites from each satellite, resulting in a total availability of23 annual composite annual images. Images are scaled onto a geo-referenced 30 arc-second grid(approximately 1 km2). Each pixel is encoded with a measure of its annual average brightness on a6-bit scale from 0 to 63. These are relative values and thus individual pixel values are not directlycomparable from one year to the next. This does not affect the analysis of variation within a singleannual composite image as I present here.
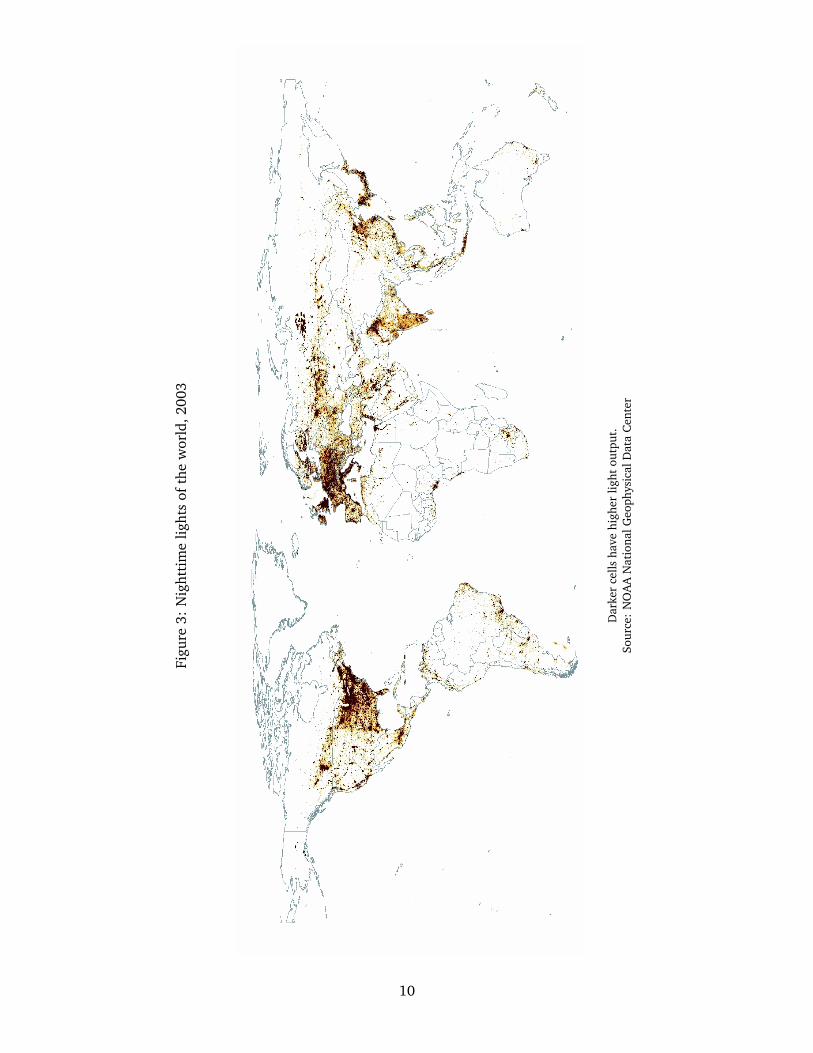
Figure 3 shows a reverse-color DMSP-OLS image of night-time lights in 2003 with darker dotsindicating more brightly lit areas and white areas on the page indicating darkness. The image
8The geographic extent of usable DMSP data is -65 to +65 latitude. This results in missing data for portions of theworld within the Arctic and Antarctic circles (home to only 0.0005% of the global population).
8
reveals large variation in light intensity around the world, with especially broad and brightly litareas across the eastern U.S., western Europe, India, and east Asia. Meanwhile, inhospitable envi-ronments in the frozen Arctic deserts of Canada, Alaska, and Siberia and the hot deserts of Africa,China, and Australia are cloaked in darkness. At first glance, the distribution of lights might appearto be a reflection of population distributions. But closer examination reveals that there are impor-tant differences across the world and within countries. For example, much of Africa is dark, eventhough it is home to 15% of the world’s population. While more than one in three people in theworld live in India and China, their light output accounts for only a tenth of the global total.
A country’s level of industrialization explains a large portion of the global variation. SouthAfrica has a similar population density but larger economy than neighboring Zimbabwe and a cor-respondingly higher light output. The difference across the 38th parallel on the Korean peninsulais particularly striking, revealing the impact of political institutions and economic development ina region with identical cultures and similar geography.
Numerous studies have validated the DMSP-OLS night lights images against measures of electricpower consumption and gross domestic product (Elvidge et al. 1997b). More recently, scientists areusing these data to model urbanization (Lo 2001, Small et al. 2005, Amaral et al. 2006) and theenvironmental impacts of fires and natural disasters (Fuller 2000, Kohiyama et al. 2004). The greatvirtue of these data for social science research is that they are unbiased, consistent, and complete.
Three technical limitations complicate the use of nighttime lights to estimate the extent andintensity of use of electrical infrastructure: saturation, blooming and low sensitivity. Saturationoccurs because of the limited dynamic range of the satellite sensor. To accurately detect dimlylit areas, the sensors are calibrated with high gain on the photomultiplier tube. This results insmall areas of saturation (i.e. cells with encoded brightness values of 63) in the centers of largecities and other brightly lit zones. This does not affect the analysis here since we are interestedprimarily on unlit cells. Blooming occurs when lights from an area appear to spill into neighboringareas resulting in an overglow. Blooming increases in the presence of nearby water sources andother sources that reflect nearby light into space. This means that nighttime light images tend tooverestimate the extent of light coverage, especially around large cities and coastal settlements.Fortunately, this results only in a downward bias in the estimate of unlit populations; in addition,the effects of blooming are unlikely to be correlated at the country level with the political variables Iam most interested in. The limited sensitivity of the DMSP sensors mean that not all dimly lit regionsare detectable in satellite images. In theory, the DMSP sensors are capable of detecting radiances aslow as 10−9watts/cm2/sr/µm, and field checks have revealed that lights from U.S. towns as smallas 120 people are detectable (Elvidge et al. 2001). However, even sparse cloud cover and minoratmospheric disturbances can cloak the lights from a small settlement. Moreover, because DMSPannual composite images are produced through image processing algorithms designed to removeephemeral light sources like lightning and fires, it is possible that some of the most dimly lit (orirregularly lit) areas also get blacked out. The result is that the annual composite DMSP imagesdo not unambiguously detect the electrification of small settlements. More research is requiredto understand the limits of light detection at the low end of the sensitivity spectrum. As a result,I propose a conservative strategy below which only identifies an area as unlit if the underlyingpopulation count exceeds a certain minimum threshold.
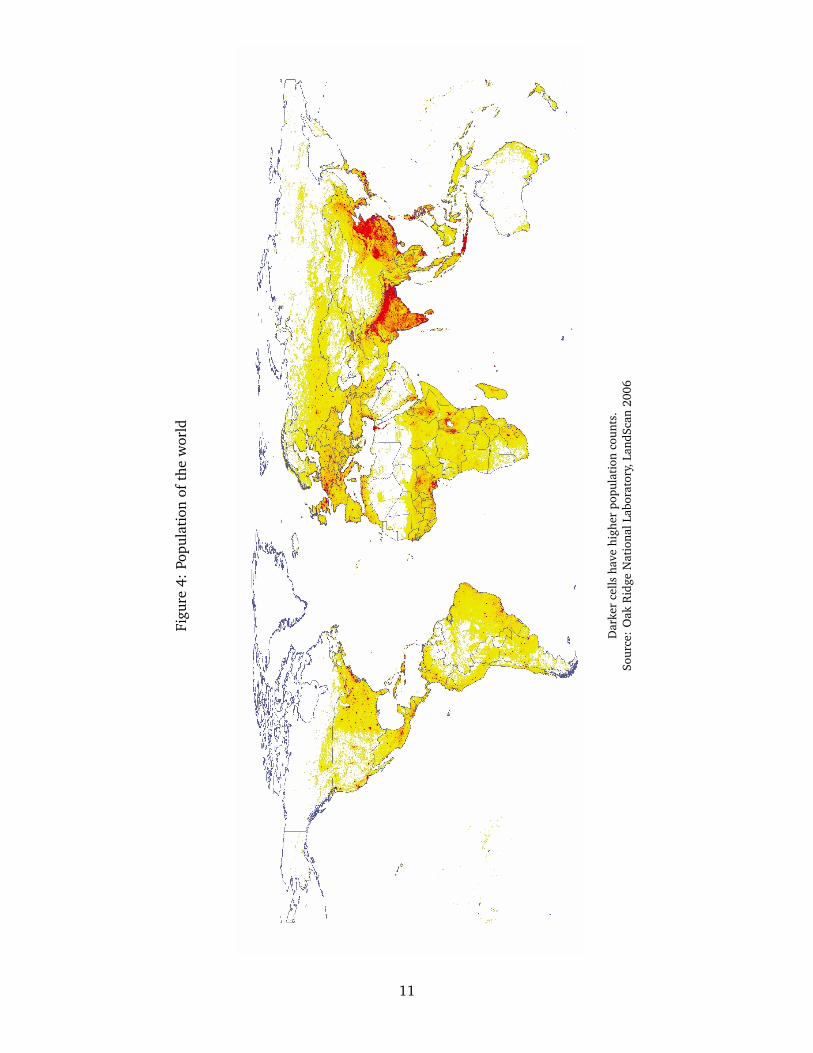
To identify populated regions, I draw on the LandScan 2006 population count map producedby the Oak Ridge National Laboratory (see Figure 4). This is the highest resolution populationmap currently available. Drawing on sub-national census data, population counts are apportionedonto a 30 arc-second grid using country-specific likelihood coefficients based on proximity to roads,
9
Figu
re3:
Nig
htti
me
light
sof
the
wor
ld,2
003
Dar
ker
cells
have
high
erlig
htou
tput
.So
urce
:N
OA
AN
atio
nalG
eoph
ysic
alD
ata
Cen
ter
10
Figu
re4:
Popu
lati
onof
the
wor
ld
Dar
ker
cells
have
high
erpo
pula
tion
coun
ts.
Sour
ce:
Oak
Rid
geN
atio
nalL
abor
ator
y,La
ndSc
an20
06
11
slope, land cover, and other information.9 The LandScan population maps have been thoroughlyvetted and are widely used by the United Nations, World Health Organization, and Food and Agri-cultural Organization. LandScan 2006 uses satellite-based inputs to create their map including highresolution daytime imagery and land cover databases. It does not use night lights images, resultingin a data source that is fully independent of the DMSP-OLS night lights data.
A direct comparison of the raw LandScan and DMSP-OLS images reveals a very large numberof populated cells with no light output. This is because even electrified areas might not generate asufficient concentration of outdoor light if the population density is very low. Thus a direct compar-ison of these data sources does not yield a reliable estimate of unelectrified populations. To derivea more reliable estimate of unlit populations, we need to identify only those areas where we canreliably infer that lighting would be detectable if it were present. The approach used here matchesthe most dimly lit cells against unlit cells with similar population and economic characteristics. Anunlit cell with the same population and economic characteristics as a dimly lit cell is inferred tobe unelectrified. Practically speaking, I identify the median population count in the most dimlylit cells, and do this separately for each country of the world to allow for differences in economicand other fixed factors. I then sum the population in all unlit cells of a country whose populationexceeds the country-specific threshold. Details are described in Appendix B.
To illustrate, I describe the method as applied to India. India is home to 1.1 billion people,making it the second most populous country in the world and the largest democracy. The DMSPsatellite image of India for 2003 is composed of 4 million cells with a mean light output of 2.2(4.9 excluding unlit cells) on the 0–63 scale. The median population count of the most dimly litcells is 58, providing observational evidence that in India, outdoor lighting technology is detectablefrom space for cells with at least 58 people. Of the over 2 million unlit cells in which no light isdetectable by satellite, about 690,000 have a population of at least 58. Summing the populationcounts across these unlit cells with at least 58 people yields a total estimate of about 275 millionIndians living in unlit areas.10
The distribution of unlit populations in India is plotted in Figure 5, with each dot indicating anunlit settlement and darker dots indicating higher population counts. The highest concentration ofunlit populations are clearly visible on the northeast rim just south of Nepal. This area includes twoof India’s poorest states, Uttar Pradesh and Bihar. Note that even in these impoverished regions,urban cores are white, including the state capitals Lucknow and Patna, indicating the prevalenceof electrical infrastructure in urban areas. In comparison, Kerala and Tamil Nadu on the southerntip of the Indian peninsula, have only a scattering of unelectrified communities. Indeed, India’sMinistry of Power estimates that 42% of villages in Uttar Pradesh and 51% of Bihar lacked electricityin 2005. Meanwhile, the estimated rates for Kerala and Tamil Nadu were 3% and 0% respectively.In comparison, my satellite-derived method estimates that 37% of people in Uttar Pradesh live inunlit areas, 64% in Bihar, 3% in Kerala and 1% in Tamil Nadu.
Applying the method described above, I estimate that 1.4 billion people, or 22% of the globalpopulation, live in unlit areas of the world in 2003. Regional breakdowns are presented in Table1 (see Appendix B for country estimates). This global estimate compares reasonably well with the
9LandScan was conceived as an effort to estimate the ambient or average population distribution over a 24-hourperiod. This differs from traditional population density estimates which measure residential settlement patterns, typicallyundercounting the presence of people in commercial centers and airports, for example. In practice, the “differencebetween ambient and resident population is not significant as the results are quite coarse in all available populationdensity maps” (Salvatore et al. 2005, p. 16).
10In comparison, International Energy Agency (2006) estimates 440 million unelectrified homes in India, many ofwhich are in electrified villages and towns. The population living in unelectrified villages, which my measure mostclosely resembles, has not been reported.
12
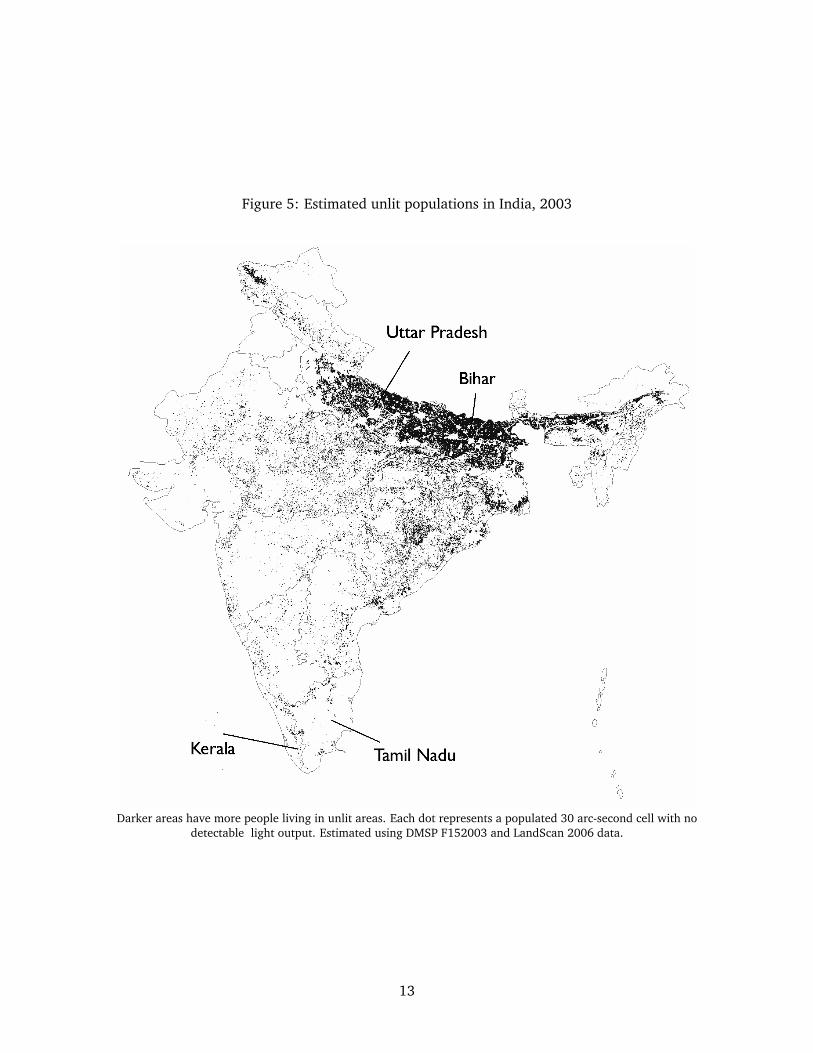
Figure 5: Estimated unlit populations in India, 2003
Darker areas have more people living in unlit areas. Each dot represents a populated 30 arc-second cell with nodetectable light output. Estimated using DMSP F152003 and LandScan 2006 data.
13
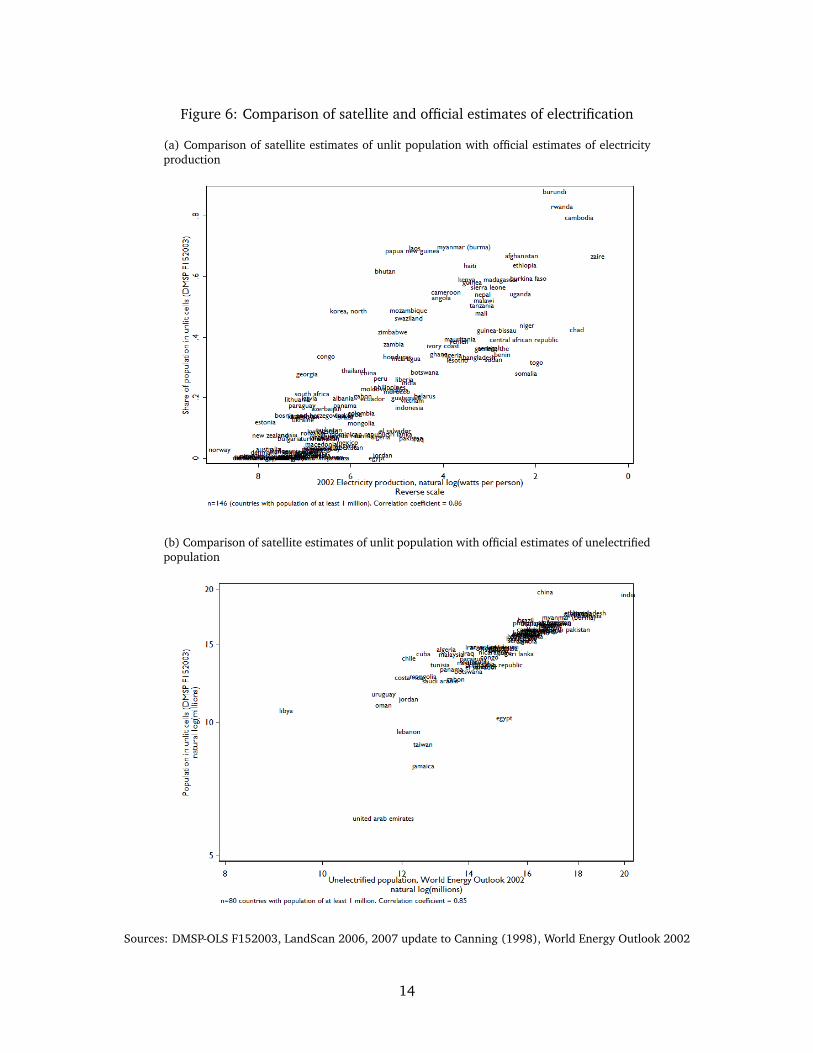
Figure 6: Comparison of satellite and official estimates of electrification
(a) Comparison of satellite estimates of unlit population with official estimates of electricityproduction
(b) Comparison of satellite estimates of unlit population with official estimates of unelectrifiedpopulation
Sources: DMSP-OLS F152003, LandScan 2006, 2007 update to Canning (1998), World Energy Outlook 2002
14
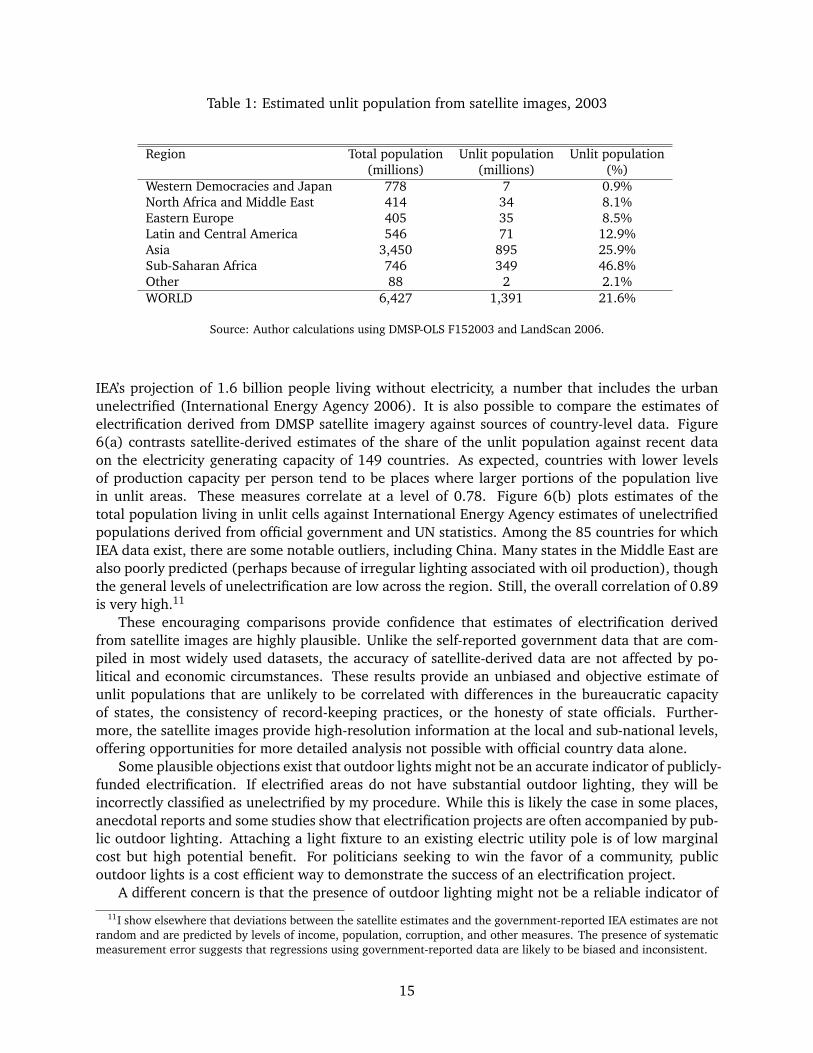
Table 1: Estimated unlit population from satellite images, 2003
Region Total population Unlit population Unlit population(millions) (millions) (%)
Western Democracies and Japan 778 7 0.9%North Africa and Middle East 414 34 8.1%Eastern Europe 405 35 8.5%Latin and Central America 546 71 12.9%Asia 3,450 895 25.9%Sub-Saharan Africa 746 349 46.8%Other 88 2 2.1%WORLD 6,427 1,391 21.6%
Source: Author calculations using DMSP-OLS F152003 and LandScan 2006.
IEA’s projection of 1.6 billion people living without electricity, a number that includes the urbanunelectrified (International Energy Agency 2006). It is also possible to compare the estimates ofelectrification derived from DMSP satellite imagery against sources of country-level data. Figure6(a) contrasts satellite-derived estimates of the share of the unlit population against recent dataon the electricity generating capacity of 149 countries. As expected, countries with lower levelsof production capacity per person tend to be places where larger portions of the population livein unlit areas. These measures correlate at a level of 0.78. Figure 6(b) plots estimates of thetotal population living in unlit cells against International Energy Agency estimates of unelectrifiedpopulations derived from official government and UN statistics. Among the 85 countries for whichIEA data exist, there are some notable outliers, including China. Many states in the Middle East arealso poorly predicted (perhaps because of irregular lighting associated with oil production), thoughthe general levels of unelectrification are low across the region. Still, the overall correlation of 0.89is very high.11
These encouraging comparisons provide confidence that estimates of electrification derivedfrom satellite images are highly plausible. Unlike the self-reported government data that are com-piled in most widely used datasets, the accuracy of satellite-derived data are not affected by po-litical and economic circumstances. These results provide an unbiased and objective estimate ofunlit populations that are unlikely to be correlated with differences in the bureaucratic capacityof states, the consistency of record-keeping practices, or the honesty of state officials. Further-more, the satellite images provide high-resolution information at the local and sub-national levels,offering opportunities for more detailed analysis not possible with official country data alone.
Some plausible objections exist that outdoor lights might not be an accurate indicator of publicly-funded electrification. If electrified areas do not have substantial outdoor lighting, they will beincorrectly classified as unelectrified by my procedure. While this is likely the case in some places,anecdotal reports and some studies show that electrification projects are often accompanied by pub-lic outdoor lighting. Attaching a light fixture to an existing electric utility pole is of low marginalcost but high potential benefit. For politicians seeking to win the favor of a community, publicoutdoor lights is a cost efficient way to demonstrate the success of an electrification project.
A different concern is that the presence of outdoor lighting might not be a reliable indicator of
11I show elsewhere that deviations between the satellite estimates and the government-reported IEA estimates are notrandom and are predicted by levels of income, population, corruption, and other measures. The presence of systematicmeasurement error suggests that regressions using government-reported data are likely to be biased and inconsistent.
15
government public goods provision if electricity is provided privately. In many parts of the develop-ing world unconnected to the electric grid or where service provision is unreliable, privately-owneddiesel and kerosene power generators provide electricity to those who can afford access. However,it is not likely that private generators are widely used to provide the kind of outdoor lighting de-tected by the DMSP sensor. Because outdoor lighting is expensive to provide but difficult to chargefor, most entrepreneurs are unlikely to shine lights outdoors and into space. It is more likely thatgenerators are used to power indoor lighting and other devices unlikely to be visible from space.
That said, neither of these two concerns are likely to lead to an incorrect inference about abeneficial effect of democratic institutions on electrification. Random measurement error on thedependent variable does not bias the slope coefficient but leads to larger standard errors, whichmakes it more difficult to find a statistically significant democracy effect. Systematic errors on thedependent variable will bias coefficient estimates towards zero when the errors are correlated withthe predictor variables, which makes it more difficult to identify a democracy effect. However, thereis no clear reason to believe that the concerns above should be systematically related to democracyor autocracy.
5 Democracy and Light
Most theories of public goods provision expect that democracies will provide higher levels of basicinfrastructure like electrification than autocracies. If these theories are correct, we should find thatmore citizens enjoy the benefits of electrification in democratic regimes, and that the positive bene-fits of democracy should compound over time as elected leaders continue to seek votes through theprovision of electrical infrastructure. Recent headlines highlight the political value of electrificationto voters. In Liberia, President Ellen Johnson Sirleaf campaigned on a platform to restore order andstability to the civil war-ravaged country, including a promise to restore electricity to Monrovia, itscapital city. Amidst celebratory crowds and cameras, President Sirleaf flipped a switch in July 2006,turning on streetlights that had been dark for 16 years since rebels knocked out Monrovia’s powergrid in 1990. When power outages swept across South Africa in late 2007, citizens directed theiroutrage towards their political leaders. The power crisis, considered the result of poor planningand government oversight, led the government to acknowledge that President Thabo Mbeki “hasaccepted that this government got its timing wrong” in what was called an extraordinary admissionof failure.12 The ongoing power crisis is likely to be a significant election issue for the AfricanNational Congress when Mbeki steps down in 2009.
If voters hold their politicians accountable for the provision of electrification, then democraticleaders should face higher incentives to provide electrification to their citizens than in autocracies.Using the satellite-based estimates of unlit populations described above, I evaluate the differencesin the provision and distribution of rural electrification between democracies and autocracies. Toassess the influence of democratic rule on rural electrification, I construct a measure of Democratichistory which calculates the number of years from 1946 until 2002 that a country has been underdemocratic rule. I use the dichotomous coding of democracy from Cheibub & Gandhi (2004).13
It is important to account for history since electrical infrastructure observed in 2003 is a stockmeasurement, accumulated through the flow of investments over years and decades. Lookingonly at the current level of democratization might yield incorrect inferences, since the extent ofelectrification in 2003 reflects the accumulation of a history of investment. That said, almost half
12New York Times, “Power Failures Outrage South Africa,” 31 January 2008, quoting Alec Erwin, South Africa’s Ministerof Energy and Public Enterprises.
13I also compare my results using alternative democracy measures constructed from Polity2 data. See Appendix A.
16
of the countries in my data do not change regime type at any point during the post-war period: 52countries have always been autocratic while 31 have stayed democratic.
Figure 7(a) shows electrification rates for 183 countries at all levels of democratic history (thesample size is limited only by the availability of regime-type data). Among sustained democracies,the provision of rural electrification is impressively uniform. In these 21 countries, only about2 out of every 100 people live in unlit areas, with India appearing as a notable outlier. Amongauthoritarian regimes, the variance in electrification rates is much wider. In Rwanda and Burundi,more than three-quarters of the population live in unlit areas compared to less than 1% in Egyptand Jordan. Some of these differences are likely to be linked to oil wealth, but variation persistseven among non-oil producing dictatorships.14
In the middle region of the figure lie almost half of the world’s countries that have experiencedsome democratic and some autocratic rule since 1946. The pattern here remains consistent withthe above: countries with a longer history of democratic rule have lower rates of unlit population.In addition, variation in electrification rates appears to decrease at all levels of democratic history.
Figure 7(b) shows the same scatter plot but using markers weighted by the population size ofeach country. Dominating the plot are the large markers associated with China and India. In starkcontrast with the official electrification estimates reported at the beginning of the paper, the shareof unlit populations are very similar for China and India using the satellite-based methodology.More research is required to investigate this discrepancy.
Partially obscured in both figures is the large number of countries that are effectively fullyelectrified: 43 countries have less than 1% of their population in unlit cells and 64 countries haveless than 5% unelectrified. Many of these countries are wealthy (e.g. Norway, Saudi Arabia),have small territories (e.g. Jamaica, Lebanon), or both (e.g. Kuwait, Israel). The majority aredemocracies though about a quarter are autocracies.
To what extent does this pattern simply reflect the well-known differences in development be-tween the (mostly) wealthy democratic west and the (mostly) autocratic developing world? Evencomparing countries at similar levels of development, differences in democratic history appear tomatter. Among the poorest half of the world’s countries, with incomes below $4,589 per capitain 2002 (approximately the median observed value), those with no history of democratic rule had39% of their populations in unlit areas compared with 34% for current democracies. A t-test showsthat the difference is statistically significant at the p=0.03 level.
Many scholars have asserted that the choice of governments matter little in the poorest states.Przeworski, Alvarez, Cheibub & Limongi (2000, p. 163) write, “Poor countries cannot afford astrong state, and when the state is weak, the kind of regime matters little for everyday life.” Butsatellite images of lit areas show otherwise. Among states with income levels in the bottom quartile— below $1,534 per capita — 44% of citizens living in democracies were in the dark compared to52% in autocracies. For the average country in this group, this translates into nearly two millionmore people living without light in autocracies versus democracies. The difference is significant atthe p=0.02 level.
These results suggest that even across different levels of development, more citizens enjoy elec-trification in democracies than in nondemocracies. Still, these highly suggestive results might becaused by other factors unrelated but correlated with democratic rule, like differences in geographyor demography. I explore these concerns using regression analysis in the following sections.
14Nighttime lights in oil producing countries is also likely to lead to an overestimate of the distribution of electrification:gas flares on oil wells and rigs generate high levels of outdoor light visible in the satellite images. Gas flaring is knownto be particularly pronounced in Nigeria, Russia, Iran, Algeria, Mexico, Venezuela, and Indonesia.
17
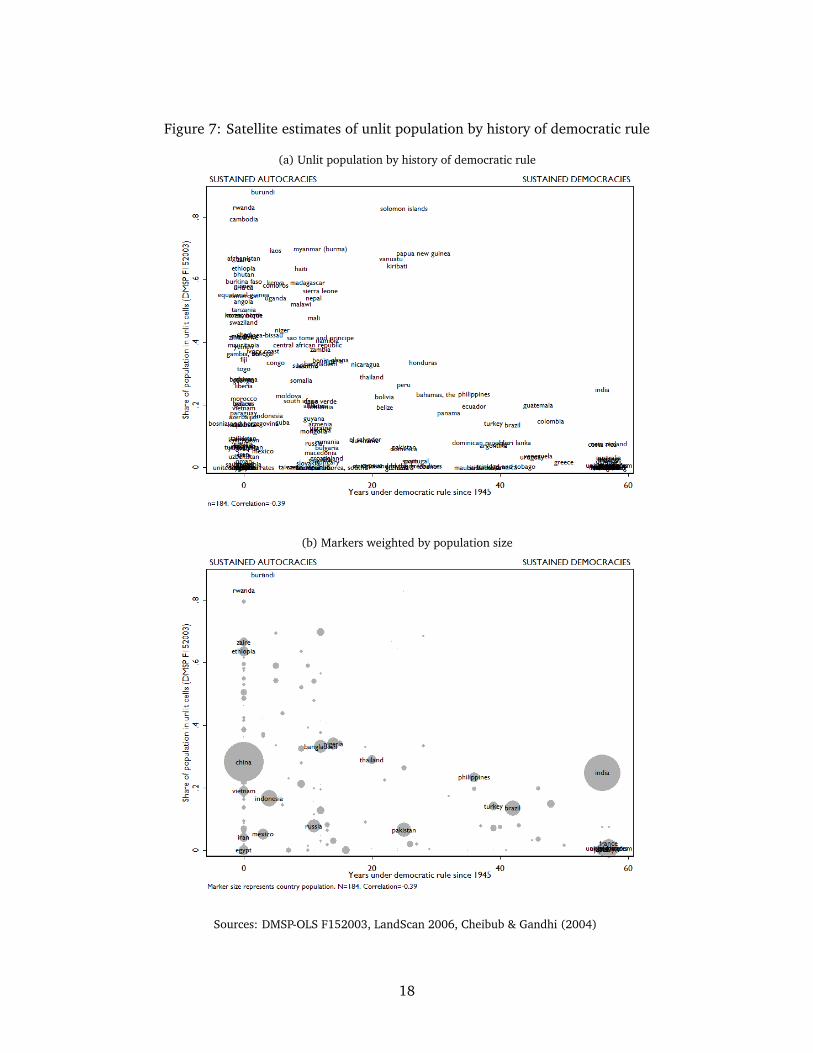
Figure 7: Satellite estimates of unlit population by history of democratic rule
(a) Unlit population by history of democratic rule
(b) Markers weighted by population size
Sources: DMSP-OLS F152003, LandScan 2006, Cheibub & Gandhi (2004)
18
5.1 Cross-national analysis of unlit populations
To evaluate the effects of democracy on the provision of electrification, I conduct cross-nationalregressions on the proportion of a country’s population living in unlit cells. Because my dependentvariable is a proportion bounded at 0 and 1, ordinary-least squares regression is not appropriatesince it will generate predicted values outside of this range. Instead, I use a fractional logit modelfollowing Papke & Wooldridge (1996) and Wooldridge (2002, p. 661). In the fractional logitmodel, the dependent variable, y is assumed to be a proportion generated by the logistic function,
E(y|x) = exp(xβ)/[1 + exp(xβ)] (1)
The β’s are easily estimated in standard packages like R and Stata by specifying a generalized linearmodel with a binomial distribution and logit link function. The partial effects of a change in anindependent variable in a fractional logit model are roughly comparable to the change based onthe coefficients of an OLS model.15
The dependent variable is the proportion of a country’s population living in unlit areas as of2003, derived from nighttime DMSP satellite images and population estimates from the LandScanproject. My key independent variable is a simple count of the number of years a country hasbeen under democratic rule between 1946 and 2002. Among non-political variables, the mostlikely determinants of electrification are a country’s level of industrialization and the distributionof its population. The level of industrialization is an indicator of a country’s ability to afford theprovision of electrification. Moreover, the more advanced an economy, the higher the demand forelectrical infrastructure. I estimate the level of industrialization using the natural log of a country’sGDP PER CAPITA in 2002. Data come from the Penn World Table 6.2 and are denominated inthousands of 2000 U.S. dollars. A country’s POPULATION DENSITY will also affect the feasibilityof electrification since sparsely populated countries must absorb higher per capita costs to electrifyremote areas. I use the natural log of the population density, which is in people per km2 andis computed from LandScan 2006 population numbers and World Development Indicators dataon surface area. To account for differences in urbanization across countries, I also control for acountry’s RURAL POPULATION, calculated as the percent of the population living in rural areas in2002 as defined by national governments and recorded in the World Development Indicators.
I include several other control variables. Violent civil wars and conflicts can quickly destroyinfrastructure that might have taken years to build. As a result, countries who have suffered froma higher NUMBER OF CIVIL ARMED CONFLICTS might have lower levels of electrification. Thisvariable, derived from the PRIO Armed Conflicts Dataset 3.0, counts the total number of inter-nal conflicts with at least 25 battle-related deaths from 1946–2002. Many scholars have found arelationship between ethnic diversity and public goods provision. I include a measure of ETHNO-LINGUISTIC FRACTIONALIZATION that comes from Fearon & Laitin (2003). The physical geogra-phy of a country might make it more difficult for a government to provide rural electrification. Forexample, the presence of rough and MOUNTAINOUS TERRAIN increases construction and main-tenance costs for electrical infrastructure. This measure also comes from Fearon & Laitin (2003).Geography may also affect the underlying demand for electricity. Places at a higher ABSOLUTE LAT-ITUDE will have more hours of darkness and colder temperatures. I use the latitude of a country’scapital city as coded by Gleditsch (2003).
Access to natural resources like oil might affect the incentives of governments to electrify theirrural populations, both by diverting state resources toward resource extraction activities and by
15An alternative is to use the log-odds transformation, log[y/(1 − y)], as the dependent variable, since log[y/(1 − y)]ranges over all real values while y is strictly bounded between 0 and 1. However, the log-odds transformation fails wheny takes on the boundary values of 0 and 1 where the transformation is undefined.
19
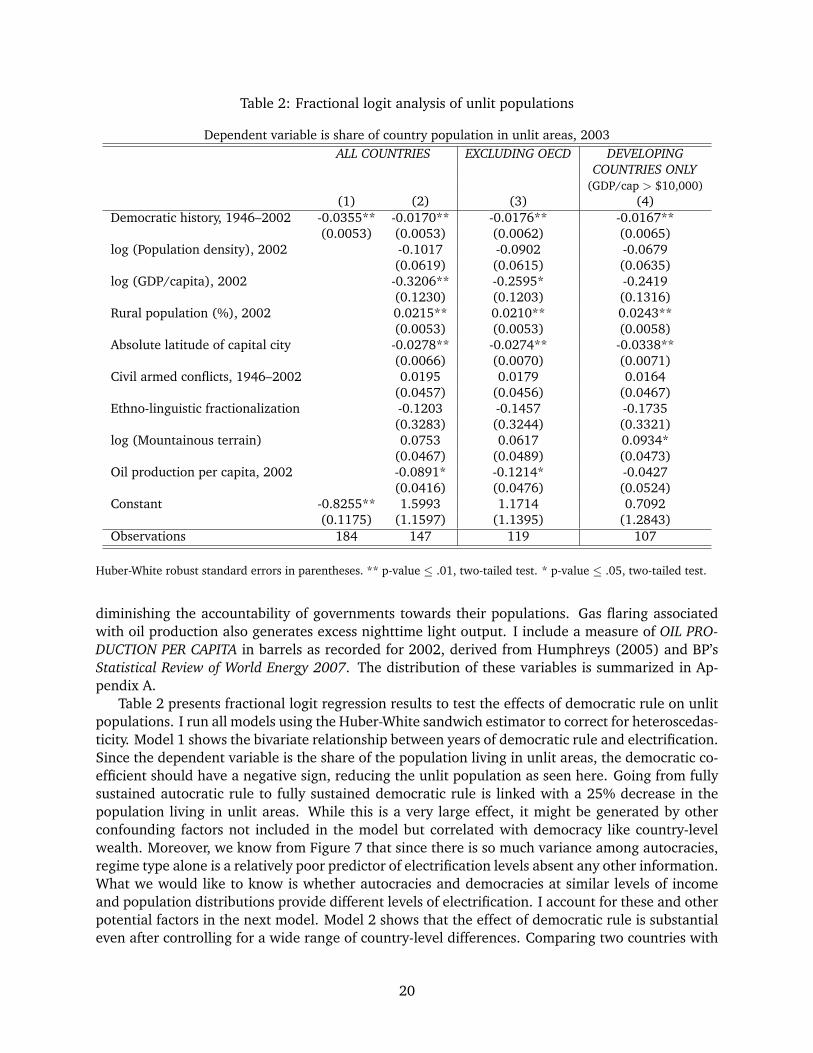
Table 2: Fractional logit analysis of unlit populations
Dependent variable is share of country population in unlit areas, 2003ALL COUNTRIES EXCLUDING OECD DEVELOPING
COUNTRIES ONLY(GDP/cap > $10,000)
(1) (2) (3) (4)Democratic history, 1946–2002 -0.0355** -0.0170** -0.0176** -0.0167**
(0.0053) (0.0053) (0.0062) (0.0065)log (Population density), 2002 -0.1017 -0.0902 -0.0679
(0.0619) (0.0615) (0.0635)log (GDP/capita), 2002 -0.3206** -0.2595* -0.2419
(0.1230) (0.1203) (0.1316)Rural population (%), 2002 0.0215** 0.0210** 0.0243**
(0.0053) (0.0053) (0.0058)Absolute latitude of capital city -0.0278** -0.0274** -0.0338**
(0.0066) (0.0070) (0.0071)Civil armed conflicts, 1946–2002 0.0195 0.0179 0.0164
(0.0457) (0.0456) (0.0467)Ethno-linguistic fractionalization -0.1203 -0.1457 -0.1735
(0.3283) (0.3244) (0.3321)log (Mountainous terrain) 0.0753 0.0617 0.0934*
(0.0467) (0.0489) (0.0473)Oil production per capita, 2002 -0.0891* -0.1214* -0.0427
(0.0416) (0.0476) (0.0524)Constant -0.8255** 1.5993 1.1714 0.7092
(0.1175) (1.1597) (1.1395) (1.2843)Observations 184 147 119 107
Huber-White robust standard errors in parentheses. ** p-value ≤ .01, two-tailed test. * p-value ≤ .05, two-tailed test.
diminishing the accountability of governments towards their populations. Gas flaring associatedwith oil production also generates excess nighttime light output. I include a measure of OIL PRO-DUCTION PER CAPITA in barrels as recorded for 2002, derived from Humphreys (2005) and BP’sStatistical Review of World Energy 2007. The distribution of these variables is summarized in Ap-pendix A.
Table 2 presents fractional logit regression results to test the effects of democratic rule on unlitpopulations. I run all models using the Huber-White sandwich estimator to correct for heteroscedas-ticity. Model 1 shows the bivariate relationship between years of democratic rule and electrification.Since the dependent variable is the share of the population living in unlit areas, the democratic co-efficient should have a negative sign, reducing the unlit population as seen here. Going from fullysustained autocratic rule to fully sustained democratic rule is linked with a 25% decrease in thepopulation living in unlit areas. While this is a very large effect, it might be generated by otherconfounding factors not included in the model but correlated with democracy like country-levelwealth. Moreover, we know from Figure 7 that since there is so much variance among autocracies,regime type alone is a relatively poor predictor of electrification levels absent any other information.What we would like to know is whether autocracies and democracies at similar levels of incomeand population distributions provide different levels of electrification. I account for these and otherpotential factors in the next model. Model 2 shows that the effect of democratic rule is substantialeven after controlling for a wide range of country-level differences. Comparing two countries with
20
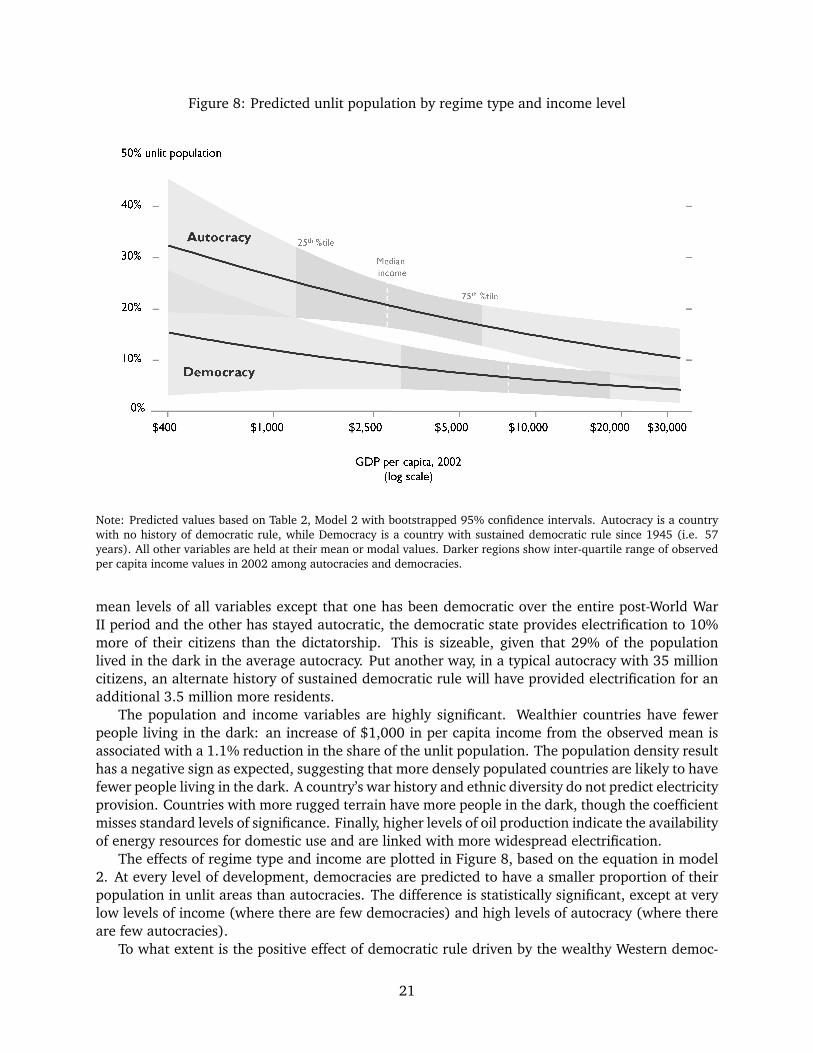
Figure 8: Predicted unlit population by regime type and income level
Note: Predicted values based on Table 2, Model 2 with bootstrapped 95% confidence intervals. Autocracy is a countrywith no history of democratic rule, while Democracy is a country with sustained democratic rule since 1945 (i.e. 57years). All other variables are held at their mean or modal values. Darker regions show inter-quartile range of observedper capita income values in 2002 among autocracies and democracies.
mean levels of all variables except that one has been democratic over the entire post-World WarII period and the other has stayed autocratic, the democratic state provides electrification to 10%more of their citizens than the dictatorship. This is sizeable, given that 29% of the populationlived in the dark in the average autocracy. Put another way, in a typical autocracy with 35 millioncitizens, an alternate history of sustained democratic rule will have provided electrification for anadditional 3.5 million more residents.
The population and income variables are highly significant. Wealthier countries have fewerpeople living in the dark: an increase of $1,000 in per capita income from the observed mean isassociated with a 1.1% reduction in the share of the unlit population. The population density resulthas a negative sign as expected, suggesting that more densely populated countries are likely to havefewer people living in the dark. A country’s war history and ethnic diversity do not predict electricityprovision. Countries with more rugged terrain have more people in the dark, though the coefficientmisses standard levels of significance. Finally, higher levels of oil production indicate the availabilityof energy resources for domestic use and are linked with more widespread electrification.
The effects of regime type and income are plotted in Figure 8, based on the equation in model2. At every level of development, democracies are predicted to have a smaller proportion of theirpopulation in unlit areas than autocracies. The difference is statistically significant, except at verylow levels of income (where there are few democracies) and high levels of autocracy (where thereare few autocracies).
To what extent is the positive effect of democratic rule driven by the wealthy Western democ-
21
racies? To evaluate this possibility, Model 3 excludes the 30 highly developed OECD nations andyields nearly identical results. Model 4 focuses the analysis on the developing world, excludingcountries with per capita income greater than $10,000. The results are again nearly identical, sug-gesting that even poor and middle-income democracies provide electrification to more citizens thantheir autocratic counterparts. The results are also robust to alternative measures of democratic his-tory. Drawing on codings from the Polity IV project, different measures of democratic rule yieldcoefficients that are consistent in size and significance to the results shown here (see Appendix Ta-ble 5 for results). Other model specifications were also examined, including a population weightedregression, inclusion of region fixed effects, and controlling for possible interaction effects. Allmodels yield the same prediction that democracies provide lights to more of their population thanautocracies (see Appendix Table 6 for results). Notably, an identical analysis (not shown here)using the IEA’s electrification rates derived from government self-reports and third-party estimatesreveals no democratic effect, demonstrating the potential perils of missing data and measurementerror in standard cross-national analysis.
Taken together, these findings support the claim that electoral incentives induce higher pub-lic goods provision in democracies. Across a range of samples and model specifications, demo-cratic leaders provide substantially higher levels of electrification than do autocrats, even aftercontrolling for differences in wealth, population density, and other factors. Nevertheless, theresults should be interpreted with some caution. Recent work has challenged the use of stan-dard cross-sectional research methods in comparing democracies and dictatorships (Przeworskiet al. 2000, Keefer 2005, Ross 2006). Since the causal factors that lead countries to democratizemight also be correlated with the outcomes we seek to evaluate, inferences about the effects ofdemocracy might be weakened by selection bias. Some of this concern is mitigated by my mea-sure of democratic history, which takes period under democratic rule into account and not just thecurrent level of democracy. However, it is still possible that the observed electrification level is notcausally linked to democracy. For example, a country that transitions to democracy might alreadyhave high levels of electrification, and inferring that it was democracy that led to the provision oflighting would be incorrect. One way of mitigating this concern is to compare only the subsam-ple of states that have not experienced a regime transition during the postwar period. Within thisgroup, the average unlit population was 26% higher in the 51 fully sustained autocracies comparedto the 17 sustained democracies (see also Appendix Table 6).
A far more robust evaluation of the effects of democracy could be identified if we could ran-domly assign a democratic “treatment” to a group of countries and compare their performance overtime against a “control” group of otherwise similar autocratic countries. While such an ideal exper-iment could never be conducted, we can exploit the occurrence of a quasi-natural experiment thatoccurred after the fall of Communism across Eastern Europe and Central Asia in the early 1990s. Ievaluate this question in the following section.
5.2 Democratic transitions in the former Soviet Bloc
The period of 1992 to 2003 for which nighttime satellite images are available captures what somehave called the fourth wave of democratization: with the end of the Cold War and the downfall ofCommunism, rapid transitions to democracy occurred in many parts of the world (McFaul 2002,Doorenspleet 2005). Nowhere were these changes as sweeping and dramatic as across the formerSoviet Bloc. As the Berlin Wall fell and the Soviet Union dissolved, a group of 28 states that hadbeen united under Communist governments loyal to Moscow abandoned their governments. In theensuing decade, many retained authoritarian rule but 12 transitioned to become democracies (seeTable 3). The fall of Communism in a substantial group of countries with roughly similar political
22
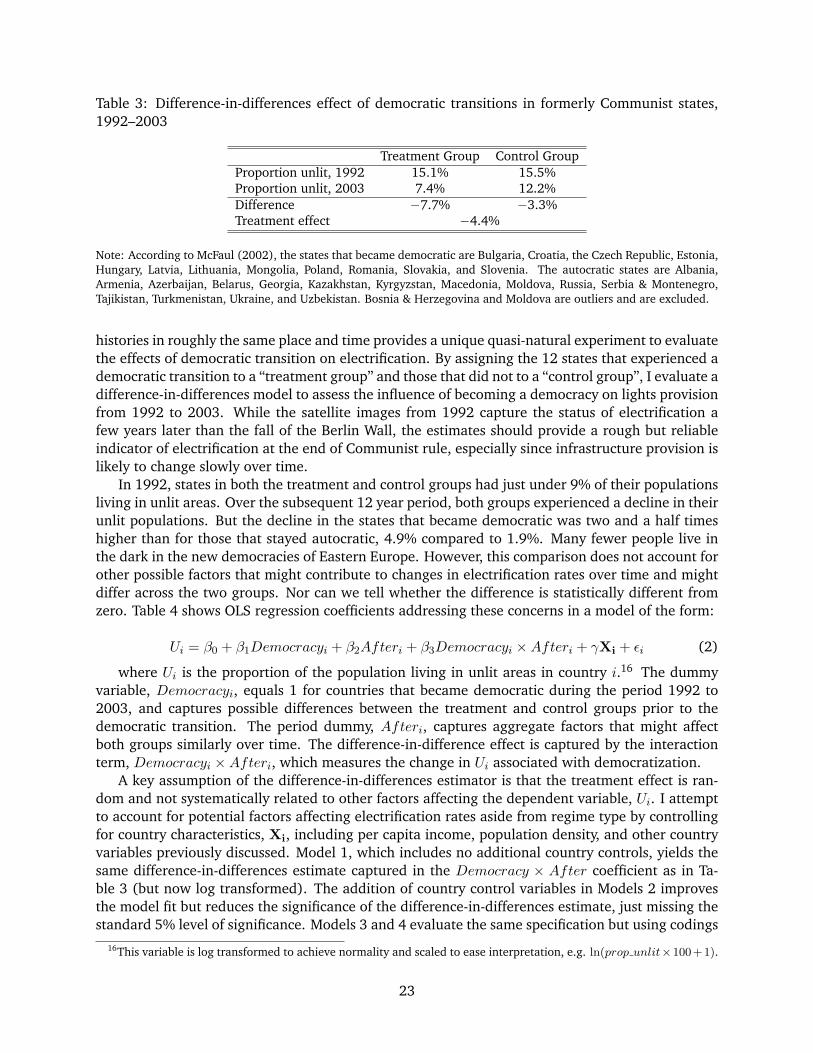
Table 3: Difference-in-differences effect of democratic transitions in formerly Communist states,1992–2003
Treatment Group Control GroupProportion unlit, 1992 15.1% 15.5%Proportion unlit, 2003 7.4% 12.2%Difference −7.7% −3.3%Treatment effect −4.4%
Note: According to McFaul (2002), the states that became democratic are Bulgaria, Croatia, the Czech Republic, Estonia,Hungary, Latvia, Lithuania, Mongolia, Poland, Romania, Slovakia, and Slovenia. The autocratic states are Albania,Armenia, Azerbaijan, Belarus, Georgia, Kazakhstan, Kyrgyzstan, Macedonia, Moldova, Russia, Serbia & Montenegro,Tajikistan, Turkmenistan, Ukraine, and Uzbekistan. Bosnia & Herzegovina and Moldova are outliers and are excluded.
histories in roughly the same place and time provides a unique quasi-natural experiment to evaluatethe effects of democratic transition on electrification. By assigning the 12 states that experienced ademocratic transition to a “treatment group” and those that did not to a “control group”, I evaluate adifference-in-differences model to assess the influence of becoming a democracy on lights provisionfrom 1992 to 2003. While the satellite images from 1992 capture the status of electrification afew years later than the fall of the Berlin Wall, the estimates should provide a rough but reliableindicator of electrification at the end of Communist rule, especially since infrastructure provision islikely to change slowly over time.
In 1992, states in both the treatment and control groups had just under 9% of their populationsliving in unlit areas. Over the subsequent 12 year period, both groups experienced a decline in theirunlit populations. But the decline in the states that became democratic was two and a half timeshigher than for those that stayed autocratic, 4.9% compared to 1.9%. Many fewer people live inthe dark in the new democracies of Eastern Europe. However, this comparison does not account forother possible factors that might contribute to changes in electrification rates over time and mightdiffer across the two groups. Nor can we tell whether the difference is statistically different fromzero. Table 4 shows OLS regression coefficients addressing these concerns in a model of the form:
Ui = β0 + β1Democracyi + β2Afteri + β3Democracyi ×Afteri + γXi + εi (2)
where Ui is the proportion of the population living in unlit areas in country i.16 The dummyvariable, Democracyi, equals 1 for countries that became democratic during the period 1992 to2003, and captures possible differences between the treatment and control groups prior to thedemocratic transition. The period dummy, Afteri, captures aggregate factors that might affectboth groups similarly over time. The difference-in-difference effect is captured by the interactionterm, Democracyi ×Afteri, which measures the change in Ui associated with democratization.
A key assumption of the difference-in-differences estimator is that the treatment effect is ran-dom and not systematically related to other factors affecting the dependent variable, Ui. I attemptto account for potential factors affecting electrification rates aside from regime type by controllingfor country characteristics, Xi, including per capita income, population density, and other countryvariables previously discussed. Model 1, which includes no additional country controls, yields thesame difference-in-differences estimate captured in the Democracy × After coefficient as in Ta-ble 3 (but now log transformed). The addition of country control variables in Models 2 improvesthe model fit but reduces the significance of the difference-in-differences estimate, just missing thestandard 5% level of significance. Models 3 and 4 evaluate the same specification but using codings
16This variable is log transformed to achieve normality and scaled to ease interpretation, e.g. ln(prop unlit×100+1).
23
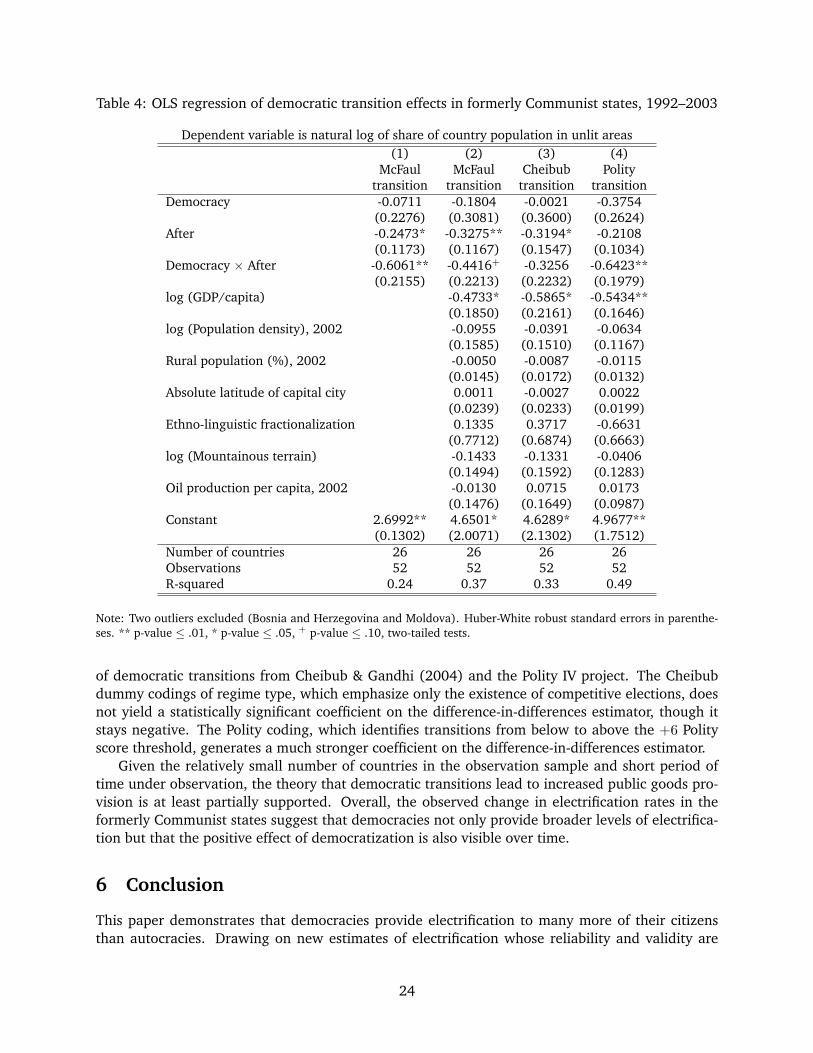
Table 4: OLS regression of democratic transition effects in formerly Communist states, 1992–2003
Dependent variable is natural log of share of country population in unlit areas(1) (2) (3) (4)
McFaul McFaul Cheibub Politytransition transition transition transition
Democracy -0.0711 -0.1804 -0.0021 -0.3754(0.2276) (0.3081) (0.3600) (0.2624)
After -0.2473* -0.3275** -0.3194* -0.2108(0.1173) (0.1167) (0.1547) (0.1034)
Democracy × After -0.6061** -0.4416+ -0.3256 -0.6423**(0.2155) (0.2213) (0.2232) (0.1979)
log (GDP/capita) -0.4733* -0.5865* -0.5434**(0.1850) (0.2161) (0.1646)
log (Population density), 2002 -0.0955 -0.0391 -0.0634(0.1585) (0.1510) (0.1167)
Rural population (%), 2002 -0.0050 -0.0087 -0.0115(0.0145) (0.0172) (0.0132)
Absolute latitude of capital city 0.0011 -0.0027 0.0022(0.0239) (0.0233) (0.0199)
Ethno-linguistic fractionalization 0.1335 0.3717 -0.6631(0.7712) (0.6874) (0.6663)
log (Mountainous terrain) -0.1433 -0.1331 -0.0406(0.1494) (0.1592) (0.1283)
Oil production per capita, 2002 -0.0130 0.0715 0.0173(0.1476) (0.1649) (0.0987)
Constant 2.6992** 4.6501* 4.6289* 4.9677**(0.1302) (2.0071) (2.1302) (1.7512)
Number of countries 26 26 26 26Observations 52 52 52 52R-squared 0.24 0.37 0.33 0.49
Note: Two outliers excluded (Bosnia and Herzegovina and Moldova). Huber-White robust standard errors in parenthe-ses. ** p-value ≤ .01, * p-value ≤ .05, + p-value ≤ .10, two-tailed tests.
of democratic transitions from Cheibub & Gandhi (2004) and the Polity IV project. The Cheibubdummy codings of regime type, which emphasize only the existence of competitive elections, doesnot yield a statistically significant coefficient on the difference-in-differences estimator, though itstays negative. The Polity coding, which identifies transitions from below to above the +6 Polityscore threshold, generates a much stronger coefficient on the difference-in-differences estimator.
Given the relatively small number of countries in the observation sample and short period oftime under observation, the theory that democratic transitions lead to increased public goods pro-vision is at least partially supported. Overall, the observed change in electrification rates in theformerly Communist states suggest that democracies not only provide broader levels of electrifica-tion but that the positive effect of democratization is also visible over time.
6 Conclusion
This paper demonstrates that democracies provide electrification to many more of their citizensthan autocracies. Drawing on new estimates of electrification whose reliability and validity are
24
not sensitive to endogeneity with the political institutions we want to evaluate, I show a posi-tive link between democratic rule and electrification that is robust to differences in development,demographics, and geography.
Future research will need to address several questions raised by the results and analysis pre-sented in this paper. First, even if democracies provide public goods to more of their citizens thanautocracies, how do we know whether these public goods are distributed more equitably or ef-ficiently than in autocracies? Data limitations have made it impossible to evaluate distributionalquestions of this kind at a global scale. The comprehensive coverage of the night lights satelliteimages combined with their high resolution may provide a unique data source for the analysis ofthese important distributional issues. Second, if the provision of electrification is conditional onthe electoral accountability of politicians, then differences in electoral rules should have an observ-able impact on the distribution of electrical infrastructure. States with proportional representationvoting systems, for example, should have fewer pockets of unlit communities than states with ma-joritarian systems since small voting blocs are more likely to have electoral representation in PRsystems (Lizzeri & Persico 2001, Milesi-Ferretti, Perotti & Rostagno 2002). Third, what explainsthe wide variance in electrification rates across autocracies? Do other institutions of accountabilityexist in autocracies (see e.g., Tsai 2007) that might induce some dictators to distribute electric-ity more broadly to their rural citizens (and perhaps even more than some democratic leaders)?Fourth, what explains the discrepancy between satellite-derived estimates of electrification and theofficial tallies reported in the most widely used cross-national datasets? Finally, what inferencescan be drawn about whether electrification provision is related to the distribution of other basicpublic goods and services like water, education, and health? Seeking answers to these questionsshould extend the possible applications of satellite imagery for the analysis of state activities andother political phenomena.
25
References
Acemoglu, Daron & James A. Robinson. 2006. economic origins of dictatorship and democracy. New York:Cambridge University Press.
Alesina, Alberto, Reza Baqir & William Easterly. 1999. “Public goods and ethnic divisions.” Quarterly Journalof Economics 114(4):1243–1284.
Amaral, Silvana et al. 2006. “DMSP/OLS night-time light imagery for urban population estimates in theBrazilian Amazon.” International Journal of Remote Sensing 27(5):855–870.
Austen-Smith, David & Jeffrey Banks. 1988. “Elections, coalitions, and legislative outcomes.” AmericanPolitical Science Review 82(2):405–422.
Banerjee, Abhijit, Rohini Somanathan & Lakshmi Iyer. 2005. “History, social divisions and public goods inrural India.” Journal of the European Economic Association 3(2–3):639–647.
Barnes, Douglas F. & Willem M. Floor. 1996. “Rural energy in developing countries: a challenge for economicdevelopment.” Annual Review of Energy and the Environment 21:497–530.
Baron, David P. & John A. Ferejohn. 1989. “Bargaining in legislatures.” American Political Science Review83(4):1181–1206.
Bates, Robert. 1974. “Ethnic competition and modernization in contemporary Africa.” Comparative PoliticalStudies 6(4):457–484.
Besley, Timothy & Stephen Coate. 1998. “Sources of inefficiency in a representative democracy: A dynamicanalysis.” American Economic Review 88(1):139–156.
Besley, Timothy & Stephen Coate. 2003. “Centralized versus decentralized provision of local public goods:A political economy approach.” Journal of Public Economics 87(12):2611–2637.
Besley, Timothy et al. 2004. “The politics of public good provision: Evidence from Indian local governments.”Journal of the European Economic Association 2(2–3):416–26.
Boix, Carles & Daniel N. Posner. 1998. “Social capital: Explaining its origins and effects on governmentperformance.” British Journal of Political Science 28(04):686–693.
Bratton, Michael & Nicholas van de Walle. 1994. “Neopatrimonial regimes and political transitions in Africa.”World Politics 46(4):453–489.
Bueno de Mesquita, Bruce et al. 2003. Logic of political survival. Cambridge, MA: MIT Press.
Canning, David. 1998. “A database of world stocks of infrastructure, 1950–95.” World Bank Economic Review12(3):529.
Casper, Gretchen & Claudiu Tufis. 2003. “Correlation Versus interchangeability: The limited robustness ofempirical findings on democracy using highly correlated data sets.” Political Analysis 11(2):196–203.
Chandra, Kanchan. 2004. Why ethnic parties succeed. Cambridge, UK; New York, NY: Cambridge UniversityPress.
Cheibub, Jose A. & Jennifer Gandhi. 2004. “Classifying political regimes: A six-fold measure of democraciesand dictatorships.” Annual Meeting of the American Political Science Association, Chicago, September.
Collie, Melissa P. 1988. “Universalism and the parties in the US House of Representatives, 1921–80.” Ameri-can Journal of Political Science 32(4):865–883.
Diaz-Cayeros, Alberto, Beatriz Magaloni & Estevez. forthcoming. “Vote-buying, poverty and democracy: Thepolitics of social programs in Mexico, 1989–2006.” Unpublished manuscript.
Doorenspleet, Renske. 2005. Democratic transitions: Exploring the structural sources of the fourth wave.Boulder, CO: Lynne Rienner.
26
Easterly, William & Ross Levine. 1997. “Africa’s growth tragedy: Policies and ethnic divisions.” QuarterlyJournal of Economics 112(4):1203–1250.
Elvidge, Christopher et al. 1997a. “Mapping city lights with nighttime data from the DMSP OperationalLinescan System.” Photogrammetric Engineering & Remote Sensing 63(6):727–734.
Elvidge, Christopher et al. 1997b. “Relation between satellite observed visible-near infrared emissions,population, economic activity, and power consumption.” International Journal of Remote Sensing18(6):1373–1379.
Elvidge, Christopher et al. 2001. “Night-time lights of the world: 1994–1995.” ISPRS Journal of Photogram-metry & Remote Sensing 56:81–99.
Fearon, James D. & David D. Laitin. 2003. “Ethnicity, insurgency, and civil war.” American Political ScienceReview 97(1):75–90.
Friedl, M. et al. 2002. “Global land cover mapping from MODIS algorithms and early results.” Remote Sensingof Environment 83(1):287–302.
Fuller, D.O. 2000. “Comparison of NOAA-AVHRR and DMSP-OLS for operational fire monitoring in Kaliman-tan, Indonesia.” International Journal of Remote Sensing 21(1):181–187.
Gandhi, Jennifer & Adam Przeworski. 2006. “Cooperation, cooptation, and rebellion under dictatorships.”Economics and Politics 18(1):1–26.
Gleditsch, Kristian. 2003. “Distance between capital cities dataset.”http://privatewww.essex.ac.uk/ ksg/data-5.html.
Gradstein, Mark. 1993. “Rent seeking and the provision of public goods.” Economic Journal 103(420):1236–1243.
Groseclose, Timothy & James M. Snyder. 1996. “Buying supermajorities.” American Political Science Review90(2):303–315.
Guinier, Lani. 1994. The tyranny of the majority: Fundamental fairness in representative democracy. NewYork: Free Press.
Habyarimana, James et al. 2007. “Why does ethnic diversity undermine public goods provision?” AmericanPolitical Science Review 101(4):709–725.
Humphreys, Macartan. 2005. “Natural resources, conflict, and conflict resolution: Uncovering the mecha-nisms.” Journal of Conflict Resolution 49(4):508–537.
Imhoff, Mark L. et al. 1997. “A technique for using composite DMSP/OLS “city lights” satellite data to mapurban area.” Remote Sensing of Environment 61(3):361–370.
International Energy Agency. 2002. World Energy Outlook 2002. Paris, France: Organisation for EconomicCooperation and Development (OECD)/IEA.
International Energy Agency. 2006. World Energy Outlook 2006. Paris, France: Organisation for EconomicCooperation and Development (OECD)/IEA.
Keefer, Philip. 2005. Democratization and clientelism: why are young democracies badly governed? WorkingPaper Series No. 3594. World Bank. Washington, DC: World Bank.
Keefer, Phlip & Stuti Khemani. 2005. “Democracy, public expenditures, and the poor: Understanding politicalincentives for providing public services.” World Bank Research Observer 20(1):1–27.
Kohiyama, M. et al. 2004. “Early damaged area estimation system using DMSP-OLS night-time imagery.”International Journal of Remote Sensing 25(11):2015–2036.
Kromm, David E. 1970. “Soviet planning for increases in electric power production and capacity.” Transac-tions of the Kansas Academy of Science 73(3):281–291.
27
Lake, David A. & Matt Baum. 2001. “The invisible hand of democracy: political control and the provision ofpublic services.” Comparative Political Studies 34(6):587–621.
Lee, Kuan Yew. 2000. From third world to first: The Singapore story: 1965-2000. New York: Harper Collins.
Lindert, Peter H. 2004. Growing public: Social spending and economic growth since the eighteenth century.New York: Cambridge University Press.
Lipset, Seymour Martin. 1959. “Some social requisites of democracy: Economic development and politicallegitimacy.” American Political Science Review 53(1):69–105.
Lizzeri, A. & N. Persico. 2001. “The provision of public goods under alternative electoral incentives.” Ameri-can Economic Review 91(1):225–239.
Lo, C.P. 2001. “Modeling the population of China using DMSP operational linescan system nighttime data.”Photogrammetric engineering and remote sensing 67(9):1037–1047.
McFaul, M. 2002. “The fourth wave of democracy and dictatorship: Noncooperative transitions in thepostcommunist world.” World Politics 54(2):212–244.
Meltzer, Allan H. & Scott F. Richard. 1981. “A rational theory of the size of government.” Journal of PoliticalEconomy 89(5):914–927.
Miguel, Edward. 2004. “Tribe or nation? Nation-building and public goods in Kenya versus Tanzania.” WorldPolitics 56(3):327–362.
Milesi-Ferretti, Gian Maria, Roberto Perotti & Massimo Rostagno. 2002. “Electoral systems and public spend-ing.” Quarterly Journal of Economics 117(2):609–657.
Montalvo, Jos’e Garcia & Marta Reynal-Querol. 2005. “Ethnic diversity and economic development.” Journalof Development Economics 76:293–323.
Nye, David E. 1992. Electrifying America: Social meanings of a new technology, 1880–1940. Cambridge, MA:MIT Press.
Pan, Jiahua et al. 2006. “Rural electrification in China 1950–2004: Historical processes and key drivingforces.” Program on Energy and Sustainable Development.
Pande, Rohini. 2003. “Can mandated political representation increase policy influence for disadvantagedminorities? Theory and evidence from India.” American Economic Review 93(4):1132–1151.
Papke, Leslie E. & Jeffrey M. Wooldridge. 1996. “Econometric methods for fractional response variables withan application to 401 (k) plan participation rates.” Journal of Applied Econometrics 11(6):619–632.
Persson, Torsten & Guido Tabellini. 2000. Political economics: Explaining economic policy. Cambridge, MA:MIT Press.
Persson, Torsten & Guido Tabellini. 2003. Economic Effects of Constitutions. Cambidge, MA: MIT Press.
Posner, Daniel N. 2004. “Measuring ethnic fractionalization in Africa.” American Journal of Political Science48(4):849–863.
Przeworski, A., M. Alvarez, J. Cheibub & F. Limongi. 2000. Democracy and Development: Political Institutionsand Material Well Being in the World. New York: Cambridge University Press.
Rodriguez, E., C.S. Morris & J.E. Belz. 2006. “A Global Assessment of the SRTM Performance.” Photogram-metric Engineering and Remote Sensing 72(3):249–260.
Ross, Michael L. 2006. “Is Democracy Good for the Poor?” American Journal of Political Science 50(4):860–874.
Salvatore, Mirella et al. 2005. Mapping global urban and rural population distributions. Environment andNatural Resources Working Paper 24, Food and Agriculture Organization of the United Nations. Rome:Food and Agriculture Organization of the United Nations.
28
Scheiner, Ethan. 2006. Democracy without competition in Japan: Opposition failure in a one-party dominantstate. New York: Cambridge University Press.
Schmitter, Philippe C. & Terry L. Karl. 1991. “What democracy is. . . and is not.” Journal of Democracy2(3):75–88.
SHP News. 2004. “Small hydro power-based rural electrification in China.” SHP News 21(Autumn):2–10.
Small, C. et al. 2005. “Spatial analysis of global urban extent from DMSP-OLS night lights.” Remote Sensingof Environment 96(3–4):277–291.
Stokes, Susan C. 2005. “Perverse accountability: A formal model of machine politics with evidence fromArgentina.” American Political Science Review 99(03):315–325.
Tsai, Lily. 2007. “Solidary groups, informal accountability, and local public goods provision in rural China.”American Political Science Review 101(02):355–372.
U.S. Census Bureau. 1975. Historical statistics of the United States: Colonial times to 1970. Washington, DC:U.S. Census Bureau.
Wantchekon, Leonard. 2003. “Clientelism and voting behavior: Evidence from a field experiment in Benin.”World Politics 55(3):399–422.
Weingast, Barry R., Kenneth A. Shepsle & Christopher Johnsen. 1981. “The political economy of benefits andcosts: A neoclassical approach to distributive politics.” Journal of Political Economy 89(4):642–664.
Wilkinson, Steven I. 2006. “The politics of infrastructural spending in India.” Background paper for Dancingwith Giants: China, India, and the Global Economy. Institute for Policy Studies and the World Bank,Washington, DC. July.
Wittman, Donald. 1989. “Why democracies produce efficient results.” Journal of Political Economy97(6):1395–1424.
Wooldridge, Jeffrey M. 2002. Econometric analysis of cross section and panel data. Cambridge, MA: MITPress.
World Bank. 2008. The welfare impact of rural electrification: A reassessment of the costs and benefits.Technical report Independent Evaluation Group (IEG). Washington, DC: World Bank.
29
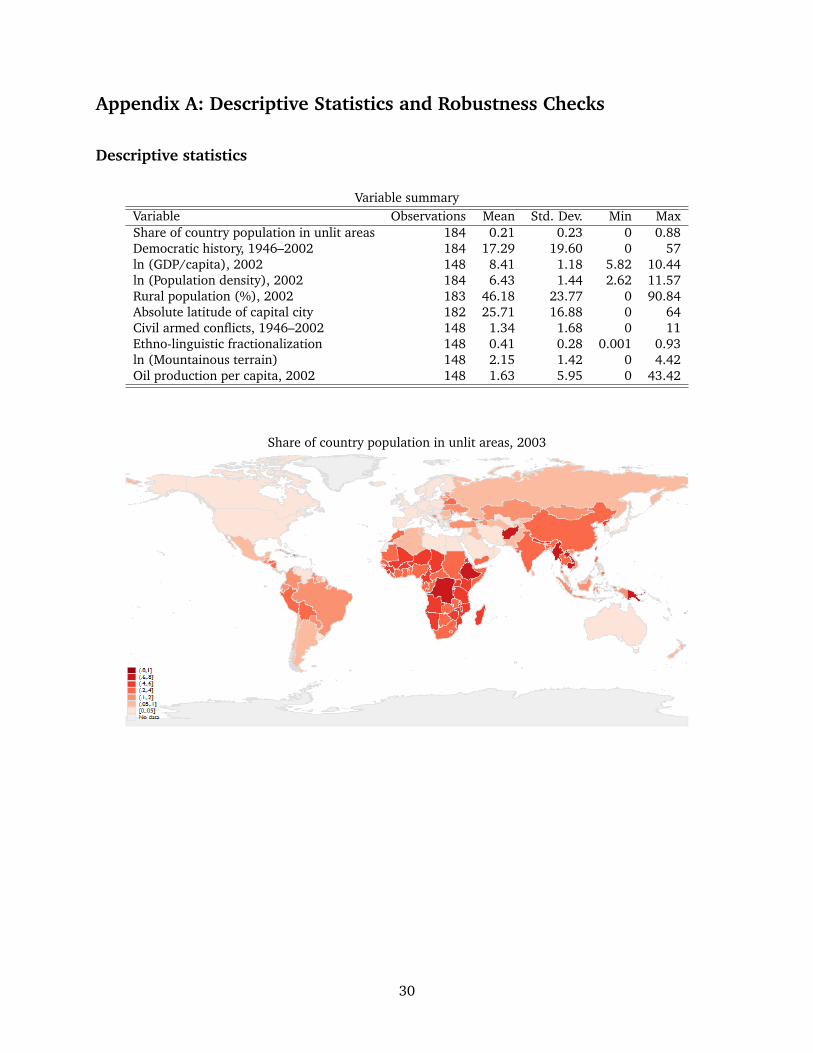
Appendix A: Descriptive Statistics and Robustness Checks
Descriptive statistics
Variable summaryVariable Observations Mean Std. Dev. Min MaxShare of country population in unlit areas 184 0.21 0.23 0 0.88Democratic history, 1946–2002 184 17.29 19.60 0 57ln (GDP/capita), 2002 148 8.41 1.18 5.82 10.44ln (Population density), 2002 184 6.43 1.44 2.62 11.57Rural population (%), 2002 183 46.18 23.77 0 90.84Absolute latitude of capital city 182 25.71 16.88 0 64Civil armed conflicts, 1946–2002 148 1.34 1.68 0 11Ethno-linguistic fractionalization 148 0.41 0.28 0.001 0.93ln (Mountainous terrain) 148 2.15 1.42 0 4.42Oil production per capita, 2002 148 1.63 5.95 0 43.42
Share of country population in unlit areas, 2003
30
Alternative measures of democratic history
The results presented in the paper are highly robust to alternative measures of democracy. Table 5 showsversions of the main model using several measures of democratic history derived from the Polity IV project.Each of these measures yields an almost identical result to the one presented in the paper, both in terms ofthe size and statistical significance of the coefficient on democratic history. 17
• Years Polity>0: Number of years from 1946–2002 in which Polity score is positive (1946• Years Polity≥6: Number of years in which Polity score surpasses Polity’s recommended threshold for
“democracy.”• Years with competitive elections: Number of years in which the chief executive is chosen through
competitive elections involving at least two parties (Executive Recruitment Concept 8 in the Polityproject’s codings).
• Σ Polity: The sum of the annual Polity scores (from −10 to +10), scaled to a 0–100 score.
Alternative model specifications
Table 6 evaluates the robustness of the main results to different model specifications. Model 1 includesonly the sample of sustained democracies and autocracies to obviate any concern that the current level ofelectrification might be a result of progress under previous regime types. The size and sign of the democratichistory coefficient remains similar to the results for the full country sample. Even given the much smallersample size, it is significant at the 0.07 level.
Model 2 runs a population weighted regression to see whether the cross-sectional results might be drivenby a handful of small countries. The largest country in my sample (China) has a population three ordersof magnitude larger than the smallest (Trinidad and Tobago). Weighting each observation by its populationsize reduces the size and significance of the democratic history variable (p=0.09), though the sign remainsnegative as before. Model 3 adds controls for region fixed effects. Even controlling for unmeasured regionaldifferences, the effect of democracy remains consistent and strong. Model 4 explores the inclusion of in-teraction effects. For example, it might be that democracies are better able to translate economic wealthinto public goods provision. To ease the interpretation of interactions between two continuous variables, Icenter the democratic history, per capita income, and population density variables. While the interactioneffects between democratic history and income; democratic history and population density; and income andpopulation density are all significant, the independent effect of democratic rule remains as strong as before.These results are nearly identical for the reduced sample that excludes the 30 OECD countries (models 5–7).
17The other widely used set of democracy indicators comes from Freedom House. Unfortunately, these measures areavailably only back to 1973, too recent to evaluate the effects of democratic history over decades as I do here. Given thehigh correlation that has been observed between the Freedom House and Polity measures (Casper & Tufis 2003), I donot expect the choice of indicators to yield substantive differences to my results.
31
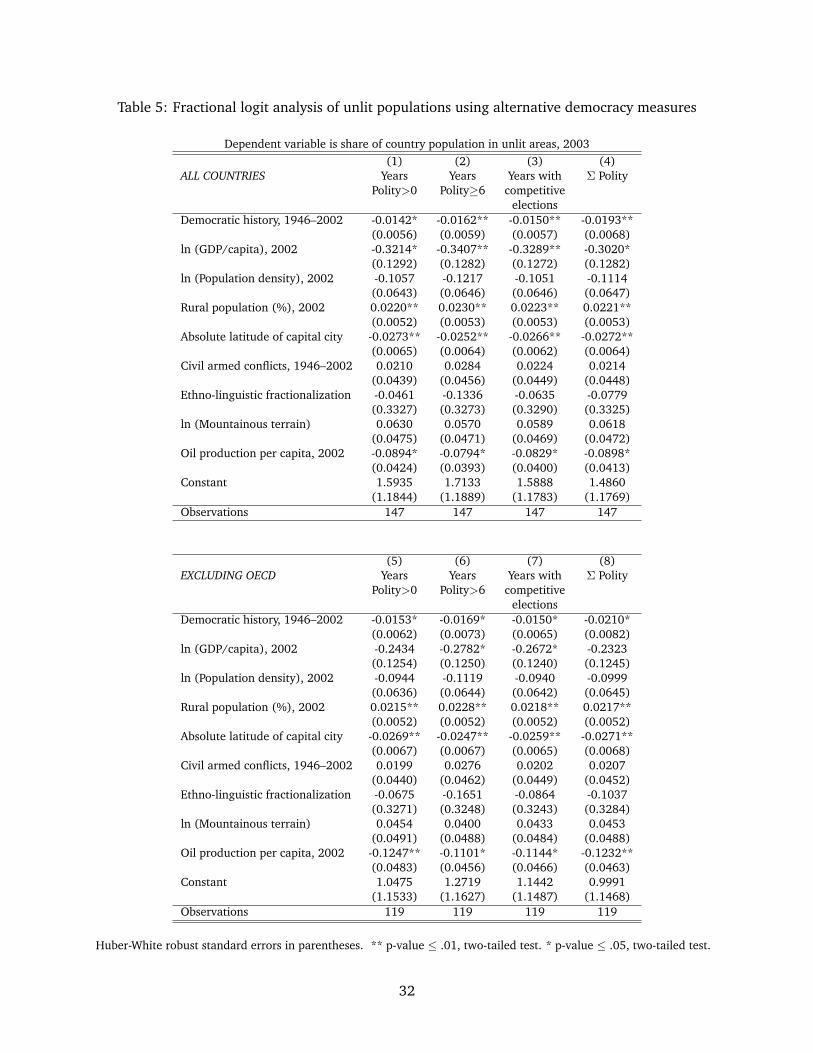
Table 5: Fractional logit analysis of unlit populations using alternative democracy measures
Dependent variable is share of country population in unlit areas, 2003(1) (2) (3) (4)
ALL COUNTRIES Years Years Years with Σ PolityPolity>0 Polity≥6 competitive
electionsDemocratic history, 1946–2002 -0.0142* -0.0162** -0.0150** -0.0193**
(0.0056) (0.0059) (0.0057) (0.0068)ln (GDP/capita), 2002 -0.3214* -0.3407** -0.3289** -0.3020*
(0.1292) (0.1282) (0.1272) (0.1282)ln (Population density), 2002 -0.1057 -0.1217 -0.1051 -0.1114
(0.0643) (0.0646) (0.0646) (0.0647)Rural population (%), 2002 0.0220** 0.0230** 0.0223** 0.0221**
(0.0052) (0.0053) (0.0053) (0.0053)Absolute latitude of capital city -0.0273** -0.0252** -0.0266** -0.0272**
(0.0065) (0.0064) (0.0062) (0.0064)Civil armed conflicts, 1946–2002 0.0210 0.0284 0.0224 0.0214
(0.0439) (0.0456) (0.0449) (0.0448)Ethno-linguistic fractionalization -0.0461 -0.1336 -0.0635 -0.0779
(0.3327) (0.3273) (0.3290) (0.3325)ln (Mountainous terrain) 0.0630 0.0570 0.0589 0.0618
(0.0475) (0.0471) (0.0469) (0.0472)Oil production per capita, 2002 -0.0894* -0.0794* -0.0829* -0.0898*
(0.0424) (0.0393) (0.0400) (0.0413)Constant 1.5935 1.7133 1.5888 1.4860
(1.1844) (1.1889) (1.1783) (1.1769)Observations 147 147 147 147
(5) (6) (7) (8)EXCLUDING OECD Years Years Years with Σ Polity
Polity>0 Polity>6 competitiveelections
Democratic history, 1946–2002 -0.0153* -0.0169* -0.0150* -0.0210*(0.0062) (0.0073) (0.0065) (0.0082)
ln (GDP/capita), 2002 -0.2434 -0.2782* -0.2672* -0.2323(0.1254) (0.1250) (0.1240) (0.1245)
ln (Population density), 2002 -0.0944 -0.1119 -0.0940 -0.0999(0.0636) (0.0644) (0.0642) (0.0645)
Rural population (%), 2002 0.0215** 0.0228** 0.0218** 0.0217**(0.0052) (0.0052) (0.0052) (0.0052)
Absolute latitude of capital city -0.0269** -0.0247** -0.0259** -0.0271**(0.0067) (0.0067) (0.0065) (0.0068)
Civil armed conflicts, 1946–2002 0.0199 0.0276 0.0202 0.0207(0.0440) (0.0462) (0.0449) (0.0452)
Ethno-linguistic fractionalization -0.0675 -0.1651 -0.0864 -0.1037(0.3271) (0.3248) (0.3243) (0.3284)
ln (Mountainous terrain) 0.0454 0.0400 0.0433 0.0453(0.0491) (0.0488) (0.0484) (0.0488)
Oil production per capita, 2002 -0.1247** -0.1101* -0.1144* -0.1232**(0.0483) (0.0456) (0.0466) (0.0463)
Constant 1.0475 1.2719 1.1442 0.9991(1.1533) (1.1627) (1.1487) (1.1468)
Observations 119 119 119 119
Huber-White robust standard errors in parentheses. ** p-value ≤ .01, two-tailed test. * p-value ≤ .05, two-tailed test.
32
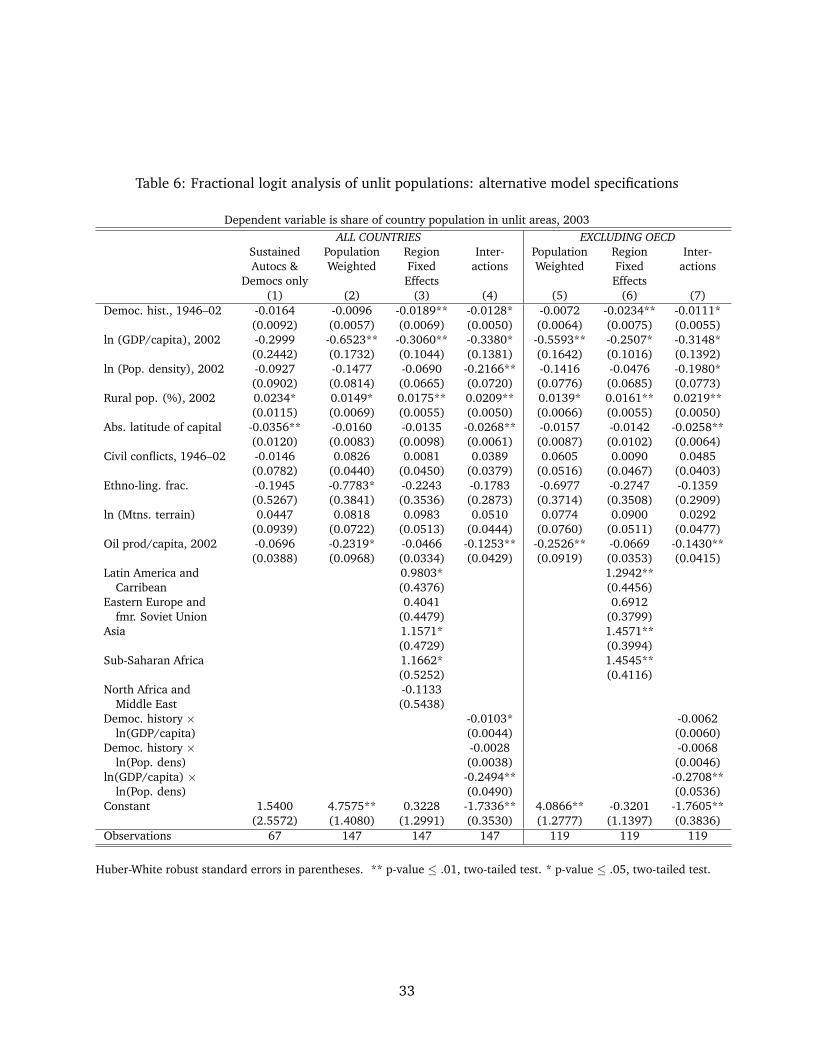
Table 6: Fractional logit analysis of unlit populations: alternative model specifications
Dependent variable is share of country population in unlit areas, 2003ALL COUNTRIES EXCLUDING OECD
Sustained Population Region Inter- Population Region Inter-Autocs & Weighted Fixed actions Weighted Fixed actions
Democs only Effects Effects(1) (2) (3) (4) (5) (6) (7)
Democ. hist., 1946–02 -0.0164 -0.0096 -0.0189** -0.0128* -0.0072 -0.0234** -0.0111*(0.0092) (0.0057) (0.0069) (0.0050) (0.0064) (0.0075) (0.0055)
ln (GDP/capita), 2002 -0.2999 -0.6523** -0.3060** -0.3380* -0.5593** -0.2507* -0.3148*(0.2442) (0.1732) (0.1044) (0.1381) (0.1642) (0.1016) (0.1392)
ln (Pop. density), 2002 -0.0927 -0.1477 -0.0690 -0.2166** -0.1416 -0.0476 -0.1980*(0.0902) (0.0814) (0.0665) (0.0720) (0.0776) (0.0685) (0.0773)
Rural pop. (%), 2002 0.0234* 0.0149* 0.0175** 0.0209** 0.0139* 0.0161** 0.0219**(0.0115) (0.0069) (0.0055) (0.0050) (0.0066) (0.0055) (0.0050)
Abs. latitude of capital -0.0356** -0.0160 -0.0135 -0.0268** -0.0157 -0.0142 -0.0258**(0.0120) (0.0083) (0.0098) (0.0061) (0.0087) (0.0102) (0.0064)
Civil conflicts, 1946–02 -0.0146 0.0826 0.0081 0.0389 0.0605 0.0090 0.0485(0.0782) (0.0440) (0.0450) (0.0379) (0.0516) (0.0467) (0.0403)
Ethno-ling. frac. -0.1945 -0.7783* -0.2243 -0.1783 -0.6977 -0.2747 -0.1359(0.5267) (0.3841) (0.3536) (0.2873) (0.3714) (0.3508) (0.2909)
ln (Mtns. terrain) 0.0447 0.0818 0.0983 0.0510 0.0774 0.0900 0.0292(0.0939) (0.0722) (0.0513) (0.0444) (0.0760) (0.0511) (0.0477)
Oil prod/capita, 2002 -0.0696 -0.2319* -0.0466 -0.1253** -0.2526** -0.0669 -0.1430**(0.0388) (0.0968) (0.0334) (0.0429) (0.0919) (0.0353) (0.0415)
Latin America and 0.9803* 1.2942**Carribean (0.4376) (0.4456)
Eastern Europe and 0.4041 0.6912fmr. Soviet Union (0.4479) (0.3799)
Asia 1.1571* 1.4571**(0.4729) (0.3994)
Sub-Saharan Africa 1.1662* 1.4545**(0.5252) (0.4116)
North Africa and -0.1133Middle East (0.5438)
Democ. history × -0.0103* -0.0062ln(GDP/capita) (0.0044) (0.0060)
Democ. history × -0.0028 -0.0068ln(Pop. dens) (0.0038) (0.0046)
ln(GDP/capita) × -0.2494** -0.2708**ln(Pop. dens) (0.0490) (0.0536)
Constant 1.5400 4.7575** 0.3228 -1.7336** 4.0866** -0.3201 -1.7605**(2.5572) (1.4080) (1.2991) (0.3530) (1.2777) (1.1397) (0.3836)
Observations 67 147 147 147 119 119 119
Huber-White robust standard errors in parentheses. ** p-value ≤ .01, two-tailed test. * p-value ≤ .05, two-tailed test.
33
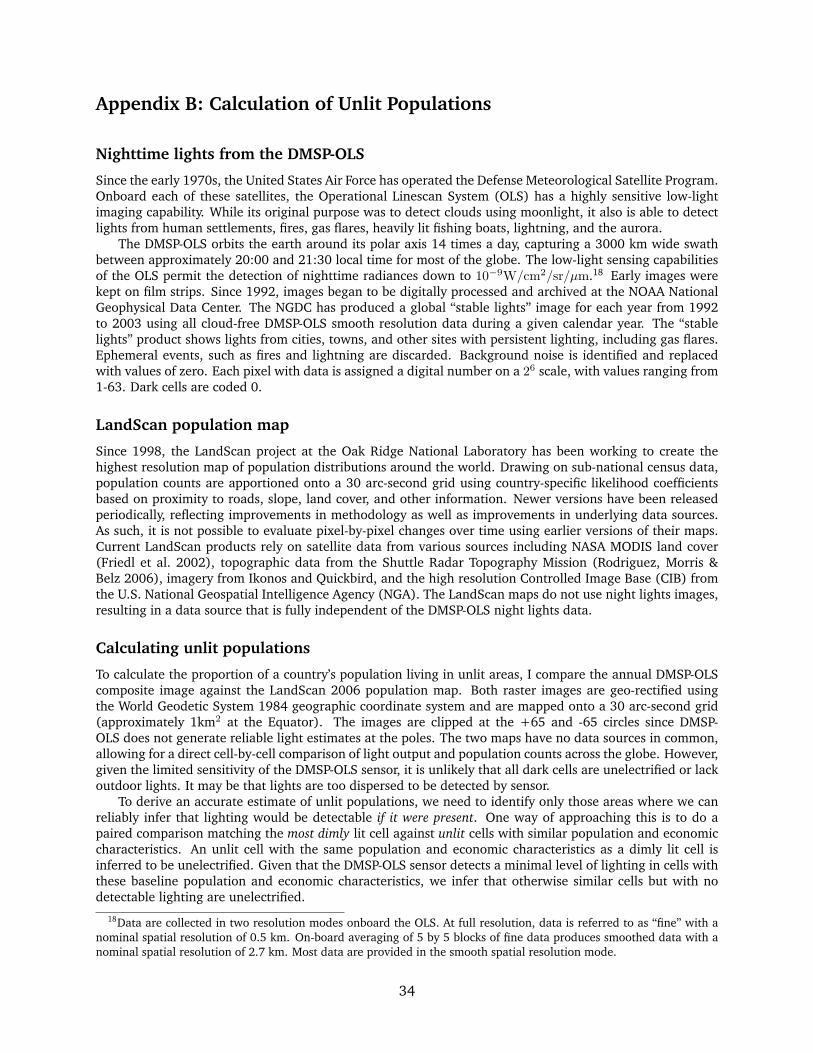
Appendix B: Calculation of Unlit Populations
Nighttime lights from the DMSP-OLS
Since the early 1970s, the United States Air Force has operated the Defense Meteorological Satellite Program.Onboard each of these satellites, the Operational Linescan System (OLS) has a highly sensitive low-lightimaging capability. While its original purpose was to detect clouds using moonlight, it also is able to detectlights from human settlements, fires, gas flares, heavily lit fishing boats, lightning, and the aurora.
The DMSP-OLS orbits the earth around its polar axis 14 times a day, capturing a 3000 km wide swathbetween approximately 20:00 and 21:30 local time for most of the globe. The low-light sensing capabilitiesof the OLS permit the detection of nighttime radiances down to 10−9W/cm2/sr/µm.18 Early images werekept on film strips. Since 1992, images began to be digitally processed and archived at the NOAA NationalGeophysical Data Center. The NGDC has produced a global “stable lights” image for each year from 1992to 2003 using all cloud-free DMSP-OLS smooth resolution data during a given calendar year. The “stablelights” product shows lights from cities, towns, and other sites with persistent lighting, including gas flares.Ephemeral events, such as fires and lightning are discarded. Background noise is identified and replacedwith values of zero. Each pixel with data is assigned a digital number on a 26 scale, with values ranging from1-63. Dark cells are coded 0.
LandScan population map
Since 1998, the LandScan project at the Oak Ridge National Laboratory has been working to create thehighest resolution map of population distributions around the world. Drawing on sub-national census data,population counts are apportioned onto a 30 arc-second grid using country-specific likelihood coefficientsbased on proximity to roads, slope, land cover, and other information. Newer versions have been releasedperiodically, reflecting improvements in methodology as well as improvements in underlying data sources.As such, it is not possible to evaluate pixel-by-pixel changes over time using earlier versions of their maps.Current LandScan products rely on satellite data from various sources including NASA MODIS land cover(Friedl et al. 2002), topographic data from the Shuttle Radar Topography Mission (Rodriguez, Morris &Belz 2006), imagery from Ikonos and Quickbird, and the high resolution Controlled Image Base (CIB) fromthe U.S. National Geospatial Intelligence Agency (NGA). The LandScan maps do not use night lights images,resulting in a data source that is fully independent of the DMSP-OLS night lights data.
Calculating unlit populations
To calculate the proportion of a country’s population living in unlit areas, I compare the annual DMSP-OLScomposite image against the LandScan 2006 population map. Both raster images are geo-rectified usingthe World Geodetic System 1984 geographic coordinate system and are mapped onto a 30 arc-second grid(approximately 1km2 at the Equator). The images are clipped at the +65 and -65 circles since DMSP-OLS does not generate reliable light estimates at the poles. The two maps have no data sources in common,allowing for a direct cell-by-cell comparison of light output and population counts across the globe. However,given the limited sensitivity of the DMSP-OLS sensor, it is unlikely that all dark cells are unelectrified or lackoutdoor lights. It may be that lights are too dispersed to be detected by sensor.
To derive an accurate estimate of unlit populations, we need to identify only those areas where we canreliably infer that lighting would be detectable if it were present. One way of approaching this is to do apaired comparison matching the most dimly lit cell against unlit cells with similar population and economiccharacteristics. An unlit cell with the same population and economic characteristics as a dimly lit cell isinferred to be unelectrified. Given that the DMSP-OLS sensor detects a minimal level of lighting in cells withthese baseline population and economic characteristics, we infer that otherwise similar cells but with nodetectable lighting are unelectrified.
18Data are collected in two resolution modes onboard the OLS. At full resolution, data is referred to as “fine” with anominal spatial resolution of 0.5 km. On-board averaging of 5 by 5 blocks of fine data produces smoothed data with anominal spatial resolution of 2.7 km. Most data are provided in the smooth spatial resolution mode.
34
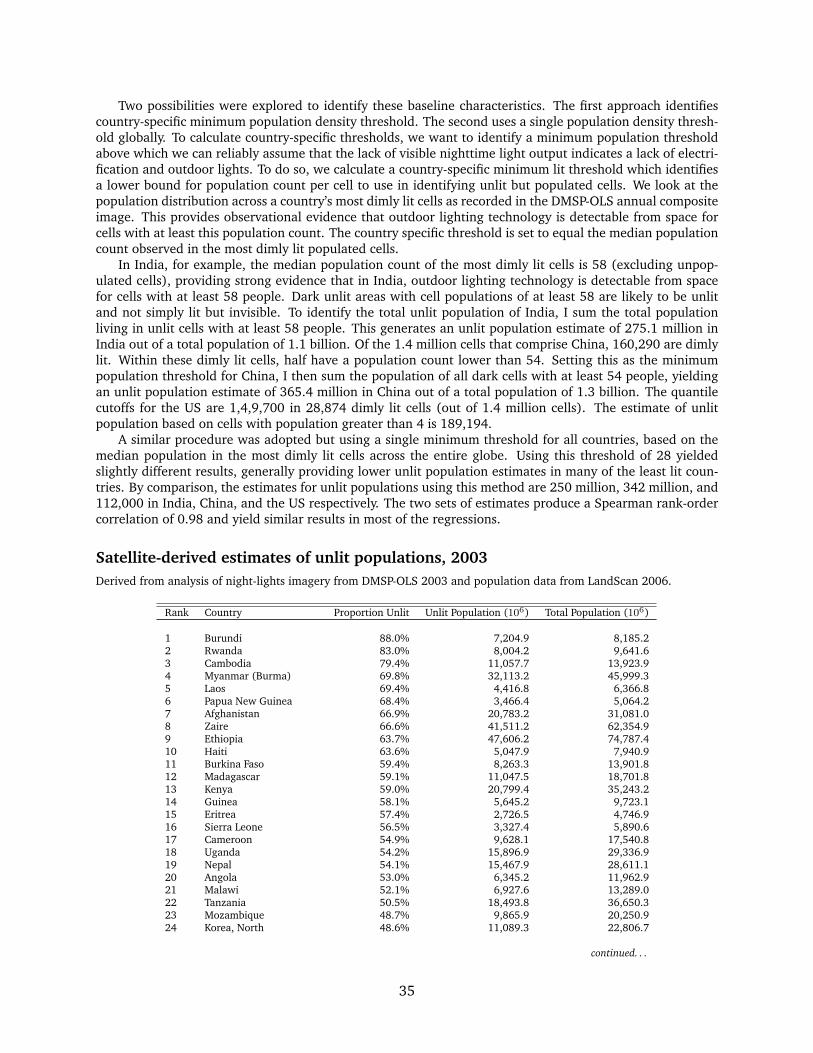
Two possibilities were explored to identify these baseline characteristics. The first approach identifiescountry-specific minimum population density threshold. The second uses a single population density thresh-old globally. To calculate country-specific thresholds, we want to identify a minimum population thresholdabove which we can reliably assume that the lack of visible nighttime light output indicates a lack of electri-fication and outdoor lights. To do so, we calculate a country-specific minimum lit threshold which identifiesa lower bound for population count per cell to use in identifying unlit but populated cells. We look at thepopulation distribution across a country’s most dimly lit cells as recorded in the DMSP-OLS annual compositeimage. This provides observational evidence that outdoor lighting technology is detectable from space forcells with at least this population count. The country specific threshold is set to equal the median populationcount observed in the most dimly lit populated cells.
In India, for example, the median population count of the most dimly lit cells is 58 (excluding unpop-ulated cells), providing strong evidence that in India, outdoor lighting technology is detectable from spacefor cells with at least 58 people. Dark unlit areas with cell populations of at least 58 are likely to be unlitand not simply lit but invisible. To identify the total unlit population of India, I sum the total populationliving in unlit cells with at least 58 people. This generates an unlit population estimate of 275.1 million inIndia out of a total population of 1.1 billion. Of the 1.4 million cells that comprise China, 160,290 are dimlylit. Within these dimly lit cells, half have a population count lower than 54. Setting this as the minimumpopulation threshold for China, I then sum the population of all dark cells with at least 54 people, yieldingan unlit population estimate of 365.4 million in China out of a total population of 1.3 billion. The quantilecutoffs for the US are 1,4,9,700 in 28,874 dimly lit cells (out of 1.4 million cells). The estimate of unlitpopulation based on cells with population greater than 4 is 189,194.
A similar procedure was adopted but using a single minimum threshold for all countries, based on themedian population in the most dimly lit cells across the entire globe. Using this threshold of 28 yieldedslightly different results, generally providing lower unlit population estimates in many of the least lit coun-tries. By comparison, the estimates for unlit populations using this method are 250 million, 342 million, and112,000 in India, China, and the US respectively. The two sets of estimates produce a Spearman rank-ordercorrelation of 0.98 and yield similar results in most of the regressions.
Satellite-derived estimates of unlit populations, 2003Derived from analysis of night-lights imagery from DMSP-OLS 2003 and population data from LandScan 2006.
Rank Country Proportion Unlit Unlit Population (106) Total Population (106)
1 Burundi 88.0% 7,204.9 8,185.22 Rwanda 83.0% 8,004.2 9,641.63 Cambodia 79.4% 11,057.7 13,923.94 Myanmar (Burma) 69.8% 32,113.2 45,999.35 Laos 69.4% 4,416.8 6,366.86 Papua New Guinea 68.4% 3,466.4 5,064.27 Afghanistan 66.9% 20,783.2 31,081.08 Zaire 66.6% 41,511.2 62,354.99 Ethiopia 63.7% 47,606.2 74,787.410 Haiti 63.6% 5,047.9 7,940.911 Burkina Faso 59.4% 8,263.3 13,901.812 Madagascar 59.1% 11,047.5 18,701.813 Kenya 59.0% 20,799.4 35,243.214 Guinea 58.1% 5,645.2 9,723.115 Eritrea 57.4% 2,726.5 4,746.916 Sierra Leone 56.5% 3,327.4 5,890.617 Cameroon 54.9% 9,628.1 17,540.818 Uganda 54.2% 15,896.9 29,336.919 Nepal 54.1% 15,467.9 28,611.120 Angola 53.0% 6,345.2 11,962.921 Malawi 52.1% 6,927.6 13,289.022 Tanzania 50.5% 18,493.8 36,650.323 Mozambique 48.7% 9,865.9 20,250.924 Korea, North 48.6% 11,089.3 22,806.7
continued. . .
35
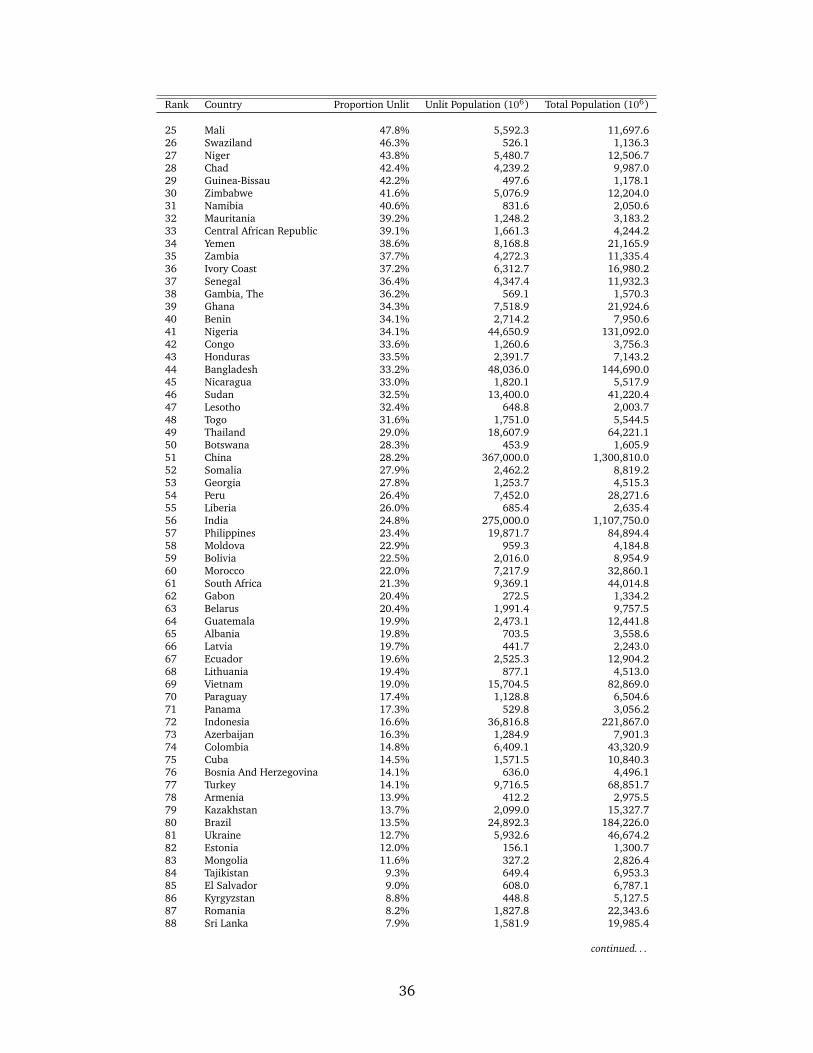
Rank Country Proportion Unlit Unlit Population (106) Total Population (106)
25 Mali 47.8% 5,592.3 11,697.626 Swaziland 46.3% 526.1 1,136.327 Niger 43.8% 5,480.7 12,506.728 Chad 42.4% 4,239.2 9,987.029 Guinea-Bissau 42.2% 497.6 1,178.130 Zimbabwe 41.6% 5,076.9 12,204.031 Namibia 40.6% 831.6 2,050.632 Mauritania 39.2% 1,248.2 3,183.233 Central African Republic 39.1% 1,661.3 4,244.234 Yemen 38.6% 8,168.8 21,165.935 Zambia 37.7% 4,272.3 11,335.436 Ivory Coast 37.2% 6,312.7 16,980.237 Senegal 36.4% 4,347.4 11,932.338 Gambia, The 36.2% 569.1 1,570.339 Ghana 34.3% 7,518.9 21,924.640 Benin 34.1% 2,714.2 7,950.641 Nigeria 34.1% 44,650.9 131,092.042 Congo 33.6% 1,260.6 3,756.343 Honduras 33.5% 2,391.7 7,143.244 Bangladesh 33.2% 48,036.0 144,690.045 Nicaragua 33.0% 1,820.1 5,517.946 Sudan 32.5% 13,400.0 41,220.447 Lesotho 32.4% 648.8 2,003.748 Togo 31.6% 1,751.0 5,544.549 Thailand 29.0% 18,607.9 64,221.150 Botswana 28.3% 453.9 1,605.951 China 28.2% 367,000.0 1,300,810.052 Somalia 27.9% 2,462.2 8,819.253 Georgia 27.8% 1,253.7 4,515.354 Peru 26.4% 7,452.0 28,271.655 Liberia 26.0% 685.4 2,635.456 India 24.8% 275,000.0 1,107,750.057 Philippines 23.4% 19,871.7 84,894.458 Moldova 22.9% 959.3 4,184.859 Bolivia 22.5% 2,016.0 8,954.960 Morocco 22.0% 7,217.9 32,860.161 South Africa 21.3% 9,369.1 44,014.862 Gabon 20.4% 272.5 1,334.263 Belarus 20.4% 1,991.4 9,757.564 Guatemala 19.9% 2,473.1 12,441.865 Albania 19.8% 703.5 3,558.666 Latvia 19.7% 441.7 2,243.067 Ecuador 19.6% 2,525.3 12,904.268 Lithuania 19.4% 877.1 4,513.069 Vietnam 19.0% 15,704.5 82,869.070 Paraguay 17.4% 1,128.8 6,504.671 Panama 17.3% 529.8 3,056.272 Indonesia 16.6% 36,816.8 221,867.073 Azerbaijan 16.3% 1,284.9 7,901.374 Colombia 14.8% 6,409.1 43,320.975 Cuba 14.5% 1,571.5 10,840.376 Bosnia And Herzegovina 14.1% 636.0 4,496.177 Turkey 14.1% 9,716.5 68,851.778 Armenia 13.9% 412.2 2,975.579 Kazakhstan 13.7% 2,099.0 15,327.780 Brazil 13.5% 24,892.3 184,226.081 Ukraine 12.7% 5,932.6 46,674.282 Estonia 12.0% 156.1 1,300.783 Mongolia 11.6% 327.2 2,826.484 Tajikistan 9.3% 649.4 6,953.385 El Salvador 9.0% 608.0 6,787.186 Kyrgyzstan 8.8% 448.8 5,127.587 Romania 8.2% 1,827.8 22,343.688 Sri Lanka 7.9% 1,581.9 19,985.4
continued. . .
36
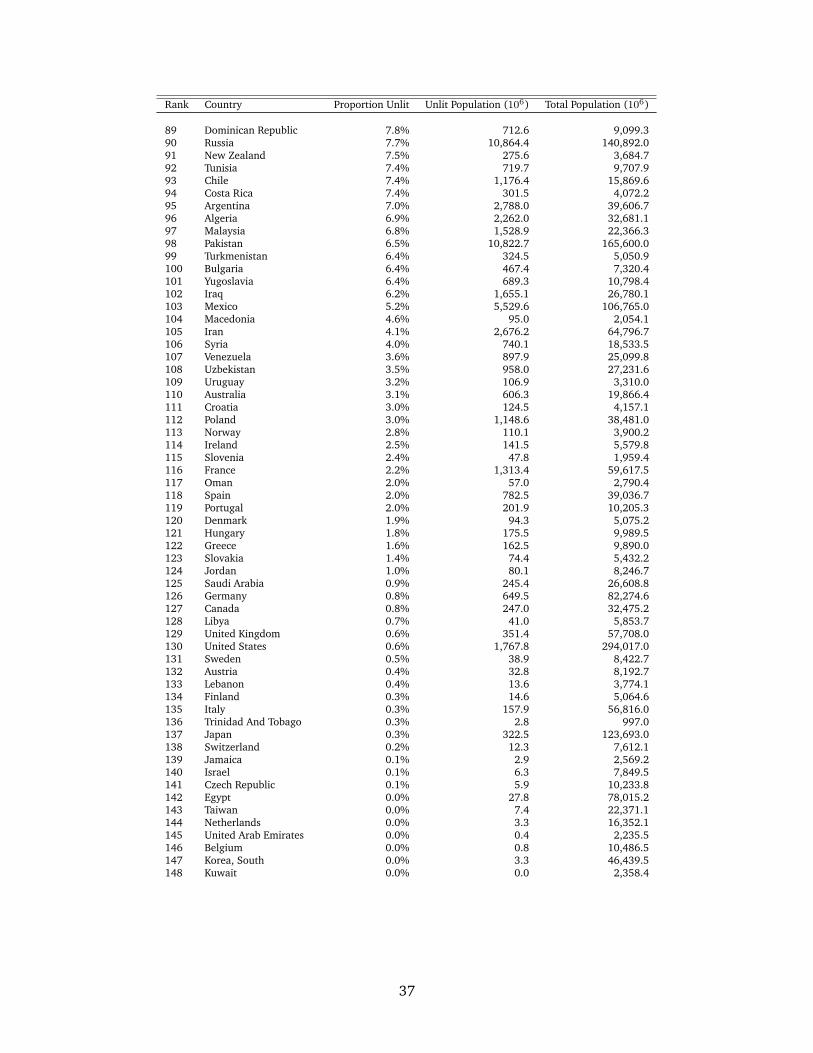
Rank Country Proportion Unlit Unlit Population (106) Total Population (106)
89 Dominican Republic 7.8% 712.6 9,099.390 Russia 7.7% 10,864.4 140,892.091 New Zealand 7.5% 275.6 3,684.792 Tunisia 7.4% 719.7 9,707.993 Chile 7.4% 1,176.4 15,869.694 Costa Rica 7.4% 301.5 4,072.295 Argentina 7.0% 2,788.0 39,606.796 Algeria 6.9% 2,262.0 32,681.197 Malaysia 6.8% 1,528.9 22,366.398 Pakistan 6.5% 10,822.7 165,600.099 Turkmenistan 6.4% 324.5 5,050.9100 Bulgaria 6.4% 467.4 7,320.4101 Yugoslavia 6.4% 689.3 10,798.4102 Iraq 6.2% 1,655.1 26,780.1103 Mexico 5.2% 5,529.6 106,765.0104 Macedonia 4.6% 95.0 2,054.1105 Iran 4.1% 2,676.2 64,796.7106 Syria 4.0% 740.1 18,533.5107 Venezuela 3.6% 897.9 25,099.8108 Uzbekistan 3.5% 958.0 27,231.6109 Uruguay 3.2% 106.9 3,310.0110 Australia 3.1% 606.3 19,866.4111 Croatia 3.0% 124.5 4,157.1112 Poland 3.0% 1,148.6 38,481.0113 Norway 2.8% 110.1 3,900.2114 Ireland 2.5% 141.5 5,579.8115 Slovenia 2.4% 47.8 1,959.4116 France 2.2% 1,313.4 59,617.5117 Oman 2.0% 57.0 2,790.4118 Spain 2.0% 782.5 39,036.7119 Portugal 2.0% 201.9 10,205.3120 Denmark 1.9% 94.3 5,075.2121 Hungary 1.8% 175.5 9,989.5122 Greece 1.6% 162.5 9,890.0123 Slovakia 1.4% 74.4 5,432.2124 Jordan 1.0% 80.1 8,246.7125 Saudi Arabia 0.9% 245.4 26,608.8126 Germany 0.8% 649.5 82,274.6127 Canada 0.8% 247.0 32,475.2128 Libya 0.7% 41.0 5,853.7129 United Kingdom 0.6% 351.4 57,708.0130 United States 0.6% 1,767.8 294,017.0131 Sweden 0.5% 38.9 8,422.7132 Austria 0.4% 32.8 8,192.7133 Lebanon 0.4% 13.6 3,774.1134 Finland 0.3% 14.6 5,064.6135 Italy 0.3% 157.9 56,816.0136 Trinidad And Tobago 0.3% 2.8 997.0137 Japan 0.3% 322.5 123,693.0138 Switzerland 0.2% 12.3 7,612.1139 Jamaica 0.1% 2.9 2,569.2140 Israel 0.1% 6.3 7,849.5141 Czech Republic 0.1% 5.9 10,233.8142 Egypt 0.0% 27.8 78,015.2143 Taiwan 0.0% 7.4 22,371.1144 Netherlands 0.0% 3.3 16,352.1145 United Arab Emirates 0.0% 0.4 2,235.5146 Belgium 0.0% 0.8 10,486.5147 Korea, South 0.0% 3.3 46,439.5148 Kuwait 0.0% 0.0 2,358.4
37