Embed Size (px)
Citation preview
1
Eastern Economic Journal, Vol. 29, No. 1, Winter 2003
Ludovic Comeau: Lewis Center, Suite 200, DePaul University, 25 East Jackson Boulevard, Chicago,IL 60604. E-mail: [email protected]
DEMOCRACY AND GROWTH:
A RELATIONSHIP REVISITED
Ludovic Comeau, Jr.DePaul University
INTRODUCTION
The potential effects of political regimes on economic growth have been intenselyanalyzed. Starting with the work by Adelman and Morris [1967], economists haveconcurred that the standard of living in a society is a direct result of the dynamicinterdependence of economic, political, and social forces. They admit the importanceof valid political structures and social cohesion for good economic health, in additionto sound macroeconomic policies. However, several issues cause this accord to sinkinto disagreement. The following are among the questions at the core of the debate: Isthe nature of political regimes (regime type) a significant determinant of economicperformance? In other words, does it matter whether the regime is democratic orauthoritarian? Or would sociopolitical stability, in fact, be what really counts?
Two broadly opposing views fail to reach a consensus on the authoritative an-swers to these questions.1 Advocates of democracy regard political liberties to be nec-essary to achieve sustained and equitable growth. In their view, democratic featuressuch as political pluralism, the system of institutional checks and balances, and theperiodic renewal of policymakers through elections protect the economic system againstabusive or predatory behaviors typical of most authoritarian regimes. The democraticprocess is viewed as more suitable to economic prosperity because it can better nur-ture civil liberties and secure property and contract rights. Consequently, it providesagents with incentives to undertake investments and to seek to maximize welfare.Democracy makes it possible for individuals to examine opportunity costs freely, toengage in the entrepreneurial initiatives of their choice, and to benefit fully from thefruits of their labor.
In opposition to that perspective is the proposition that democratic regimes ham-per growth because of their short-term focus. According to adherents to that view,elected officials tend to be shortsighted because they long for popular approval andsuccess in the next election, making them exceedingly receptive to all sorts of pres-sure, and inclined to yield to calls for immediate consumption. Krueger [1974] arguesthat actions by private pressure groups and lobbying can affect people’s perception ofthe economic game. The market mechanism is held in suspicion, and resource alloca-tion is considered to be the result of a lottery where lucky (successful) rent-seekers
2 EASTERN ECONOMIC JOURNAL
become rich while the poor are unlucky players excluded from the benefit of rentseeking. The democratic process is therefore regarded as typically incapable of pursu-ing policies needed to unleash the forces of economic growth because such policiesmay limit political and civil liberties, which precisely defeats the democratic purpose.This reduces investment and makes it difficult to achieve sustained growth. Hencethe process is a fundamental weakness of democratic regimes that, as suggested bytheir critics, causes their economies to perform more poorly than authoritarian re-gimes. The latter, on the contrary, are insulated from the constraints of redistribu-tive politics and have enough elbowroom to enact optimal policies aimed at achievinglong-term growth. Also, as residual claimants to their countries’ national wealth,autocrat policymakers (dictators) have an “encompassing interest” in furtheringgrowth through the provision of domestic tranquility and other public goods thatincrease productivity and output and, as a result, their share of national income[Olson, 1982; McGuire and Olson, 1996].
Democracy advocates reject this line of argument. They do not consider the some-what rare experience of higher rates of growth under the authoritarian rule to be anindication of any superiority over the democratic rule. For them, economic successunder autocracy is incapable of withstanding the test of sustainability because it oc-curs in an inequitable environment, laden with repressed discontent. Frustrationsbuild up, gradually undermine the apparent sturdiness of the macroeconomy and,ultimately, burst into flames of sociopolitical instability. This hampers long-run growth.This outcome is avoidable only if, after the country has come through the early stagesof economic development, the polity manages to implement a transition toward de-mocracy, like in South Korea and Taiwan. Democracy advocates also point to thedamages predatory or incompetent (anarchistic) authoritarian regimes have inflictedon their countries historically. This holds true even for the rational (but self-inter-ested) autocratic ruler who has eliminated anarchy and provides a peaceful order andother basic public goods to tax-generating subjects to give them an incentive to keepgenerating taxable income. The promises of these autocrats to foster long-run eco-nomic performance are not absolutely credible because their planning horizon is notindefinitely long. In extreme cases, an otherwise rational ruler who is led at a certainpoint in time to fear for his regime’s longevity might end up behaving like a predatorybandit (confiscation of private property, abrogation of contracts, etc.), with no con-cern for the economic repercussions of his acts [Olson, 1993]. At the limit, the factthat within the class of nondemocratic regimes, the poorly performing ones customar-ily wreak havoc on their economies while substantially outnumbering the few highlyperforming ones (such as most East Asian Tigers two decades ago), does little to helpthe case of authoritarianism.
In retrospect, one distinguishing feature of the empirical literature on growthand democracy is its lack of certainty with regard to the nature of the relationship. Inthat respect, besides the two broad perspectives presented earlier in this study, thereis also a third viewpoint that casts doubt on the very existence of any relationshipbetween regime type and economic growth. What really matters, according to thisapproach, is the effectiveness of policies implemented and the stability, rather thantype, of the regime. Theoretically, political instability creates uncertainty about the
3DEMOCRACY AND GROWTH: A RELATIONSHIP REVISITED
future orientation of governance and renders economic agents reluctant to engage inprojects that they have come to perceive as exceptionally risky. This causes privateresources in the economy (both physical and human capital) to expatriate and relo-cate in less erratic environments, which hinders investment and growth.
The sources of the divergence still merit thorough investigation. This study re-visits the issue in the context of the 1970s and 1980s.2 It introduces the concept ofinitial democratic capital, and argues that several other factors, besides the type ofthe political regime per se, contribute to the influence of the political economy ongrowth. Among those factors, the nonlinearity of the growth/regime-type relation-ship, the stability of the political regime, and the presence of an initial democraticcapital seem crucial. The findings show that the explanatory power of the neoclassi-cal growth model adopted in this study is strengthened with the addition of proxiesfor regime type, regime stability, the initial level of political rights, initial democraticcapital, the level of economic freedom, the stock of human capital, and country loca-tion (that is, the various regions of the world where the 82 countries retained in thesample are located3). The robustness of the relationships under study is also ana-lyzed.
THEORETICAL FRAMEWORK
This paper implements a comprehensive approach to the analysis of the interplaybetween regime type and economic growth. In addition to the types of political re-gimes prevailing in the period of study itself, the political legacy from previous yearsis also accounted for. The basic hypothesis is that regime type, whether democratic orautocratic, is likely the result of a relatively prolonged institutionalization processwhereby the underlying structural arrangements become stabilized and effective [Hun-tington, 1968]. Consequently, contrary to most studies, it is posited here that theconceptualization of the regime-type/economic-growth relationship should go beyondthe assessment of the average level of democracy (or autocracy) over the period stud-ied. It is important to detect accurately any political legacy a country might haveinherited from earlier periods. I refer to this historical background as the initial demo-cratic capital.
Relevance of Initial Democratic Capital
This study is not the first to espouse the idea of accounting for political tradition,although, as will be seen, the conceptualization and measurement of the politicaltradition adopted here is different from previous research and is new to this litera-ture. Other studies have looked at variables such as a nation’s colonial heritage todetermine the impact of the latter on the status of political freedom. Lipset et al.[1993] finds countries that were British colonies to be more likely to have democracythrough the 1970s than countries formerly ruled by other colonial powers. But therelationships are not significant for the 1980s. Barro [1996] argues that the formerpossessions of Britain and Spain are substantially more democratic than are those ofFrance, Portugal, or other countries. However, he concludes that the breakdown amongdifferent colonizers is irrelevant and colonial history is insignificant for democracy
4 EASTERN ECONOMIC JOURNAL
when measures of the standard of living (such as schooling and infant mortality) areheld constant.
Using the colonial experience as an indicator of a nation’s political tradition hassome intrinsic conceptual problems. Due to fierce competition among colonial powers,a number of nations have experienced a succession of colonial administrations overtime. The fact that a competitor would prevail, usually after throwing its rivals out ofa disputed territory, does not necessarily imply that the losers left behind no impact.Therefore, it might not be appropriate to attribute the entirety of a nation’s politicalheritage before independence to the one predominant colonial ruler. Moreover, colo-nial legacy varies widely across countries both in its attributes and its persistence.Nations have been freed at different points over a fairly long span of time, from late inthe eighteenth century (the United States became independent in 1776) to very latein the twentieth century (the former soviet republics became independent in the 1990s).Differentiation on the basis of the length of the self-governance period seems war-ranted when evaluating the impact of colonization on political freedom. This impactis likely to fade as the period of self-governance extends over time. This may helpexplain why, as reported earlier, Lipset et al. [1993] found colonial influence to besignificant in the 1970s but not in the 1980s. Another important point may be thepermeability of the ruler/ruled relationship (that is, the extent to which a colonizingpower cared to instill useful skills into those it colonized). It is possible that the formerBritish colonies were found to have benefited somewhat from their exposure to theBritish democratic principles because they were administered in a way that allowedthem to learn and later take the first steps toward democracy. Or, alternatively, theBritish may have left their colonies with a significant endowment of administrativecapacity, making it possible for the new nations to organize and operate in a cadremore hospitable to democratic principles.4
This study develops the concept of initial democratic capital to represent moreaccurately the impact of the political tradition of a nation on economic performance.The starting point of this approach is its account of a country’s legacy of politicalfreedom inherited from the years immediately prior to the sample period (that is, theyears preceding the 1970s up to the two or three previous decades). These may havebeen years of colonial rule, for example in the case of African countries that becameindependent in the 1960s, or they may have been years of self-governance in the caseof countries that were emancipated relatively long before or have always been inde-pendent. Therefore, the focus of inquiry is redirected away from the exclusive consid-eration of the colonial heritage, and toward the representation of a nation’s “own”political background, regardless of its source, which may or may not stem from colo-nial legacy. Initial democratic capital is intended to capture the many instances whena nation has been independent long enough to build its own (post-colonial) politicaltradition.
Initial democratic capital is measured as the level of democracy in the sampleperiod’s first year. As an indicator of a country’s distinctive initial democratic endow-ment, initial democratic capital is denoted either high (for a country that had democ-racy in 1972) or low (for a country that was autocratic at that time). Political freedomin a country that was a democracy at the start of the sample period is assumed to
5DEMOCRACY AND GROWTH: A RELATIONSHIP REVISITED
have been improving more or less steadily in the recent past. On the contrary, acountry that was autocratic in 1972 is likely to have failed to implement a democratictradition in the run-up to the period studied. The former is thus assumed to havestarted the sample period with a high level of initial democratic capital, and the latterwith a low level of initial democratic capital. The higher the starting level of politicalrights (or the higher the initial democratic capital), the stronger the democratic tradi-tion accumulated in earlier years, the more favorable democracy is likely to be forgrowth in the sample years (1972-1989).5 With this in mind, this analysis assumesthat cross-country differentials in growth rates may also be explained by early differ-ences in democratic capital. This idea is similar to the neoclassical assumption of animpact of early levels of national income on subsequent levels of national income,which is the basis of the conditional convergence theory [Barro and Sala-í-Martin,1995].
In addition to the types of political regime prevailing in the sample period and tocountries’ initial democratic capital, the following are accounted for as growth-im-pacting factors:
• Nonlinearity of the regime-type/economic-growth relationship. Previous researchfound that the type of political regime might have a different effect on growthdepending on the stage of economic development. Building on prior separate studiesby Jackman, O’Donnell, and Kurth, Lipset [1993] postulates that the relationshipis curvilinear (an N-shaped curve), which suggests the existence of an upper thresh-old of economic development beyond which the chances for more democracy arequite low. Other studies found that at low levels of political rights, an expansionof rights stimulates growth; however, further expansion of political rights towardthe highest levels of democracy causes a relative erosion of the growth potential[Barro, 1996; Comeau, 1997]. Arguably, enhanced political liberties trigger en-hanced pressures to satisfy social and welfare demands and to redistribute na-tional income, which would be detrimental to productive investments;
• Stability of the political regime. Among the determinants of economic growth,the stability of the political regime may be as important as its type. Consequently,a complete representation of the workings of the sociopolitical framework mayrequire, in addition to the regime-type proxy, a measure for sociopolitical insta-bility as a complementary explanatory variable in the model.
The Model
The following production function is used:
(1) yt = At f(kt)
where y is output per capita, k is capital stock per capita, f is a neoclassical produc-tion function exhibiting positive and diminishing marginal returns [Barro and Sala-í-Martin, 1995], and At is an overall productivity factor. Assuming that y0 is the ini-tial level of income, n is population growth rate, and s is investment in physicalcapital (saving rate), the rate of growth of y can be formulated as
6 EASTERN ECONOMIC JOURNAL
(2) .y/y = g(y0, n, s, A)
with partial derivatives g1<0, g2<0, g3>0, g4>0 [Mankiw et al., 1992]. A caveat is inorder. The overall productivity factor is usually assumed to produce positive mar-ginal returns for growth inasmuch as it captures the impact of technology. However,for the purpose of this study it also captures the effects of sociopolitical factors thatmight either favor or reduce growth. Specifically:
(3) A = A(regime type, regime stability, initial level of political rights,initial democratic capital, human capital, economic freedom)
I hypothesize that all partial derivatives are positive, provided that regime typeis democratic. This extended version of the neoclassical growth model assumes thatthe neoclassical variables (y0, n, s, A) augmented with sociopolitical factors determinethe rate of growth of the economy in the process of convergence toward the steady-state level of income.
Methodology of Estimation
The existing evidence is disparate enough to warrant legitimate concerns aboutthe robustness of findings regarding the interaction between the political economyand economic growth. More generally, serious doubts have been expressed with re-spect to the validity of an entire class of studies that have drawn more or less definiteconclusions about the mechanisms of long-run growth on the basis of empirical link-ages obtained through cross-country regressions. An extensive literature has comeup with over 50 theoretically acceptable economic policy, political, and institutionalexplanatory variables. However, each study ignores the vast majority of such vari-ables to consider only a very few, if not just one. To say the least, this does not helpachieve certainty as to what drives economic growth. As Levine and Renelt [1992]noted, most policy indicators utilized by researchers have a fragile relationship withlong-run economic growth. The relationships lack robustness, and specific factors wouldlose significance in the presence of small alterations in other factors. They proposethe use of a variant of Leamer’s [1983] extreme-bounds analysis to assess the robust-ness of results obtained from cross-section analyses. This study’s methodology forestimation of the model follows from their approach.
The empirical counterpart of the extended neoclassical model (equation 2) is asfollows:
(4) .y/y = �1N + �2P + �3Z + u
where N is a vector comprised of a subset of variables that are generally included ingrowth regressions because they are theoretically important for growth: for the pur-pose of this paper, such variables are the basic neoclassical regressors (y0, n, s); P is avector including the subset of variables of interest: the proxies for regime type,sociopolitical stability, initial level of political rights, and initial democratic capital; Z
7DEMOCRACY AND GROWTH: A RELATIONSHIP REVISITED
is a vector of variables that have, according to the literature, displayed a significantrelationship with growth: the proxies for economic freedom and human capital, alongwith a number of regional dummies; and u is an error term.
The empirical analysis is conducted in the form of a sensitivity analysis. Becausethe N-variables are usually accounted for, I focus on examining the effects of the P-and Z-variables on growth. The coefficients for the neoclassical (N) and political (P)variables are estimated first (Table 2), followed by estimations where various combi-nations of the other growth-related (Z) variables are added (Table 3). The relation-ship between the political structure and growth will be considered as robust if, inde-pendent of variations in the choice of other growth-related variables included in dif-ferent versions of the regression, the political variables remain statistically signifi-cant while carrying the theoretically expected signs [De Haan and Siermann, 1998].Moreover, of importance to the analysis is the use of the other variables (Z-factors) asinstrumental variables to correct for potential endogeneity problems. Although,endogeneity should not be a major problem, particularly as it is typically less severein cross-sectional regressions with a length of period similar to this paper’s [Fischer,1993]. Nevertheless, in the case of investment, given widely expressed endogeneityconcerns in the literature, the empirical analysis will perform a test to that effect.The variables comprised in the three vectors are listed below (see Appendix B forfurther details and sources).
Neoclassical variables (N). The neoclassical variables include: starting level ofreal GDP per capita, population growth, and physical capital investment.
Political variables (P). There are five political variables: two representing re-gime type, two representing the political heritage, and one representing sociopoliticalinstability. They are constructed from the index of political rights of The Annual Sur-vey of Political Rights and Civil Liberties [Gastil and Freedom House, annual since1972]. I utilize the Gastil scale in its original format with 7 scores labeled from 1 to 7to convey the level of political freedom of countries, from most democratic (a score of1) to most autocratic (a score of 7). This methodology is contrary to other studies thathave converted the Gastil scale linearly to 0-1. Using the unaltered 1-7 scale makes iteasier to intuitively relate this study’s implications to any country’s political reality,based directly on its Gastil ranking (no need to decipher the corresponding Gastilscore of any freedom level expressed in the 0-1 scale).
The five political variables include the proxy for regime type, and its quadraticspecification. They comprise also the measure of the extent of political rights at thebeginning of the sample period (a measure of initial political endowment), and anindicator of initial democratic capital. The last political variable is the proxy forsociopolitical instability (which indicates the absence of stability). This proxy is thestandard deviation of the Gastil political rights series. It is conceptually differentfrom other proxies proposed in the literature, such as the number of revolutions,attempted coups d’état, political assassinations, and executive turnover [Londreganand Poole, 1990; Barro, 1991; Alesina et al., 1996]. This analysis finds these usualindicators of sociopolitical instability somewhat lacking.6 Because it is based on the
8 EASTERN ECONOMIC JOURNALT
AB
LE
1C
orre
lati
on M
atri
x(A
vera
ges
for
1972
-198
9, e
xcep
t fo
r In
itia
l In
com
e an
d I
nit
ial
Dem
ocra
tic
Cap
ital
a)
Gro
wth
Init
ial
Pop
ula
tion
Ph
ysic
alD
emoc
racy
Pol
itic
alIn
itia
lE
con
omic
Hu
man
Inco
me
Gro
wth
Cap
ital
Inst
abil
ity
Dem
ocra
tic
Fre
edom
Cap
ital
Inve
stm
ent
Cap
ital
Inve
stm
ent
(Bas
ic S
choo
lin
g)
Init
ial
inco
me
0.12
21
Pop
ula
tion
gro
wth
�0.
328
�0.
750
1P
hys
ical
cap
ital
in
vest
men
t0.
499
0.63
8�
0.55
81
Dem
ocra
cyb
0.28
60.
764
�0.
673
0.59
11
Pol
itic
al i
nst
abil
ity
�0.
147
�0.
394
0.24
2�
0.25
6�
0.27
51
Init
ial
dem
ocra
tic
capi
tal
0.21
50.
587
�0.
530
0.34
50.
784
�0.
349
1E
con
omic
fre
edom
0.36
10.
492
�0.
359
0.46
10.
382
�0.
275
0.34
71
Hu
man
ca
pita
l in
vest
men
t (b
asic
sch
ooli
ng)
0.27
40.
852
�0.
772
0.69
80.
712
�0.
313
0.54
00.
472
1H
um
an
capi
tal
inve
stm
ent
(hig
her
sch
ooli
ng)
0.18
20.
738
�0.
489
0.51
70.
571
�0.
252
0.41
70.
411
0.80
2
Nu
mbe
r of
obs
erva
tion
s: 8
2.a.
Th
ese
two
vari
able
s ca
ptu
re p
er c
apit
a in
com
e an
d th
e le
vel o
f dem
ocra
cy, r
espe
ctiv
ely,
at
the
begi
nn
ing
of t
he
sam
ple
peri
od (t
hat
is,
in 1
972)
. In
App
endi
xB
an
d T
able
s 2
and
3 in
itia
l in
com
e is
lab
eled
ST
AR
TG
DP
, an
d in
itia
l de
moc
rati
c ca
pita
l is
lab
eled
ST
AR
TD
EM
OC
.b.
Dem
ocra
cy is
th
e pr
oxy
for
regi
me
type
(RE
GT
YP
E in
App
endi
x B
an
d T
able
s 2
and
3) v
iew
ed fr
om t
he
stan
dpoi
nt
of it
s re
pres
enta
tion
of t
he
aver
age
degr
eeof
dem
ocra
cy o
f po
liti
cal
regi
mes
in
th
e sa
mpl
e pe
riod
.In
App
endi
x B
an
d T
able
s 2
and
3 po
pula
tion
gro
wth
is P
OP
, ph
ysic
al c
apit
al in
vest
men
t is
IN
VE
ST
, pol
itic
al in
stab
ilit
y is
IN
ST
AB
ILIT
Y, e
con
omic
free
dom
is E
CO
NF
RE
E, b
asic
sch
ooli
ng
is L
OW
HU
MC
AP
, an
d h
igh
er s
choo
lin
g is
HIG
HH
UM
CA
P.
9DEMOCRACY AND GROWTH: A RELATIONSHIP REVISITED
variability of the Gastil series, this proxy is more likely than its competitors to reflectthe effect of stability-disturbing events that are not as obvious as revolutions or ex-ecutive turnover. Methodologically, Freedom House’s 7-class political rights series isderived to capture the impact on the sociopolitical environment of each nation sur-veyed of all “real world situations caused by state and nongovernmental factors” [Gastiland Freedom House, 2000, 582]. The availability of seven classes to rank countries(instead of only two or three) allows the survey more flexibility to render nuances inthe status of political freedom across nations.7 Similarly, this flexibility makes it pos-sible for the survey to reflect moderate year-to-year fluctuations in freedom within anation by allowing a democratic (or autocratic) regime to oscillate between adjacentclasses.8 In the limit, the standard deviation is a valid assessor of this activity that, athigher intensity, is viewed as indicating higher instability.9
Other variables (Z). Other variables related to growth include the proxy foreconomic freedom, and its quadratic specification; proxies for low-level and high-levelhuman capital; and the regional dummies for Sub-Saharan Africa, Latin Americaand the Caribbean, North Africa and the Middle East, Asia and the Pacific, andNorth America and Europe.
EMPIRICAL RESULTS
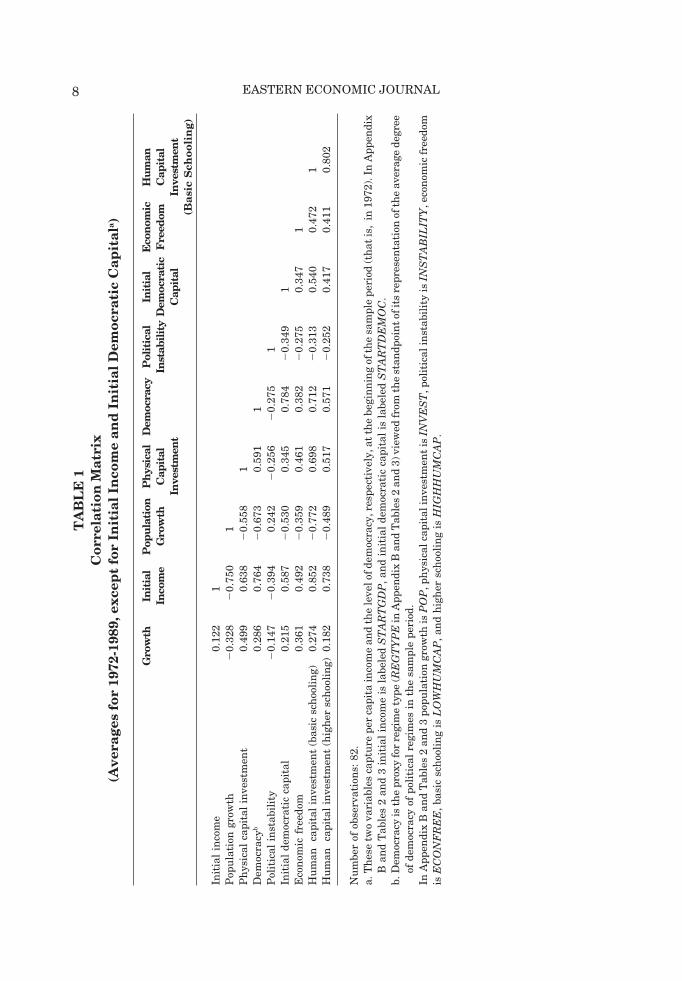
Table 1 provides a description of simple correlations between the main variables.The first column shows the correlations between growth and neoclassical and institu-tional variables. The outcomes are as expected. Democracy, initial democratic capi-tal, economic freedom, and human capital are positively associated with growth. Onthe contrary, political instability and population growth are negatively correlatedwith all the other variables, but are positively correlated with each other. The highpositive correlation between democracy and initial democratic capital (0.784) pointsto the persistence of democracy, and supports the hypothesis that a significant demo-cratic endowment at the start of the sample period is associated with significant lev-els of political rights in subsequent years. A similarly strong positive correlation ex-ists between democracy and initial income (0.764), and between democracy and basicor low-level human capital (0.712). These strong correlations, which are all statisti-cally significant, provide insight into growth-impacting mechanisms in the model.For instance, democracy correlates positively with physical capital investment (0.591)which itself is positively associated with growth (0.499), suggesting that democracycorrelates positively with growth both directly (efficiency effect with correlation at0.286) and indirectly through investment (accumulation effect with correlation at0.591).
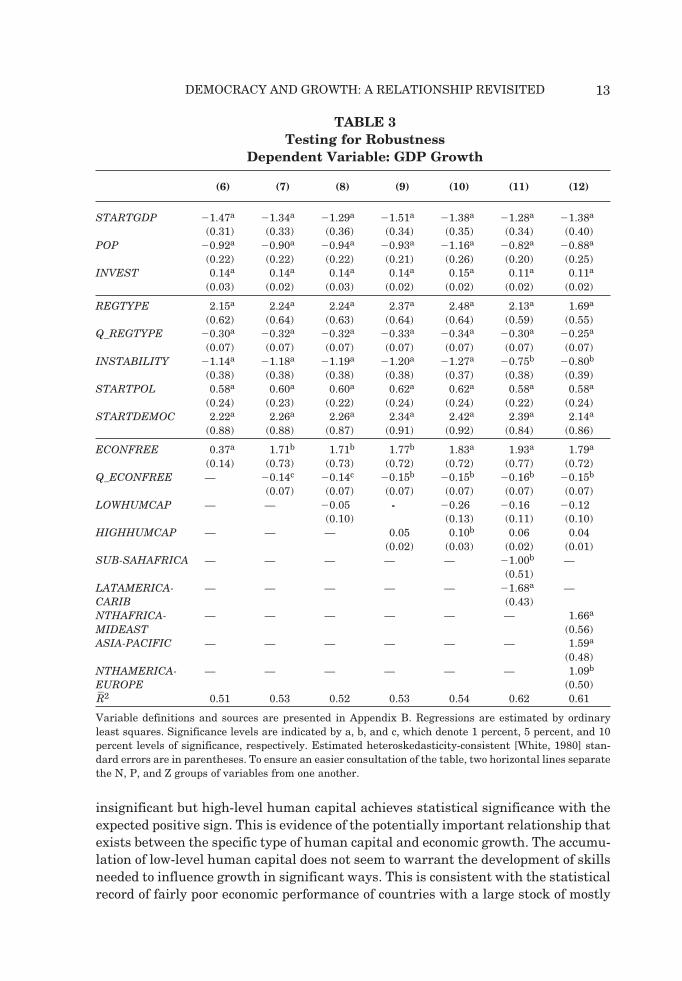
Impact of Regime Type, Regime Stability, and Initial Democratic Capital
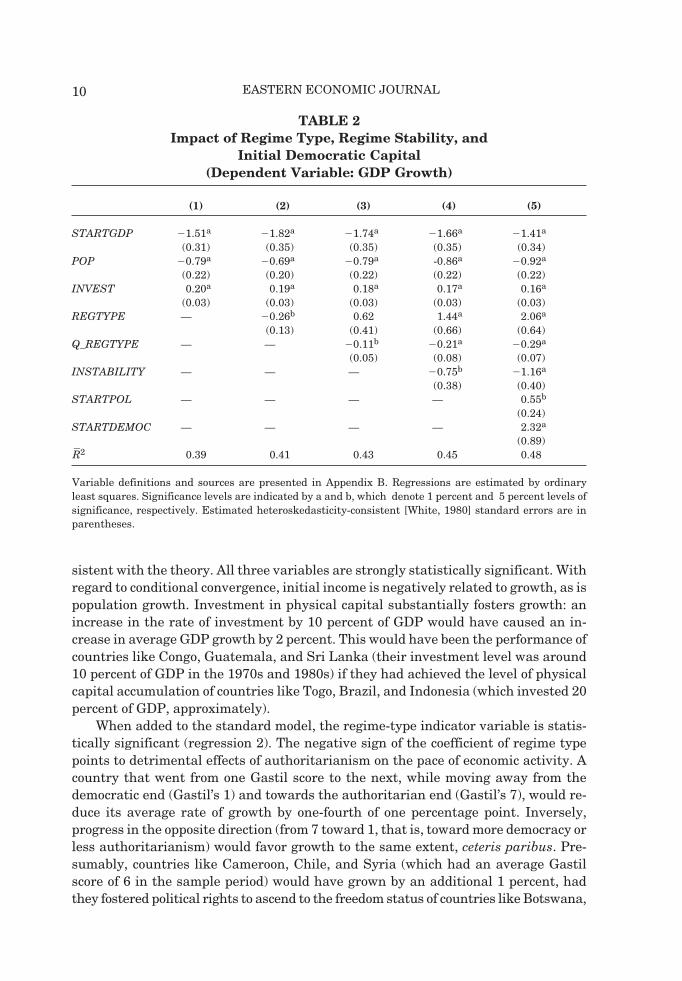
Table 2 presents five linear and quadratic specifications of equation (2). Regres-sion (1) is the basic neoclassical growth regression with initial income, investment inphysical capital, and population growth as independent variables. Its results are con-
10 EASTERN ECONOMIC JOURNAL
sistent with the theory. All three variables are strongly statistically significant. Withregard to conditional convergence, initial income is negatively related to growth, as ispopulation growth. Investment in physical capital substantially fosters growth: anincrease in the rate of investment by 10 percent of GDP would have caused an in-crease in average GDP growth by 2 percent. This would have been the performance ofcountries like Congo, Guatemala, and Sri Lanka (their investment level was around10 percent of GDP in the 1970s and 1980s) if they had achieved the level of physicalcapital accumulation of countries like Togo, Brazil, and Indonesia (which invested 20percent of GDP, approximately).
When added to the standard model, the regime-type indicator variable is statis-tically significant (regression 2). The negative sign of the coefficient of regime typepoints to detrimental effects of authoritarianism on the pace of economic activity. Acountry that went from one Gastil score to the next, while moving away from thedemocratic end (Gastil’s 1) and towards the authoritarian end (Gastil’s 7), would re-duce its average rate of growth by one-fourth of one percentage point. Inversely,progress in the opposite direction (from 7 toward 1, that is, toward more democracy orless authoritarianism) would favor growth to the same extent, ceteris paribus. Pre-sumably, countries like Cameroon, Chile, and Syria (which had an average Gastilscore of 6 in the sample period) would have grown by an additional 1 percent, hadthey fostered political rights to ascend to the freedom status of countries like Botswana,
TABLE 2Impact of Regime Type, Regime Stability, and
Initial Democratic Capital(Dependent Variable: GDP Growth)
(1) (2) (3) (4) (5)
STARTGDP �1.51a �1.82a �1.74a �1.66a �1.41a
(0.31) (0.35) (0.35) (0.35) (0.34)POP �0.79a �0.69a �0.79a -0.86a �0.92a
(0.22) (0.20) (0.22) (0.22) (0.22)INVEST 0.20a 0.19a 0.18a 0.17a 0.16a
(0.03) (0.03) (0.03) (0.03) (0.03)REGTYPE — �0.26b 0.62 1.44a 2.06a
(0.13) (0.41) (0.66) (0.64)Q_REGTYPE — — �0.11b �0.21a �0.29a
(0.05) (0.08) (0.07)INSTABILITY — — — �0.75b �1.16a
(0.38) (0.40)STARTPOL — — — — 0.55b
(0.24)STARTDEMOC — — — — 2.32a
(0.89)�R2 0.39 0.41 0.43 0.45 0.48
Variable definitions and sources are presented in Appendix B. Regressions are estimated by ordinaryleast squares. Significance levels are indicated by a and b, which denote 1 percent and 5 percent levels ofsignificance, respectively. Estimated heteroskedasticity-consistent [White, 1980] standard errors are inparentheses.
11DEMOCRACY AND GROWTH: A RELATIONSHIP REVISITED
the Dominican Republic, and India (whose average Gastil score was 2). This result,however, casts doubt on the linearity of the democracy/growth linkage. Moving froma Gastil score of 6 to a Gastil score of 2 (a substantial change in political freedom)would generate only a one percentage point increase in growth rate. Also, this evolu-tion would most likely come with a surge of instability, which would defeat the under-lying other things equal assumption. Hence the need of a better specification for themodel.
The addition of the quadratic specification of regime type provides evidence thatthe relationship between growth and regime type in fact may not be linear (regres-sion 3). The political economy is likely to affect economic performance differently,depending on the stage of economic development. Interestingly, in regression (3) re-gime type loses statistical significance in the presence of its statistically significantquadratic version. This outcome may signal that nonlinearity actually dominates theunderlying relationship. The negative sign of the coefficient on the quadratic specifi-cation of regime type suggests that regime type gives rise to declining marginal re-turns for economic growth—more democracy leads to more growth, but at a dimin-ishing rate.
With the inclusion of the indicator of instability (regression 4), the explanatorypower of the model and the statistical significance of the two regime-type proxies arestrengthened. The presence of sociopolitical instability contributes to stronger effectsof regime type on growth, as evidenced by the doubling of the size of the coefficientson regime type and its quadratic form from regression (3) to regression (4). Regres-sion (5) adds initial levels of political rights and democratic capital to the model. Thevariable for the initial level of political rights captures the extent to which peoplebenefited from political freedom at the start of the sample period (1972), withoutdifferentiating between democratic and authoritarian regimes. It is a measure ofinitial political endowment. The variable for initial democratic capital is a binaryregressor that splits the sample countries into two groups in 1972—democratic andnon-democratic (the latter being the omitted category). The purpose of this variableis to show whether a tradition of democracy helped countries do better economically.
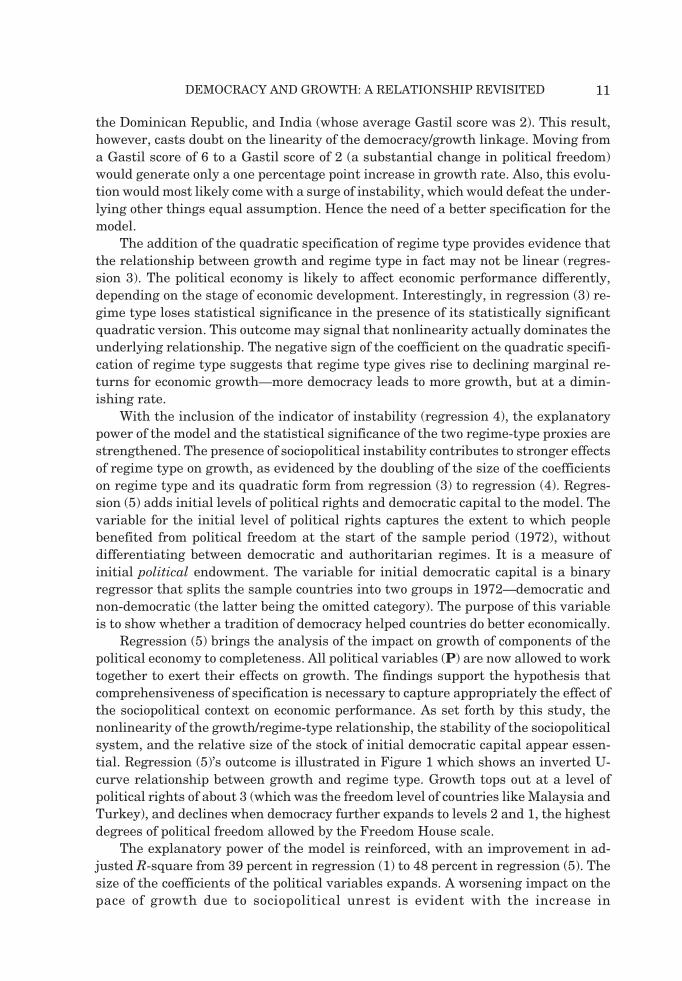
Regression (5) brings the analysis of the impact on growth of components of thepolitical economy to completeness. All political variables (P) are now allowed to worktogether to exert their effects on growth. The findings support the hypothesis thatcomprehensiveness of specification is necessary to capture appropriately the effect ofthe sociopolitical context on economic performance. As set forth by this study, thenonlinearity of the growth/regime-type relationship, the stability of the sociopoliticalsystem, and the relative size of the stock of initial democratic capital appear essen-tial. Regression (5)’s outcome is illustrated in Figure 1 which shows an inverted U-curve relationship between growth and regime type. Growth tops out at a level ofpolitical rights of about 3 (which was the freedom level of countries like Malaysia andTurkey), and declines when democracy further expands to levels 2 and 1, the highestdegrees of political freedom allowed by the Freedom House scale.
The explanatory power of the model is reinforced, with an improvement in ad-justed R-square from 39 percent in regression (1) to 48 percent in regression (5). Thesize of the coefficients of the political variables expands. A worsening impact on thepace of growth due to sociopolitical unrest is evident with the increase in
12 EASTERN ECONOMIC JOURNAL
INSTABILITY’s coefficient from �0.75 in regression (4) to �1.16 in regression (5),and with an increase in the confidence level from 5 percent to 1 percent. According toregression (5), a democratic legacy bodes well for economic prosperity: the point esti-mate of the coefficient on STARTDEMOC implies that, compared to their authoritar-ian counterparts, countries that were democracies in the early 1970s subsequentlygrew by an additional 2.3 percentage points.
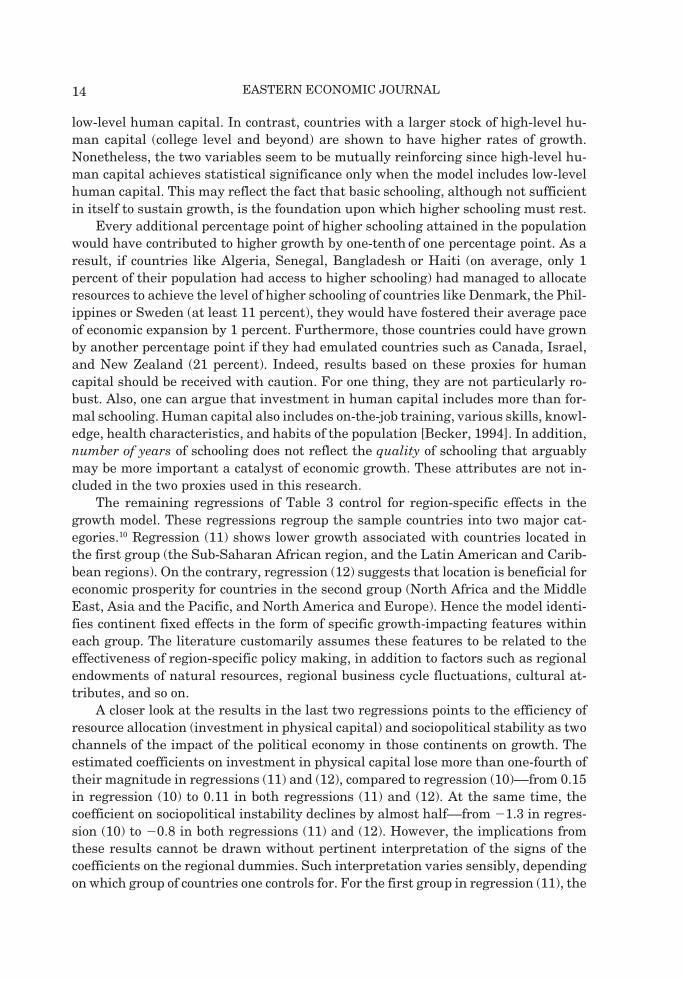
Testing for Robustness
This part of the analysis tests the robustness of the results obtained thus far.Table 3 shows the outcome of further augmenting the model with different combina-tions of the Z-variables.
Economic freedom is shown to foster growth (regression 6), holding all three char-acteristics of the political economy constant. An improvement in standing by threepoints within the 1-to-10 economic freedom scale would have caused the averagesample country to grow in the period by an additional 1 percent, approximately. Thiswould require that countries like Benin, Jamaica, Colombia, and Pakistan (averageeconomic freedom level of 4) to have been on a par with countries like Belgium,Panama, Singapore, and Malaysia (level 7). Regression (7) adds the quadratic speci-fication of economic freedom, and displays an outcome similar to that of regressions(4) and (5). As in the case of democracy, economic freedom maintains a nonlinearrelationship with growth, and gives rise to declining marginal returns for growth—more economic freedom increases the capacity of the economy to expand, but it doesso at a diminishing rate.
In regressions (8) to (10), the proxies for low-level human capital and high-levelhuman capital are added first alternately, then simultaneously. Regression (10) provesto be a somewhat better specification. Low-level human capital remains statistically
FIGURE 1Regime Type and Growth
0
0.5
1
1.5
2
2.5
3
3.5
4
7 6 5 4 3 2 1
Index of Political Rights (Autocracy=7; Democracy=1)
GD
P G
row
th R
ate
(P
erce
nt)
13DEMOCRACY AND GROWTH: A RELATIONSHIP REVISITED
insignificant but high-level human capital achieves statistical significance with theexpected positive sign. This is evidence of the potentially important relationship thatexists between the specific type of human capital and economic growth. The accumu-lation of low-level human capital does not seem to warrant the development of skillsneeded to influence growth in significant ways. This is consistent with the statisticalrecord of fairly poor economic performance of countries with a large stock of mostly
TABLE 3Testing for Robustness
Dependent Variable: GDP Growth
(6) (7) (8) (9) (10) (11) (12)
STARTGDP �1.47a �1.34a �1.29a �1.51a �1.38a �1.28a �1.38a
(0.31) (0.33) (0.36) (0.34) (0.35) (0.34) (0.40)POP �0.92a �0.90a �0.94a �0.93a �1.16a �0.82a �0.88a
(0.22) (0.22) (0.22) (0.21) (0.26) (0.20) (0.25)INVEST 0.14a 0.14a 0.14a 0.14a 0.15a 0.11a 0.11a
(0.03) (0.02) (0.03) (0.02) (0.02) (0.02) (0.02)
REGTYPE 2.15a 2.24a 2.24a 2.37a 2.48a 2.13a 1.69a
(0.62) (0.64) (0.63) (0.64) (0.64) (0.59) (0.55)Q_REGTYPE �0.30a �0.32a �0.32a �0.33a �0.34a �0.30a �0.25a
(0.07) (0.07) (0.07) (0.07) (0.07) (0.07) (0.07)INSTABILITY �1.14a �1.18a �1.19a �1.20a �1.27a �0.75b �0.80b
(0.38) (0.38) (0.38) (0.38) (0.37) (0.38) (0.39)STARTPOL 0.58a 0.60a 0.60a 0.62a 0.62a 0.58a 0.58a
(0.24) (0.23) (0.22) (0.24) (0.24) (0.22) (0.24)STARTDEMOC 2.22a 2.26a 2.26a 2.34a 2.42a 2.39a 2.14a
(0.88) (0.88) (0.87) (0.91) (0.92) (0.84) (0.86)
ECONFREE 0.37a 1.71b 1.71b 1.77b 1.83a 1.93a 1.79a
(0.14) (0.73) (0.73) (0.72) (0.72) (0.77) (0.72)Q_ECONFREE — �0.14c �0.14c �0.15b �0.15b �0.16b �0.15b
(0.07) (0.07) (0.07) (0.07) (0.07) (0.07)LOWHUMCAP — — �0.05 - �0.26 �0.16 �0.12
(0.10) (0.13) (0.11) (0.10)HIGHHUMCAP — — — 0.05 0.10b 0.06 0.04
(0.02) (0.03) (0.02) (0.01)SUB-SAHAFRICA — — — — — �1.00b —
(0.51)LATAMERICA- — — — — — �1.68a —CARIB (0.43)NTHAFRICA- — — — — — — 1.66a
MIDEAST (0.56)ASIA-PACIFIC — — — — — — 1.59a
(0.48)NTHAMERICA- — — — — — — 1.09b
EUROPE (0.50)�R2 0.51 0.53 0.52 0.53 0.54 0.62 0.61
Variable definitions and sources are presented in Appendix B. Regressions are estimated by ordinaryleast squares. Significance levels are indicated by a, b, and c, which denote 1 percent, 5 percent, and 10percent levels of significance, respectively. Estimated heteroskedasticity-consistent [White, 1980] stan-dard errors are in parentheses. To ensure an easier consultation of the table, two horizontal lines separatethe N, P, and Z groups of variables from one another.
14 EASTERN ECONOMIC JOURNAL
low-level human capital. In contrast, countries with a larger stock of high-level hu-man capital (college level and beyond) are shown to have higher rates of growth.Nonetheless, the two variables seem to be mutually reinforcing since high-level hu-man capital achieves statistical significance only when the model includes low-levelhuman capital. This may reflect the fact that basic schooling, although not sufficientin itself to sustain growth, is the foundation upon which higher schooling must rest.
Every additional percentage point of higher schooling attained in the populationwould have contributed to higher growth by one-tenth of one percentage point. As aresult, if countries like Algeria, Senegal, Bangladesh or Haiti (on average, only 1percent of their population had access to higher schooling) had managed to allocateresources to achieve the level of higher schooling of countries like Denmark, the Phil-ippines or Sweden (at least 11 percent), they would have fostered their average paceof economic expansion by 1 percent. Furthermore, those countries could have grownby another percentage point if they had emulated countries such as Canada, Israel,and New Zealand (21 percent). Indeed, results based on these proxies for humancapital should be received with caution. For one thing, they are not particularly ro-bust. Also, one can argue that investment in human capital includes more than for-mal schooling. Human capital also includes on-the-job training, various skills, knowl-edge, health characteristics, and habits of the population [Becker, 1994]. In addition,number of years of schooling does not reflect the quality of schooling that arguablymay be more important a catalyst of economic growth. These attributes are not in-cluded in the two proxies used in this research.
The remaining regressions of Table 3 control for region-specific effects in thegrowth model. These regressions regroup the sample countries into two major cat-egories.10 Regression (11) shows lower growth associated with countries located inthe first group (the Sub-Saharan African region, and the Latin American and Carib-bean regions). On the contrary, regression (12) suggests that location is beneficial foreconomic prosperity for countries in the second group (North Africa and the MiddleEast, Asia and the Pacific, and North America and Europe). Hence the model identi-fies continent fixed effects in the form of specific growth-impacting features withineach group. The literature customarily assumes these features to be related to theeffectiveness of region-specific policy making, in addition to factors such as regionalendowments of natural resources, regional business cycle fluctuations, cultural at-tributes, and so on.
A closer look at the results in the last two regressions points to the efficiency ofresource allocation (investment in physical capital) and sociopolitical stability as twochannels of the impact of the political economy in those continents on growth. Theestimated coefficients on investment in physical capital lose more than one-fourth oftheir magnitude in regressions (11) and (12), compared to regression (10)––from 0.15in regression (10) to 0.11 in both regressions (11) and (12). At the same time, thecoefficient on sociopolitical instability declines by almost half––from �1.3 in regres-sion (10) to �0.8 in both regressions (11) and (12). However, the implications fromthese results cannot be drawn without pertinent interpretation of the signs of thecoefficients on the regional dummies. Such interpretation varies sensibly, dependingon which group of countries one controls for. For the first group in regression (11), the
15DEMOCRACY AND GROWTH: A RELATIONSHIP REVISITED
negative regional dummy coefficients point to lower growth (possibly through lowerinvestment and higher instability). For the second group in regression (12), the posi-tive regional dummy coefficients indicate higher growth (possibly through higherinvestment and lower instability).
The outcome from regressions (11) and (12) suggests a more important role forinvestment than assumed by the neoclassical growth model. For the latter, invest-ment comes from an exogenous saving rate and is measured as a ratio of GDP. How-ever, many studies find evidence that, besides the positive impact of an exogenouslydetermined investment ratio on growth, there might exist a positive association be-tween the two factors whereby growth opportunities would favor investment [Barro,1996; Mankiw et al., 1992]. What are the implications for this study, in terms of pos-sible endogeneity of investment? A new run of regressions (11) and (12) is executedwithout investment in physical capital INVEST (not reported in Table 3). This leadsto a reduction in adjusted R-square by six percent, and a moderate increase in themagnitude of the coefficients on sociopolitical instability, initial political rights, andthe regional dummies. But the essential findings from the empirical analysis are notaltered in any significant manner.
The purpose in this sub-section was to assert the statistical soundness of theempirical outcomes of the political variables. The aim was to establish the credibilityof the results from Table 2 that found that the political (P) variables were believablecausal channels for economic growth. The seven regressions in Table 3 allowed forvariations in the conditioning of the model. Regardless of the other (Z) variables orthe combination of other (Z) variables utilized to augment the final political economymodel of regression (5), all political proxies remained strongly statistically signifi-cant. They consistently maintained robustness, even when investment in physicalcapital is not included, while the explanatory power of the model augmented in asteady fashion. This lends credence to the hypotheses set forth in this research re-garding the three features that were assumed critical in understanding the interac-tion between the political structure and economic performance.
CONCLUSION
This paper aimed to analyze underlying mechanisms by which components of thepolitical economy influence economic growth. It posited that the sociopolitical envi-ronment exhibits various characteristics that, to the extent that the data availableallow, should be accounted for if there is to be a credible explanation about the rela-tionship between that environment and growth. This analysis innovated with theintroduction of the concept of initial democratic capital, arguing that the politicalmakeup in the sample period may be better understood if the political legacy fromprevious years is also considered. The results of the empirical analysis supportedthat proposition, along with the hypotheses that democratic types of political regimeare more favorable for economic prosperity, that a nonlinear relationship exists be-tween growth and regime type, and that sociopolitical stability is a necessary comple-mentary condition.
16 EASTERN ECONOMIC JOURNAL
Are the partial effects generated by this investigation strong enough to warrantvalid policy implications regarding the political economy of economic growth? Ac-cording to the test for robustness conducted through the other growth-related (Z)variables, they are. An interesting corollary of that sensitivity analysis pointed tothe importance of economic freedom and human capital. Consistent with the existingliterature, their promotion should be regarded as another desirable feature of policymaking in promoting economic expansion.
Where does this research leave the discussion over the impact of regime type ongrowth? Has its novel perspective to approach the sociopolitical environment suc-ceeded in putting that debate to rest? I will certainly not go that far. Despite therobustness of results obtained for a sample period that I purposely chose to overlapthat of many existing studies, the disparity of outcomes in the literature remainspuzzling. Before definite conclusions can be reached, a comprehensive review of theliterature seems necessary. The latter should go beyond the usual reporting of diverg-ing results to analyze variations in the methodology used by each study either todepict the features of the political system or to conduct the empirical analysis.
Apart from the positive impact of democracy on a nation’s material welfare, avalid moral argument also can be made regarding the intrinsic desirability of democ-racy, as one political system that upholds political freedom and nurtures civil liber-ties. By empowering the citizenry through enfranchisement and the respect of therights of the individual with respect to the state and the larger social group, democ-racy stands as a prerequisite of social justice. Another extension of the research canbe to expand the period of study to include the 1990s, a decade where the dramaticgains recorded for political freedom in the 1980s continued. It would therefore beinteresting to determine whether the substantial strides made by democracy through-out the world in the last decade of the twentieth century were accompanied by im-proved economic performance.
NOTES
The author wishes to thank the editor of this Journal and two anonymous referees for very helpfulcomments on an earlier version of this paper. The author assumes responsibility for the paper’scontents.
1. Surveys of the empirical literature on the relationship between democracy and growth can be foundin Kormendi and Meguire [1985], Barro [1991], De Haan and Siermann [1995], and Ali [1997].
2. The choice of time period (1972-1989) is dictated by data availability, in addition to the logic ofconducting this analysis in a period similar to that of previous research so that the results can becompared. 1972 is retained as the sample’s first year because this is the first year for which thesociopolitical data utilized here became available.
3. The choice of countries to include in the sample is dictated by simultaneous availability of the vari-ous categories of data utilized in the empirical analysis. Appendix A presents the list of retainedcountries.
4. By comparison, the French colonization tended to exhibit a lack of permeability. Many French colo-nies did not seem to have enjoyed a significant opportunity to learn administrative skills and demo-cratic principles from their rulers. This was the case even during the French Revolution (the 1790s),a time of sweeping changes in the French sociopolitical environment. Every effort was made to insu-late the colonies and nullify possible contagious effects of the revolution there. That effort failed inthe case of one of the most prosperous French colonies, Saint Domingue (on the island of Hispaniola
17DEMOCRACY AND GROWTH: A RELATIONSHIP REVISITED
in the Caribbean). Propelled at the time in part by the course of events in France, that colony wentahead with its own revolution to declare independence in 1804 under the name of Republic of Haiti.That model spurred, and the new nation occasionally supported, a wave of emancipatory events inthe Caribbean and Latin America throughout the nineteenth century.
5. A desirable endeavor would be to consider alternative proxies for initial democratic capital. An ap-pealing candidate is the number of years a country was democratic in the two or three decades beforethe sample period began. However, data limitations make this difficult to use as a measure of initialdemocratic capital in the context of the period studied. Nonetheless, intuitively, the 1972 level ofdemocracy adopted here is an acceptable indicator of initial democratic capital. History suggests thatcountries (such as those in the OECD) that were consistently democratic in the post-World War IIyears also tended to do better economically in the 1970s and 1980s than their authoritarian counter-parts. That observation is congruent with this study’s hypothesis about the relevance of initial demo-cratic capital for growth.
6. The number of revolutions and attempted coups d’état are likely to miss the impact of activities thateffectively disturb stability without actually succeeding in removing the government or attemptingto do so. These include the weakening of the government because of systematic rejection of its bills bythe parliament; frequent street demonstrations by the opposition or by pressure groups; and so on.Similarly, political assassinations and executive turnover are likely to allow only for a partial assess-ment of instability. A political system may be inherently unstable in the absence of high executiveturnover, and frequent changes of government do not necessarily imply a high level of instability.For instance, Italy remained a stable democracy despite experiencing over fifty governments in thefour decades following World War II. This is captured by the proxy for sociopolitical stability thatstands for Italy at 0.44, a relatively low score compared to the proxy’s mean value for the entiresample (0.61) and to the scores of Greece (1.65) and Argentina (2.02), two countries that were muchless stable in the sample period.
7. For example, countries with a score of 1 and countries with a score of 2 are all “free”, but the latter(India, for example) are somewhat less democratic that the former (Canada). Countries with a scoreof 6 and countries with a score of 7 are all “not free”, but the latter (Benin) are somewhat moreauthoritarian than the former (Algeria).
8. For example, Italy was a democracy in the sample period but it alternately scored 1 and 2 from oneyear to another; Haiti was an autocracy but it alternately scored 6 and 7. The three intermediateclasses (3, 4, and 5) provide even more flexibility in categorizing mixed regimes.
9. However, this variable fails in cases where a country remained in the same class throughout thesample period (total absence of variability). A country that experienced repeated coups but remainedauthoritarian at either 6 or 7, exclusively, would be wrongly represented as stable due to a standarddeviation of zero. Interestingly, this happens to only one of the eighty-two retained countries: Benin.Other countries that would be in the same case were dropped from a larger sample for lack of one ormore categories of data (Gabon, Guinea, Romania, Saudi Arabia, the former Czechoslovakia, andSomalia). Except for Benin, the sociopolitical stability variable does contribute in measuring fluctua-tions in political freedom resulting from the inherent dynamism of a political system.
10. Due to the presence of an intercept in the model, including all five regional dummy variables at oncein the same regression would result in perfect multicollinearity, and the regression could not be run.This is avoided by omitting one or some of the dummy variables in any individual regression [Kennedy,1998, 222]. The choice of dummies to regroup together is based on the historical evidence aboutsimilarities in growth performance.
18 EASTERN ECONOMIC JOURNAL
APPENDIX BDATA: DESCRIPTION AND SOURCES
The sample period covers the 1970s and the 1980s (precisely: 1972-1989).The three neoclassical variables are from Penn World Table [Summers and Heston,
1991]. They are:
STARTGDP (y0) is the logarithm of the PPP-adjusted real GDP per capita at thestart of the sample period, i.e. in 1972.
POP (n) is the average growth rate of population in the sample period.
INVEST (s) is the average level of investment in physical capital in the sampleperiod, measured in percentage of GDP.
The five sociopolitical variables are from the index of political rights of The An-nual Survey of Political Rights and Civil Liberties [Gastil and Freedom House, an-nual since 1972]. The survey has been extensively utilized in the literature to mea-sure the levels of political and civil freedoms. It uses a scale of 1 to 7, where scores of1 and 2 indicate the most democratic regimes (“free” by the survey’s nomenclature),
APPENDIX ASample Countries
Sub-Saharan North Africa Latin America North America AsiaAfrica & the Middle East & the Caribbean & Europe & the Pacific
1- Benin 21- Algeria 28- Costa Rica 48- Canada 69- Bangladesh2- Botswana 22- Egypt 29- Dominican Republic 49- Mexico 70- India3- Cameroon 23- Tunisia 30- El Salvador 50- USA 71- Indonesia4- Central African Rep 24- Iran 31- Guatemala 51- Austria 72- Japan5- Congo 25- Israel 32- Haiti 52- Belgium 73- Korea (South)6- Ghana 26- Jordan 33- Honduras 53- Denmark 74- Malaysia7- Kenya 27- Syria 34- Jamaica 54- Finland 75- Pakistan8- Malawi 35- Nicaragua 55- France 76- Philippines9- Mali 36- Panama 56- Germany 77- Singapore10- Mauritius 37- Trinidad & Tobago 57- Greece 78- Sri Lanka11- Niger 38- Argentina 58- Hungary 79- Taiwan12- Rwanda 39- Bolivia 59- Ireland 80- Thailand13- Senegal 40- Brazil 60- Italy 81- Australia14- Sierra Leone 41- Chile 61- Netherlands 82- New Zealand15- South Africa 42- Colombia 62- Norway16- Togo 43- Ecuador 63- Portugal17- Uganda 44- Paraguay 64- Spain18- Zaire 45- Peru 65- Sweden19- Zambia 46- Uruguay 66- Switzerland20- Zimbabwe 47- Venezuela 67- Turkey
68- United Kingdom
19DEMOCRACY AND GROWTH: A RELATIONSHIP REVISITED
scores of 3, 4, and 5 indicate mixed regimes (“partly free” or semi-democratic), andscores of 6 and 7 indicate authoritarian regimes (“not free” or nondemocratic). Thisapproach conceptualizes regime type along a continuum where democracy (1) andautocracy (7) occupy the two extremes. Thus, democracy is viewed analytically as theopposite of autocracy. For more details about methodological issues, see the 1999-2000 survey.
The five sociopolitical variables are:
REGTYPE is a proxy for regime type. It is the average level of political rights,that is, the mean of the Gastil political rights series for the 1970s and 1980s. Thehigher REGTYPE is (that is, the closer it is to 7, the authoritarian bound), thelower the level of political rights is, and the least democratic the system is. Hencethe expectation of a negative sign for REGTYPE. This variable is essentially aproxy for autocracy (regime types located closer to the “7” extreme) and, inversely,for democracy (regime types located closer to the “1” extreme).
Q_REGTYPE is a quadratic specification of REGTYPE, aimed to capturenonlinearity effects in the relationship between growth and regime type.
INSTABILITY is a proxy for sociopolitical instability. Due to the practical diffi-culty of exactly assessing instability, I use the standard deviation of the Gastilpolitical rights series. The more spread out a country’s political rights series wasin the period under study (that is, the more variability it exhibited around itscentral value), the more that country moved from one score to another within theGastil scale, the less stable it was due to structural inability to settle down any-where within the 7-score spectrum.
STARTPOL captures every country’s initial level of Gastil political rights (thatis, in 1972). It helps to determine whether it makes sense to account for theextent of political rights at the start of the period.
STARTDEMOC is the indicator of initial democratic capital. It is a dummy vari-able capturing the initial level of democracy (that is, the level of democracy in1972). The sample is split so as to include two broad Gastil classes of countries in1972: democratic regimes (STARTDEMOC=1 if 1=STARTPOL<=3), and nondemo-cratic regimes (STARTDEMOC=0 if 4=>STARTPOL=7). The democratic thresh-old is thus set at 3. A “natural” threshold would be “2” (recall that Gastil/Free-dom House classifies 1-2 countries as free, 3-5 countries as partly free, and 6-7countries as not free). I set the cutoff score at 3 to remain consistent with thesurvey which includes in the “free” group countries achieving an average score ofup to 2.5 for the political rights ratings and the civil liberties ratings taken to-gether (2 in political rights and 3 in civil liberties, or 3 in political rights and 2 incivil liberties; Freedom House, 1999-2000, 588). Also, using a cutoff score of 3 isconsistent with the empirical analysis: 3 is the score at which growth reaches itshighest potential (depicted in Figure 1).
20 EASTERN ECONOMIC JOURNAL
The data for economic freedom are from Economic Freedom of the World, 1975-1995 [Gwartney, Lawson and Block, 1996]. Two variables are constructed using thatsurvey:
ECONFREE is a 1-to-10 scale. A score of 1 indicates the lowest average level ofeconomic freedom, and a score of 10 the highest level, in the sample period.
Q_ECONFREE is a quadratic specification of ECONFREE, aimed to capturenonlinearity effects in the relationship between growth and economic freedom.
The data for human capital are from International Comparisons of EducationalAttainment [Barro and Lee, 1993]. Two variables are constructed from that dataset:
LOWHUMCAP, or low-level human capital, is the percentage of the total popula-tion that achieved basic schooling.
HIGHHUMCAP, or high-level human capital, is the percentage of the total popu-lation that achieved higher schooling (formal education at college level and be-yond).
A number of regional dummies are used:
SUB-SAHAFRICA: Sub-Saharan Africa.
LATAMERICA-CARIB: Latin America and the Caribbean.
NTHAFRICA-MIDEAST: North Africa and the Middle East.
ASIA-PACIFIC: Asia and the Pacific region.
NTHAMERICA-EUROPE: North America and Europe, where most OECD coun-tries are located.
REFERENCES
Adelman, I. and Morris, C. Society, Politics & Economic Development: A Quantitative Approach. Balti-more: Johns Hopkins Press, 1967.
Alesina, A., Ozler, S., Roubini, N., Swagel, P. Political Instability and Economic Growth. Journal ofEconomic Growth, 1996.
Ali, A. Economic Freedom, Democracy, and Growth. Journal of Private Enterprise, Fall 1997, 1-20.Barro, R. Economic Growth in a Cross Section of Countries. Quarterly Journal of Economics, May 1991,
407-44.____________. Democracy and Growth. Journal of Economic Growth, March 1996, 1-27.Barro, R. and Lee, J.-W. International Comparisons of Educational Attainment. NBER Working Paper
Number 4349, 1995.Barro, R. and Sala-í-Martin, X. Economic Growth. New York: McGraw-Hill Advanced Series in Eco-
nomics, McGraw-Hill, Inc., 1995.
21DEMOCRACY AND GROWTH: A RELATIONSHIP REVISITED
Becker, G. S. Lecture on Human Capital and Poverty Alleviation presented at the World Bank on 16December 1994.
Comeau, L. Regime Type, Political Stability, and Economic Growth. Mimeo. The University of Illinois atChicago, 1997.
De Haan, J. and Siermann, C. A Sensitivity Analysis of the Impact of Democracy on Economic Growth.Empirical Economics, 1995, 197-215.
____________. Further Evidence on the Relationship between Economic Freedom and Economic Growth.Public Choice, June 1998, 363-80.
Fischer, S. The Role of Macroeconomics Factors in Growth. Journal of Monetary Economics, 32(3), De-cember 1993, 485-512.
Gastil, R. and Freedom House. Freedom of the World: The Annual Survey of Political Rights and CivilLiberties. New York: Raymond Gastil, 1972-1982, and Freedom House, 1983 to present.
Gwartney, J., Lawson, R. and Block, W. Economic Freedom of the World, 1975-1995. Vancouver:Fraser Institute, 1996.
Huntington, S. Political Order in Changing Societies. New Haven: Yale University Press, 1968.Kennedy, P. A Guide to Econometrics. Cambridge: MIT Press, 1998.Kormendi, R. and Meguire, P. Macroeconomic Determinants of Growth: Cross-Country Evidence. Jour-
nal of Monetary Economics, September 1985, 141-63.Krueger, A. The Political Economy of the Rent Seeking Society. American Economic Review, 1974, 291-303.Leamer, E. Let’s Take the Con Out of Econometrics. American Economic Review, March 1983, 31-43.Levine, R. and Renelt, D. A Sensitivity Analysis of Cross-Country Growth Regressions. American Eco-
nomic Review, September 1992, 942-63.Lipset, S. M., Seong, K.-R., and Torres, J. C. A Comparative Analysis of the Social Requisites of
Democracy. International Social Science Journal, 1993, 155-75.Londregan, J. B., and Poole, K. T. Poverty, the Coup Trap, and the Seizure of Executive Power. World
Politics, 1990, 151-83.Mankiw, N. G., Romer, D. and Weil, D. N. A Contribution to the Empirics of Economic Growth. Quar-
terly Journal of Economics, May 1992, 407-37.McGuire, M. and Olson, M. The Economics of Autocracy and Majority Rule: The Invisible Hand and the
Use of Force. Journal of Economic Literature, 1996, 72-96.Olson, M. The Rise and Decline of Nations. New Haven: Yale University Press, 1982.____________. Dictatorship, Democracy, and Development. American Political Science Review, Septem-
ber 1993, 567-76.Summers, R. and Heston, A. The Penn World Table (Mark 5): An Expanded Set of International Com-
parisons. Quarterly Journal of Economics, 1991, 327-68.White, H. A Heteroskedasticity-Consistent Covariance Matrix Estimator and a Direct Test for
Heteroskedasticity. Econometrica, May 1980, 817-38.