Embed Size (px)
Citation preview
Wonderlic and NFL 1
Running head: WONDERLIC AND NFL PERFORMANCE
The Wonderlic-NFL Performance Relationship Revisited:
Positional Analyses and Generalizability
Brian D. Lyons
University at Albany, State University of New York
Brian J. Hoffman
University of Tennessee, Knoxville
John W. Michel
University at Albany, State University of New York
Paper to be presented at the 21st Annual Meeting of the Society for Industrial and Organizational
Psychology, April 2005, Dallas, TX. Please direct all correspondence concerning this
manuscript to Brian D. Lyons, University at Albany, SUNY, 1400 Washington Ave., BA 339,
Albany, NY 12222; Phone: (518) 456-1209; e-mail: [email protected].
Wonderlic and NFL 2
Abstract
The purpose of this research was to re-examine relationship between the Wonderlic and NFL
performance by accumulating data from another draft class. A total of 521 professional football
players from the 2002 and 2003 draft classes were included in our sample. Results indicated that
scores on the WPT are not predictive of future NFL performance in either draft class or by
position and overall selection in the NFL Draft. Additionally, the use of this measure produced
significant racial discrepancies. The implications of these findings and avenues for future
research are discussed.
Wonderlic and NFL 3
The Wonderlic-NFL Performance Relationship Revisited:
Positional Analyses and Generalizability
Within a selection system, a predictor can be evaluated in terms of its efficiency (i.e.,
validity) and equity (i.e., gender/ethnic differences; Murphy, 2002). Voluminous empirical
research supports the validity of general mental ability (GMA; i.e., g) as a predictor of job
performance (e.g., Schmidt & Hunter, 1998; Viswesvaran & Ones, 2002). To that end, GMA
consistently demonstrates the strongest criterion-related validity evidence of existing predictors
(Murphy, 2002; Ree, Earles, & Teachout, 1994; Schmidt, 2002; Schmidt & Hunter, 1998).
Meta-analytic estimates of this relationship typically result in an uncorrected validity coefficient
of approximately .30 (Bobko, Roth, & Potosky, 1999; Schmitt, Rogers, Chan, Sheppard, &
Jennings, 1997) and a corrected validity coefficient of .51 (Schmidt & Hunter, 1998). However,
ethnic group differences associated with measures of GMA have also garnered substantial
attention (e.g., Herrnstein & Murray, 1994). Given the legal landscape and a demographic shift
to a more heterogeneous workforce (Offermann & Gowing, 1993; Outtz, 2002), the potential for
adverse consequences to minorities is a probable determinant against the use of GMA in
selection contexts (e.g., Outtz, 2002; Schmitt et al., 1997). Still, GMA remains a frequently
assessed construct in personnel selection.
For example, GMA is used as an evaluation tool by the National Football League (NFL)
at its annual NFL Combine, held approximately two months before the NFL Draft. Professional
football can be conceptualized as an indirect extension of an employment setting, with
professional athletes being evaluated, compensated, promoted, and terminated based on their
performance. An additional similarity between professional athletics and employment settings is
that professional athletes are selected via the NFL Draft. A preliminary study examined the
Wonderlic and NFL 4
relationship between GMA and subsequent performance in the NFL (Citation withheld, 2005).
However, only one draft class of players was included in the sample. As a result, the inability to
generalize the results to other draft classes was a methodological issue as well as the failure to
provide specific position predictability of the GMA-performance relationship because of low
sample sizes. Thus, the purpose of this study is to expand the initial sample to include another
draft class which, in turn, will strengthen the analysis of the efficiency and equity of GMA in this
employment context.
Study Hypotheses
An on-line publication produced by the Wonderlic organization (2004), HR
Measurements, stated that the WPT is an essential assessment during the Combine because
“smarter people make better teammates and deliver more wins to the team.” Such a
determination should be based on evidence demonstrating a relationship between the WPT and
subsequent performance. Given the import of "on-the fly" processing of information, the
complex schemes associated with present day professional football, and the research suggesting
that GMA is related to performance across job settings (Schmidt & Hunter, 1998; Schmidt,
Hunter, & Pearlman, 1981), it is expected that GMA will possess a positive, nonzero relationship
with NFL performance. Thus, the following hypothesis is proposed:
Hypothesis 1: The WPT will be positively related to performance in the NFL.
A recent Wonderlic, Inc. press release (2005) suggested that a positive relationship exists
between the WPT and the number of games an athlete starts during a given NFL season.
However, we were unable to locate any empirical research examining this assertion. It is
reasonable to assume that in the competitive environment of the NFL, playing time will be a
direct function of a player's performance. In other words, those draftees who play in more games
Wonderlic and NFL 5
have a greater probability of attaining performance-related statistics. In turn, those draftees who
elicit immediate playing time may be those who digested the playbook quicker and more
efficiently. After all, GMA has been shown to be causally related to the acquisition of job
knowledge (Schmidt, 2002). Thus, it is hypothesized that:
Hypothesis 2: The WPT will be positively related to number of games started.
The efficiency of GMA might not compensate for the potential threat of adverse impact
and subsequent litigation (Ryan, Ployhart, & Friedel, 1998; Schmitt et al., 1997). The issue of
equity is of concern because GMA tests are frequently associated with large mean differences
between African-Americans and Caucasians (Sackett & Wilk, 1994). More specifically, on
average, African-Americans score about one standard deviation lower than Caucasians (Hunter &
Hunter, 1984; Roth, BeVier, Bobko, Switzer, & Tyler, 2001). In addition to the general trend of
Caucasians outscoring their African-American counterparts on measures of GMA, the WPT is a
speeded test of GMA (Murphy, 1984), which may exacerbate this discrepancy. Consistent with
previous research investigating racial differences in cognitive ability testing (e.g., Hunter &
Hunter, 1984; Roth et al., 2001), the following hypothesis is proposed:
Hypothesis 3: Caucasian prospects will score higher on the WPT than African-American
prospects.
Similarly, disparity in WPT scores may be further explained and examined through
positional differences in GMA. For instance, some positions may require more cognitive
functioning than other positions. Specifically, the quarterback position may encompass more
decision making (e.g., deciding which receiver is the best option) and problem solving (e.g.,
reading defensive schemes) than other positions. Because GMA has been positively related to
Wonderlic and NFL 6
problem solving (Stevens & Campion, 1999) and decision making (Gully, Payne, Koles, &
Whiteman, 2002) activities, it is hypothesized that:
Hypothesis 4: Quarterbacks will score higher, on average, on the WPT than other
positions.
In addition to these specific hypotheses, two research questions will be offered to further
determine the WPT’s efficiency and equity in this employment realm. It has been reported that
some NFL teams question the validity of the WPT (Mulligan, 2004) while other teams consider
the test results a vital part of their selection processes (Merron, 2002). Given the apparent
disagreement among league decision makers over the utility of the WPT, this research sought to
examine the relationship between a prospect’s WPT score and his overall draft selection number
in order to elucidate the potential influence WPT scores have during the draft selection process.
Research Question 1: Is there a relationship between GMA and draft selection
number?
A meta-analysis by Schmidt and Hunter (1998) demonstrated that although GMA is
related to performance across levels of job complexity, the relationship between GMA and
performance decreases as job complexity decreases. Thus, to the degree that some positions are
less complex than others, the relationship between GMA and performance would be expected to
fluctuate by position. To that extent, certain positions require more problem solving and
decision making ability (e.g., quarterbacks) than other positions that primarily rely on skill and
instinct (e.g., running back and wide receivers). Consequently, the strength of the relationship
between the WPT and performance might vary by position.
Research Question 2: Does position type influence the relationship between GMA and
NFL performance?
Wonderlic and NFL 7
Method
Participants
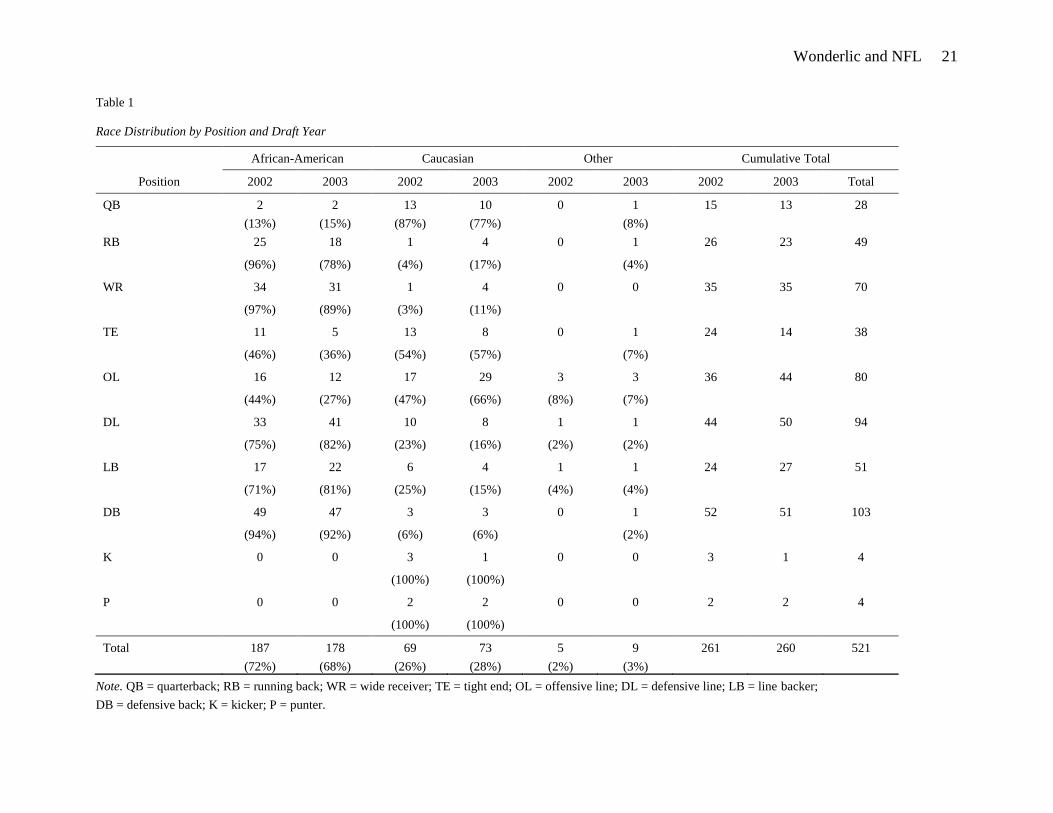
A total of 521 professional football players, 261 taken in the 2002 NFL Draft and 260 in
the 2003 NFL Draft, were included in the sample. Draftees over these two years consisted of
365 African-Americans (70.1%), 142 Caucasians (27.3%), and 14 Other (2.7%). Table 1 depicts
the racial distribution by position and draft year (i.e., 2002 and 2003).
--------------------------------
Insert Table 1 about here
--------------------------------
Measures
Prior to the annual NFL Draft, the NFL Combine provides owners and coaches an
opportunity to evaluate prospects’ physical and mental ability. During the NFL Combine, GMA
is measured with the WPT. First published in 1938, the WPT was originally adopted from the
Otis Self-Administering Test of Mental Ability. Designed as a speeded test, the WPT is a 12
minute timed test consisting of 50-items comprised of multiple-choice and short answer items
that purport to measure verbal, numerical, general knowledge, analytical, and spatial relations.
Test scores range from 1 to 50. Internal consistency estimates for the WPT range from .88 to
.94, test-retest values range from .82 to .94, and alternate form estimates range from .73 to .95
(Wonderlic, Inc., 2000). WPT data for all draftees were collected from a secondary source,
CBS.sportsline.com.
To serve as the criterion, data from the first two years of athletic performance were
collected for both draft classes. Specifically, data was taken from the 2002 and 2003 NFL
seasons for the 2002 draft class and 2003 and 2004 NFL seasons for the 2003 draft class.
Wonderlic and NFL 8
Depending on the draft class, each year of statistical data represented Year 1 and Year 2 of
performance. This information was accumulated from nationally recognized sports websites
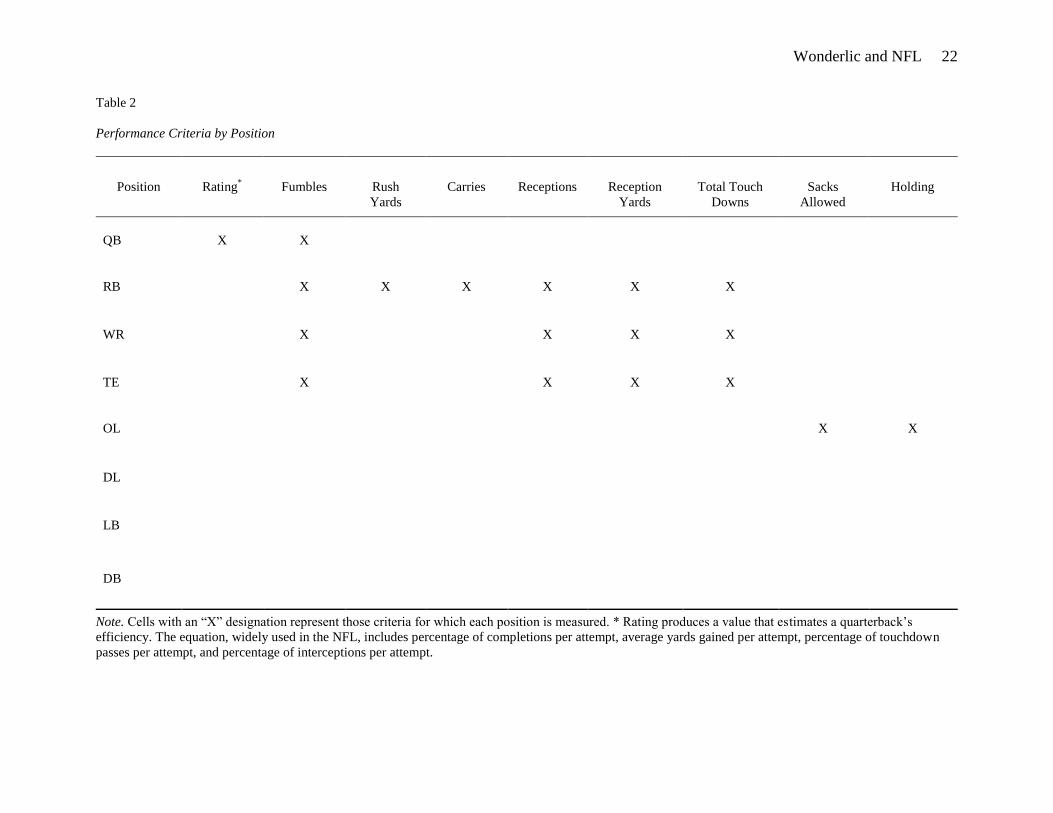
available on the world-wide-web such as ESPN.com and NFL.com. A priori decision rules were
imposed for performance criteria inclusion. Our goals were to include those statistics that were
(1) available on the world-wide-web and discernable by position, (2) not redundant within
position (e.g., we included total tackles instead of including solo and assisted tackles), and (3)
accurately portrayed performance. Performance criteria by position are summarized in Table 2.
--------------------------------
Insert Table 2 about here
--------------------------------
Procedure
The 2002 and 2003 NFL Combine data were collected from a nationally recognized
sports website, CBS.sportsline.com. This information included each participant’s name, weight,
height, football position, WPT score, and overall selection number in either the 2002 or 2003
NFL Draft. As noted above, the first two years of athletic performance were collected per
draftee to serve as the criteria. Performance data was collected from two NFL seasons to
mitigate the potential effects of a draftee’s decreased playing time, which would attenuate their
statistics, because of rookie status and/or injury. As a result, two years of performance data may
provide a more reliable estimate of the criterion.
Data Analysis
To ascertain and compare the relationship of the WPT and performance across positions,
all performance criteria within each position were standardized. We negatively coded raw scores
for adverse performance criteria such as fumbles, sacks allowed, holding, and false starts (e.g., a
Wonderlic and NFL 9
value of 5 for fumbles was changed to –5). Subsequently, the raw scores for each draft class
were transformed into z-scores within each position per year. We then summated all of the
representative z-scores and divided this value by the number of performance criteria that position
encompasses to create an overall averaged estimation of their performance per year (i.e., Year 1
and Year 2). In essence, each z-score represents a player’s performance relative to other players
at the same position (e.g., a score of zero indicates average performance, while a z-score of one
indicates performance at one standard deviation above average performance for a respective
position). Games played and games started were not included in this performance metric
because of the decision to control for these two variables in one of the analyses.
To create an averaged performance value for the performance in both Year 1 and Year 2,
we summated the z-score totals for each year and divided this value by the total number of
performance criteria. In sum, three z-score performance values were created for each draftee:
Year 1, Year 2, and overall averaged performance. In addition, z-score values for games played
and games started were created for Year 1 and Year 2, and an overall averaged value for both
years. One undesirable result of using z-scores is that half of the scores in the distribution will
be negative (Murphy & Davidshofer, 2001). Since we did not want to use or interpret negative
performance values, the three z-score performance composites and the games played and games
started values were transformed into T-scores to produce the final performance estimates.
Finally, to test the hypotheses and research questions, bivariate correlations, partial correlations,
an independent-samples t-test, and a one-way analysis of variance were produced.
Results
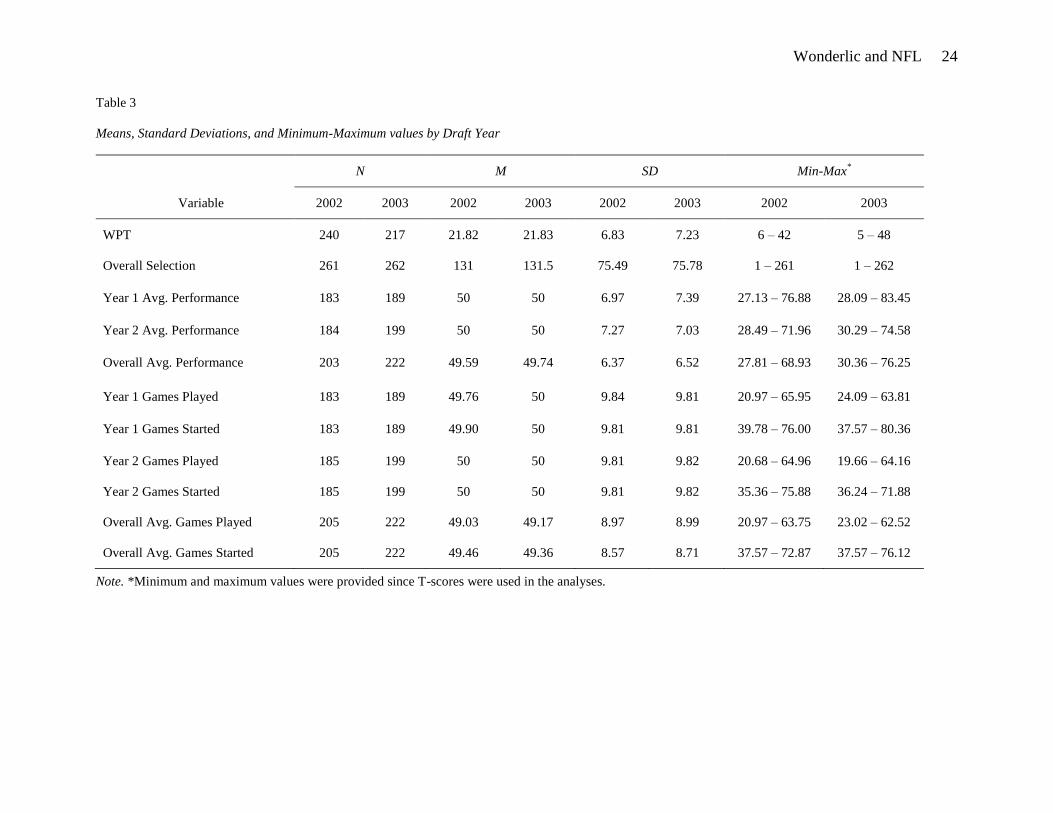
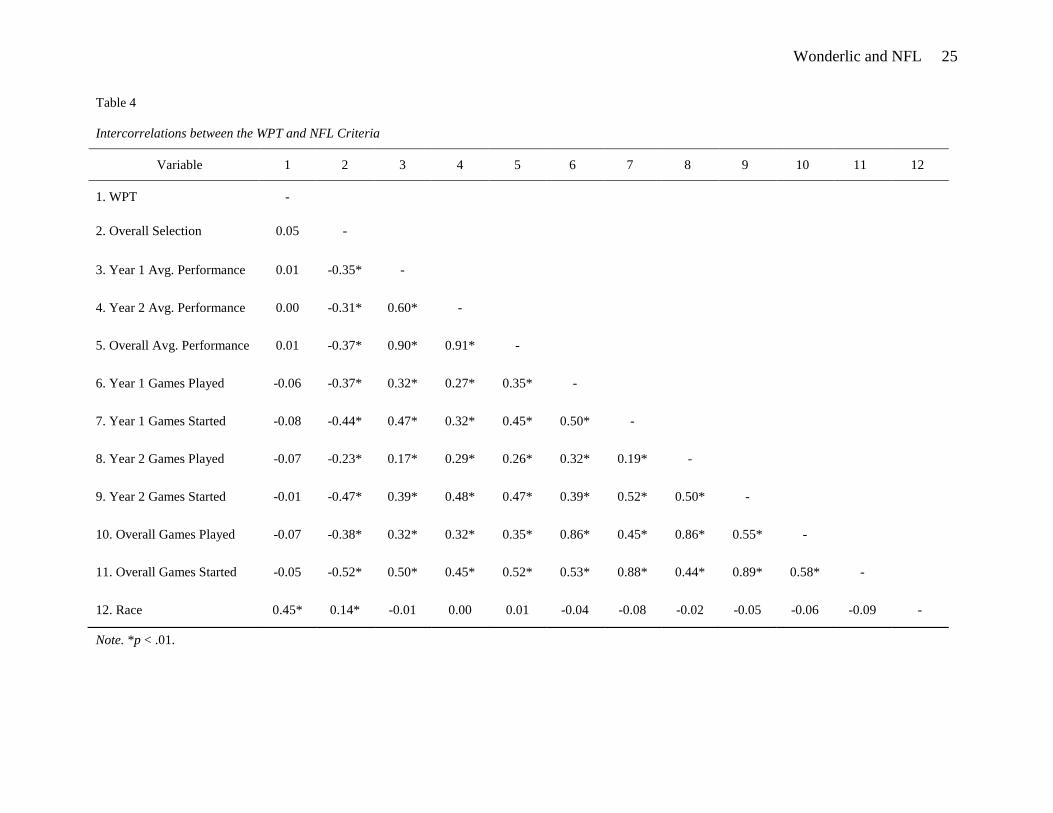
Descriptive statistics and bivariate correlations among study variables are presented in
Tables 3 and 4. The first hypothesis stated that the WPT would be positively related to
Wonderlic and NFL 10
performance in the NFL. Results indicated that the WPT is not related to any of the performance
criteria. Specifically, the bivariate correlations between the WPT and Year 1 performance (r =
.01, p = ns), Year 2 performance (r = .00, p = ns), and overall performance across both Years 1
and 2 (r = .01, p = ns) were not significant. In order to rule out possible attenuation to the WPT-
performance relationship due to playing time, partial correlations were utilized to control for the
number of games started and played. In particular, three partial correlations were calculated
between the WPT and NFL performance (i.e., one for Year 1, one for Year 2, and one for
overall), holding games played and games started constant for each analysis. These analyses
indicated that each of the partial correlations for Year 1 performance (pr = .06, p = ns), Year 2
performance (pr = .01, p = ns), and overall performance (pr = .05, p = ns) were not significant.
Thus, our results suggest that the number of games played and games started have little impact
on the relationship between the WPT and NFL performance. Overall, the results from both
correlation analyses suggest that scores on the WPT are not predictive of subsequent NFL
performance.
---------------------------------------
Insert Tables 3 and 4 about here
---------------------------------------
The second hypothesis predicted that the WPT would be positively related to the number
of games started. Similar to the previous results, this hypothesis was not supported.
Specifically, these data indicated there is no relationship between the WPT and Year 1 games
started (r = -.08, p = ns), Year 2 games started (r = -.01, p = ns), or overall games started
(r = -.05, p = ns).
Wonderlic and NFL 11
The third hypothesis stated that Caucasian prospects would score higher on the WPT than
African-American prospects. This hypothesis was supported as Caucasians (M = 27.66, SD =
5.92), on average, scored significantly higher than African-Americans (M = 19.54, SD = 5.97) on
the WPT, t(443) = -12.83, p < .001.
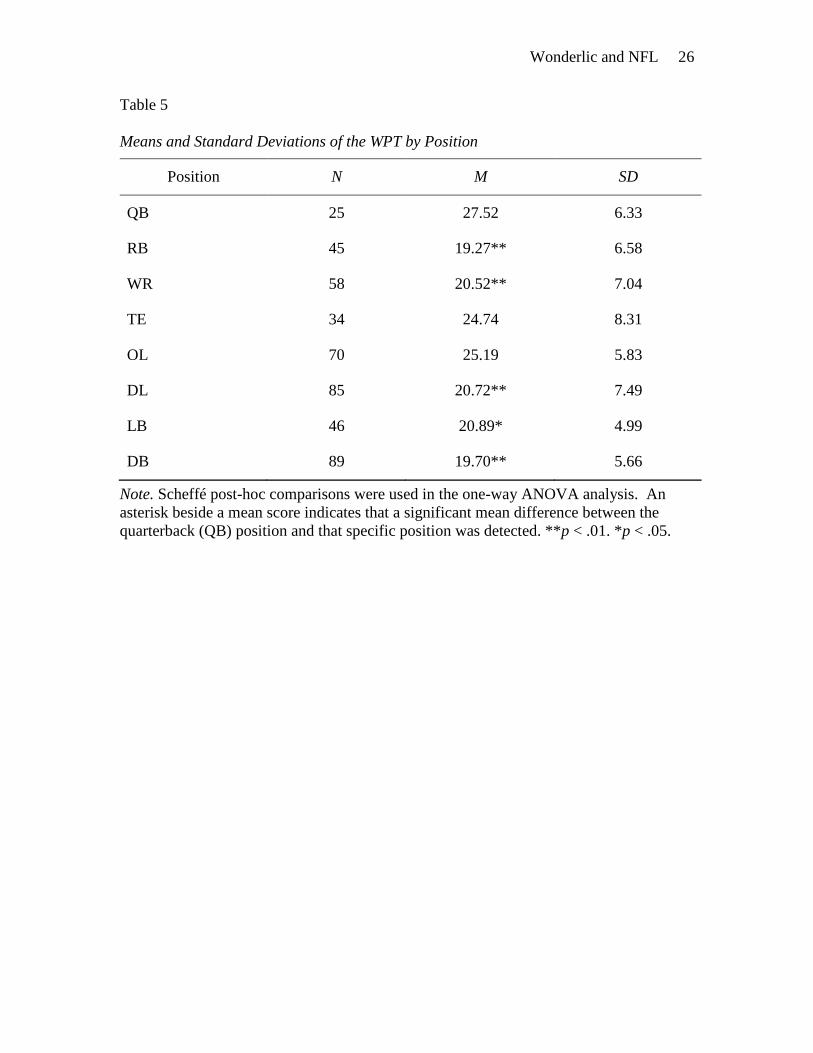
The fourth hypothesis stated that quarterbacks would score higher on average on the
WPT than other positions. A one-way analysis of variance (ANOVA) computed to determine if
mean differences on the WPT existed between positions. This analysis indicated that statistically
significant mean group differences were present, F(7, 444) = 9.46, p < .001. Consequently,
Scheffé post-hoc comparisons were produced to examine position level differences. As depicted
in Table 5, quarterbacks (M = 27.52) were found to significantly score higher on the WPT than
running backs (M = 19.27, p < .01), wide receivers (M = 20.52, p < .01), defensive linemen (M =
20.72, p < .01), line backers (M = 20.89, p < .05), and defensive backs (M = 19.7, p < .01).
However, quarterback WPT scores on average did not significantly differ from those of tight
ends (M = 24.74) or offensive linemen (M = 25.19). As a result, this hypothesis was mostly
supported in that statistically significant differences were found between most positions.
--------------------------------
Insert Table 5 about here
--------------------------------
The first research question speculated whether a relationship existed between the WPT
and draft selection number. As depicted in Table 4, the correlation between the WPT and overall
selection was not significant (r = .05, p = ns). Therefore, these data suggest that there is no
relationship between how well a prospect scores on the WPT and how high he is selected in the
NFL draft.
Wonderlic and NFL 12
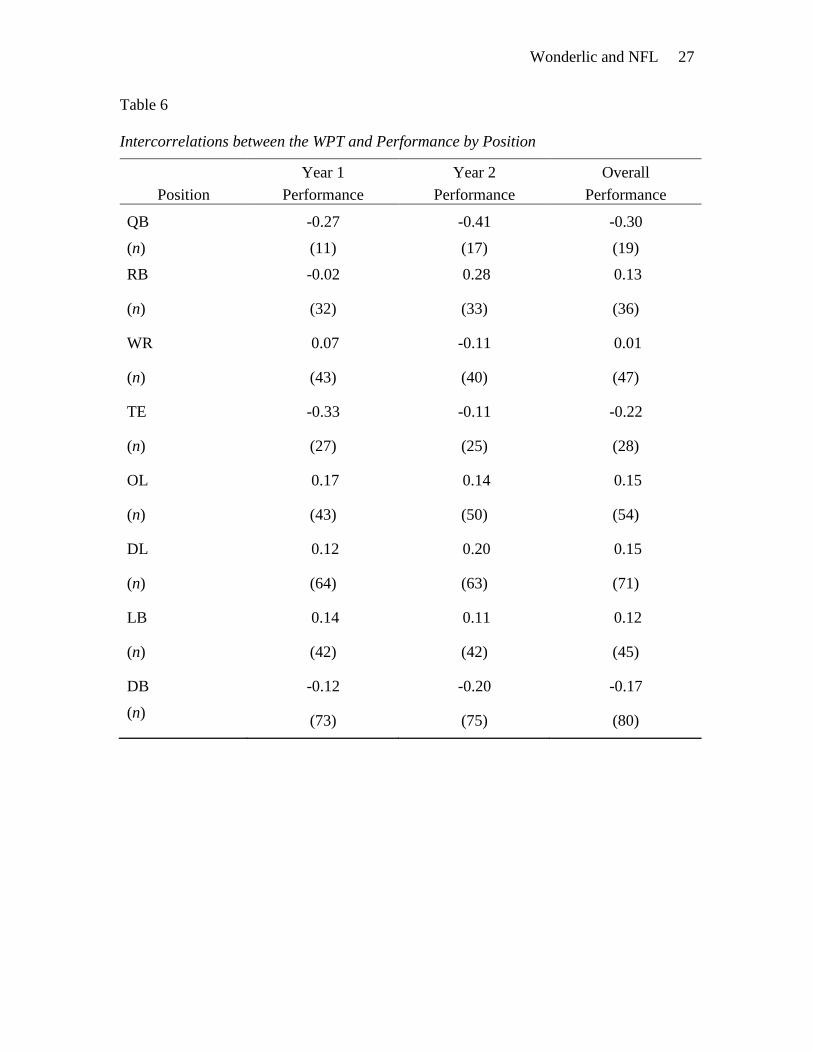
The second research question sought to determine if position type influences the
relationship between the WPT and NFL performance. As illustrated in Table 6, no statistically
significant relationships between the WPT and any year of performance were detected. In some
positions, the strength of the relationship between the WPT and performance increased or
decreased by year. Nevertheless, the results from this analysis suggest that regardless of
position, the WPT was not significantly correlated with performance in the NFL.
--------------------------------
Insert Table 6 about here
--------------------------------
Discussion
The primary purpose of this research was to examine whether the GMA-job performance
relationship can generalize to a non-traditional employment setting, professional football. The
results provided implications and future research directions germane to the extant GMA-job
performance literature.
As indicated by the results, the WPT has a nonsignificant relationship with future NFL
performance in either Year 1, Year 2, or overall (i.e., averaged performance from both years). In
addition, the number of games a prospect starts in the NFL displayed a nonsignificant
relationship with the WPT. In other words, the WPT predicted neither NFL performance nor the
number of games started. These results call into question the utility of using the instrument at
the NFL Combine and are uncharacteristic of those typically found in employment settings (e.g.,
Schmidt & Hunter, 1998; Schmidt et al., 1981).
Consistent with previous GMA literature, Caucasian prospects scored higher on the WPT
than African-American prospects. Because the majority of athletes in the NFL are African-
Wonderlic and NFL 13
American (Turner, 2003), this discrepancy will most likely not be eliminated in the near future.
Although racial differences exist, the results from first research question indicated that the WPT
is not related to where a prospect is selected in the draft. In that the WPT is not used in the
selection of these athletes, adverse impact is not a concern in this setting. Furthermore, since the
relationship between the WPT and performance was approximately near zero, differential
prediction by race is not a concern.
The GMA discrepancy was also reflected by the type of position. The fourth hypothesis
was mostly supported in that quarterbacks did significantly score higher than all positions except
tight ends and offensive linemen. The second research question examined whether the predictive
strength of the relationship between the WPT and performance would vary by position. As
depicted in the results section, the value of the WPT-performance relationship fluctuated by
position but its statistical strength in predicting performance was nonsignificant. However, some
of correlation coefficients approached significance, but in those positions that did, the results
were unexpected. For example, the WPT-performance relationship was negative for the
quarterback position where cognitive processing and decision making is said to be critical
(Wonderlic, Inc., 2005). On the other hand, the running back position, where skill and instinct
are thought to be more dominant, demonstrated a positive relationship in the second year of
performance.
The historical notion that GMA predicts job performance, regardless of context, has most
likely been the foundation for the NFL's continued use of the WPT (e.g., Goldstein, Zedeck, &
Goldstein, 2002). Other types of assessment strategies, related to the industrial psychology field,
could be utilized during the NFL Combine. One such strategy would be to assess the propensity
and susceptibility to deviant or counterproductive behavior. This could be measured by using a
Wonderlic and NFL 14
biographical data inventory, situational judgment test, or a personality instrument. Another
strategy would be to assess the fit between the prospect’s ability and personality with certain
team climates (e.g., Bowen, Ledford, Nathan, 1991). For example, some prospects could be
more suited for the West-Coast offense (i.e., emphasizes short, quick passes and ball control)
than the Run-and-Gun (i.e., emphasizes a strong running game and passing the ball downfield).
In general, future research should explicate whether assessment instruments in the traditional
employment realm can be applied to this employment context.
Limitations
Several limitations of this study should be noted. First, the WPT and performance data
were gathered from nationally recognized secondary data sources, CBS.sportsline.com,
NFL.com, and ESPN.com. Although these websites are secondary data sources, we believe that
these are reputable sources for sporting information. Another possible limitation is criterion
deficiency. More specifically, the ultimate criterion that represents job performance in the NFL
may entail multiple years of performance that encompasses objective (e.g., statistical) and
contextual performance behaviors (e.g., Borman & Motowidlo, 1993). However, in this
employment context, statistical output and ability potential are most likely the precursors for
compensation beyond the initial contract; thus, statistics may capture or possess a greater amount
of the variance in the ultimate criterion. In addition, more than one year of performance was
gathered to provide a longitudinal estimate of performance. A final limitation is statistical power
and sample size within position. For example, the correlational results obtained for the
quarterback and tight end positions should be interpreted with caution.
Conclusion
Wonderlic and NFL 15
Empirical research has supported the validity of GMA as a predictor of job performance
in traditional employment settings. However, in this employment context, the results from this
research suggest that the WPT is not predictive of future performance overall or by position, has
adverse consequences to minorities, and is not related to where a prospect is selected during the
NFL Draft. Therefore, its use is neither efficient nor equitable in this context. Future research
examining the efficiency and equity of other predictors in this context is clearly warranted.
Wonderlic and NFL 16
References
Bivens, S., & Leonard II, W. M. (1994, March). Race, centrality, and educational attainment: An
NFL perspective. Journal of Sport Behavior, 17, 1-8.
Bobko, P., Roth, P. L., & Potosky, D. (1999). Derivation and implication of a meta-analytic
matrix incorporating cognitive ability, alternative predictors, and job performance.
Personnel Psychology, 52, 561-589.
Borman, W. C., & Motowidlo, S. J. (1993). Expanding the criterion domain to include elements
of contextual performance. In N. Schmitt, W. C. Borman, & Associates (Eds.), Personnel
selection in organizations (pp. 71-98). San Francisco, CA: Jossey-Bass.
Bowen, D. E., Ledford, G. E., & Nathan, B. R. (1991). Hiring for the organization, not the job.
Academy of Management Executive, 5, 35-51.
Chan, D. (1997). Racial subgroup differences in predictive validity perceptions on personality
and cognitive ability tests. Journal of Applied Psychology, 82, 311-320.
Chan, D., Schmitt, N., DeShon, R. P., Clause, C. S., & Delbridge, K. (1997). Reactions to
cognitive ability tests: The relationships between race, test performance, face validity
perceptions and test-taking motivation. Journal of Applied Psychology, 82, 300-310.
FairTest. (1995, Spring). Testing pro football players. FairTest Examiner. Retrieved August 20,
2004, from http://www.fairtest.org/examarts/spring95/wonderli.htm
Goldstein, H. W., Zedeck, S., & Goldstein, I. L. (2002). g: Is this your final answer? Human
Performance, 15, 123-142.
Gully, S. M., Payne, S. C., Koles, K. L. K., & Whiteman, J. A. K. (2002). The impact of error
training and individual differences on training outcomes: An attribute-treatment
interaction perspective. Journal of Applied Psychology, 87, 143-155.
Wonderlic and NFL 17
Herrnstein, R. J., & Murray, C. (1994). The bell curve: Intelligence and class structure in
American life. New York: Free Press.
Horn, J. L. (1976). Human abilities: A review of research and theory in the early 1970s. Annual
Review of Psychology, 27, 437-485.
Hunter, J. E., & Hunter, R. F. (1984). Validity and utility of alternative predictors of job
performance. Psychological Bulletin, 96, 72-98.
Merron, J. (2002, February 28). Taking your Wonderlics. Retrieved August 9, 2004, from
http://espn.go.com/page2/s/closer/020228.html
Mulligan, M. (2004, April 22). Wonderlic scores have NFL teams wondering. The Chicago Sun-
Times, pp. S4.
Murphy, K. R. (1984). The Wonderlic Personnel test. In D. J. Keyser & R. C. Sweetland (Eds.),
Test critiques: Vol. 1 (pp. 769-775). Kansas City, MO: Test Corporation of America.
Murphy, K. R. (2002). Can conflicting perspectives on the role of g in personnel selection be
resolved? Human Performance, 15, 173-186.
Murphy, K. R., & Davidshofer, C. O. (2001). Psychological testing: Principles and applications
(5th ed.). Upper Saddle River, NJ: Prentice Hall.
Offermann, L. R., & Gowing, M. K. (1993). Personnel selection in the future: The impact of
changing demographics and the nature of work. In N. Schmitt & W. C. Borman (Eds.),
Personnel selection in organizations (pp. 385-417). San Francisco, CA: Jossey-Bass
Publishers.
Outtz, J. L. (2002). The role of cognitive ability tests in employment selection. Human
Performance, 15, 161-171.
Wonderlic and NFL 18
Parisi Speed School. (2004). Parisi speed school: NFL combine training & NFL combine
preparation. Retrieved February 19, 2004, from http://www.parisischool.com/
NFL_Combine.html
Ree, M. J., Earles, J. A., & Teachout, M. S. (1994). Predicting job performance: Not much more
than g. Journal of Applied Psychology, 79, 518-524.
Roth, P. L., BeVier, C. A., Bobko, P., Switzer, F. S., III, & Tyler, P. (2001). Ethnic group
difference in cognitive ability in employment and educational settings: A meta-analysis.
Personnel Psychology, 54, 297-330.
Ryan, A. M., & Ployhart, R. E. (2000). Applicants’ perceptions of selection procedures and
decisions: A critical review and agenda for the future. Journal of Management, 26, 565-
606.
Ryan, A. M., Ployhart, R. E., & Friedel, L. A. (1998). Using personality testing to reduce adverse
impact: A cautionary note. Journal of Applied Psychology, 83, 298-307.
Sackett, P. R., & Wilk, S. L. (1994). Within-group norming and other forms of score adjustment
in preemployment testing. American Psychologist, 49, 929-954.
Sackett, P. R., Burris, L. R., & Ryan, A. M. (1989). Coaching and practice effects in personnel
selection. In C. L. Cooper & I. T. Robertson (Eds.), International review of industrial and
organizational psychology. Chichester: John Wiley and Sons.
Schmidt, F. L. (2002). The role of general cognitive ability and job performance: Why there
cannot be a debate. Human Performance, 15, 187-210.
Schmidt, F. L., & Hunter, J. E. (1998). The validity and utility of selection methods in personnel
psychology: Practical and theoretical implications of 85 years of research findings.
Psychological Bulletin, 124, 262-274.
Wonderlic and NFL 19
Schmidt, F. L., Hunter, J. E., & Pearlman, K. (1981). Task differences as moderators of aptitude
test validity in selection: A red herring. Journal of Applied Psychology, 66, 166-185.
Schmitt, N., Rogers, W., Chan, D., Sheppard, L., & Jennings, D. (1997). Adverse impact and
predictive efficiency of various predictor combinations. Journal of Applied Psychology,
82, 719-730.
Schneider, B. (1987). The people make the place. Personnel Psychology, 40, 437-454.
Schneider, B., Goldstein, H. W., & Smith, D. B. (1995). The ASA framework: An update.
Personnel Psychology, 48, 747-773.
Stevens, M. J., & Campion, M. A. (1999). Staffing work teams: Development and validation of a
selection test for teamwork settings. Journal of Management, 25, 207-228.
Turner, C. M. (2003, Fall). Inherent conflicts of interest in the National Football League
management structure may render the Rooney-rule meaningless. The Sports Journal, 6,
Article 2. Retrieved September 2, 2004, from
http://www.thesportsjournal.org/2003journal/Vol6-No4/nfl.asp
U.S. Equal Employment Opportunity Commission, Civil Service Commission, Department of
Labor, and Department of Justice. (1978). Uniform guidelines on employee selection
procedures. Federal Register, 43: 38290-38315.
Viswesvaran, C., & Ones, D. S. (2002). Agreements and disagreements on the role of general
mental ability (GMA) in industrial, work, and organizational psychology. Human
Performance, 15, 211-231.
Wonderlic, Inc. (2000). Wonderlic personnel test & scholastic level exam user’s manual.
Libertyville, IL: Wonderlic, Inc.

Wonderlic and NFL 20
Wonderlic, Inc. (2004). How smart is your first round draft pick? HR Measurements. Retrieved
September 1, 2004, from http://www.wonderlic.com/news/mm_article1.htm
Wonderlic, Inc. (2005, March 1). NFL testing provides valuable lesson for all employers.
Retrieved August 14, 2005, from
http://www.wonderlic.com/Promotion/NFL_press_release.asp
Wonderlic and NFL 21
Table 1
Race Distribution by Position and Draft Year
Position
African-American Caucasian Other Cumulative Total
2002 2003 2002 2003 2002 2003 2002 2003 Total
QB 2
(13%)
2
(15%)
13
(87%)
10
(77%)
0
1
(8%)
15
13 28
RB 25
(96%)
18
(78%)
1
(4%)
4
(17%)
0
1
(4%)
26 23 49
WR 34
(97%)
31
(89%)
1
(3%)
4
(11%)
0
0
35 35 70
TE 11
(46%)
5
(36%)
13
(54%)
8
(57%)
0
1
(7%)
24 14 38
OL 16
(44%)
12
(27%)
17
(47%)
29
(66%)
3
(8%)
3
(7%)
36 44 80
DL 33
(75%)
41
(82%)
10
(23%)
8
(16%)
1
(2%)
1
(2%)
44 50 94
LB 17
(71%)
22
(81%)
6
(25%)
4
(15%)
1
(4%)
1
(4%)
24 27 51
DB 49
(94%)
47
(92%)
3
(6%)
3
(6%)
0
1
(2%)
52 51 103
K 0 0 3
(100%)
1
(100%)
0 0 3 1 4
P 0 0 2
(100%)
2
(100%)
0 0 2 2 4
Total 187
(72%)
178
(68%)
69
(26%)
73
(28%)
5
(2%)
9
(3%)
261 260 521
Note. QB = quarterback; RB = running back; WR = wide receiver; TE = tight end; OL = offensive line; DL = defensive line; LB = line backer;
DB = defensive back; K = kicker; P = punter.
Wonderlic and NFL 22
Table 2
Performance Criteria by Position
Position
Rating*
Fumbles
Rush
Yards
Carries Receptions
Reception
Yards
Total Touch
Downs
Sacks
Allowed
Holding
QB
X
X
RB
X
X
X
X
X
X
WR
X
X
X
X
TE
X
X
X
X
OL
X
X
DL
LB
DB
Note. Cells with an “X” designation represent those criteria for which each position is measured. * Rating produces a value that estimates a quarterback’s
efficiency. The equation, widely used in the NFL, includes percentage of completions per attempt, average yards gained per attempt, percentage of touchdown
passes per attempt, and percentage of interceptions per attempt.

Wonderlic and NFL 23
Table 2 (Cont.)
Performance Criteria by Position
Position
False
Starts
Total
Tackles
Forced
Fumbles
Sacks
Interceptions
Passes
Defended
Games
Started
Games
Played
QB
X
X
RB
X
X
WR
X
X
TE
X
X
OL
X
X
X
DL
X
X
X
X
X
X
X
LB
X
X
X
X
X
X
X
DB
X
X
X
X
X
X
X
Wonderlic and NFL 24
Table 3
Means, Standard Deviations, and Minimum-Maximum values by Draft Year
Note. *Minimum and maximum values were provided since T-scores were used in the analyses.
Variable
N M SD Min-Max*
2002 2003 2002 2003 2002 2003 2002 2003
WPT 240 217 21.82 21.83 6.83 7.23 6 – 42 5 – 48
Overall Selection 261 262 131 131.5 75.49 75.78 1 – 261 1 – 262
Year 1 Avg. Performance 183 189 50 50 6.97 7.39 27.13 – 76.88 28.09 – 83.45
Year 2 Avg. Performance 184 199 50 50 7.27 7.03 28.49 – 71.96 30.29 – 74.58
Overall Avg. Performance 203 222 49.59 49.74 6.37 6.52 27.81 – 68.93 30.36 – 76.25
Year 1 Games Played 183 189 49.76 50 9.84 9.81 20.97 – 65.95 24.09 – 63.81
Year 1 Games Started 183 189 49.90 50 9.81 9.81 39.78 – 76.00 37.57 – 80.36
Year 2 Games Played 185 199 50 50 9.81 9.82 20.68 – 64.96 19.66 – 64.16
Year 2 Games Started 185 199 50 50 9.81 9.82 35.36 – 75.88 36.24 – 71.88
Overall Avg. Games Played 205 222 49.03 49.17 8.97 8.99 20.97 – 63.75 23.02 – 62.52
Overall Avg. Games Started 205 222 49.46 49.36 8.57 8.71 37.57 – 72.87 37.57 – 76.12
Wonderlic and NFL 25
Table 4
Intercorrelations between the WPT and NFL Criteria
Note. *p < .01.
Variable 1 2 3 4 5 6 7 8 9 10 11 12
1. WPT -
2. Overall Selection 0.05 -
3. Year 1 Avg. Performance 0.01 -0.35* -
4. Year 2 Avg. Performance 0.00 -0.31* 0.60* -
5. Overall Avg. Performance 0.01 -0.37* 0.90* 0.91* -
6. Year 1 Games Played -0.06 -0.37* 0.32* 0.27* 0.35* -
7. Year 1 Games Started -0.08 -0.44* 0.47* 0.32* 0.45* 0.50* -
8. Year 2 Games Played -0.07 -0.23* 0.17* 0.29* 0.26* 0.32* 0.19* -
9. Year 2 Games Started -0.01 -0.47* 0.39* 0.48* 0.47* 0.39* 0.52* 0.50* -
10. Overall Games Played -0.07 -0.38* 0.32* 0.32* 0.35* 0.86* 0.45* 0.86* 0.55* -
11. Overall Games Started -0.05 -0.52* 0.50* 0.45* 0.52* 0.53* 0.88* 0.44* 0.89* 0.58* -
12. Race 0.45* 0.14* -0.01 0.00 0.01 -0.04 -0.08 -0.02 -0.05 -0.06 -0.09 -
Wonderlic and NFL 26
Table 5
Means and Standard Deviations of the WPT by Position
Position N M SD
QB 25 27.52 6.33
RB 45 19.27** 6.58
WR 58 20.52** 7.04
TE 34 24.74 8.31
OL 70 25.19 5.83
DL 85 20.72** 7.49
LB 46 20.89* 4.99
DB 89 19.70** 5.66
Note. Scheffé post-hoc comparisons were used in the one-way ANOVA analysis. An
asterisk beside a mean score indicates that a significant mean difference between the
quarterback (QB) position and that specific position was detected. **p < .01. *p < .05.
Wonderlic and NFL 27
Table 6
Intercorrelations between the WPT and Performance by Position
Position
Year 1
Performance
Year 2
Performance
Overall
Performance
QB
(n)
-0.27
(11)
-0.41
(17)
-0.30
(19)
RB
(n)
-0.02
(32)
0.28
(33)
0.13
(36)
WR
(n)
0.07
(43)
-0.11
(40)
0.01
(47)
TE
(n)
-0.33
(27)
-0.11
(25)
-0.22
(28)
OL
(n)
0.17
(43)
0.14
(50)
0.15
(54)
DL
(n)
0.12
(64)
0.20
(63)
0.15
(71)
LB
(n)
0.14
(42)
0.11
(42)
0.12
(45)
DB
(n)
-0.12
(73)
-0.20
(75)
-0.17
(80)