Embed Size (px)
Citation preview
Demarcating the gene-rich regions of the wheatgenomeMustafa Erayman Devinder Sandhu Deepak Sidhu Muharrem Dilbirligi
P S Baenziger1 and Kulvinder S Gill
Washington State University Pullman WA 99164 USA and 1Department of Agronomy and HorticultureUniversity of Nebraska-Lincoln Lincoln NE 68583-0915 USA
Received January 14 2004 Revised March 28 2004 Accepted May 14 2004
ABSTRACT
By physically mapping 3025 loci including 252phenotypically characterized genes and 17 quan-titative trait loci (QTLs) relative to 334 deletionbreakpoints we localized the gene-containing frac-tion to 29 of the wheat genome present as 18major and 30 minor gene-rich regions (GRRs) TheGRRs varied both in gene number and density Thefive largest GRRs physically spanning 3 of thegenome contained 26 of the wheat genesApproximate size of the GRRs ranged from 3 to 71Mb Recombination mainly occurred in the GRRsVarious GRRs varied as much as 128-fold for genedensity and 140-fold for recombination ratesExcept for a general suppression in 25ndash40 of thechromosomal region around centromeres nocorrelation of recombination was observed with thegene density the size or chromosomal locationof GRRs More than 30 of the wheat genes are inrecombination-poor regions thus are inaccessibleto map-based cloning
INTRODUCTION
Bread wheat (Triticum aestivum L) is an allohexaploid(2n = 6x = 42 AABBDD) containing three homoeologousgenomes (1) Wheat genome is about 35 times larger thanrice (Oryza sativa L) although both belong to Poaceaefamily (2) Estimates for the gene-containing fraction of thewheat genome range from 1ndash5 obtained from the availablesequence data analyses and genome size comparisons withother plant genomes to 15 by DNA re-association kineticsexperiments (3ndash5) It is therefore imperative to identify anddemarcate the gene-containing regions for an efficient andtargeted characterization of this important genome Second
genetic maps and DNA sequence comparisons along withother phylogenetic studies have suggested that various grassgenomes originated from a common ancestor (67) This is alsoevident from the fact that majority of wheat barley (Hordeumvulgare L) and rice protein sequences are 98 similar (8) Itis however unknown how monophyletic origin of the grassesresulted in as much as 35-fold difference in genome size
Genes are unevenly distributed on wheat as well as otherplant chromosomes (59ndash12) In Arabidopsis thaliana 45of the genome accounts for all 25 000 genes (513) Theremaining 55 is lsquogene-emptyrsquo and is interspersed amonggenes as blocks ranging in size from a few hundred basepairsto 50 kb Gene-rich and gene-poor regions were alsoobserved in pea tomato and palm (14) Uneven distributionof genes on chromosomes seems to be a common feature ofother higher eukaryotes also (15ndash17) In larger genomessuch as human unevenness of gene distribution is morepronounced (18) The 30 000 genes with an average size of27 kb account for 25 of the human genome The remaining75 is composed of retrotransposon-like repetitive sequencesinterspersed among genes as a result of multiple invasionsby different retrotransposons at different times duringevolution followed by their inactivation by transpositionandor heterochromatinization (18ndash20)
By physically mapping gene markers on an array of chromo-some deletion lines it has been shown that most wheat genesare present in clusters that occur more frequently in distal partsof the chromosomes (92122) The exact location relativesize gene density and structural organization of the gene-containing regions are however not known Comparisons ofgenetic distances among C-bands revealed that distribution ofrecombination is also uneven along the wheat chromosomes(2324) Comparisons of wheat physical and genetic linkagemaps confirmed the uneven distribution of both genes andrecombination and established a general correlation betweenthe two (9102125ndash29) Precise relationships among rate ofrecombination distribution of genes gene density and locationon the chromosome have not been established in wheat
To whom correspondence should be addressed at Department of Crop and Soil Sciences 277 Johnson Hall PO Box 646420 Washington State UniversityPullman WA 99164 USA Tel +1 509 335 4666 Fax +1 509 335 8674 Email ksgillwsueduPresent addressesDevinder Sandhu G302 Agronomy Hall Department of Agronomy Iowa State University Ames IA-50011-1010 USAMustafa Erayman Agricultural College Department of Crop Sciences Mustafa Kemal University 31034 Hatay TurkeyMuharrem Dilbirligi Central Research Institute for Field Crops Eskisehir yolu 10 km LodumuluAnkara Pk 226 0642 UlusAnkara Turkey
The authors wish it to be known that in their opinion the first four authors should be regarded as joint First Authors
Nucleic Acids Research Vol 32 No 12 ordf Oxford University Press 2004 all rights reserved
3546ndash3565 Nucleic Acids Research 2004 Vol 32 No 12doi101093nargkh639
Published online July 7 2004
Regions around the eukaryotic centromeres and in some casestelomeres have been reported to suppress recombinationrates (133031) Furthermore as shown in barley maize(Zea mays L) Arabidopsis and other plants distribution ofrecombination can be highly uneven even within a few kilobases of DNA (32ndash35) Relationships of the similar putativerecombination hotspots of wheat with the currently identifiedhighly recombinogenic chromosomal regions have not beenestablished
About 461 phenotypic markers and useful genes have beenidentified in wheat (36) (httpwheatpwusdagov) Althoughthe linkage relationship of about 377 has been establishedrelative to molecular markers the physical location of onlyseven of these genes is known (37) Because of uneven dist-ribution of recombination the physical location of the genesalong with a precise kbcM estimate for the region areessential for map-based cloning This is particularly importantfor wheat where the difference in the recombination amongregions is expected to be greater than other crop plants
The objectives of this study were to generate a comprehens-ive map of the wheat genome identify and precisely localizethe gene-containing regions reveal gene density distributionof recombination and kbcM estimate for each of thegene-containing regions and physically map phenotypicallycharacterized genes
MATERIALS AND METHODS
Plant material
Various aneuploid stocks along with the wild-type wheat culti-var Chinese Spring (CS) were used for physical mapping The21 nullisomicndashtetrasomic lines (NT missing a pair of chromo-somes the deficiency of which is compensated for by an extrapair of homoeologous chromosomes) were used for inter-chromosomal mapping and 14 ditelosomic lines (DT missinga pair of chromosome arms) were used to reveal arm location ofthe gene markers Sub-arm localization of markers was accom-plished using 334 deletion lines covering all 21 wheat chromo-somes A list of the deletion lines along with the fraction length(FL) of the retained arm is provided as supplementary informa-tion in Supplementary Table 1 These deletion lines weregenerated using gametocidal genes from Aegilops speltoides(38ndash40) Giemsa C-banding characterization and low-densityrestriction fragment length polymorphism (RFLP) mappingsuggested that most of these deletion lines resulted from singlebreaks followed by the loss of the acentric fragments (262740)High-density mapping revealed a few complex and secondarydeletionsrearrangements in some of the deletion lines (10)Additional information about the deletion lines is available athttpwwwksueduwgrcGermplasmDeletions
DNA analysis and marker selection
Plant genomic DNA was extracted following a previouslydescribed method (41) Gel blot analysis was performedusing 15 g of genomic DNA digested with either EcoRI orHindIII restriction enzymes and size separated on 08 agar-ose gels All other steps for the gel blot DNA analysis were aspreviously described (26)
The published and the Poaceae maps from the lsquograingenesrsquodatabase (httpwheatpwusdagovggpagesmapshtml) wereused to select gene markers for physical mapping The DNAmarkers were from wheat (FBA FBB NOR PSR TAGTAM UNL WG) Ae tauschii (KSU) barley (ABC ABGBCD MWG and cMWG) oat (CDO) and rice (RZ) (104243)Priority was given to cDNA clones although some PstI geno-mic clones were also used
Deletion mapping
Chromosomal and arm locations of each fragment band wererevealed by the NT and DT mapping A fragment band wasmapped to a chromosomal region bracketed by the breakpointsof the largest deletion possessing the fragment band and thesmallest deletion lacking it Multiple fragments were consid-ered non-allelic (shown by a letter at the end of the probename) if the corresponding bands mapped to different regionsor if more than two DNA fragments larger than the probe sizewere detected
Demarcating the gene-rich regions
The deletion mapping information for the three homoeologs ofeach group was combined to generate a high-resolution con-sensus physical map All deletion breakpoints for a group werealigned on a hypothetical chromosome based on FL values andeach marker was placed in the shortest possible interval basedon its location on the three homoeologs Due to the occasionaldifferences in size and distribution of gene-poor regionsamong homoeologs relative locations of markers were alsoconsidered along with the FL values to place deletion break-points on the consensus map To determine physical locationof a GRR the FL value consistent with at least two of thethree homoeologs was used Deletion mapping data fromthe three homoeologs along with FL location were used tolocalize deletion breakpoints within a GRR
Recombination analysis
A comprehensive genetic linkage map for each of the sevenwheat homoeologous groups was constructed using 137 geneticlinkage maps including 17 each for group 1 and 2 32 for 3 25 for4 16 for 5 and 15 each for group 6 and 7 chromosomes (httpwheatpwusdagovggpagesmapsshtml) First the markersgenes that were common among several wheat genetic linkagemaps for a homoeologous group were designated as anchorsTotal genetic length of the consensus map and distances amonganchors were estimated by taking average of recombinationamong anchor markers from various maps Second markerspresent between two anchor markers on multiple maps wereintegrated on the consensus map Relative genetic distancesof the markers present in the segment between two anchorswere averaged over different genetic linkage maps and calibr-ated according to the genetic distances between the two anchormarkers Third markers that were present on a few linkage mapswere incorporated relative to anchor markers Finally the mark-ers andgenes present onlyononeor twomapswere placedon theconsensus genetic maps via linked markers Genetic distanceson the consensus linkage maps are relative rather than absoluteIn cases where map distances between markers were not com-parable the distances were extrapolated based on an averageover majority of the maps
Nucleic Acids Research 2004 Vol 32 No 12 3547
Tab
le1
P
hysi
cal
loca
tio
ns
of
gen
esm
ark
ers
del
etio
nli
nes
re
com
bin
atio
nin
GR
Rs
inw
hea
tg
eno
me
GR
Rsa
Fla
nk
ing
del
etio
ns
Del
etio
ns
inth
ere
gio
nM
ark
ers
Gen
esbc
Gen
es(
)R
ec
()
Siz
e(M
b)
Rec
in
Kb
cM
lsquo1S
08
rsquo1
BS
-19(0
31
)-1
BS
-4(0
54
)1
AS
-3
1B
S-4
1
BS
-18
1B
S-1
9
1D
S-5
5SD
na1-
AB
D
Bg-
A
Chs
3-A
G
li1a
-AB
D
Gli
1b-A
BD
G
li1c
-AB
D
Gli
3-A
BD
G
lu3a
-AB
D
Glu
3b-A
BD
G
lu3c
-AB
D
Gpi
1-A
BD
H
g-A
L
r10-
A
Lr2
1-D
L
r26-
BLrk10aLrk10bNor1-A
D
QP
ms
fr-B
D
Pm
3a-A
P
m8-
B
Rf3
-B
Rg1
-B
Rg2
-D
rga5
2a
rga5
2b
rgaY
r10a
rg
aYr1
0b
Sr21
-D
Sr31
-B
Sr33
-D
Tri
-AD
Y
r9-B
Y
r10-
B
Yr1
5-B
X
ab
c15
6
Xa
bg
53
Xa
bg
59
Xa
bg
74
Xa
bg
500
X
bcd
98
X
bcd
24
9
Xb
cd1
340
X
bcd
14
34
X
cdo9
9
Xcd
o3
88
X
cdo4
26
Xcd
o4
42
Xcd
o5
80
a
Xcd
o5
80
b
Xcd
o1
42
3
Xcm
wg
64
5a
X
cmw
g758
aX
cmw
g758
bX
cslH
69
Xk
suD
14
a
Xk
suD
14
b
Xk
suD
14
cX
ksu
E1
8
Xks
uE19
X
ksu
F4
3
Xks
uG9
Xm
wg
36
X
mw
g6
0
Xm
wg6
7X
mw
g6
8
Xm
wg5
84
Xm
wg
83
5a
X
mw
g8
37
X
mw
g9
13
a
Xm
wg9
20a
Xm
wg9
20b
Xm
wg
938
a
Xm
wg
20
21
X
mw
g2
04
8a
X
mw
g2
05
6
Xm
wg
20
83
X
mw
g2
14
8a
X
mw
g2
19
7
Xm
wg
22
45
X
psr
38
1a
X
psr
63
4a
X
psr
68
8a
X
psr
68
8b
X
psr
90
8
Xpsr
93
7
Xpsr
96
3
Xrz
24
4
Xw
hs17
9a
Xw
hs17
9b
71
86
71
51
lsquo1S
06
rsquo1
DS
-3(0
48
)-1
DS
-1(0
59
)1
AS
-2
1A
S-3
1
BS
-3
1B
S-7
1
BS
-9
1B
S-2
1
DS
-1
1D
S-2
1
DS
-3
QH
tfr
a-1B
Q
Ld
sfr-
1B
QL
rsf
r-1B
Sr
14-B
Sr
18-D
X
ab
g4
94
X
bcd
34
0
Xbc
d446
X
bcd1
124
Xcd
o5
34
a
Xcd
o5
34b
X
cdo
11
73
X
cdo1
18
8
Xcd
o134
0X
mw
g2
04
8b
X
psr5
96
Xpsr
63
4b
X
psr
68
8c
Xp
sr9
49
Xps
r957
X
rz16
6X
tam
52
X
wg
18
4
Xw
g78
9
Xw
g81
1
20
81
53
48
8
lsquo1S
04
rsquo1
BS
-21(0
49
)-1
BS
-10(0
50
)1
AS
-2
1A
S-1
1
BS
-10
1B
S-1
5
1B
S-2
1
Xb
cd7
62
a
Xbcd
10
72
X
bcd
17
96
X
cdo
12
7
Xcd
o278
X
cdo6
18
X
cdo6
58
X
psr
16
1
Xpsr
16
8
Xpsr
38
1b
X
psr
39
39
33
21
43
lsquo1L
02
rsquo1
DL
-4(0
18
)-1
BL
-6(0
23
)1
AL
-1
1A
L-2
1
BL
-11
1
DL
-4
1D
L-3
1
DL
-1
Xa
bg
373
X
ab
g4
52
X
abg9
58
Xbcd
20
0
Xbc
d207
X
bcd
33
8
Xbcd
38
6
Xbc
d120
1X
bcd
14
49
X
cdo9
2
Xcd
o9
8
Xcd
o637
X
cmw
g645
cX
Esi
47
Xks
uB7
Xk
suH
9
Xm
wg8
37b
Xm
wg
89
6
Xpsr
15
8
Xpsr
54
4b
X
psr
13
27
b
Xrz
58
3
Xw
g180
X
wg
60
5
18
31
76
07
1
lsquo1L
04
rsquo1
DL
-2(0
41
)-1
AL
-4(0
47
)1
AL
-1
1A
L-2
1
AL
-5
1B
L-6
1
BL
-1
1B
L-1
6
1B
L-7
1
BL
-14
1
DL
-1
1D
L-2
Em
=D
or2
Glb
1-A
BD
X
abc1
52a
Xa
bc1
60
X
bcd1
2X
bcd2
2X
bcd
76
2b
X
bcd
92
1
Xcd
o105
X
cdo2
78
Xcd
o3
12
Xcd
o4
19
Xcm
wg
75
8
Xksu
H1
4
Xm
wg
913
b
Xp
sr3
91
Xp
sr6
01
Xp
sr9
57
Xta
g136
X
tag
42
7
Xta
g5
58
16
14
21
12
80
lsquo1L
07
rsquo1
BL
-14
(06
1)-
1B
L-9
(07
3)
1A
L-5
1
AL
-3
1B
L-1
4
1B
L-2
1
BL
-9
1D
L-2
Glu
1-A
BD
L
ec-A
BD
X
ab
c15
1
Xab
g464
X
bcd
31
0
Xb
cd4
54a
X
bcd
45
4b
X
bcd5
92
Xbc
d738
X
bcd1
150a
X
bcd1
150b
X
cdo8
9
Xcd
o312
X
cdo
57
2
Xcd
o637
X
cdo1
396
Xcm
wg6
45b
Xk
suD
49
X
ksu
E8
X
ksu
G2
Xks
uG55
X
mw
g504
X
mw
g5
84
X
mw
g8
35
b
Xm
wg
21
48
b
Xps
r162
X
tag
13
6
Xw
g222
X
wg
98
3
22
21
35
14
40
lsquo1L
09
rsquo1
BL
-5(0
84
)-1
BL
-10
(08
9)
1A
L-3
1
BL
-5
1B
L-1
5
1B
L-1
2
1B
L-3
1
BL
-13
1
BL
-10
Ad
h-A
BD
A
TP
ase-
AB
D
QSd
ksu
-D
Xab
c2
Xab
c152
bX
ab
c25
7
Xab
g2
61
X
abg5
42
Xb
cd2
65
Xb
cd3
04
Xbcd
44
1
Xb
cd4
42
X
bcd
80
8a
X
bcd
80
8b
X
bcd
12
61
X
bcd
15
62
X
bcd1
889
Xbc
d193
0X
cdo2
02
X
cdo1
160
Xcm
wg6
32
Xcm
wg7
06
Xcm
wg
71
0
Xcm
wg7
33
Xk
suE
3
Xksu
E8
X
ksu
E1
9a
X
ksu
E1
9b
X
ksu
E1
9c
Xk
suG
34
X
ksuH
9b
Xks
uH14
X
mw
g68
Xm
wg6
76
Xm
wg7
01
Xm
wg
93
8b
X
tag
16
3
Xta
g71
0
Xta
m2
31
43
14
28
0
lsquo1L
10
rsquo1
BL
-4(1
04
)-1
00
1A
L-3
1
BL
-4
1D
L-2
Xa
bg
387
X
bcd5
08
Xbc
d125
1X
bcd1
514
Xcd
o346
X
cdo3
83
Xcd
o3
93
X
cdo1
189
Xk
suE
11a
X
ksu
E1
1b
X
ksu
I27
a
Xk
suI2
7b
X
mw
g912
X
wg
24
1
11
87
75
3
3548 Nucleic Acids Research 2004 Vol 32 No 12
Ta
ble
1
Con
tinu
ed
GR
Rsa
Fla
nk
ing
del
etio
ns
Del
etio
ns
inth
ere
gio
nM
arker
sG
enes
bc
Gen
es(
)R
ec
()
Siz
e(M
b)
Rec
in
Kb
cM
lsquo2S
09
rsquo2
BS
-7(0
89
)-10
02
BS
-7L
r16-
D
Lr1
7-A
L
r22-
D
Lr3
8-A
Q
Pm
sfr
-A
Sr23
-D
Sr38
-A
Tg-
D
Yr1
7-A
W
2I
Xa
bg
703
Xbc
d18
Xbc
d102
X
bcd
34
8
Xbc
d348
aX
bcd3
48b
Xbc
d718
X
bcd1
970
Xcd
o57
Xcd
o447
X
cdo4
56a
Xcd
o456
bX
cdo4
56c
Xcd
o109
0X
cmw
g682
X
fba4
X
fba2
9X
fba7
0a
Xfb
a70b
X
fba8
2X
fba8
3X
fba3
49
Xfb
b40
Xfb
b61
Xfb
b62a
X
fbb1
21
Xfb
b289
X
ksu
D1
8
Xpsr
10
9
Xps
r566
X
psr6
49
Xp
sr6
66
Xps
r908
X
psr9
33
Xps
r958
X
tag1
97
Xta
g302
X
un
l14
5
X
un
l216
X
un
lBE
44
28
54
Xu
nlB
E4
97
251
X
un
lBE
49
95
23
X
un
lBE
59
09
70
X
un
lBF
20
01
66
X
un
lBF
47
40
28
Xu
nlB
F48
42
66
X
un
lBG
26
33
66
X
un
lBG
60
685
9l
Xw
g51
6
46
37
39
13
00
lsquo2S
08
rsquo2
BS
-14(0
84
)-2
BS
-3(0
79
)2
BS
-14
2B
S-3
Lr2
3-B
L
r-2A
L
r15-
A
Lr2
8-A
Sr
6-A
X
ab
g2
X
bcd2
62
Xb
cd3
48
Xbc
d611
X
bcd
11
84
X
bcd1
688
Xbc
d170
9X
bs12
8X
cdo
64
Xcd
o4
05
X
cdo7
83
Xcd
o128
1X
cdo1
379
Xcd
o147
9X
fbb4
7X
fba8
8X
fba1
06
Xfb
a178
X
fba2
72
Xfb
a300
X
fbb2
79
Xfb
b329
X
fbb3
47
Xks
u904
(Per
2)
Xks
u907
(Sod
)X
mw
g950
X
psr8
04(S
bp)
Xta
g222
X
tam
18
Xta
m72
X
wsu
1
31
39
72
15
lsquo2S
05
rsquo2
DS
-5(0
47
)-2
BS
-8(0
57
)2
DS
-5
2A
S-6
2
BS
-1
2B
S-6
2
BS
-8
Lr1
3-A
N
e2-A
Sr
19-A
Sr
21-A
Sr
36-A
X
bcd1
11
Xbc
d120
X
bcd
15
2
Xbc
d161
X
bcd
85
5
Xbc
d111
9X
cdo3
88
Xcd
o5
37
X
cdo1
376
Xfb
a374
X
fbb0
04
Xfb
b021
X
fbb0
75
Xfb
b212
X
fbb2
26
Xfb
b353
X
ksu
F1
9
Xpsr
13
1
Xpsr
78
3
Xrz
395
Xta
g57
8
Xu
nl1
47
Xu
nl1
49
Xu
nlB
E40
19
39
X
un
lBE
405
71
1
Xu
nlB
E5
18
41
9
Xu
nlB
E5
91
764
X
un
lBG
31
423
4
23
17
21
15
00
lsquo2L
03
rsquo2
DL
-4(0
26
)-2
BL
-2(0
36
)2
DL
-4
2B
L-3
2
BL
-2X
bcd4
45
Xcd
o3
70
Xfb
a199
X
fbb3
35
Xp
sr1
01
Xps
r135
X
psr
38
8
Xps
r489
(Ss2
)X
un
l11
0
Xu
nlB
E4
04
32
8
Xu
nlB
E4
46
789
X
un
lBE
49
68
34
X
un
lBF
48
38
53
94
44
88
00
lsquo2L
05
rsquo2
DL
-3(0
49
)-2
DL
-10(0
47
)2
DL
-3
2D
L-1
0Si
-1
Sr9-
A
Sr21
-A
Yr5
-A
Yr7
-A
Xbc
d543
X
cdo6
84
Xcn
l6
Xcr
872(
Psb
O)
Xfb
a74
Xfb
b99
Xksu
F4
3
Xk
suG
30
Xp
sr1
02
Xps
r107
X
psr
11
2
Xps
r129
X
psr1
51
Xps
r380
X
psr3
86
Xps
r390
X
psr5
71
Xps
r575
X
psr6
02
Xps
r919
X
psr9
61
Xta
g293
X
tam
8X
un
lBE
51
81
42
X
un
lBG
26
35
21
Xw
g40
5
Xw
g99
6
Xw
ye19
22(S
be)
23
17
94
50
lsquo2L
08
rsquo2
AL
-3(0
77
)-2
AL
-1(0
85
)2
AL
-3
2A
L-1
Xbcd
13
5
X
bcd3
07
Xfb
a62
Xfb
a64
Xfb
a111
X
fba3
41b
Xk
suD
22
X
ksu
E1
6
Xksu
F2
Xk
suG
5
Xm
wg2
025
Xu
nl1
36
X
un
lBE
51
76
22
X
un
lBE
51
79
92
X
un
lBG
60
71
96
10
43
67
20
0
lsquo2L
10
rsquo2
DL
-6(0
95
)-1
00
2D
L-6
D1-
D
D2-
B
Dfq
1-d
PL
_AP
P
m4-
A
QP
ms
fr-D
Q
Fhs
nds
u-A
Sr
16-B
Sr
28-B
X
bcd
26
6
Xbcd
29
2
Xb
cd4
10
Xbc
d512
X
bcd
10
95
X
bcd
12
31
X
cdo3
6
Xcd
o3
73
X
cdo6
78
Xcd
o100
8X
cdo1
410
Xcm
wg
66
0
Xfb
a8
Xfb
a11
Xfb
a62b
X
fba1
02
Xfb
a122
X
fba2
09a
Xfb
a209
bX
fba2
76
Xfb
a310
X
fba3
11
Xfb
a314
X
fba3
45
Xfb
a359
X
fba3
85
Xfb
b9
Xfb
b32
Xfb
b68
Xfb
b113
X
fbb2
51
Xfb
b276
X
fbb2
84
Xfb
b377
X
ksu9
06(C
bp2)
X
ksu9
08(C
bp1)
X
ksu9
09(C
hi1)
X
ksu9
10(T
ha)
Xks
uD23
X
ksu
F1
1
X
ksu
F4
1
Xk
suH
9
Xksu
H1
6
Xk
suI2
4
Xm
wg5
46
Xps
r331
X
psr3
35
Xps
r540
X
psr6
30
Xps
r644
X
psr6
81
Xps
r692
X
psr9
24
Xps
r932
X
psr9
34
Xps
r956
X
tag2
78a
Xta
g278
bX
tag2
78c
Xta
g558
X
tag6
10a
Xta
g610
bX
tag6
10c
Xta
g632
X
tag6
53
Xta
g664
X
tag6
84
Xta
g699
X
un
l142
Xu
nlB
F4
74
053
Xw
g18
4
X
wg
64
5
X
wsu
2
58
68
22
27
5
lsquo3S
09
rsquo3
BS
-3(0
87
)-10
03
BS
-3C
970
Eps
-A
Lr2
7-B
Sr
2-B
Y
rns
B1-
A
QP
ms
fr-D
Q
Fhs
nds
u-B
X
ab
c17
1
Xbcd
15
X
bcd
90
7
Xbcd
12
78
X
cdo4
59
Xcd
o4
60
X
cdo
54
9
Xfb
a1
90
Xfb
a311
X
fbb1
47a
Xfb
b166
X
fbb1
85
Xfb
b370
X
psr1
196
Xps
r120
0X
psr1
327
Xks
u913
(Pal
)X
ksuD
18
Xksu
G5
3
Xksu
I19
X
psr3
04
Xps
r305
X
psr9
07
Xsf
r2(L
rk10
)X
tag
68
3
Xta
m47
X
ttu1
934(
Hsp
169
b)
39
36
46
11
07
Nucleic Acids Research 2004 Vol 32 No 12 3549
Ta
ble
1
Con
tinu
ed
GR
Rsa
Fla
nk
ing
del
etio
ns
Del
etio
ns
inth
ere
gio
nM
arker
sG
enes
bc
Gen
es(
)R
ec
()
Siz
e(M
b)
Rec
in
Kb
cM
lsquo3S
08
rsquo3
AS
-3(0
71
)-3
BS
-3(0
87
)3
AS
-3
3B
S-7
3
BS
-8E
st-2
-AB
D
Lr3
2-D
P
m13
-B
Xab
g4
60
X
abg4
71
Xb
cd7
06
Xbc
d142
8X
bcd
15
32
X
bcd
18
23
X
cdo
39
5
Xcd
o4
07
X
cdo6
38
X
cdo1
164
Xcd
o1
34
5
Xcd
o1
43
5
Xfb
a9
1
Xfb
a241
X
fbb2
4X
fbb1
42
Xfb
b315
X
fbb
36
6
Xk
suA
6
Xm
wg2
2X
psr
59
8
X
psr9
46
Xta
m5
5
Xta
m6
1
31
39
25
58
0
lsquo3S
05
rsquo3
DS
-1(0
39
)-3
BS
-2(0
56
)3
BS
-2
3D
S-6
3
DS
-5
3D
S-8
3
DS
-1A
TP
ase
a-A
BD
E
st-1
-AB
D
QL
rst
f-B
s-
1-D
X
abg3
90
Xb
cd1
27
X
bcd1
380a
X
cdo3
28
Xcd
o4
80
X
ksu
E2
X
ksu
G1
3
Xksu
H7
X
psr
12
3
Xps
r547
X
psr
68
9
Xpsr
90
2
Xps
r903
X
psr
91
0
X
psr
92
6
Xps
r919
X
psr1
060
Xta
g223
X
tag5
38
Xta
g554
X
tag
72
4
Xta
g756
X
ttu1
935(
Hsp
173
)
31
20
60
43
32
lsquo3L
03
rsquo3
BL
-8(0
28
)-3
BL
-9(0
38
)3
AL
-1
3B
L-1
3
BL
-8
3B
L-9
3
DL
-2A
TP
ase
b-A
BD
G
ot3-
AB
D
Mal
-1-A
BD
S-
1-D
Sr
12-B
X
abc1
76
Xb
cd1
34
Xbcd
36
6
Xb
cd9
27
Xb
cd1
127
X
bcd
11
42
Xbcd
11
45
X
bcd
13
80
X
cdo
54
X
cdo1
18
Xcd
o1
174
X
cdo1
283a
X
fbb2
77
Xksu
G3
6
Xm
wg
68
0
Xm
wg6
88
Xm
wg
802
X
psr
56
X
psr
11
6
Xp
sr1
56
X
psr3
54
Xps
r543
X
psr5
70
Xp
sr1
077
Xps
r114
9X
tag2
21
20
15
19
13
82
lsquo3L
05
rsquo3
AL
-3(0
42
)-3
BL
-10
(05
0)
3A
L-3
3
AL
-7
3B
L-3
3
BL
-10
AT
Pas
ec-
AB
D
Xab
g3
96
X
bcd1
15
Xbc
d288
X
bcd
45
2
Xb
cd8
09
Xbcd
14
18
Xbcd
20
44
X
cdo
28
1
Xcd
o5
34
Xcd
o583
X
cdo7
18
Xcd
o140
6X
fba
21
3
Xfb
a2
14
Xfb
a220
X
fba2
42
Xfb
b156
X
fbb1
77
Xfb
b348
X
ksu9
09(C
hi1)
X
ksu
H2
Xm
wg8
18
Xm
wg9
61
Xpsr
74
Xp
sr7
8
Xp
sr5
78
X
psr7
54
Xps
r804
(Sbp
)X
tag1
18
Xta
g577
X
wg
17
7
Xw
g1
78
22
92
21
85
0
lsquo3L
08
rsquo3
AL
-5(0
78
)-3
DL
-3(0
81
)3
AL
-5
3B
L-1
1
3D
L-3
Xab
g4
Xbcd
22
X
bcd
14
1
Xbc
d147
X
bcd
37
2
Xb
cd5
15
Xb
cd1
555
X
csc4
75(T
lp)
Xfb
b168
X
fbb
27
1
Xfb
b332
X
fbb3
53
Xfb
b378
X
ksu
H1
5
Xm
wg3
0X
mw
g69
Xps
r106
7X
tag
71
8
Xta
m33
X
wg
11
0
X
wia
483(
Cxp
1)
14
10
14
60
9
lsquo3L
09
rsquo3
DL
-3(0
81
)-1
00
3A
L-8
3
DL
-3
3B
L-1
1C
hi2-
D
EST
-5-A
BD
L
r24-
D
R1-
AB
D
R2-
AB
D
R3-
AB
D
Sr24
-D
Sr35
-A
Xa
bc1
61
Xab
c166
X
abc1
72a
Xab
c172
bX
abc1
72c
Xa
bc1
74
X
abg5
5X
abg3
77
Xab
g387
X
ab
g3
89
Xb
cd1
31
Xb
cd3
58
Xbcd
36
1
Xbcd
45
1
Xb
cd1
661
X
bcd1
773
Xcd
o1
05
X
cdo
11
3
Xcd
o127
bX
cdo2
81
Xcd
o4
82
Xfb
a8(H
b)
Xfb
a1
33
Xfb
a1
67
X
fba3
47
X
fba3
60
Xfb
a389
X
fbb1
47b
Xfb
b147
c
Xfb
b2
50
Xfb
b269
X
fbb2
93
Xfb
b3
16
Xks
u912
(Prp
)X
ksu9
14(G
lb3)
aX
ksu9
14(G
lb3)
bX
ksu9
14(G
lb3)
cX
ksu9
14(G
lb3)
dX
ksu
D1
9
Xksu
E1
4
Xks
uE3
Xksu
G4
8
X
ksuG
59
Xk
suG
62
X
mw
g11
Xm
wg1
2X
psr
17
0
Xps
r388
X
psr9
04
Xpsr
93
1
Xpsr
12
03
Xps
r120
5X
rsq8
05(E
mbp
)X
tam
63
Xuc
d111
(Esi
48)
Xw
ia80
7(G
lb33
)X
wia
858(
Glb
35)
44
66
71
49
0
lsquo4S
09
rsquo4
DS
-2(0
82
)-1
00
4D
S-2
ms1
-B
ms2
-D
Xab
g460
X
fbb1
X
ksu9
15(1
4-3-
3a)
Xks
u916
(Oxo
)X
ksu9
17(T
ha)
Xks
u918
(Chi
2)
Xm
wg5
84
Xm
wg6
34
Xps
r332
X
psr9
21
Xrs
q808
(Glo
)X
un
l216
X
un
l164
X
wg
62
23
02
45
34
40
0
lsquo4S
07
rsquo4
DS
-1(0
53
)-4
DS
-3(0
67
)4
DS
-1
4B
S-2
4
DS
-5
4D
S-3
Adh
-B1
Gai
1-B
G
ai2-
D
Gai
3-B
L
r25-
B
Pm
7-B
R
ht1-
B
Rht
10-D
R
ht2-
D
X7S
Glo
b-a
X7S
Glo
b-c
X7S
Glo
b-d
Xab
g55
Xab
g387
X
bgl4
85(G
er)1
X
bgl4
85(G
er)2
X
cdo6
69
Xcd
o795
X
cdo1
33
8
XD
hn6
Xfb
a40
Xfb
a78
Xfb
a320
X
fbb2
27
Xm
wg8
44
Xm
wg2
033
Xp
sr1
10
Xp
sr1
39
Xp
sr1
44
Xp
sr5
41
Xp
sr5
84
Xps
r593
X
psr6
48
Xps
r922
X
psr1
871(
Pki
)X
ucb8
21(P
hyA
)X
un
l133
X
wg
18
4
Xw
g87
6
70
61
41
13
50
lsquo4L
05
rsquo4
DL
-13(0
56
)-4
DL
-6(0
35
)4
DL
-13
4D
L-8
4
DL
-1
4D
L-7
4
DL
-6
4D
L-6
Ba-
B
Hd-
A
Xab
g383
X
abg4
84
Xbcd
11
0
Xbc
d327
X
bcd7
34
Xb
cd1
006
Xbc
d109
2X
bcd1
117
Xbc
d126
5X
bcd1
652
Xbg
l485
(Ger
)3
Xcd
o3
8
Xcd
o64
Xcd
o1
89
X
cdo3
88
Xcd
o4
88
Xcd
o1
387
X
cdo1
401
Xfb
b251
X
Fbp
-D
Xks
uD18
X
ksuF
8X
ksuH
5X
ksuH
8X
mw
g948
X
Pot
-t
Xps
r39(
Fbp
)X
psr
10
4
Xp
sr1
57
Xp
sr1
63
Xps
r860
(Uba
)X
psr9
20
Xps
r927
X
psr1
318
Xrz
251
Xtt
u193
6(H
sp26
6a)
X
ucd1
02(E
si3)
X
wg1
10
38
15
70
63
50
lsquo4L
07
rsquo4
AL
-2(0
75
)-4
AL
-11(0
66
)4
AL
-11
4A
L-7
4
AL
-5
4B
L-3
4
BL
-7
4D
L-2
4
BL
-5
4D
L-1
2
4A
L-9
4
AL
-2
Xab
g390
X
bcd
15
Xbc
d130
X
bcd1
670
Xbn
l50
9X
cdo4
75
Xcd
o4
84
X
cdo5
41
X
fba2
31
Xfb
b154
X
ksu9
19(L
p)
Xks
uD9
Xks
uE6
Xks
uE9
Xks
uG12
X
mw
g549
X
mw
g710
X
psr5
9X
psr
11
5
Xp
sr5
80
Xps
r914
X
psr1
206
Xu
nl1
01
X
wg
18
1
22
12
37
40
00
lsquo4L
09
rsquo4
DL
-14(0
86
)-1
00
4B
L-1
0
4D
L-1
4be
ta-A
my-
1-A
BD
H
p-A
BD
Q
Pm
sfr
-D
Lr2
8-A
Sr
7-A
X
abg3
97
Xak
466(
Nra
)X
bcd1
29
Xbc
d143
1a
Xcd
o20
Xcd
o545
X
cdo9
49
Xcd
o108
1X
cdo1
31
2
Xcd
o1
333
X
cdo1
528
Xfb
a177
X
fbb6
7X
fbb1
14
Xfb
b178
X
fbb1
82
Xfb
b226
X
fbb2
55
Xks
u910
(Tha
)X
ksu9
20(O
xo)2
X
ksu
C2
X
ksu
G1
0
Xm
td86
2(C
M16
)X
mw
g851
X
psr1
19
Xps
r160
(Plc
)X
psr1
64
Xps
r375
X
psr4
84(C
at)
Xps
r567
X
psr5
73
Xps
r604
X
psr1
051
Xum
c190
(Css
1)
Xu
nl1
63
X
wg
11
4
Xw
g789
40
68
60
12
20
3550 Nucleic Acids Research 2004 Vol 32 No 12
Tab
le1
C
onti
nued
GR
Rsa
Fla
nk
ing
del
etio
ns
Del
etio
ns
inth
ere
gio
nM
arker
sG
enes
bc
Gen
es(
)R
ec
()
Siz
e(M
b)
Rec
in
Kb
cM
lsquo5S
09
rsquo5
AS
-6(0
97
)-5
BS
-6(0
81
)5
AS
-6
5B
S-6
Gsp
-AB
D
Ha-
D
Xa
bg
479
X
ab
g7
05
Xbcd
87
3
Xcd
o959
X
fba1
14
X
fba
36
7
Xfb
b1
21
X
fbb
27
6
Xfb
b277
X
mw
g8
35
X
psr
17
0
Xps
r618
X
psr2
152b
X
tag
31
7
Xw
g687
29
60
43
23
89
lsquo5S
07
rsquo5
AS
-3(0
75
)-5
DS
-5(0
67
)5
AS
-3
5D
S-5
No
r-A
P
m2-
D
Xb
cd1
871
X
cdo
68
7
Xcd
o7
49
X
fba1
31
Xfb
a2
32
X
fba
34
2
Xfb
a352
X
fba3
93
X
ksu9
22(T
ha)
X
psr
32
6
Xpsr
62
8
Xpsr
94
0a
X
psr
94
0b
X
psr
94
5
Xta
g31
9
Xta
g62
9
Xta
m5
3a
Xta
m5
3b
Xu
bp
3
Xu
bp
5
Xuc
w14
1
39
28
21
30
00
lsquo5S
06
rsquo5
BS
-8(0
56
)-5
BS
-4(0
43
)5
BS
-8
5D
S-1
5
BS
-4X
bcd
11
30
X
cdo3
44
X
cdo
45
9a
X
cdo
45
9b
X
cdo6
77
a
Xcd
o6
77
b
Xcd
o1
33
5
Xk
suI2
6
Xpsr
11
8
Xp
sr9
29
Xp
sr1
204
X
rg4
63
Xrg
90
1
Xta
m5
42
45
19
63
33
lsquo5S
04
rsquo
5A
S-1
(04
0)-
04
5
5B
S-9
5
BS
-2
5B
S-3
5
AS
-1M
s3-A
X
ksu
G60
X
ksu
H8
Xpsr
11
8
Xpsr
90
3
Xps
r946
X
wg
34
1
Xw
g3
63
14
31
34
33
3
lsquo5L
03
rsquo5
BL
-6(0
26
)-5
DL
-10(0
35
)5
BL
-6
5B
L-2
5
BL
-15
5
BL
-7
5D
L-1
0
5A
L-1
9A
dh-1
-AB
D
Xab
c164
X
bcd
15
7
Xbcd
20
4
Xbcd
50
8b
Xb
cd1
087
Xcd
o785
X
cdo1
04
9
Xfb
a137
X
fbb2
38
Xksu
26
Xksu
D1
6
Xksu
D3
0
X
ksu
D4
2
Xksu
G4
4a
X
ksu
M2
Xm
wg5
61
Xps
r109
X
psr
12
0a
X
psr
12
8
Xps
r335
X
psr3
60
Xps
r574
X
psr8
60(U
ba)
Xps
r906
X
psr1
327
Xta
g22
2
Xuc
w12
7X
wg
41
9
Xw
g56
4
Xw
g90
9
10
84
54
09
1
lsquo5L
05
rsquo5
DL
-12(0
48
)-5
DL
-1(0
60
)5
BL
-1
5B
L-3
5
BL
-5
5B
L-1
1
5D
L-1
2
5D
L-1
Crr
K
r1
Lr1
8P
h1
-B
Xa
bc1
68
Xa
bc3
02
Xab
c71
7
Xab
g6
9
Xa
bg
314
X
ab
g3
87
X
ab
g4
73
Xbcd
9
X
bcd
21
X
bcd
15
7
X
bcd
30
7a
X
bcd
35
1a
X
bcd
35
1b
X
bcd
50
8
Xbc
d926
X
bcd9
81
Xb
cd1
088
X
bcd1
140
Xbc
d187
4X
bcd
19
49
X
cdo5
7
Xcd
o3
88a
X
cdo4
12
X
cdo5
48
a
Xcd
o7
86
a
Xcd
o7
86b
X
cdo1
09
0
Xcd
o116
8X
cdo
11
92
X
fba1
27
X
fba1
66
Xfb
b1
22a
Xfb
b156
X
ksu
8a
X
ksu
8b
X
ksu
8c
Xk
su24
Xk
su92
3(P
r1b
)X
ksu
G7
Xk
suG
12
X
ksu
G44
b
Xksu
H1
X
ksuM
9X
ksu
P6
X
ksu
Q10
X
ksu
Q24
X
ksu
Q35
X
ksu
Q45
a
X
ksu
Q60
X
ksu
Q6
4
Xksu
Q65
Xksu
S1
X
mb
g3
01
Xm
gb1
Xm
gb1
0
Xm
gb
63
X
mg
b1
74
X
mg
b1
91
X
mg
b3
01
X
mg
b3
41
X
mw
g5
2
Xm
wg
55
2
Xm
wg
58
3
Xm
wg
592
X
mw
g6
04
Xm
wg6
24
Xm
wg
76
8
Xm
wg
914
Xm
wg
923
X
mw
g9
56
a
Xm
wg
95
6b
X
psr
10
0
Xpsr
12
0b
Xps
r492
(Acl
3)
Xps
r637
X
psr8
06(A
cl2)
X
psr9
11
Xps
r912
X
psr1
202
Xta
g61
4
Xta
g6
44
Xu
bp
25
X
ucd1
04(E
si14
)X
un
l4
Xu
nl1
04
X
un
l109
X
un
l113
X
un
l116
X
un
l117
X
un
l119
X
un
l12
1
Xu
nl1
23
X
un
l13
8
Xu
nl1
39
X
un
l14
1
Xu
nl1
52
Xu
nl1
60
Xu
nl1
69
X
un
l191
X
un
l21
3
Xu
nl2
14
X
un
l21
7
Xu
nl2
18
X
un
l22
4
Xw
g3
64
X
wg
53
0
Xw
g56
4
Xw
g8
89
Xw
g102
6
36
20
61
20
33
lsquo5L
08
rsquo5
BL
-14
(07
5)-
5B
L-1
6(0
79
)5
BL
-9
5B
L-1
4
5B
L-1
6
5D
L-5
5
DL
-9d
hn
2-A
BD
F
r1-A
Ib
f-1-
AB
D
hsp1
69b
-A
Mpc
1Q
-A
Qkb
cnl
-5A
bts
n1-B
V
rn1-
A
Vrn
3-D
X
ab
c15
5
Xa
bc3
09
Xa
bg
391
X
bcd1
83
Xbcd
30
7b
Xb
cd4
50
Xb
cd8
81
Xbcd
10
30
X
bcd
12
35
a
Xbcd
14
27
X
cdo
87
X
cdo
34
8
Xcd
o4
00
X
cdo4
57
X
cdo
46
5
Xcd
o4
84
X
cdo5
04
Xcd
o5
48b
X
cdo5
84
X
cdo1
18
9
Xcd
o1
32
6
Xcd
o1
475
X
cdo1
508
Xfb
a6
8
Xfb
a190
X
fba2
09
Xfb
a332
X
fba3
48
X
fba3
51
X
fbb2
6X
fbb
16
6
Xfb
b199
X
fbb2
09
Xfb
b2
37
X
fbb
25
5b
Xfb
b322
X
fbb3
23
Xfb
b328
X
ksu
91
9(L
pX
)X
ksu
92
3(P
r1a
)X
ksu
F1
X
ksu
G1
4
Xksu
G57
Xksu
P1
0
Xk
suP
18
X
ksu
P2
0
Xksu
P2
1
Xk
suP
23
X
ksu
P5
0
Xksu
P6
4
Xk
suQ
13
X
ksu
Q16
X
ksu
Q3
2
Xksu
Q3
4
Xksu
Q4
5b
X
ksu
Q5
8
Xksu
Q5
9
Xksu
Q6
3
Xksu
Q66
X
ksu
Q67
X
mw
g7
2
Xm
wg
76
Xm
wg
51
4
Xm
wg
51
6
Xm
wg
55
0
Xm
wg
60
2
Xm
wg
71
6
Xm
wg
740
X
mw
g8
62
X
mw
g9
00
X
mw
g9
22
X
mw
g9
33
Xps
r14(
alph
a-A
my-
3-A
BD
)X
psr
79
X
psr
11
5
X
psr
13
1
Xp
sr1
45
Xps
r575
X
psr8
19(A
dpg1
-AB
D)
Xps
r918
X
psr9
63
Xps
r119
4X
rsq8
05(E
mpb
-AB
D)
Xrz
32
8
Xrz
39
5
Xrz
57
5
Xrz
58
9
Xrz
74
4
Xta
g69
X
tag
16
5
Xta
g25
1
Xta
g35
4
Xta
g6
21
X
tag
65
1
Xta
g69
5a
X
tag
69
5b
X
un
l137
Xu
nl1
40
X
wg
64
4
Xw
g90
8
36
40
20
30
8
lsquo5L
09
rsquo5
AL
-23(0
87
)-1
00
5A
L-2
3B
1-A
be
ta-A
my-
1-A
L
r1-D
Q
kbc
nl-5
Aa
Rh1
2-A
X
abg3
66
Xbc
d110
3X
bcd
12
35
b
X
bcd1
421
Xbc
d167
0X
cdo2
0X
cdo
21
3
X
cdo3
46
Xcd
o3
88b
X
cdo
13
12
X
cdo1
528
Xfb
b100
X
fbb2
13
Xfb
b249
X
fbb3
30
Xk
suQ
62
X
mw
g211
2X
psr
37
0
Xps
r567
aX
psr5
67b
Xpsr
58
0
Xps
r120
6X
psr1
316
Xta
g69
5
X
tag
75
4
Xw
g11
4
11
29
66
16
50
Nucleic Acids Research 2004 Vol 32 No 12 3551
Ta
ble
1
Con
tinu
ed
GR
Rsa
Fla
nk
ing
del
etio
ns
Del
etio
ns
inth
ere
gio
nM
arker
sG
enes
bc
Gen
es(
)R
ec
()
Siz
e(M
b)
Rec
in
Kb
cM
lsquo6S
10
rsquo6
DS
-6(0
99
)-1
00
6A
S-5
6
BS
-3
6B
S-6
6
BS
-2
6D
S-6
6
DS
-4L
r36-
B
Nor
2-B
Q
Gpc
nds
u-B
Q
Pm
sfr
-B
Sr5-
D
Sr8-
A
Su1-
B
Xab
g387
X
abg4
58
Xab
g466
X
ak46
6(N
ra)
Xbc
d21
Xbc
d342
X
bcd1
821
Xcd
o476
X
cdo1
380
Xcm
wg6
20
Xcm
wg6
52
Xcm
wg6
79a
Xcm
wg6
79b
Xcm
wg
69
0
Xfb
a1
X
fba8
5
Xfb
a1
87
Xfb
a3
44
X
fbb3
54
X
ksuE
3X
ksuF
36
Xks
uF43
X
ksu
G8a
X
ksu
G8b
X
ksu
G48
Xk
suH
4
Xksu
I28
X
ksuM
5X
mw
g59
Xm
wg7
9X
mw
g573
X
mw
g6
52
Xm
wg8
20
Xm
wg8
87
Xm
wg
91
6
Xm
wg
96
6
Xpa
p4
Xpsr
8(C
xP
3)a
X
psr
8(C
xP
3)b
X
psr
10
(Gli
-2)
Xpsr
10
6a
X
psr
14
1b
X
psr1
67
Xpsr
30
1a
X
psr5
46
Xp
sr5
51
Xps
r563
X
psr
62
7
Xps
r662
X
psr8
99
Xps
r904
X
psr
91
6
Xpsr
96
4
Xps
r967
X
rgc6
9X
tag5
37
Xta
g562
X
tag5
82
Xta
g75
2
Xta
m60
X
uta
2(P
sif)
82
89
10
16
4
lsquo6S
05
rsquo6
DS
-2(0
45
)-6
AS
-5(0
65
)6
AS
-4
6A
S-5
6
AS
-1
6B
S-8
6
BS
-5
6B
S-1
6
DS
-4
6D
S-2
Xa
bc1
73
Xcd
o270
X
cdo
53
4
Xcd
o115
8X
fba6
7
Xfb
a1
48
Xfb
a3
99
X
fbb2
31
X
cmw
g653
X
psr
14
1a
X
psr
31
2
Xps
r962
X
tam
31
X
rz4
76
X
uta
1(P
sif)
18
94
16
94
9
lsquo6L
04
rsquo6
BL
-3(0
36
)-6
BL
-4(0
44
)6
AL
-6
6A
L-4
6
AL
-1
6B
L-4
6
BL
-5
6B
L-3
6
DL
-6
6D
L-1
Xa
bc1
63
Xa
bc1
75
X
ab
g2
0
Xab
g379
X
ab
g3
88
X
abg4
74
Xb
cd1
02
Xbc
d758
X
cdo2
9X
cdo
204
Xcd
o497
X
cdo5
07
Xcd
o7
72
X
cdo1
315
Xcd
o142
8X
cmw
g6
53
X
cmw
g6
64
X
fba3
28
X
fba3
67
X
fba
39
7
Xfb
b9
5
Xfb
b2
83
Xfb
b3
64
X
ksuD
17
Xks
uG58
X
ksuM
151
Xm
wg
872
Xm
wg
911
X
mw
g206
1X
psr1
13
Xpsr
14
2
Xp
sr3
71
Xp
sr4
63(P
rk)
Xps
r831
X
psr9
08
Xp
sr9
15
Xrs
q8
05
(Em
bp
)X
tag3
17
Xta
g33
4
Xta
m6
Xta
m9
Xta
m10
X
tam
27
Xta
m31
X
tam
57
Xu
cd1
09
(Esi
35
)X
VA
tp-B
2X
wg2
23
Xw
g93
3
30
21
15
84
7
lsquo6L
07
rsquo6
AL
-1(0
69
)-6
BL
-6(0
76
)6
AL
-1
6A
L-5
6
BL
-9
6B
L-8
6
BL
-14
6
BL
-1
6B
L-6
6
DL
-1
6D
L-1
2
6D
L-7
6
DL
-13
Xa
bg
1
Xfb
b2
15
X
ksuF
24
Xm
wg8
20
Xm
wg
20
29
X
npi2
53
Xps
r149
X
psr
30
1b
X
tag4
95
Xta
m1
7
Xta
m7
4
Xuc
w26
X
wg
28
6
Xw
g341
10
66
01
17
65
lsquo6L
09
rsquo6
AL
-8(0
90
)-1
00
6A
L-8
6
BL
-6
6D
L-1
3A
HV
5D
hn3
Got
2-A
BD
H
t3-D
N
or7-
B
Lr3
-B
Sr11
-B
Sr13
-A
Sr29
-D
WsP
16
Xab
c154
X
abc4
51
Xab
g652
X
bcd
1
Xbc
d269
X
bcd
27
6
Xbc
d880
X
bcd1
510
Xcd
o388
X
cdo5
16
Xcd
o836
X
cdo1
091
Xcm
wg
66
9
Xcm
wg
67
4
Xcm
wg
68
4
Xcm
wg
716
Xcs
b1
12b
(Dh
n5
)X
fba1
X
fba4
2
Xfb
a8
1
Xfb
a1
11
X
fbb
40
X
fbb5
7
Xfb
b5
9
Xfb
b7
0
Xfb
b8
2
Xfb
b1
64
Xfb
b1
69
X
fbb1
70
X
fbb
22
1
Xfb
b3
27
X
ksu
D1
Xks
uD12
X
ksuD
17
Xks
uD27
X
ksuE
14
Xks
uF14
aX
ksuF
14b
Xks
uF19
X
ksuF
37
Xks
uG30
X
ksu
G51
X
ksuM
1X
ksuM
75
Xm
wg
19
Xm
wg
21
X
mw
g7
4a
Xm
wg
74
b
Xm
wg5
13
Xm
wg
514
X
mw
g7
98
X
mw
g813
X
mw
g838
X
mw
g887
X
mw
g897
X
mw
g934
X
mw
g2
053
X
mw
g2
10
0
Xp
sr2
(a-a
my1
)a
Xpsr
2(a
-am
y1)b
X
psr1
06b
Xps
r134
X
psr1
54
Xps
r546
X
psr6
05
Xpsr
90
4
Xpsr
90
8
Xps
r966
X
psr
96
7
Xrg
c74
Xta
g495
X
tag5
20
Xta
g547
X
tag6
80
Xta
g70
5
Xta
g762
X
tam
10
b
Xta
m21
X
tam
26
Xta
m2
8
Xta
m3
6
Xu
cd1
06
(Esi
18
)X
wg
34
1
Xw
g4
05
60
72
45
82
5
lsquo7S
09
rsquo7
AS
-1(0
90
)-1
00
7A
S-1
7
AS
-9P
gd3-
A
Xab
g378
X
abg7
04
Xb
cd9
3
Xbcd
13
0
Xb
cd5
88
Xb
cd9
07
Xbcd
18
72
X
cdo5
45
X
cdo
14
00
X
fba8
X
fba1
7X
fba6
5X
fba7
2X
fba9
3X
fba1
09
Xfb
b121
X
fba1
27
Xfb
a311
bX
fba3
21
Xfb
b9
Xfb
b156
X
fbb2
78
Xk
suD
9
Xm
wg5
30
Xm
wg
90
5
Xm
wg
20
80
X
psr
11
9
Xp
sr1
60(P
lc)
Xp
sr3
86
Xpsr
39
2
Xpsr
56
3
Xps
r648
X
psr8
33(P
er)
Xps
r946
aX
psr9
46b
Xta
g18
4
Xta
g6
1
Xum
c190
(Css
1)
Xu
nl2
22
X
un
l223
X
wye
835(
Wx)
30
32
40
14
81
lsquo7S
08
rsquo7
AS
-7(0
87
)-7
AS
-2(0
73
)7
AS
-7
7A
S-1
2
7A
S-2
Lr3
4-D
N
ar7-
A
Pc1
-B
Xab
c15
1
X
ab
c15
2
Xa
k4
66(N
ra)
Xbcd
14
38
X
cdo
43
1
X
cdo
47
5
Xcd
o5
34
Xcd
o6
76
Xcd
o7
80
X
cdo1
18
9
X
cdo
13
95
X
fba4
2X
fba3
46
Xfb
a377
X
fbb6
7a
Xfb
b186
aX
ksu
A1
Xk
suD
25
Xk
suE
3
Xksu
F4
8
Xk
suH
8
Xm
wg7
10
Xps
r490
(Ss1
-AB
D)
Xps
r604
X
psr6
62
Xrj
19
Xrz
2X
tam
13
Xta
g65
1
Xw
g83
4
23
22
36
19
78
lsquo7S
04
rsquo7
AS
-10
(04
5)-
7D
S-5
(03
6)
7D
S-1
7
DS
-5
7A
S-1
0
7A
S-5
Am
p-3-
A
Brz
-A
Est
3-A
P
an2-
A
Rc1
-A
Rc3
-D
Xa
bc4
65
Xbcd
31
0
Xbcd
38
5
Xb
cd7
07
Xb
cd9
81
Xb
cd1
06
6
Xbcd
13
38
X
bcd
17
73
X
cdo
57
X
cdo7
8
X
cdo9
1
X
cdo5
95
Xcm
wg
66
9
Xcm
wg
70
4
X
fba3
2X
fba2
48
Xfb
a340
X
fba3
71
Xfb
b150
X
fbb1
95
Xfb
b226
X
fbb2
64
Xk
suD
15
X
ksu
S1
X
mw
g8
9
Xpsr
10
3
Xp
sr1
08
Xp
sr1
50
Xp
sr1
52
Xps
r492
(Acl
3)
Xp
sr9
55
Xps
r192
1X
rj5
X
tam
64
X
un
l13
4
Xu
nl1
57
Xu
nl1
61
X
wg
18
0a
31
43
29
85
3
3552 Nucleic Acids Research 2004 Vol 32 No 12
Tab
le1
C
onti
nued
GR
Rsa
Fla
nk
ing
del
etio
ns
Del
etio
ns
inth
ere
gio
nM
ark
ers
Gen
esbc
Gen
es(
)R
ec
()
Siz
e(M
b)
Rec
in
Kb
cM
lsquo7S
02
rsquo7
AS
-4(0
26
)-7
BS
-3(0
16
)7
AS
-6
7A
S-4
7
DS
-3
7B
S-3
Xa
bg
476
a
Xb
cd9
8
Xbcd
34
9
Xcm
wg
70
5
Xfb
a363
X
fbb3
43
Xm
wg
808
X
psr
65
X
rz4
X
tag
30
1
Xta
g53
6
Xta
g65
8
Xw
g5
22
Xw
g66
91
02
36
21
687
lsquo7L
01
rsquo7
DL
-6(0
10
)-7
AL
-4(0
18
)7
DL
-6
7A
L-4
7
BL
-14
Xcd
o5
51
X
cdo1
19
9
Xpsr
16
9
Xp
sr3
03
Xta
g43
9
Xta
g64
23
13
31
52
78
lsquo7L
03
rsquo7
AL
-3(0
29
)-7
BL
-1(0
40
)7
AL
-3
7B
L-2
7
BL
-1
7D
L-5
Am
y2-A
V
Atp
-B1-
A
Xab
c455
X
ab
g4
76
b
Xcd
o5
3
Xcd
o6
73
X
cdo
92
0
Xcd
o1
40
7
Xcd
o1
42
8
Xh
r20b
X
mw
g2
03
1
Xm
wg8
25
Xpsr
10
5
Xpsr
16
5
Xp
sr3
11
Xp
sr3
40
Xp
sr3
89
Xps
r468
(Pep
c)
Xpsr
51
4
Xpsr
69
0
Xps
r803
(Fed
)X
psr
93
8
Xta
g5
98
X
ubp2
X
un
l188
X
wg
46
6
Xw
g68
6a
X
wg
71
9
Xw
ye19
58(A
dpg3
)
19
54
51
38
89
lsquo7L
08
rsquo7
DL
-4(0
76
)-7
AL
-2(0
87
)7
AL
-21
7
AL
-6
7B
L-1
0
7B
L-1
3
7A
L-8
7
AL
-13
7A
L-1
6
7A
L-2
7
DL
-4
Ep-
D1b
-D
Lr1
9-D
P
m5-
B
Sr22
-A
VA
tp-A
-A
Xab
c305
X
ab
c31
0
Xbc
d178
X
bcd
19
30
X
cdo6
65
X
cdo6
86
Xcd
o7
75
Xcd
o962
X
fba6
9X
fba9
7X
fba2
04
Xfb
a234
X
fba2
59
Xfb
a264
X
fba3
01
Xfb
a350
X
fba3
82
Xfb
b67b
X
fbb7
9X
fbb1
75
Xfb
b218
X
fbb3
25
Xks
u927
(Grp
94a)
X
ksu9
27(G
rp94
b)
Xksu
A5
X
ksu
D2
X
ksu
D39
X
ksu
D6
Xk
suD
7
Xk
suD
9
Xksu
G1
2
Xk
suG
39
Xk
suG
7
Xm
wg
97
5
Xpsr
72
X
psr
11
7
Xp
sr1
29
Xps
r350
aX
psr3
50b
Xpsr
54
7
Xp
sr5
48
Xpsr
56
0
Xpsr
68
1
Xpsr
92
7
Xri
s44
Xrr
11
X
rz4
76
X
rz6
82
X
tag
47
8
Xta
g5
49
X
tag
68
6
Xta
m6
2a
Xta
m6
2b
Xuc
d101
(Esi
2)
Xu
nl1
70
X
un
l185
X
un
l204
X
wg
18
0b
X
wg4
20
Xw
g514
X
wg
68
6b
43
39
41
86
3
lsquo7L
10
rsquo7
AL
-9(0
94
)-7
AL
-15(0
99
)7
AL
-9
7A
L-1
5B
dv1
Cht
1b-B
D
Ep-
V1
Lr1
4a-B
L
r20-
A
Pch
1-A
BD
P
ch2-
A
Pm
1-A
P
m9-
A
Sr15
-A
Sr17
-B
Xab
g461
X
cdo3
47
X
cdo
41
4
Xcs
ih8
1
Xfb
b18
Xfb
a21
Xfb
a134
X
fbb1
45
Xfb
b186
bX
fbb1
89
Xfb
b238
X
ksu
929(
Cat
)X
ksu
B7
Xks
uE18
X
ksu
G3
4
Xks
uH9
Xm
wg9
38
Xm
wg
206
2
Xp
sr1
21(G
lb3)
Xpsr
14
8
Xps
r680
X
psr
68
7
Xp
sr7
43
Xps
r965
X
psr1
923
Xps
r195
4(T
ha)
Xrz
508
Xta
g3
5
Xta
g54
6
Xta
g75
0
Xta
m50
X
wg
34
1
Xw
g3
80
X
wg
86
6
Xw
g18
06
X
wia
482
31
53
21
44
2
aM
ajor
GR
Rs
are
un
der
lin
ed
bA
ster
isk
repre
sen
tm
ark
ers
ten
tati
vel
yp
lace
dw
ith
ina
GR
R
cM
ark
ers
inb
old
are
ph
ysi
call
ym
app
ed
Th
eu
nd
erli
ned
mar
ker
sar
eb
oth
pre
sen
to
nth
eco
nse
nsu
sp
hy
sica
lan
dg
enet
icm
aps
Nucleic Acids Research 2004 Vol 32 No 12 3553
RESULTS
In order to identify and demarcate the gene-containing regionsprecise physical location of 3025 gene marker loci including252 phenotypically characterized genes and 17 quantitativetrait loci (QTLs) was revealed First 942 cDNA or PstI geno-mic clones were physically mapped using 334 deletion linesEach gene marker loci was localized to the smallest possiblechromosomal interval by combining mapping informationfrom the three wheat homoeologs on a consensus physicalmap This analysis localized the gene-containing regionsand identified the flanking deletion breakpoints Second aconsensus genetic linkage map was constructed by combininginformation from 137 wheat maps and was compared with theconsensus physical map via 428 common markers (underlinedbold face markers Table 1) This comparison revealed thephysical location of phenotypically characterized genes con-firmed gene distribution and provided estimates of recombina-tion at a sub-chromosomal level
Physical mapping
The physical mapping results are provided in supplementaryfigures (AndashG) and are summarized in Table 1 With an averageof 135 the number of physically mapped probes ranged from43 for group 4 to 274 for group 5 chromosomes The averagenumber of deletion lines used per homoeologous group was 48with a range of 40 to 58 (Table 2) The 942 probes detected2036 loci of which 617 were for the A 740 for the B and 679were for the D genome chromosomes (Table 3) With anaverage of 22 the number of loci per probe ranged from19 for group 6 to 24 for groups 1 and 3 Using one restrictionenzyme 45 of the probes detected loci on all three homo-eologs 25 on two and 29 of the probes detected loci ononly one of the three homoeologs (Table 3) Among the probesdetecting loci on two homoeologs the number for B and Dgenome chromosomes was more than double (124 probes)compared to either of the other two combinations (A and Dor A and B) Similarly among the probes detecting loci on onlyone of the three homoeologs the number for the B genome wasmore than double compared to either of the other two Thetotal number of loci detected for the B genome was 37compared with 33 for the D and 30 for the A genomeThe number of probes mapping on all three homoeologs ran-ged from 29 for group 6 to 60 for group 1 Similarly thenumber of probes mapping only on one of the three homoeo-logs ranged from 19 for group 3 to 41 for group 6
Except for a few discrepancies relative order FL locationand overall distribution of gene markers were similar amonghomoeologs It was therefore possible to generate consensusphysical maps by combining mapping information from thehomoeologs Deletion breakpoints of homoeologs were placedon the consensus map and each marker was placed to theshortest possible interval (see Methods)
Gene distribution on the wheat chromosomes is obviousfrom Figure 1 Regions of very high marker density wereobserved on all consensus physical maps and were calledgene-rich regions (GRRs) The location and size of eachGRR was drawn to scale and the bracketing deletion break-points are shown on the lsquoleftrsquo Detailed information regardingthe bracketing deletions size markers and other deletion linesfor each GRR is given in Table 1 and is summarized in Table 2With an average of seven and a range of five to eight perchromosome 48 GRRs were identified for the wheat genomethat contained 94 of the markers (Table 2) The remaining6 of the markers were present in other regions includingcentromere of chromosome 1B that contained markersXbcd1072 and Xpsr161
Comparative analysis
With the objectives to confirm the gene distribution physicallymap additional markers including phenotypically character-ized genes and to reveal precise distribution of recombinationon the wheat chromosomes consensus genetic linkage mapswere constructed for each of the homoeologous groups andcompared with the consensus physical maps A total of 1417markers including 252 phenotypically characterized genes and17 QTLs were placed on the consensus genetic linkage maps(Figure 1) With an average of 202 per chromosome thenumber of markers ranged from 151 for group 4 to 235 forgroup 2 The average number of phenotypically characterizedgenesQTLs was 38 per chromosome group with a range of 28for group 5 to 43 for group 1
The 428 common markers were used to compare the con-sensus physical and genetic linkage maps A sector corre-sponding to each of the GRR was identified on the geneticlinkage map Additional markers and useful genes present onthe consensus linkage map were then localized to the corre-sponding GRR and the results are summarized in Table 1About 94 (13361417) of the consensus genetic linkagemap markers including 241 of the 252 phenotypically char-acterized genes and all 17 QTLs mapped in the GRRs(Figure 1 Table 1) The distribution of gene markers observed
Table 2 Summary information about the identified GRRs
Group Size (Mb) No of del in GRR Total No of deletion No of Marker No of GRRS L Total S L Total S L Total S L Total S L Total
1 25 94 119 19 32 51 26 26 52 126 126 252 3 5 82 67 111 178 8 8 16 25 17 42 128 145 273 3 4 73 131 131 262 9 10 19 20 20 40 88 153 241 3 4 74 94 167 261 5 18 23 16 33 49 56 106 162 2 3 55 96 192 288 11 18 29 17 35 52 62 290 352 4 4 86 51 84 135 14 22 36 15 26 41 85 163 248 2 3 57 141 140 281 13 18 31 19 39 58 137 154 291 4 4 8Total 605 919 1524 79 126 205 138 196 334 682 1137 1819 21 27 48
3554 Nucleic Acids Research 2004 Vol 32 No 12
from the genetic linkage maps was similar to that from thephysical maps Between the two methods 3025 marker lociwere physically localized on wheat chromosomes that corre-sponded to 1931 unique gene loci (Figure 1 Table 1) Of these94 mapped within the 48 GRRs The remaining 6 werepresent in small groups of one to four markers separated bymore than one deletion breakpoints
Gene distribution
The number and location of GRRs was different among wheatchromosomes (Figure 1 and Table 1) Twenty-one GRRs werepresent on the short arms and contained 35 of the wheatgenes The remaining 27 GRRs were present on the long armsand contained about 59 of the genes (Table 1) The numberof GRRs per chromosome varied from five (groups 4 and 6) toeight (Groups 1 5 and 7) Essentially no GRR was observed inthe centromeric regions of the chromosomes Only one smallGRR (lsquo7L01rsquo) containing 4 of the armrsquos genes was observedin the proximal 20 of any chromosome In general GRRspresent in the distal regions were relatively higher in genedensity More than 80 of the total marker loci mapped inthe distal half of the chromosomes and 58 mapped in thedistal 20 (Figure 1 and Table 1)
Significant differences were observed among GRRs formarker number marker density and the size The 48 GRRsencompassed about 1554 Mb that is equivalent to 29 of thewheat genome (Table 1) Gene density and number in18 GRRs was very high (major GRRs) (underlined inTable 1 and Figure 1) These major GRRs contained nearly60 of the wheat genes but covered only 11 of the genomeThe gene number and density was variable even among thesemajor GRRs Five of these (lsquo1S08rsquo lsquo2L10rsquo lsquo4S07rsquo lsquo6S10rsquoand lsquo6L09rsquo) contained 26 of the wheat genes but spannedonly 3 of the genome On the contrary four minor GRRs(lsquo1S04rsquo lsquo2L03rsquo lsquo5S04rsquo and lsquo7L01rsquo) contained only 2 ofthe wheat genes but covered gt2 of the genome Estimatedsizes of GRRs varied from 3 Mb for lsquo1S04rsquo to 71 Mb forlsquo3L09rsquo with an average of 32 Mb The total region spannedby GRRs ranged from 119 Mb for group 1 to 288 Mb forgroup 5 Number of genes in a GRR varied from 4 of the armin lsquo7L01rsquo to 82 in lsquo6S10rsquo Gene density varied as much as70-fold among GRRs with a range from a gene per 78 kb inlsquo1S08rsquo to 5500 kb in lsquo7L01rsquo Gene distribution even withinGRRs appeared to be uneven The lsquo1L09rsquo region is presentbetween FLs 084 and 09 Of the total 22 markers present inthe region 16 mapped between FL 084 and 085 one betweenFL 085 and 089 and five between FL 089 and 09
Physical mapping of phenotypic markers
The 269 phenotypic markers mapped in this study included80 monogenically inherited wheat disease resistance genes and17 QTLs (Figure 1 and Table 1) Some of the other usefulgenes were Eps (earliness per se) Hd (awnedness) Kr (cross-ibility) Ph1 plant height male sterility and ear morphologygenes (36) Of the 269 phenotypic markers and useful genes159 were reliably located on the consensus genetic maps(colored red Figure 1) The remaining 93 genes were placedon the consensus genetic maps because of their close associa-tion (lt5 cM) with one or more markers The 17 QTLs werelocated to 10 cM intervals on the consensus linkage map asT
ab
le3
S
um
mar
yo
fth
ep
hy
sica
lly
map
ped
wh
eat
loci
on
ho
mo
eolo
go
us
gro
ups
Chro
mo
som
e
gro
up
s
AB
DA
BB
DA
DA
BD
LN
o
PL
PL
PL
PL
PL
PL
PL
To
tal
AT
ota
lB
To
tal
CT
ota
lP
ML
To
tal
PM
LC
AG
ran
dto
tal
18
92
67
36
19
38
12
99
23
23
33
10
21
34
11
23
48
11
74
65
24
51
35
36
14
28
51
01
18
89
95
47
07
31
97
20
74
04
36
72
01
91
87
14
11
22
77
10
10
55
94
93
90
27
71
44
42
14
17
51
48
10
20
00
88
33
11
29
34
28
91
13
82
29
51
09
32
71
53
04
69
21
12
22
52
55
55
51
31
31
60
22
51
79
56
41
06
67
06
33
99
51
01
73
41
12
26
61
91
92
02
05
57
48
12
10
14
03
50
76
82
04
12
24
11
22
24
48
19
19
19
19
13
13
12
31
10
11
63
49
13
74
86
To
tal
42
81
28
45
11
02
12
42
48
63
12
67
57
51
37
13
76
46
46
17
74
06
79
20
36
98
93
02
5
P
pro
be
L
loci
P
ML
p
hy
sica
lly
map
ped
loci
P
ML
CA
p
hy
sica
lly
map
ped
loci
by
com
par
ativ
ean
alysi
sA
ctu
allo
cin
um
ber
may
be
incr
ease
d2
2
fold
Nucleic Acids Research 2004 Vol 32 No 12 3555
their precise location within the intervals was not knownThese 93 genes and 17 QTLs are colored green in Figure 1With an average of 36 the number of phenotypic markersvaried from 29 for group 4 to 44 for group 1 Comparisonof the genetic with the physical consensus maps localized 258of the 269 phenotypic markers and useful genes to 37 GRRs
The highest number (32) of phenotypic markers was observedfor the lsquo1S08rsquo region The 11 GRRs that lacked phenotypicmarkers were present in the proximal regions of the chromo-somes (Figure 1 and Table 1) The genes mapping in the non-GRR regions are Per1 Hk1 Lr35 Xksu905 (Wip) Lr25 Lr9Pm7 Lr30 Xwsu4 (Dor4) tav1933 (Vdoc) and v1
3556 Nucleic Acids Research 2004 Vol 32 No 12
Distribution of recombination
Comparison of the consensus physical and genetic linkagemaps via 428 common markers provided a detailed andaccurate estimate of recombination at a sub-regional level(Figure 1) In general a severe suppression of recombinationwas observed in the centromeric regions of the wheat
chromosomes (Figure 1) One-fourth of the wheat genomepresent around the centromeres accounted for lt1 of thetotal recombination Nearly perfect linkage was observedamong markers present on different arms of a chromosomeFor example markers Xcdo618 (lsquo1S04rsquo) and Xcdo98(lsquo1L02rsquo) were physically separated by one-fourth ofthe chromosomal length but were lt2 cM apart Due to the
Nucleic Acids Research 2004 Vol 32 No 12 3557
lack of recombination in the proximal regions a large num-ber of markers clustered in the centromeric regions of thelinkage maps (Figure 1)
The gene-poor regions accounted for only 5 of therecombination as 95 of the recombination was observedin the GRRs (Figure 1 and Table 1) Markers present intwo different GRRs separated by a gene-poor region were
usually tightly linked on the genetic linkage map For exam-ple no recombination was observed between markers Xwg789(lsquo1S06rsquo) and Xcdo618 (lsquo1S04rsquo) Similarly markers XksuD22(lsquo2L08rsquo) and Xcdo373 (lsquo2L10rsquo) were inseparable on thegenetic linkage map even though these were physically separ-ated by 20 of the armrsquos length (Figure 1) Maximumrecombination observed in a gene-poor region was for the
3558 Nucleic Acids Research 2004 Vol 32 No 12
region between lsquo4S09rsquo and lsquo4S07rsquo that accounted for 12of the armrsquos recombination Recombination occurring in theGRRs varied from 90 for group 4 to 985 for groups 6 and7 The chromosome 3L GRRs accounted for almost 100 ofthe armrsquos recombination Among GRRs maximum geneticlength of 143 cM was observed for lsquo3L09rsquo and minimumof 1 cM was for lsquo1S04rsquo region (Figure 1 and Table 1) Recom-bination rate for two GRRs (lsquo7L01rsquo and lsquo7L10rsquo) present on
the same chromosome arm was 53-fold different Only 1ndash3of the armrsquos recombination was observed for the GRRslsquo1L02rsquo and lsquo7L01rsquo (Figure 1)
Recombination in the distal chromosomal regions was muchhigher as compared to the proximal halves The recombinationrates among GRRs present in the distal half of the chromo-somes were however highly variable Recombination rates insome proximal GRRs were higher than in distal GRRs For
Nucleic Acids Research 2004 Vol 32 No 12 3559
example lsquo1L09rsquo region is proximal to lsquo1L10rsquo but is about5-fold higher in recombination (Figure 1) There are six otherexamples where recombination in the proximal GRRs is 38ndash325 higher compared to the distal GRRs (Figure 1)
In general the recombination rate in the smaller GRRsseemed higher as compared to the GRRs that encompassedlarger chromosomal regions The 10 Mb sized region
lsquo6S10rsquo had the highest percentage recombination per chromo-some arm (Table 1) Similarly the lsquo1S08rsquo region showed 86of the armrsquos recombination and is only 7 Mb in size On thecontrary a larger GRR lsquo4L05rsquo is 70 Mb but accounted forlt15 of the armrsquos recombination (Figure 1) As in the case oflsquo3L09rsquo this pattern of negative correlation between GRR sizeand recombination rate was not observed for some regions
3560 Nucleic Acids Research 2004 Vol 32 No 12
Comparisons of consensus physical and genetic linkagemaps showed that the ratio of physical to genetic distance(kbcM) varied as much as 140-fold among GRRs ThekbcM estimate ranged from 151 for lsquo1S08rsquo to 21687 forlsquo7S02rsquo with an average of 3381 (Figure 1 and Table 1) Inmost cases recombination rate was higher for GRRs with a
higher gene density although there were some exceptions Forexample gene density was relatively high in the GRR lsquo1S04rsquo(1 gene per 273 kb) but only 3 of the armrsquos recombination wasobserved in this region (Table 1) Similarly lsquo5S09rsquo region isrelatively low in gene density (1 gene per 2688 kb) but 60 ofthe armrsquos recombination occurred in this region
Nucleic Acids Research 2004 Vol 32 No 12 3561
Figure 1 (Group 1 to 7) Distribution of genes and recombination on wheat chromosomes Sizes of consensus chromosomes location and sizes of GRRs are drawn toscale based on the average size of the three homoeologous chromosomes for each homoeologous group (54) Names of the GRRs are given on the left side of aconsensus chromosome In the nomenclature of GRRs (eg lsquo1S08rsquo) the first digit represents wheat homoeologous group followed by the arm location either as shortarm (S) or long arm (L) The last two numeral numbers represent GRR location as fraction length (FL) of the chromosome (eg 08 for lsquo1S08rsquo) The flanking deletionlines for each GRR are shown in blue on the left side of a consensus physical chromosome Actual physical size (black) and the ratio of physical to genetic distance(red) for a region are given on the right hand side of a consensus chromosome Sizes (in Mb) of GRRs are calculated based on the cytological measurements(measurements of the region bracketed by the flanking deletion line breakpoints in comparison to the total chromosome size) and are drawn to scale Recombinationin a chromosomal region is calculated by comparing deletion line based physical map with the consensus genetic linkage map for each chromosome Flankingmarkers for each GRR are joined with dotted lines connecting physical and consensus genetic linkage maps On the consensus genetic linkage maps the genes forwhich exact location in reference to other markers was known are shown in red and the genesQTLs for which the location was imprecise are shown in green
fraction length for satellite F region not precisely marked by deletion lines C markers which were not flanked by the flanking deletion lines for the GRR butprobably are part of that region
3562 Nucleic Acids Research 2004 Vol 32 No 12
DISCUSSION
Gene-containing regions of wheat
The number of genes in most of the higher plants is expected tobe similar although variations due to ploidy changes areexpected The in silico approach based gene number estimatefor Arabidopsis is 25 000 and for rice ranges from 32 000 to50 000 (813) Accounting for polyploidy the correspondingnumber for wheat may be between 75 000 and 150 000 Usingthe average gene size of 25 kb that is found in rice only 12ndash24 (188ndash375 Mb) of the wheat genome is therefore expectedto contain genes The predicted number of genes in thesequenced eukaryotes dropped 2- to 3-fold with the availabil-ity of better computational and biological tools The humangenome once thought to have more than 100 000 genes con-tains 30 000 genes based on new stringent criteria andimproved gene-prediction programs Similarly the gene-con-taining fraction of the wheat genome may even be smaller thanthe above predictions Therefore precise localization anddemarcation of the gene-containing regions is particularlyimportant for wheat
Use of deletion lines to reveal the physical location of genemarkers and the approach to combine the mapping data of thethree homoeologs to generate a consensus map have beenshown previously (91026) Relative gene marker locationwas conserved among the three homoeologs even at the cur-rent density (Supplementary Figures AndashG) It was thereforepossible to construct consensus maps for the seven homoeo-logous groups The consensus maps had an average of 48 dele-tion breakpoints per chromosome group with a range from 40for group 3 to 58 for group 7 Based on the average chromo-some size of the homoeologs deletion breakpoints occurredevery 133 Mb for group 7 to 204 Mb for group 3 The break-points were two times more frequent around the GRRs thanrandomly expected once every 8 Mb Of the 334 deletions210 (63) occurred in the GRRs that encompassed 29 ofthe wheat genome (Table 1)
The distribution of genes on wheat chromosomes is strikingWheat chromosomes have regions of high gene density inter-spersed by vast expanses of unpopulated regions consisting ofrepeated DNA Based on the sample of 3025 gene loci 29 ofthe wheat genome contained 94 of the genes (Figure 1) Of the48 GRRs that were identified 18 were major spanning 11 ofthe genome but accounted for 60 of the genes All majorGRRs were present in the distal 35 of the chromosomes Thelong arms of wheat contained twice as many genes as the shortarms Of the total 94 genes present in GRRs 59 were presentin the 27 GRRs on the long arm and remaining in the 21 GRRs onthe short arms No significant correlation was observed betweenthe chromosome size and the gene fraction or the size of theGRRs For example group 3 has the largest chromosomesamong the wheat groups but contained only 13 of thewheat genes compared with group 5 chromosomes that con-tained 20 Roughly the gene fraction seemed to correlatewith the size of the GRRs The size of chromosomes encom-passing the GRRs is the largest for group 5 and the smallest forgroup 6 Correspondingly the gene fraction was the highest forgroup 5 and the lowest for group 6
The actual size of the GRRs may be smaller than that shownin Figure 1 because the accuracy of bracketing the GRRsis dependent upon the number of deletion breakpoints If
randomly occurring breakpoints of the 334 deletion linesare expected to occur every 16 Mb on the consensus physicalmap As mentioned earlier frequency of these chromosomalbreaks was about double in the GRRs Even with that fre-quency GRRs interspersed by lt8 Mb of gene-poor DNAwill not be resolved
As observed in wheat distribution of genes is uneven inother grass species as well In rice 20 of the genome hasnot been contigedsequenced in spite of extensive efforts (8)The unsequenced part of the genome is probably gene-poorAbout 21 of the sequenced portion of the rice genomecontains 40 of the genes (44) Translocation breakpoint-based physical maps showed that barley chromosomes arealso partitioned into gene-rich and gene-poor regions (45)Similarly in the smaller genome plant Arabidopsis genesare unevenly distributed on the chromosomes About 45of the genome accounts for about 25 000 genes with an averagegene size of 2 kb
Based on the expected size of the gene-containing fractiononly a small part of the currently demarcated GRRs is allegedto contain genes Assuming that the wheat genes may encom-pass only 188ndash375 Mb (12ndash24) of the genome the gene-containing fraction within the GRRs is predicted to be only12ndash24 The exact distribution of genes in the GRRs is notknown but preliminary results suggest that the GRRs mayfurther be partitioned into mini gene-rich and gene-poor com-partments Within the GRRs the estimated 75 000 to 150 000wheat genes are expected to occur every 10ndash20 kb Except forploidy differences the wheat and the barley genomes are verysimilar in gene synteny and composition An 11 Mbsequence for selected wheat and barley regions showed thatgene density within the GRRs may range from a gene every4ndash103 kb with an average of 10ndash20 kb (46ndash49) The size of thelsquogene-emptyrsquo blocks interspersed in these regions ranged from08 to 94 kb The largest contig among these wheat and barleyregions is 261 kb around the Mla locus (49) A 130 kb region inthe contig contained 23 genes with an average gene density ofa gene per 56 kb Size of the interspersing lsquogene-emptyrsquoregions ranged from a few hundred base pairs to 11 kbThe second region of high gene density was 40 kb longand contained 10 genes (a gene every 4 kb) The largestlsquogene-emptyrsquo region was 55 kb Another 60 kb barley contigspanned a 32 kb region around the bronze locus with a geneevery 32 kb (34) Very similar observations were made inother large genome grasses such as Triticum monococcumAegilops tauschii and maize (475051)
Localization of the gene containing regions of wheat isbased on studying gene distribution of 3025 gene loci bythree different methods (Table 2) Gene distribution by dele-tion-line-based physical mapping was very similar to thatrevealed by the comparative analysis between physical andconsensus genetic linkage maps Similarly distribution ofgene markers was comparable to that of phenotypically char-acterized genes Therefore we believe that the demarcationand distribution of genes given in Figure 1 is a good repres-entation of the wheat genome Since the current analysis wasbased on the study of 39ndash78 of the wheat genes relativenumbers among various GRRs may slightly vary with theanalysis of additional genes Considering the diversity andrandomness of the analyzed gene markers the size relativegene density and gene proportion are however not expected
Nucleic Acids Research 2004 Vol 32 No 12 3563
to change dramatically A probable exception might bemulticopy gene families that were not represented in thisstudy because of the technical difficulties The currentinterpretations will not hold true for the multicopy genes iftheir distribution is dramatically different from that of thesingle-copy genes
The presence of 6 of the genes in the gene-poor regionssuggests that additional yet smaller GRRs may exist that werenot identified during the current analysis Some genes wereobserved in the highly heterochromatic gene-poor regionsTwo cDNA clones mapped in the centromeric region ofwheat homoelogous group 1 chromosomes that is highly het-erochromatic and gene-poor Other such examples are genemarkers Xbcd1124 Xcdo1340 and Xpsr596 on chromosome1B Xpsr107 XunlBF483292 Xabg356 and Xbcd260 on group2 Xtam12 Xcdo681 Xbcd1278 Xbcd102 XksuI32 XksuF34Xksu609 Xcdo920 and Xwg222 on group 3 and Xbcd1092Xbcd734 Xcdo1337 and Xbcd1262 on group 4
Distribution of recombination
Recombination is highly uneven along the wheat chromo-somes (Figure 1) Recombination mainly occurred in the48 GRRs that accounted for 95 of the recombinationMore than 100-fold differences were however observed forthe rate of recombination among various GRRs A part of thisdifference seemed to be due to the suppression effect of cen-tromere on recombination Essentially no recombination wasobserved in the proximal 30 of the wheat chromosomesin spite of the presence of GRRs In group 7 chromosomeseg genetic distance between the GRRs lsquo7S02rsquo andlsquo7L08rsquo is only 7 cM The spanned region is gt50 of thechromosome and extended over three GRRs Most of thehighly recombinogenic GRRs were localized in the distalparts of the chromosomes but not all distal GRRs were highlyrecombinogenic Genetic distances spanned by lsquo2L08rsquo andlsquo6L07rsquo GRRs were lt5 cM
Recombination distribution within the GRRs is not knownbut the available data suggest that recombination is highlyasymmetrical even within the highly recombinogenicGRRs Analysis of a 1 Mb region of barley homoeologousto one of the most recombinogenic region of wheat (lsquo1S08rsquo)identified a 240 kb region spanning the Mla locus where norecombination was observed (32) Recombination differencesup to 10-fold were observed among different sectors of theremaining part of the region Similar observations have alsobeen made in other eukaryotes Distribution of recombinationhas been best studied on yeast chromosomes Measured at 1 kbresolution the average frequency of recombination was035 cMkb with a range of 0ndash2 cMkb (httpwwwyeast-genomeorg) Measured at a 150 kb interval recombinationwithin a 1 Mb region of rice ranged from 0 to 15cM eventhough the gene distribution was fairly even (44) (httprgpdnaaffrcgojpPublicdatahtml) The average frequencyof recombination in rice is 0003 cMkb with a range of0ndash006 cMkb (httprgpdnaaffrcgojpPublicdatahtml)Similarly in wheat at a resolution of 7 Mb the averagerecombination frequency was 00003 cMkb with a rangefrom 0 to 0007 cMkb Non-recombinogenic regions havebeen observed in yeast as well as in rice but the highestrate of recombination for a region appears to be 35-fold
less in rice It may be because the rice estimates were at150 kb resolution whereas the recombination hotspotsmay be much smaller in length In yeast there is a majorhotspot around PHO8 gene located on the distal end of chro-mosome IV where recombination is 2 cMkb (httpwwwyeastgenomeorg) A 194 bp region around the waxy(wx) locus of rice has a recombination rate of 006 cMkb thatis 20-fold higher than the genome average (52) Similarly a377 bp region of the maize genome has a recombination rate of002 cMkb that is about 30 times higher than the genomeaverage (3553)
SUPPLEMENTARY MATERIAL
Supplementary Material is available at NAR Online
ACKNOWLEDGEMENTS
A contribution of the Agriculture Research Center WashingtonState University Pullman WA Journal series No 0902-03This research project was supported by the US Department ofAgriculture-National Research Initiative (USDA-NRI) and theWSU Vogel Endowment Funds
REFERENCES
1 SearsER (1954) The aneuploids of common wheat Research Bulletin572 University of Missouri Agricultural Experiment Station pp 1ndash58
2 ArumuganathanK and EarleED (1991) Estimation of nuclear DNAcontent of plants by flow cytometry Plant Mol Biol Rep 9 229ndash241
3 FlavellRB BennettMD SmithJB and SmithDB (1974) Genomesize and the proportion of repeated nucleotide sequence DNA in plantsBiochem Genet 12 257ndash269
4 SandhuD and GillKS (2002) Gene-containing regions of wheat and theother grass genomes Plant Physiol 128 803ndash811
5 SidhuD and GillKS (2004) Distribution of genes and recombination inwheat and other eukaryotes Plant Cell Tissue Organ Cult in press
6 ClaytonWD (1981) Evolution and distribution of grassesAnn Missouri Bot Gard 69 5ndash14
7 KelloggE (1998) Relationships of cereal crops and other grassesProc Natl Acad Sci USA 95 2005ndash2010
8 GoffSA RickeD LanTH PrestingG WangR DunnMGlazebrookJ SessionsA OellerP VarmaH et al (2002) A draftsequence of the rice genome (Oryza sativa L ssp japonica) Science 29692ndash100
9 GillKS GillBS EndoTR and BoykoE (1996) Identification andhigh-density mapping of gene-rich regions in chromosome group 5of wheat Genetics 143 1001ndash1012
10 SandhuD ChampouxJA BondarevaSN and GillKS (2001)Identification and physical localization of useful genes and markers to amajor gene-rich region on wheat group 1S chromosomes Genetics 1571735ndash1747
11 AkhunovED GoodyearAW GengS QiLL EchalierB GillBSMiftahudin GustafsonJP LazoG ChaoS et al (2003) Theorganization and rate of evolution of wheat genomes are correlatedwith recombination rates along chromosome arms Genome Res13 753ndash763
12 BarakatACarelsN and BernardiG (1997) The distribution of genes inthe genome of Gramineae Proc Natl Acad Sci USA 94 6857ndash6861
13 TAGI (2000) Analysis of the genome sequence of the floweringplant Arabidopsis thaliana Nature 408 796ndash815
14 BarakatA HanDT BenslimaneA RodeA and BernardiG (1999)The gene distribution in the genomes of pea tomato and date palmFEBS Lett 463 139ndash142
3564 Nucleic Acids Research 2004 Vol 32 No 12
15 SumnerAT TorreJDL and StuppiaL (1993) The distribution ofgenes on chromosomes A cytological approach J Mol Evol 37117ndash122
16 ClayO and BernardiG (2001) The isochores in human chromosome 21and 22 Biochem Biophys Res Commun 285 855ndash856
17 JabbariK and BernardiG (2000) The distribution of genes in drosophilagenome Gene 18 1859ndash1867
18 LanderES LintonLM BirrenB NusbaumC ZodyMCBaldwinJ DevonK DewarK DoyleM FitzHughW et al (2001)Initial sequencing and analysis of the human genome Nature 409860ndash921
19 McPhersonJD MarraM HillierL WaterstonRH ChinwallaAWallisJ SekhonM WylieK MardisER WilsonRK et al (2001)A physical map of the human genome Nature 409 934ndash941
20 VenterJC AdamsMD MyersEW LiPW MuralRJSuttonGG SmithHO YandellM EvansCA HoltRA et al(2001) The sequence of the human genome Science 291 1304ndash1351
21 GillKS GillBS EndoTR and TaylorT (1996) Identificationand high-density mapping of gene-rich regions in chromosome group 1of wheat Genetics 144 1883ndash1891
22 SandhuD and GillKS (2002) Structural and functional organization ofthe lsquo1S08 gene-rich regionrsquo in the Triticeae Plant Mol Biol 48791ndash804
23 DvorakJ and ChenK-C (1984) Distribution of nonstructural variationbetween wheat cultivars along chromosome arm 6Bp evidence from thelinkage map and physical map of the arm Genetics 106 325ndash333
24 CurtisCA and LukaszewskiAJ (1991) Genetic linkage betweenC-bands and storage protein genes in chromosome 1B of tetraploid wheatTheor Appl Genet 81 245ndash252
25 WernerJE KotaRS and GillBS (1992) Distribution of telomericrepeats and their role in the healing of broken chromosome ends in wheatGenome 35 844ndash848
26 GillKS GillBS and EndoTR (1993) A chromosome region-specificmapping strategy reveals gene-rich telometric ends in wheatChromosoma 102 374ndash381
27 KotaRS GillKS GillBS and EndoTR (1993) A cytogeneticallybased physical map of chromosome 1B in common wheat Genome36 548ndash554
28 FarisJD HaenKM and GillBS (2000) Saturation mapping of agene-rich recombination hot spot region in wheat Genetics 154823ndash835
29 WengY TuleenNA and HartGE (2000) Extended physical maps anda consensus physical map of the homoeologous group-6 chromosomesof wheat (Triticum aestivum L em Thell) Theor Appl Genet 100519ndash527
30 TanksleySD GanalMW PrinceJP de VicenteMCBonierbaleMW BrounP FultonTM GiovannoniJJ GrandilloSMartinGB et al (1992) High density molecular linkage maps of thetomato and potato genomes Genetics 132 1141ndash1160
31 PuechbertyJ LaurentAM GimenezS BillaultA LaurentMEBCalendaA MarcaisB PradesC LoannouP YurovY et al (1999)Genetic and physical analyses of the centromeric and pericentromericregions of human chromosome 5 Recombination across 5cen Genomics56 274ndash287
32 WeiF Gobelman-WernerK MorrollSM KurthJ MaoLWingRA LeisterD Schulze-LefertP and WiseRP (1999)The Mla (powdery mildew) resistance cluster is associated withthree NBS-LRR gene families and suppressed recombination withina 240-kb DNA interval on chromosome 5S (1HS) of barley Genetics153 1929ndash1948
33 FeuilletC and KellerB (2002) Comparative genomics in the grassfamily molecular characterization of grass genome structure andevolution Ann Bot (Lond) 89 3ndash10
34 FuH ZhengZ and DoonerHK (2002) Recombination rates betweenadjacent genic and retrotransposon regions in maize vary by 2 ordersof magnitude Proc Natl Acad Sci USA 99 1082ndash1087
35 YaoH ZhouQ LiJ SmithH YandeauM NikolauBJ andSchnablePS (2002) Molecular characterization of meiotic
recombination across the 140-kb multigenic a1-sh2 interval of maizeProc Natl Acad Sci USA 99 6157ndash6162
36 AdamsMD CelnikerSE HoltRA EvansCA GocayneJDAmanatidesPG SchererSE LiPW HoskinsRA GalleRF et al(2000) The genome sequence of Drosophila melanogaster Science 2872185ndash2195
37 BoykoEV GillKS Mickelson-YoungL NasudaS RouppWJZiegleJN SinghS HassawiDS FritzAK NamuthD et al(1999) A high-density genetic linkage map of Aegilops tauschiithe D-genome progenitor of bread wheat Theor Appl Genet 9916ndash26
38 EndoTR (1982) Gametocidal chromosomes of three Aegilops speciesin common wheat Can J Genet Cytol 24 201ndash206
39 EndoTR MukaiY YamamotoM and GillBS (1991) Physicalmapping of a male-fertility gene of common wheat Jpn J Genet66 291ndash295
40 EndoTR and GillBS (1996) The deletion stocks of common wheatJ Hered 87 295ndash307
41 AndersonJA OgiharaY SorrellsME and TanksleySD (1992)Development of a chromosomal arm map for wheat based on RFLPmarkers Theor Appl Genet 83 1035ndash1043
42 SandhuD SidhuD and GillKS (2002) Identification of expressedsequence markers for a major gene-rich region of wheat chromosomegroup 1 using RNA fingerprinting-differential display Crop Sci 421285ndash1290
43 DilbirligiM EraymanM SandhuD SidhuD and GillKS (2004)Identification of wheat chromosomal regions containing expressedresistance genes Genetics 166 461ndash481
44 WuJ MaeharaT ShimokawaT YamamotoS HaradaCTakazakiY OnoN MukaiY KoikeK YazakiJ et al (2002) Acomprehensive rice transcript map containing 6591 expressed sequencetag sites Plant Cell 14 525ndash535
45 KunzelG KorzumL and MeisterA (2000) Cytologically integratedphysical restriction fragment length polymorphism maps for thebarley genome based on translocation breakpoints Genetics 154397ndash412
46 ShirasuK SchulmanAH LahayeT and Schulze-LefertP (2000) Acontiguous 66-kb barley DNA sequence provides evidence for reversiblegenome expansion Genome Res 10 908ndash915
47 WickerT SteinN AlbarL FeuilletC SchlagenhaufE and KellerB(2001) Analysis of a contiguous 211 kb sequence in diploid wheat(Triticum monococcum L) reveals multiple mechanisms of genomeevolution Plant J 26 307ndash316
48 BrueggemanR RostoksN KudrnaD KilianA HanF ChenJDrukaA SteffensonB and KleinhofsA (2002) The barley stem rust-resistance gene Rpg1 is a novel disease-resistance gene with homology toreceptor kinases Proc Natl Acad Sci USA 99 9328ndash9333
49 WeiF WingRA and WiseRP (2002) Genome dynamics andevolution of the Mla (powdery mildew) resistance locus in barley PlantCell 14 1903ndash1917
50 FeuilletC and KellerB (1999) High gene density is conserved atsyntenic loci of small and large grass genomes Proc Natl Acad SciUSA 96 8265ndash8270
51 TikhonovAP SanMiguelPJ NakajimaY GorensteinNMBennetzenJL and AvramovaZ (1999) Colinearity and its exceptions inorthologous adh regions of maize and sorghum Proc Natl Acad SciUSA 96 7409ndash7414
52 InukaiT SakoA HiranoHY and SanoY (2000) Analysis ofintragenic recombination at wx in rice Correlation between the molecularand genetic maps within the locus Genome 43 589ndash596
53 CivardiL XiaY EdwardsKJ SchnablePS and NikolauBJ (1994)The relationship between genetic and physical distances in thecloned a1-sh2 interval of the Zea mays L genome Proc Natl Acad SciUSA 91 8268ndash8272
54 GillBS FriebeB and EndoTR (1991) Standard karyotype andnomenclature system for description of chromosome bands andstructural aberrations in wheat (Triticum aestivum) Genome 34830ndash839
Nucleic Acids Research 2004 Vol 32 No 12 3565
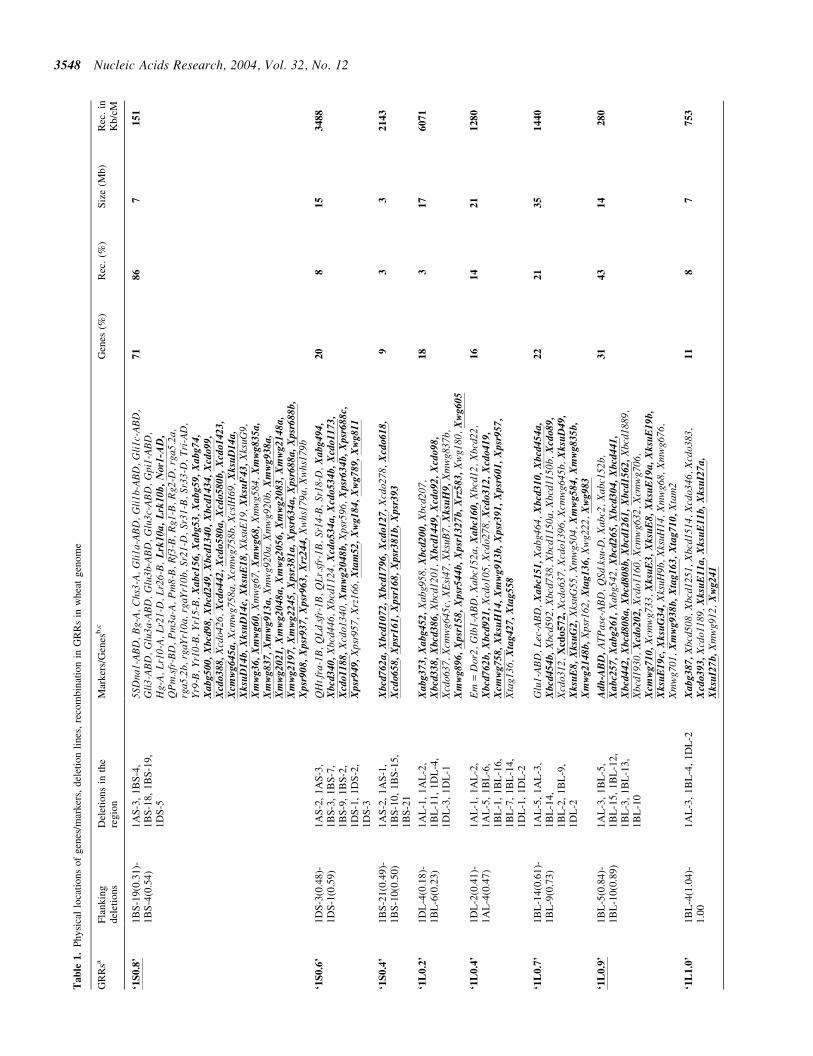
Tab
le1
P
hysi
cal
loca
tio
ns
of
gen
esm
ark
ers
del
etio
nli
nes
re
com
bin
atio
nin
GR
Rs
inw
hea
tg
eno
me
GR
Rsa
Fla
nk
ing
del
etio
ns
Del
etio
ns
inth
ere
gio
nM
ark
ers
Gen
esbc
Gen
es(
)R
ec
()
Siz
e(M
b)
Rec
in
Kb
cM
lsquo1S
08
rsquo1
BS
-19(0
31
)-1
BS
-4(0
54
)1
AS
-3
1B
S-4
1
BS
-18
1B
S-1
9
1D
S-5
5SD
na1-
AB
D
Bg-
A
Chs
3-A
G
li1a
-AB
D
Gli
1b-A
BD
G
li1c
-AB
D
Gli
3-A
BD
G
lu3a
-AB
D
Glu
3b-A
BD
G
lu3c
-AB
D
Gpi
1-A
BD
H
g-A
L
r10-
A
Lr2
1-D
L
r26-
BLrk10aLrk10bNor1-A
D
QP
ms
fr-B
D
Pm
3a-A
P
m8-
B
Rf3
-B
Rg1
-B
Rg2
-D
rga5
2a
rga5
2b
rgaY
r10a
rg
aYr1
0b
Sr21
-D
Sr31
-B
Sr33
-D
Tri
-AD
Y
r9-B
Y
r10-
B
Yr1
5-B
X
ab
c15
6
Xa
bg
53
Xa
bg
59
Xa
bg
74
Xa
bg
500
X
bcd
98
X
bcd
24
9
Xb
cd1
340
X
bcd
14
34
X
cdo9
9
Xcd
o3
88
X
cdo4
26
Xcd
o4
42
Xcd
o5
80
a
Xcd
o5
80
b
Xcd
o1
42
3
Xcm
wg
64
5a
X
cmw
g758
aX
cmw
g758
bX
cslH
69
Xk
suD
14
a
Xk
suD
14
b
Xk
suD
14
cX
ksu
E1
8
Xks
uE19
X
ksu
F4
3
Xks
uG9
Xm
wg
36
X
mw
g6
0
Xm
wg6
7X
mw
g6
8
Xm
wg5
84
Xm
wg
83
5a
X
mw
g8
37
X
mw
g9
13
a
Xm
wg9
20a
Xm
wg9
20b
Xm
wg
938
a
Xm
wg
20
21
X
mw
g2
04
8a
X
mw
g2
05
6
Xm
wg
20
83
X
mw
g2
14
8a
X
mw
g2
19
7
Xm
wg
22
45
X
psr
38
1a
X
psr
63
4a
X
psr
68
8a
X
psr
68
8b
X
psr
90
8
Xpsr
93
7
Xpsr
96
3
Xrz
24
4
Xw
hs17
9a
Xw
hs17
9b
71
86
71
51
lsquo1S
06
rsquo1
DS
-3(0
48
)-1
DS
-1(0
59
)1
AS
-2
1A
S-3
1
BS
-3
1B
S-7
1
BS
-9
1B
S-2
1
DS
-1
1D
S-2
1
DS
-3
QH
tfr
a-1B
Q
Ld
sfr-
1B
QL
rsf
r-1B
Sr
14-B
Sr
18-D
X
ab
g4
94
X
bcd
34
0
Xbc
d446
X
bcd1
124
Xcd
o5
34
a
Xcd
o5
34b
X
cdo
11
73
X
cdo1
18
8
Xcd
o134
0X
mw
g2
04
8b
X
psr5
96
Xpsr
63
4b
X
psr
68
8c
Xp
sr9
49
Xps
r957
X
rz16
6X
tam
52
X
wg
18
4
Xw
g78
9
Xw
g81
1
20
81
53
48
8
lsquo1S
04
rsquo1
BS
-21(0
49
)-1
BS
-10(0
50
)1
AS
-2
1A
S-1
1
BS
-10
1B
S-1
5
1B
S-2
1
Xb
cd7
62
a
Xbcd
10
72
X
bcd
17
96
X
cdo
12
7
Xcd
o278
X
cdo6
18
X
cdo6
58
X
psr
16
1
Xpsr
16
8
Xpsr
38
1b
X
psr
39
39
33
21
43
lsquo1L
02
rsquo1
DL
-4(0
18
)-1
BL
-6(0
23
)1
AL
-1
1A
L-2
1
BL
-11
1
DL
-4
1D
L-3
1
DL
-1
Xa
bg
373
X
ab
g4
52
X
abg9
58
Xbcd
20
0
Xbc
d207
X
bcd
33
8
Xbcd
38
6
Xbc
d120
1X
bcd
14
49
X
cdo9
2
Xcd
o9
8
Xcd
o637
X
cmw
g645
cX
Esi
47
Xks
uB7
Xk
suH
9
Xm
wg8
37b
Xm
wg
89
6
Xpsr
15
8
Xpsr
54
4b
X
psr
13
27
b
Xrz
58
3
Xw
g180
X
wg
60
5
18
31
76
07
1
lsquo1L
04
rsquo1
DL
-2(0
41
)-1
AL
-4(0
47
)1
AL
-1
1A
L-2
1
AL
-5
1B
L-6
1
BL
-1
1B
L-1
6
1B
L-7
1
BL
-14
1
DL
-1
1D
L-2
Em
=D
or2
Glb
1-A
BD
X
abc1
52a
Xa
bc1
60
X
bcd1
2X
bcd2
2X
bcd
76
2b
X
bcd
92
1
Xcd
o105
X
cdo2
78
Xcd
o3
12
Xcd
o4
19
Xcm
wg
75
8
Xksu
H1
4
Xm
wg
913
b
Xp
sr3
91
Xp
sr6
01
Xp
sr9
57
Xta
g136
X
tag
42
7
Xta
g5
58
16
14
21
12
80
lsquo1L
07
rsquo1
BL
-14
(06
1)-
1B
L-9
(07
3)
1A
L-5
1
AL
-3
1B
L-1
4
1B
L-2
1
BL
-9
1D
L-2
Glu
1-A
BD
L
ec-A
BD
X
ab
c15
1
Xab
g464
X
bcd
31
0
Xb
cd4
54a
X
bcd
45
4b
X
bcd5
92
Xbc
d738
X
bcd1
150a
X
bcd1
150b
X
cdo8
9
Xcd
o312
X
cdo
57
2
Xcd
o637
X
cdo1
396
Xcm
wg6
45b
Xk
suD
49
X
ksu
E8
X
ksu
G2
Xks
uG55
X
mw
g504
X
mw
g5
84
X
mw
g8
35
b
Xm
wg
21
48
b
Xps
r162
X
tag
13
6
Xw
g222
X
wg
98
3
22
21
35
14
40
lsquo1L
09
rsquo1
BL
-5(0
84
)-1
BL
-10
(08
9)
1A
L-3
1
BL
-5
1B
L-1
5
1B
L-1
2
1B
L-3
1
BL
-13
1
BL
-10
Ad
h-A
BD
A
TP
ase-
AB
D
QSd
ksu
-D
Xab
c2
Xab
c152
bX
ab
c25
7
Xab
g2
61
X
abg5
42
Xb
cd2
65
Xb
cd3
04
Xbcd
44
1
Xb
cd4
42
X
bcd
80
8a
X
bcd
80
8b
X
bcd
12
61
X
bcd
15
62
X
bcd1
889
Xbc
d193
0X
cdo2
02
X
cdo1
160
Xcm
wg6
32
Xcm
wg7
06
Xcm
wg
71
0
Xcm
wg7
33
Xk
suE
3
Xksu
E8
X
ksu
E1
9a
X
ksu
E1
9b
X
ksu
E1
9c
Xk
suG
34
X
ksuH
9b
Xks
uH14
X
mw
g68
Xm
wg6
76
Xm
wg7
01
Xm
wg
93
8b
X
tag
16
3
Xta
g71
0
Xta
m2
31
43
14
28
0
lsquo1L
10
rsquo1
BL
-4(1
04
)-1
00
1A
L-3
1
BL
-4
1D
L-2
Xa
bg
387
X
bcd5
08
Xbc
d125
1X
bcd1
514
Xcd
o346
X
cdo3
83
Xcd
o3
93
X
cdo1
189
Xk
suE
11a
X
ksu
E1
1b
X
ksu
I27
a
Xk
suI2
7b
X
mw
g912
X
wg
24
1
11
87
75
3
3548 Nucleic Acids Research 2004 Vol 32 No 12
Ta
ble
1
Con
tinu
ed
GR
Rsa
Fla
nk
ing
del
etio
ns
Del
etio
ns
inth
ere
gio
nM
arker
sG
enes
bc
Gen
es(
)R
ec
()
Siz
e(M
b)
Rec
in
Kb
cM
lsquo2S
09
rsquo2
BS
-7(0
89
)-10
02
BS
-7L
r16-
D
Lr1
7-A
L
r22-
D
Lr3
8-A
Q
Pm
sfr
-A
Sr23
-D
Sr38
-A
Tg-
D
Yr1
7-A
W
2I
Xa
bg
703
Xbc
d18
Xbc
d102
X
bcd
34
8
Xbc
d348
aX
bcd3
48b
Xbc
d718
X
bcd1
970
Xcd
o57
Xcd
o447
X
cdo4
56a
Xcd
o456
bX
cdo4
56c
Xcd
o109
0X
cmw
g682
X
fba4
X
fba2
9X
fba7
0a
Xfb
a70b
X
fba8
2X
fba8
3X
fba3
49
Xfb
b40
Xfb
b61
Xfb
b62a
X
fbb1
21
Xfb
b289
X
ksu
D1
8
Xpsr
10
9
Xps
r566
X
psr6
49
Xp
sr6
66
Xps
r908
X
psr9
33
Xps
r958
X
tag1
97
Xta
g302
X
un
l14
5
X
un
l216
X
un
lBE
44
28
54
Xu
nlB
E4
97
251
X
un
lBE
49
95
23
X
un
lBE
59
09
70
X
un
lBF
20
01
66
X
un
lBF
47
40
28
Xu
nlB
F48
42
66
X
un
lBG
26
33
66
X
un
lBG
60
685
9l
Xw
g51
6
46
37
39
13
00
lsquo2S
08
rsquo2
BS
-14(0
84
)-2
BS
-3(0
79
)2
BS
-14
2B
S-3
Lr2
3-B
L
r-2A
L
r15-
A
Lr2
8-A
Sr
6-A
X
ab
g2
X
bcd2
62
Xb
cd3
48
Xbc
d611
X
bcd
11
84
X
bcd1
688
Xbc
d170
9X
bs12
8X
cdo
64
Xcd
o4
05
X
cdo7
83
Xcd
o128
1X
cdo1
379
Xcd
o147
9X
fbb4
7X
fba8
8X
fba1
06
Xfb
a178
X
fba2
72
Xfb
a300
X
fbb2
79
Xfb
b329
X
fbb3
47
Xks
u904
(Per
2)
Xks
u907
(Sod
)X
mw
g950
X
psr8
04(S
bp)
Xta
g222
X
tam
18
Xta
m72
X
wsu
1
31
39
72
15
lsquo2S
05
rsquo2
DS
-5(0
47
)-2
BS
-8(0
57
)2
DS
-5
2A
S-6
2
BS
-1
2B
S-6
2
BS
-8
Lr1
3-A
N
e2-A
Sr
19-A
Sr
21-A
Sr
36-A
X
bcd1
11
Xbc
d120
X
bcd
15
2
Xbc
d161
X
bcd
85
5
Xbc
d111
9X
cdo3
88
Xcd
o5
37
X
cdo1
376
Xfb
a374
X
fbb0
04
Xfb
b021
X
fbb0
75
Xfb
b212
X
fbb2
26
Xfb
b353
X
ksu
F1
9
Xpsr
13
1
Xpsr
78
3
Xrz
395
Xta
g57
8
Xu
nl1
47
Xu
nl1
49
Xu
nlB
E40
19
39
X
un
lBE
405
71
1
Xu
nlB
E5
18
41
9
Xu
nlB
E5
91
764
X
un
lBG
31
423
4
23
17
21
15
00
lsquo2L
03
rsquo2
DL
-4(0
26
)-2
BL
-2(0
36
)2
DL
-4
2B
L-3
2
BL
-2X
bcd4
45
Xcd
o3
70
Xfb
a199
X
fbb3
35
Xp
sr1
01
Xps
r135
X
psr
38
8
Xps
r489
(Ss2
)X
un
l11
0
Xu
nlB
E4
04
32
8
Xu
nlB
E4
46
789
X
un
lBE
49
68
34
X
un
lBF
48
38
53
94
44
88
00
lsquo2L
05
rsquo2
DL
-3(0
49
)-2
DL
-10(0
47
)2
DL
-3
2D
L-1
0Si
-1
Sr9-
A
Sr21
-A
Yr5
-A
Yr7
-A
Xbc
d543
X
cdo6
84
Xcn
l6
Xcr
872(
Psb
O)
Xfb
a74
Xfb
b99
Xksu
F4
3
Xk
suG
30
Xp
sr1
02
Xps
r107
X
psr
11
2
Xps
r129
X
psr1
51
Xps
r380
X
psr3
86
Xps
r390
X
psr5
71
Xps
r575
X
psr6
02
Xps
r919
X
psr9
61
Xta
g293
X
tam
8X
un
lBE
51
81
42
X
un
lBG
26
35
21
Xw
g40
5
Xw
g99
6
Xw
ye19
22(S
be)
23
17
94
50
lsquo2L
08
rsquo2
AL
-3(0
77
)-2
AL
-1(0
85
)2
AL
-3
2A
L-1
Xbcd
13
5
X
bcd3
07
Xfb
a62
Xfb
a64
Xfb
a111
X
fba3
41b
Xk
suD
22
X
ksu
E1
6
Xksu
F2
Xk
suG
5
Xm
wg2
025
Xu
nl1
36
X
un
lBE
51
76
22
X
un
lBE
51
79
92
X
un
lBG
60
71
96
10
43
67
20
0
lsquo2L
10
rsquo2
DL
-6(0
95
)-1
00
2D
L-6
D1-
D
D2-
B
Dfq
1-d
PL
_AP
P
m4-
A
QP
ms
fr-D
Q
Fhs
nds
u-A
Sr
16-B
Sr
28-B
X
bcd
26
6
Xbcd
29
2
Xb
cd4
10
Xbc
d512
X
bcd
10
95
X
bcd
12
31
X
cdo3
6
Xcd
o3
73
X
cdo6
78
Xcd
o100
8X
cdo1
410
Xcm
wg
66
0
Xfb
a8
Xfb
a11
Xfb
a62b
X
fba1
02
Xfb
a122
X
fba2
09a
Xfb
a209
bX
fba2
76
Xfb
a310
X
fba3
11
Xfb
a314
X
fba3
45
Xfb
a359
X
fba3
85
Xfb
b9
Xfb
b32
Xfb
b68
Xfb
b113
X
fbb2
51
Xfb
b276
X
fbb2
84
Xfb
b377
X
ksu9
06(C
bp2)
X
ksu9
08(C
bp1)
X
ksu9
09(C
hi1)
X
ksu9
10(T
ha)
Xks
uD23
X
ksu
F1
1
X
ksu
F4
1
Xk
suH
9
Xksu
H1
6
Xk
suI2
4
Xm
wg5
46
Xps
r331
X
psr3
35
Xps
r540
X
psr6
30
Xps
r644
X
psr6
81
Xps
r692
X
psr9
24
Xps
r932
X
psr9
34
Xps
r956
X
tag2
78a
Xta
g278
bX
tag2
78c
Xta
g558
X
tag6
10a
Xta
g610
bX
tag6
10c
Xta
g632
X
tag6
53
Xta
g664
X
tag6
84
Xta
g699
X
un
l142
Xu
nlB
F4
74
053
Xw
g18
4
X
wg
64
5
X
wsu
2
58
68
22
27
5
lsquo3S
09
rsquo3
BS
-3(0
87
)-10
03
BS
-3C
970
Eps
-A
Lr2
7-B
Sr
2-B
Y
rns
B1-
A
QP
ms
fr-D
Q
Fhs
nds
u-B
X
ab
c17
1
Xbcd
15
X
bcd
90
7
Xbcd
12
78
X
cdo4
59
Xcd
o4
60
X
cdo
54
9
Xfb
a1
90
Xfb
a311
X
fbb1
47a
Xfb
b166
X
fbb1
85
Xfb
b370
X
psr1
196
Xps
r120
0X
psr1
327
Xks
u913
(Pal
)X
ksuD
18
Xksu
G5
3
Xksu
I19
X
psr3
04
Xps
r305
X
psr9
07
Xsf
r2(L
rk10
)X
tag
68
3
Xta
m47
X
ttu1
934(
Hsp
169
b)
39
36
46
11
07
Nucleic Acids Research 2004 Vol 32 No 12 3549
Ta
ble
1
Con
tinu
ed
GR
Rsa
Fla
nk
ing
del
etio
ns
Del
etio
ns
inth
ere
gio
nM
arker
sG
enes
bc
Gen
es(
)R
ec
()
Siz
e(M
b)
Rec
in
Kb
cM
lsquo3S
08
rsquo3
AS
-3(0
71
)-3
BS
-3(0
87
)3
AS
-3
3B
S-7
3
BS
-8E
st-2
-AB
D
Lr3
2-D
P
m13
-B
Xab
g4
60
X
abg4
71
Xb
cd7
06
Xbc
d142
8X
bcd
15
32
X
bcd
18
23
X
cdo
39
5
Xcd
o4
07
X
cdo6
38
X
cdo1
164
Xcd
o1
34
5
Xcd
o1
43
5
Xfb
a9
1
Xfb
a241
X
fbb2
4X
fbb1
42
Xfb
b315
X
fbb
36
6
Xk
suA
6
Xm
wg2
2X
psr
59
8
X
psr9
46
Xta
m5
5
Xta
m6
1
31
39
25
58
0
lsquo3S
05
rsquo3
DS
-1(0
39
)-3
BS
-2(0
56
)3
BS
-2
3D
S-6
3
DS
-5
3D
S-8
3
DS
-1A
TP
ase
a-A
BD
E
st-1
-AB
D
QL
rst
f-B
s-
1-D
X
abg3
90
Xb
cd1
27
X
bcd1
380a
X
cdo3
28
Xcd
o4
80
X
ksu
E2
X
ksu
G1
3
Xksu
H7
X
psr
12
3
Xps
r547
X
psr
68
9
Xpsr
90
2
Xps
r903
X
psr
91
0
X
psr
92
6
Xps
r919
X
psr1
060
Xta
g223
X
tag5
38
Xta
g554
X
tag
72
4
Xta
g756
X
ttu1
935(
Hsp
173
)
31
20
60
43
32
lsquo3L
03
rsquo3
BL
-8(0
28
)-3
BL
-9(0
38
)3
AL
-1
3B
L-1
3
BL
-8
3B
L-9
3
DL
-2A
TP
ase
b-A
BD
G
ot3-
AB
D
Mal
-1-A
BD
S-
1-D
Sr
12-B
X
abc1
76
Xb
cd1
34
Xbcd
36
6
Xb
cd9
27
Xb
cd1
127
X
bcd
11
42
Xbcd
11
45
X
bcd
13
80
X
cdo
54
X
cdo1
18
Xcd
o1
174
X
cdo1
283a
X
fbb2
77
Xksu
G3
6
Xm
wg
68
0
Xm
wg6
88
Xm
wg
802
X
psr
56
X
psr
11
6
Xp
sr1
56
X
psr3
54
Xps
r543
X
psr5
70
Xp
sr1
077
Xps
r114
9X
tag2
21
20
15
19
13
82
lsquo3L
05
rsquo3
AL
-3(0
42
)-3
BL
-10
(05
0)
3A
L-3
3
AL
-7
3B
L-3
3
BL
-10
AT
Pas
ec-
AB
D
Xab
g3
96
X
bcd1
15
Xbc
d288
X
bcd
45
2
Xb
cd8
09
Xbcd
14
18
Xbcd
20
44
X
cdo
28
1
Xcd
o5
34
Xcd
o583
X
cdo7
18
Xcd
o140
6X
fba
21
3
Xfb
a2
14
Xfb
a220
X
fba2
42
Xfb
b156
X
fbb1
77
Xfb
b348
X
ksu9
09(C
hi1)
X
ksu
H2
Xm
wg8
18
Xm
wg9
61
Xpsr
74
Xp
sr7
8
Xp
sr5
78
X
psr7
54
Xps
r804
(Sbp
)X
tag1
18
Xta
g577
X
wg
17
7
Xw
g1
78
22
92
21
85
0
lsquo3L
08
rsquo3
AL
-5(0
78
)-3
DL
-3(0
81
)3
AL
-5
3B
L-1
1
3D
L-3
Xab
g4
Xbcd
22
X
bcd
14
1
Xbc
d147
X
bcd
37
2
Xb
cd5
15
Xb
cd1
555
X
csc4
75(T
lp)
Xfb
b168
X
fbb
27
1
Xfb
b332
X
fbb3
53
Xfb
b378
X
ksu
H1
5
Xm
wg3
0X
mw
g69
Xps
r106
7X
tag
71
8
Xta
m33
X
wg
11
0
X
wia
483(
Cxp
1)
14
10
14
60
9
lsquo3L
09
rsquo3
DL
-3(0
81
)-1
00
3A
L-8
3
DL
-3
3B
L-1
1C
hi2-
D
EST
-5-A
BD
L
r24-
D
R1-
AB
D
R2-
AB
D
R3-
AB
D
Sr24
-D
Sr35
-A
Xa
bc1
61
Xab
c166
X
abc1
72a
Xab
c172
bX
abc1
72c
Xa
bc1
74
X
abg5
5X
abg3
77
Xab
g387
X
ab
g3
89
Xb
cd1
31
Xb
cd3
58
Xbcd
36
1
Xbcd
45
1
Xb
cd1
661
X
bcd1
773
Xcd
o1
05
X
cdo
11
3
Xcd
o127
bX
cdo2
81
Xcd
o4
82
Xfb
a8(H
b)
Xfb
a1
33
Xfb
a1
67
X
fba3
47
X
fba3
60
Xfb
a389
X
fbb1
47b
Xfb
b147
c
Xfb
b2
50
Xfb
b269
X
fbb2
93
Xfb
b3
16
Xks
u912
(Prp
)X
ksu9
14(G
lb3)
aX
ksu9
14(G
lb3)
bX
ksu9
14(G
lb3)
cX
ksu9
14(G
lb3)
dX
ksu
D1
9
Xksu
E1
4
Xks
uE3
Xksu
G4
8
X
ksuG
59
Xk
suG
62
X
mw
g11
Xm
wg1
2X
psr
17
0
Xps
r388
X
psr9
04
Xpsr
93
1
Xpsr
12
03
Xps
r120
5X
rsq8
05(E
mbp
)X
tam
63
Xuc
d111
(Esi
48)
Xw
ia80
7(G
lb33
)X
wia
858(
Glb
35)
44
66
71
49
0
lsquo4S
09
rsquo4
DS
-2(0
82
)-1
00
4D
S-2
ms1
-B
ms2
-D
Xab
g460
X
fbb1
X
ksu9
15(1
4-3-
3a)
Xks
u916
(Oxo
)X
ksu9
17(T
ha)
Xks
u918
(Chi
2)
Xm
wg5
84
Xm
wg6
34
Xps
r332
X
psr9
21
Xrs
q808
(Glo
)X
un
l216
X
un
l164
X
wg
62
23
02
45
34
40
0
lsquo4S
07
rsquo4
DS
-1(0
53
)-4
DS
-3(0
67
)4
DS
-1
4B
S-2
4
DS
-5
4D
S-3
Adh
-B1
Gai
1-B
G
ai2-
D
Gai
3-B
L
r25-
B
Pm
7-B
R
ht1-
B
Rht
10-D
R
ht2-
D
X7S
Glo
b-a
X7S
Glo
b-c
X7S
Glo
b-d
Xab
g55
Xab
g387
X
bgl4
85(G
er)1
X
bgl4
85(G
er)2
X
cdo6
69
Xcd
o795
X
cdo1
33
8
XD
hn6
Xfb
a40
Xfb
a78
Xfb
a320
X
fbb2
27
Xm
wg8
44
Xm
wg2
033
Xp
sr1
10
Xp
sr1
39
Xp
sr1
44
Xp
sr5
41
Xp
sr5
84
Xps
r593
X
psr6
48
Xps
r922
X
psr1
871(
Pki
)X
ucb8
21(P
hyA
)X
un
l133
X
wg
18
4
Xw
g87
6
70
61
41
13
50
lsquo4L
05
rsquo4
DL
-13(0
56
)-4
DL
-6(0
35
)4
DL
-13
4D
L-8
4
DL
-1
4D
L-7
4
DL
-6
4D
L-6
Ba-
B
Hd-
A
Xab
g383
X
abg4
84
Xbcd
11
0
Xbc
d327
X
bcd7
34
Xb
cd1
006
Xbc
d109
2X
bcd1
117
Xbc
d126
5X
bcd1
652
Xbg
l485
(Ger
)3
Xcd
o3
8
Xcd
o64
Xcd
o1
89
X
cdo3
88
Xcd
o4
88
Xcd
o1
387
X
cdo1
401
Xfb
b251
X
Fbp
-D
Xks
uD18
X
ksuF
8X
ksuH
5X
ksuH
8X
mw
g948
X
Pot
-t
Xps
r39(
Fbp
)X
psr
10
4
Xp
sr1
57
Xp
sr1
63
Xps
r860
(Uba
)X
psr9
20
Xps
r927
X
psr1
318
Xrz
251
Xtt
u193
6(H
sp26
6a)
X
ucd1
02(E
si3)
X
wg1
10
38
15
70
63
50
lsquo4L
07
rsquo4
AL
-2(0
75
)-4
AL
-11(0
66
)4
AL
-11
4A
L-7
4
AL
-5
4B
L-3
4
BL
-7
4D
L-2
4
BL
-5
4D
L-1
2
4A
L-9
4
AL
-2
Xab
g390
X
bcd
15
Xbc
d130
X
bcd1
670
Xbn
l50
9X
cdo4
75
Xcd
o4
84
X
cdo5
41
X
fba2
31
Xfb
b154
X
ksu9
19(L
p)
Xks
uD9
Xks
uE6
Xks
uE9
Xks
uG12
X
mw
g549
X
mw
g710
X
psr5
9X
psr
11
5
Xp
sr5
80
Xps
r914
X
psr1
206
Xu
nl1
01
X
wg
18
1
22
12
37
40
00
lsquo4L
09
rsquo4
DL
-14(0
86
)-1
00
4B
L-1
0
4D
L-1
4be
ta-A
my-
1-A
BD
H
p-A
BD
Q
Pm
sfr
-D
Lr2
8-A
Sr
7-A
X
abg3
97
Xak
466(
Nra
)X
bcd1
29
Xbc
d143
1a
Xcd
o20
Xcd
o545
X
cdo9
49
Xcd
o108
1X
cdo1
31
2
Xcd
o1
333
X
cdo1
528
Xfb
a177
X
fbb6
7X
fbb1
14
Xfb
b178
X
fbb1
82
Xfb
b226
X
fbb2
55
Xks
u910
(Tha
)X
ksu9
20(O
xo)2
X
ksu
C2
X
ksu
G1
0
Xm
td86
2(C
M16
)X
mw
g851
X
psr1
19
Xps
r160
(Plc
)X
psr1
64
Xps
r375
X
psr4
84(C
at)
Xps
r567
X
psr5
73
Xps
r604
X
psr1
051
Xum
c190
(Css
1)
Xu
nl1
63
X
wg
11
4
Xw
g789
40
68
60
12
20
3550 Nucleic Acids Research 2004 Vol 32 No 12
Tab
le1
C
onti
nued
GR
Rsa
Fla
nk
ing
del
etio
ns
Del
etio
ns
inth
ere
gio
nM
arker
sG
enes
bc
Gen
es(
)R
ec
()
Siz
e(M
b)
Rec
in
Kb
cM
lsquo5S
09
rsquo5
AS
-6(0
97
)-5
BS
-6(0
81
)5
AS
-6
5B
S-6
Gsp
-AB
D
Ha-
D
Xa
bg
479
X
ab
g7
05
Xbcd
87
3
Xcd
o959
X
fba1
14
X
fba
36
7
Xfb
b1
21
X
fbb
27
6
Xfb
b277
X
mw
g8
35
X
psr
17
0
Xps
r618
X
psr2
152b
X
tag
31
7
Xw
g687
29
60
43
23
89
lsquo5S
07
rsquo5
AS
-3(0
75
)-5
DS
-5(0
67
)5
AS
-3
5D
S-5
No
r-A
P
m2-
D
Xb
cd1
871
X
cdo
68
7
Xcd
o7
49
X
fba1
31
Xfb
a2
32
X
fba
34
2
Xfb
a352
X
fba3
93
X
ksu9
22(T
ha)
X
psr
32
6
Xpsr
62
8
Xpsr
94
0a
X
psr
94
0b
X
psr
94
5
Xta
g31
9
Xta
g62
9
Xta
m5
3a
Xta
m5
3b
Xu
bp
3
Xu
bp
5
Xuc
w14
1
39
28
21
30
00
lsquo5S
06
rsquo5
BS
-8(0
56
)-5
BS
-4(0
43
)5
BS
-8
5D
S-1
5
BS
-4X
bcd
11
30
X
cdo3
44
X
cdo
45
9a
X
cdo
45
9b
X
cdo6
77
a
Xcd
o6
77
b
Xcd
o1
33
5
Xk
suI2
6
Xpsr
11
8
Xp
sr9
29
Xp
sr1
204
X
rg4
63
Xrg
90
1
Xta
m5
42
45
19
63
33
lsquo5S
04
rsquo
5A
S-1
(04
0)-
04
5
5B
S-9
5
BS
-2
5B
S-3
5
AS
-1M
s3-A
X
ksu
G60
X
ksu
H8
Xpsr
11
8
Xpsr
90
3
Xps
r946
X
wg
34
1
Xw
g3
63
14
31
34
33
3
lsquo5L
03
rsquo5
BL
-6(0
26
)-5
DL
-10(0
35
)5
BL
-6
5B
L-2
5
BL
-15
5
BL
-7
5D
L-1
0
5A
L-1
9A
dh-1
-AB
D
Xab
c164
X
bcd
15
7
Xbcd
20
4
Xbcd
50
8b
Xb
cd1
087
Xcd
o785
X
cdo1
04
9
Xfb
a137
X
fbb2
38
Xksu
26
Xksu
D1
6
Xksu
D3
0
X
ksu
D4
2
Xksu
G4
4a
X
ksu
M2
Xm
wg5
61
Xps
r109
X
psr
12
0a
X
psr
12
8
Xps
r335
X
psr3
60
Xps
r574
X
psr8
60(U
ba)
Xps
r906
X
psr1
327
Xta
g22
2
Xuc
w12
7X
wg
41
9
Xw
g56
4
Xw
g90
9
10
84
54
09
1
lsquo5L
05
rsquo5
DL
-12(0
48
)-5
DL
-1(0
60
)5
BL
-1
5B
L-3
5
BL
-5
5B
L-1
1
5D
L-1
2
5D
L-1
Crr
K
r1
Lr1
8P
h1
-B
Xa
bc1
68
Xa
bc3
02
Xab
c71
7
Xab
g6
9
Xa
bg
314
X
ab
g3
87
X
ab
g4
73
Xbcd
9
X
bcd
21
X
bcd
15
7
X
bcd
30
7a
X
bcd
35
1a
X
bcd
35
1b
X
bcd
50
8
Xbc
d926
X
bcd9
81
Xb
cd1
088
X
bcd1
140
Xbc
d187
4X
bcd
19
49
X
cdo5
7
Xcd
o3
88a
X
cdo4
12
X
cdo5
48
a
Xcd
o7
86
a
Xcd
o7
86b
X
cdo1
09
0
Xcd
o116
8X
cdo
11
92
X
fba1
27
X
fba1
66
Xfb
b1
22a
Xfb
b156
X
ksu
8a
X
ksu
8b
X
ksu
8c
Xk
su24
Xk
su92
3(P
r1b
)X
ksu
G7
Xk
suG
12
X
ksu
G44
b
Xksu
H1
X
ksuM
9X
ksu
P6
X
ksu
Q10
X
ksu
Q24
X
ksu
Q35
X
ksu
Q45
a
X
ksu
Q60
X
ksu
Q6
4
Xksu
Q65
Xksu
S1
X
mb
g3
01
Xm
gb1
Xm
gb1
0
Xm
gb
63
X
mg
b1
74
X
mg
b1
91
X
mg
b3
01
X
mg
b3
41
X
mw
g5
2
Xm
wg
55
2
Xm
wg
58
3
Xm
wg
592
X
mw
g6
04
Xm
wg6
24
Xm
wg
76
8
Xm
wg
914
Xm
wg
923
X
mw
g9
56
a
Xm
wg
95
6b
X
psr
10
0
Xpsr
12
0b
Xps
r492
(Acl
3)
Xps
r637
X
psr8
06(A
cl2)
X
psr9
11
Xps
r912
X
psr1
202
Xta
g61
4
Xta
g6
44
Xu
bp
25
X
ucd1
04(E
si14
)X
un
l4
Xu
nl1
04
X
un
l109
X
un
l113
X
un
l116
X
un
l117
X
un
l119
X
un
l12
1
Xu
nl1
23
X
un
l13
8
Xu
nl1
39
X
un
l14
1
Xu
nl1
52
Xu
nl1
60
Xu
nl1
69
X
un
l191
X
un
l21
3
Xu
nl2
14
X
un
l21
7
Xu
nl2
18
X
un
l22
4
Xw
g3
64
X
wg
53
0
Xw
g56
4
Xw
g8
89
Xw
g102
6
36
20
61
20
33
lsquo5L
08
rsquo5
BL
-14
(07
5)-
5B
L-1
6(0
79
)5
BL
-9
5B
L-1
4
5B
L-1
6
5D
L-5
5
DL
-9d
hn
2-A
BD
F
r1-A
Ib
f-1-
AB
D
hsp1
69b
-A
Mpc
1Q
-A
Qkb
cnl
-5A
bts
n1-B
V
rn1-
A
Vrn
3-D
X
ab
c15
5
Xa
bc3
09
Xa
bg
391
X
bcd1
83
Xbcd
30
7b
Xb
cd4
50
Xb
cd8
81
Xbcd
10
30
X
bcd
12
35
a
Xbcd
14
27
X
cdo
87
X
cdo
34
8
Xcd
o4
00
X
cdo4
57
X
cdo
46
5
Xcd
o4
84
X
cdo5
04
Xcd
o5
48b
X
cdo5
84
X
cdo1
18
9
Xcd
o1
32
6
Xcd
o1
475
X
cdo1
508
Xfb
a6
8
Xfb
a190
X
fba2
09
Xfb
a332
X
fba3
48
X
fba3
51
X
fbb2
6X
fbb
16
6
Xfb
b199
X
fbb2
09
Xfb
b2
37
X
fbb
25
5b
Xfb
b322
X
fbb3
23
Xfb
b328
X
ksu
91
9(L
pX
)X
ksu
92
3(P
r1a
)X
ksu
F1
X
ksu
G1
4
Xksu
G57
Xksu
P1
0
Xk
suP
18
X
ksu
P2
0
Xksu
P2
1
Xk
suP
23
X
ksu
P5
0
Xksu
P6
4
Xk
suQ
13
X
ksu
Q16
X
ksu
Q3
2
Xksu
Q3
4
Xksu
Q4
5b
X
ksu
Q5
8
Xksu
Q5
9
Xksu
Q6
3
Xksu
Q66
X
ksu
Q67
X
mw
g7
2
Xm
wg
76
Xm
wg
51
4
Xm
wg
51
6
Xm
wg
55
0
Xm
wg
60
2
Xm
wg
71
6
Xm
wg
740
X
mw
g8
62
X
mw
g9
00
X
mw
g9
22
X
mw
g9
33
Xps
r14(
alph
a-A
my-
3-A
BD
)X
psr
79
X
psr
11
5
X
psr
13
1
Xp
sr1
45
Xps
r575
X
psr8
19(A
dpg1
-AB
D)
Xps
r918
X
psr9
63
Xps
r119
4X
rsq8
05(E
mpb
-AB
D)
Xrz
32
8
Xrz
39
5
Xrz
57
5
Xrz
58
9
Xrz
74
4
Xta
g69
X
tag
16
5
Xta
g25
1
Xta
g35
4
Xta
g6
21
X
tag
65
1
Xta
g69
5a
X
tag
69
5b
X
un
l137
Xu
nl1
40
X
wg
64
4
Xw
g90
8
36
40
20
30
8
lsquo5L
09
rsquo5
AL
-23(0
87
)-1
00
5A
L-2
3B
1-A
be
ta-A
my-
1-A
L
r1-D
Q
kbc
nl-5
Aa
Rh1
2-A
X
abg3
66
Xbc
d110
3X
bcd
12
35
b
X
bcd1
421
Xbc
d167
0X
cdo2
0X
cdo
21
3
X
cdo3
46
Xcd
o3
88b
X
cdo
13
12
X
cdo1
528
Xfb
b100
X
fbb2
13
Xfb
b249
X
fbb3
30
Xk
suQ
62
X
mw
g211
2X
psr
37
0
Xps
r567
aX
psr5
67b
Xpsr
58
0
Xps
r120
6X
psr1
316
Xta
g69
5
X
tag
75
4
Xw
g11
4
11
29
66
16
50
Nucleic Acids Research 2004 Vol 32 No 12 3551
Ta
ble
1
Con
tinu
ed
GR
Rsa
Fla
nk
ing
del
etio
ns
Del
etio
ns
inth
ere
gio
nM
arker
sG
enes
bc
Gen
es(
)R
ec
()
Siz
e(M
b)
Rec
in
Kb
cM
lsquo6S
10
rsquo6
DS
-6(0
99
)-1
00
6A
S-5
6
BS
-3
6B
S-6
6
BS
-2
6D
S-6
6
DS
-4L
r36-
B
Nor
2-B
Q
Gpc
nds
u-B
Q
Pm
sfr
-B
Sr5-
D
Sr8-
A
Su1-
B
Xab
g387
X
abg4
58
Xab
g466
X
ak46
6(N
ra)
Xbc
d21
Xbc
d342
X
bcd1
821
Xcd
o476
X
cdo1
380
Xcm
wg6
20
Xcm
wg6
52
Xcm
wg6
79a
Xcm
wg6
79b
Xcm
wg
69
0
Xfb
a1
X
fba8
5
Xfb
a1
87
Xfb
a3
44
X
fbb3
54
X
ksuE
3X
ksuF
36
Xks
uF43
X
ksu
G8a
X
ksu
G8b
X
ksu
G48
Xk
suH
4
Xksu
I28
X
ksuM
5X
mw
g59
Xm
wg7
9X
mw
g573
X
mw
g6
52
Xm
wg8
20
Xm
wg8
87
Xm
wg
91
6
Xm
wg
96
6
Xpa
p4
Xpsr
8(C
xP
3)a
X
psr
8(C
xP
3)b
X
psr
10
(Gli
-2)
Xpsr
10
6a
X
psr
14
1b
X
psr1
67
Xpsr
30
1a
X
psr5
46
Xp
sr5
51
Xps
r563
X
psr
62
7
Xps
r662
X
psr8
99
Xps
r904
X
psr
91
6
Xpsr
96
4
Xps
r967
X
rgc6
9X
tag5
37
Xta
g562
X
tag5
82
Xta
g75
2
Xta
m60
X
uta
2(P
sif)
82
89
10
16
4
lsquo6S
05
rsquo6
DS
-2(0
45
)-6
AS
-5(0
65
)6
AS
-4
6A
S-5
6
AS
-1
6B
S-8
6
BS
-5
6B
S-1
6
DS
-4
6D
S-2
Xa
bc1
73
Xcd
o270
X
cdo
53
4
Xcd
o115
8X
fba6
7
Xfb
a1
48
Xfb
a3
99
X
fbb2
31
X
cmw
g653
X
psr
14
1a
X
psr
31
2
Xps
r962
X
tam
31
X
rz4
76
X
uta
1(P
sif)
18
94
16
94
9
lsquo6L
04
rsquo6
BL
-3(0
36
)-6
BL
-4(0
44
)6
AL
-6
6A
L-4
6
AL
-1
6B
L-4
6
BL
-5
6B
L-3
6
DL
-6
6D
L-1
Xa
bc1
63
Xa
bc1
75
X
ab
g2
0
Xab
g379
X
ab
g3
88
X
abg4
74
Xb
cd1
02
Xbc
d758
X
cdo2
9X
cdo
204
Xcd
o497
X
cdo5
07
Xcd
o7
72
X
cdo1
315
Xcd
o142
8X
cmw
g6
53
X
cmw
g6
64
X
fba3
28
X
fba3
67
X
fba
39
7
Xfb
b9
5
Xfb
b2
83
Xfb
b3
64
X
ksuD
17
Xks
uG58
X
ksuM
151
Xm
wg
872
Xm
wg
911
X
mw
g206
1X
psr1
13
Xpsr
14
2
Xp
sr3
71
Xp
sr4
63(P
rk)
Xps
r831
X
psr9
08
Xp
sr9
15
Xrs
q8
05
(Em
bp
)X
tag3
17
Xta
g33
4
Xta
m6
Xta
m9
Xta
m10
X
tam
27
Xta
m31
X
tam
57
Xu
cd1
09
(Esi
35
)X
VA
tp-B
2X
wg2
23
Xw
g93
3
30
21
15
84
7
lsquo6L
07
rsquo6
AL
-1(0
69
)-6
BL
-6(0
76
)6
AL
-1
6A
L-5
6
BL
-9
6B
L-8
6
BL
-14
6
BL
-1
6B
L-6
6
DL
-1
6D
L-1
2
6D
L-7
6
DL
-13
Xa
bg
1
Xfb
b2
15
X
ksuF
24
Xm
wg8
20
Xm
wg
20
29
X
npi2
53
Xps
r149
X
psr
30
1b
X
tag4
95
Xta
m1
7
Xta
m7
4
Xuc
w26
X
wg
28
6
Xw
g341
10
66
01
17
65
lsquo6L
09
rsquo6
AL
-8(0
90
)-1
00
6A
L-8
6
BL
-6
6D
L-1
3A
HV
5D
hn3
Got
2-A
BD
H
t3-D
N
or7-
B
Lr3
-B
Sr11
-B
Sr13
-A
Sr29
-D
WsP
16
Xab
c154
X
abc4
51
Xab
g652
X
bcd
1
Xbc
d269
X
bcd
27
6
Xbc
d880
X
bcd1
510
Xcd
o388
X
cdo5
16
Xcd
o836
X
cdo1
091
Xcm
wg
66
9
Xcm
wg
67
4
Xcm
wg
68
4
Xcm
wg
716
Xcs
b1
12b
(Dh
n5
)X
fba1
X
fba4
2
Xfb
a8
1
Xfb
a1
11
X
fbb
40
X
fbb5
7
Xfb
b5
9
Xfb
b7
0
Xfb
b8
2
Xfb
b1
64
Xfb
b1
69
X
fbb1
70
X
fbb
22
1
Xfb
b3
27
X
ksu
D1
Xks
uD12
X
ksuD
17
Xks
uD27
X
ksuE
14
Xks
uF14
aX
ksuF
14b
Xks
uF19
X
ksuF
37
Xks
uG30
X
ksu
G51
X
ksuM
1X
ksuM
75
Xm
wg
19
Xm
wg
21
X
mw
g7
4a
Xm
wg
74
b
Xm
wg5
13
Xm
wg
514
X
mw
g7
98
X
mw
g813
X
mw
g838
X
mw
g887
X
mw
g897
X
mw
g934
X
mw
g2
053
X
mw
g2
10
0
Xp
sr2
(a-a
my1
)a
Xpsr
2(a
-am
y1)b
X
psr1
06b
Xps
r134
X
psr1
54
Xps
r546
X
psr6
05
Xpsr
90
4
Xpsr
90
8
Xps
r966
X
psr
96
7
Xrg
c74
Xta
g495
X
tag5
20
Xta
g547
X
tag6
80
Xta
g70
5
Xta
g762
X
tam
10
b
Xta
m21
X
tam
26
Xta
m2
8
Xta
m3
6
Xu
cd1
06
(Esi
18
)X
wg
34
1
Xw
g4
05
60
72
45
82
5
lsquo7S
09
rsquo7
AS
-1(0
90
)-1
00
7A
S-1
7
AS
-9P
gd3-
A
Xab
g378
X
abg7
04
Xb
cd9
3
Xbcd
13
0
Xb
cd5
88
Xb
cd9
07
Xbcd
18
72
X
cdo5
45
X
cdo
14
00
X
fba8
X
fba1
7X
fba6
5X
fba7
2X
fba9
3X
fba1
09
Xfb
b121
X
fba1
27
Xfb
a311
bX
fba3
21
Xfb
b9
Xfb
b156
X
fbb2
78
Xk
suD
9
Xm
wg5
30
Xm
wg
90
5
Xm
wg
20
80
X
psr
11
9
Xp
sr1
60(P
lc)
Xp
sr3
86
Xpsr
39
2
Xpsr
56
3
Xps
r648
X
psr8
33(P
er)
Xps
r946
aX
psr9
46b
Xta
g18
4
Xta
g6
1
Xum
c190
(Css
1)
Xu
nl2
22
X
un
l223
X
wye
835(
Wx)
30
32
40
14
81
lsquo7S
08
rsquo7
AS
-7(0
87
)-7
AS
-2(0
73
)7
AS
-7
7A
S-1
2
7A
S-2
Lr3
4-D
N
ar7-
A
Pc1
-B
Xab
c15
1
X
ab
c15
2
Xa
k4
66(N
ra)
Xbcd
14
38
X
cdo
43
1
X
cdo
47
5
Xcd
o5
34
Xcd
o6
76
Xcd
o7
80
X
cdo1
18
9
X
cdo
13
95
X
fba4
2X
fba3
46
Xfb
a377
X
fbb6
7a
Xfb
b186
aX
ksu
A1
Xk
suD
25
Xk
suE
3
Xksu
F4
8
Xk
suH
8
Xm
wg7
10
Xps
r490
(Ss1
-AB
D)
Xps
r604
X
psr6
62
Xrj
19
Xrz
2X
tam
13
Xta
g65
1
Xw
g83
4
23
22
36
19
78
lsquo7S
04
rsquo7
AS
-10
(04
5)-
7D
S-5
(03
6)
7D
S-1
7
DS
-5
7A
S-1
0
7A
S-5
Am
p-3-
A
Brz
-A
Est
3-A
P
an2-
A
Rc1
-A
Rc3
-D
Xa
bc4
65
Xbcd
31
0
Xbcd
38
5
Xb
cd7
07
Xb
cd9
81
Xb
cd1
06
6
Xbcd
13
38
X
bcd
17
73
X
cdo
57
X
cdo7
8
X
cdo9
1
X
cdo5
95
Xcm
wg
66
9
Xcm
wg
70
4
X
fba3
2X
fba2
48
Xfb
a340
X
fba3
71
Xfb
b150
X
fbb1
95
Xfb
b226
X
fbb2
64
Xk
suD
15
X
ksu
S1
X
mw
g8
9
Xpsr
10
3
Xp
sr1
08
Xp
sr1
50
Xp
sr1
52
Xps
r492
(Acl
3)
Xp
sr9
55
Xps
r192
1X
rj5
X
tam
64
X
un
l13
4
Xu
nl1
57
Xu
nl1
61
X
wg
18
0a
31
43
29
85
3
3552 Nucleic Acids Research 2004 Vol 32 No 12
Tab
le1
C
onti
nued
GR
Rsa
Fla
nk
ing
del
etio
ns
Del
etio
ns
inth
ere
gio
nM
ark
ers
Gen
esbc
Gen
es(
)R
ec
()
Siz
e(M
b)
Rec
in
Kb
cM
lsquo7S
02
rsquo7
AS
-4(0
26
)-7
BS
-3(0
16
)7
AS
-6
7A
S-4
7
DS
-3
7B
S-3
Xa
bg
476
a
Xb
cd9
8
Xbcd
34
9
Xcm
wg
70
5
Xfb
a363
X
fbb3
43
Xm
wg
808
X
psr
65
X
rz4
X
tag
30
1
Xta
g53
6
Xta
g65
8
Xw
g5
22
Xw
g66
91
02
36
21
687
lsquo7L
01
rsquo7
DL
-6(0
10
)-7
AL
-4(0
18
)7
DL
-6
7A
L-4
7
BL
-14
Xcd
o5
51
X
cdo1
19
9
Xpsr
16
9
Xp
sr3
03
Xta
g43
9
Xta
g64
23
13
31
52
78
lsquo7L
03
rsquo7
AL
-3(0
29
)-7
BL
-1(0
40
)7
AL
-3
7B
L-2
7
BL
-1
7D
L-5
Am
y2-A
V
Atp
-B1-
A
Xab
c455
X
ab
g4
76
b
Xcd
o5
3
Xcd
o6
73
X
cdo
92
0
Xcd
o1
40
7
Xcd
o1
42
8
Xh
r20b
X
mw
g2
03
1
Xm
wg8
25
Xpsr
10
5
Xpsr
16
5
Xp
sr3
11
Xp
sr3
40
Xp
sr3
89
Xps
r468
(Pep
c)
Xpsr
51
4
Xpsr
69
0
Xps
r803
(Fed
)X
psr
93
8
Xta
g5
98
X
ubp2
X
un
l188
X
wg
46
6
Xw
g68
6a
X
wg
71
9
Xw
ye19
58(A
dpg3
)
19
54
51
38
89
lsquo7L
08
rsquo7
DL
-4(0
76
)-7
AL
-2(0
87
)7
AL
-21
7
AL
-6
7B
L-1
0
7B
L-1
3
7A
L-8
7
AL
-13
7A
L-1
6
7A
L-2
7
DL
-4
Ep-
D1b
-D
Lr1
9-D
P
m5-
B
Sr22
-A
VA
tp-A
-A
Xab
c305
X
ab
c31
0
Xbc
d178
X
bcd
19
30
X
cdo6
65
X
cdo6
86
Xcd
o7
75
Xcd
o962
X
fba6
9X
fba9
7X
fba2
04
Xfb
a234
X
fba2
59
Xfb
a264
X
fba3
01
Xfb
a350
X
fba3
82
Xfb
b67b
X
fbb7
9X
fbb1
75
Xfb
b218
X
fbb3
25
Xks
u927
(Grp
94a)
X
ksu9
27(G
rp94
b)
Xksu
A5
X
ksu
D2
X
ksu
D39
X
ksu
D6
Xk
suD
7
Xk
suD
9
Xksu
G1
2
Xk
suG
39
Xk
suG
7
Xm
wg
97
5
Xpsr
72
X
psr
11
7
Xp
sr1
29
Xps
r350
aX
psr3
50b
Xpsr
54
7
Xp
sr5
48
Xpsr
56
0
Xpsr
68
1
Xpsr
92
7
Xri
s44
Xrr
11
X
rz4
76
X
rz6
82
X
tag
47
8
Xta
g5
49
X
tag
68
6
Xta
m6
2a
Xta
m6
2b
Xuc
d101
(Esi
2)
Xu
nl1
70
X
un
l185
X
un
l204
X
wg
18
0b
X
wg4
20
Xw
g514
X
wg
68
6b
43
39
41
86
3
lsquo7L
10
rsquo7
AL
-9(0
94
)-7
AL
-15(0
99
)7
AL
-9
7A
L-1
5B
dv1
Cht
1b-B
D
Ep-
V1
Lr1
4a-B
L
r20-
A
Pch
1-A
BD
P
ch2-
A
Pm
1-A
P
m9-
A
Sr15
-A
Sr17
-B
Xab
g461
X
cdo3
47
X
cdo
41
4
Xcs
ih8
1
Xfb
b18
Xfb
a21
Xfb
a134
X
fbb1
45
Xfb
b186
bX
fbb1
89
Xfb
b238
X
ksu
929(
Cat
)X
ksu
B7
Xks
uE18
X
ksu
G3
4
Xks
uH9
Xm
wg9
38
Xm
wg
206
2
Xp
sr1
21(G
lb3)
Xpsr
14
8
Xps
r680
X
psr
68
7
Xp
sr7
43
Xps
r965
X
psr1
923
Xps
r195
4(T
ha)
Xrz
508
Xta
g3
5
Xta
g54
6
Xta
g75
0
Xta
m50
X
wg
34
1
Xw
g3
80
X
wg
86
6
Xw
g18
06
X
wia
482
31
53
21
44
2
aM
ajor
GR
Rs
are
un
der
lin
ed
bA
ster
isk
repre
sen
tm
ark
ers
ten
tati
vel
yp
lace
dw
ith
ina
GR
R
cM
ark
ers
inb
old
are
ph
ysi
call
ym
app
ed
Th
eu
nd
erli
ned
mar
ker
sar
eb
oth
pre
sen
to
nth
eco
nse
nsu
sp
hy
sica
lan
dg
enet
icm
aps
Nucleic Acids Research 2004 Vol 32 No 12 3553
RESULTS
In order to identify and demarcate the gene-containing regionsprecise physical location of 3025 gene marker loci including252 phenotypically characterized genes and 17 quantitativetrait loci (QTLs) was revealed First 942 cDNA or PstI geno-mic clones were physically mapped using 334 deletion linesEach gene marker loci was localized to the smallest possiblechromosomal interval by combining mapping informationfrom the three wheat homoeologs on a consensus physicalmap This analysis localized the gene-containing regionsand identified the flanking deletion breakpoints Second aconsensus genetic linkage map was constructed by combininginformation from 137 wheat maps and was compared with theconsensus physical map via 428 common markers (underlinedbold face markers Table 1) This comparison revealed thephysical location of phenotypically characterized genes con-firmed gene distribution and provided estimates of recombina-tion at a sub-chromosomal level
Physical mapping
The physical mapping results are provided in supplementaryfigures (AndashG) and are summarized in Table 1 With an averageof 135 the number of physically mapped probes ranged from43 for group 4 to 274 for group 5 chromosomes The averagenumber of deletion lines used per homoeologous group was 48with a range of 40 to 58 (Table 2) The 942 probes detected2036 loci of which 617 were for the A 740 for the B and 679were for the D genome chromosomes (Table 3) With anaverage of 22 the number of loci per probe ranged from19 for group 6 to 24 for groups 1 and 3 Using one restrictionenzyme 45 of the probes detected loci on all three homo-eologs 25 on two and 29 of the probes detected loci ononly one of the three homoeologs (Table 3) Among the probesdetecting loci on two homoeologs the number for B and Dgenome chromosomes was more than double (124 probes)compared to either of the other two combinations (A and Dor A and B) Similarly among the probes detecting loci on onlyone of the three homoeologs the number for the B genome wasmore than double compared to either of the other two Thetotal number of loci detected for the B genome was 37compared with 33 for the D and 30 for the A genomeThe number of probes mapping on all three homoeologs ran-ged from 29 for group 6 to 60 for group 1 Similarly thenumber of probes mapping only on one of the three homoeo-logs ranged from 19 for group 3 to 41 for group 6
Except for a few discrepancies relative order FL locationand overall distribution of gene markers were similar amonghomoeologs It was therefore possible to generate consensusphysical maps by combining mapping information from thehomoeologs Deletion breakpoints of homoeologs were placedon the consensus map and each marker was placed to theshortest possible interval (see Methods)
Gene distribution on the wheat chromosomes is obviousfrom Figure 1 Regions of very high marker density wereobserved on all consensus physical maps and were calledgene-rich regions (GRRs) The location and size of eachGRR was drawn to scale and the bracketing deletion break-points are shown on the lsquoleftrsquo Detailed information regardingthe bracketing deletions size markers and other deletion linesfor each GRR is given in Table 1 and is summarized in Table 2With an average of seven and a range of five to eight perchromosome 48 GRRs were identified for the wheat genomethat contained 94 of the markers (Table 2) The remaining6 of the markers were present in other regions includingcentromere of chromosome 1B that contained markersXbcd1072 and Xpsr161
Comparative analysis
With the objectives to confirm the gene distribution physicallymap additional markers including phenotypically character-ized genes and to reveal precise distribution of recombinationon the wheat chromosomes consensus genetic linkage mapswere constructed for each of the homoeologous groups andcompared with the consensus physical maps A total of 1417markers including 252 phenotypically characterized genes and17 QTLs were placed on the consensus genetic linkage maps(Figure 1) With an average of 202 per chromosome thenumber of markers ranged from 151 for group 4 to 235 forgroup 2 The average number of phenotypically characterizedgenesQTLs was 38 per chromosome group with a range of 28for group 5 to 43 for group 1
The 428 common markers were used to compare the con-sensus physical and genetic linkage maps A sector corre-sponding to each of the GRR was identified on the geneticlinkage map Additional markers and useful genes present onthe consensus linkage map were then localized to the corre-sponding GRR and the results are summarized in Table 1About 94 (13361417) of the consensus genetic linkagemap markers including 241 of the 252 phenotypically char-acterized genes and all 17 QTLs mapped in the GRRs(Figure 1 Table 1) The distribution of gene markers observed
Table 2 Summary information about the identified GRRs
Group Size (Mb) No of del in GRR Total No of deletion No of Marker No of GRRS L Total S L Total S L Total S L Total S L Total
1 25 94 119 19 32 51 26 26 52 126 126 252 3 5 82 67 111 178 8 8 16 25 17 42 128 145 273 3 4 73 131 131 262 9 10 19 20 20 40 88 153 241 3 4 74 94 167 261 5 18 23 16 33 49 56 106 162 2 3 55 96 192 288 11 18 29 17 35 52 62 290 352 4 4 86 51 84 135 14 22 36 15 26 41 85 163 248 2 3 57 141 140 281 13 18 31 19 39 58 137 154 291 4 4 8Total 605 919 1524 79 126 205 138 196 334 682 1137 1819 21 27 48
3554 Nucleic Acids Research 2004 Vol 32 No 12
from the genetic linkage maps was similar to that from thephysical maps Between the two methods 3025 marker lociwere physically localized on wheat chromosomes that corre-sponded to 1931 unique gene loci (Figure 1 Table 1) Of these94 mapped within the 48 GRRs The remaining 6 werepresent in small groups of one to four markers separated bymore than one deletion breakpoints
Gene distribution
The number and location of GRRs was different among wheatchromosomes (Figure 1 and Table 1) Twenty-one GRRs werepresent on the short arms and contained 35 of the wheatgenes The remaining 27 GRRs were present on the long armsand contained about 59 of the genes (Table 1) The numberof GRRs per chromosome varied from five (groups 4 and 6) toeight (Groups 1 5 and 7) Essentially no GRR was observed inthe centromeric regions of the chromosomes Only one smallGRR (lsquo7L01rsquo) containing 4 of the armrsquos genes was observedin the proximal 20 of any chromosome In general GRRspresent in the distal regions were relatively higher in genedensity More than 80 of the total marker loci mapped inthe distal half of the chromosomes and 58 mapped in thedistal 20 (Figure 1 and Table 1)
Significant differences were observed among GRRs formarker number marker density and the size The 48 GRRsencompassed about 1554 Mb that is equivalent to 29 of thewheat genome (Table 1) Gene density and number in18 GRRs was very high (major GRRs) (underlined inTable 1 and Figure 1) These major GRRs contained nearly60 of the wheat genes but covered only 11 of the genomeThe gene number and density was variable even among thesemajor GRRs Five of these (lsquo1S08rsquo lsquo2L10rsquo lsquo4S07rsquo lsquo6S10rsquoand lsquo6L09rsquo) contained 26 of the wheat genes but spannedonly 3 of the genome On the contrary four minor GRRs(lsquo1S04rsquo lsquo2L03rsquo lsquo5S04rsquo and lsquo7L01rsquo) contained only 2 ofthe wheat genes but covered gt2 of the genome Estimatedsizes of GRRs varied from 3 Mb for lsquo1S04rsquo to 71 Mb forlsquo3L09rsquo with an average of 32 Mb The total region spannedby GRRs ranged from 119 Mb for group 1 to 288 Mb forgroup 5 Number of genes in a GRR varied from 4 of the armin lsquo7L01rsquo to 82 in lsquo6S10rsquo Gene density varied as much as70-fold among GRRs with a range from a gene per 78 kb inlsquo1S08rsquo to 5500 kb in lsquo7L01rsquo Gene distribution even withinGRRs appeared to be uneven The lsquo1L09rsquo region is presentbetween FLs 084 and 09 Of the total 22 markers present inthe region 16 mapped between FL 084 and 085 one betweenFL 085 and 089 and five between FL 089 and 09
Physical mapping of phenotypic markers
The 269 phenotypic markers mapped in this study included80 monogenically inherited wheat disease resistance genes and17 QTLs (Figure 1 and Table 1) Some of the other usefulgenes were Eps (earliness per se) Hd (awnedness) Kr (cross-ibility) Ph1 plant height male sterility and ear morphologygenes (36) Of the 269 phenotypic markers and useful genes159 were reliably located on the consensus genetic maps(colored red Figure 1) The remaining 93 genes were placedon the consensus genetic maps because of their close associa-tion (lt5 cM) with one or more markers The 17 QTLs werelocated to 10 cM intervals on the consensus linkage map asT
ab
le3
S
um
mar
yo
fth
ep
hy
sica
lly
map
ped
wh
eat
loci
on
ho
mo
eolo
go
us
gro
ups
Chro
mo
som
e
gro
up
s
AB
DA
BB
DA
DA
BD
LN
o
PL
PL
PL
PL
PL
PL
PL
To
tal
AT
ota
lB
To
tal
CT
ota
lP
ML
To
tal
PM
LC
AG
ran
dto
tal
18
92
67
36
19
38
12
99
23
23
33
10
21
34
11
23
48
11
74
65
24
51
35
36
14
28
51
01
18
89
95
47
07
31
97
20
74
04
36
72
01
91
87
14
11
22
77
10
10
55
94
93
90
27
71
44
42
14
17
51
48
10
20
00
88
33
11
29
34
28
91
13
82
29
51
09
32
71
53
04
69
21
12
22
52
55
55
51
31
31
60
22
51
79
56
41
06
67
06
33
99
51
01
73
41
12
26
61
91
92
02
05
57
48
12
10
14
03
50
76
82
04
12
24
11
22
24
48
19
19
19
19
13
13
12
31
10
11
63
49
13
74
86
To
tal
42
81
28
45
11
02
12
42
48
63
12
67
57
51
37
13
76
46
46
17
74
06
79
20
36
98
93
02
5
P
pro
be
L
loci
P
ML
p
hy
sica
lly
map
ped
loci
P
ML
CA
p
hy
sica
lly
map
ped
loci
by
com
par
ativ
ean
alysi
sA
ctu
allo
cin
um
ber
may
be
incr
ease
d2
2
fold
Nucleic Acids Research 2004 Vol 32 No 12 3555
their precise location within the intervals was not knownThese 93 genes and 17 QTLs are colored green in Figure 1With an average of 36 the number of phenotypic markersvaried from 29 for group 4 to 44 for group 1 Comparisonof the genetic with the physical consensus maps localized 258of the 269 phenotypic markers and useful genes to 37 GRRs
The highest number (32) of phenotypic markers was observedfor the lsquo1S08rsquo region The 11 GRRs that lacked phenotypicmarkers were present in the proximal regions of the chromo-somes (Figure 1 and Table 1) The genes mapping in the non-GRR regions are Per1 Hk1 Lr35 Xksu905 (Wip) Lr25 Lr9Pm7 Lr30 Xwsu4 (Dor4) tav1933 (Vdoc) and v1
3556 Nucleic Acids Research 2004 Vol 32 No 12
Distribution of recombination
Comparison of the consensus physical and genetic linkagemaps via 428 common markers provided a detailed andaccurate estimate of recombination at a sub-regional level(Figure 1) In general a severe suppression of recombinationwas observed in the centromeric regions of the wheat
chromosomes (Figure 1) One-fourth of the wheat genomepresent around the centromeres accounted for lt1 of thetotal recombination Nearly perfect linkage was observedamong markers present on different arms of a chromosomeFor example markers Xcdo618 (lsquo1S04rsquo) and Xcdo98(lsquo1L02rsquo) were physically separated by one-fourth ofthe chromosomal length but were lt2 cM apart Due to the
Nucleic Acids Research 2004 Vol 32 No 12 3557
lack of recombination in the proximal regions a large num-ber of markers clustered in the centromeric regions of thelinkage maps (Figure 1)
The gene-poor regions accounted for only 5 of therecombination as 95 of the recombination was observedin the GRRs (Figure 1 and Table 1) Markers present intwo different GRRs separated by a gene-poor region were
usually tightly linked on the genetic linkage map For exam-ple no recombination was observed between markers Xwg789(lsquo1S06rsquo) and Xcdo618 (lsquo1S04rsquo) Similarly markers XksuD22(lsquo2L08rsquo) and Xcdo373 (lsquo2L10rsquo) were inseparable on thegenetic linkage map even though these were physically separ-ated by 20 of the armrsquos length (Figure 1) Maximumrecombination observed in a gene-poor region was for the
3558 Nucleic Acids Research 2004 Vol 32 No 12
region between lsquo4S09rsquo and lsquo4S07rsquo that accounted for 12of the armrsquos recombination Recombination occurring in theGRRs varied from 90 for group 4 to 985 for groups 6 and7 The chromosome 3L GRRs accounted for almost 100 ofthe armrsquos recombination Among GRRs maximum geneticlength of 143 cM was observed for lsquo3L09rsquo and minimumof 1 cM was for lsquo1S04rsquo region (Figure 1 and Table 1) Recom-bination rate for two GRRs (lsquo7L01rsquo and lsquo7L10rsquo) present on
the same chromosome arm was 53-fold different Only 1ndash3of the armrsquos recombination was observed for the GRRslsquo1L02rsquo and lsquo7L01rsquo (Figure 1)
Recombination in the distal chromosomal regions was muchhigher as compared to the proximal halves The recombinationrates among GRRs present in the distal half of the chromo-somes were however highly variable Recombination rates insome proximal GRRs were higher than in distal GRRs For
Nucleic Acids Research 2004 Vol 32 No 12 3559
example lsquo1L09rsquo region is proximal to lsquo1L10rsquo but is about5-fold higher in recombination (Figure 1) There are six otherexamples where recombination in the proximal GRRs is 38ndash325 higher compared to the distal GRRs (Figure 1)
In general the recombination rate in the smaller GRRsseemed higher as compared to the GRRs that encompassedlarger chromosomal regions The 10 Mb sized region
lsquo6S10rsquo had the highest percentage recombination per chromo-some arm (Table 1) Similarly the lsquo1S08rsquo region showed 86of the armrsquos recombination and is only 7 Mb in size On thecontrary a larger GRR lsquo4L05rsquo is 70 Mb but accounted forlt15 of the armrsquos recombination (Figure 1) As in the case oflsquo3L09rsquo this pattern of negative correlation between GRR sizeand recombination rate was not observed for some regions
3560 Nucleic Acids Research 2004 Vol 32 No 12
Comparisons of consensus physical and genetic linkagemaps showed that the ratio of physical to genetic distance(kbcM) varied as much as 140-fold among GRRs ThekbcM estimate ranged from 151 for lsquo1S08rsquo to 21687 forlsquo7S02rsquo with an average of 3381 (Figure 1 and Table 1) Inmost cases recombination rate was higher for GRRs with a
higher gene density although there were some exceptions Forexample gene density was relatively high in the GRR lsquo1S04rsquo(1 gene per 273 kb) but only 3 of the armrsquos recombination wasobserved in this region (Table 1) Similarly lsquo5S09rsquo region isrelatively low in gene density (1 gene per 2688 kb) but 60 ofthe armrsquos recombination occurred in this region
Nucleic Acids Research 2004 Vol 32 No 12 3561
Figure 1 (Group 1 to 7) Distribution of genes and recombination on wheat chromosomes Sizes of consensus chromosomes location and sizes of GRRs are drawn toscale based on the average size of the three homoeologous chromosomes for each homoeologous group (54) Names of the GRRs are given on the left side of aconsensus chromosome In the nomenclature of GRRs (eg lsquo1S08rsquo) the first digit represents wheat homoeologous group followed by the arm location either as shortarm (S) or long arm (L) The last two numeral numbers represent GRR location as fraction length (FL) of the chromosome (eg 08 for lsquo1S08rsquo) The flanking deletionlines for each GRR are shown in blue on the left side of a consensus physical chromosome Actual physical size (black) and the ratio of physical to genetic distance(red) for a region are given on the right hand side of a consensus chromosome Sizes (in Mb) of GRRs are calculated based on the cytological measurements(measurements of the region bracketed by the flanking deletion line breakpoints in comparison to the total chromosome size) and are drawn to scale Recombinationin a chromosomal region is calculated by comparing deletion line based physical map with the consensus genetic linkage map for each chromosome Flankingmarkers for each GRR are joined with dotted lines connecting physical and consensus genetic linkage maps On the consensus genetic linkage maps the genes forwhich exact location in reference to other markers was known are shown in red and the genesQTLs for which the location was imprecise are shown in green
fraction length for satellite F region not precisely marked by deletion lines C markers which were not flanked by the flanking deletion lines for the GRR butprobably are part of that region
3562 Nucleic Acids Research 2004 Vol 32 No 12
DISCUSSION
Gene-containing regions of wheat
The number of genes in most of the higher plants is expected tobe similar although variations due to ploidy changes areexpected The in silico approach based gene number estimatefor Arabidopsis is 25 000 and for rice ranges from 32 000 to50 000 (813) Accounting for polyploidy the correspondingnumber for wheat may be between 75 000 and 150 000 Usingthe average gene size of 25 kb that is found in rice only 12ndash24 (188ndash375 Mb) of the wheat genome is therefore expectedto contain genes The predicted number of genes in thesequenced eukaryotes dropped 2- to 3-fold with the availabil-ity of better computational and biological tools The humangenome once thought to have more than 100 000 genes con-tains 30 000 genes based on new stringent criteria andimproved gene-prediction programs Similarly the gene-con-taining fraction of the wheat genome may even be smaller thanthe above predictions Therefore precise localization anddemarcation of the gene-containing regions is particularlyimportant for wheat
Use of deletion lines to reveal the physical location of genemarkers and the approach to combine the mapping data of thethree homoeologs to generate a consensus map have beenshown previously (91026) Relative gene marker locationwas conserved among the three homoeologs even at the cur-rent density (Supplementary Figures AndashG) It was thereforepossible to construct consensus maps for the seven homoeo-logous groups The consensus maps had an average of 48 dele-tion breakpoints per chromosome group with a range from 40for group 3 to 58 for group 7 Based on the average chromo-some size of the homoeologs deletion breakpoints occurredevery 133 Mb for group 7 to 204 Mb for group 3 The break-points were two times more frequent around the GRRs thanrandomly expected once every 8 Mb Of the 334 deletions210 (63) occurred in the GRRs that encompassed 29 ofthe wheat genome (Table 1)
The distribution of genes on wheat chromosomes is strikingWheat chromosomes have regions of high gene density inter-spersed by vast expanses of unpopulated regions consisting ofrepeated DNA Based on the sample of 3025 gene loci 29 ofthe wheat genome contained 94 of the genes (Figure 1) Of the48 GRRs that were identified 18 were major spanning 11 ofthe genome but accounted for 60 of the genes All majorGRRs were present in the distal 35 of the chromosomes Thelong arms of wheat contained twice as many genes as the shortarms Of the total 94 genes present in GRRs 59 were presentin the 27 GRRs on the long arm and remaining in the 21 GRRs onthe short arms No significant correlation was observed betweenthe chromosome size and the gene fraction or the size of theGRRs For example group 3 has the largest chromosomesamong the wheat groups but contained only 13 of thewheat genes compared with group 5 chromosomes that con-tained 20 Roughly the gene fraction seemed to correlatewith the size of the GRRs The size of chromosomes encom-passing the GRRs is the largest for group 5 and the smallest forgroup 6 Correspondingly the gene fraction was the highest forgroup 5 and the lowest for group 6
The actual size of the GRRs may be smaller than that shownin Figure 1 because the accuracy of bracketing the GRRsis dependent upon the number of deletion breakpoints If
randomly occurring breakpoints of the 334 deletion linesare expected to occur every 16 Mb on the consensus physicalmap As mentioned earlier frequency of these chromosomalbreaks was about double in the GRRs Even with that fre-quency GRRs interspersed by lt8 Mb of gene-poor DNAwill not be resolved
As observed in wheat distribution of genes is uneven inother grass species as well In rice 20 of the genome hasnot been contigedsequenced in spite of extensive efforts (8)The unsequenced part of the genome is probably gene-poorAbout 21 of the sequenced portion of the rice genomecontains 40 of the genes (44) Translocation breakpoint-based physical maps showed that barley chromosomes arealso partitioned into gene-rich and gene-poor regions (45)Similarly in the smaller genome plant Arabidopsis genesare unevenly distributed on the chromosomes About 45of the genome accounts for about 25 000 genes with an averagegene size of 2 kb
Based on the expected size of the gene-containing fractiononly a small part of the currently demarcated GRRs is allegedto contain genes Assuming that the wheat genes may encom-pass only 188ndash375 Mb (12ndash24) of the genome the gene-containing fraction within the GRRs is predicted to be only12ndash24 The exact distribution of genes in the GRRs is notknown but preliminary results suggest that the GRRs mayfurther be partitioned into mini gene-rich and gene-poor com-partments Within the GRRs the estimated 75 000 to 150 000wheat genes are expected to occur every 10ndash20 kb Except forploidy differences the wheat and the barley genomes are verysimilar in gene synteny and composition An 11 Mbsequence for selected wheat and barley regions showed thatgene density within the GRRs may range from a gene every4ndash103 kb with an average of 10ndash20 kb (46ndash49) The size of thelsquogene-emptyrsquo blocks interspersed in these regions ranged from08 to 94 kb The largest contig among these wheat and barleyregions is 261 kb around the Mla locus (49) A 130 kb region inthe contig contained 23 genes with an average gene density ofa gene per 56 kb Size of the interspersing lsquogene-emptyrsquoregions ranged from a few hundred base pairs to 11 kbThe second region of high gene density was 40 kb longand contained 10 genes (a gene every 4 kb) The largestlsquogene-emptyrsquo region was 55 kb Another 60 kb barley contigspanned a 32 kb region around the bronze locus with a geneevery 32 kb (34) Very similar observations were made inother large genome grasses such as Triticum monococcumAegilops tauschii and maize (475051)
Localization of the gene containing regions of wheat isbased on studying gene distribution of 3025 gene loci bythree different methods (Table 2) Gene distribution by dele-tion-line-based physical mapping was very similar to thatrevealed by the comparative analysis between physical andconsensus genetic linkage maps Similarly distribution ofgene markers was comparable to that of phenotypically char-acterized genes Therefore we believe that the demarcationand distribution of genes given in Figure 1 is a good repres-entation of the wheat genome Since the current analysis wasbased on the study of 39ndash78 of the wheat genes relativenumbers among various GRRs may slightly vary with theanalysis of additional genes Considering the diversity andrandomness of the analyzed gene markers the size relativegene density and gene proportion are however not expected
Nucleic Acids Research 2004 Vol 32 No 12 3563
to change dramatically A probable exception might bemulticopy gene families that were not represented in thisstudy because of the technical difficulties The currentinterpretations will not hold true for the multicopy genes iftheir distribution is dramatically different from that of thesingle-copy genes
The presence of 6 of the genes in the gene-poor regionssuggests that additional yet smaller GRRs may exist that werenot identified during the current analysis Some genes wereobserved in the highly heterochromatic gene-poor regionsTwo cDNA clones mapped in the centromeric region ofwheat homoelogous group 1 chromosomes that is highly het-erochromatic and gene-poor Other such examples are genemarkers Xbcd1124 Xcdo1340 and Xpsr596 on chromosome1B Xpsr107 XunlBF483292 Xabg356 and Xbcd260 on group2 Xtam12 Xcdo681 Xbcd1278 Xbcd102 XksuI32 XksuF34Xksu609 Xcdo920 and Xwg222 on group 3 and Xbcd1092Xbcd734 Xcdo1337 and Xbcd1262 on group 4
Distribution of recombination
Recombination is highly uneven along the wheat chromo-somes (Figure 1) Recombination mainly occurred in the48 GRRs that accounted for 95 of the recombinationMore than 100-fold differences were however observed forthe rate of recombination among various GRRs A part of thisdifference seemed to be due to the suppression effect of cen-tromere on recombination Essentially no recombination wasobserved in the proximal 30 of the wheat chromosomesin spite of the presence of GRRs In group 7 chromosomeseg genetic distance between the GRRs lsquo7S02rsquo andlsquo7L08rsquo is only 7 cM The spanned region is gt50 of thechromosome and extended over three GRRs Most of thehighly recombinogenic GRRs were localized in the distalparts of the chromosomes but not all distal GRRs were highlyrecombinogenic Genetic distances spanned by lsquo2L08rsquo andlsquo6L07rsquo GRRs were lt5 cM
Recombination distribution within the GRRs is not knownbut the available data suggest that recombination is highlyasymmetrical even within the highly recombinogenicGRRs Analysis of a 1 Mb region of barley homoeologousto one of the most recombinogenic region of wheat (lsquo1S08rsquo)identified a 240 kb region spanning the Mla locus where norecombination was observed (32) Recombination differencesup to 10-fold were observed among different sectors of theremaining part of the region Similar observations have alsobeen made in other eukaryotes Distribution of recombinationhas been best studied on yeast chromosomes Measured at 1 kbresolution the average frequency of recombination was035 cMkb with a range of 0ndash2 cMkb (httpwwwyeast-genomeorg) Measured at a 150 kb interval recombinationwithin a 1 Mb region of rice ranged from 0 to 15cM eventhough the gene distribution was fairly even (44) (httprgpdnaaffrcgojpPublicdatahtml) The average frequencyof recombination in rice is 0003 cMkb with a range of0ndash006 cMkb (httprgpdnaaffrcgojpPublicdatahtml)Similarly in wheat at a resolution of 7 Mb the averagerecombination frequency was 00003 cMkb with a rangefrom 0 to 0007 cMkb Non-recombinogenic regions havebeen observed in yeast as well as in rice but the highestrate of recombination for a region appears to be 35-fold
less in rice It may be because the rice estimates were at150 kb resolution whereas the recombination hotspotsmay be much smaller in length In yeast there is a majorhotspot around PHO8 gene located on the distal end of chro-mosome IV where recombination is 2 cMkb (httpwwwyeastgenomeorg) A 194 bp region around the waxy(wx) locus of rice has a recombination rate of 006 cMkb thatis 20-fold higher than the genome average (52) Similarly a377 bp region of the maize genome has a recombination rate of002 cMkb that is about 30 times higher than the genomeaverage (3553)
SUPPLEMENTARY MATERIAL
Supplementary Material is available at NAR Online
ACKNOWLEDGEMENTS
A contribution of the Agriculture Research Center WashingtonState University Pullman WA Journal series No 0902-03This research project was supported by the US Department ofAgriculture-National Research Initiative (USDA-NRI) and theWSU Vogel Endowment Funds
REFERENCES
1 SearsER (1954) The aneuploids of common wheat Research Bulletin572 University of Missouri Agricultural Experiment Station pp 1ndash58
2 ArumuganathanK and EarleED (1991) Estimation of nuclear DNAcontent of plants by flow cytometry Plant Mol Biol Rep 9 229ndash241
3 FlavellRB BennettMD SmithJB and SmithDB (1974) Genomesize and the proportion of repeated nucleotide sequence DNA in plantsBiochem Genet 12 257ndash269
4 SandhuD and GillKS (2002) Gene-containing regions of wheat and theother grass genomes Plant Physiol 128 803ndash811
5 SidhuD and GillKS (2004) Distribution of genes and recombination inwheat and other eukaryotes Plant Cell Tissue Organ Cult in press
6 ClaytonWD (1981) Evolution and distribution of grassesAnn Missouri Bot Gard 69 5ndash14
7 KelloggE (1998) Relationships of cereal crops and other grassesProc Natl Acad Sci USA 95 2005ndash2010
8 GoffSA RickeD LanTH PrestingG WangR DunnMGlazebrookJ SessionsA OellerP VarmaH et al (2002) A draftsequence of the rice genome (Oryza sativa L ssp japonica) Science 29692ndash100
9 GillKS GillBS EndoTR and BoykoE (1996) Identification andhigh-density mapping of gene-rich regions in chromosome group 5of wheat Genetics 143 1001ndash1012
10 SandhuD ChampouxJA BondarevaSN and GillKS (2001)Identification and physical localization of useful genes and markers to amajor gene-rich region on wheat group 1S chromosomes Genetics 1571735ndash1747
11 AkhunovED GoodyearAW GengS QiLL EchalierB GillBSMiftahudin GustafsonJP LazoG ChaoS et al (2003) Theorganization and rate of evolution of wheat genomes are correlatedwith recombination rates along chromosome arms Genome Res13 753ndash763
12 BarakatACarelsN and BernardiG (1997) The distribution of genes inthe genome of Gramineae Proc Natl Acad Sci USA 94 6857ndash6861
13 TAGI (2000) Analysis of the genome sequence of the floweringplant Arabidopsis thaliana Nature 408 796ndash815
14 BarakatA HanDT BenslimaneA RodeA and BernardiG (1999)The gene distribution in the genomes of pea tomato and date palmFEBS Lett 463 139ndash142
3564 Nucleic Acids Research 2004 Vol 32 No 12
15 SumnerAT TorreJDL and StuppiaL (1993) The distribution ofgenes on chromosomes A cytological approach J Mol Evol 37117ndash122
16 ClayO and BernardiG (2001) The isochores in human chromosome 21and 22 Biochem Biophys Res Commun 285 855ndash856
17 JabbariK and BernardiG (2000) The distribution of genes in drosophilagenome Gene 18 1859ndash1867
18 LanderES LintonLM BirrenB NusbaumC ZodyMCBaldwinJ DevonK DewarK DoyleM FitzHughW et al (2001)Initial sequencing and analysis of the human genome Nature 409860ndash921
19 McPhersonJD MarraM HillierL WaterstonRH ChinwallaAWallisJ SekhonM WylieK MardisER WilsonRK et al (2001)A physical map of the human genome Nature 409 934ndash941
20 VenterJC AdamsMD MyersEW LiPW MuralRJSuttonGG SmithHO YandellM EvansCA HoltRA et al(2001) The sequence of the human genome Science 291 1304ndash1351
21 GillKS GillBS EndoTR and TaylorT (1996) Identificationand high-density mapping of gene-rich regions in chromosome group 1of wheat Genetics 144 1883ndash1891
22 SandhuD and GillKS (2002) Structural and functional organization ofthe lsquo1S08 gene-rich regionrsquo in the Triticeae Plant Mol Biol 48791ndash804
23 DvorakJ and ChenK-C (1984) Distribution of nonstructural variationbetween wheat cultivars along chromosome arm 6Bp evidence from thelinkage map and physical map of the arm Genetics 106 325ndash333
24 CurtisCA and LukaszewskiAJ (1991) Genetic linkage betweenC-bands and storage protein genes in chromosome 1B of tetraploid wheatTheor Appl Genet 81 245ndash252
25 WernerJE KotaRS and GillBS (1992) Distribution of telomericrepeats and their role in the healing of broken chromosome ends in wheatGenome 35 844ndash848
26 GillKS GillBS and EndoTR (1993) A chromosome region-specificmapping strategy reveals gene-rich telometric ends in wheatChromosoma 102 374ndash381
27 KotaRS GillKS GillBS and EndoTR (1993) A cytogeneticallybased physical map of chromosome 1B in common wheat Genome36 548ndash554
28 FarisJD HaenKM and GillBS (2000) Saturation mapping of agene-rich recombination hot spot region in wheat Genetics 154823ndash835
29 WengY TuleenNA and HartGE (2000) Extended physical maps anda consensus physical map of the homoeologous group-6 chromosomesof wheat (Triticum aestivum L em Thell) Theor Appl Genet 100519ndash527
30 TanksleySD GanalMW PrinceJP de VicenteMCBonierbaleMW BrounP FultonTM GiovannoniJJ GrandilloSMartinGB et al (1992) High density molecular linkage maps of thetomato and potato genomes Genetics 132 1141ndash1160
31 PuechbertyJ LaurentAM GimenezS BillaultA LaurentMEBCalendaA MarcaisB PradesC LoannouP YurovY et al (1999)Genetic and physical analyses of the centromeric and pericentromericregions of human chromosome 5 Recombination across 5cen Genomics56 274ndash287
32 WeiF Gobelman-WernerK MorrollSM KurthJ MaoLWingRA LeisterD Schulze-LefertP and WiseRP (1999)The Mla (powdery mildew) resistance cluster is associated withthree NBS-LRR gene families and suppressed recombination withina 240-kb DNA interval on chromosome 5S (1HS) of barley Genetics153 1929ndash1948
33 FeuilletC and KellerB (2002) Comparative genomics in the grassfamily molecular characterization of grass genome structure andevolution Ann Bot (Lond) 89 3ndash10
34 FuH ZhengZ and DoonerHK (2002) Recombination rates betweenadjacent genic and retrotransposon regions in maize vary by 2 ordersof magnitude Proc Natl Acad Sci USA 99 1082ndash1087
35 YaoH ZhouQ LiJ SmithH YandeauM NikolauBJ andSchnablePS (2002) Molecular characterization of meiotic
recombination across the 140-kb multigenic a1-sh2 interval of maizeProc Natl Acad Sci USA 99 6157ndash6162
36 AdamsMD CelnikerSE HoltRA EvansCA GocayneJDAmanatidesPG SchererSE LiPW HoskinsRA GalleRF et al(2000) The genome sequence of Drosophila melanogaster Science 2872185ndash2195
37 BoykoEV GillKS Mickelson-YoungL NasudaS RouppWJZiegleJN SinghS HassawiDS FritzAK NamuthD et al(1999) A high-density genetic linkage map of Aegilops tauschiithe D-genome progenitor of bread wheat Theor Appl Genet 9916ndash26
38 EndoTR (1982) Gametocidal chromosomes of three Aegilops speciesin common wheat Can J Genet Cytol 24 201ndash206
39 EndoTR MukaiY YamamotoM and GillBS (1991) Physicalmapping of a male-fertility gene of common wheat Jpn J Genet66 291ndash295
40 EndoTR and GillBS (1996) The deletion stocks of common wheatJ Hered 87 295ndash307
41 AndersonJA OgiharaY SorrellsME and TanksleySD (1992)Development of a chromosomal arm map for wheat based on RFLPmarkers Theor Appl Genet 83 1035ndash1043
42 SandhuD SidhuD and GillKS (2002) Identification of expressedsequence markers for a major gene-rich region of wheat chromosomegroup 1 using RNA fingerprinting-differential display Crop Sci 421285ndash1290
43 DilbirligiM EraymanM SandhuD SidhuD and GillKS (2004)Identification of wheat chromosomal regions containing expressedresistance genes Genetics 166 461ndash481
44 WuJ MaeharaT ShimokawaT YamamotoS HaradaCTakazakiY OnoN MukaiY KoikeK YazakiJ et al (2002) Acomprehensive rice transcript map containing 6591 expressed sequencetag sites Plant Cell 14 525ndash535
45 KunzelG KorzumL and MeisterA (2000) Cytologically integratedphysical restriction fragment length polymorphism maps for thebarley genome based on translocation breakpoints Genetics 154397ndash412
46 ShirasuK SchulmanAH LahayeT and Schulze-LefertP (2000) Acontiguous 66-kb barley DNA sequence provides evidence for reversiblegenome expansion Genome Res 10 908ndash915
47 WickerT SteinN AlbarL FeuilletC SchlagenhaufE and KellerB(2001) Analysis of a contiguous 211 kb sequence in diploid wheat(Triticum monococcum L) reveals multiple mechanisms of genomeevolution Plant J 26 307ndash316
48 BrueggemanR RostoksN KudrnaD KilianA HanF ChenJDrukaA SteffensonB and KleinhofsA (2002) The barley stem rust-resistance gene Rpg1 is a novel disease-resistance gene with homology toreceptor kinases Proc Natl Acad Sci USA 99 9328ndash9333
49 WeiF WingRA and WiseRP (2002) Genome dynamics andevolution of the Mla (powdery mildew) resistance locus in barley PlantCell 14 1903ndash1917
50 FeuilletC and KellerB (1999) High gene density is conserved atsyntenic loci of small and large grass genomes Proc Natl Acad SciUSA 96 8265ndash8270
51 TikhonovAP SanMiguelPJ NakajimaY GorensteinNMBennetzenJL and AvramovaZ (1999) Colinearity and its exceptions inorthologous adh regions of maize and sorghum Proc Natl Acad SciUSA 96 7409ndash7414
52 InukaiT SakoA HiranoHY and SanoY (2000) Analysis ofintragenic recombination at wx in rice Correlation between the molecularand genetic maps within the locus Genome 43 589ndash596
53 CivardiL XiaY EdwardsKJ SchnablePS and NikolauBJ (1994)The relationship between genetic and physical distances in thecloned a1-sh2 interval of the Zea mays L genome Proc Natl Acad SciUSA 91 8268ndash8272
54 GillBS FriebeB and EndoTR (1991) Standard karyotype andnomenclature system for description of chromosome bands andstructural aberrations in wheat (Triticum aestivum) Genome 34830ndash839
Nucleic Acids Research 2004 Vol 32 No 12 3565
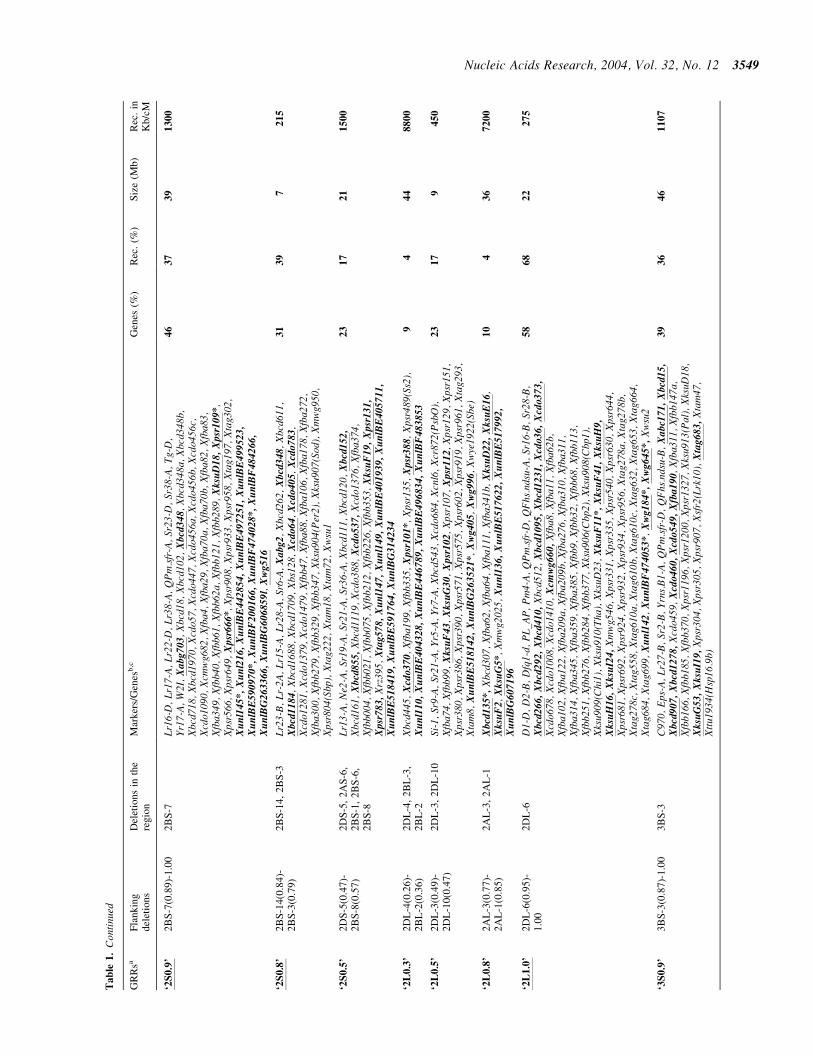
Ta
ble
1
Con
tinu
ed
GR
Rsa
Fla
nk
ing
del
etio
ns
Del
etio
ns
inth
ere
gio
nM
arker
sG
enes
bc
Gen
es(
)R
ec
()
Siz
e(M
b)
Rec
in
Kb
cM
lsquo2S
09
rsquo2
BS
-7(0
89
)-10
02
BS
-7L
r16-
D
Lr1
7-A
L
r22-
D
Lr3
8-A
Q
Pm
sfr
-A
Sr23
-D
Sr38
-A
Tg-
D
Yr1
7-A
W
2I
Xa
bg
703
Xbc
d18
Xbc
d102
X
bcd
34
8
Xbc
d348
aX
bcd3
48b
Xbc
d718
X
bcd1
970
Xcd
o57
Xcd
o447
X
cdo4
56a
Xcd
o456
bX
cdo4
56c
Xcd
o109
0X
cmw
g682
X
fba4
X
fba2
9X
fba7
0a
Xfb
a70b
X
fba8
2X
fba8
3X
fba3
49
Xfb
b40
Xfb
b61
Xfb
b62a
X
fbb1
21
Xfb
b289
X
ksu
D1
8
Xpsr
10
9
Xps
r566
X
psr6
49
Xp
sr6
66
Xps
r908
X
psr9
33
Xps
r958
X
tag1
97
Xta
g302
X
un
l14
5
X
un
l216
X
un
lBE
44
28
54
Xu
nlB
E4
97
251
X
un
lBE
49
95
23
X
un
lBE
59
09
70
X
un
lBF
20
01
66
X
un
lBF
47
40
28
Xu
nlB
F48
42
66
X
un
lBG
26
33
66
X
un
lBG
60
685
9l
Xw
g51
6
46
37
39
13
00
lsquo2S
08
rsquo2
BS
-14(0
84
)-2
BS
-3(0
79
)2
BS
-14
2B
S-3
Lr2
3-B
L
r-2A
L
r15-
A
Lr2
8-A
Sr
6-A
X
ab
g2
X
bcd2
62
Xb
cd3
48
Xbc
d611
X
bcd
11
84
X
bcd1
688
Xbc
d170
9X
bs12
8X
cdo
64
Xcd
o4
05
X
cdo7
83
Xcd
o128
1X
cdo1
379
Xcd
o147
9X
fbb4
7X
fba8
8X
fba1
06
Xfb
a178
X
fba2
72
Xfb
a300
X
fbb2
79
Xfb
b329
X
fbb3
47
Xks
u904
(Per
2)
Xks
u907
(Sod
)X
mw
g950
X
psr8
04(S
bp)
Xta
g222
X
tam
18
Xta
m72
X
wsu
1
31
39
72
15
lsquo2S
05
rsquo2
DS
-5(0
47
)-2
BS
-8(0
57
)2
DS
-5
2A
S-6
2
BS
-1
2B
S-6
2
BS
-8
Lr1
3-A
N
e2-A
Sr
19-A
Sr
21-A
Sr
36-A
X
bcd1
11
Xbc
d120
X
bcd
15
2
Xbc
d161
X
bcd
85
5
Xbc
d111
9X
cdo3
88
Xcd
o5
37
X
cdo1
376
Xfb
a374
X
fbb0
04
Xfb
b021
X
fbb0
75
Xfb
b212
X
fbb2
26
Xfb
b353
X
ksu
F1
9
Xpsr
13
1
Xpsr
78
3
Xrz
395
Xta
g57
8
Xu
nl1
47
Xu
nl1
49
Xu
nlB
E40
19
39
X
un
lBE
405
71
1
Xu
nlB
E5
18
41
9
Xu
nlB
E5
91
764
X
un
lBG
31
423
4
23
17
21
15
00
lsquo2L
03
rsquo2
DL
-4(0
26
)-2
BL
-2(0
36
)2
DL
-4
2B
L-3
2
BL
-2X
bcd4
45
Xcd
o3
70
Xfb
a199
X
fbb3
35
Xp
sr1
01
Xps
r135
X
psr
38
8
Xps
r489
(Ss2
)X
un
l11
0
Xu
nlB
E4
04
32
8
Xu
nlB
E4
46
789
X
un
lBE
49
68
34
X
un
lBF
48
38
53
94
44
88
00
lsquo2L
05
rsquo2
DL
-3(0
49
)-2
DL
-10(0
47
)2
DL
-3
2D
L-1
0Si
-1
Sr9-
A
Sr21
-A
Yr5
-A
Yr7
-A
Xbc
d543
X
cdo6
84
Xcn
l6
Xcr
872(
Psb
O)
Xfb
a74
Xfb
b99
Xksu
F4
3
Xk
suG
30
Xp
sr1
02
Xps
r107
X
psr
11
2
Xps
r129
X
psr1
51
Xps
r380
X
psr3
86
Xps
r390
X
psr5
71
Xps
r575
X
psr6
02
Xps
r919
X
psr9
61
Xta
g293
X
tam
8X
un
lBE
51
81
42
X
un
lBG
26
35
21
Xw
g40
5
Xw
g99
6
Xw
ye19
22(S
be)
23
17
94
50
lsquo2L
08
rsquo2
AL
-3(0
77
)-2
AL
-1(0
85
)2
AL
-3
2A
L-1
Xbcd
13
5
X
bcd3
07
Xfb
a62
Xfb
a64
Xfb
a111
X
fba3
41b
Xk
suD
22
X
ksu
E1
6
Xksu
F2
Xk
suG
5
Xm
wg2
025
Xu
nl1
36
X
un
lBE
51
76
22
X
un
lBE
51
79
92
X
un
lBG
60
71
96
10
43
67
20
0
lsquo2L
10
rsquo2
DL
-6(0
95
)-1
00
2D
L-6
D1-
D
D2-
B
Dfq
1-d
PL
_AP
P
m4-
A
QP
ms
fr-D
Q
Fhs
nds
u-A
Sr
16-B
Sr
28-B
X
bcd
26
6
Xbcd
29
2
Xb
cd4
10
Xbc
d512
X
bcd
10
95
X
bcd
12
31
X
cdo3
6
Xcd
o3
73
X
cdo6
78
Xcd
o100
8X
cdo1
410
Xcm
wg
66
0
Xfb
a8
Xfb
a11
Xfb
a62b
X
fba1
02
Xfb
a122
X
fba2
09a
Xfb
a209
bX
fba2
76
Xfb
a310
X
fba3
11
Xfb
a314
X
fba3
45
Xfb
a359
X
fba3
85
Xfb
b9
Xfb
b32
Xfb
b68
Xfb
b113
X
fbb2
51
Xfb
b276
X
fbb2
84
Xfb
b377
X
ksu9
06(C
bp2)
X
ksu9
08(C
bp1)
X
ksu9
09(C
hi1)
X
ksu9
10(T
ha)
Xks
uD23
X
ksu
F1
1
X
ksu
F4
1
Xk
suH
9
Xksu
H1
6
Xk
suI2
4
Xm
wg5
46
Xps
r331
X
psr3
35
Xps
r540
X
psr6
30
Xps
r644
X
psr6
81
Xps
r692
X
psr9
24
Xps
r932
X
psr9
34
Xps
r956
X
tag2
78a
Xta
g278
bX
tag2
78c
Xta
g558
X
tag6
10a
Xta
g610
bX
tag6
10c
Xta
g632
X
tag6
53
Xta
g664
X
tag6
84
Xta
g699
X
un
l142
Xu
nlB
F4
74
053
Xw
g18
4
X
wg
64
5
X
wsu
2
58
68
22
27
5
lsquo3S
09
rsquo3
BS
-3(0
87
)-10
03
BS
-3C
970
Eps
-A
Lr2
7-B
Sr
2-B
Y
rns
B1-
A
QP
ms
fr-D
Q
Fhs
nds
u-B
X
ab
c17
1
Xbcd
15
X
bcd
90
7
Xbcd
12
78
X
cdo4
59
Xcd
o4
60
X
cdo
54
9
Xfb
a1
90
Xfb
a311
X
fbb1
47a
Xfb
b166
X
fbb1
85
Xfb
b370
X
psr1
196
Xps
r120
0X
psr1
327
Xks
u913
(Pal
)X
ksuD
18
Xksu
G5
3
Xksu
I19
X
psr3
04
Xps
r305
X
psr9
07
Xsf
r2(L
rk10
)X
tag
68
3
Xta
m47
X
ttu1
934(
Hsp
169
b)
39
36
46
11
07
Nucleic Acids Research 2004 Vol 32 No 12 3549
Ta
ble
1
Con
tinu
ed
GR
Rsa
Fla
nk
ing
del
etio
ns
Del
etio
ns
inth
ere
gio
nM
arker
sG
enes
bc
Gen
es(
)R
ec
()
Siz
e(M
b)
Rec
in
Kb
cM
lsquo3S
08
rsquo3
AS
-3(0
71
)-3
BS
-3(0
87
)3
AS
-3
3B
S-7
3
BS
-8E
st-2
-AB
D
Lr3
2-D
P
m13
-B
Xab
g4
60
X
abg4
71
Xb
cd7
06
Xbc
d142
8X
bcd
15
32
X
bcd
18
23
X
cdo
39
5
Xcd
o4
07
X
cdo6
38
X
cdo1
164
Xcd
o1
34
5
Xcd
o1
43
5
Xfb
a9
1
Xfb
a241
X
fbb2
4X
fbb1
42
Xfb
b315
X
fbb
36
6
Xk
suA
6
Xm
wg2
2X
psr
59
8
X
psr9
46
Xta
m5
5
Xta
m6
1
31
39
25
58
0
lsquo3S
05
rsquo3
DS
-1(0
39
)-3
BS
-2(0
56
)3
BS
-2
3D
S-6
3
DS
-5
3D
S-8
3
DS
-1A
TP
ase
a-A
BD
E
st-1
-AB
D
QL
rst
f-B
s-
1-D
X
abg3
90
Xb
cd1
27
X
bcd1
380a
X
cdo3
28
Xcd
o4
80
X
ksu
E2
X
ksu
G1
3
Xksu
H7
X
psr
12
3
Xps
r547
X
psr
68
9
Xpsr
90
2
Xps
r903
X
psr
91
0
X
psr
92
6
Xps
r919
X
psr1
060
Xta
g223
X
tag5
38
Xta
g554
X
tag
72
4
Xta
g756
X
ttu1
935(
Hsp
173
)
31
20
60
43
32
lsquo3L
03
rsquo3
BL
-8(0
28
)-3
BL
-9(0
38
)3
AL
-1
3B
L-1
3
BL
-8
3B
L-9
3
DL
-2A
TP
ase
b-A
BD
G
ot3-
AB
D
Mal
-1-A
BD
S-
1-D
Sr
12-B
X
abc1
76
Xb
cd1
34
Xbcd
36
6
Xb
cd9
27
Xb
cd1
127
X
bcd
11
42
Xbcd
11
45
X
bcd
13
80
X
cdo
54
X
cdo1
18
Xcd
o1
174
X
cdo1
283a
X
fbb2
77
Xksu
G3
6
Xm
wg
68
0
Xm
wg6
88
Xm
wg
802
X
psr
56
X
psr
11
6
Xp
sr1
56
X
psr3
54
Xps
r543
X
psr5
70
Xp
sr1
077
Xps
r114
9X
tag2
21
20
15
19
13
82
lsquo3L
05
rsquo3
AL
-3(0
42
)-3
BL
-10
(05
0)
3A
L-3
3
AL
-7
3B
L-3
3
BL
-10
AT
Pas
ec-
AB
D
Xab
g3
96
X
bcd1
15
Xbc
d288
X
bcd
45
2
Xb
cd8
09
Xbcd
14
18
Xbcd
20
44
X
cdo
28
1
Xcd
o5
34
Xcd
o583
X
cdo7
18
Xcd
o140
6X
fba
21
3
Xfb
a2
14
Xfb
a220
X
fba2
42
Xfb
b156
X
fbb1
77
Xfb
b348
X
ksu9
09(C
hi1)
X
ksu
H2
Xm
wg8
18
Xm
wg9
61
Xpsr
74
Xp
sr7
8
Xp
sr5
78
X
psr7
54
Xps
r804
(Sbp
)X
tag1
18
Xta
g577
X
wg
17
7
Xw
g1
78
22
92
21
85
0
lsquo3L
08
rsquo3
AL
-5(0
78
)-3
DL
-3(0
81
)3
AL
-5
3B
L-1
1
3D
L-3
Xab
g4
Xbcd
22
X
bcd
14
1
Xbc
d147
X
bcd
37
2
Xb
cd5
15
Xb
cd1
555
X
csc4
75(T
lp)
Xfb
b168
X
fbb
27
1
Xfb
b332
X
fbb3
53
Xfb
b378
X
ksu
H1
5
Xm
wg3
0X
mw
g69
Xps
r106
7X
tag
71
8
Xta
m33
X
wg
11
0
X
wia
483(
Cxp
1)
14
10
14
60
9
lsquo3L
09
rsquo3
DL
-3(0
81
)-1
00
3A
L-8
3
DL
-3
3B
L-1
1C
hi2-
D
EST
-5-A
BD
L
r24-
D
R1-
AB
D
R2-
AB
D
R3-
AB
D
Sr24
-D
Sr35
-A
Xa
bc1
61
Xab
c166
X
abc1
72a
Xab
c172
bX
abc1
72c
Xa
bc1
74
X
abg5
5X
abg3
77
Xab
g387
X
ab
g3
89
Xb
cd1
31
Xb
cd3
58
Xbcd
36
1
Xbcd
45
1
Xb
cd1
661
X
bcd1
773
Xcd
o1
05
X
cdo
11
3
Xcd
o127
bX
cdo2
81
Xcd
o4
82
Xfb
a8(H
b)
Xfb
a1
33
Xfb
a1
67
X
fba3
47
X
fba3
60
Xfb
a389
X
fbb1
47b
Xfb
b147
c
Xfb
b2
50
Xfb
b269
X
fbb2
93
Xfb
b3
16
Xks
u912
(Prp
)X
ksu9
14(G
lb3)
aX
ksu9
14(G
lb3)
bX
ksu9
14(G
lb3)
cX
ksu9
14(G
lb3)
dX
ksu
D1
9
Xksu
E1
4
Xks
uE3
Xksu
G4
8
X
ksuG
59
Xk
suG
62
X
mw
g11
Xm
wg1
2X
psr
17
0
Xps
r388
X
psr9
04
Xpsr
93
1
Xpsr
12
03
Xps
r120
5X
rsq8
05(E
mbp
)X
tam
63
Xuc
d111
(Esi
48)
Xw
ia80
7(G
lb33
)X
wia
858(
Glb
35)
44
66
71
49
0
lsquo4S
09
rsquo4
DS
-2(0
82
)-1
00
4D
S-2
ms1
-B
ms2
-D
Xab
g460
X
fbb1
X
ksu9
15(1
4-3-
3a)
Xks
u916
(Oxo
)X
ksu9
17(T
ha)
Xks
u918
(Chi
2)
Xm
wg5
84
Xm
wg6
34
Xps
r332
X
psr9
21
Xrs
q808
(Glo
)X
un
l216
X
un
l164
X
wg
62
23
02
45
34
40
0
lsquo4S
07
rsquo4
DS
-1(0
53
)-4
DS
-3(0
67
)4
DS
-1
4B
S-2
4
DS
-5
4D
S-3
Adh
-B1
Gai
1-B
G
ai2-
D
Gai
3-B
L
r25-
B
Pm
7-B
R
ht1-
B
Rht
10-D
R
ht2-
D
X7S
Glo
b-a
X7S
Glo
b-c
X7S
Glo
b-d
Xab
g55
Xab
g387
X
bgl4
85(G
er)1
X
bgl4
85(G
er)2
X
cdo6
69
Xcd
o795
X
cdo1
33
8
XD
hn6
Xfb
a40
Xfb
a78
Xfb
a320
X
fbb2
27
Xm
wg8
44
Xm
wg2
033
Xp
sr1
10
Xp
sr1
39
Xp
sr1
44
Xp
sr5
41
Xp
sr5
84
Xps
r593
X
psr6
48
Xps
r922
X
psr1
871(
Pki
)X
ucb8
21(P
hyA
)X
un
l133
X
wg
18
4
Xw
g87
6
70
61
41
13
50
lsquo4L
05
rsquo4
DL
-13(0
56
)-4
DL
-6(0
35
)4
DL
-13
4D
L-8
4
DL
-1
4D
L-7
4
DL
-6
4D
L-6
Ba-
B
Hd-
A
Xab
g383
X
abg4
84
Xbcd
11
0
Xbc
d327
X
bcd7
34
Xb
cd1
006
Xbc
d109
2X
bcd1
117
Xbc
d126
5X
bcd1
652
Xbg
l485
(Ger
)3
Xcd
o3
8
Xcd
o64
Xcd
o1
89
X
cdo3
88
Xcd
o4
88
Xcd
o1
387
X
cdo1
401
Xfb
b251
X
Fbp
-D
Xks
uD18
X
ksuF
8X
ksuH
5X
ksuH
8X
mw
g948
X
Pot
-t
Xps
r39(
Fbp
)X
psr
10
4
Xp
sr1
57
Xp
sr1
63
Xps
r860
(Uba
)X
psr9
20
Xps
r927
X
psr1
318
Xrz
251
Xtt
u193
6(H
sp26
6a)
X
ucd1
02(E
si3)
X
wg1
10
38
15
70
63
50
lsquo4L
07
rsquo4
AL
-2(0
75
)-4
AL
-11(0
66
)4
AL
-11
4A
L-7
4
AL
-5
4B
L-3
4
BL
-7
4D
L-2
4
BL
-5
4D
L-1
2
4A
L-9
4
AL
-2
Xab
g390
X
bcd
15
Xbc
d130
X
bcd1
670
Xbn
l50
9X
cdo4
75
Xcd
o4
84
X
cdo5
41
X
fba2
31
Xfb
b154
X
ksu9
19(L
p)
Xks
uD9
Xks
uE6
Xks
uE9
Xks
uG12
X
mw
g549
X
mw
g710
X
psr5
9X
psr
11
5
Xp
sr5
80
Xps
r914
X
psr1
206
Xu
nl1
01
X
wg
18
1
22
12
37
40
00
lsquo4L
09
rsquo4
DL
-14(0
86
)-1
00
4B
L-1
0
4D
L-1
4be
ta-A
my-
1-A
BD
H
p-A
BD
Q
Pm
sfr
-D
Lr2
8-A
Sr
7-A
X
abg3
97
Xak
466(
Nra
)X
bcd1
29
Xbc
d143
1a
Xcd
o20
Xcd
o545
X
cdo9
49
Xcd
o108
1X
cdo1
31
2
Xcd
o1
333
X
cdo1
528
Xfb
a177
X
fbb6
7X
fbb1
14
Xfb
b178
X
fbb1
82
Xfb
b226
X
fbb2
55
Xks
u910
(Tha
)X
ksu9
20(O
xo)2
X
ksu
C2
X
ksu
G1
0
Xm
td86
2(C
M16
)X
mw
g851
X
psr1
19
Xps
r160
(Plc
)X
psr1
64
Xps
r375
X
psr4
84(C
at)
Xps
r567
X
psr5
73
Xps
r604
X
psr1
051
Xum
c190
(Css
1)
Xu
nl1
63
X
wg
11
4
Xw
g789
40
68
60
12
20
3550 Nucleic Acids Research 2004 Vol 32 No 12
Tab
le1
C
onti
nued
GR
Rsa
Fla
nk
ing
del
etio
ns
Del
etio
ns
inth
ere
gio
nM
arker
sG
enes
bc
Gen
es(
)R
ec
()
Siz
e(M
b)
Rec
in
Kb
cM
lsquo5S
09
rsquo5
AS
-6(0
97
)-5
BS
-6(0
81
)5
AS
-6
5B
S-6
Gsp
-AB
D
Ha-
D
Xa
bg
479
X
ab
g7
05
Xbcd
87
3
Xcd
o959
X
fba1
14
X
fba
36
7
Xfb
b1
21
X
fbb
27
6
Xfb
b277
X
mw
g8
35
X
psr
17
0
Xps
r618
X
psr2
152b
X
tag
31
7
Xw
g687
29
60
43
23
89
lsquo5S
07
rsquo5
AS
-3(0
75
)-5
DS
-5(0
67
)5
AS
-3
5D
S-5
No
r-A
P
m2-
D
Xb
cd1
871
X
cdo
68
7
Xcd
o7
49
X
fba1
31
Xfb
a2
32
X
fba
34
2
Xfb
a352
X
fba3
93
X
ksu9
22(T
ha)
X
psr
32
6
Xpsr
62
8
Xpsr
94
0a
X
psr
94
0b
X
psr
94
5
Xta
g31
9
Xta
g62
9
Xta
m5
3a
Xta
m5
3b
Xu
bp
3
Xu
bp
5
Xuc
w14
1
39
28
21
30
00
lsquo5S
06
rsquo5
BS
-8(0
56
)-5
BS
-4(0
43
)5
BS
-8
5D
S-1
5
BS
-4X
bcd
11
30
X
cdo3
44
X
cdo
45
9a
X
cdo
45
9b
X
cdo6
77
a
Xcd
o6
77
b
Xcd
o1
33
5
Xk
suI2
6
Xpsr
11
8
Xp
sr9
29
Xp
sr1
204
X
rg4
63
Xrg
90
1
Xta
m5
42
45
19
63
33
lsquo5S
04
rsquo
5A
S-1
(04
0)-
04
5
5B
S-9
5
BS
-2
5B
S-3
5
AS
-1M
s3-A
X
ksu
G60
X
ksu
H8
Xpsr
11
8
Xpsr
90
3
Xps
r946
X
wg
34
1
Xw
g3
63
14
31
34
33
3
lsquo5L
03
rsquo5
BL
-6(0
26
)-5
DL
-10(0
35
)5
BL
-6
5B
L-2
5
BL
-15
5
BL
-7
5D
L-1
0
5A
L-1
9A
dh-1
-AB
D
Xab
c164
X
bcd
15
7
Xbcd
20
4
Xbcd
50
8b
Xb
cd1
087
Xcd
o785
X
cdo1
04
9
Xfb
a137
X
fbb2
38
Xksu
26
Xksu
D1
6
Xksu
D3
0
X
ksu
D4
2
Xksu
G4
4a
X
ksu
M2
Xm
wg5
61
Xps
r109
X
psr
12
0a
X
psr
12
8
Xps
r335
X
psr3
60
Xps
r574
X
psr8
60(U
ba)
Xps
r906
X
psr1
327
Xta
g22
2
Xuc
w12
7X
wg
41
9
Xw
g56
4
Xw
g90
9
10
84
54
09
1
lsquo5L
05
rsquo5
DL
-12(0
48
)-5
DL
-1(0
60
)5
BL
-1
5B
L-3
5
BL
-5
5B
L-1
1
5D
L-1
2
5D
L-1
Crr
K
r1
Lr1
8P
h1
-B
Xa
bc1
68
Xa
bc3
02
Xab
c71
7
Xab
g6
9
Xa
bg
314
X
ab
g3
87
X
ab
g4
73
Xbcd
9
X
bcd
21
X
bcd
15
7
X
bcd
30
7a
X
bcd
35
1a
X
bcd
35
1b
X
bcd
50
8
Xbc
d926
X
bcd9
81
Xb
cd1
088
X
bcd1
140
Xbc
d187
4X
bcd
19
49
X
cdo5
7
Xcd
o3
88a
X
cdo4
12
X
cdo5
48
a
Xcd
o7
86
a
Xcd
o7
86b
X
cdo1
09
0
Xcd
o116
8X
cdo
11
92
X
fba1
27
X
fba1
66
Xfb
b1
22a
Xfb
b156
X
ksu
8a
X
ksu
8b
X
ksu
8c
Xk
su24
Xk
su92
3(P
r1b
)X
ksu
G7
Xk
suG
12
X
ksu
G44
b
Xksu
H1
X
ksuM
9X
ksu
P6
X
ksu
Q10
X
ksu
Q24
X
ksu
Q35
X
ksu
Q45
a
X
ksu
Q60
X
ksu
Q6
4
Xksu
Q65
Xksu
S1
X
mb
g3
01
Xm
gb1
Xm
gb1
0
Xm
gb
63
X
mg
b1
74
X
mg
b1
91
X
mg
b3
01
X
mg
b3
41
X
mw
g5
2
Xm
wg
55
2
Xm
wg
58
3
Xm
wg
592
X
mw
g6
04
Xm
wg6
24
Xm
wg
76
8
Xm
wg
914
Xm
wg
923
X
mw
g9
56
a
Xm
wg
95
6b
X
psr
10
0
Xpsr
12
0b
Xps
r492
(Acl
3)
Xps
r637
X
psr8
06(A
cl2)
X
psr9
11
Xps
r912
X
psr1
202
Xta
g61
4
Xta
g6
44
Xu
bp
25
X
ucd1
04(E
si14
)X
un
l4
Xu
nl1
04
X
un
l109
X
un
l113
X
un
l116
X
un
l117
X
un
l119
X
un
l12
1
Xu
nl1
23
X
un
l13
8
Xu
nl1
39
X
un
l14
1
Xu
nl1
52
Xu
nl1
60
Xu
nl1
69
X
un
l191
X
un
l21
3
Xu
nl2
14
X
un
l21
7
Xu
nl2
18
X
un
l22
4
Xw
g3
64
X
wg
53
0
Xw
g56
4
Xw
g8
89
Xw
g102
6
36
20
61
20
33
lsquo5L
08
rsquo5
BL
-14
(07
5)-
5B
L-1
6(0
79
)5
BL
-9
5B
L-1
4
5B
L-1
6
5D
L-5
5
DL
-9d
hn
2-A
BD
F
r1-A
Ib
f-1-
AB
D
hsp1
69b
-A
Mpc
1Q
-A
Qkb
cnl
-5A
bts
n1-B
V
rn1-
A
Vrn
3-D
X
ab
c15
5
Xa
bc3
09
Xa
bg
391
X
bcd1
83
Xbcd
30
7b
Xb
cd4
50
Xb
cd8
81
Xbcd
10
30
X
bcd
12
35
a
Xbcd
14
27
X
cdo
87
X
cdo
34
8
Xcd
o4
00
X
cdo4
57
X
cdo
46
5
Xcd
o4
84
X
cdo5
04
Xcd
o5
48b
X
cdo5
84
X
cdo1
18
9
Xcd
o1
32
6
Xcd
o1
475
X
cdo1
508
Xfb
a6
8
Xfb
a190
X
fba2
09
Xfb
a332
X
fba3
48
X
fba3
51
X
fbb2
6X
fbb
16
6
Xfb
b199
X
fbb2
09
Xfb
b2
37
X
fbb
25
5b
Xfb
b322
X
fbb3
23
Xfb
b328
X
ksu
91
9(L
pX
)X
ksu
92
3(P
r1a
)X
ksu
F1
X
ksu
G1
4
Xksu
G57
Xksu
P1
0
Xk
suP
18
X
ksu
P2
0
Xksu
P2
1
Xk
suP
23
X
ksu
P5
0
Xksu
P6
4
Xk
suQ
13
X
ksu
Q16
X
ksu
Q3
2
Xksu
Q3
4
Xksu
Q4
5b
X
ksu
Q5
8
Xksu
Q5
9
Xksu
Q6
3
Xksu
Q66
X
ksu
Q67
X
mw
g7
2
Xm
wg
76
Xm
wg
51
4
Xm
wg
51
6
Xm
wg
55
0
Xm
wg
60
2
Xm
wg
71
6
Xm
wg
740
X
mw
g8
62
X
mw
g9
00
X
mw
g9
22
X
mw
g9
33
Xps
r14(
alph
a-A
my-
3-A
BD
)X
psr
79
X
psr
11
5
X
psr
13
1
Xp
sr1
45
Xps
r575
X
psr8
19(A
dpg1
-AB
D)
Xps
r918
X
psr9
63
Xps
r119
4X
rsq8
05(E
mpb
-AB
D)
Xrz
32
8
Xrz
39
5
Xrz
57
5
Xrz
58
9
Xrz
74
4
Xta
g69
X
tag
16
5
Xta
g25
1
Xta
g35
4
Xta
g6
21
X
tag
65
1
Xta
g69
5a
X
tag
69
5b
X
un
l137
Xu
nl1
40
X
wg
64
4
Xw
g90
8
36
40
20
30
8
lsquo5L
09
rsquo5
AL
-23(0
87
)-1
00
5A
L-2
3B
1-A
be
ta-A
my-
1-A
L
r1-D
Q
kbc
nl-5
Aa
Rh1
2-A
X
abg3
66
Xbc
d110
3X
bcd
12
35
b
X
bcd1
421
Xbc
d167
0X
cdo2
0X
cdo
21
3
X
cdo3
46
Xcd
o3
88b
X
cdo
13
12
X
cdo1
528
Xfb
b100
X
fbb2
13
Xfb
b249
X
fbb3
30
Xk
suQ
62
X
mw
g211
2X
psr
37
0
Xps
r567
aX
psr5
67b
Xpsr
58
0
Xps
r120
6X
psr1
316
Xta
g69
5
X
tag
75
4
Xw
g11
4
11
29
66
16
50
Nucleic Acids Research 2004 Vol 32 No 12 3551
Ta
ble
1
Con
tinu
ed
GR
Rsa
Fla
nk
ing
del
etio
ns
Del
etio
ns
inth
ere
gio
nM
arker
sG
enes
bc
Gen
es(
)R
ec
()
Siz
e(M
b)
Rec
in
Kb
cM
lsquo6S
10
rsquo6
DS
-6(0
99
)-1
00
6A
S-5
6
BS
-3
6B
S-6
6
BS
-2
6D
S-6
6
DS
-4L
r36-
B
Nor
2-B
Q
Gpc
nds
u-B
Q
Pm
sfr
-B
Sr5-
D
Sr8-
A
Su1-
B
Xab
g387
X
abg4
58
Xab
g466
X
ak46
6(N
ra)
Xbc
d21
Xbc
d342
X
bcd1
821
Xcd
o476
X
cdo1
380
Xcm
wg6
20
Xcm
wg6
52
Xcm
wg6
79a
Xcm
wg6
79b
Xcm
wg
69
0
Xfb
a1
X
fba8
5
Xfb
a1
87
Xfb
a3
44
X
fbb3
54
X
ksuE
3X
ksuF
36
Xks
uF43
X
ksu
G8a
X
ksu
G8b
X
ksu
G48
Xk
suH
4
Xksu
I28
X
ksuM
5X
mw
g59
Xm
wg7
9X
mw
g573
X
mw
g6
52
Xm
wg8
20
Xm
wg8
87
Xm
wg
91
6
Xm
wg
96
6
Xpa
p4
Xpsr
8(C
xP
3)a
X
psr
8(C
xP
3)b
X
psr
10
(Gli
-2)
Xpsr
10
6a
X
psr
14
1b
X
psr1
67
Xpsr
30
1a
X
psr5
46
Xp
sr5
51
Xps
r563
X
psr
62
7
Xps
r662
X
psr8
99
Xps
r904
X
psr
91
6
Xpsr
96
4
Xps
r967
X
rgc6
9X
tag5
37
Xta
g562
X
tag5
82
Xta
g75
2
Xta
m60
X
uta
2(P
sif)
82
89
10
16
4
lsquo6S
05
rsquo6
DS
-2(0
45
)-6
AS
-5(0
65
)6
AS
-4
6A
S-5
6
AS
-1
6B
S-8
6
BS
-5
6B
S-1
6
DS
-4
6D
S-2
Xa
bc1
73
Xcd
o270
X
cdo
53
4
Xcd
o115
8X
fba6
7
Xfb
a1
48
Xfb
a3
99
X
fbb2
31
X
cmw
g653
X
psr
14
1a
X
psr
31
2
Xps
r962
X
tam
31
X
rz4
76
X
uta
1(P
sif)
18
94
16
94
9
lsquo6L
04
rsquo6
BL
-3(0
36
)-6
BL
-4(0
44
)6
AL
-6
6A
L-4
6
AL
-1
6B
L-4
6
BL
-5
6B
L-3
6
DL
-6
6D
L-1
Xa
bc1
63
Xa
bc1
75
X
ab
g2
0
Xab
g379
X
ab
g3
88
X
abg4
74
Xb
cd1
02
Xbc
d758
X
cdo2
9X
cdo
204
Xcd
o497
X
cdo5
07
Xcd
o7
72
X
cdo1
315
Xcd
o142
8X
cmw
g6
53
X
cmw
g6
64
X
fba3
28
X
fba3
67
X
fba
39
7
Xfb
b9
5
Xfb
b2
83
Xfb
b3
64
X
ksuD
17
Xks
uG58
X
ksuM
151
Xm
wg
872
Xm
wg
911
X
mw
g206
1X
psr1
13
Xpsr
14
2
Xp
sr3
71
Xp
sr4
63(P
rk)
Xps
r831
X
psr9
08
Xp
sr9
15
Xrs
q8
05
(Em
bp
)X
tag3
17
Xta
g33
4
Xta
m6
Xta
m9
Xta
m10
X
tam
27
Xta
m31
X
tam
57
Xu
cd1
09
(Esi
35
)X
VA
tp-B
2X
wg2
23
Xw
g93
3
30
21
15
84
7
lsquo6L
07
rsquo6
AL
-1(0
69
)-6
BL
-6(0
76
)6
AL
-1
6A
L-5
6
BL
-9
6B
L-8
6
BL
-14
6
BL
-1
6B
L-6
6
DL
-1
6D
L-1
2
6D
L-7
6
DL
-13
Xa
bg
1
Xfb
b2
15
X
ksuF
24
Xm
wg8
20
Xm
wg
20
29
X
npi2
53
Xps
r149
X
psr
30
1b
X
tag4
95
Xta
m1
7
Xta
m7
4
Xuc
w26
X
wg
28
6
Xw
g341
10
66
01
17
65
lsquo6L
09
rsquo6
AL
-8(0
90
)-1
00
6A
L-8
6
BL
-6
6D
L-1
3A
HV
5D
hn3
Got
2-A
BD
H
t3-D
N
or7-
B
Lr3
-B
Sr11
-B
Sr13
-A
Sr29
-D
WsP
16
Xab
c154
X
abc4
51
Xab
g652
X
bcd
1
Xbc
d269
X
bcd
27
6
Xbc
d880
X
bcd1
510
Xcd
o388
X
cdo5
16
Xcd
o836
X
cdo1
091
Xcm
wg
66
9
Xcm
wg
67
4
Xcm
wg
68
4
Xcm
wg
716
Xcs
b1
12b
(Dh
n5
)X
fba1
X
fba4
2
Xfb
a8
1
Xfb
a1
11
X
fbb
40
X
fbb5
7
Xfb
b5
9
Xfb
b7
0
Xfb
b8
2
Xfb
b1
64
Xfb
b1
69
X
fbb1
70
X
fbb
22
1
Xfb
b3
27
X
ksu
D1
Xks
uD12
X
ksuD
17
Xks
uD27
X
ksuE
14
Xks
uF14
aX
ksuF
14b
Xks
uF19
X
ksuF
37
Xks
uG30
X
ksu
G51
X
ksuM
1X
ksuM
75
Xm
wg
19
Xm
wg
21
X
mw
g7
4a
Xm
wg
74
b
Xm
wg5
13
Xm
wg
514
X
mw
g7
98
X
mw
g813
X
mw
g838
X
mw
g887
X
mw
g897
X
mw
g934
X
mw
g2
053
X
mw
g2
10
0
Xp
sr2
(a-a
my1
)a
Xpsr
2(a
-am
y1)b
X
psr1
06b
Xps
r134
X
psr1
54
Xps
r546
X
psr6
05
Xpsr
90
4
Xpsr
90
8
Xps
r966
X
psr
96
7
Xrg
c74
Xta
g495
X
tag5
20
Xta
g547
X
tag6
80
Xta
g70
5
Xta
g762
X
tam
10
b
Xta
m21
X
tam
26
Xta
m2
8
Xta
m3
6
Xu
cd1
06
(Esi
18
)X
wg
34
1
Xw
g4
05
60
72
45
82
5
lsquo7S
09
rsquo7
AS
-1(0
90
)-1
00
7A
S-1
7
AS
-9P
gd3-
A
Xab
g378
X
abg7
04
Xb
cd9
3
Xbcd
13
0
Xb
cd5
88
Xb
cd9
07
Xbcd
18
72
X
cdo5
45
X
cdo
14
00
X
fba8
X
fba1
7X
fba6
5X
fba7
2X
fba9
3X
fba1
09
Xfb
b121
X
fba1
27
Xfb
a311
bX
fba3
21
Xfb
b9
Xfb
b156
X
fbb2
78
Xk
suD
9
Xm
wg5
30
Xm
wg
90
5
Xm
wg
20
80
X
psr
11
9
Xp
sr1
60(P
lc)
Xp
sr3
86
Xpsr
39
2
Xpsr
56
3
Xps
r648
X
psr8
33(P
er)
Xps
r946
aX
psr9
46b
Xta
g18
4
Xta
g6
1
Xum
c190
(Css
1)
Xu
nl2
22
X
un
l223
X
wye
835(
Wx)
30
32
40
14
81
lsquo7S
08
rsquo7
AS
-7(0
87
)-7
AS
-2(0
73
)7
AS
-7
7A
S-1
2
7A
S-2
Lr3
4-D
N
ar7-
A
Pc1
-B
Xab
c15
1
X
ab
c15
2
Xa
k4
66(N
ra)
Xbcd
14
38
X
cdo
43
1
X
cdo
47
5
Xcd
o5
34
Xcd
o6
76
Xcd
o7
80
X
cdo1
18
9
X
cdo
13
95
X
fba4
2X
fba3
46
Xfb
a377
X
fbb6
7a
Xfb
b186
aX
ksu
A1
Xk
suD
25
Xk
suE
3
Xksu
F4
8
Xk
suH
8
Xm
wg7
10
Xps
r490
(Ss1
-AB
D)
Xps
r604
X
psr6
62
Xrj
19
Xrz
2X
tam
13
Xta
g65
1
Xw
g83
4
23
22
36
19
78
lsquo7S
04
rsquo7
AS
-10
(04
5)-
7D
S-5
(03
6)
7D
S-1
7
DS
-5
7A
S-1
0
7A
S-5
Am
p-3-
A
Brz
-A
Est
3-A
P
an2-
A
Rc1
-A
Rc3
-D
Xa
bc4
65
Xbcd
31
0
Xbcd
38
5
Xb
cd7
07
Xb
cd9
81
Xb
cd1
06
6
Xbcd
13
38
X
bcd
17
73
X
cdo
57
X
cdo7
8
X
cdo9
1
X
cdo5
95
Xcm
wg
66
9
Xcm
wg
70
4
X
fba3
2X
fba2
48
Xfb
a340
X
fba3
71
Xfb
b150
X
fbb1
95
Xfb
b226
X
fbb2
64
Xk
suD
15
X
ksu
S1
X
mw
g8
9
Xpsr
10
3
Xp
sr1
08
Xp
sr1
50
Xp
sr1
52
Xps
r492
(Acl
3)
Xp
sr9
55
Xps
r192
1X
rj5
X
tam
64
X
un
l13
4
Xu
nl1
57
Xu
nl1
61
X
wg
18
0a
31
43
29
85
3
3552 Nucleic Acids Research 2004 Vol 32 No 12
Tab
le1
C
onti
nued
GR
Rsa
Fla
nk
ing
del
etio
ns
Del
etio
ns
inth
ere
gio
nM
ark
ers
Gen
esbc
Gen
es(
)R
ec
()
Siz
e(M
b)
Rec
in
Kb
cM
lsquo7S
02
rsquo7
AS
-4(0
26
)-7
BS
-3(0
16
)7
AS
-6
7A
S-4
7
DS
-3
7B
S-3
Xa
bg
476
a
Xb
cd9
8
Xbcd
34
9
Xcm
wg
70
5
Xfb
a363
X
fbb3
43
Xm
wg
808
X
psr
65
X
rz4
X
tag
30
1
Xta
g53
6
Xta
g65
8
Xw
g5
22
Xw
g66
91
02
36
21
687
lsquo7L
01
rsquo7
DL
-6(0
10
)-7
AL
-4(0
18
)7
DL
-6
7A
L-4
7
BL
-14
Xcd
o5
51
X
cdo1
19
9
Xpsr
16
9
Xp
sr3
03
Xta
g43
9
Xta
g64
23
13
31
52
78
lsquo7L
03
rsquo7
AL
-3(0
29
)-7
BL
-1(0
40
)7
AL
-3
7B
L-2
7
BL
-1
7D
L-5
Am
y2-A
V
Atp
-B1-
A
Xab
c455
X
ab
g4
76
b
Xcd
o5
3
Xcd
o6
73
X
cdo
92
0
Xcd
o1
40
7
Xcd
o1
42
8
Xh
r20b
X
mw
g2
03
1
Xm
wg8
25
Xpsr
10
5
Xpsr
16
5
Xp
sr3
11
Xp
sr3
40
Xp
sr3
89
Xps
r468
(Pep
c)
Xpsr
51
4
Xpsr
69
0
Xps
r803
(Fed
)X
psr
93
8
Xta
g5
98
X
ubp2
X
un
l188
X
wg
46
6
Xw
g68
6a
X
wg
71
9
Xw
ye19
58(A
dpg3
)
19
54
51
38
89
lsquo7L
08
rsquo7
DL
-4(0
76
)-7
AL
-2(0
87
)7
AL
-21
7
AL
-6
7B
L-1
0
7B
L-1
3
7A
L-8
7
AL
-13
7A
L-1
6
7A
L-2
7
DL
-4
Ep-
D1b
-D
Lr1
9-D
P
m5-
B
Sr22
-A
VA
tp-A
-A
Xab
c305
X
ab
c31
0
Xbc
d178
X
bcd
19
30
X
cdo6
65
X
cdo6
86
Xcd
o7
75
Xcd
o962
X
fba6
9X
fba9
7X
fba2
04
Xfb
a234
X
fba2
59
Xfb
a264
X
fba3
01
Xfb
a350
X
fba3
82
Xfb
b67b
X
fbb7
9X
fbb1
75
Xfb
b218
X
fbb3
25
Xks
u927
(Grp
94a)
X
ksu9
27(G
rp94
b)
Xksu
A5
X
ksu
D2
X
ksu
D39
X
ksu
D6
Xk
suD
7
Xk
suD
9
Xksu
G1
2
Xk
suG
39
Xk
suG
7
Xm
wg
97
5
Xpsr
72
X
psr
11
7
Xp
sr1
29
Xps
r350
aX
psr3
50b
Xpsr
54
7
Xp
sr5
48
Xpsr
56
0
Xpsr
68
1
Xpsr
92
7
Xri
s44
Xrr
11
X
rz4
76
X
rz6
82
X
tag
47
8
Xta
g5
49
X
tag
68
6
Xta
m6
2a
Xta
m6
2b
Xuc
d101
(Esi
2)
Xu
nl1
70
X
un
l185
X
un
l204
X
wg
18
0b
X
wg4
20
Xw
g514
X
wg
68
6b
43
39
41
86
3
lsquo7L
10
rsquo7
AL
-9(0
94
)-7
AL
-15(0
99
)7
AL
-9
7A
L-1
5B
dv1
Cht
1b-B
D
Ep-
V1
Lr1
4a-B
L
r20-
A
Pch
1-A
BD
P
ch2-
A
Pm
1-A
P
m9-
A
Sr15
-A
Sr17
-B
Xab
g461
X
cdo3
47
X
cdo
41
4
Xcs
ih8
1
Xfb
b18
Xfb
a21
Xfb
a134
X
fbb1
45
Xfb
b186
bX
fbb1
89
Xfb
b238
X
ksu
929(
Cat
)X
ksu
B7
Xks
uE18
X
ksu
G3
4
Xks
uH9
Xm
wg9
38
Xm
wg
206
2
Xp
sr1
21(G
lb3)
Xpsr
14
8
Xps
r680
X
psr
68
7
Xp
sr7
43
Xps
r965
X
psr1
923
Xps
r195
4(T
ha)
Xrz
508
Xta
g3
5
Xta
g54
6
Xta
g75
0
Xta
m50
X
wg
34
1
Xw
g3
80
X
wg
86
6
Xw
g18
06
X
wia
482
31
53
21
44
2
aM
ajor
GR
Rs
are
un
der
lin
ed
bA
ster
isk
repre
sen
tm
ark
ers
ten
tati
vel
yp
lace
dw
ith
ina
GR
R
cM
ark
ers
inb
old
are
ph
ysi
call
ym
app
ed
Th
eu
nd
erli
ned
mar
ker
sar
eb
oth
pre
sen
to
nth
eco
nse
nsu
sp
hy
sica
lan
dg
enet
icm
aps
Nucleic Acids Research 2004 Vol 32 No 12 3553
RESULTS
In order to identify and demarcate the gene-containing regionsprecise physical location of 3025 gene marker loci including252 phenotypically characterized genes and 17 quantitativetrait loci (QTLs) was revealed First 942 cDNA or PstI geno-mic clones were physically mapped using 334 deletion linesEach gene marker loci was localized to the smallest possiblechromosomal interval by combining mapping informationfrom the three wheat homoeologs on a consensus physicalmap This analysis localized the gene-containing regionsand identified the flanking deletion breakpoints Second aconsensus genetic linkage map was constructed by combininginformation from 137 wheat maps and was compared with theconsensus physical map via 428 common markers (underlinedbold face markers Table 1) This comparison revealed thephysical location of phenotypically characterized genes con-firmed gene distribution and provided estimates of recombina-tion at a sub-chromosomal level
Physical mapping
The physical mapping results are provided in supplementaryfigures (AndashG) and are summarized in Table 1 With an averageof 135 the number of physically mapped probes ranged from43 for group 4 to 274 for group 5 chromosomes The averagenumber of deletion lines used per homoeologous group was 48with a range of 40 to 58 (Table 2) The 942 probes detected2036 loci of which 617 were for the A 740 for the B and 679were for the D genome chromosomes (Table 3) With anaverage of 22 the number of loci per probe ranged from19 for group 6 to 24 for groups 1 and 3 Using one restrictionenzyme 45 of the probes detected loci on all three homo-eologs 25 on two and 29 of the probes detected loci ononly one of the three homoeologs (Table 3) Among the probesdetecting loci on two homoeologs the number for B and Dgenome chromosomes was more than double (124 probes)compared to either of the other two combinations (A and Dor A and B) Similarly among the probes detecting loci on onlyone of the three homoeologs the number for the B genome wasmore than double compared to either of the other two Thetotal number of loci detected for the B genome was 37compared with 33 for the D and 30 for the A genomeThe number of probes mapping on all three homoeologs ran-ged from 29 for group 6 to 60 for group 1 Similarly thenumber of probes mapping only on one of the three homoeo-logs ranged from 19 for group 3 to 41 for group 6
Except for a few discrepancies relative order FL locationand overall distribution of gene markers were similar amonghomoeologs It was therefore possible to generate consensusphysical maps by combining mapping information from thehomoeologs Deletion breakpoints of homoeologs were placedon the consensus map and each marker was placed to theshortest possible interval (see Methods)
Gene distribution on the wheat chromosomes is obviousfrom Figure 1 Regions of very high marker density wereobserved on all consensus physical maps and were calledgene-rich regions (GRRs) The location and size of eachGRR was drawn to scale and the bracketing deletion break-points are shown on the lsquoleftrsquo Detailed information regardingthe bracketing deletions size markers and other deletion linesfor each GRR is given in Table 1 and is summarized in Table 2With an average of seven and a range of five to eight perchromosome 48 GRRs were identified for the wheat genomethat contained 94 of the markers (Table 2) The remaining6 of the markers were present in other regions includingcentromere of chromosome 1B that contained markersXbcd1072 and Xpsr161
Comparative analysis
With the objectives to confirm the gene distribution physicallymap additional markers including phenotypically character-ized genes and to reveal precise distribution of recombinationon the wheat chromosomes consensus genetic linkage mapswere constructed for each of the homoeologous groups andcompared with the consensus physical maps A total of 1417markers including 252 phenotypically characterized genes and17 QTLs were placed on the consensus genetic linkage maps(Figure 1) With an average of 202 per chromosome thenumber of markers ranged from 151 for group 4 to 235 forgroup 2 The average number of phenotypically characterizedgenesQTLs was 38 per chromosome group with a range of 28for group 5 to 43 for group 1
The 428 common markers were used to compare the con-sensus physical and genetic linkage maps A sector corre-sponding to each of the GRR was identified on the geneticlinkage map Additional markers and useful genes present onthe consensus linkage map were then localized to the corre-sponding GRR and the results are summarized in Table 1About 94 (13361417) of the consensus genetic linkagemap markers including 241 of the 252 phenotypically char-acterized genes and all 17 QTLs mapped in the GRRs(Figure 1 Table 1) The distribution of gene markers observed
Table 2 Summary information about the identified GRRs
Group Size (Mb) No of del in GRR Total No of deletion No of Marker No of GRRS L Total S L Total S L Total S L Total S L Total
1 25 94 119 19 32 51 26 26 52 126 126 252 3 5 82 67 111 178 8 8 16 25 17 42 128 145 273 3 4 73 131 131 262 9 10 19 20 20 40 88 153 241 3 4 74 94 167 261 5 18 23 16 33 49 56 106 162 2 3 55 96 192 288 11 18 29 17 35 52 62 290 352 4 4 86 51 84 135 14 22 36 15 26 41 85 163 248 2 3 57 141 140 281 13 18 31 19 39 58 137 154 291 4 4 8Total 605 919 1524 79 126 205 138 196 334 682 1137 1819 21 27 48
3554 Nucleic Acids Research 2004 Vol 32 No 12
from the genetic linkage maps was similar to that from thephysical maps Between the two methods 3025 marker lociwere physically localized on wheat chromosomes that corre-sponded to 1931 unique gene loci (Figure 1 Table 1) Of these94 mapped within the 48 GRRs The remaining 6 werepresent in small groups of one to four markers separated bymore than one deletion breakpoints
Gene distribution
The number and location of GRRs was different among wheatchromosomes (Figure 1 and Table 1) Twenty-one GRRs werepresent on the short arms and contained 35 of the wheatgenes The remaining 27 GRRs were present on the long armsand contained about 59 of the genes (Table 1) The numberof GRRs per chromosome varied from five (groups 4 and 6) toeight (Groups 1 5 and 7) Essentially no GRR was observed inthe centromeric regions of the chromosomes Only one smallGRR (lsquo7L01rsquo) containing 4 of the armrsquos genes was observedin the proximal 20 of any chromosome In general GRRspresent in the distal regions were relatively higher in genedensity More than 80 of the total marker loci mapped inthe distal half of the chromosomes and 58 mapped in thedistal 20 (Figure 1 and Table 1)
Significant differences were observed among GRRs formarker number marker density and the size The 48 GRRsencompassed about 1554 Mb that is equivalent to 29 of thewheat genome (Table 1) Gene density and number in18 GRRs was very high (major GRRs) (underlined inTable 1 and Figure 1) These major GRRs contained nearly60 of the wheat genes but covered only 11 of the genomeThe gene number and density was variable even among thesemajor GRRs Five of these (lsquo1S08rsquo lsquo2L10rsquo lsquo4S07rsquo lsquo6S10rsquoand lsquo6L09rsquo) contained 26 of the wheat genes but spannedonly 3 of the genome On the contrary four minor GRRs(lsquo1S04rsquo lsquo2L03rsquo lsquo5S04rsquo and lsquo7L01rsquo) contained only 2 ofthe wheat genes but covered gt2 of the genome Estimatedsizes of GRRs varied from 3 Mb for lsquo1S04rsquo to 71 Mb forlsquo3L09rsquo with an average of 32 Mb The total region spannedby GRRs ranged from 119 Mb for group 1 to 288 Mb forgroup 5 Number of genes in a GRR varied from 4 of the armin lsquo7L01rsquo to 82 in lsquo6S10rsquo Gene density varied as much as70-fold among GRRs with a range from a gene per 78 kb inlsquo1S08rsquo to 5500 kb in lsquo7L01rsquo Gene distribution even withinGRRs appeared to be uneven The lsquo1L09rsquo region is presentbetween FLs 084 and 09 Of the total 22 markers present inthe region 16 mapped between FL 084 and 085 one betweenFL 085 and 089 and five between FL 089 and 09
Physical mapping of phenotypic markers
The 269 phenotypic markers mapped in this study included80 monogenically inherited wheat disease resistance genes and17 QTLs (Figure 1 and Table 1) Some of the other usefulgenes were Eps (earliness per se) Hd (awnedness) Kr (cross-ibility) Ph1 plant height male sterility and ear morphologygenes (36) Of the 269 phenotypic markers and useful genes159 were reliably located on the consensus genetic maps(colored red Figure 1) The remaining 93 genes were placedon the consensus genetic maps because of their close associa-tion (lt5 cM) with one or more markers The 17 QTLs werelocated to 10 cM intervals on the consensus linkage map asT
ab
le3
S
um
mar
yo
fth
ep
hy
sica
lly
map
ped
wh
eat
loci
on
ho
mo
eolo
go
us
gro
ups
Chro
mo
som
e
gro
up
s
AB
DA
BB
DA
DA
BD
LN
o
PL
PL
PL
PL
PL
PL
PL
To
tal
AT
ota
lB
To
tal
CT
ota
lP
ML
To
tal
PM
LC
AG
ran
dto
tal
18
92
67
36
19
38
12
99
23
23
33
10
21
34
11
23
48
11
74
65
24
51
35
36
14
28
51
01
18
89
95
47
07
31
97
20
74
04
36
72
01
91
87
14
11
22
77
10
10
55
94
93
90
27
71
44
42
14
17
51
48
10
20
00
88
33
11
29
34
28
91
13
82
29
51
09
32
71
53
04
69
21
12
22
52
55
55
51
31
31
60
22
51
79
56
41
06
67
06
33
99
51
01
73
41
12
26
61
91
92
02
05
57
48
12
10
14
03
50
76
82
04
12
24
11
22
24
48
19
19
19
19
13
13
12
31
10
11
63
49
13
74
86
To
tal
42
81
28
45
11
02
12
42
48
63
12
67
57
51
37
13
76
46
46
17
74
06
79
20
36
98
93
02
5
P
pro
be
L
loci
P
ML
p
hy
sica
lly
map
ped
loci
P
ML
CA
p
hy
sica
lly
map
ped
loci
by
com
par
ativ
ean
alysi
sA
ctu
allo
cin
um
ber
may
be
incr
ease
d2
2
fold
Nucleic Acids Research 2004 Vol 32 No 12 3555
their precise location within the intervals was not knownThese 93 genes and 17 QTLs are colored green in Figure 1With an average of 36 the number of phenotypic markersvaried from 29 for group 4 to 44 for group 1 Comparisonof the genetic with the physical consensus maps localized 258of the 269 phenotypic markers and useful genes to 37 GRRs
The highest number (32) of phenotypic markers was observedfor the lsquo1S08rsquo region The 11 GRRs that lacked phenotypicmarkers were present in the proximal regions of the chromo-somes (Figure 1 and Table 1) The genes mapping in the non-GRR regions are Per1 Hk1 Lr35 Xksu905 (Wip) Lr25 Lr9Pm7 Lr30 Xwsu4 (Dor4) tav1933 (Vdoc) and v1
3556 Nucleic Acids Research 2004 Vol 32 No 12
Distribution of recombination
Comparison of the consensus physical and genetic linkagemaps via 428 common markers provided a detailed andaccurate estimate of recombination at a sub-regional level(Figure 1) In general a severe suppression of recombinationwas observed in the centromeric regions of the wheat
chromosomes (Figure 1) One-fourth of the wheat genomepresent around the centromeres accounted for lt1 of thetotal recombination Nearly perfect linkage was observedamong markers present on different arms of a chromosomeFor example markers Xcdo618 (lsquo1S04rsquo) and Xcdo98(lsquo1L02rsquo) were physically separated by one-fourth ofthe chromosomal length but were lt2 cM apart Due to the
Nucleic Acids Research 2004 Vol 32 No 12 3557
lack of recombination in the proximal regions a large num-ber of markers clustered in the centromeric regions of thelinkage maps (Figure 1)
The gene-poor regions accounted for only 5 of therecombination as 95 of the recombination was observedin the GRRs (Figure 1 and Table 1) Markers present intwo different GRRs separated by a gene-poor region were
usually tightly linked on the genetic linkage map For exam-ple no recombination was observed between markers Xwg789(lsquo1S06rsquo) and Xcdo618 (lsquo1S04rsquo) Similarly markers XksuD22(lsquo2L08rsquo) and Xcdo373 (lsquo2L10rsquo) were inseparable on thegenetic linkage map even though these were physically separ-ated by 20 of the armrsquos length (Figure 1) Maximumrecombination observed in a gene-poor region was for the
3558 Nucleic Acids Research 2004 Vol 32 No 12
region between lsquo4S09rsquo and lsquo4S07rsquo that accounted for 12of the armrsquos recombination Recombination occurring in theGRRs varied from 90 for group 4 to 985 for groups 6 and7 The chromosome 3L GRRs accounted for almost 100 ofthe armrsquos recombination Among GRRs maximum geneticlength of 143 cM was observed for lsquo3L09rsquo and minimumof 1 cM was for lsquo1S04rsquo region (Figure 1 and Table 1) Recom-bination rate for two GRRs (lsquo7L01rsquo and lsquo7L10rsquo) present on
the same chromosome arm was 53-fold different Only 1ndash3of the armrsquos recombination was observed for the GRRslsquo1L02rsquo and lsquo7L01rsquo (Figure 1)
Recombination in the distal chromosomal regions was muchhigher as compared to the proximal halves The recombinationrates among GRRs present in the distal half of the chromo-somes were however highly variable Recombination rates insome proximal GRRs were higher than in distal GRRs For
Nucleic Acids Research 2004 Vol 32 No 12 3559
example lsquo1L09rsquo region is proximal to lsquo1L10rsquo but is about5-fold higher in recombination (Figure 1) There are six otherexamples where recombination in the proximal GRRs is 38ndash325 higher compared to the distal GRRs (Figure 1)
In general the recombination rate in the smaller GRRsseemed higher as compared to the GRRs that encompassedlarger chromosomal regions The 10 Mb sized region
lsquo6S10rsquo had the highest percentage recombination per chromo-some arm (Table 1) Similarly the lsquo1S08rsquo region showed 86of the armrsquos recombination and is only 7 Mb in size On thecontrary a larger GRR lsquo4L05rsquo is 70 Mb but accounted forlt15 of the armrsquos recombination (Figure 1) As in the case oflsquo3L09rsquo this pattern of negative correlation between GRR sizeand recombination rate was not observed for some regions
3560 Nucleic Acids Research 2004 Vol 32 No 12
Comparisons of consensus physical and genetic linkagemaps showed that the ratio of physical to genetic distance(kbcM) varied as much as 140-fold among GRRs ThekbcM estimate ranged from 151 for lsquo1S08rsquo to 21687 forlsquo7S02rsquo with an average of 3381 (Figure 1 and Table 1) Inmost cases recombination rate was higher for GRRs with a
higher gene density although there were some exceptions Forexample gene density was relatively high in the GRR lsquo1S04rsquo(1 gene per 273 kb) but only 3 of the armrsquos recombination wasobserved in this region (Table 1) Similarly lsquo5S09rsquo region isrelatively low in gene density (1 gene per 2688 kb) but 60 ofthe armrsquos recombination occurred in this region
Nucleic Acids Research 2004 Vol 32 No 12 3561
Figure 1 (Group 1 to 7) Distribution of genes and recombination on wheat chromosomes Sizes of consensus chromosomes location and sizes of GRRs are drawn toscale based on the average size of the three homoeologous chromosomes for each homoeologous group (54) Names of the GRRs are given on the left side of aconsensus chromosome In the nomenclature of GRRs (eg lsquo1S08rsquo) the first digit represents wheat homoeologous group followed by the arm location either as shortarm (S) or long arm (L) The last two numeral numbers represent GRR location as fraction length (FL) of the chromosome (eg 08 for lsquo1S08rsquo) The flanking deletionlines for each GRR are shown in blue on the left side of a consensus physical chromosome Actual physical size (black) and the ratio of physical to genetic distance(red) for a region are given on the right hand side of a consensus chromosome Sizes (in Mb) of GRRs are calculated based on the cytological measurements(measurements of the region bracketed by the flanking deletion line breakpoints in comparison to the total chromosome size) and are drawn to scale Recombinationin a chromosomal region is calculated by comparing deletion line based physical map with the consensus genetic linkage map for each chromosome Flankingmarkers for each GRR are joined with dotted lines connecting physical and consensus genetic linkage maps On the consensus genetic linkage maps the genes forwhich exact location in reference to other markers was known are shown in red and the genesQTLs for which the location was imprecise are shown in green
fraction length for satellite F region not precisely marked by deletion lines C markers which were not flanked by the flanking deletion lines for the GRR butprobably are part of that region
3562 Nucleic Acids Research 2004 Vol 32 No 12
DISCUSSION
Gene-containing regions of wheat
The number of genes in most of the higher plants is expected tobe similar although variations due to ploidy changes areexpected The in silico approach based gene number estimatefor Arabidopsis is 25 000 and for rice ranges from 32 000 to50 000 (813) Accounting for polyploidy the correspondingnumber for wheat may be between 75 000 and 150 000 Usingthe average gene size of 25 kb that is found in rice only 12ndash24 (188ndash375 Mb) of the wheat genome is therefore expectedto contain genes The predicted number of genes in thesequenced eukaryotes dropped 2- to 3-fold with the availabil-ity of better computational and biological tools The humangenome once thought to have more than 100 000 genes con-tains 30 000 genes based on new stringent criteria andimproved gene-prediction programs Similarly the gene-con-taining fraction of the wheat genome may even be smaller thanthe above predictions Therefore precise localization anddemarcation of the gene-containing regions is particularlyimportant for wheat
Use of deletion lines to reveal the physical location of genemarkers and the approach to combine the mapping data of thethree homoeologs to generate a consensus map have beenshown previously (91026) Relative gene marker locationwas conserved among the three homoeologs even at the cur-rent density (Supplementary Figures AndashG) It was thereforepossible to construct consensus maps for the seven homoeo-logous groups The consensus maps had an average of 48 dele-tion breakpoints per chromosome group with a range from 40for group 3 to 58 for group 7 Based on the average chromo-some size of the homoeologs deletion breakpoints occurredevery 133 Mb for group 7 to 204 Mb for group 3 The break-points were two times more frequent around the GRRs thanrandomly expected once every 8 Mb Of the 334 deletions210 (63) occurred in the GRRs that encompassed 29 ofthe wheat genome (Table 1)
The distribution of genes on wheat chromosomes is strikingWheat chromosomes have regions of high gene density inter-spersed by vast expanses of unpopulated regions consisting ofrepeated DNA Based on the sample of 3025 gene loci 29 ofthe wheat genome contained 94 of the genes (Figure 1) Of the48 GRRs that were identified 18 were major spanning 11 ofthe genome but accounted for 60 of the genes All majorGRRs were present in the distal 35 of the chromosomes Thelong arms of wheat contained twice as many genes as the shortarms Of the total 94 genes present in GRRs 59 were presentin the 27 GRRs on the long arm and remaining in the 21 GRRs onthe short arms No significant correlation was observed betweenthe chromosome size and the gene fraction or the size of theGRRs For example group 3 has the largest chromosomesamong the wheat groups but contained only 13 of thewheat genes compared with group 5 chromosomes that con-tained 20 Roughly the gene fraction seemed to correlatewith the size of the GRRs The size of chromosomes encom-passing the GRRs is the largest for group 5 and the smallest forgroup 6 Correspondingly the gene fraction was the highest forgroup 5 and the lowest for group 6
The actual size of the GRRs may be smaller than that shownin Figure 1 because the accuracy of bracketing the GRRsis dependent upon the number of deletion breakpoints If
randomly occurring breakpoints of the 334 deletion linesare expected to occur every 16 Mb on the consensus physicalmap As mentioned earlier frequency of these chromosomalbreaks was about double in the GRRs Even with that fre-quency GRRs interspersed by lt8 Mb of gene-poor DNAwill not be resolved
As observed in wheat distribution of genes is uneven inother grass species as well In rice 20 of the genome hasnot been contigedsequenced in spite of extensive efforts (8)The unsequenced part of the genome is probably gene-poorAbout 21 of the sequenced portion of the rice genomecontains 40 of the genes (44) Translocation breakpoint-based physical maps showed that barley chromosomes arealso partitioned into gene-rich and gene-poor regions (45)Similarly in the smaller genome plant Arabidopsis genesare unevenly distributed on the chromosomes About 45of the genome accounts for about 25 000 genes with an averagegene size of 2 kb
Based on the expected size of the gene-containing fractiononly a small part of the currently demarcated GRRs is allegedto contain genes Assuming that the wheat genes may encom-pass only 188ndash375 Mb (12ndash24) of the genome the gene-containing fraction within the GRRs is predicted to be only12ndash24 The exact distribution of genes in the GRRs is notknown but preliminary results suggest that the GRRs mayfurther be partitioned into mini gene-rich and gene-poor com-partments Within the GRRs the estimated 75 000 to 150 000wheat genes are expected to occur every 10ndash20 kb Except forploidy differences the wheat and the barley genomes are verysimilar in gene synteny and composition An 11 Mbsequence for selected wheat and barley regions showed thatgene density within the GRRs may range from a gene every4ndash103 kb with an average of 10ndash20 kb (46ndash49) The size of thelsquogene-emptyrsquo blocks interspersed in these regions ranged from08 to 94 kb The largest contig among these wheat and barleyregions is 261 kb around the Mla locus (49) A 130 kb region inthe contig contained 23 genes with an average gene density ofa gene per 56 kb Size of the interspersing lsquogene-emptyrsquoregions ranged from a few hundred base pairs to 11 kbThe second region of high gene density was 40 kb longand contained 10 genes (a gene every 4 kb) The largestlsquogene-emptyrsquo region was 55 kb Another 60 kb barley contigspanned a 32 kb region around the bronze locus with a geneevery 32 kb (34) Very similar observations were made inother large genome grasses such as Triticum monococcumAegilops tauschii and maize (475051)
Localization of the gene containing regions of wheat isbased on studying gene distribution of 3025 gene loci bythree different methods (Table 2) Gene distribution by dele-tion-line-based physical mapping was very similar to thatrevealed by the comparative analysis between physical andconsensus genetic linkage maps Similarly distribution ofgene markers was comparable to that of phenotypically char-acterized genes Therefore we believe that the demarcationand distribution of genes given in Figure 1 is a good repres-entation of the wheat genome Since the current analysis wasbased on the study of 39ndash78 of the wheat genes relativenumbers among various GRRs may slightly vary with theanalysis of additional genes Considering the diversity andrandomness of the analyzed gene markers the size relativegene density and gene proportion are however not expected
Nucleic Acids Research 2004 Vol 32 No 12 3563
to change dramatically A probable exception might bemulticopy gene families that were not represented in thisstudy because of the technical difficulties The currentinterpretations will not hold true for the multicopy genes iftheir distribution is dramatically different from that of thesingle-copy genes
The presence of 6 of the genes in the gene-poor regionssuggests that additional yet smaller GRRs may exist that werenot identified during the current analysis Some genes wereobserved in the highly heterochromatic gene-poor regionsTwo cDNA clones mapped in the centromeric region ofwheat homoelogous group 1 chromosomes that is highly het-erochromatic and gene-poor Other such examples are genemarkers Xbcd1124 Xcdo1340 and Xpsr596 on chromosome1B Xpsr107 XunlBF483292 Xabg356 and Xbcd260 on group2 Xtam12 Xcdo681 Xbcd1278 Xbcd102 XksuI32 XksuF34Xksu609 Xcdo920 and Xwg222 on group 3 and Xbcd1092Xbcd734 Xcdo1337 and Xbcd1262 on group 4
Distribution of recombination
Recombination is highly uneven along the wheat chromo-somes (Figure 1) Recombination mainly occurred in the48 GRRs that accounted for 95 of the recombinationMore than 100-fold differences were however observed forthe rate of recombination among various GRRs A part of thisdifference seemed to be due to the suppression effect of cen-tromere on recombination Essentially no recombination wasobserved in the proximal 30 of the wheat chromosomesin spite of the presence of GRRs In group 7 chromosomeseg genetic distance between the GRRs lsquo7S02rsquo andlsquo7L08rsquo is only 7 cM The spanned region is gt50 of thechromosome and extended over three GRRs Most of thehighly recombinogenic GRRs were localized in the distalparts of the chromosomes but not all distal GRRs were highlyrecombinogenic Genetic distances spanned by lsquo2L08rsquo andlsquo6L07rsquo GRRs were lt5 cM
Recombination distribution within the GRRs is not knownbut the available data suggest that recombination is highlyasymmetrical even within the highly recombinogenicGRRs Analysis of a 1 Mb region of barley homoeologousto one of the most recombinogenic region of wheat (lsquo1S08rsquo)identified a 240 kb region spanning the Mla locus where norecombination was observed (32) Recombination differencesup to 10-fold were observed among different sectors of theremaining part of the region Similar observations have alsobeen made in other eukaryotes Distribution of recombinationhas been best studied on yeast chromosomes Measured at 1 kbresolution the average frequency of recombination was035 cMkb with a range of 0ndash2 cMkb (httpwwwyeast-genomeorg) Measured at a 150 kb interval recombinationwithin a 1 Mb region of rice ranged from 0 to 15cM eventhough the gene distribution was fairly even (44) (httprgpdnaaffrcgojpPublicdatahtml) The average frequencyof recombination in rice is 0003 cMkb with a range of0ndash006 cMkb (httprgpdnaaffrcgojpPublicdatahtml)Similarly in wheat at a resolution of 7 Mb the averagerecombination frequency was 00003 cMkb with a rangefrom 0 to 0007 cMkb Non-recombinogenic regions havebeen observed in yeast as well as in rice but the highestrate of recombination for a region appears to be 35-fold
less in rice It may be because the rice estimates were at150 kb resolution whereas the recombination hotspotsmay be much smaller in length In yeast there is a majorhotspot around PHO8 gene located on the distal end of chro-mosome IV where recombination is 2 cMkb (httpwwwyeastgenomeorg) A 194 bp region around the waxy(wx) locus of rice has a recombination rate of 006 cMkb thatis 20-fold higher than the genome average (52) Similarly a377 bp region of the maize genome has a recombination rate of002 cMkb that is about 30 times higher than the genomeaverage (3553)
SUPPLEMENTARY MATERIAL
Supplementary Material is available at NAR Online
ACKNOWLEDGEMENTS
A contribution of the Agriculture Research Center WashingtonState University Pullman WA Journal series No 0902-03This research project was supported by the US Department ofAgriculture-National Research Initiative (USDA-NRI) and theWSU Vogel Endowment Funds
REFERENCES
1 SearsER (1954) The aneuploids of common wheat Research Bulletin572 University of Missouri Agricultural Experiment Station pp 1ndash58
2 ArumuganathanK and EarleED (1991) Estimation of nuclear DNAcontent of plants by flow cytometry Plant Mol Biol Rep 9 229ndash241
3 FlavellRB BennettMD SmithJB and SmithDB (1974) Genomesize and the proportion of repeated nucleotide sequence DNA in plantsBiochem Genet 12 257ndash269
4 SandhuD and GillKS (2002) Gene-containing regions of wheat and theother grass genomes Plant Physiol 128 803ndash811
5 SidhuD and GillKS (2004) Distribution of genes and recombination inwheat and other eukaryotes Plant Cell Tissue Organ Cult in press
6 ClaytonWD (1981) Evolution and distribution of grassesAnn Missouri Bot Gard 69 5ndash14
7 KelloggE (1998) Relationships of cereal crops and other grassesProc Natl Acad Sci USA 95 2005ndash2010
8 GoffSA RickeD LanTH PrestingG WangR DunnMGlazebrookJ SessionsA OellerP VarmaH et al (2002) A draftsequence of the rice genome (Oryza sativa L ssp japonica) Science 29692ndash100
9 GillKS GillBS EndoTR and BoykoE (1996) Identification andhigh-density mapping of gene-rich regions in chromosome group 5of wheat Genetics 143 1001ndash1012
10 SandhuD ChampouxJA BondarevaSN and GillKS (2001)Identification and physical localization of useful genes and markers to amajor gene-rich region on wheat group 1S chromosomes Genetics 1571735ndash1747
11 AkhunovED GoodyearAW GengS QiLL EchalierB GillBSMiftahudin GustafsonJP LazoG ChaoS et al (2003) Theorganization and rate of evolution of wheat genomes are correlatedwith recombination rates along chromosome arms Genome Res13 753ndash763
12 BarakatACarelsN and BernardiG (1997) The distribution of genes inthe genome of Gramineae Proc Natl Acad Sci USA 94 6857ndash6861
13 TAGI (2000) Analysis of the genome sequence of the floweringplant Arabidopsis thaliana Nature 408 796ndash815
14 BarakatA HanDT BenslimaneA RodeA and BernardiG (1999)The gene distribution in the genomes of pea tomato and date palmFEBS Lett 463 139ndash142
3564 Nucleic Acids Research 2004 Vol 32 No 12
15 SumnerAT TorreJDL and StuppiaL (1993) The distribution ofgenes on chromosomes A cytological approach J Mol Evol 37117ndash122
16 ClayO and BernardiG (2001) The isochores in human chromosome 21and 22 Biochem Biophys Res Commun 285 855ndash856
17 JabbariK and BernardiG (2000) The distribution of genes in drosophilagenome Gene 18 1859ndash1867
18 LanderES LintonLM BirrenB NusbaumC ZodyMCBaldwinJ DevonK DewarK DoyleM FitzHughW et al (2001)Initial sequencing and analysis of the human genome Nature 409860ndash921
19 McPhersonJD MarraM HillierL WaterstonRH ChinwallaAWallisJ SekhonM WylieK MardisER WilsonRK et al (2001)A physical map of the human genome Nature 409 934ndash941
20 VenterJC AdamsMD MyersEW LiPW MuralRJSuttonGG SmithHO YandellM EvansCA HoltRA et al(2001) The sequence of the human genome Science 291 1304ndash1351
21 GillKS GillBS EndoTR and TaylorT (1996) Identificationand high-density mapping of gene-rich regions in chromosome group 1of wheat Genetics 144 1883ndash1891
22 SandhuD and GillKS (2002) Structural and functional organization ofthe lsquo1S08 gene-rich regionrsquo in the Triticeae Plant Mol Biol 48791ndash804
23 DvorakJ and ChenK-C (1984) Distribution of nonstructural variationbetween wheat cultivars along chromosome arm 6Bp evidence from thelinkage map and physical map of the arm Genetics 106 325ndash333
24 CurtisCA and LukaszewskiAJ (1991) Genetic linkage betweenC-bands and storage protein genes in chromosome 1B of tetraploid wheatTheor Appl Genet 81 245ndash252
25 WernerJE KotaRS and GillBS (1992) Distribution of telomericrepeats and their role in the healing of broken chromosome ends in wheatGenome 35 844ndash848
26 GillKS GillBS and EndoTR (1993) A chromosome region-specificmapping strategy reveals gene-rich telometric ends in wheatChromosoma 102 374ndash381
27 KotaRS GillKS GillBS and EndoTR (1993) A cytogeneticallybased physical map of chromosome 1B in common wheat Genome36 548ndash554
28 FarisJD HaenKM and GillBS (2000) Saturation mapping of agene-rich recombination hot spot region in wheat Genetics 154823ndash835
29 WengY TuleenNA and HartGE (2000) Extended physical maps anda consensus physical map of the homoeologous group-6 chromosomesof wheat (Triticum aestivum L em Thell) Theor Appl Genet 100519ndash527
30 TanksleySD GanalMW PrinceJP de VicenteMCBonierbaleMW BrounP FultonTM GiovannoniJJ GrandilloSMartinGB et al (1992) High density molecular linkage maps of thetomato and potato genomes Genetics 132 1141ndash1160
31 PuechbertyJ LaurentAM GimenezS BillaultA LaurentMEBCalendaA MarcaisB PradesC LoannouP YurovY et al (1999)Genetic and physical analyses of the centromeric and pericentromericregions of human chromosome 5 Recombination across 5cen Genomics56 274ndash287
32 WeiF Gobelman-WernerK MorrollSM KurthJ MaoLWingRA LeisterD Schulze-LefertP and WiseRP (1999)The Mla (powdery mildew) resistance cluster is associated withthree NBS-LRR gene families and suppressed recombination withina 240-kb DNA interval on chromosome 5S (1HS) of barley Genetics153 1929ndash1948
33 FeuilletC and KellerB (2002) Comparative genomics in the grassfamily molecular characterization of grass genome structure andevolution Ann Bot (Lond) 89 3ndash10
34 FuH ZhengZ and DoonerHK (2002) Recombination rates betweenadjacent genic and retrotransposon regions in maize vary by 2 ordersof magnitude Proc Natl Acad Sci USA 99 1082ndash1087
35 YaoH ZhouQ LiJ SmithH YandeauM NikolauBJ andSchnablePS (2002) Molecular characterization of meiotic
recombination across the 140-kb multigenic a1-sh2 interval of maizeProc Natl Acad Sci USA 99 6157ndash6162
36 AdamsMD CelnikerSE HoltRA EvansCA GocayneJDAmanatidesPG SchererSE LiPW HoskinsRA GalleRF et al(2000) The genome sequence of Drosophila melanogaster Science 2872185ndash2195
37 BoykoEV GillKS Mickelson-YoungL NasudaS RouppWJZiegleJN SinghS HassawiDS FritzAK NamuthD et al(1999) A high-density genetic linkage map of Aegilops tauschiithe D-genome progenitor of bread wheat Theor Appl Genet 9916ndash26
38 EndoTR (1982) Gametocidal chromosomes of three Aegilops speciesin common wheat Can J Genet Cytol 24 201ndash206
39 EndoTR MukaiY YamamotoM and GillBS (1991) Physicalmapping of a male-fertility gene of common wheat Jpn J Genet66 291ndash295
40 EndoTR and GillBS (1996) The deletion stocks of common wheatJ Hered 87 295ndash307
41 AndersonJA OgiharaY SorrellsME and TanksleySD (1992)Development of a chromosomal arm map for wheat based on RFLPmarkers Theor Appl Genet 83 1035ndash1043
42 SandhuD SidhuD and GillKS (2002) Identification of expressedsequence markers for a major gene-rich region of wheat chromosomegroup 1 using RNA fingerprinting-differential display Crop Sci 421285ndash1290
43 DilbirligiM EraymanM SandhuD SidhuD and GillKS (2004)Identification of wheat chromosomal regions containing expressedresistance genes Genetics 166 461ndash481
44 WuJ MaeharaT ShimokawaT YamamotoS HaradaCTakazakiY OnoN MukaiY KoikeK YazakiJ et al (2002) Acomprehensive rice transcript map containing 6591 expressed sequencetag sites Plant Cell 14 525ndash535
45 KunzelG KorzumL and MeisterA (2000) Cytologically integratedphysical restriction fragment length polymorphism maps for thebarley genome based on translocation breakpoints Genetics 154397ndash412
46 ShirasuK SchulmanAH LahayeT and Schulze-LefertP (2000) Acontiguous 66-kb barley DNA sequence provides evidence for reversiblegenome expansion Genome Res 10 908ndash915
47 WickerT SteinN AlbarL FeuilletC SchlagenhaufE and KellerB(2001) Analysis of a contiguous 211 kb sequence in diploid wheat(Triticum monococcum L) reveals multiple mechanisms of genomeevolution Plant J 26 307ndash316
48 BrueggemanR RostoksN KudrnaD KilianA HanF ChenJDrukaA SteffensonB and KleinhofsA (2002) The barley stem rust-resistance gene Rpg1 is a novel disease-resistance gene with homology toreceptor kinases Proc Natl Acad Sci USA 99 9328ndash9333
49 WeiF WingRA and WiseRP (2002) Genome dynamics andevolution of the Mla (powdery mildew) resistance locus in barley PlantCell 14 1903ndash1917
50 FeuilletC and KellerB (1999) High gene density is conserved atsyntenic loci of small and large grass genomes Proc Natl Acad SciUSA 96 8265ndash8270
51 TikhonovAP SanMiguelPJ NakajimaY GorensteinNMBennetzenJL and AvramovaZ (1999) Colinearity and its exceptions inorthologous adh regions of maize and sorghum Proc Natl Acad SciUSA 96 7409ndash7414
52 InukaiT SakoA HiranoHY and SanoY (2000) Analysis ofintragenic recombination at wx in rice Correlation between the molecularand genetic maps within the locus Genome 43 589ndash596
53 CivardiL XiaY EdwardsKJ SchnablePS and NikolauBJ (1994)The relationship between genetic and physical distances in thecloned a1-sh2 interval of the Zea mays L genome Proc Natl Acad SciUSA 91 8268ndash8272
54 GillBS FriebeB and EndoTR (1991) Standard karyotype andnomenclature system for description of chromosome bands andstructural aberrations in wheat (Triticum aestivum) Genome 34830ndash839
Nucleic Acids Research 2004 Vol 32 No 12 3565
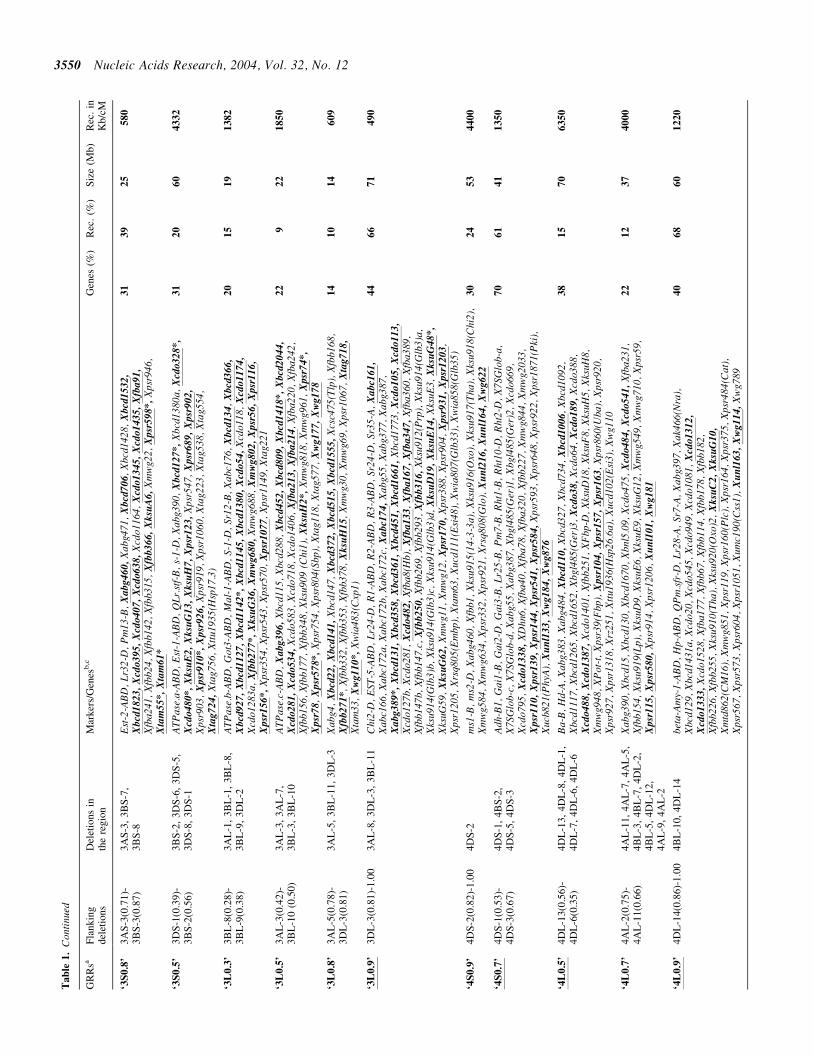
Ta
ble
1
Con
tinu
ed
GR
Rsa
Fla
nk
ing
del
etio
ns
Del
etio
ns
inth
ere
gio
nM
arker
sG
enes
bc
Gen
es(
)R
ec
()
Siz
e(M
b)
Rec
in
Kb
cM
lsquo3S
08
rsquo3
AS
-3(0
71
)-3
BS
-3(0
87
)3
AS
-3
3B
S-7
3
BS
-8E
st-2
-AB
D
Lr3
2-D
P
m13
-B
Xab
g4
60
X
abg4
71
Xb
cd7
06
Xbc
d142
8X
bcd
15
32
X
bcd
18
23
X
cdo
39
5
Xcd
o4
07
X
cdo6
38
X
cdo1
164
Xcd
o1
34
5
Xcd
o1
43
5
Xfb
a9
1
Xfb
a241
X
fbb2
4X
fbb1
42
Xfb
b315
X
fbb
36
6
Xk
suA
6
Xm
wg2
2X
psr
59
8
X
psr9
46
Xta
m5
5
Xta
m6
1
31
39
25
58
0
lsquo3S
05
rsquo3
DS
-1(0
39
)-3
BS
-2(0
56
)3
BS
-2
3D
S-6
3
DS
-5
3D
S-8
3
DS
-1A
TP
ase
a-A
BD
E
st-1
-AB
D
QL
rst
f-B
s-
1-D
X
abg3
90
Xb
cd1
27
X
bcd1
380a
X
cdo3
28
Xcd
o4
80
X
ksu
E2
X
ksu
G1
3
Xksu
H7
X
psr
12
3
Xps
r547
X
psr
68
9
Xpsr
90
2
Xps
r903
X
psr
91
0
X
psr
92
6
Xps
r919
X
psr1
060
Xta
g223
X
tag5
38
Xta
g554
X
tag
72
4
Xta
g756
X
ttu1
935(
Hsp
173
)
31
20
60
43
32
lsquo3L
03
rsquo3
BL
-8(0
28
)-3
BL
-9(0
38
)3
AL
-1
3B
L-1
3
BL
-8
3B
L-9
3
DL
-2A
TP
ase
b-A
BD
G
ot3-
AB
D
Mal
-1-A
BD
S-
1-D
Sr
12-B
X
abc1
76
Xb
cd1
34
Xbcd
36
6
Xb
cd9
27
Xb
cd1
127
X
bcd
11
42
Xbcd
11
45
X
bcd
13
80
X
cdo
54
X
cdo1
18
Xcd
o1
174
X
cdo1
283a
X
fbb2
77
Xksu
G3
6
Xm
wg
68
0
Xm
wg6
88
Xm
wg
802
X
psr
56
X
psr
11
6
Xp
sr1
56
X
psr3
54
Xps
r543
X
psr5
70
Xp
sr1
077
Xps
r114
9X
tag2
21
20
15
19
13
82
lsquo3L
05
rsquo3
AL
-3(0
42
)-3
BL
-10
(05
0)
3A
L-3
3
AL
-7
3B
L-3
3
BL
-10
AT
Pas
ec-
AB
D
Xab
g3
96
X
bcd1
15
Xbc
d288
X
bcd
45
2
Xb
cd8
09
Xbcd
14
18
Xbcd
20
44
X
cdo
28
1
Xcd
o5
34
Xcd
o583
X
cdo7
18
Xcd
o140
6X
fba
21
3
Xfb
a2
14
Xfb
a220
X
fba2
42
Xfb
b156
X
fbb1
77
Xfb
b348
X
ksu9
09(C
hi1)
X
ksu
H2
Xm
wg8
18
Xm
wg9
61
Xpsr
74
Xp
sr7
8
Xp
sr5
78
X
psr7
54
Xps
r804
(Sbp
)X
tag1
18
Xta
g577
X
wg
17
7
Xw
g1
78
22
92
21
85
0
lsquo3L
08
rsquo3
AL
-5(0
78
)-3
DL
-3(0
81
)3
AL
-5
3B
L-1
1
3D
L-3
Xab
g4
Xbcd
22
X
bcd
14
1
Xbc
d147
X
bcd
37
2
Xb
cd5
15
Xb
cd1
555
X
csc4
75(T
lp)
Xfb
b168
X
fbb
27
1
Xfb
b332
X
fbb3
53
Xfb
b378
X
ksu
H1
5
Xm
wg3
0X
mw
g69
Xps
r106
7X
tag
71
8
Xta
m33
X
wg
11
0
X
wia
483(
Cxp
1)
14
10
14
60
9
lsquo3L
09
rsquo3
DL
-3(0
81
)-1
00
3A
L-8
3
DL
-3
3B
L-1
1C
hi2-
D
EST
-5-A
BD
L
r24-
D
R1-
AB
D
R2-
AB
D
R3-
AB
D
Sr24
-D
Sr35
-A
Xa
bc1
61
Xab
c166
X
abc1
72a
Xab
c172
bX
abc1
72c
Xa
bc1
74
X
abg5
5X
abg3
77
Xab
g387
X
ab
g3
89
Xb
cd1
31
Xb
cd3
58
Xbcd
36
1
Xbcd
45
1
Xb
cd1
661
X
bcd1
773
Xcd
o1
05
X
cdo
11
3
Xcd
o127
bX
cdo2
81
Xcd
o4
82
Xfb
a8(H
b)
Xfb
a1
33
Xfb
a1
67
X
fba3
47
X
fba3
60
Xfb
a389
X
fbb1
47b
Xfb
b147
c
Xfb
b2
50
Xfb
b269
X
fbb2
93
Xfb
b3
16
Xks
u912
(Prp
)X
ksu9
14(G
lb3)
aX
ksu9
14(G
lb3)
bX
ksu9
14(G
lb3)
cX
ksu9
14(G
lb3)
dX
ksu
D1
9
Xksu
E1
4
Xks
uE3
Xksu
G4
8
X
ksuG
59
Xk
suG
62
X
mw
g11
Xm
wg1
2X
psr
17
0
Xps
r388
X
psr9
04
Xpsr
93
1
Xpsr
12
03
Xps
r120
5X
rsq8
05(E
mbp
)X
tam
63
Xuc
d111
(Esi
48)
Xw
ia80
7(G
lb33
)X
wia
858(
Glb
35)
44
66
71
49
0
lsquo4S
09
rsquo4
DS
-2(0
82
)-1
00
4D
S-2
ms1
-B
ms2
-D
Xab
g460
X
fbb1
X
ksu9
15(1
4-3-
3a)
Xks
u916
(Oxo
)X
ksu9
17(T
ha)
Xks
u918
(Chi
2)
Xm
wg5
84
Xm
wg6
34
Xps
r332
X
psr9
21
Xrs
q808
(Glo
)X
un
l216
X
un
l164
X
wg
62
23
02
45
34
40
0
lsquo4S
07
rsquo4
DS
-1(0
53
)-4
DS
-3(0
67
)4
DS
-1
4B
S-2
4
DS
-5
4D
S-3
Adh
-B1
Gai
1-B
G
ai2-
D
Gai
3-B
L
r25-
B
Pm
7-B
R
ht1-
B
Rht
10-D
R
ht2-
D
X7S
Glo
b-a
X7S
Glo
b-c
X7S
Glo
b-d
Xab
g55
Xab
g387
X
bgl4
85(G
er)1
X
bgl4
85(G
er)2
X
cdo6
69
Xcd
o795
X
cdo1
33
8
XD
hn6
Xfb
a40
Xfb
a78
Xfb
a320
X
fbb2
27
Xm
wg8
44
Xm
wg2
033
Xp
sr1
10
Xp
sr1
39
Xp
sr1
44
Xp
sr5
41
Xp
sr5
84
Xps
r593
X
psr6
48
Xps
r922
X
psr1
871(
Pki
)X
ucb8
21(P
hyA
)X
un
l133
X
wg
18
4
Xw
g87
6
70
61
41
13
50
lsquo4L
05
rsquo4
DL
-13(0
56
)-4
DL
-6(0
35
)4
DL
-13
4D
L-8
4
DL
-1
4D
L-7
4
DL
-6
4D
L-6
Ba-
B
Hd-
A
Xab
g383
X
abg4
84
Xbcd
11
0
Xbc
d327
X
bcd7
34
Xb
cd1
006
Xbc
d109
2X
bcd1
117
Xbc
d126
5X
bcd1
652
Xbg
l485
(Ger
)3
Xcd
o3
8
Xcd
o64
Xcd
o1
89
X
cdo3
88
Xcd
o4
88
Xcd
o1
387
X
cdo1
401
Xfb
b251
X
Fbp
-D
Xks
uD18
X
ksuF
8X
ksuH
5X
ksuH
8X
mw
g948
X
Pot
-t
Xps
r39(
Fbp
)X
psr
10
4
Xp
sr1
57
Xp
sr1
63
Xps
r860
(Uba
)X
psr9
20
Xps
r927
X
psr1
318
Xrz
251
Xtt
u193
6(H
sp26
6a)
X
ucd1
02(E
si3)
X
wg1
10
38
15
70
63
50
lsquo4L
07
rsquo4
AL
-2(0
75
)-4
AL
-11(0
66
)4
AL
-11
4A
L-7
4
AL
-5
4B
L-3
4
BL
-7
4D
L-2
4
BL
-5
4D
L-1
2
4A
L-9
4
AL
-2
Xab
g390
X
bcd
15
Xbc
d130
X
bcd1
670
Xbn
l50
9X
cdo4
75
Xcd
o4
84
X
cdo5
41
X
fba2
31
Xfb
b154
X
ksu9
19(L
p)
Xks
uD9
Xks
uE6
Xks
uE9
Xks
uG12
X
mw
g549
X
mw
g710
X
psr5
9X
psr
11
5
Xp
sr5
80
Xps
r914
X
psr1
206
Xu
nl1
01
X
wg
18
1
22
12
37
40
00
lsquo4L
09
rsquo4
DL
-14(0
86
)-1
00
4B
L-1
0
4D
L-1
4be
ta-A
my-
1-A
BD
H
p-A
BD
Q
Pm
sfr
-D
Lr2
8-A
Sr
7-A
X
abg3
97
Xak
466(
Nra
)X
bcd1
29
Xbc
d143
1a
Xcd
o20
Xcd
o545
X
cdo9
49
Xcd
o108
1X
cdo1
31
2
Xcd
o1
333
X
cdo1
528
Xfb
a177
X
fbb6
7X
fbb1
14
Xfb
b178
X
fbb1
82
Xfb
b226
X
fbb2
55
Xks
u910
(Tha
)X
ksu9
20(O
xo)2
X
ksu
C2
X
ksu
G1
0
Xm
td86
2(C
M16
)X
mw
g851
X
psr1
19
Xps
r160
(Plc
)X
psr1
64
Xps
r375
X
psr4
84(C
at)
Xps
r567
X
psr5
73
Xps
r604
X
psr1
051
Xum
c190
(Css
1)
Xu
nl1
63
X
wg
11
4
Xw
g789
40
68
60
12
20
3550 Nucleic Acids Research 2004 Vol 32 No 12
Tab
le1
C
onti
nued
GR
Rsa
Fla
nk
ing
del
etio
ns
Del
etio
ns
inth
ere
gio
nM
arker
sG
enes
bc
Gen
es(
)R
ec
()
Siz
e(M
b)
Rec
in
Kb
cM
lsquo5S
09
rsquo5
AS
-6(0
97
)-5
BS
-6(0
81
)5
AS
-6
5B
S-6
Gsp
-AB
D
Ha-
D
Xa
bg
479
X
ab
g7
05
Xbcd
87
3
Xcd
o959
X
fba1
14
X
fba
36
7
Xfb
b1
21
X
fbb
27
6
Xfb
b277
X
mw
g8
35
X
psr
17
0
Xps
r618
X
psr2
152b
X
tag
31
7
Xw
g687
29
60
43
23
89
lsquo5S
07
rsquo5
AS
-3(0
75
)-5
DS
-5(0
67
)5
AS
-3
5D
S-5
No
r-A
P
m2-
D
Xb
cd1
871
X
cdo
68
7
Xcd
o7
49
X
fba1
31
Xfb
a2
32
X
fba
34
2
Xfb
a352
X
fba3
93
X
ksu9
22(T
ha)
X
psr
32
6
Xpsr
62
8
Xpsr
94
0a
X
psr
94
0b
X
psr
94
5
Xta
g31
9
Xta
g62
9
Xta
m5
3a
Xta
m5
3b
Xu
bp
3
Xu
bp
5
Xuc
w14
1
39
28
21
30
00
lsquo5S
06
rsquo5
BS
-8(0
56
)-5
BS
-4(0
43
)5
BS
-8
5D
S-1
5
BS
-4X
bcd
11
30
X
cdo3
44
X
cdo
45
9a
X
cdo
45
9b
X
cdo6
77
a
Xcd
o6
77
b
Xcd
o1
33
5
Xk
suI2
6
Xpsr
11
8
Xp
sr9
29
Xp
sr1
204
X
rg4
63
Xrg
90
1
Xta
m5
42
45
19
63
33
lsquo5S
04
rsquo
5A
S-1
(04
0)-
04
5
5B
S-9
5
BS
-2
5B
S-3
5
AS
-1M
s3-A
X
ksu
G60
X
ksu
H8
Xpsr
11
8
Xpsr
90
3
Xps
r946
X
wg
34
1
Xw
g3
63
14
31
34
33
3
lsquo5L
03
rsquo5
BL
-6(0
26
)-5
DL
-10(0
35
)5
BL
-6
5B
L-2
5
BL
-15
5
BL
-7
5D
L-1
0
5A
L-1
9A
dh-1
-AB
D
Xab
c164
X
bcd
15
7
Xbcd
20
4
Xbcd
50
8b
Xb
cd1
087
Xcd
o785
X
cdo1
04
9
Xfb
a137
X
fbb2
38
Xksu
26
Xksu
D1
6
Xksu
D3
0
X
ksu
D4
2
Xksu
G4
4a
X
ksu
M2
Xm
wg5
61
Xps
r109
X
psr
12
0a
X
psr
12
8
Xps
r335
X
psr3
60
Xps
r574
X
psr8
60(U
ba)
Xps
r906
X
psr1
327
Xta
g22
2
Xuc
w12
7X
wg
41
9
Xw
g56
4
Xw
g90
9
10
84
54
09
1
lsquo5L
05
rsquo5
DL
-12(0
48
)-5
DL
-1(0
60
)5
BL
-1
5B
L-3
5
BL
-5
5B
L-1
1
5D
L-1
2
5D
L-1
Crr
K
r1
Lr1
8P
h1
-B
Xa
bc1
68
Xa
bc3
02
Xab
c71
7
Xab
g6
9
Xa
bg
314
X
ab
g3
87
X
ab
g4
73
Xbcd
9
X
bcd
21
X
bcd
15
7
X
bcd
30
7a
X
bcd
35
1a
X
bcd
35
1b
X
bcd
50
8
Xbc
d926
X
bcd9
81
Xb
cd1
088
X
bcd1
140
Xbc
d187
4X
bcd
19
49
X
cdo5
7
Xcd
o3
88a
X
cdo4
12
X
cdo5
48
a
Xcd
o7
86
a
Xcd
o7
86b
X
cdo1
09
0
Xcd
o116
8X
cdo
11
92
X
fba1
27
X
fba1
66
Xfb
b1
22a
Xfb
b156
X
ksu
8a
X
ksu
8b
X
ksu
8c
Xk
su24
Xk
su92
3(P
r1b
)X
ksu
G7
Xk
suG
12
X
ksu
G44
b
Xksu
H1
X
ksuM
9X
ksu
P6
X
ksu
Q10
X
ksu
Q24
X
ksu
Q35
X
ksu
Q45
a
X
ksu
Q60
X
ksu
Q6
4
Xksu
Q65
Xksu
S1
X
mb
g3
01
Xm
gb1
Xm
gb1
0
Xm
gb
63
X
mg
b1
74
X
mg
b1
91
X
mg
b3
01
X
mg
b3
41
X
mw
g5
2
Xm
wg
55
2
Xm
wg
58
3
Xm
wg
592
X
mw
g6
04
Xm
wg6
24
Xm
wg
76
8
Xm
wg
914
Xm
wg
923
X
mw
g9
56
a
Xm
wg
95
6b
X
psr
10
0
Xpsr
12
0b
Xps
r492
(Acl
3)
Xps
r637
X
psr8
06(A
cl2)
X
psr9
11
Xps
r912
X
psr1
202
Xta
g61
4
Xta
g6
44
Xu
bp
25
X
ucd1
04(E
si14
)X
un
l4
Xu
nl1
04
X
un
l109
X
un
l113
X
un
l116
X
un
l117
X
un
l119
X
un
l12
1
Xu
nl1
23
X
un
l13
8
Xu
nl1
39
X
un
l14
1
Xu
nl1
52
Xu
nl1
60
Xu
nl1
69
X
un
l191
X
un
l21
3
Xu
nl2
14
X
un
l21
7
Xu
nl2
18
X
un
l22
4
Xw
g3
64
X
wg
53
0
Xw
g56
4
Xw
g8
89
Xw
g102
6
36
20
61
20
33
lsquo5L
08
rsquo5
BL
-14
(07
5)-
5B
L-1
6(0
79
)5
BL
-9
5B
L-1
4
5B
L-1
6
5D
L-5
5
DL
-9d
hn
2-A
BD
F
r1-A
Ib
f-1-
AB
D
hsp1
69b
-A
Mpc
1Q
-A
Qkb
cnl
-5A
bts
n1-B
V
rn1-
A
Vrn
3-D
X
ab
c15
5
Xa
bc3
09
Xa
bg
391
X
bcd1
83
Xbcd
30
7b
Xb
cd4
50
Xb
cd8
81
Xbcd
10
30
X
bcd
12
35
a
Xbcd
14
27
X
cdo
87
X
cdo
34
8
Xcd
o4
00
X
cdo4
57
X
cdo
46
5
Xcd
o4
84
X
cdo5
04
Xcd
o5
48b
X
cdo5
84
X
cdo1
18
9
Xcd
o1
32
6
Xcd
o1
475
X
cdo1
508
Xfb
a6
8
Xfb
a190
X
fba2
09
Xfb
a332
X
fba3
48
X
fba3
51
X
fbb2
6X
fbb
16
6
Xfb
b199
X
fbb2
09
Xfb
b2
37
X
fbb
25
5b
Xfb
b322
X
fbb3
23
Xfb
b328
X
ksu
91
9(L
pX
)X
ksu
92
3(P
r1a
)X
ksu
F1
X
ksu
G1
4
Xksu
G57
Xksu
P1
0
Xk
suP
18
X
ksu
P2
0
Xksu
P2
1
Xk
suP
23
X
ksu
P5
0
Xksu
P6
4
Xk
suQ
13
X
ksu
Q16
X
ksu
Q3
2
Xksu
Q3
4
Xksu
Q4
5b
X
ksu
Q5
8
Xksu
Q5
9
Xksu
Q6
3
Xksu
Q66
X
ksu
Q67
X
mw
g7
2
Xm
wg
76
Xm
wg
51
4
Xm
wg
51
6
Xm
wg
55
0
Xm
wg
60
2
Xm
wg
71
6
Xm
wg
740
X
mw
g8
62
X
mw
g9
00
X
mw
g9
22
X
mw
g9
33
Xps
r14(
alph
a-A
my-
3-A
BD
)X
psr
79
X
psr
11
5
X
psr
13
1
Xp
sr1
45
Xps
r575
X
psr8
19(A
dpg1
-AB
D)
Xps
r918
X
psr9
63
Xps
r119
4X
rsq8
05(E
mpb
-AB
D)
Xrz
32
8
Xrz
39
5
Xrz
57
5
Xrz
58
9
Xrz
74
4
Xta
g69
X
tag
16
5
Xta
g25
1
Xta
g35
4
Xta
g6
21
X
tag
65
1
Xta
g69
5a
X
tag
69
5b
X
un
l137
Xu
nl1
40
X
wg
64
4
Xw
g90
8
36
40
20
30
8
lsquo5L
09
rsquo5
AL
-23(0
87
)-1
00
5A
L-2
3B
1-A
be
ta-A
my-
1-A
L
r1-D
Q
kbc
nl-5
Aa
Rh1
2-A
X
abg3
66
Xbc
d110
3X
bcd
12
35
b
X
bcd1
421
Xbc
d167
0X
cdo2
0X
cdo
21
3
X
cdo3
46
Xcd
o3
88b
X
cdo
13
12
X
cdo1
528
Xfb
b100
X
fbb2
13
Xfb
b249
X
fbb3
30
Xk
suQ
62
X
mw
g211
2X
psr
37
0
Xps
r567
aX
psr5
67b
Xpsr
58
0
Xps
r120
6X
psr1
316
Xta
g69
5
X
tag
75
4
Xw
g11
4
11
29
66
16
50
Nucleic Acids Research 2004 Vol 32 No 12 3551
Ta
ble
1
Con
tinu
ed
GR
Rsa
Fla
nk
ing
del
etio
ns
Del
etio
ns
inth
ere
gio
nM
arker
sG
enes
bc
Gen
es(
)R
ec
()
Siz
e(M
b)
Rec
in
Kb
cM
lsquo6S
10
rsquo6
DS
-6(0
99
)-1
00
6A
S-5
6
BS
-3
6B
S-6
6
BS
-2
6D
S-6
6
DS
-4L
r36-
B
Nor
2-B
Q
Gpc
nds
u-B
Q
Pm
sfr
-B
Sr5-
D
Sr8-
A
Su1-
B
Xab
g387
X
abg4
58
Xab
g466
X
ak46
6(N
ra)
Xbc
d21
Xbc
d342
X
bcd1
821
Xcd
o476
X
cdo1
380
Xcm
wg6
20
Xcm
wg6
52
Xcm
wg6
79a
Xcm
wg6
79b
Xcm
wg
69
0
Xfb
a1
X
fba8
5
Xfb
a1
87
Xfb
a3
44
X
fbb3
54
X
ksuE
3X
ksuF
36
Xks
uF43
X
ksu
G8a
X
ksu
G8b
X
ksu
G48
Xk
suH
4
Xksu
I28
X
ksuM
5X
mw
g59
Xm
wg7
9X
mw
g573
X
mw
g6
52
Xm
wg8
20
Xm
wg8
87
Xm
wg
91
6
Xm
wg
96
6
Xpa
p4
Xpsr
8(C
xP
3)a
X
psr
8(C
xP
3)b
X
psr
10
(Gli
-2)
Xpsr
10
6a
X
psr
14
1b
X
psr1
67
Xpsr
30
1a
X
psr5
46
Xp
sr5
51
Xps
r563
X
psr
62
7
Xps
r662
X
psr8
99
Xps
r904
X
psr
91
6
Xpsr
96
4
Xps
r967
X
rgc6
9X
tag5
37
Xta
g562
X
tag5
82
Xta
g75
2
Xta
m60
X
uta
2(P
sif)
82
89
10
16
4
lsquo6S
05
rsquo6
DS
-2(0
45
)-6
AS
-5(0
65
)6
AS
-4
6A
S-5
6
AS
-1
6B
S-8
6
BS
-5
6B
S-1
6
DS
-4
6D
S-2
Xa
bc1
73
Xcd
o270
X
cdo
53
4
Xcd
o115
8X
fba6
7
Xfb
a1
48
Xfb
a3
99
X
fbb2
31
X
cmw
g653
X
psr
14
1a
X
psr
31
2
Xps
r962
X
tam
31
X
rz4
76
X
uta
1(P
sif)
18
94
16
94
9
lsquo6L
04
rsquo6
BL
-3(0
36
)-6
BL
-4(0
44
)6
AL
-6
6A
L-4
6
AL
-1
6B
L-4
6
BL
-5
6B
L-3
6
DL
-6
6D
L-1
Xa
bc1
63
Xa
bc1
75
X
ab
g2
0
Xab
g379
X
ab
g3
88
X
abg4
74
Xb
cd1
02
Xbc
d758
X
cdo2
9X
cdo
204
Xcd
o497
X
cdo5
07
Xcd
o7
72
X
cdo1
315
Xcd
o142
8X
cmw
g6
53
X
cmw
g6
64
X
fba3
28
X
fba3
67
X
fba
39
7
Xfb
b9
5
Xfb
b2
83
Xfb
b3
64
X
ksuD
17
Xks
uG58
X
ksuM
151
Xm
wg
872
Xm
wg
911
X
mw
g206
1X
psr1
13
Xpsr
14
2
Xp
sr3
71
Xp
sr4
63(P
rk)
Xps
r831
X
psr9
08
Xp
sr9
15
Xrs
q8
05
(Em
bp
)X
tag3
17
Xta
g33
4
Xta
m6
Xta
m9
Xta
m10
X
tam
27
Xta
m31
X
tam
57
Xu
cd1
09
(Esi
35
)X
VA
tp-B
2X
wg2
23
Xw
g93
3
30
21
15
84
7
lsquo6L
07
rsquo6
AL
-1(0
69
)-6
BL
-6(0
76
)6
AL
-1
6A
L-5
6
BL
-9
6B
L-8
6
BL
-14
6
BL
-1
6B
L-6
6
DL
-1
6D
L-1
2
6D
L-7
6
DL
-13
Xa
bg
1
Xfb
b2
15
X
ksuF
24
Xm
wg8
20
Xm
wg
20
29
X
npi2
53
Xps
r149
X
psr
30
1b
X
tag4
95
Xta
m1
7
Xta
m7
4
Xuc
w26
X
wg
28
6
Xw
g341
10
66
01
17
65
lsquo6L
09
rsquo6
AL
-8(0
90
)-1
00
6A
L-8
6
BL
-6
6D
L-1
3A
HV
5D
hn3
Got
2-A
BD
H
t3-D
N
or7-
B
Lr3
-B
Sr11
-B
Sr13
-A
Sr29
-D
WsP
16
Xab
c154
X
abc4
51
Xab
g652
X
bcd
1
Xbc
d269
X
bcd
27
6
Xbc
d880
X
bcd1
510
Xcd
o388
X
cdo5
16
Xcd
o836
X
cdo1
091
Xcm
wg
66
9
Xcm
wg
67
4
Xcm
wg
68
4
Xcm
wg
716
Xcs
b1
12b
(Dh
n5
)X
fba1
X
fba4
2
Xfb
a8
1
Xfb
a1
11
X
fbb
40
X
fbb5
7
Xfb
b5
9
Xfb
b7
0
Xfb
b8
2
Xfb
b1
64
Xfb
b1
69
X
fbb1
70
X
fbb
22
1
Xfb
b3
27
X
ksu
D1
Xks
uD12
X
ksuD
17
Xks
uD27
X
ksuE
14
Xks
uF14
aX
ksuF
14b
Xks
uF19
X
ksuF
37
Xks
uG30
X
ksu
G51
X
ksuM
1X
ksuM
75
Xm
wg
19
Xm
wg
21
X
mw
g7
4a
Xm
wg
74
b
Xm
wg5
13
Xm
wg
514
X
mw
g7
98
X
mw
g813
X
mw
g838
X
mw
g887
X
mw
g897
X
mw
g934
X
mw
g2
053
X
mw
g2
10
0
Xp
sr2
(a-a
my1
)a
Xpsr
2(a
-am
y1)b
X
psr1
06b
Xps
r134
X
psr1
54
Xps
r546
X
psr6
05
Xpsr
90
4
Xpsr
90
8
Xps
r966
X
psr
96
7
Xrg
c74
Xta
g495
X
tag5
20
Xta
g547
X
tag6
80
Xta
g70
5
Xta
g762
X
tam
10
b
Xta
m21
X
tam
26
Xta
m2
8
Xta
m3
6
Xu
cd1
06
(Esi
18
)X
wg
34
1
Xw
g4
05
60
72
45
82
5
lsquo7S
09
rsquo7
AS
-1(0
90
)-1
00
7A
S-1
7
AS
-9P
gd3-
A
Xab
g378
X
abg7
04
Xb
cd9
3
Xbcd
13
0
Xb
cd5
88
Xb
cd9
07
Xbcd
18
72
X
cdo5
45
X
cdo
14
00
X
fba8
X
fba1
7X
fba6
5X
fba7
2X
fba9
3X
fba1
09
Xfb
b121
X
fba1
27
Xfb
a311
bX
fba3
21
Xfb
b9
Xfb
b156
X
fbb2
78
Xk
suD
9
Xm
wg5
30
Xm
wg
90
5
Xm
wg
20
80
X
psr
11
9
Xp
sr1
60(P
lc)
Xp
sr3
86
Xpsr
39
2
Xpsr
56
3
Xps
r648
X
psr8
33(P
er)
Xps
r946
aX
psr9
46b
Xta
g18
4
Xta
g6
1
Xum
c190
(Css
1)
Xu
nl2
22
X
un
l223
X
wye
835(
Wx)
30
32
40
14
81
lsquo7S
08
rsquo7
AS
-7(0
87
)-7
AS
-2(0
73
)7
AS
-7
7A
S-1
2
7A
S-2
Lr3
4-D
N
ar7-
A
Pc1
-B
Xab
c15
1
X
ab
c15
2
Xa
k4
66(N
ra)
Xbcd
14
38
X
cdo
43
1
X
cdo
47
5
Xcd
o5
34
Xcd
o6
76
Xcd
o7
80
X
cdo1
18
9
X
cdo
13
95
X
fba4
2X
fba3
46
Xfb
a377
X
fbb6
7a
Xfb
b186
aX
ksu
A1
Xk
suD
25
Xk
suE
3
Xksu
F4
8
Xk
suH
8
Xm
wg7
10
Xps
r490
(Ss1
-AB
D)
Xps
r604
X
psr6
62
Xrj
19
Xrz
2X
tam
13
Xta
g65
1
Xw
g83
4
23
22
36
19
78
lsquo7S
04
rsquo7
AS
-10
(04
5)-
7D
S-5
(03
6)
7D
S-1
7
DS
-5
7A
S-1
0
7A
S-5
Am
p-3-
A
Brz
-A
Est
3-A
P
an2-
A
Rc1
-A
Rc3
-D
Xa
bc4
65
Xbcd
31
0
Xbcd
38
5
Xb
cd7
07
Xb
cd9
81
Xb
cd1
06
6
Xbcd
13
38
X
bcd
17
73
X
cdo
57
X
cdo7
8
X
cdo9
1
X
cdo5
95
Xcm
wg
66
9
Xcm
wg
70
4
X
fba3
2X
fba2
48
Xfb
a340
X
fba3
71
Xfb
b150
X
fbb1
95
Xfb
b226
X
fbb2
64
Xk
suD
15
X
ksu
S1
X
mw
g8
9
Xpsr
10
3
Xp
sr1
08
Xp
sr1
50
Xp
sr1
52
Xps
r492
(Acl
3)
Xp
sr9
55
Xps
r192
1X
rj5
X
tam
64
X
un
l13
4
Xu
nl1
57
Xu
nl1
61
X
wg
18
0a
31
43
29
85
3
3552 Nucleic Acids Research 2004 Vol 32 No 12
Tab
le1
C
onti
nued
GR
Rsa
Fla
nk
ing
del
etio
ns
Del
etio
ns
inth
ere
gio
nM
ark
ers
Gen
esbc
Gen
es(
)R
ec
()
Siz
e(M
b)
Rec
in
Kb
cM
lsquo7S
02
rsquo7
AS
-4(0
26
)-7
BS
-3(0
16
)7
AS
-6
7A
S-4
7
DS
-3
7B
S-3
Xa
bg
476
a
Xb
cd9
8
Xbcd
34
9
Xcm
wg
70
5
Xfb
a363
X
fbb3
43
Xm
wg
808
X
psr
65
X
rz4
X
tag
30
1
Xta
g53
6
Xta
g65
8
Xw
g5
22
Xw
g66
91
02
36
21
687
lsquo7L
01
rsquo7
DL
-6(0
10
)-7
AL
-4(0
18
)7
DL
-6
7A
L-4
7
BL
-14
Xcd
o5
51
X
cdo1
19
9
Xpsr
16
9
Xp
sr3
03
Xta
g43
9
Xta
g64
23
13
31
52
78
lsquo7L
03
rsquo7
AL
-3(0
29
)-7
BL
-1(0
40
)7
AL
-3
7B
L-2
7
BL
-1
7D
L-5
Am
y2-A
V
Atp
-B1-
A
Xab
c455
X
ab
g4
76
b
Xcd
o5
3
Xcd
o6
73
X
cdo
92
0
Xcd
o1
40
7
Xcd
o1
42
8
Xh
r20b
X
mw
g2
03
1
Xm
wg8
25
Xpsr
10
5
Xpsr
16
5
Xp
sr3
11
Xp
sr3
40
Xp
sr3
89
Xps
r468
(Pep
c)
Xpsr
51
4
Xpsr
69
0
Xps
r803
(Fed
)X
psr
93
8
Xta
g5
98
X
ubp2
X
un
l188
X
wg
46
6
Xw
g68
6a
X
wg
71
9
Xw
ye19
58(A
dpg3
)
19
54
51
38
89
lsquo7L
08
rsquo7
DL
-4(0
76
)-7
AL
-2(0
87
)7
AL
-21
7
AL
-6
7B
L-1
0
7B
L-1
3
7A
L-8
7
AL
-13
7A
L-1
6
7A
L-2
7
DL
-4
Ep-
D1b
-D
Lr1
9-D
P
m5-
B
Sr22
-A
VA
tp-A
-A
Xab
c305
X
ab
c31
0
Xbc
d178
X
bcd
19
30
X
cdo6
65
X
cdo6
86
Xcd
o7
75
Xcd
o962
X
fba6
9X
fba9
7X
fba2
04
Xfb
a234
X
fba2
59
Xfb
a264
X
fba3
01
Xfb
a350
X
fba3
82
Xfb
b67b
X
fbb7
9X
fbb1
75
Xfb
b218
X
fbb3
25
Xks
u927
(Grp
94a)
X
ksu9
27(G
rp94
b)
Xksu
A5
X
ksu
D2
X
ksu
D39
X
ksu
D6
Xk
suD
7
Xk
suD
9
Xksu
G1
2
Xk
suG
39
Xk
suG
7
Xm
wg
97
5
Xpsr
72
X
psr
11
7
Xp
sr1
29
Xps
r350
aX
psr3
50b
Xpsr
54
7
Xp
sr5
48
Xpsr
56
0
Xpsr
68
1
Xpsr
92
7
Xri
s44
Xrr
11
X
rz4
76
X
rz6
82
X
tag
47
8
Xta
g5
49
X
tag
68
6
Xta
m6
2a
Xta
m6
2b
Xuc
d101
(Esi
2)
Xu
nl1
70
X
un
l185
X
un
l204
X
wg
18
0b
X
wg4
20
Xw
g514
X
wg
68
6b
43
39
41
86
3
lsquo7L
10
rsquo7
AL
-9(0
94
)-7
AL
-15(0
99
)7
AL
-9
7A
L-1
5B
dv1
Cht
1b-B
D
Ep-
V1
Lr1
4a-B
L
r20-
A
Pch
1-A
BD
P
ch2-
A
Pm
1-A
P
m9-
A
Sr15
-A
Sr17
-B
Xab
g461
X
cdo3
47
X
cdo
41
4
Xcs
ih8
1
Xfb
b18
Xfb
a21
Xfb
a134
X
fbb1
45
Xfb
b186
bX
fbb1
89
Xfb
b238
X
ksu
929(
Cat
)X
ksu
B7
Xks
uE18
X
ksu
G3
4
Xks
uH9
Xm
wg9
38
Xm
wg
206
2
Xp
sr1
21(G
lb3)
Xpsr
14
8
Xps
r680
X
psr
68
7
Xp
sr7
43
Xps
r965
X
psr1
923
Xps
r195
4(T
ha)
Xrz
508
Xta
g3
5
Xta
g54
6
Xta
g75
0
Xta
m50
X
wg
34
1
Xw
g3
80
X
wg
86
6
Xw
g18
06
X
wia
482
31
53
21
44
2
aM
ajor
GR
Rs
are
un
der
lin
ed
bA
ster
isk
repre
sen
tm
ark
ers
ten
tati
vel
yp
lace
dw
ith
ina
GR
R
cM
ark
ers
inb
old
are
ph
ysi
call
ym
app
ed
Th
eu
nd
erli
ned
mar
ker
sar
eb
oth
pre
sen
to
nth
eco
nse
nsu
sp
hy
sica
lan
dg
enet
icm
aps
Nucleic Acids Research 2004 Vol 32 No 12 3553
RESULTS
In order to identify and demarcate the gene-containing regionsprecise physical location of 3025 gene marker loci including252 phenotypically characterized genes and 17 quantitativetrait loci (QTLs) was revealed First 942 cDNA or PstI geno-mic clones were physically mapped using 334 deletion linesEach gene marker loci was localized to the smallest possiblechromosomal interval by combining mapping informationfrom the three wheat homoeologs on a consensus physicalmap This analysis localized the gene-containing regionsand identified the flanking deletion breakpoints Second aconsensus genetic linkage map was constructed by combininginformation from 137 wheat maps and was compared with theconsensus physical map via 428 common markers (underlinedbold face markers Table 1) This comparison revealed thephysical location of phenotypically characterized genes con-firmed gene distribution and provided estimates of recombina-tion at a sub-chromosomal level
Physical mapping
The physical mapping results are provided in supplementaryfigures (AndashG) and are summarized in Table 1 With an averageof 135 the number of physically mapped probes ranged from43 for group 4 to 274 for group 5 chromosomes The averagenumber of deletion lines used per homoeologous group was 48with a range of 40 to 58 (Table 2) The 942 probes detected2036 loci of which 617 were for the A 740 for the B and 679were for the D genome chromosomes (Table 3) With anaverage of 22 the number of loci per probe ranged from19 for group 6 to 24 for groups 1 and 3 Using one restrictionenzyme 45 of the probes detected loci on all three homo-eologs 25 on two and 29 of the probes detected loci ononly one of the three homoeologs (Table 3) Among the probesdetecting loci on two homoeologs the number for B and Dgenome chromosomes was more than double (124 probes)compared to either of the other two combinations (A and Dor A and B) Similarly among the probes detecting loci on onlyone of the three homoeologs the number for the B genome wasmore than double compared to either of the other two Thetotal number of loci detected for the B genome was 37compared with 33 for the D and 30 for the A genomeThe number of probes mapping on all three homoeologs ran-ged from 29 for group 6 to 60 for group 1 Similarly thenumber of probes mapping only on one of the three homoeo-logs ranged from 19 for group 3 to 41 for group 6
Except for a few discrepancies relative order FL locationand overall distribution of gene markers were similar amonghomoeologs It was therefore possible to generate consensusphysical maps by combining mapping information from thehomoeologs Deletion breakpoints of homoeologs were placedon the consensus map and each marker was placed to theshortest possible interval (see Methods)
Gene distribution on the wheat chromosomes is obviousfrom Figure 1 Regions of very high marker density wereobserved on all consensus physical maps and were calledgene-rich regions (GRRs) The location and size of eachGRR was drawn to scale and the bracketing deletion break-points are shown on the lsquoleftrsquo Detailed information regardingthe bracketing deletions size markers and other deletion linesfor each GRR is given in Table 1 and is summarized in Table 2With an average of seven and a range of five to eight perchromosome 48 GRRs were identified for the wheat genomethat contained 94 of the markers (Table 2) The remaining6 of the markers were present in other regions includingcentromere of chromosome 1B that contained markersXbcd1072 and Xpsr161
Comparative analysis
With the objectives to confirm the gene distribution physicallymap additional markers including phenotypically character-ized genes and to reveal precise distribution of recombinationon the wheat chromosomes consensus genetic linkage mapswere constructed for each of the homoeologous groups andcompared with the consensus physical maps A total of 1417markers including 252 phenotypically characterized genes and17 QTLs were placed on the consensus genetic linkage maps(Figure 1) With an average of 202 per chromosome thenumber of markers ranged from 151 for group 4 to 235 forgroup 2 The average number of phenotypically characterizedgenesQTLs was 38 per chromosome group with a range of 28for group 5 to 43 for group 1
The 428 common markers were used to compare the con-sensus physical and genetic linkage maps A sector corre-sponding to each of the GRR was identified on the geneticlinkage map Additional markers and useful genes present onthe consensus linkage map were then localized to the corre-sponding GRR and the results are summarized in Table 1About 94 (13361417) of the consensus genetic linkagemap markers including 241 of the 252 phenotypically char-acterized genes and all 17 QTLs mapped in the GRRs(Figure 1 Table 1) The distribution of gene markers observed
Table 2 Summary information about the identified GRRs
Group Size (Mb) No of del in GRR Total No of deletion No of Marker No of GRRS L Total S L Total S L Total S L Total S L Total
1 25 94 119 19 32 51 26 26 52 126 126 252 3 5 82 67 111 178 8 8 16 25 17 42 128 145 273 3 4 73 131 131 262 9 10 19 20 20 40 88 153 241 3 4 74 94 167 261 5 18 23 16 33 49 56 106 162 2 3 55 96 192 288 11 18 29 17 35 52 62 290 352 4 4 86 51 84 135 14 22 36 15 26 41 85 163 248 2 3 57 141 140 281 13 18 31 19 39 58 137 154 291 4 4 8Total 605 919 1524 79 126 205 138 196 334 682 1137 1819 21 27 48
3554 Nucleic Acids Research 2004 Vol 32 No 12
from the genetic linkage maps was similar to that from thephysical maps Between the two methods 3025 marker lociwere physically localized on wheat chromosomes that corre-sponded to 1931 unique gene loci (Figure 1 Table 1) Of these94 mapped within the 48 GRRs The remaining 6 werepresent in small groups of one to four markers separated bymore than one deletion breakpoints
Gene distribution
The number and location of GRRs was different among wheatchromosomes (Figure 1 and Table 1) Twenty-one GRRs werepresent on the short arms and contained 35 of the wheatgenes The remaining 27 GRRs were present on the long armsand contained about 59 of the genes (Table 1) The numberof GRRs per chromosome varied from five (groups 4 and 6) toeight (Groups 1 5 and 7) Essentially no GRR was observed inthe centromeric regions of the chromosomes Only one smallGRR (lsquo7L01rsquo) containing 4 of the armrsquos genes was observedin the proximal 20 of any chromosome In general GRRspresent in the distal regions were relatively higher in genedensity More than 80 of the total marker loci mapped inthe distal half of the chromosomes and 58 mapped in thedistal 20 (Figure 1 and Table 1)
Significant differences were observed among GRRs formarker number marker density and the size The 48 GRRsencompassed about 1554 Mb that is equivalent to 29 of thewheat genome (Table 1) Gene density and number in18 GRRs was very high (major GRRs) (underlined inTable 1 and Figure 1) These major GRRs contained nearly60 of the wheat genes but covered only 11 of the genomeThe gene number and density was variable even among thesemajor GRRs Five of these (lsquo1S08rsquo lsquo2L10rsquo lsquo4S07rsquo lsquo6S10rsquoand lsquo6L09rsquo) contained 26 of the wheat genes but spannedonly 3 of the genome On the contrary four minor GRRs(lsquo1S04rsquo lsquo2L03rsquo lsquo5S04rsquo and lsquo7L01rsquo) contained only 2 ofthe wheat genes but covered gt2 of the genome Estimatedsizes of GRRs varied from 3 Mb for lsquo1S04rsquo to 71 Mb forlsquo3L09rsquo with an average of 32 Mb The total region spannedby GRRs ranged from 119 Mb for group 1 to 288 Mb forgroup 5 Number of genes in a GRR varied from 4 of the armin lsquo7L01rsquo to 82 in lsquo6S10rsquo Gene density varied as much as70-fold among GRRs with a range from a gene per 78 kb inlsquo1S08rsquo to 5500 kb in lsquo7L01rsquo Gene distribution even withinGRRs appeared to be uneven The lsquo1L09rsquo region is presentbetween FLs 084 and 09 Of the total 22 markers present inthe region 16 mapped between FL 084 and 085 one betweenFL 085 and 089 and five between FL 089 and 09
Physical mapping of phenotypic markers
The 269 phenotypic markers mapped in this study included80 monogenically inherited wheat disease resistance genes and17 QTLs (Figure 1 and Table 1) Some of the other usefulgenes were Eps (earliness per se) Hd (awnedness) Kr (cross-ibility) Ph1 plant height male sterility and ear morphologygenes (36) Of the 269 phenotypic markers and useful genes159 were reliably located on the consensus genetic maps(colored red Figure 1) The remaining 93 genes were placedon the consensus genetic maps because of their close associa-tion (lt5 cM) with one or more markers The 17 QTLs werelocated to 10 cM intervals on the consensus linkage map asT
ab
le3
S
um
mar
yo
fth
ep
hy
sica
lly
map
ped
wh
eat
loci
on
ho
mo
eolo
go
us
gro
ups
Chro
mo
som
e
gro
up
s
AB
DA
BB
DA
DA
BD
LN
o
PL
PL
PL
PL
PL
PL
PL
To
tal
AT
ota
lB
To
tal
CT
ota
lP
ML
To
tal
PM
LC
AG
ran
dto
tal
18
92
67
36
19
38
12
99
23
23
33
10
21
34
11
23
48
11
74
65
24
51
35
36
14
28
51
01
18
89
95
47
07
31
97
20
74
04
36
72
01
91
87
14
11
22
77
10
10
55
94
93
90
27
71
44
42
14
17
51
48
10
20
00
88
33
11
29
34
28
91
13
82
29
51
09
32
71
53
04
69
21
12
22
52
55
55
51
31
31
60
22
51
79
56
41
06
67
06
33
99
51
01
73
41
12
26
61
91
92
02
05
57
48
12
10
14
03
50
76
82
04
12
24
11
22
24
48
19
19
19
19
13
13
12
31
10
11
63
49
13
74
86
To
tal
42
81
28
45
11
02
12
42
48
63
12
67
57
51
37
13
76
46
46
17
74
06
79
20
36
98
93
02
5
P
pro
be
L
loci
P
ML
p
hy
sica
lly
map
ped
loci
P
ML
CA
p
hy
sica
lly
map
ped
loci
by
com
par
ativ
ean
alysi
sA
ctu
allo
cin
um
ber
may
be
incr
ease
d2
2
fold
Nucleic Acids Research 2004 Vol 32 No 12 3555
their precise location within the intervals was not knownThese 93 genes and 17 QTLs are colored green in Figure 1With an average of 36 the number of phenotypic markersvaried from 29 for group 4 to 44 for group 1 Comparisonof the genetic with the physical consensus maps localized 258of the 269 phenotypic markers and useful genes to 37 GRRs
The highest number (32) of phenotypic markers was observedfor the lsquo1S08rsquo region The 11 GRRs that lacked phenotypicmarkers were present in the proximal regions of the chromo-somes (Figure 1 and Table 1) The genes mapping in the non-GRR regions are Per1 Hk1 Lr35 Xksu905 (Wip) Lr25 Lr9Pm7 Lr30 Xwsu4 (Dor4) tav1933 (Vdoc) and v1
3556 Nucleic Acids Research 2004 Vol 32 No 12
Distribution of recombination
Comparison of the consensus physical and genetic linkagemaps via 428 common markers provided a detailed andaccurate estimate of recombination at a sub-regional level(Figure 1) In general a severe suppression of recombinationwas observed in the centromeric regions of the wheat
chromosomes (Figure 1) One-fourth of the wheat genomepresent around the centromeres accounted for lt1 of thetotal recombination Nearly perfect linkage was observedamong markers present on different arms of a chromosomeFor example markers Xcdo618 (lsquo1S04rsquo) and Xcdo98(lsquo1L02rsquo) were physically separated by one-fourth ofthe chromosomal length but were lt2 cM apart Due to the
Nucleic Acids Research 2004 Vol 32 No 12 3557
lack of recombination in the proximal regions a large num-ber of markers clustered in the centromeric regions of thelinkage maps (Figure 1)
The gene-poor regions accounted for only 5 of therecombination as 95 of the recombination was observedin the GRRs (Figure 1 and Table 1) Markers present intwo different GRRs separated by a gene-poor region were
usually tightly linked on the genetic linkage map For exam-ple no recombination was observed between markers Xwg789(lsquo1S06rsquo) and Xcdo618 (lsquo1S04rsquo) Similarly markers XksuD22(lsquo2L08rsquo) and Xcdo373 (lsquo2L10rsquo) were inseparable on thegenetic linkage map even though these were physically separ-ated by 20 of the armrsquos length (Figure 1) Maximumrecombination observed in a gene-poor region was for the
3558 Nucleic Acids Research 2004 Vol 32 No 12
region between lsquo4S09rsquo and lsquo4S07rsquo that accounted for 12of the armrsquos recombination Recombination occurring in theGRRs varied from 90 for group 4 to 985 for groups 6 and7 The chromosome 3L GRRs accounted for almost 100 ofthe armrsquos recombination Among GRRs maximum geneticlength of 143 cM was observed for lsquo3L09rsquo and minimumof 1 cM was for lsquo1S04rsquo region (Figure 1 and Table 1) Recom-bination rate for two GRRs (lsquo7L01rsquo and lsquo7L10rsquo) present on
the same chromosome arm was 53-fold different Only 1ndash3of the armrsquos recombination was observed for the GRRslsquo1L02rsquo and lsquo7L01rsquo (Figure 1)
Recombination in the distal chromosomal regions was muchhigher as compared to the proximal halves The recombinationrates among GRRs present in the distal half of the chromo-somes were however highly variable Recombination rates insome proximal GRRs were higher than in distal GRRs For
Nucleic Acids Research 2004 Vol 32 No 12 3559
example lsquo1L09rsquo region is proximal to lsquo1L10rsquo but is about5-fold higher in recombination (Figure 1) There are six otherexamples where recombination in the proximal GRRs is 38ndash325 higher compared to the distal GRRs (Figure 1)
In general the recombination rate in the smaller GRRsseemed higher as compared to the GRRs that encompassedlarger chromosomal regions The 10 Mb sized region
lsquo6S10rsquo had the highest percentage recombination per chromo-some arm (Table 1) Similarly the lsquo1S08rsquo region showed 86of the armrsquos recombination and is only 7 Mb in size On thecontrary a larger GRR lsquo4L05rsquo is 70 Mb but accounted forlt15 of the armrsquos recombination (Figure 1) As in the case oflsquo3L09rsquo this pattern of negative correlation between GRR sizeand recombination rate was not observed for some regions
3560 Nucleic Acids Research 2004 Vol 32 No 12
Comparisons of consensus physical and genetic linkagemaps showed that the ratio of physical to genetic distance(kbcM) varied as much as 140-fold among GRRs ThekbcM estimate ranged from 151 for lsquo1S08rsquo to 21687 forlsquo7S02rsquo with an average of 3381 (Figure 1 and Table 1) Inmost cases recombination rate was higher for GRRs with a
higher gene density although there were some exceptions Forexample gene density was relatively high in the GRR lsquo1S04rsquo(1 gene per 273 kb) but only 3 of the armrsquos recombination wasobserved in this region (Table 1) Similarly lsquo5S09rsquo region isrelatively low in gene density (1 gene per 2688 kb) but 60 ofthe armrsquos recombination occurred in this region
Nucleic Acids Research 2004 Vol 32 No 12 3561
Figure 1 (Group 1 to 7) Distribution of genes and recombination on wheat chromosomes Sizes of consensus chromosomes location and sizes of GRRs are drawn toscale based on the average size of the three homoeologous chromosomes for each homoeologous group (54) Names of the GRRs are given on the left side of aconsensus chromosome In the nomenclature of GRRs (eg lsquo1S08rsquo) the first digit represents wheat homoeologous group followed by the arm location either as shortarm (S) or long arm (L) The last two numeral numbers represent GRR location as fraction length (FL) of the chromosome (eg 08 for lsquo1S08rsquo) The flanking deletionlines for each GRR are shown in blue on the left side of a consensus physical chromosome Actual physical size (black) and the ratio of physical to genetic distance(red) for a region are given on the right hand side of a consensus chromosome Sizes (in Mb) of GRRs are calculated based on the cytological measurements(measurements of the region bracketed by the flanking deletion line breakpoints in comparison to the total chromosome size) and are drawn to scale Recombinationin a chromosomal region is calculated by comparing deletion line based physical map with the consensus genetic linkage map for each chromosome Flankingmarkers for each GRR are joined with dotted lines connecting physical and consensus genetic linkage maps On the consensus genetic linkage maps the genes forwhich exact location in reference to other markers was known are shown in red and the genesQTLs for which the location was imprecise are shown in green
fraction length for satellite F region not precisely marked by deletion lines C markers which were not flanked by the flanking deletion lines for the GRR butprobably are part of that region
3562 Nucleic Acids Research 2004 Vol 32 No 12
DISCUSSION
Gene-containing regions of wheat
The number of genes in most of the higher plants is expected tobe similar although variations due to ploidy changes areexpected The in silico approach based gene number estimatefor Arabidopsis is 25 000 and for rice ranges from 32 000 to50 000 (813) Accounting for polyploidy the correspondingnumber for wheat may be between 75 000 and 150 000 Usingthe average gene size of 25 kb that is found in rice only 12ndash24 (188ndash375 Mb) of the wheat genome is therefore expectedto contain genes The predicted number of genes in thesequenced eukaryotes dropped 2- to 3-fold with the availabil-ity of better computational and biological tools The humangenome once thought to have more than 100 000 genes con-tains 30 000 genes based on new stringent criteria andimproved gene-prediction programs Similarly the gene-con-taining fraction of the wheat genome may even be smaller thanthe above predictions Therefore precise localization anddemarcation of the gene-containing regions is particularlyimportant for wheat
Use of deletion lines to reveal the physical location of genemarkers and the approach to combine the mapping data of thethree homoeologs to generate a consensus map have beenshown previously (91026) Relative gene marker locationwas conserved among the three homoeologs even at the cur-rent density (Supplementary Figures AndashG) It was thereforepossible to construct consensus maps for the seven homoeo-logous groups The consensus maps had an average of 48 dele-tion breakpoints per chromosome group with a range from 40for group 3 to 58 for group 7 Based on the average chromo-some size of the homoeologs deletion breakpoints occurredevery 133 Mb for group 7 to 204 Mb for group 3 The break-points were two times more frequent around the GRRs thanrandomly expected once every 8 Mb Of the 334 deletions210 (63) occurred in the GRRs that encompassed 29 ofthe wheat genome (Table 1)
The distribution of genes on wheat chromosomes is strikingWheat chromosomes have regions of high gene density inter-spersed by vast expanses of unpopulated regions consisting ofrepeated DNA Based on the sample of 3025 gene loci 29 ofthe wheat genome contained 94 of the genes (Figure 1) Of the48 GRRs that were identified 18 were major spanning 11 ofthe genome but accounted for 60 of the genes All majorGRRs were present in the distal 35 of the chromosomes Thelong arms of wheat contained twice as many genes as the shortarms Of the total 94 genes present in GRRs 59 were presentin the 27 GRRs on the long arm and remaining in the 21 GRRs onthe short arms No significant correlation was observed betweenthe chromosome size and the gene fraction or the size of theGRRs For example group 3 has the largest chromosomesamong the wheat groups but contained only 13 of thewheat genes compared with group 5 chromosomes that con-tained 20 Roughly the gene fraction seemed to correlatewith the size of the GRRs The size of chromosomes encom-passing the GRRs is the largest for group 5 and the smallest forgroup 6 Correspondingly the gene fraction was the highest forgroup 5 and the lowest for group 6
The actual size of the GRRs may be smaller than that shownin Figure 1 because the accuracy of bracketing the GRRsis dependent upon the number of deletion breakpoints If
randomly occurring breakpoints of the 334 deletion linesare expected to occur every 16 Mb on the consensus physicalmap As mentioned earlier frequency of these chromosomalbreaks was about double in the GRRs Even with that fre-quency GRRs interspersed by lt8 Mb of gene-poor DNAwill not be resolved
As observed in wheat distribution of genes is uneven inother grass species as well In rice 20 of the genome hasnot been contigedsequenced in spite of extensive efforts (8)The unsequenced part of the genome is probably gene-poorAbout 21 of the sequenced portion of the rice genomecontains 40 of the genes (44) Translocation breakpoint-based physical maps showed that barley chromosomes arealso partitioned into gene-rich and gene-poor regions (45)Similarly in the smaller genome plant Arabidopsis genesare unevenly distributed on the chromosomes About 45of the genome accounts for about 25 000 genes with an averagegene size of 2 kb
Based on the expected size of the gene-containing fractiononly a small part of the currently demarcated GRRs is allegedto contain genes Assuming that the wheat genes may encom-pass only 188ndash375 Mb (12ndash24) of the genome the gene-containing fraction within the GRRs is predicted to be only12ndash24 The exact distribution of genes in the GRRs is notknown but preliminary results suggest that the GRRs mayfurther be partitioned into mini gene-rich and gene-poor com-partments Within the GRRs the estimated 75 000 to 150 000wheat genes are expected to occur every 10ndash20 kb Except forploidy differences the wheat and the barley genomes are verysimilar in gene synteny and composition An 11 Mbsequence for selected wheat and barley regions showed thatgene density within the GRRs may range from a gene every4ndash103 kb with an average of 10ndash20 kb (46ndash49) The size of thelsquogene-emptyrsquo blocks interspersed in these regions ranged from08 to 94 kb The largest contig among these wheat and barleyregions is 261 kb around the Mla locus (49) A 130 kb region inthe contig contained 23 genes with an average gene density ofa gene per 56 kb Size of the interspersing lsquogene-emptyrsquoregions ranged from a few hundred base pairs to 11 kbThe second region of high gene density was 40 kb longand contained 10 genes (a gene every 4 kb) The largestlsquogene-emptyrsquo region was 55 kb Another 60 kb barley contigspanned a 32 kb region around the bronze locus with a geneevery 32 kb (34) Very similar observations were made inother large genome grasses such as Triticum monococcumAegilops tauschii and maize (475051)
Localization of the gene containing regions of wheat isbased on studying gene distribution of 3025 gene loci bythree different methods (Table 2) Gene distribution by dele-tion-line-based physical mapping was very similar to thatrevealed by the comparative analysis between physical andconsensus genetic linkage maps Similarly distribution ofgene markers was comparable to that of phenotypically char-acterized genes Therefore we believe that the demarcationand distribution of genes given in Figure 1 is a good repres-entation of the wheat genome Since the current analysis wasbased on the study of 39ndash78 of the wheat genes relativenumbers among various GRRs may slightly vary with theanalysis of additional genes Considering the diversity andrandomness of the analyzed gene markers the size relativegene density and gene proportion are however not expected
Nucleic Acids Research 2004 Vol 32 No 12 3563
to change dramatically A probable exception might bemulticopy gene families that were not represented in thisstudy because of the technical difficulties The currentinterpretations will not hold true for the multicopy genes iftheir distribution is dramatically different from that of thesingle-copy genes
The presence of 6 of the genes in the gene-poor regionssuggests that additional yet smaller GRRs may exist that werenot identified during the current analysis Some genes wereobserved in the highly heterochromatic gene-poor regionsTwo cDNA clones mapped in the centromeric region ofwheat homoelogous group 1 chromosomes that is highly het-erochromatic and gene-poor Other such examples are genemarkers Xbcd1124 Xcdo1340 and Xpsr596 on chromosome1B Xpsr107 XunlBF483292 Xabg356 and Xbcd260 on group2 Xtam12 Xcdo681 Xbcd1278 Xbcd102 XksuI32 XksuF34Xksu609 Xcdo920 and Xwg222 on group 3 and Xbcd1092Xbcd734 Xcdo1337 and Xbcd1262 on group 4
Distribution of recombination
Recombination is highly uneven along the wheat chromo-somes (Figure 1) Recombination mainly occurred in the48 GRRs that accounted for 95 of the recombinationMore than 100-fold differences were however observed forthe rate of recombination among various GRRs A part of thisdifference seemed to be due to the suppression effect of cen-tromere on recombination Essentially no recombination wasobserved in the proximal 30 of the wheat chromosomesin spite of the presence of GRRs In group 7 chromosomeseg genetic distance between the GRRs lsquo7S02rsquo andlsquo7L08rsquo is only 7 cM The spanned region is gt50 of thechromosome and extended over three GRRs Most of thehighly recombinogenic GRRs were localized in the distalparts of the chromosomes but not all distal GRRs were highlyrecombinogenic Genetic distances spanned by lsquo2L08rsquo andlsquo6L07rsquo GRRs were lt5 cM
Recombination distribution within the GRRs is not knownbut the available data suggest that recombination is highlyasymmetrical even within the highly recombinogenicGRRs Analysis of a 1 Mb region of barley homoeologousto one of the most recombinogenic region of wheat (lsquo1S08rsquo)identified a 240 kb region spanning the Mla locus where norecombination was observed (32) Recombination differencesup to 10-fold were observed among different sectors of theremaining part of the region Similar observations have alsobeen made in other eukaryotes Distribution of recombinationhas been best studied on yeast chromosomes Measured at 1 kbresolution the average frequency of recombination was035 cMkb with a range of 0ndash2 cMkb (httpwwwyeast-genomeorg) Measured at a 150 kb interval recombinationwithin a 1 Mb region of rice ranged from 0 to 15cM eventhough the gene distribution was fairly even (44) (httprgpdnaaffrcgojpPublicdatahtml) The average frequencyof recombination in rice is 0003 cMkb with a range of0ndash006 cMkb (httprgpdnaaffrcgojpPublicdatahtml)Similarly in wheat at a resolution of 7 Mb the averagerecombination frequency was 00003 cMkb with a rangefrom 0 to 0007 cMkb Non-recombinogenic regions havebeen observed in yeast as well as in rice but the highestrate of recombination for a region appears to be 35-fold
less in rice It may be because the rice estimates were at150 kb resolution whereas the recombination hotspotsmay be much smaller in length In yeast there is a majorhotspot around PHO8 gene located on the distal end of chro-mosome IV where recombination is 2 cMkb (httpwwwyeastgenomeorg) A 194 bp region around the waxy(wx) locus of rice has a recombination rate of 006 cMkb thatis 20-fold higher than the genome average (52) Similarly a377 bp region of the maize genome has a recombination rate of002 cMkb that is about 30 times higher than the genomeaverage (3553)
SUPPLEMENTARY MATERIAL
Supplementary Material is available at NAR Online
ACKNOWLEDGEMENTS
A contribution of the Agriculture Research Center WashingtonState University Pullman WA Journal series No 0902-03This research project was supported by the US Department ofAgriculture-National Research Initiative (USDA-NRI) and theWSU Vogel Endowment Funds
REFERENCES
1 SearsER (1954) The aneuploids of common wheat Research Bulletin572 University of Missouri Agricultural Experiment Station pp 1ndash58
2 ArumuganathanK and EarleED (1991) Estimation of nuclear DNAcontent of plants by flow cytometry Plant Mol Biol Rep 9 229ndash241
3 FlavellRB BennettMD SmithJB and SmithDB (1974) Genomesize and the proportion of repeated nucleotide sequence DNA in plantsBiochem Genet 12 257ndash269
4 SandhuD and GillKS (2002) Gene-containing regions of wheat and theother grass genomes Plant Physiol 128 803ndash811
5 SidhuD and GillKS (2004) Distribution of genes and recombination inwheat and other eukaryotes Plant Cell Tissue Organ Cult in press
6 ClaytonWD (1981) Evolution and distribution of grassesAnn Missouri Bot Gard 69 5ndash14
7 KelloggE (1998) Relationships of cereal crops and other grassesProc Natl Acad Sci USA 95 2005ndash2010
8 GoffSA RickeD LanTH PrestingG WangR DunnMGlazebrookJ SessionsA OellerP VarmaH et al (2002) A draftsequence of the rice genome (Oryza sativa L ssp japonica) Science 29692ndash100
9 GillKS GillBS EndoTR and BoykoE (1996) Identification andhigh-density mapping of gene-rich regions in chromosome group 5of wheat Genetics 143 1001ndash1012
10 SandhuD ChampouxJA BondarevaSN and GillKS (2001)Identification and physical localization of useful genes and markers to amajor gene-rich region on wheat group 1S chromosomes Genetics 1571735ndash1747
11 AkhunovED GoodyearAW GengS QiLL EchalierB GillBSMiftahudin GustafsonJP LazoG ChaoS et al (2003) Theorganization and rate of evolution of wheat genomes are correlatedwith recombination rates along chromosome arms Genome Res13 753ndash763
12 BarakatACarelsN and BernardiG (1997) The distribution of genes inthe genome of Gramineae Proc Natl Acad Sci USA 94 6857ndash6861
13 TAGI (2000) Analysis of the genome sequence of the floweringplant Arabidopsis thaliana Nature 408 796ndash815
14 BarakatA HanDT BenslimaneA RodeA and BernardiG (1999)The gene distribution in the genomes of pea tomato and date palmFEBS Lett 463 139ndash142
3564 Nucleic Acids Research 2004 Vol 32 No 12
15 SumnerAT TorreJDL and StuppiaL (1993) The distribution ofgenes on chromosomes A cytological approach J Mol Evol 37117ndash122
16 ClayO and BernardiG (2001) The isochores in human chromosome 21and 22 Biochem Biophys Res Commun 285 855ndash856
17 JabbariK and BernardiG (2000) The distribution of genes in drosophilagenome Gene 18 1859ndash1867
18 LanderES LintonLM BirrenB NusbaumC ZodyMCBaldwinJ DevonK DewarK DoyleM FitzHughW et al (2001)Initial sequencing and analysis of the human genome Nature 409860ndash921
19 McPhersonJD MarraM HillierL WaterstonRH ChinwallaAWallisJ SekhonM WylieK MardisER WilsonRK et al (2001)A physical map of the human genome Nature 409 934ndash941
20 VenterJC AdamsMD MyersEW LiPW MuralRJSuttonGG SmithHO YandellM EvansCA HoltRA et al(2001) The sequence of the human genome Science 291 1304ndash1351
21 GillKS GillBS EndoTR and TaylorT (1996) Identificationand high-density mapping of gene-rich regions in chromosome group 1of wheat Genetics 144 1883ndash1891
22 SandhuD and GillKS (2002) Structural and functional organization ofthe lsquo1S08 gene-rich regionrsquo in the Triticeae Plant Mol Biol 48791ndash804
23 DvorakJ and ChenK-C (1984) Distribution of nonstructural variationbetween wheat cultivars along chromosome arm 6Bp evidence from thelinkage map and physical map of the arm Genetics 106 325ndash333
24 CurtisCA and LukaszewskiAJ (1991) Genetic linkage betweenC-bands and storage protein genes in chromosome 1B of tetraploid wheatTheor Appl Genet 81 245ndash252
25 WernerJE KotaRS and GillBS (1992) Distribution of telomericrepeats and their role in the healing of broken chromosome ends in wheatGenome 35 844ndash848
26 GillKS GillBS and EndoTR (1993) A chromosome region-specificmapping strategy reveals gene-rich telometric ends in wheatChromosoma 102 374ndash381
27 KotaRS GillKS GillBS and EndoTR (1993) A cytogeneticallybased physical map of chromosome 1B in common wheat Genome36 548ndash554
28 FarisJD HaenKM and GillBS (2000) Saturation mapping of agene-rich recombination hot spot region in wheat Genetics 154823ndash835
29 WengY TuleenNA and HartGE (2000) Extended physical maps anda consensus physical map of the homoeologous group-6 chromosomesof wheat (Triticum aestivum L em Thell) Theor Appl Genet 100519ndash527
30 TanksleySD GanalMW PrinceJP de VicenteMCBonierbaleMW BrounP FultonTM GiovannoniJJ GrandilloSMartinGB et al (1992) High density molecular linkage maps of thetomato and potato genomes Genetics 132 1141ndash1160
31 PuechbertyJ LaurentAM GimenezS BillaultA LaurentMEBCalendaA MarcaisB PradesC LoannouP YurovY et al (1999)Genetic and physical analyses of the centromeric and pericentromericregions of human chromosome 5 Recombination across 5cen Genomics56 274ndash287
32 WeiF Gobelman-WernerK MorrollSM KurthJ MaoLWingRA LeisterD Schulze-LefertP and WiseRP (1999)The Mla (powdery mildew) resistance cluster is associated withthree NBS-LRR gene families and suppressed recombination withina 240-kb DNA interval on chromosome 5S (1HS) of barley Genetics153 1929ndash1948
33 FeuilletC and KellerB (2002) Comparative genomics in the grassfamily molecular characterization of grass genome structure andevolution Ann Bot (Lond) 89 3ndash10
34 FuH ZhengZ and DoonerHK (2002) Recombination rates betweenadjacent genic and retrotransposon regions in maize vary by 2 ordersof magnitude Proc Natl Acad Sci USA 99 1082ndash1087
35 YaoH ZhouQ LiJ SmithH YandeauM NikolauBJ andSchnablePS (2002) Molecular characterization of meiotic
recombination across the 140-kb multigenic a1-sh2 interval of maizeProc Natl Acad Sci USA 99 6157ndash6162
36 AdamsMD CelnikerSE HoltRA EvansCA GocayneJDAmanatidesPG SchererSE LiPW HoskinsRA GalleRF et al(2000) The genome sequence of Drosophila melanogaster Science 2872185ndash2195
37 BoykoEV GillKS Mickelson-YoungL NasudaS RouppWJZiegleJN SinghS HassawiDS FritzAK NamuthD et al(1999) A high-density genetic linkage map of Aegilops tauschiithe D-genome progenitor of bread wheat Theor Appl Genet 9916ndash26
38 EndoTR (1982) Gametocidal chromosomes of three Aegilops speciesin common wheat Can J Genet Cytol 24 201ndash206
39 EndoTR MukaiY YamamotoM and GillBS (1991) Physicalmapping of a male-fertility gene of common wheat Jpn J Genet66 291ndash295
40 EndoTR and GillBS (1996) The deletion stocks of common wheatJ Hered 87 295ndash307
41 AndersonJA OgiharaY SorrellsME and TanksleySD (1992)Development of a chromosomal arm map for wheat based on RFLPmarkers Theor Appl Genet 83 1035ndash1043
42 SandhuD SidhuD and GillKS (2002) Identification of expressedsequence markers for a major gene-rich region of wheat chromosomegroup 1 using RNA fingerprinting-differential display Crop Sci 421285ndash1290
43 DilbirligiM EraymanM SandhuD SidhuD and GillKS (2004)Identification of wheat chromosomal regions containing expressedresistance genes Genetics 166 461ndash481
44 WuJ MaeharaT ShimokawaT YamamotoS HaradaCTakazakiY OnoN MukaiY KoikeK YazakiJ et al (2002) Acomprehensive rice transcript map containing 6591 expressed sequencetag sites Plant Cell 14 525ndash535
45 KunzelG KorzumL and MeisterA (2000) Cytologically integratedphysical restriction fragment length polymorphism maps for thebarley genome based on translocation breakpoints Genetics 154397ndash412
46 ShirasuK SchulmanAH LahayeT and Schulze-LefertP (2000) Acontiguous 66-kb barley DNA sequence provides evidence for reversiblegenome expansion Genome Res 10 908ndash915
47 WickerT SteinN AlbarL FeuilletC SchlagenhaufE and KellerB(2001) Analysis of a contiguous 211 kb sequence in diploid wheat(Triticum monococcum L) reveals multiple mechanisms of genomeevolution Plant J 26 307ndash316
48 BrueggemanR RostoksN KudrnaD KilianA HanF ChenJDrukaA SteffensonB and KleinhofsA (2002) The barley stem rust-resistance gene Rpg1 is a novel disease-resistance gene with homology toreceptor kinases Proc Natl Acad Sci USA 99 9328ndash9333
49 WeiF WingRA and WiseRP (2002) Genome dynamics andevolution of the Mla (powdery mildew) resistance locus in barley PlantCell 14 1903ndash1917
50 FeuilletC and KellerB (1999) High gene density is conserved atsyntenic loci of small and large grass genomes Proc Natl Acad SciUSA 96 8265ndash8270
51 TikhonovAP SanMiguelPJ NakajimaY GorensteinNMBennetzenJL and AvramovaZ (1999) Colinearity and its exceptions inorthologous adh regions of maize and sorghum Proc Natl Acad SciUSA 96 7409ndash7414
52 InukaiT SakoA HiranoHY and SanoY (2000) Analysis ofintragenic recombination at wx in rice Correlation between the molecularand genetic maps within the locus Genome 43 589ndash596
53 CivardiL XiaY EdwardsKJ SchnablePS and NikolauBJ (1994)The relationship between genetic and physical distances in thecloned a1-sh2 interval of the Zea mays L genome Proc Natl Acad SciUSA 91 8268ndash8272
54 GillBS FriebeB and EndoTR (1991) Standard karyotype andnomenclature system for description of chromosome bands andstructural aberrations in wheat (Triticum aestivum) Genome 34830ndash839
Nucleic Acids Research 2004 Vol 32 No 12 3565
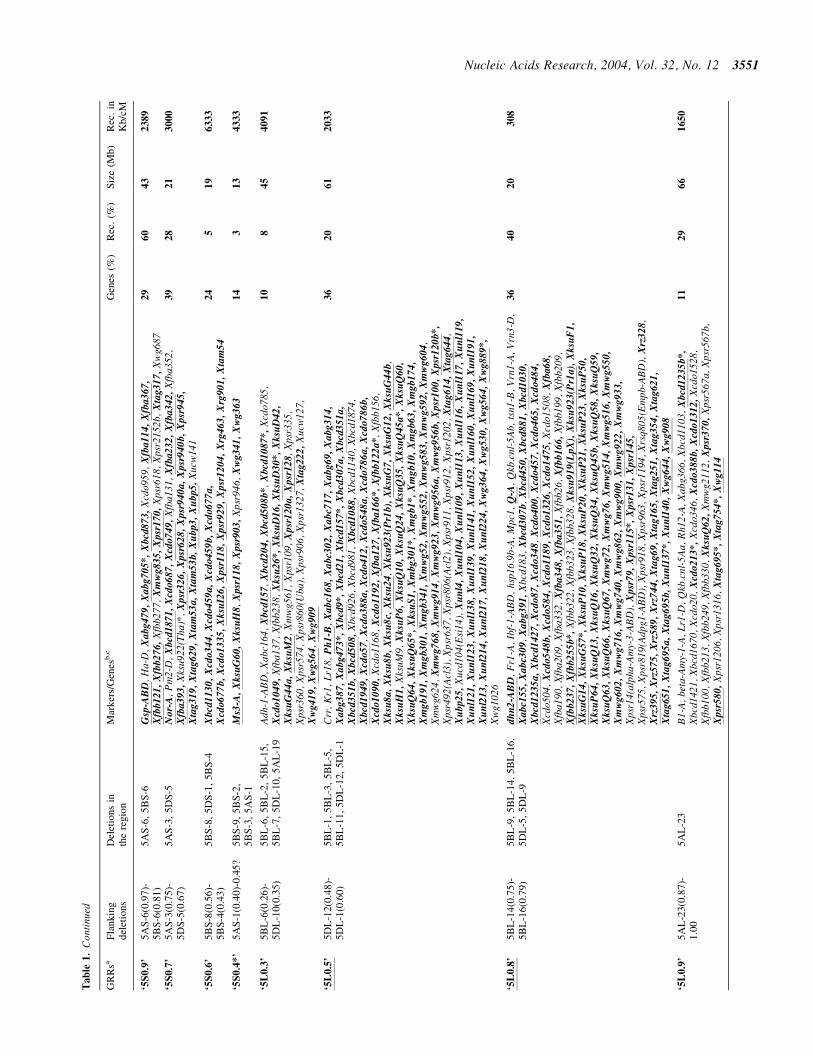
Tab
le1
C
onti
nued
GR
Rsa
Fla
nk
ing
del
etio
ns
Del
etio
ns
inth
ere
gio
nM
arker
sG
enes
bc
Gen
es(
)R
ec
()
Siz
e(M
b)
Rec
in
Kb
cM
lsquo5S
09
rsquo5
AS
-6(0
97
)-5
BS
-6(0
81
)5
AS
-6
5B
S-6
Gsp
-AB
D
Ha-
D
Xa
bg
479
X
ab
g7
05
Xbcd
87
3
Xcd
o959
X
fba1
14
X
fba
36
7
Xfb
b1
21
X
fbb
27
6
Xfb
b277
X
mw
g8
35
X
psr
17
0
Xps
r618
X
psr2
152b
X
tag
31
7
Xw
g687
29
60
43
23
89
lsquo5S
07
rsquo5
AS
-3(0
75
)-5
DS
-5(0
67
)5
AS
-3
5D
S-5
No
r-A
P
m2-
D
Xb
cd1
871
X
cdo
68
7
Xcd
o7
49
X
fba1
31
Xfb
a2
32
X
fba
34
2
Xfb
a352
X
fba3
93
X
ksu9
22(T
ha)
X
psr
32
6
Xpsr
62
8
Xpsr
94
0a
X
psr
94
0b
X
psr
94
5
Xta
g31
9
Xta
g62
9
Xta
m5
3a
Xta
m5
3b
Xu
bp
3
Xu
bp
5
Xuc
w14
1
39
28
21
30
00
lsquo5S
06
rsquo5
BS
-8(0
56
)-5
BS
-4(0
43
)5
BS
-8
5D
S-1
5
BS
-4X
bcd
11
30
X
cdo3
44
X
cdo
45
9a
X
cdo
45
9b
X
cdo6
77
a
Xcd
o6
77
b
Xcd
o1
33
5
Xk
suI2
6
Xpsr
11
8
Xp
sr9
29
Xp
sr1
204
X
rg4
63
Xrg
90
1
Xta
m5
42
45
19
63
33
lsquo5S
04
rsquo
5A
S-1
(04
0)-
04
5
5B
S-9
5
BS
-2
5B
S-3
5
AS
-1M
s3-A
X
ksu
G60
X
ksu
H8
Xpsr
11
8
Xpsr
90
3
Xps
r946
X
wg
34
1
Xw
g3
63
14
31
34
33
3
lsquo5L
03
rsquo5
BL
-6(0
26
)-5
DL
-10(0
35
)5
BL
-6
5B
L-2
5
BL
-15
5
BL
-7
5D
L-1
0
5A
L-1
9A
dh-1
-AB
D
Xab
c164
X
bcd
15
7
Xbcd
20
4
Xbcd
50
8b
Xb
cd1
087
Xcd
o785
X
cdo1
04
9
Xfb
a137
X
fbb2
38
Xksu
26
Xksu
D1
6
Xksu
D3
0
X
ksu
D4
2
Xksu
G4
4a
X
ksu
M2
Xm
wg5
61
Xps
r109
X
psr
12
0a
X
psr
12
8
Xps
r335
X
psr3
60
Xps
r574
X
psr8
60(U
ba)
Xps
r906
X
psr1
327
Xta
g22
2
Xuc
w12
7X
wg
41
9
Xw
g56
4
Xw
g90
9
10
84
54
09
1
lsquo5L
05
rsquo5
DL
-12(0
48
)-5
DL
-1(0
60
)5
BL
-1
5B
L-3
5
BL
-5
5B
L-1
1
5D
L-1
2
5D
L-1
Crr
K
r1
Lr1
8P
h1
-B
Xa
bc1
68
Xa
bc3
02
Xab
c71
7
Xab
g6
9
Xa
bg
314
X
ab
g3
87
X
ab
g4
73
Xbcd
9
X
bcd
21
X
bcd
15
7
X
bcd
30
7a
X
bcd
35
1a
X
bcd
35
1b
X
bcd
50
8
Xbc
d926
X
bcd9
81
Xb
cd1
088
X
bcd1
140
Xbc
d187
4X
bcd
19
49
X
cdo5
7
Xcd
o3
88a
X
cdo4
12
X
cdo5
48
a
Xcd
o7
86
a
Xcd
o7
86b
X
cdo1
09
0
Xcd
o116
8X
cdo
11
92
X
fba1
27
X
fba1
66
Xfb
b1
22a
Xfb
b156
X
ksu
8a
X
ksu
8b
X
ksu
8c
Xk
su24
Xk
su92
3(P
r1b
)X
ksu
G7
Xk
suG
12
X
ksu
G44
b
Xksu
H1
X
ksuM
9X
ksu
P6
X
ksu
Q10
X
ksu
Q24
X
ksu
Q35
X
ksu
Q45
a
X
ksu
Q60
X
ksu
Q6
4
Xksu
Q65
Xksu
S1
X
mb
g3
01
Xm
gb1
Xm
gb1
0
Xm
gb
63
X
mg
b1
74
X
mg
b1
91
X
mg
b3
01
X
mg
b3
41
X
mw
g5
2
Xm
wg
55
2
Xm
wg
58
3
Xm
wg
592
X
mw
g6
04
Xm
wg6
24
Xm
wg
76
8
Xm
wg
914
Xm
wg
923
X
mw
g9
56
a
Xm
wg
95
6b
X
psr
10
0
Xpsr
12
0b
Xps
r492
(Acl
3)
Xps
r637
X
psr8
06(A
cl2)
X
psr9
11
Xps
r912
X
psr1
202
Xta
g61
4
Xta
g6
44
Xu
bp
25
X
ucd1
04(E
si14
)X
un
l4
Xu
nl1
04
X
un
l109
X
un
l113
X
un
l116
X
un
l117
X
un
l119
X
un
l12
1
Xu
nl1
23
X
un
l13
8
Xu
nl1
39
X
un
l14
1
Xu
nl1
52
Xu
nl1
60
Xu
nl1
69
X
un
l191
X
un
l21
3
Xu
nl2
14
X
un
l21
7
Xu
nl2
18
X
un
l22
4
Xw
g3
64
X
wg
53
0
Xw
g56
4
Xw
g8
89
Xw
g102
6
36
20
61
20
33
lsquo5L
08
rsquo5
BL
-14
(07
5)-
5B
L-1
6(0
79
)5
BL
-9
5B
L-1
4
5B
L-1
6
5D
L-5
5
DL
-9d
hn
2-A
BD
F
r1-A
Ib
f-1-
AB
D
hsp1
69b
-A
Mpc
1Q
-A
Qkb
cnl
-5A
bts
n1-B
V
rn1-
A
Vrn
3-D
X
ab
c15
5
Xa
bc3
09
Xa
bg
391
X
bcd1
83
Xbcd
30
7b
Xb
cd4
50
Xb
cd8
81
Xbcd
10
30
X
bcd
12
35
a
Xbcd
14
27
X
cdo
87
X
cdo
34
8
Xcd
o4
00
X
cdo4
57
X
cdo
46
5
Xcd
o4
84
X
cdo5
04
Xcd
o5
48b
X
cdo5
84
X
cdo1
18
9
Xcd
o1
32
6
Xcd
o1
475
X
cdo1
508
Xfb
a6
8
Xfb
a190
X
fba2
09
Xfb
a332
X
fba3
48
X
fba3
51
X
fbb2
6X
fbb
16
6
Xfb
b199
X
fbb2
09
Xfb
b2
37
X
fbb
25
5b
Xfb
b322
X
fbb3
23
Xfb
b328
X
ksu
91
9(L
pX
)X
ksu
92
3(P
r1a
)X
ksu
F1
X
ksu
G1
4
Xksu
G57
Xksu
P1
0
Xk
suP
18
X
ksu
P2
0
Xksu
P2
1
Xk
suP
23
X
ksu
P5
0
Xksu
P6
4
Xk
suQ
13
X
ksu
Q16
X
ksu
Q3
2
Xksu
Q3
4
Xksu
Q4
5b
X
ksu
Q5
8
Xksu
Q5
9
Xksu
Q6
3
Xksu
Q66
X
ksu
Q67
X
mw
g7
2
Xm
wg
76
Xm
wg
51
4
Xm
wg
51
6
Xm
wg
55
0
Xm
wg
60
2
Xm
wg
71
6
Xm
wg
740
X
mw
g8
62
X
mw
g9
00
X
mw
g9
22
X
mw
g9
33
Xps
r14(
alph
a-A
my-
3-A
BD
)X
psr
79
X
psr
11
5
X
psr
13
1
Xp
sr1
45
Xps
r575
X
psr8
19(A
dpg1
-AB
D)
Xps
r918
X
psr9
63
Xps
r119
4X
rsq8
05(E
mpb
-AB
D)
Xrz
32
8
Xrz
39
5
Xrz
57
5
Xrz
58
9
Xrz
74
4
Xta
g69
X
tag
16
5
Xta
g25
1
Xta
g35
4
Xta
g6
21
X
tag
65
1
Xta
g69
5a
X
tag
69
5b
X
un
l137
Xu
nl1
40
X
wg
64
4
Xw
g90
8
36
40
20
30
8
lsquo5L
09
rsquo5
AL
-23(0
87
)-1
00
5A
L-2
3B
1-A
be
ta-A
my-
1-A
L
r1-D
Q
kbc
nl-5
Aa
Rh1
2-A
X
abg3
66
Xbc
d110
3X
bcd
12
35
b
X
bcd1
421
Xbc
d167
0X
cdo2
0X
cdo
21
3
X
cdo3
46
Xcd
o3
88b
X
cdo
13
12
X
cdo1
528
Xfb
b100
X
fbb2
13
Xfb
b249
X
fbb3
30
Xk
suQ
62
X
mw
g211
2X
psr
37
0
Xps
r567
aX
psr5
67b
Xpsr
58
0
Xps
r120
6X
psr1
316
Xta
g69
5
X
tag
75
4
Xw
g11
4
11
29
66
16
50
Nucleic Acids Research 2004 Vol 32 No 12 3551
Ta
ble
1
Con
tinu
ed
GR
Rsa
Fla
nk
ing
del
etio
ns
Del
etio
ns
inth
ere
gio
nM
arker
sG
enes
bc
Gen
es(
)R
ec
()
Siz
e(M
b)
Rec
in
Kb
cM
lsquo6S
10
rsquo6
DS
-6(0
99
)-1
00
6A
S-5
6
BS
-3
6B
S-6
6
BS
-2
6D
S-6
6
DS
-4L
r36-
B
Nor
2-B
Q
Gpc
nds
u-B
Q
Pm
sfr
-B
Sr5-
D
Sr8-
A
Su1-
B
Xab
g387
X
abg4
58
Xab
g466
X
ak46
6(N
ra)
Xbc
d21
Xbc
d342
X
bcd1
821
Xcd
o476
X
cdo1
380
Xcm
wg6
20
Xcm
wg6
52
Xcm
wg6
79a
Xcm
wg6
79b
Xcm
wg
69
0
Xfb
a1
X
fba8
5
Xfb
a1
87
Xfb
a3
44
X
fbb3
54
X
ksuE
3X
ksuF
36
Xks
uF43
X
ksu
G8a
X
ksu
G8b
X
ksu
G48
Xk
suH
4
Xksu
I28
X
ksuM
5X
mw
g59
Xm
wg7
9X
mw
g573
X
mw
g6
52
Xm
wg8
20
Xm
wg8
87
Xm
wg
91
6
Xm
wg
96
6
Xpa
p4
Xpsr
8(C
xP
3)a
X
psr
8(C
xP
3)b
X
psr
10
(Gli
-2)
Xpsr
10
6a
X
psr
14
1b
X
psr1
67
Xpsr
30
1a
X
psr5
46
Xp
sr5
51
Xps
r563
X
psr
62
7
Xps
r662
X
psr8
99
Xps
r904
X
psr
91
6
Xpsr
96
4
Xps
r967
X
rgc6
9X
tag5
37
Xta
g562
X
tag5
82
Xta
g75
2
Xta
m60
X
uta
2(P
sif)
82
89
10
16
4
lsquo6S
05
rsquo6
DS
-2(0
45
)-6
AS
-5(0
65
)6
AS
-4
6A
S-5
6
AS
-1
6B
S-8
6
BS
-5
6B
S-1
6
DS
-4
6D
S-2
Xa
bc1
73
Xcd
o270
X
cdo
53
4
Xcd
o115
8X
fba6
7
Xfb
a1
48
Xfb
a3
99
X
fbb2
31
X
cmw
g653
X
psr
14
1a
X
psr
31
2
Xps
r962
X
tam
31
X
rz4
76
X
uta
1(P
sif)
18
94
16
94
9
lsquo6L
04
rsquo6
BL
-3(0
36
)-6
BL
-4(0
44
)6
AL
-6
6A
L-4
6
AL
-1
6B
L-4
6
BL
-5
6B
L-3
6
DL
-6
6D
L-1
Xa
bc1
63
Xa
bc1
75
X
ab
g2
0
Xab
g379
X
ab
g3
88
X
abg4
74
Xb
cd1
02
Xbc
d758
X
cdo2
9X
cdo
204
Xcd
o497
X
cdo5
07
Xcd
o7
72
X
cdo1
315
Xcd
o142
8X
cmw
g6
53
X
cmw
g6
64
X
fba3
28
X
fba3
67
X
fba
39
7
Xfb
b9
5
Xfb
b2
83
Xfb
b3
64
X
ksuD
17
Xks
uG58
X
ksuM
151
Xm
wg
872
Xm
wg
911
X
mw
g206
1X
psr1
13
Xpsr
14
2
Xp
sr3
71
Xp
sr4
63(P
rk)
Xps
r831
X
psr9
08
Xp
sr9
15
Xrs
q8
05
(Em
bp
)X
tag3
17
Xta
g33
4
Xta
m6
Xta
m9
Xta
m10
X
tam
27
Xta
m31
X
tam
57
Xu
cd1
09
(Esi
35
)X
VA
tp-B
2X
wg2
23
Xw
g93
3
30
21
15
84
7
lsquo6L
07
rsquo6
AL
-1(0
69
)-6
BL
-6(0
76
)6
AL
-1
6A
L-5
6
BL
-9
6B
L-8
6
BL
-14
6
BL
-1
6B
L-6
6
DL
-1
6D
L-1
2
6D
L-7
6
DL
-13
Xa
bg
1
Xfb
b2
15
X
ksuF
24
Xm
wg8
20
Xm
wg
20
29
X
npi2
53
Xps
r149
X
psr
30
1b
X
tag4
95
Xta
m1
7
Xta
m7
4
Xuc
w26
X
wg
28
6
Xw
g341
10
66
01
17
65
lsquo6L
09
rsquo6
AL
-8(0
90
)-1
00
6A
L-8
6
BL
-6
6D
L-1
3A
HV
5D
hn3
Got
2-A
BD
H
t3-D
N
or7-
B
Lr3
-B
Sr11
-B
Sr13
-A
Sr29
-D
WsP
16
Xab
c154
X
abc4
51
Xab
g652
X
bcd
1
Xbc
d269
X
bcd
27
6
Xbc
d880
X
bcd1
510
Xcd
o388
X
cdo5
16
Xcd
o836
X
cdo1
091
Xcm
wg
66
9
Xcm
wg
67
4
Xcm
wg
68
4
Xcm
wg
716
Xcs
b1
12b
(Dh
n5
)X
fba1
X
fba4
2
Xfb
a8
1
Xfb
a1
11
X
fbb
40
X
fbb5
7
Xfb
b5
9
Xfb
b7
0
Xfb
b8
2
Xfb
b1
64
Xfb
b1
69
X
fbb1
70
X
fbb
22
1
Xfb
b3
27
X
ksu
D1
Xks
uD12
X
ksuD
17
Xks
uD27
X
ksuE
14
Xks
uF14
aX
ksuF
14b
Xks
uF19
X
ksuF
37
Xks
uG30
X
ksu
G51
X
ksuM
1X
ksuM
75
Xm
wg
19
Xm
wg
21
X
mw
g7
4a
Xm
wg
74
b
Xm
wg5
13
Xm
wg
514
X
mw
g7
98
X
mw
g813
X
mw
g838
X
mw
g887
X
mw
g897
X
mw
g934
X
mw
g2
053
X
mw
g2
10
0
Xp
sr2
(a-a
my1
)a
Xpsr
2(a
-am
y1)b
X
psr1
06b
Xps
r134
X
psr1
54
Xps
r546
X
psr6
05
Xpsr
90
4
Xpsr
90
8
Xps
r966
X
psr
96
7
Xrg
c74
Xta
g495
X
tag5
20
Xta
g547
X
tag6
80
Xta
g70
5
Xta
g762
X
tam
10
b
Xta
m21
X
tam
26
Xta
m2
8
Xta
m3
6
Xu
cd1
06
(Esi
18
)X
wg
34
1
Xw
g4
05
60
72
45
82
5
lsquo7S
09
rsquo7
AS
-1(0
90
)-1
00
7A
S-1
7
AS
-9P
gd3-
A
Xab
g378
X
abg7
04
Xb
cd9
3
Xbcd
13
0
Xb
cd5
88
Xb
cd9
07
Xbcd
18
72
X
cdo5
45
X
cdo
14
00
X
fba8
X
fba1
7X
fba6
5X
fba7
2X
fba9
3X
fba1
09
Xfb
b121
X
fba1
27
Xfb
a311
bX
fba3
21
Xfb
b9
Xfb
b156
X
fbb2
78
Xk
suD
9
Xm
wg5
30
Xm
wg
90
5
Xm
wg
20
80
X
psr
11
9
Xp
sr1
60(P
lc)
Xp
sr3
86
Xpsr
39
2
Xpsr
56
3
Xps
r648
X
psr8
33(P
er)
Xps
r946
aX
psr9
46b
Xta
g18
4
Xta
g6
1
Xum
c190
(Css
1)
Xu
nl2
22
X
un
l223
X
wye
835(
Wx)
30
32
40
14
81
lsquo7S
08
rsquo7
AS
-7(0
87
)-7
AS
-2(0
73
)7
AS
-7
7A
S-1
2
7A
S-2
Lr3
4-D
N
ar7-
A
Pc1
-B
Xab
c15
1
X
ab
c15
2
Xa
k4
66(N
ra)
Xbcd
14
38
X
cdo
43
1
X
cdo
47
5
Xcd
o5
34
Xcd
o6
76
Xcd
o7
80
X
cdo1
18
9
X
cdo
13
95
X
fba4
2X
fba3
46
Xfb
a377
X
fbb6
7a
Xfb
b186
aX
ksu
A1
Xk
suD
25
Xk
suE
3
Xksu
F4
8
Xk
suH
8
Xm
wg7
10
Xps
r490
(Ss1
-AB
D)
Xps
r604
X
psr6
62
Xrj
19
Xrz
2X
tam
13
Xta
g65
1
Xw
g83
4
23
22
36
19
78
lsquo7S
04
rsquo7
AS
-10
(04
5)-
7D
S-5
(03
6)
7D
S-1
7
DS
-5
7A
S-1
0
7A
S-5
Am
p-3-
A
Brz
-A
Est
3-A
P
an2-
A
Rc1
-A
Rc3
-D
Xa
bc4
65
Xbcd
31
0
Xbcd
38
5
Xb
cd7
07
Xb
cd9
81
Xb
cd1
06
6
Xbcd
13
38
X
bcd
17
73
X
cdo
57
X
cdo7
8
X
cdo9
1
X
cdo5
95
Xcm
wg
66
9
Xcm
wg
70
4
X
fba3
2X
fba2
48
Xfb
a340
X
fba3
71
Xfb
b150
X
fbb1
95
Xfb
b226
X
fbb2
64
Xk
suD
15
X
ksu
S1
X
mw
g8
9
Xpsr
10
3
Xp
sr1
08
Xp
sr1
50
Xp
sr1
52
Xps
r492
(Acl
3)
Xp
sr9
55
Xps
r192
1X
rj5
X
tam
64
X
un
l13
4
Xu
nl1
57
Xu
nl1
61
X
wg
18
0a
31
43
29
85
3
3552 Nucleic Acids Research 2004 Vol 32 No 12
Tab
le1
C
onti
nued
GR
Rsa
Fla
nk
ing
del
etio
ns
Del
etio
ns
inth
ere
gio
nM
ark
ers
Gen
esbc
Gen
es(
)R
ec
()
Siz
e(M
b)
Rec
in
Kb
cM
lsquo7S
02
rsquo7
AS
-4(0
26
)-7
BS
-3(0
16
)7
AS
-6
7A
S-4
7
DS
-3
7B
S-3
Xa
bg
476
a
Xb
cd9
8
Xbcd
34
9
Xcm
wg
70
5
Xfb
a363
X
fbb3
43
Xm
wg
808
X
psr
65
X
rz4
X
tag
30
1
Xta
g53
6
Xta
g65
8
Xw
g5
22
Xw
g66
91
02
36
21
687
lsquo7L
01
rsquo7
DL
-6(0
10
)-7
AL
-4(0
18
)7
DL
-6
7A
L-4
7
BL
-14
Xcd
o5
51
X
cdo1
19
9
Xpsr
16
9
Xp
sr3
03
Xta
g43
9
Xta
g64
23
13
31
52
78
lsquo7L
03
rsquo7
AL
-3(0
29
)-7
BL
-1(0
40
)7
AL
-3
7B
L-2
7
BL
-1
7D
L-5
Am
y2-A
V
Atp
-B1-
A
Xab
c455
X
ab
g4
76
b
Xcd
o5
3
Xcd
o6
73
X
cdo
92
0
Xcd
o1
40
7
Xcd
o1
42
8
Xh
r20b
X
mw
g2
03
1
Xm
wg8
25
Xpsr
10
5
Xpsr
16
5
Xp
sr3
11
Xp
sr3
40
Xp
sr3
89
Xps
r468
(Pep
c)
Xpsr
51
4
Xpsr
69
0
Xps
r803
(Fed
)X
psr
93
8
Xta
g5
98
X
ubp2
X
un
l188
X
wg
46
6
Xw
g68
6a
X
wg
71
9
Xw
ye19
58(A
dpg3
)
19
54
51
38
89
lsquo7L
08
rsquo7
DL
-4(0
76
)-7
AL
-2(0
87
)7
AL
-21
7
AL
-6
7B
L-1
0
7B
L-1
3
7A
L-8
7
AL
-13
7A
L-1
6
7A
L-2
7
DL
-4
Ep-
D1b
-D
Lr1
9-D
P
m5-
B
Sr22
-A
VA
tp-A
-A
Xab
c305
X
ab
c31
0
Xbc
d178
X
bcd
19
30
X
cdo6
65
X
cdo6
86
Xcd
o7
75
Xcd
o962
X
fba6
9X
fba9
7X
fba2
04
Xfb
a234
X
fba2
59
Xfb
a264
X
fba3
01
Xfb
a350
X
fba3
82
Xfb
b67b
X
fbb7
9X
fbb1
75
Xfb
b218
X
fbb3
25
Xks
u927
(Grp
94a)
X
ksu9
27(G
rp94
b)
Xksu
A5
X
ksu
D2
X
ksu
D39
X
ksu
D6
Xk
suD
7
Xk
suD
9
Xksu
G1
2
Xk
suG
39
Xk
suG
7
Xm
wg
97
5
Xpsr
72
X
psr
11
7
Xp
sr1
29
Xps
r350
aX
psr3
50b
Xpsr
54
7
Xp
sr5
48
Xpsr
56
0
Xpsr
68
1
Xpsr
92
7
Xri
s44
Xrr
11
X
rz4
76
X
rz6
82
X
tag
47
8
Xta
g5
49
X
tag
68
6
Xta
m6
2a
Xta
m6
2b
Xuc
d101
(Esi
2)
Xu
nl1
70
X
un
l185
X
un
l204
X
wg
18
0b
X
wg4
20
Xw
g514
X
wg
68
6b
43
39
41
86
3
lsquo7L
10
rsquo7
AL
-9(0
94
)-7
AL
-15(0
99
)7
AL
-9
7A
L-1
5B
dv1
Cht
1b-B
D
Ep-
V1
Lr1
4a-B
L
r20-
A
Pch
1-A
BD
P
ch2-
A
Pm
1-A
P
m9-
A
Sr15
-A
Sr17
-B
Xab
g461
X
cdo3
47
X
cdo
41
4
Xcs
ih8
1
Xfb
b18
Xfb
a21
Xfb
a134
X
fbb1
45
Xfb
b186
bX
fbb1
89
Xfb
b238
X
ksu
929(
Cat
)X
ksu
B7
Xks
uE18
X
ksu
G3
4
Xks
uH9
Xm
wg9
38
Xm
wg
206
2
Xp
sr1
21(G
lb3)
Xpsr
14
8
Xps
r680
X
psr
68
7
Xp
sr7
43
Xps
r965
X
psr1
923
Xps
r195
4(T
ha)
Xrz
508
Xta
g3
5
Xta
g54
6
Xta
g75
0
Xta
m50
X
wg
34
1
Xw
g3
80
X
wg
86
6
Xw
g18
06
X
wia
482
31
53
21
44
2
aM
ajor
GR
Rs
are
un
der
lin
ed
bA
ster
isk
repre
sen
tm
ark
ers
ten
tati
vel
yp
lace
dw
ith
ina
GR
R
cM
ark
ers
inb
old
are
ph
ysi
call
ym
app
ed
Th
eu
nd
erli
ned
mar
ker
sar
eb
oth
pre
sen
to
nth
eco
nse
nsu
sp
hy
sica
lan
dg
enet
icm
aps
Nucleic Acids Research 2004 Vol 32 No 12 3553
RESULTS
In order to identify and demarcate the gene-containing regionsprecise physical location of 3025 gene marker loci including252 phenotypically characterized genes and 17 quantitativetrait loci (QTLs) was revealed First 942 cDNA or PstI geno-mic clones were physically mapped using 334 deletion linesEach gene marker loci was localized to the smallest possiblechromosomal interval by combining mapping informationfrom the three wheat homoeologs on a consensus physicalmap This analysis localized the gene-containing regionsand identified the flanking deletion breakpoints Second aconsensus genetic linkage map was constructed by combininginformation from 137 wheat maps and was compared with theconsensus physical map via 428 common markers (underlinedbold face markers Table 1) This comparison revealed thephysical location of phenotypically characterized genes con-firmed gene distribution and provided estimates of recombina-tion at a sub-chromosomal level
Physical mapping
The physical mapping results are provided in supplementaryfigures (AndashG) and are summarized in Table 1 With an averageof 135 the number of physically mapped probes ranged from43 for group 4 to 274 for group 5 chromosomes The averagenumber of deletion lines used per homoeologous group was 48with a range of 40 to 58 (Table 2) The 942 probes detected2036 loci of which 617 were for the A 740 for the B and 679were for the D genome chromosomes (Table 3) With anaverage of 22 the number of loci per probe ranged from19 for group 6 to 24 for groups 1 and 3 Using one restrictionenzyme 45 of the probes detected loci on all three homo-eologs 25 on two and 29 of the probes detected loci ononly one of the three homoeologs (Table 3) Among the probesdetecting loci on two homoeologs the number for B and Dgenome chromosomes was more than double (124 probes)compared to either of the other two combinations (A and Dor A and B) Similarly among the probes detecting loci on onlyone of the three homoeologs the number for the B genome wasmore than double compared to either of the other two Thetotal number of loci detected for the B genome was 37compared with 33 for the D and 30 for the A genomeThe number of probes mapping on all three homoeologs ran-ged from 29 for group 6 to 60 for group 1 Similarly thenumber of probes mapping only on one of the three homoeo-logs ranged from 19 for group 3 to 41 for group 6
Except for a few discrepancies relative order FL locationand overall distribution of gene markers were similar amonghomoeologs It was therefore possible to generate consensusphysical maps by combining mapping information from thehomoeologs Deletion breakpoints of homoeologs were placedon the consensus map and each marker was placed to theshortest possible interval (see Methods)
Gene distribution on the wheat chromosomes is obviousfrom Figure 1 Regions of very high marker density wereobserved on all consensus physical maps and were calledgene-rich regions (GRRs) The location and size of eachGRR was drawn to scale and the bracketing deletion break-points are shown on the lsquoleftrsquo Detailed information regardingthe bracketing deletions size markers and other deletion linesfor each GRR is given in Table 1 and is summarized in Table 2With an average of seven and a range of five to eight perchromosome 48 GRRs were identified for the wheat genomethat contained 94 of the markers (Table 2) The remaining6 of the markers were present in other regions includingcentromere of chromosome 1B that contained markersXbcd1072 and Xpsr161
Comparative analysis
With the objectives to confirm the gene distribution physicallymap additional markers including phenotypically character-ized genes and to reveal precise distribution of recombinationon the wheat chromosomes consensus genetic linkage mapswere constructed for each of the homoeologous groups andcompared with the consensus physical maps A total of 1417markers including 252 phenotypically characterized genes and17 QTLs were placed on the consensus genetic linkage maps(Figure 1) With an average of 202 per chromosome thenumber of markers ranged from 151 for group 4 to 235 forgroup 2 The average number of phenotypically characterizedgenesQTLs was 38 per chromosome group with a range of 28for group 5 to 43 for group 1
The 428 common markers were used to compare the con-sensus physical and genetic linkage maps A sector corre-sponding to each of the GRR was identified on the geneticlinkage map Additional markers and useful genes present onthe consensus linkage map were then localized to the corre-sponding GRR and the results are summarized in Table 1About 94 (13361417) of the consensus genetic linkagemap markers including 241 of the 252 phenotypically char-acterized genes and all 17 QTLs mapped in the GRRs(Figure 1 Table 1) The distribution of gene markers observed
Table 2 Summary information about the identified GRRs
Group Size (Mb) No of del in GRR Total No of deletion No of Marker No of GRRS L Total S L Total S L Total S L Total S L Total
1 25 94 119 19 32 51 26 26 52 126 126 252 3 5 82 67 111 178 8 8 16 25 17 42 128 145 273 3 4 73 131 131 262 9 10 19 20 20 40 88 153 241 3 4 74 94 167 261 5 18 23 16 33 49 56 106 162 2 3 55 96 192 288 11 18 29 17 35 52 62 290 352 4 4 86 51 84 135 14 22 36 15 26 41 85 163 248 2 3 57 141 140 281 13 18 31 19 39 58 137 154 291 4 4 8Total 605 919 1524 79 126 205 138 196 334 682 1137 1819 21 27 48
3554 Nucleic Acids Research 2004 Vol 32 No 12
from the genetic linkage maps was similar to that from thephysical maps Between the two methods 3025 marker lociwere physically localized on wheat chromosomes that corre-sponded to 1931 unique gene loci (Figure 1 Table 1) Of these94 mapped within the 48 GRRs The remaining 6 werepresent in small groups of one to four markers separated bymore than one deletion breakpoints
Gene distribution
The number and location of GRRs was different among wheatchromosomes (Figure 1 and Table 1) Twenty-one GRRs werepresent on the short arms and contained 35 of the wheatgenes The remaining 27 GRRs were present on the long armsand contained about 59 of the genes (Table 1) The numberof GRRs per chromosome varied from five (groups 4 and 6) toeight (Groups 1 5 and 7) Essentially no GRR was observed inthe centromeric regions of the chromosomes Only one smallGRR (lsquo7L01rsquo) containing 4 of the armrsquos genes was observedin the proximal 20 of any chromosome In general GRRspresent in the distal regions were relatively higher in genedensity More than 80 of the total marker loci mapped inthe distal half of the chromosomes and 58 mapped in thedistal 20 (Figure 1 and Table 1)
Significant differences were observed among GRRs formarker number marker density and the size The 48 GRRsencompassed about 1554 Mb that is equivalent to 29 of thewheat genome (Table 1) Gene density and number in18 GRRs was very high (major GRRs) (underlined inTable 1 and Figure 1) These major GRRs contained nearly60 of the wheat genes but covered only 11 of the genomeThe gene number and density was variable even among thesemajor GRRs Five of these (lsquo1S08rsquo lsquo2L10rsquo lsquo4S07rsquo lsquo6S10rsquoand lsquo6L09rsquo) contained 26 of the wheat genes but spannedonly 3 of the genome On the contrary four minor GRRs(lsquo1S04rsquo lsquo2L03rsquo lsquo5S04rsquo and lsquo7L01rsquo) contained only 2 ofthe wheat genes but covered gt2 of the genome Estimatedsizes of GRRs varied from 3 Mb for lsquo1S04rsquo to 71 Mb forlsquo3L09rsquo with an average of 32 Mb The total region spannedby GRRs ranged from 119 Mb for group 1 to 288 Mb forgroup 5 Number of genes in a GRR varied from 4 of the armin lsquo7L01rsquo to 82 in lsquo6S10rsquo Gene density varied as much as70-fold among GRRs with a range from a gene per 78 kb inlsquo1S08rsquo to 5500 kb in lsquo7L01rsquo Gene distribution even withinGRRs appeared to be uneven The lsquo1L09rsquo region is presentbetween FLs 084 and 09 Of the total 22 markers present inthe region 16 mapped between FL 084 and 085 one betweenFL 085 and 089 and five between FL 089 and 09
Physical mapping of phenotypic markers
The 269 phenotypic markers mapped in this study included80 monogenically inherited wheat disease resistance genes and17 QTLs (Figure 1 and Table 1) Some of the other usefulgenes were Eps (earliness per se) Hd (awnedness) Kr (cross-ibility) Ph1 plant height male sterility and ear morphologygenes (36) Of the 269 phenotypic markers and useful genes159 were reliably located on the consensus genetic maps(colored red Figure 1) The remaining 93 genes were placedon the consensus genetic maps because of their close associa-tion (lt5 cM) with one or more markers The 17 QTLs werelocated to 10 cM intervals on the consensus linkage map asT
ab
le3
S
um
mar
yo
fth
ep
hy
sica
lly
map
ped
wh
eat
loci
on
ho
mo
eolo
go
us
gro
ups
Chro
mo
som
e
gro
up
s
AB
DA
BB
DA
DA
BD
LN
o
PL
PL
PL
PL
PL
PL
PL
To
tal
AT
ota
lB
To
tal
CT
ota
lP
ML
To
tal
PM
LC
AG
ran
dto
tal
18
92
67
36
19
38
12
99
23
23
33
10
21
34
11
23
48
11
74
65
24
51
35
36
14
28
51
01
18
89
95
47
07
31
97
20
74
04
36
72
01
91
87
14
11
22
77
10
10
55
94
93
90
27
71
44
42
14
17
51
48
10
20
00
88
33
11
29
34
28
91
13
82
29
51
09
32
71
53
04
69
21
12
22
52
55
55
51
31
31
60
22
51
79
56
41
06
67
06
33
99
51
01
73
41
12
26
61
91
92
02
05
57
48
12
10
14
03
50
76
82
04
12
24
11
22
24
48
19
19
19
19
13
13
12
31
10
11
63
49
13
74
86
To
tal
42
81
28
45
11
02
12
42
48
63
12
67
57
51
37
13
76
46
46
17
74
06
79
20
36
98
93
02
5
P
pro
be
L
loci
P
ML
p
hy
sica
lly
map
ped
loci
P
ML
CA
p
hy
sica
lly
map
ped
loci
by
com
par
ativ
ean
alysi
sA
ctu
allo
cin
um
ber
may
be
incr
ease
d2
2
fold
Nucleic Acids Research 2004 Vol 32 No 12 3555
their precise location within the intervals was not knownThese 93 genes and 17 QTLs are colored green in Figure 1With an average of 36 the number of phenotypic markersvaried from 29 for group 4 to 44 for group 1 Comparisonof the genetic with the physical consensus maps localized 258of the 269 phenotypic markers and useful genes to 37 GRRs
The highest number (32) of phenotypic markers was observedfor the lsquo1S08rsquo region The 11 GRRs that lacked phenotypicmarkers were present in the proximal regions of the chromo-somes (Figure 1 and Table 1) The genes mapping in the non-GRR regions are Per1 Hk1 Lr35 Xksu905 (Wip) Lr25 Lr9Pm7 Lr30 Xwsu4 (Dor4) tav1933 (Vdoc) and v1
3556 Nucleic Acids Research 2004 Vol 32 No 12
Distribution of recombination
Comparison of the consensus physical and genetic linkagemaps via 428 common markers provided a detailed andaccurate estimate of recombination at a sub-regional level(Figure 1) In general a severe suppression of recombinationwas observed in the centromeric regions of the wheat
chromosomes (Figure 1) One-fourth of the wheat genomepresent around the centromeres accounted for lt1 of thetotal recombination Nearly perfect linkage was observedamong markers present on different arms of a chromosomeFor example markers Xcdo618 (lsquo1S04rsquo) and Xcdo98(lsquo1L02rsquo) were physically separated by one-fourth ofthe chromosomal length but were lt2 cM apart Due to the
Nucleic Acids Research 2004 Vol 32 No 12 3557
lack of recombination in the proximal regions a large num-ber of markers clustered in the centromeric regions of thelinkage maps (Figure 1)
The gene-poor regions accounted for only 5 of therecombination as 95 of the recombination was observedin the GRRs (Figure 1 and Table 1) Markers present intwo different GRRs separated by a gene-poor region were
usually tightly linked on the genetic linkage map For exam-ple no recombination was observed between markers Xwg789(lsquo1S06rsquo) and Xcdo618 (lsquo1S04rsquo) Similarly markers XksuD22(lsquo2L08rsquo) and Xcdo373 (lsquo2L10rsquo) were inseparable on thegenetic linkage map even though these were physically separ-ated by 20 of the armrsquos length (Figure 1) Maximumrecombination observed in a gene-poor region was for the
3558 Nucleic Acids Research 2004 Vol 32 No 12
region between lsquo4S09rsquo and lsquo4S07rsquo that accounted for 12of the armrsquos recombination Recombination occurring in theGRRs varied from 90 for group 4 to 985 for groups 6 and7 The chromosome 3L GRRs accounted for almost 100 ofthe armrsquos recombination Among GRRs maximum geneticlength of 143 cM was observed for lsquo3L09rsquo and minimumof 1 cM was for lsquo1S04rsquo region (Figure 1 and Table 1) Recom-bination rate for two GRRs (lsquo7L01rsquo and lsquo7L10rsquo) present on
the same chromosome arm was 53-fold different Only 1ndash3of the armrsquos recombination was observed for the GRRslsquo1L02rsquo and lsquo7L01rsquo (Figure 1)
Recombination in the distal chromosomal regions was muchhigher as compared to the proximal halves The recombinationrates among GRRs present in the distal half of the chromo-somes were however highly variable Recombination rates insome proximal GRRs were higher than in distal GRRs For
Nucleic Acids Research 2004 Vol 32 No 12 3559
example lsquo1L09rsquo region is proximal to lsquo1L10rsquo but is about5-fold higher in recombination (Figure 1) There are six otherexamples where recombination in the proximal GRRs is 38ndash325 higher compared to the distal GRRs (Figure 1)
In general the recombination rate in the smaller GRRsseemed higher as compared to the GRRs that encompassedlarger chromosomal regions The 10 Mb sized region
lsquo6S10rsquo had the highest percentage recombination per chromo-some arm (Table 1) Similarly the lsquo1S08rsquo region showed 86of the armrsquos recombination and is only 7 Mb in size On thecontrary a larger GRR lsquo4L05rsquo is 70 Mb but accounted forlt15 of the armrsquos recombination (Figure 1) As in the case oflsquo3L09rsquo this pattern of negative correlation between GRR sizeand recombination rate was not observed for some regions
3560 Nucleic Acids Research 2004 Vol 32 No 12
Comparisons of consensus physical and genetic linkagemaps showed that the ratio of physical to genetic distance(kbcM) varied as much as 140-fold among GRRs ThekbcM estimate ranged from 151 for lsquo1S08rsquo to 21687 forlsquo7S02rsquo with an average of 3381 (Figure 1 and Table 1) Inmost cases recombination rate was higher for GRRs with a
higher gene density although there were some exceptions Forexample gene density was relatively high in the GRR lsquo1S04rsquo(1 gene per 273 kb) but only 3 of the armrsquos recombination wasobserved in this region (Table 1) Similarly lsquo5S09rsquo region isrelatively low in gene density (1 gene per 2688 kb) but 60 ofthe armrsquos recombination occurred in this region
Nucleic Acids Research 2004 Vol 32 No 12 3561
Figure 1 (Group 1 to 7) Distribution of genes and recombination on wheat chromosomes Sizes of consensus chromosomes location and sizes of GRRs are drawn toscale based on the average size of the three homoeologous chromosomes for each homoeologous group (54) Names of the GRRs are given on the left side of aconsensus chromosome In the nomenclature of GRRs (eg lsquo1S08rsquo) the first digit represents wheat homoeologous group followed by the arm location either as shortarm (S) or long arm (L) The last two numeral numbers represent GRR location as fraction length (FL) of the chromosome (eg 08 for lsquo1S08rsquo) The flanking deletionlines for each GRR are shown in blue on the left side of a consensus physical chromosome Actual physical size (black) and the ratio of physical to genetic distance(red) for a region are given on the right hand side of a consensus chromosome Sizes (in Mb) of GRRs are calculated based on the cytological measurements(measurements of the region bracketed by the flanking deletion line breakpoints in comparison to the total chromosome size) and are drawn to scale Recombinationin a chromosomal region is calculated by comparing deletion line based physical map with the consensus genetic linkage map for each chromosome Flankingmarkers for each GRR are joined with dotted lines connecting physical and consensus genetic linkage maps On the consensus genetic linkage maps the genes forwhich exact location in reference to other markers was known are shown in red and the genesQTLs for which the location was imprecise are shown in green
fraction length for satellite F region not precisely marked by deletion lines C markers which were not flanked by the flanking deletion lines for the GRR butprobably are part of that region
3562 Nucleic Acids Research 2004 Vol 32 No 12
DISCUSSION
Gene-containing regions of wheat
The number of genes in most of the higher plants is expected tobe similar although variations due to ploidy changes areexpected The in silico approach based gene number estimatefor Arabidopsis is 25 000 and for rice ranges from 32 000 to50 000 (813) Accounting for polyploidy the correspondingnumber for wheat may be between 75 000 and 150 000 Usingthe average gene size of 25 kb that is found in rice only 12ndash24 (188ndash375 Mb) of the wheat genome is therefore expectedto contain genes The predicted number of genes in thesequenced eukaryotes dropped 2- to 3-fold with the availabil-ity of better computational and biological tools The humangenome once thought to have more than 100 000 genes con-tains 30 000 genes based on new stringent criteria andimproved gene-prediction programs Similarly the gene-con-taining fraction of the wheat genome may even be smaller thanthe above predictions Therefore precise localization anddemarcation of the gene-containing regions is particularlyimportant for wheat
Use of deletion lines to reveal the physical location of genemarkers and the approach to combine the mapping data of thethree homoeologs to generate a consensus map have beenshown previously (91026) Relative gene marker locationwas conserved among the three homoeologs even at the cur-rent density (Supplementary Figures AndashG) It was thereforepossible to construct consensus maps for the seven homoeo-logous groups The consensus maps had an average of 48 dele-tion breakpoints per chromosome group with a range from 40for group 3 to 58 for group 7 Based on the average chromo-some size of the homoeologs deletion breakpoints occurredevery 133 Mb for group 7 to 204 Mb for group 3 The break-points were two times more frequent around the GRRs thanrandomly expected once every 8 Mb Of the 334 deletions210 (63) occurred in the GRRs that encompassed 29 ofthe wheat genome (Table 1)
The distribution of genes on wheat chromosomes is strikingWheat chromosomes have regions of high gene density inter-spersed by vast expanses of unpopulated regions consisting ofrepeated DNA Based on the sample of 3025 gene loci 29 ofthe wheat genome contained 94 of the genes (Figure 1) Of the48 GRRs that were identified 18 were major spanning 11 ofthe genome but accounted for 60 of the genes All majorGRRs were present in the distal 35 of the chromosomes Thelong arms of wheat contained twice as many genes as the shortarms Of the total 94 genes present in GRRs 59 were presentin the 27 GRRs on the long arm and remaining in the 21 GRRs onthe short arms No significant correlation was observed betweenthe chromosome size and the gene fraction or the size of theGRRs For example group 3 has the largest chromosomesamong the wheat groups but contained only 13 of thewheat genes compared with group 5 chromosomes that con-tained 20 Roughly the gene fraction seemed to correlatewith the size of the GRRs The size of chromosomes encom-passing the GRRs is the largest for group 5 and the smallest forgroup 6 Correspondingly the gene fraction was the highest forgroup 5 and the lowest for group 6
The actual size of the GRRs may be smaller than that shownin Figure 1 because the accuracy of bracketing the GRRsis dependent upon the number of deletion breakpoints If
randomly occurring breakpoints of the 334 deletion linesare expected to occur every 16 Mb on the consensus physicalmap As mentioned earlier frequency of these chromosomalbreaks was about double in the GRRs Even with that fre-quency GRRs interspersed by lt8 Mb of gene-poor DNAwill not be resolved
As observed in wheat distribution of genes is uneven inother grass species as well In rice 20 of the genome hasnot been contigedsequenced in spite of extensive efforts (8)The unsequenced part of the genome is probably gene-poorAbout 21 of the sequenced portion of the rice genomecontains 40 of the genes (44) Translocation breakpoint-based physical maps showed that barley chromosomes arealso partitioned into gene-rich and gene-poor regions (45)Similarly in the smaller genome plant Arabidopsis genesare unevenly distributed on the chromosomes About 45of the genome accounts for about 25 000 genes with an averagegene size of 2 kb
Based on the expected size of the gene-containing fractiononly a small part of the currently demarcated GRRs is allegedto contain genes Assuming that the wheat genes may encom-pass only 188ndash375 Mb (12ndash24) of the genome the gene-containing fraction within the GRRs is predicted to be only12ndash24 The exact distribution of genes in the GRRs is notknown but preliminary results suggest that the GRRs mayfurther be partitioned into mini gene-rich and gene-poor com-partments Within the GRRs the estimated 75 000 to 150 000wheat genes are expected to occur every 10ndash20 kb Except forploidy differences the wheat and the barley genomes are verysimilar in gene synteny and composition An 11 Mbsequence for selected wheat and barley regions showed thatgene density within the GRRs may range from a gene every4ndash103 kb with an average of 10ndash20 kb (46ndash49) The size of thelsquogene-emptyrsquo blocks interspersed in these regions ranged from08 to 94 kb The largest contig among these wheat and barleyregions is 261 kb around the Mla locus (49) A 130 kb region inthe contig contained 23 genes with an average gene density ofa gene per 56 kb Size of the interspersing lsquogene-emptyrsquoregions ranged from a few hundred base pairs to 11 kbThe second region of high gene density was 40 kb longand contained 10 genes (a gene every 4 kb) The largestlsquogene-emptyrsquo region was 55 kb Another 60 kb barley contigspanned a 32 kb region around the bronze locus with a geneevery 32 kb (34) Very similar observations were made inother large genome grasses such as Triticum monococcumAegilops tauschii and maize (475051)
Localization of the gene containing regions of wheat isbased on studying gene distribution of 3025 gene loci bythree different methods (Table 2) Gene distribution by dele-tion-line-based physical mapping was very similar to thatrevealed by the comparative analysis between physical andconsensus genetic linkage maps Similarly distribution ofgene markers was comparable to that of phenotypically char-acterized genes Therefore we believe that the demarcationand distribution of genes given in Figure 1 is a good repres-entation of the wheat genome Since the current analysis wasbased on the study of 39ndash78 of the wheat genes relativenumbers among various GRRs may slightly vary with theanalysis of additional genes Considering the diversity andrandomness of the analyzed gene markers the size relativegene density and gene proportion are however not expected
Nucleic Acids Research 2004 Vol 32 No 12 3563
to change dramatically A probable exception might bemulticopy gene families that were not represented in thisstudy because of the technical difficulties The currentinterpretations will not hold true for the multicopy genes iftheir distribution is dramatically different from that of thesingle-copy genes
The presence of 6 of the genes in the gene-poor regionssuggests that additional yet smaller GRRs may exist that werenot identified during the current analysis Some genes wereobserved in the highly heterochromatic gene-poor regionsTwo cDNA clones mapped in the centromeric region ofwheat homoelogous group 1 chromosomes that is highly het-erochromatic and gene-poor Other such examples are genemarkers Xbcd1124 Xcdo1340 and Xpsr596 on chromosome1B Xpsr107 XunlBF483292 Xabg356 and Xbcd260 on group2 Xtam12 Xcdo681 Xbcd1278 Xbcd102 XksuI32 XksuF34Xksu609 Xcdo920 and Xwg222 on group 3 and Xbcd1092Xbcd734 Xcdo1337 and Xbcd1262 on group 4
Distribution of recombination
Recombination is highly uneven along the wheat chromo-somes (Figure 1) Recombination mainly occurred in the48 GRRs that accounted for 95 of the recombinationMore than 100-fold differences were however observed forthe rate of recombination among various GRRs A part of thisdifference seemed to be due to the suppression effect of cen-tromere on recombination Essentially no recombination wasobserved in the proximal 30 of the wheat chromosomesin spite of the presence of GRRs In group 7 chromosomeseg genetic distance between the GRRs lsquo7S02rsquo andlsquo7L08rsquo is only 7 cM The spanned region is gt50 of thechromosome and extended over three GRRs Most of thehighly recombinogenic GRRs were localized in the distalparts of the chromosomes but not all distal GRRs were highlyrecombinogenic Genetic distances spanned by lsquo2L08rsquo andlsquo6L07rsquo GRRs were lt5 cM
Recombination distribution within the GRRs is not knownbut the available data suggest that recombination is highlyasymmetrical even within the highly recombinogenicGRRs Analysis of a 1 Mb region of barley homoeologousto one of the most recombinogenic region of wheat (lsquo1S08rsquo)identified a 240 kb region spanning the Mla locus where norecombination was observed (32) Recombination differencesup to 10-fold were observed among different sectors of theremaining part of the region Similar observations have alsobeen made in other eukaryotes Distribution of recombinationhas been best studied on yeast chromosomes Measured at 1 kbresolution the average frequency of recombination was035 cMkb with a range of 0ndash2 cMkb (httpwwwyeast-genomeorg) Measured at a 150 kb interval recombinationwithin a 1 Mb region of rice ranged from 0 to 15cM eventhough the gene distribution was fairly even (44) (httprgpdnaaffrcgojpPublicdatahtml) The average frequencyof recombination in rice is 0003 cMkb with a range of0ndash006 cMkb (httprgpdnaaffrcgojpPublicdatahtml)Similarly in wheat at a resolution of 7 Mb the averagerecombination frequency was 00003 cMkb with a rangefrom 0 to 0007 cMkb Non-recombinogenic regions havebeen observed in yeast as well as in rice but the highestrate of recombination for a region appears to be 35-fold
less in rice It may be because the rice estimates were at150 kb resolution whereas the recombination hotspotsmay be much smaller in length In yeast there is a majorhotspot around PHO8 gene located on the distal end of chro-mosome IV where recombination is 2 cMkb (httpwwwyeastgenomeorg) A 194 bp region around the waxy(wx) locus of rice has a recombination rate of 006 cMkb thatis 20-fold higher than the genome average (52) Similarly a377 bp region of the maize genome has a recombination rate of002 cMkb that is about 30 times higher than the genomeaverage (3553)
SUPPLEMENTARY MATERIAL
Supplementary Material is available at NAR Online
ACKNOWLEDGEMENTS
A contribution of the Agriculture Research Center WashingtonState University Pullman WA Journal series No 0902-03This research project was supported by the US Department ofAgriculture-National Research Initiative (USDA-NRI) and theWSU Vogel Endowment Funds
REFERENCES
1 SearsER (1954) The aneuploids of common wheat Research Bulletin572 University of Missouri Agricultural Experiment Station pp 1ndash58
2 ArumuganathanK and EarleED (1991) Estimation of nuclear DNAcontent of plants by flow cytometry Plant Mol Biol Rep 9 229ndash241
3 FlavellRB BennettMD SmithJB and SmithDB (1974) Genomesize and the proportion of repeated nucleotide sequence DNA in plantsBiochem Genet 12 257ndash269
4 SandhuD and GillKS (2002) Gene-containing regions of wheat and theother grass genomes Plant Physiol 128 803ndash811
5 SidhuD and GillKS (2004) Distribution of genes and recombination inwheat and other eukaryotes Plant Cell Tissue Organ Cult in press
6 ClaytonWD (1981) Evolution and distribution of grassesAnn Missouri Bot Gard 69 5ndash14
7 KelloggE (1998) Relationships of cereal crops and other grassesProc Natl Acad Sci USA 95 2005ndash2010
8 GoffSA RickeD LanTH PrestingG WangR DunnMGlazebrookJ SessionsA OellerP VarmaH et al (2002) A draftsequence of the rice genome (Oryza sativa L ssp japonica) Science 29692ndash100
9 GillKS GillBS EndoTR and BoykoE (1996) Identification andhigh-density mapping of gene-rich regions in chromosome group 5of wheat Genetics 143 1001ndash1012
10 SandhuD ChampouxJA BondarevaSN and GillKS (2001)Identification and physical localization of useful genes and markers to amajor gene-rich region on wheat group 1S chromosomes Genetics 1571735ndash1747
11 AkhunovED GoodyearAW GengS QiLL EchalierB GillBSMiftahudin GustafsonJP LazoG ChaoS et al (2003) Theorganization and rate of evolution of wheat genomes are correlatedwith recombination rates along chromosome arms Genome Res13 753ndash763
12 BarakatACarelsN and BernardiG (1997) The distribution of genes inthe genome of Gramineae Proc Natl Acad Sci USA 94 6857ndash6861
13 TAGI (2000) Analysis of the genome sequence of the floweringplant Arabidopsis thaliana Nature 408 796ndash815
14 BarakatA HanDT BenslimaneA RodeA and BernardiG (1999)The gene distribution in the genomes of pea tomato and date palmFEBS Lett 463 139ndash142
3564 Nucleic Acids Research 2004 Vol 32 No 12
15 SumnerAT TorreJDL and StuppiaL (1993) The distribution ofgenes on chromosomes A cytological approach J Mol Evol 37117ndash122
16 ClayO and BernardiG (2001) The isochores in human chromosome 21and 22 Biochem Biophys Res Commun 285 855ndash856
17 JabbariK and BernardiG (2000) The distribution of genes in drosophilagenome Gene 18 1859ndash1867
18 LanderES LintonLM BirrenB NusbaumC ZodyMCBaldwinJ DevonK DewarK DoyleM FitzHughW et al (2001)Initial sequencing and analysis of the human genome Nature 409860ndash921
19 McPhersonJD MarraM HillierL WaterstonRH ChinwallaAWallisJ SekhonM WylieK MardisER WilsonRK et al (2001)A physical map of the human genome Nature 409 934ndash941
20 VenterJC AdamsMD MyersEW LiPW MuralRJSuttonGG SmithHO YandellM EvansCA HoltRA et al(2001) The sequence of the human genome Science 291 1304ndash1351
21 GillKS GillBS EndoTR and TaylorT (1996) Identificationand high-density mapping of gene-rich regions in chromosome group 1of wheat Genetics 144 1883ndash1891
22 SandhuD and GillKS (2002) Structural and functional organization ofthe lsquo1S08 gene-rich regionrsquo in the Triticeae Plant Mol Biol 48791ndash804
23 DvorakJ and ChenK-C (1984) Distribution of nonstructural variationbetween wheat cultivars along chromosome arm 6Bp evidence from thelinkage map and physical map of the arm Genetics 106 325ndash333
24 CurtisCA and LukaszewskiAJ (1991) Genetic linkage betweenC-bands and storage protein genes in chromosome 1B of tetraploid wheatTheor Appl Genet 81 245ndash252
25 WernerJE KotaRS and GillBS (1992) Distribution of telomericrepeats and their role in the healing of broken chromosome ends in wheatGenome 35 844ndash848
26 GillKS GillBS and EndoTR (1993) A chromosome region-specificmapping strategy reveals gene-rich telometric ends in wheatChromosoma 102 374ndash381
27 KotaRS GillKS GillBS and EndoTR (1993) A cytogeneticallybased physical map of chromosome 1B in common wheat Genome36 548ndash554
28 FarisJD HaenKM and GillBS (2000) Saturation mapping of agene-rich recombination hot spot region in wheat Genetics 154823ndash835
29 WengY TuleenNA and HartGE (2000) Extended physical maps anda consensus physical map of the homoeologous group-6 chromosomesof wheat (Triticum aestivum L em Thell) Theor Appl Genet 100519ndash527
30 TanksleySD GanalMW PrinceJP de VicenteMCBonierbaleMW BrounP FultonTM GiovannoniJJ GrandilloSMartinGB et al (1992) High density molecular linkage maps of thetomato and potato genomes Genetics 132 1141ndash1160
31 PuechbertyJ LaurentAM GimenezS BillaultA LaurentMEBCalendaA MarcaisB PradesC LoannouP YurovY et al (1999)Genetic and physical analyses of the centromeric and pericentromericregions of human chromosome 5 Recombination across 5cen Genomics56 274ndash287
32 WeiF Gobelman-WernerK MorrollSM KurthJ MaoLWingRA LeisterD Schulze-LefertP and WiseRP (1999)The Mla (powdery mildew) resistance cluster is associated withthree NBS-LRR gene families and suppressed recombination withina 240-kb DNA interval on chromosome 5S (1HS) of barley Genetics153 1929ndash1948
33 FeuilletC and KellerB (2002) Comparative genomics in the grassfamily molecular characterization of grass genome structure andevolution Ann Bot (Lond) 89 3ndash10
34 FuH ZhengZ and DoonerHK (2002) Recombination rates betweenadjacent genic and retrotransposon regions in maize vary by 2 ordersof magnitude Proc Natl Acad Sci USA 99 1082ndash1087
35 YaoH ZhouQ LiJ SmithH YandeauM NikolauBJ andSchnablePS (2002) Molecular characterization of meiotic
recombination across the 140-kb multigenic a1-sh2 interval of maizeProc Natl Acad Sci USA 99 6157ndash6162
36 AdamsMD CelnikerSE HoltRA EvansCA GocayneJDAmanatidesPG SchererSE LiPW HoskinsRA GalleRF et al(2000) The genome sequence of Drosophila melanogaster Science 2872185ndash2195
37 BoykoEV GillKS Mickelson-YoungL NasudaS RouppWJZiegleJN SinghS HassawiDS FritzAK NamuthD et al(1999) A high-density genetic linkage map of Aegilops tauschiithe D-genome progenitor of bread wheat Theor Appl Genet 9916ndash26
38 EndoTR (1982) Gametocidal chromosomes of three Aegilops speciesin common wheat Can J Genet Cytol 24 201ndash206
39 EndoTR MukaiY YamamotoM and GillBS (1991) Physicalmapping of a male-fertility gene of common wheat Jpn J Genet66 291ndash295
40 EndoTR and GillBS (1996) The deletion stocks of common wheatJ Hered 87 295ndash307
41 AndersonJA OgiharaY SorrellsME and TanksleySD (1992)Development of a chromosomal arm map for wheat based on RFLPmarkers Theor Appl Genet 83 1035ndash1043
42 SandhuD SidhuD and GillKS (2002) Identification of expressedsequence markers for a major gene-rich region of wheat chromosomegroup 1 using RNA fingerprinting-differential display Crop Sci 421285ndash1290
43 DilbirligiM EraymanM SandhuD SidhuD and GillKS (2004)Identification of wheat chromosomal regions containing expressedresistance genes Genetics 166 461ndash481
44 WuJ MaeharaT ShimokawaT YamamotoS HaradaCTakazakiY OnoN MukaiY KoikeK YazakiJ et al (2002) Acomprehensive rice transcript map containing 6591 expressed sequencetag sites Plant Cell 14 525ndash535
45 KunzelG KorzumL and MeisterA (2000) Cytologically integratedphysical restriction fragment length polymorphism maps for thebarley genome based on translocation breakpoints Genetics 154397ndash412
46 ShirasuK SchulmanAH LahayeT and Schulze-LefertP (2000) Acontiguous 66-kb barley DNA sequence provides evidence for reversiblegenome expansion Genome Res 10 908ndash915
47 WickerT SteinN AlbarL FeuilletC SchlagenhaufE and KellerB(2001) Analysis of a contiguous 211 kb sequence in diploid wheat(Triticum monococcum L) reveals multiple mechanisms of genomeevolution Plant J 26 307ndash316
48 BrueggemanR RostoksN KudrnaD KilianA HanF ChenJDrukaA SteffensonB and KleinhofsA (2002) The barley stem rust-resistance gene Rpg1 is a novel disease-resistance gene with homology toreceptor kinases Proc Natl Acad Sci USA 99 9328ndash9333
49 WeiF WingRA and WiseRP (2002) Genome dynamics andevolution of the Mla (powdery mildew) resistance locus in barley PlantCell 14 1903ndash1917
50 FeuilletC and KellerB (1999) High gene density is conserved atsyntenic loci of small and large grass genomes Proc Natl Acad SciUSA 96 8265ndash8270
51 TikhonovAP SanMiguelPJ NakajimaY GorensteinNMBennetzenJL and AvramovaZ (1999) Colinearity and its exceptions inorthologous adh regions of maize and sorghum Proc Natl Acad SciUSA 96 7409ndash7414
52 InukaiT SakoA HiranoHY and SanoY (2000) Analysis ofintragenic recombination at wx in rice Correlation between the molecularand genetic maps within the locus Genome 43 589ndash596
53 CivardiL XiaY EdwardsKJ SchnablePS and NikolauBJ (1994)The relationship between genetic and physical distances in thecloned a1-sh2 interval of the Zea mays L genome Proc Natl Acad SciUSA 91 8268ndash8272
54 GillBS FriebeB and EndoTR (1991) Standard karyotype andnomenclature system for description of chromosome bands andstructural aberrations in wheat (Triticum aestivum) Genome 34830ndash839
Nucleic Acids Research 2004 Vol 32 No 12 3565
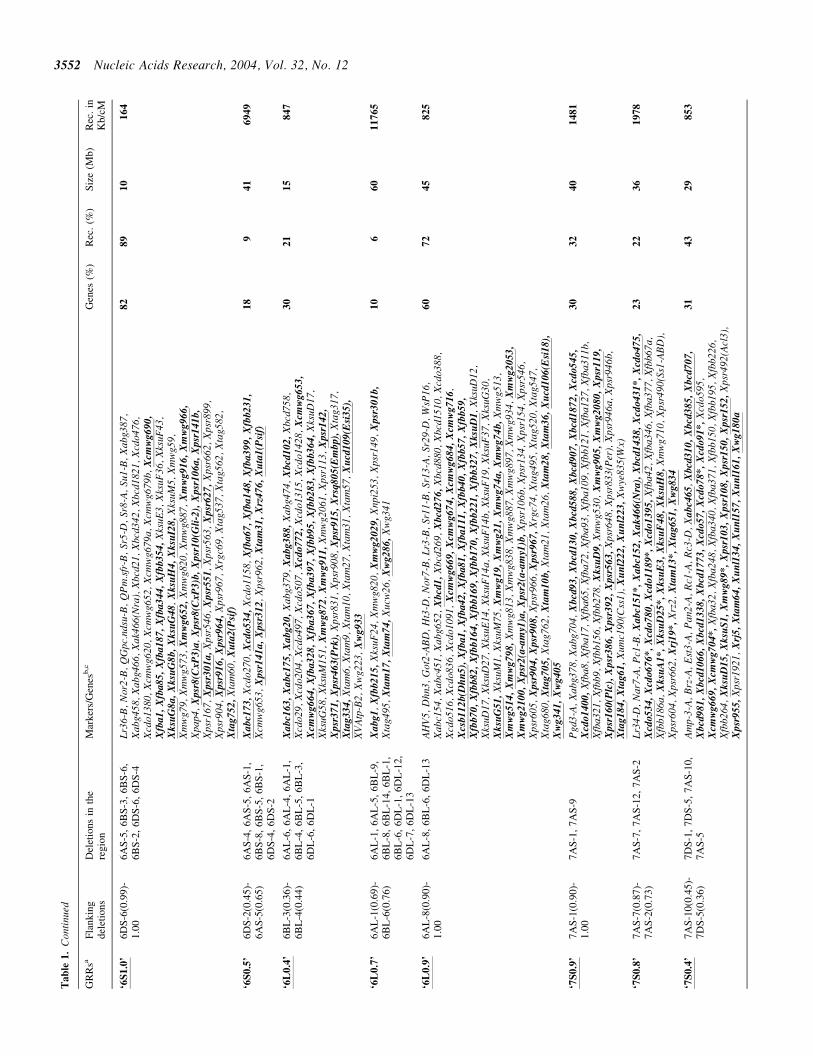
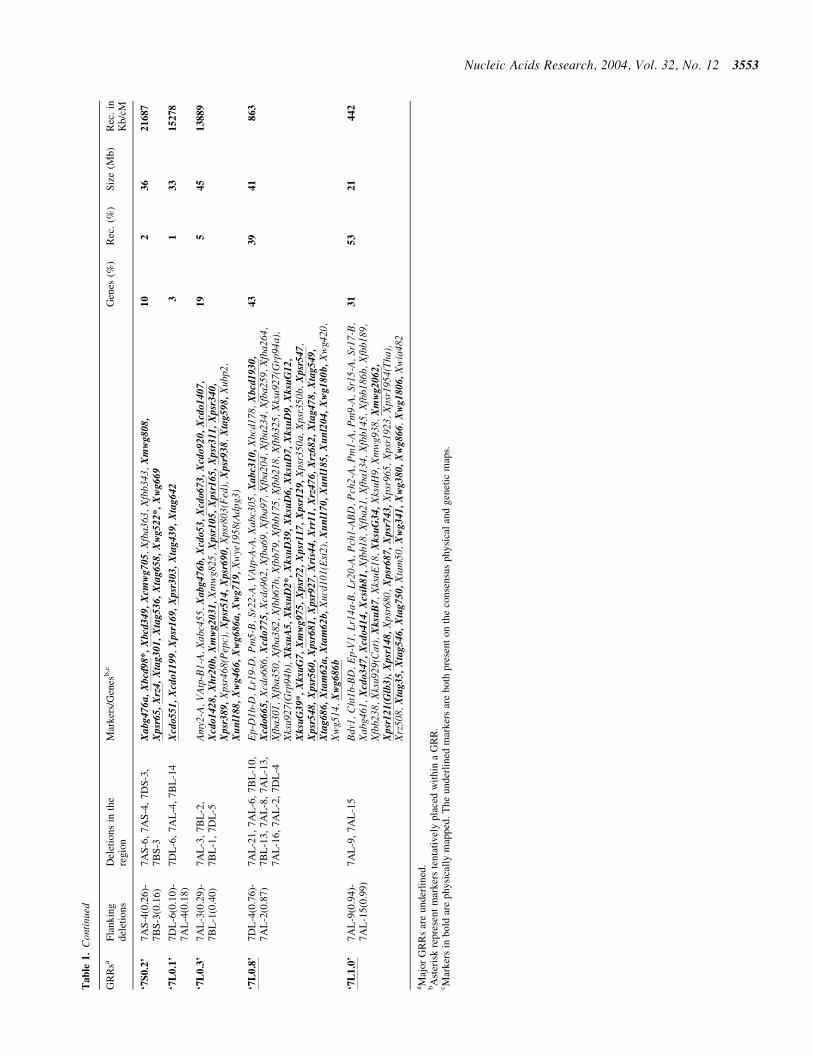
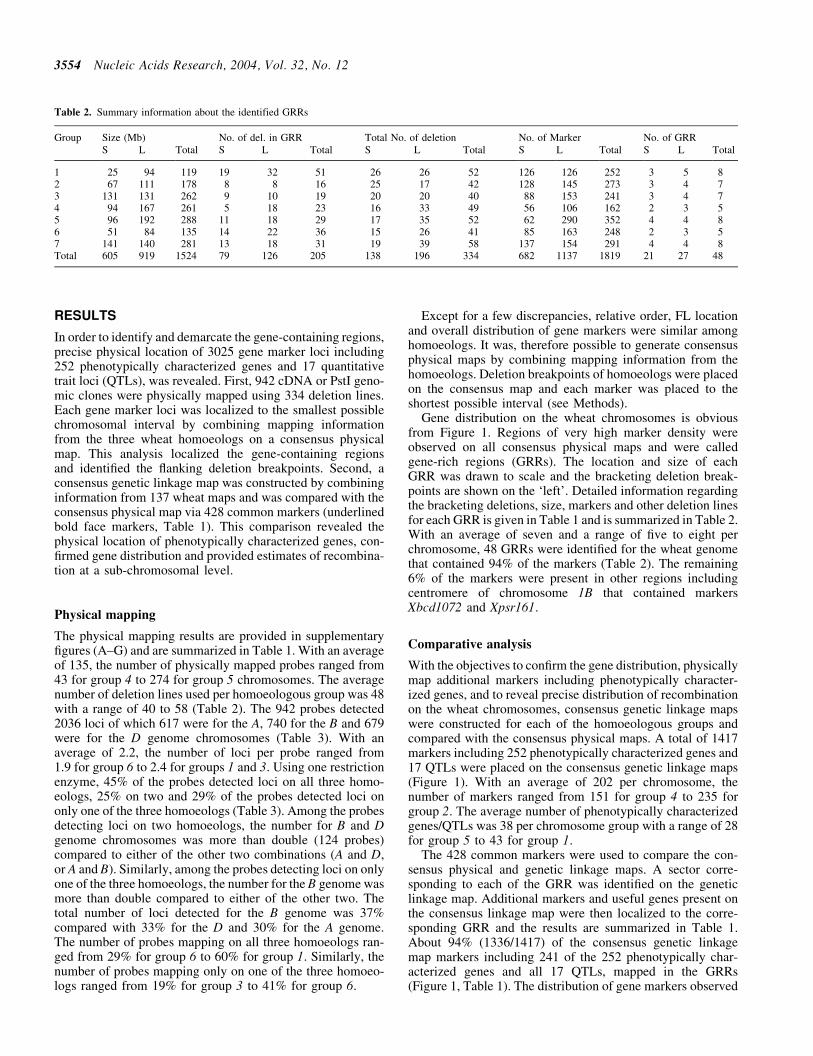
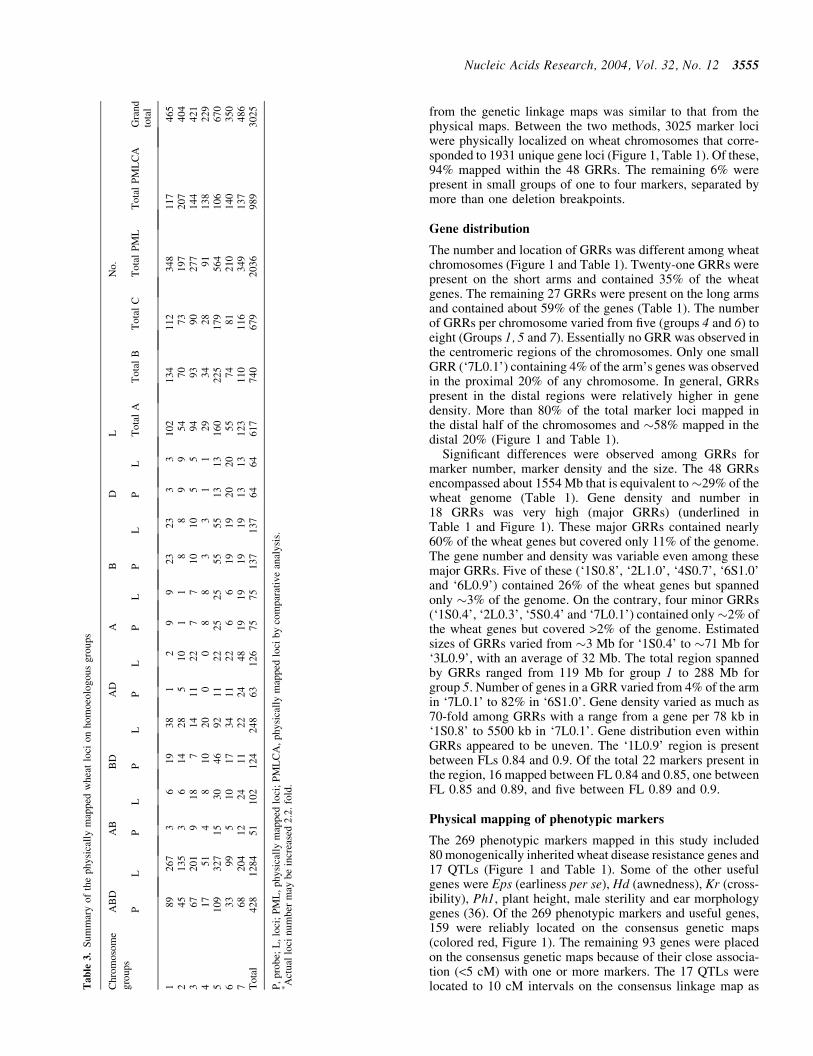
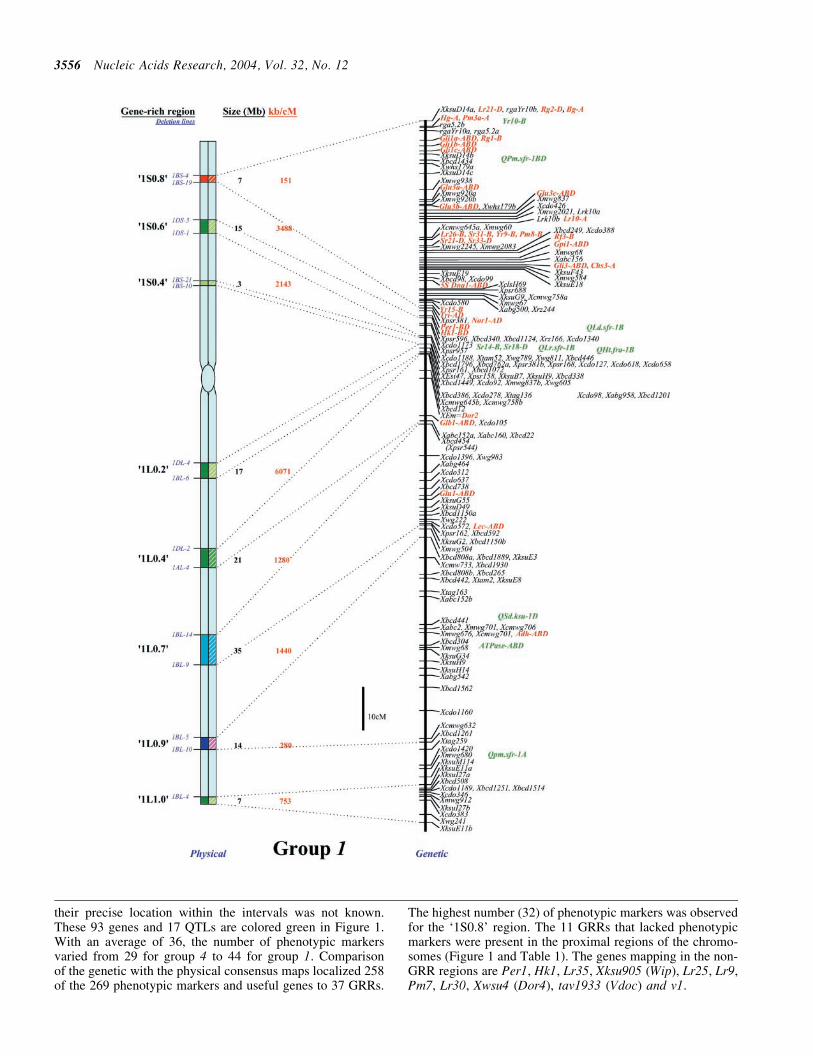
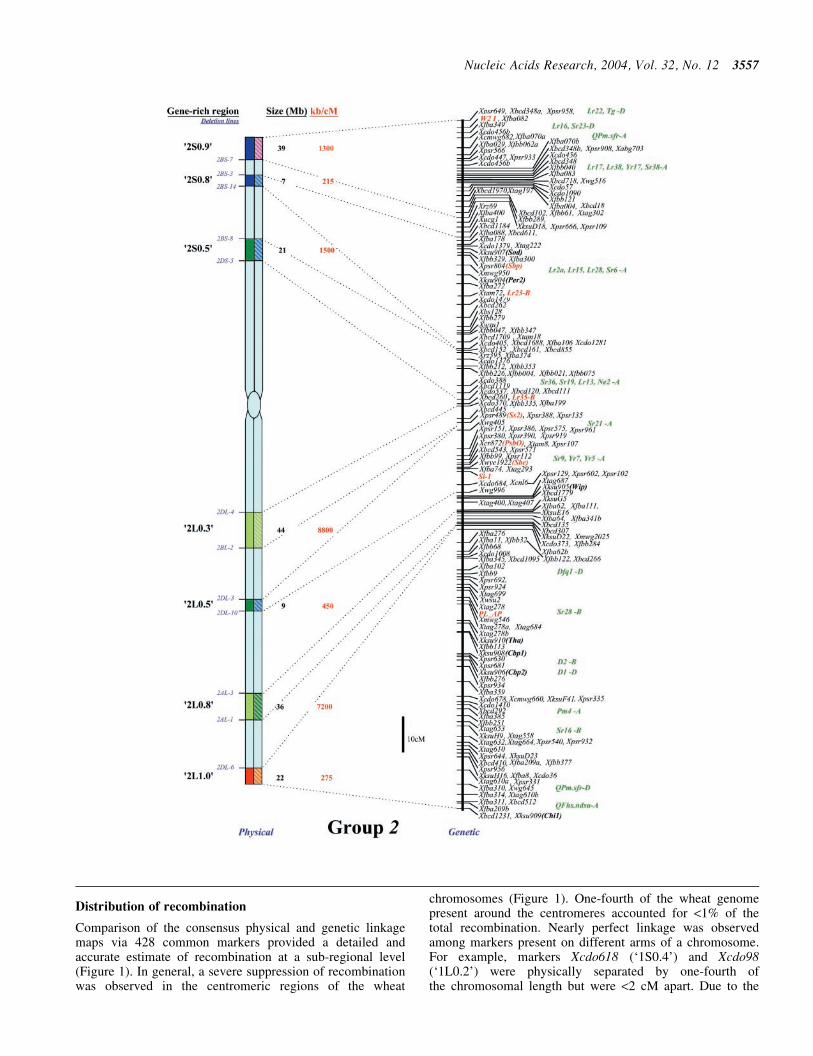
Distribution of recombination
Comparison of the consensus physical and genetic linkagemaps via 428 common markers provided a detailed andaccurate estimate of recombination at a sub-regional level(Figure 1) In general a severe suppression of recombinationwas observed in the centromeric regions of the wheat
chromosomes (Figure 1) One-fourth of the wheat genomepresent around the centromeres accounted for lt1 of thetotal recombination Nearly perfect linkage was observedamong markers present on different arms of a chromosomeFor example markers Xcdo618 (lsquo1S04rsquo) and Xcdo98(lsquo1L02rsquo) were physically separated by one-fourth ofthe chromosomal length but were lt2 cM apart Due to the
Nucleic Acids Research 2004 Vol 32 No 12 3557
lack of recombination in the proximal regions a large num-ber of markers clustered in the centromeric regions of thelinkage maps (Figure 1)
The gene-poor regions accounted for only 5 of therecombination as 95 of the recombination was observedin the GRRs (Figure 1 and Table 1) Markers present intwo different GRRs separated by a gene-poor region were
usually tightly linked on the genetic linkage map For exam-ple no recombination was observed between markers Xwg789(lsquo1S06rsquo) and Xcdo618 (lsquo1S04rsquo) Similarly markers XksuD22(lsquo2L08rsquo) and Xcdo373 (lsquo2L10rsquo) were inseparable on thegenetic linkage map even though these were physically separ-ated by 20 of the armrsquos length (Figure 1) Maximumrecombination observed in a gene-poor region was for the
3558 Nucleic Acids Research 2004 Vol 32 No 12
region between lsquo4S09rsquo and lsquo4S07rsquo that accounted for 12of the armrsquos recombination Recombination occurring in theGRRs varied from 90 for group 4 to 985 for groups 6 and7 The chromosome 3L GRRs accounted for almost 100 ofthe armrsquos recombination Among GRRs maximum geneticlength of 143 cM was observed for lsquo3L09rsquo and minimumof 1 cM was for lsquo1S04rsquo region (Figure 1 and Table 1) Recom-bination rate for two GRRs (lsquo7L01rsquo and lsquo7L10rsquo) present on
the same chromosome arm was 53-fold different Only 1ndash3of the armrsquos recombination was observed for the GRRslsquo1L02rsquo and lsquo7L01rsquo (Figure 1)
Recombination in the distal chromosomal regions was muchhigher as compared to the proximal halves The recombinationrates among GRRs present in the distal half of the chromo-somes were however highly variable Recombination rates insome proximal GRRs were higher than in distal GRRs For
Nucleic Acids Research 2004 Vol 32 No 12 3559
example lsquo1L09rsquo region is proximal to lsquo1L10rsquo but is about5-fold higher in recombination (Figure 1) There are six otherexamples where recombination in the proximal GRRs is 38ndash325 higher compared to the distal GRRs (Figure 1)
In general the recombination rate in the smaller GRRsseemed higher as compared to the GRRs that encompassedlarger chromosomal regions The 10 Mb sized region
lsquo6S10rsquo had the highest percentage recombination per chromo-some arm (Table 1) Similarly the lsquo1S08rsquo region showed 86of the armrsquos recombination and is only 7 Mb in size On thecontrary a larger GRR lsquo4L05rsquo is 70 Mb but accounted forlt15 of the armrsquos recombination (Figure 1) As in the case oflsquo3L09rsquo this pattern of negative correlation between GRR sizeand recombination rate was not observed for some regions
3560 Nucleic Acids Research 2004 Vol 32 No 12
Comparisons of consensus physical and genetic linkagemaps showed that the ratio of physical to genetic distance(kbcM) varied as much as 140-fold among GRRs ThekbcM estimate ranged from 151 for lsquo1S08rsquo to 21687 forlsquo7S02rsquo with an average of 3381 (Figure 1 and Table 1) Inmost cases recombination rate was higher for GRRs with a
higher gene density although there were some exceptions Forexample gene density was relatively high in the GRR lsquo1S04rsquo(1 gene per 273 kb) but only 3 of the armrsquos recombination wasobserved in this region (Table 1) Similarly lsquo5S09rsquo region isrelatively low in gene density (1 gene per 2688 kb) but 60 ofthe armrsquos recombination occurred in this region
Nucleic Acids Research 2004 Vol 32 No 12 3561
Figure 1 (Group 1 to 7) Distribution of genes and recombination on wheat chromosomes Sizes of consensus chromosomes location and sizes of GRRs are drawn toscale based on the average size of the three homoeologous chromosomes for each homoeologous group (54) Names of the GRRs are given on the left side of aconsensus chromosome In the nomenclature of GRRs (eg lsquo1S08rsquo) the first digit represents wheat homoeologous group followed by the arm location either as shortarm (S) or long arm (L) The last two numeral numbers represent GRR location as fraction length (FL) of the chromosome (eg 08 for lsquo1S08rsquo) The flanking deletionlines for each GRR are shown in blue on the left side of a consensus physical chromosome Actual physical size (black) and the ratio of physical to genetic distance(red) for a region are given on the right hand side of a consensus chromosome Sizes (in Mb) of GRRs are calculated based on the cytological measurements(measurements of the region bracketed by the flanking deletion line breakpoints in comparison to the total chromosome size) and are drawn to scale Recombinationin a chromosomal region is calculated by comparing deletion line based physical map with the consensus genetic linkage map for each chromosome Flankingmarkers for each GRR are joined with dotted lines connecting physical and consensus genetic linkage maps On the consensus genetic linkage maps the genes forwhich exact location in reference to other markers was known are shown in red and the genesQTLs for which the location was imprecise are shown in green
fraction length for satellite F region not precisely marked by deletion lines C markers which were not flanked by the flanking deletion lines for the GRR butprobably are part of that region
3562 Nucleic Acids Research 2004 Vol 32 No 12
DISCUSSION
Gene-containing regions of wheat
The number of genes in most of the higher plants is expected tobe similar although variations due to ploidy changes areexpected The in silico approach based gene number estimatefor Arabidopsis is 25 000 and for rice ranges from 32 000 to50 000 (813) Accounting for polyploidy the correspondingnumber for wheat may be between 75 000 and 150 000 Usingthe average gene size of 25 kb that is found in rice only 12ndash24 (188ndash375 Mb) of the wheat genome is therefore expectedto contain genes The predicted number of genes in thesequenced eukaryotes dropped 2- to 3-fold with the availabil-ity of better computational and biological tools The humangenome once thought to have more than 100 000 genes con-tains 30 000 genes based on new stringent criteria andimproved gene-prediction programs Similarly the gene-con-taining fraction of the wheat genome may even be smaller thanthe above predictions Therefore precise localization anddemarcation of the gene-containing regions is particularlyimportant for wheat
Use of deletion lines to reveal the physical location of genemarkers and the approach to combine the mapping data of thethree homoeologs to generate a consensus map have beenshown previously (91026) Relative gene marker locationwas conserved among the three homoeologs even at the cur-rent density (Supplementary Figures AndashG) It was thereforepossible to construct consensus maps for the seven homoeo-logous groups The consensus maps had an average of 48 dele-tion breakpoints per chromosome group with a range from 40for group 3 to 58 for group 7 Based on the average chromo-some size of the homoeologs deletion breakpoints occurredevery 133 Mb for group 7 to 204 Mb for group 3 The break-points were two times more frequent around the GRRs thanrandomly expected once every 8 Mb Of the 334 deletions210 (63) occurred in the GRRs that encompassed 29 ofthe wheat genome (Table 1)
The distribution of genes on wheat chromosomes is strikingWheat chromosomes have regions of high gene density inter-spersed by vast expanses of unpopulated regions consisting ofrepeated DNA Based on the sample of 3025 gene loci 29 ofthe wheat genome contained 94 of the genes (Figure 1) Of the48 GRRs that were identified 18 were major spanning 11 ofthe genome but accounted for 60 of the genes All majorGRRs were present in the distal 35 of the chromosomes Thelong arms of wheat contained twice as many genes as the shortarms Of the total 94 genes present in GRRs 59 were presentin the 27 GRRs on the long arm and remaining in the 21 GRRs onthe short arms No significant correlation was observed betweenthe chromosome size and the gene fraction or the size of theGRRs For example group 3 has the largest chromosomesamong the wheat groups but contained only 13 of thewheat genes compared with group 5 chromosomes that con-tained 20 Roughly the gene fraction seemed to correlatewith the size of the GRRs The size of chromosomes encom-passing the GRRs is the largest for group 5 and the smallest forgroup 6 Correspondingly the gene fraction was the highest forgroup 5 and the lowest for group 6
The actual size of the GRRs may be smaller than that shownin Figure 1 because the accuracy of bracketing the GRRsis dependent upon the number of deletion breakpoints If
randomly occurring breakpoints of the 334 deletion linesare expected to occur every 16 Mb on the consensus physicalmap As mentioned earlier frequency of these chromosomalbreaks was about double in the GRRs Even with that fre-quency GRRs interspersed by lt8 Mb of gene-poor DNAwill not be resolved
As observed in wheat distribution of genes is uneven inother grass species as well In rice 20 of the genome hasnot been contigedsequenced in spite of extensive efforts (8)The unsequenced part of the genome is probably gene-poorAbout 21 of the sequenced portion of the rice genomecontains 40 of the genes (44) Translocation breakpoint-based physical maps showed that barley chromosomes arealso partitioned into gene-rich and gene-poor regions (45)Similarly in the smaller genome plant Arabidopsis genesare unevenly distributed on the chromosomes About 45of the genome accounts for about 25 000 genes with an averagegene size of 2 kb
Based on the expected size of the gene-containing fractiononly a small part of the currently demarcated GRRs is allegedto contain genes Assuming that the wheat genes may encom-pass only 188ndash375 Mb (12ndash24) of the genome the gene-containing fraction within the GRRs is predicted to be only12ndash24 The exact distribution of genes in the GRRs is notknown but preliminary results suggest that the GRRs mayfurther be partitioned into mini gene-rich and gene-poor com-partments Within the GRRs the estimated 75 000 to 150 000wheat genes are expected to occur every 10ndash20 kb Except forploidy differences the wheat and the barley genomes are verysimilar in gene synteny and composition An 11 Mbsequence for selected wheat and barley regions showed thatgene density within the GRRs may range from a gene every4ndash103 kb with an average of 10ndash20 kb (46ndash49) The size of thelsquogene-emptyrsquo blocks interspersed in these regions ranged from08 to 94 kb The largest contig among these wheat and barleyregions is 261 kb around the Mla locus (49) A 130 kb region inthe contig contained 23 genes with an average gene density ofa gene per 56 kb Size of the interspersing lsquogene-emptyrsquoregions ranged from a few hundred base pairs to 11 kbThe second region of high gene density was 40 kb longand contained 10 genes (a gene every 4 kb) The largestlsquogene-emptyrsquo region was 55 kb Another 60 kb barley contigspanned a 32 kb region around the bronze locus with a geneevery 32 kb (34) Very similar observations were made inother large genome grasses such as Triticum monococcumAegilops tauschii and maize (475051)
Localization of the gene containing regions of wheat isbased on studying gene distribution of 3025 gene loci bythree different methods (Table 2) Gene distribution by dele-tion-line-based physical mapping was very similar to thatrevealed by the comparative analysis between physical andconsensus genetic linkage maps Similarly distribution ofgene markers was comparable to that of phenotypically char-acterized genes Therefore we believe that the demarcationand distribution of genes given in Figure 1 is a good repres-entation of the wheat genome Since the current analysis wasbased on the study of 39ndash78 of the wheat genes relativenumbers among various GRRs may slightly vary with theanalysis of additional genes Considering the diversity andrandomness of the analyzed gene markers the size relativegene density and gene proportion are however not expected
Nucleic Acids Research 2004 Vol 32 No 12 3563
to change dramatically A probable exception might bemulticopy gene families that were not represented in thisstudy because of the technical difficulties The currentinterpretations will not hold true for the multicopy genes iftheir distribution is dramatically different from that of thesingle-copy genes
The presence of 6 of the genes in the gene-poor regionssuggests that additional yet smaller GRRs may exist that werenot identified during the current analysis Some genes wereobserved in the highly heterochromatic gene-poor regionsTwo cDNA clones mapped in the centromeric region ofwheat homoelogous group 1 chromosomes that is highly het-erochromatic and gene-poor Other such examples are genemarkers Xbcd1124 Xcdo1340 and Xpsr596 on chromosome1B Xpsr107 XunlBF483292 Xabg356 and Xbcd260 on group2 Xtam12 Xcdo681 Xbcd1278 Xbcd102 XksuI32 XksuF34Xksu609 Xcdo920 and Xwg222 on group 3 and Xbcd1092Xbcd734 Xcdo1337 and Xbcd1262 on group 4
Distribution of recombination
Recombination is highly uneven along the wheat chromo-somes (Figure 1) Recombination mainly occurred in the48 GRRs that accounted for 95 of the recombinationMore than 100-fold differences were however observed forthe rate of recombination among various GRRs A part of thisdifference seemed to be due to the suppression effect of cen-tromere on recombination Essentially no recombination wasobserved in the proximal 30 of the wheat chromosomesin spite of the presence of GRRs In group 7 chromosomeseg genetic distance between the GRRs lsquo7S02rsquo andlsquo7L08rsquo is only 7 cM The spanned region is gt50 of thechromosome and extended over three GRRs Most of thehighly recombinogenic GRRs were localized in the distalparts of the chromosomes but not all distal GRRs were highlyrecombinogenic Genetic distances spanned by lsquo2L08rsquo andlsquo6L07rsquo GRRs were lt5 cM
Recombination distribution within the GRRs is not knownbut the available data suggest that recombination is highlyasymmetrical even within the highly recombinogenicGRRs Analysis of a 1 Mb region of barley homoeologousto one of the most recombinogenic region of wheat (lsquo1S08rsquo)identified a 240 kb region spanning the Mla locus where norecombination was observed (32) Recombination differencesup to 10-fold were observed among different sectors of theremaining part of the region Similar observations have alsobeen made in other eukaryotes Distribution of recombinationhas been best studied on yeast chromosomes Measured at 1 kbresolution the average frequency of recombination was035 cMkb with a range of 0ndash2 cMkb (httpwwwyeast-genomeorg) Measured at a 150 kb interval recombinationwithin a 1 Mb region of rice ranged from 0 to 15cM eventhough the gene distribution was fairly even (44) (httprgpdnaaffrcgojpPublicdatahtml) The average frequencyof recombination in rice is 0003 cMkb with a range of0ndash006 cMkb (httprgpdnaaffrcgojpPublicdatahtml)Similarly in wheat at a resolution of 7 Mb the averagerecombination frequency was 00003 cMkb with a rangefrom 0 to 0007 cMkb Non-recombinogenic regions havebeen observed in yeast as well as in rice but the highestrate of recombination for a region appears to be 35-fold
less in rice It may be because the rice estimates were at150 kb resolution whereas the recombination hotspotsmay be much smaller in length In yeast there is a majorhotspot around PHO8 gene located on the distal end of chro-mosome IV where recombination is 2 cMkb (httpwwwyeastgenomeorg) A 194 bp region around the waxy(wx) locus of rice has a recombination rate of 006 cMkb thatis 20-fold higher than the genome average (52) Similarly a377 bp region of the maize genome has a recombination rate of002 cMkb that is about 30 times higher than the genomeaverage (3553)
SUPPLEMENTARY MATERIAL
Supplementary Material is available at NAR Online
ACKNOWLEDGEMENTS
A contribution of the Agriculture Research Center WashingtonState University Pullman WA Journal series No 0902-03This research project was supported by the US Department ofAgriculture-National Research Initiative (USDA-NRI) and theWSU Vogel Endowment Funds
REFERENCES
1 SearsER (1954) The aneuploids of common wheat Research Bulletin572 University of Missouri Agricultural Experiment Station pp 1ndash58
2 ArumuganathanK and EarleED (1991) Estimation of nuclear DNAcontent of plants by flow cytometry Plant Mol Biol Rep 9 229ndash241
3 FlavellRB BennettMD SmithJB and SmithDB (1974) Genomesize and the proportion of repeated nucleotide sequence DNA in plantsBiochem Genet 12 257ndash269
4 SandhuD and GillKS (2002) Gene-containing regions of wheat and theother grass genomes Plant Physiol 128 803ndash811
5 SidhuD and GillKS (2004) Distribution of genes and recombination inwheat and other eukaryotes Plant Cell Tissue Organ Cult in press
6 ClaytonWD (1981) Evolution and distribution of grassesAnn Missouri Bot Gard 69 5ndash14
7 KelloggE (1998) Relationships of cereal crops and other grassesProc Natl Acad Sci USA 95 2005ndash2010
8 GoffSA RickeD LanTH PrestingG WangR DunnMGlazebrookJ SessionsA OellerP VarmaH et al (2002) A draftsequence of the rice genome (Oryza sativa L ssp japonica) Science 29692ndash100
9 GillKS GillBS EndoTR and BoykoE (1996) Identification andhigh-density mapping of gene-rich regions in chromosome group 5of wheat Genetics 143 1001ndash1012
10 SandhuD ChampouxJA BondarevaSN and GillKS (2001)Identification and physical localization of useful genes and markers to amajor gene-rich region on wheat group 1S chromosomes Genetics 1571735ndash1747
11 AkhunovED GoodyearAW GengS QiLL EchalierB GillBSMiftahudin GustafsonJP LazoG ChaoS et al (2003) Theorganization and rate of evolution of wheat genomes are correlatedwith recombination rates along chromosome arms Genome Res13 753ndash763
12 BarakatACarelsN and BernardiG (1997) The distribution of genes inthe genome of Gramineae Proc Natl Acad Sci USA 94 6857ndash6861
13 TAGI (2000) Analysis of the genome sequence of the floweringplant Arabidopsis thaliana Nature 408 796ndash815
14 BarakatA HanDT BenslimaneA RodeA and BernardiG (1999)The gene distribution in the genomes of pea tomato and date palmFEBS Lett 463 139ndash142
3564 Nucleic Acids Research 2004 Vol 32 No 12
15 SumnerAT TorreJDL and StuppiaL (1993) The distribution ofgenes on chromosomes A cytological approach J Mol Evol 37117ndash122
16 ClayO and BernardiG (2001) The isochores in human chromosome 21and 22 Biochem Biophys Res Commun 285 855ndash856
17 JabbariK and BernardiG (2000) The distribution of genes in drosophilagenome Gene 18 1859ndash1867
18 LanderES LintonLM BirrenB NusbaumC ZodyMCBaldwinJ DevonK DewarK DoyleM FitzHughW et al (2001)Initial sequencing and analysis of the human genome Nature 409860ndash921
19 McPhersonJD MarraM HillierL WaterstonRH ChinwallaAWallisJ SekhonM WylieK MardisER WilsonRK et al (2001)A physical map of the human genome Nature 409 934ndash941
20 VenterJC AdamsMD MyersEW LiPW MuralRJSuttonGG SmithHO YandellM EvansCA HoltRA et al(2001) The sequence of the human genome Science 291 1304ndash1351
21 GillKS GillBS EndoTR and TaylorT (1996) Identificationand high-density mapping of gene-rich regions in chromosome group 1of wheat Genetics 144 1883ndash1891
22 SandhuD and GillKS (2002) Structural and functional organization ofthe lsquo1S08 gene-rich regionrsquo in the Triticeae Plant Mol Biol 48791ndash804
23 DvorakJ and ChenK-C (1984) Distribution of nonstructural variationbetween wheat cultivars along chromosome arm 6Bp evidence from thelinkage map and physical map of the arm Genetics 106 325ndash333
24 CurtisCA and LukaszewskiAJ (1991) Genetic linkage betweenC-bands and storage protein genes in chromosome 1B of tetraploid wheatTheor Appl Genet 81 245ndash252
25 WernerJE KotaRS and GillBS (1992) Distribution of telomericrepeats and their role in the healing of broken chromosome ends in wheatGenome 35 844ndash848
26 GillKS GillBS and EndoTR (1993) A chromosome region-specificmapping strategy reveals gene-rich telometric ends in wheatChromosoma 102 374ndash381
27 KotaRS GillKS GillBS and EndoTR (1993) A cytogeneticallybased physical map of chromosome 1B in common wheat Genome36 548ndash554
28 FarisJD HaenKM and GillBS (2000) Saturation mapping of agene-rich recombination hot spot region in wheat Genetics 154823ndash835
29 WengY TuleenNA and HartGE (2000) Extended physical maps anda consensus physical map of the homoeologous group-6 chromosomesof wheat (Triticum aestivum L em Thell) Theor Appl Genet 100519ndash527
30 TanksleySD GanalMW PrinceJP de VicenteMCBonierbaleMW BrounP FultonTM GiovannoniJJ GrandilloSMartinGB et al (1992) High density molecular linkage maps of thetomato and potato genomes Genetics 132 1141ndash1160
31 PuechbertyJ LaurentAM GimenezS BillaultA LaurentMEBCalendaA MarcaisB PradesC LoannouP YurovY et al (1999)Genetic and physical analyses of the centromeric and pericentromericregions of human chromosome 5 Recombination across 5cen Genomics56 274ndash287
32 WeiF Gobelman-WernerK MorrollSM KurthJ MaoLWingRA LeisterD Schulze-LefertP and WiseRP (1999)The Mla (powdery mildew) resistance cluster is associated withthree NBS-LRR gene families and suppressed recombination withina 240-kb DNA interval on chromosome 5S (1HS) of barley Genetics153 1929ndash1948
33 FeuilletC and KellerB (2002) Comparative genomics in the grassfamily molecular characterization of grass genome structure andevolution Ann Bot (Lond) 89 3ndash10
34 FuH ZhengZ and DoonerHK (2002) Recombination rates betweenadjacent genic and retrotransposon regions in maize vary by 2 ordersof magnitude Proc Natl Acad Sci USA 99 1082ndash1087
35 YaoH ZhouQ LiJ SmithH YandeauM NikolauBJ andSchnablePS (2002) Molecular characterization of meiotic
recombination across the 140-kb multigenic a1-sh2 interval of maizeProc Natl Acad Sci USA 99 6157ndash6162
36 AdamsMD CelnikerSE HoltRA EvansCA GocayneJDAmanatidesPG SchererSE LiPW HoskinsRA GalleRF et al(2000) The genome sequence of Drosophila melanogaster Science 2872185ndash2195
37 BoykoEV GillKS Mickelson-YoungL NasudaS RouppWJZiegleJN SinghS HassawiDS FritzAK NamuthD et al(1999) A high-density genetic linkage map of Aegilops tauschiithe D-genome progenitor of bread wheat Theor Appl Genet 9916ndash26
38 EndoTR (1982) Gametocidal chromosomes of three Aegilops speciesin common wheat Can J Genet Cytol 24 201ndash206
39 EndoTR MukaiY YamamotoM and GillBS (1991) Physicalmapping of a male-fertility gene of common wheat Jpn J Genet66 291ndash295
40 EndoTR and GillBS (1996) The deletion stocks of common wheatJ Hered 87 295ndash307
41 AndersonJA OgiharaY SorrellsME and TanksleySD (1992)Development of a chromosomal arm map for wheat based on RFLPmarkers Theor Appl Genet 83 1035ndash1043
42 SandhuD SidhuD and GillKS (2002) Identification of expressedsequence markers for a major gene-rich region of wheat chromosomegroup 1 using RNA fingerprinting-differential display Crop Sci 421285ndash1290
43 DilbirligiM EraymanM SandhuD SidhuD and GillKS (2004)Identification of wheat chromosomal regions containing expressedresistance genes Genetics 166 461ndash481
44 WuJ MaeharaT ShimokawaT YamamotoS HaradaCTakazakiY OnoN MukaiY KoikeK YazakiJ et al (2002) Acomprehensive rice transcript map containing 6591 expressed sequencetag sites Plant Cell 14 525ndash535
45 KunzelG KorzumL and MeisterA (2000) Cytologically integratedphysical restriction fragment length polymorphism maps for thebarley genome based on translocation breakpoints Genetics 154397ndash412
46 ShirasuK SchulmanAH LahayeT and Schulze-LefertP (2000) Acontiguous 66-kb barley DNA sequence provides evidence for reversiblegenome expansion Genome Res 10 908ndash915
47 WickerT SteinN AlbarL FeuilletC SchlagenhaufE and KellerB(2001) Analysis of a contiguous 211 kb sequence in diploid wheat(Triticum monococcum L) reveals multiple mechanisms of genomeevolution Plant J 26 307ndash316
48 BrueggemanR RostoksN KudrnaD KilianA HanF ChenJDrukaA SteffensonB and KleinhofsA (2002) The barley stem rust-resistance gene Rpg1 is a novel disease-resistance gene with homology toreceptor kinases Proc Natl Acad Sci USA 99 9328ndash9333
49 WeiF WingRA and WiseRP (2002) Genome dynamics andevolution of the Mla (powdery mildew) resistance locus in barley PlantCell 14 1903ndash1917
50 FeuilletC and KellerB (1999) High gene density is conserved atsyntenic loci of small and large grass genomes Proc Natl Acad SciUSA 96 8265ndash8270
51 TikhonovAP SanMiguelPJ NakajimaY GorensteinNMBennetzenJL and AvramovaZ (1999) Colinearity and its exceptions inorthologous adh regions of maize and sorghum Proc Natl Acad SciUSA 96 7409ndash7414
52 InukaiT SakoA HiranoHY and SanoY (2000) Analysis ofintragenic recombination at wx in rice Correlation between the molecularand genetic maps within the locus Genome 43 589ndash596
53 CivardiL XiaY EdwardsKJ SchnablePS and NikolauBJ (1994)The relationship between genetic and physical distances in thecloned a1-sh2 interval of the Zea mays L genome Proc Natl Acad SciUSA 91 8268ndash8272
54 GillBS FriebeB and EndoTR (1991) Standard karyotype andnomenclature system for description of chromosome bands andstructural aberrations in wheat (Triticum aestivum) Genome 34830ndash839
Nucleic Acids Research 2004 Vol 32 No 12 3565
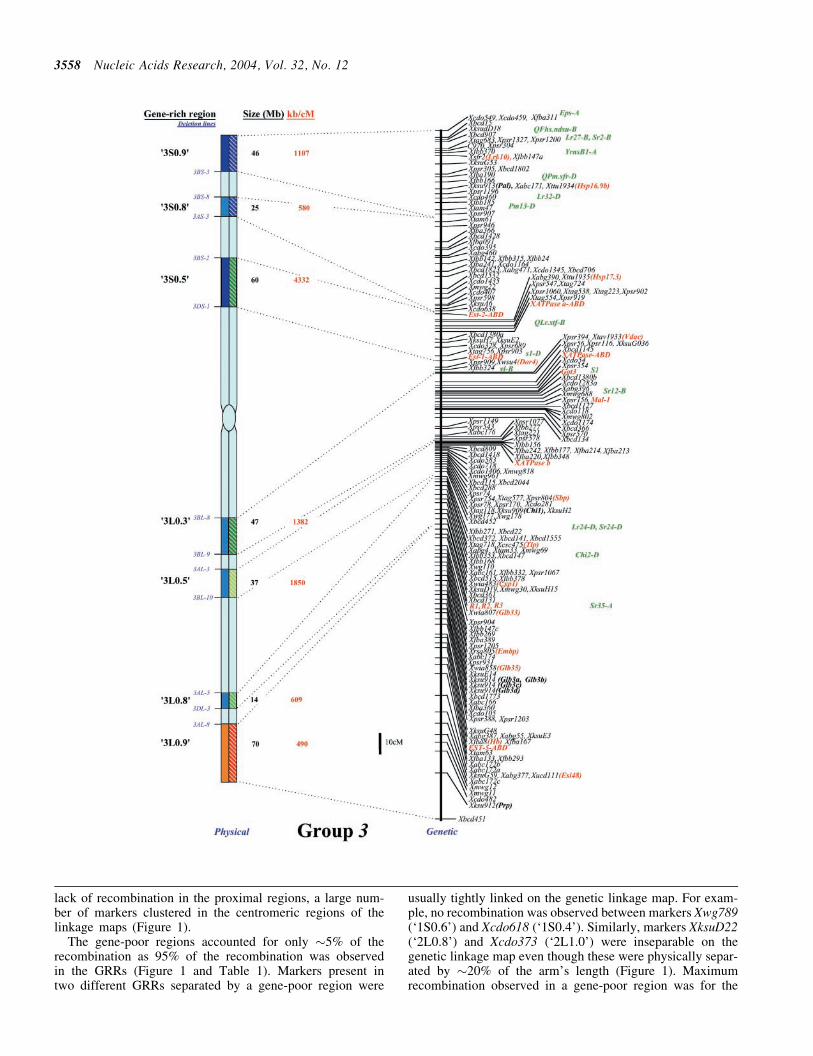
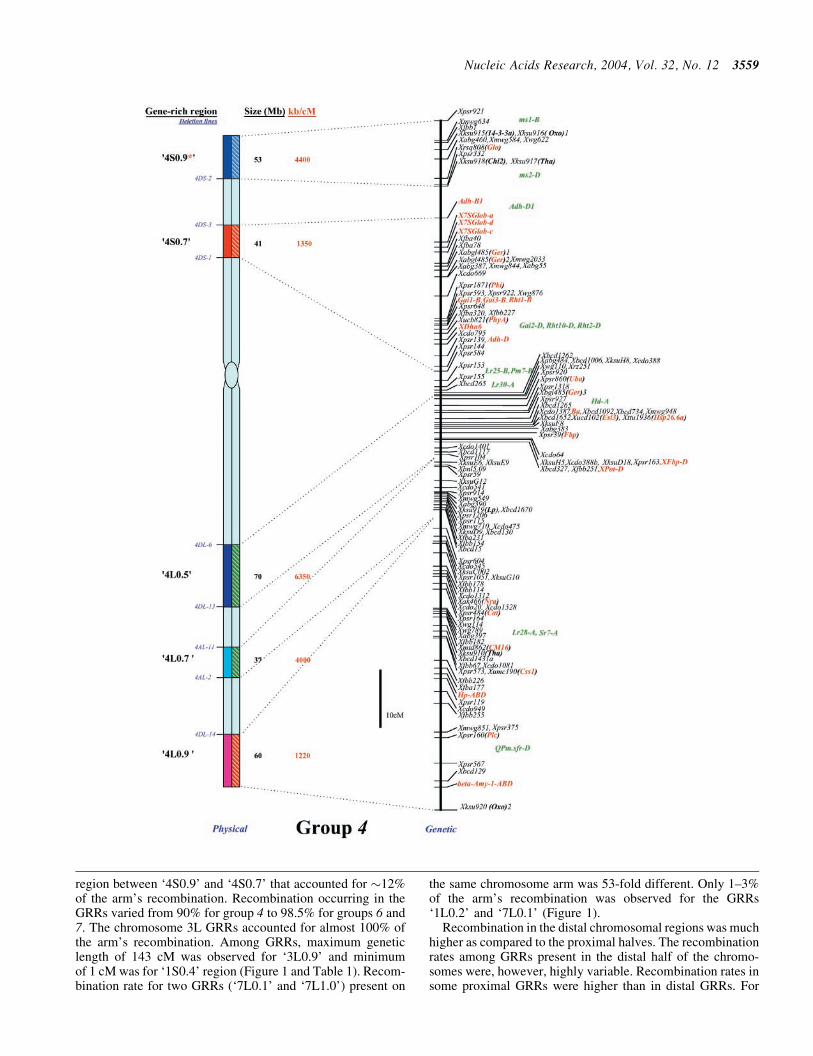
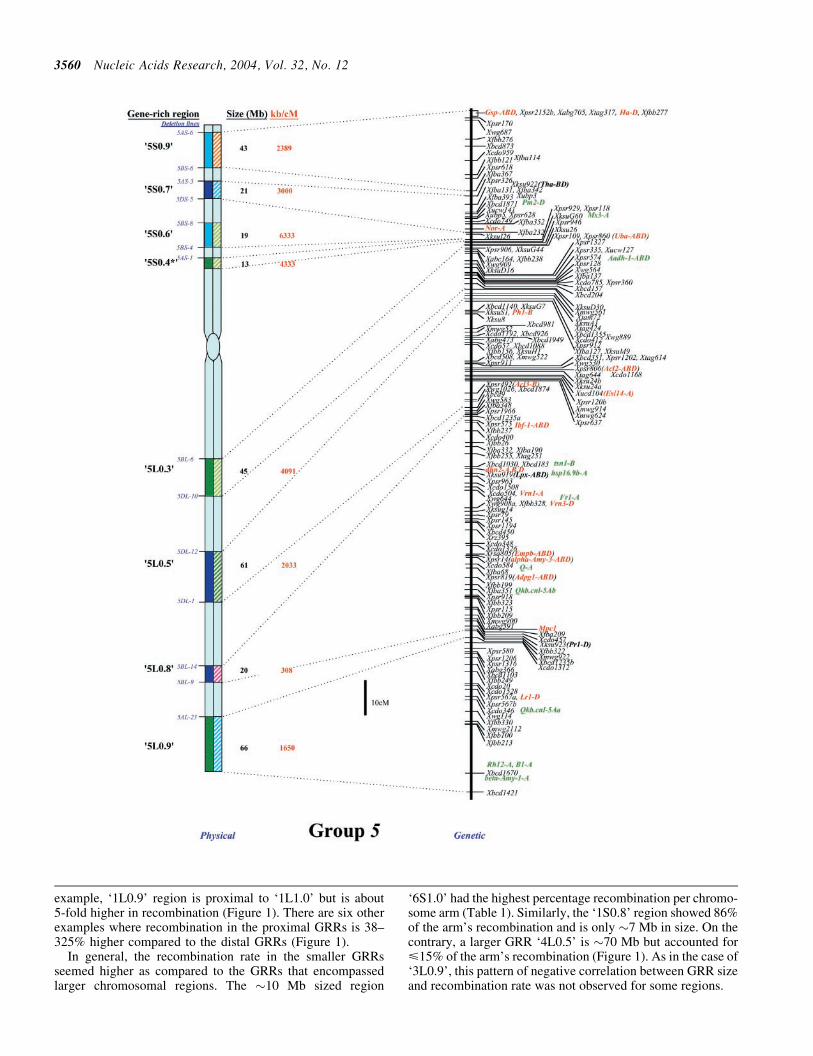