Embed Size (px)
Citation preview

Demand Uncertainty and Sales: A Study of Fashion and Markdown Pricing
B. Peter Pashigian
The American Economic Review, Vol. 78, No. 5. (Dec., 1988), pp. 936-953.
Stable URL:
http://links.jstor.org/sici?sici=0002-8282%28198812%2978%3A5%3C936%3ADUASAS%3E2.0.CO%3B2-%23
The American Economic Review is currently published by American Economic Association.
Your use of the JSTOR archive indicates your acceptance of JSTOR's Terms and Conditions of Use, available athttp://www.jstor.org/about/terms.html. JSTOR's Terms and Conditions of Use provides, in part, that unless you have obtainedprior permission, you may not download an entire issue of a journal or multiple copies of articles, and you may use content inthe JSTOR archive only for your personal, non-commercial use.
Please contact the publisher regarding any further use of this work. Publisher contact information may be obtained athttp://www.jstor.org/journals/aea.html.
Each copy of any part of a JSTOR transmission must contain the same copyright notice that appears on the screen or printedpage of such transmission.
The JSTOR Archive is a trusted digital repository providing for long-term preservation and access to leading academicjournals and scholarly literature from around the world. The Archive is supported by libraries, scholarly societies, publishers,and foundations. It is an initiative of JSTOR, a not-for-profit organization with a mission to help the scholarly community takeadvantage of advances in technology. For more information regarding JSTOR, please contact [email protected].
http://www.jstor.orgTue Sep 4 16:04:06 2007

Demand Uncertainty and Sales: A Study of Fashion and Markdown Pricing
The frequent) of sales has increased dran~aticaliy in recent years. Parado.xical(~, the percentage markup has also increased. Markdowns and markups are higher in some departments of department stores than in others. The major theme of the paper is that the growing role of fashion and product variety is an important reason for these increases and for the diflerences between merchandise groups.
Markdowns and sales have long been ubiquitous in retailing. They occur fre-quently but they have not been studied sys- tematically by econo~nists. Recently renewed interest in the subject has been expressed by two groups: economic theorists Hal R. Var- ian (1980), Steven Salop and Joe E. Stiglitz (1982), and Edward P. Lazear (1986), and marketing specialists, who have concentrated on the growing use of promotional price deals in package goods.
T h s paper expands on the topic in two ways. It extends Lazear's theory of clearance sales to allow for industry equilibrium. T h s is a useful extension because it shows how the equilibrium percentage markup is jointly determined along with the percentage mark- down and the percentage of goods sold on
*Graduate School of Business, University of Chicago, 1101 E. 58th Street. Chicago, Illinois 60637. This re-search was supported by the Graduate School of Busi- ness, University of Chicago and the Center for the Study of the Economy and the State. The author ac-knowledges helpful comments from Allan Hunter. Ed- ward Lazear, Carl Priestland, Scott Neslin, Stephen Spurr, George Stigler. Arnold Zellner. and participants at seminars presented at the University of Chicago. Clemson University, Duke University, Federal Trade Commission, Massachusetts Institute of Technology, Northwestern University, and Rochester University. Numerous helpful conversations were held with knowl- edgeable industry officials and are gratefully acknowl- edged. While most industry officials acknowledge the role of fashion, some may place greater importance on the growth of store competition. Responsibility for error rests with the author. Peter Allan Pashigian assisted with the graphics. Will Carrington, Brooks Pierce, Ken Troske, and Chnhui Juhn semed as able research assis- tants.
sale and why these three measures might be expected to either increase or decrease to- gether. More importantly, the paper takes the next steD. It confronts the theorv of clearance sales with some evidence and de- termines just how well the theory can explain some interesting time-series and cross-sectional regularities in sales offered by department stores. The empirical section in- cludes an in-depth and reasonably compre- hensive study of actual sales. The percentage markup and dollar markdowns taken by de- partment stores relative to dollar revenue are traced over an extended time, from 1925 to 1984, and then compared across merchandis- ing groups at several points in time. The most striking feature of the time-series is the increase in the percentage markup and the freauencv of sales since 1970. These in-creases can be properly viewed as revolu-tionary since neither series exhbited any clear trend during the previous 40 to 45 years. A considerable of the modeling effort is designed to discover why these in- creases began around 1970 and why there are significant but changing differences in m a r k u ~ s and markdowns-between merchan- dise groups. A major theme of the paper is that these recent increases and differences between groups are due to the growing im- portance of fashlon in merchandising. The term fashion is used synonymously with va- riety throughout this paper and refers to greater (price) uncertainty facing stores about the future popularity of colors, patterns, and fabrics. To avoid any misunderstanding, the term "fashion" is not meant to refer solely to "hgh" fashon clothing.
VOI.. 78 NO. -5 PASHICIAN. DEMAND C'NCERTAINTY A N D S A L E S 937
Section I extends Lazear's theory of clear- ance sales to allow for industry equilibrium. The effect of increased dispersion in reserva- tion prices on the optimal percentage markup, the percentage markdown, and the percentage of goods sold on markdown is shown for several price distributions. Impli- cations of the fashon hypothesis are derived. Section I1 examines the time-series behavior of markups and markdowns. Time-series changes in the use of colors and types of clothng are documented to show increases in the demand for fashon. The estimated effects of different proxy variables far fash- ion on percentage markup and on mark-downs are presented. Section I11 shows how percentage markups and markdowns have changed over time for women's fashion, women's standard, men's, teens', and infant apparel groups. Some of these changes ap- pear to be caused by the growing importance and spreading influence of fashon in ap- parel merchandising. The paper ends with a summary.
I. The Theory of Clearance Sales
Sales can be conveniently classified as pre- season, withn-season, and clearance sales. Of the three, clearance sales are the more familiar and somewhat easier to understand. They occur because style or color or pattern changes are so difficult to predict. Lazear's theory of clearance sales features one form of uncertainty-what customers will pay for individual dresses withn a line of dresses. His model considers a risk-neutral store that has already purchased the line but is uncer- tain about whch color will be popular in the coming season and could be sold for hgher prices. The prior cumulative price distribu- tion of reservation prices that consumers are willing to pay for the different colored dresses in the line is denoted by F ( P ) . Because the retailer cannot identify which dresses could be sold for h g h prices and whlch for low prices, all dresses are offered in the first period at an initial price, PO. The dresses with colors for whom consumer reservation prices exceed PO will sell out quickly. If a dress with a particular color did not sell in the initial period, it means that consumers'
reservation prices for that color are less than PO. The store revises the prior distribution of prices in light of the market evidence and selects an optimal markdown price, PI.'
The markdown price is selected to maxi- mize expected revenue:
where Po 2 P I .f( P ) / F ( PO) is the revised price distribution given that the dress did not sell at PO. When selecting the optimal markdown price, the store has a tradeoff to make between a lower markdown price and an increase in the proportion of the remain- ing dresses that will be sold by the end of the markdown period. Given PO, the optimal markdown price satisfies
The optimal first-period price maximizes expected revenue given optimal pricing be- havior in the markdown period. Expected revenue in the first period is
For a dress selected at random, expected revenue equals PO times the probability of sale in the initial period plus P1 times the probability of selling the dress in the mark- down period. It is assumed that a dress that has not sold at the end of the markdown period is given to charity. The optimal initial
'Lazear's model ignores strategic behavior by con-sumers. Consumers are less hkely to behave strategically when the selling seasons are short, fashlons change from season-to-season. and lead times between order and sales are long. Consumers do not wait to purchase a fashion item in the markdown period because the item may be sold out before then and may not long be popular in the next season.
938 T H E AMERICAN ECONOMIC RE VIE U' DECIJ,MBER 1988
price will satisfy
(4) ( P I - PO) f ( P O ) + l - F ( P 0 ) = 0 .
Lazear used equations (2) and (4) to deter- mine the optimal initial and markdown price^.^ He focused on the optimal price policy of a store that has already ordered a line of clothng. The analysis can be enriched by allowing for industry equilibrium through the actual or threatened entry of firms. New stores will enter or old stores will exit if expected profits differ from zero. So, market equilibrium requires
where C is the per unit ( = marginal) cost of purchasing the merchandise.
A market equilibrium exists when equa- tions (2), (4), and (5) are satisfied. The ad- justment to this equilibrium is not formally modeled in this paper. A brief narrative might help clarify just how t h s equilibrium could be reached. Begin by assuming the parameters of the price distribution are exo- geneously determined by the tastes of and the information held by consumers. For a given price distribution, each store will post the optimal initial and then the optimal markdown price while satisfying equations (2) and (4). If expected profits are positive at these prices, then new stores will have an incentive to enter and to acquire customers of established stores. Because all stores are assumed to be alike, any new store that enters will face the same price distribution as existing stores. So a new store will select the same prices that satisfy equations (2) and (4). Assume that new stores that post identi- cal prices as established stores cannot attract customers from the established stores except by offering higher quality merchandise, that is, by increasing C. The actual or implied threat of quality upgrading by new stores
he model can be expanded to allow for noise to make the inference problem more difficult.
will force established stores to upgrade qual- ity or lose customers. Competition through quality upgrading will continue until ex-pected profits are competed away.3
Under t h s scenario, equations (2), (4), and ( 5 ) can be solved for the endogenous variables, PO, P I , and C, as functions of the parameters of the price distribution. An in- teresting question is how PO, PI , and C change as the range of reservation prices increases. Unambiguous comparative static predictions are not easy to derive without placing more structure on the price distribu- tion. Considerable insight can be gained by considering price distributions that can be written in the form of F(P/Xl , XO/Xl), where XO and X1 represent the hghest and the lowest (reservation) price that customers are willing to pay for the dresses in the line. The larger the ratio of XO to X1 the greater is price uncertainty. Not only can XO/Xl change over time but it will be larger in those merchandise groups where there are frequent changes in color, fabric, pattern, and silhouette from season-to-season. Given the assumed form of F, it is possible to solve equations (2) and (4) for PO/X1 and P l / X l as functions of XO/Xl. After substituting these expressions for PO/Xl and P l / X l into equation (5), there will be only one value of C/Xl that satisfies equation ( 5 ) for each value of XO/Xl. As a result, the equi- librium functional relation between C/X1 and XO/X1 can be expressed as
Given XO/X1 and the corresponding equilibrium values for PO, PI , and C (rela- tive to XI), it is then possible to calculate
30bviously, this description is incomplete and needs to be elaborated on if the whole distribution of reserva- tion prices shifts to the right when quality upgrading occurs. Offering hlgher quality merchandise would change the parameters of the price distribution and shift the price distribution to the right. A zero-expected profit equilibrium can be achieved as long as the distri- bution of prices does not shift too rapidly to the right as C increases.

939 V O L . 78 NO. 5 PASHIGIAN: DEMAND UNCERTAINTY AND SALES
xo -X1
P 0 -X1
P1 -X
C -
X1 PMD MPS PMU I-.(;]
( 1 ) ( 2 ) ( 3 ) ( 4 ) ( 5 ) ( 6 ) ( 7 ) ( 8 )
Uniform Distribution 1.20 1.10 1.00 1.05 .08 .05 .05 .5 1.50 1.25 1.00 1.12 .20 . l l .10 .5 2.00 1.50 1.00 1.25 .33 .20 .17 .5 3.OO 2.00 1.00 1.50 .50 .20 .25 .5 4.74 3.16 1.52 2.00 .50 .20 .37 .5
10.92 7.28 3.64 4.00 .50 .20 .45 .5 25.63 17.05 8.57 8.93 .50 .20 .48 .5
Symmetric Triangular Distribution 1.40 1.17 1.01 1.11 .13 .05 .05 1.74 1.32 1.05 1.21 .21 .08 .08 2.28 1.57 1.14 1.37 .28 .12 .12 4.07 2.45 1.58 1.95 .39 .17 .21 6.11 3.50 2.16 2.63 .39 .19 .25 8.99 5.00 3.01 3.62 .40 .21 .28
19.01 10.43 6.10 7.09 .41 .23 .3 2
the equilibrium percentage markdown, and 7 show PMD, MPS, and PMU, respec- tively. Column 8 shows the ratio of the total
(7? PMD = (PO- Pl)/PO; units sold at the markdown price to total units sold in both periods.
the equilibrium percentage markup (PMU) The results are very informative. They in- dicate the optimal percentage markdown, the
(8) PMU = (PO-C)/PO, percentage markup, and dollar markdowns relative to dollar sales either rise (for the
and total dollar markdowns as a percentage symmetrical triangular distribution) or rise of dollar revenue, MPS, and then stabilize (for the uniform distribu-
tion) as XO/X1 increases. The most impor- (9) MPS = { PO - P l ) tant implication is that the clearance theory
predict that fashlon goods will have both a higher-percentage markup and a larger ratio of dollar markdowns relative to dollar sales. An increase in price uncertainty will cause an increase in both the percentage markup and dollar markdowns relative to dollar sales. The extended theory of clearance sales pro- vides a parsimonious explanation of why
Table 1 illustrates the equilibrium solution department stores have increased their per- for seven values of XO/X1 for two symmet- centage markup while they have been simul- rical price distributions. The upper panel taneously selling more items at markdown shows the results for a uniform price distri- prices. The clearance theory can also be bution and the lower panel for a symmetri- helpful in explaining why pricing policies cal triangular distribution. Columns 2, 3, differ across departments in a store. It can and 4 show the equilibrium values for PO, explain why the percentage markup and dol- P I , and C (relative to XI) and columns 5 , 6, lar markdowns (relative to sales) will be

940 T H E A M E R I C A N ECONOMIC R E V I E W DECEMBER 1988
higher for fashlon garments than for non-fashon garments, for example, teenager versus men's tailored clothing. Another in- teresting result is that P I is less than C. Customers who are indifferent to fashon trends and who purchase in the markdown period are purchasing remnants at a price less than C. These customers purchase at lower prices because of the preference for fashon by the majority of customers. If there were no price uncertainty, all buyers would purchase at marginal cost. A final result is that the fraction of goods sold at markdown will vary with XO/X1 but in ways that depend on the form of the price distribution. It is independent of XO/X1 for the uniform distribution and increases with XO/Xl for the symmetrical triangular di~tr ibut ion.~
11. Time-Series Changes in Markdowns and Markups
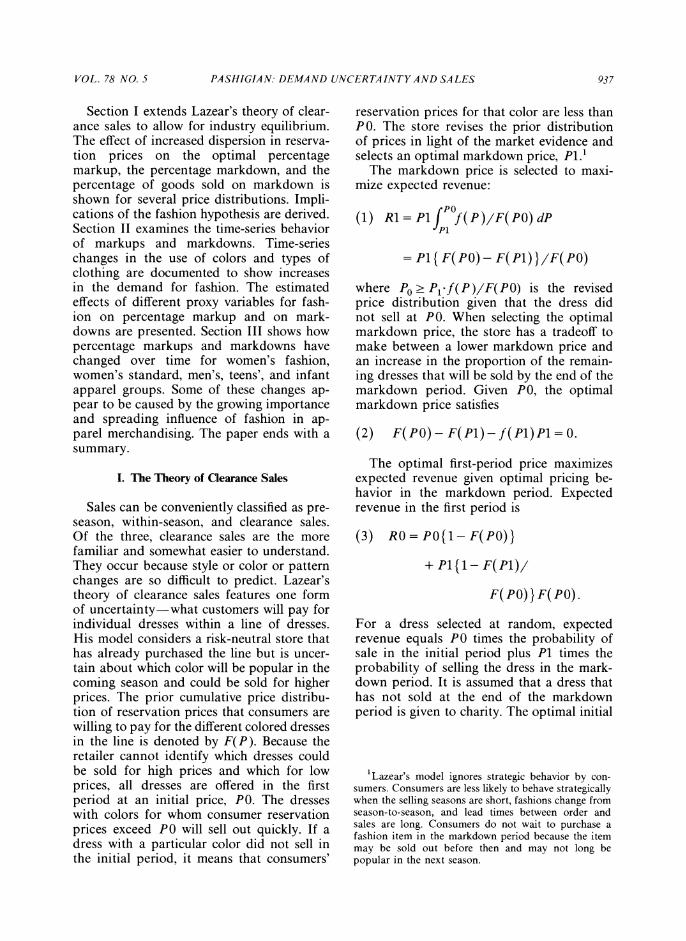
Figure 1 shows dollar markdowns as a percentage of dollar sales (MPS) for all de- partment stores in the sample and the cumu- lative markon (PMU) from 1925 to 1984. The cumulative markon is a term used in the industry and is an approximation to PMU.
Dollar markdowns relative to dollar sales and the percentage markon have changed noticeably over three time periods. First, dollar markdowns relative to total revenue rose with the onset of the Great Depression. Markdowns probably increased because the severity of the Depression was grossly un- derestimated. Second, markdowns were un- usually low during World War 11. The de- cline in markdowns during World War I1 was due to price controls, output restric-tions, and rationing. Prices were artificially fixed below equilibrium levels. Merchandise was scarce and so eagerly purchased by cus- tomers that markdowns were limited to the few remnants left on shelves.
4 ~ e r ysimilar qualitative results were obtained when the price distributions (right triangular) were asymmet- ric. The one notable difference is the fraction of goods sold at markdown decreased (increased) with increases in X O / X 1 when the distribution was skewed to the right (left).
Th rd , and most important, has been the large and steady increase in markdowns over the last 15 to 20 years whch follows a period of about 40 years of comparative stability. Figure 1 clearly shows department stores have been taking hgher-percentage markups in recent years whle they have been simulta- neously selling relatively more merchandise at markdown prices. The conjoint increase in the percentage markon and in MPS would no doubt appear paradoxical to the un-trained eye. If the increase in the percentage markup is due to persistent and large in- creases in demand, then markdowns should have been applied less frequently. Similarly, if increased competition from discount and off-price stores is the reason why department stores are offering more frequent sales, then why has t h s competition not limited or re- duced the size of the percentage markup? Both the demand or the competition hypoth- esis would imply an inverse relationship be-tween the change in the percentage markon and the change in MPS. Neither can com- pletely explain why both PMU and MPS have been rising.
The theory of clearance sales provides a plausible and parsimonious explanation of why the percentage markon and MPS have both increased. The theory implies that MPS and PMU will rise when uncertainty in-creases and uncertainty will increase as fashion and product variety become more important in the sales of apparel and other merchandise.
~ e l i a n c eon the price discrimination hypothesis to explain the higher percentage markup and hgher mark- downs relative to dollar sales should be resisted. It is doubtful whether the price discrimination hypothesis should be applied to an industry as competitive as the retail clothng industry is. Not only do many different types and sizes of outlets sell clothng, for example, department, discount, apparel, specialty, and off-price stores, but firms enter and exit the industry frequently. If the price discrimination hypotheses were to explain the data, they would imply the monopoly power of these different stores has been increasing over time or the difference between the price elasticities of demand of the two groups of customers had increased. The price discrimination hypothesis would also have to explain why MPS has increased more in selected merchandise groups, for example, teenager and junior or men's cloth- ing (see Section 111).
941 VOI.. 78 NO. 5 PASHIGIAN: D E M A N D U N C E R T A I N T Y A N D S A L E S
FIGURE1. MARKDOWNS TO DOLLAR AND PERCENTAGERELATIVE SALES MARKON,1925-84 (Source: See Data Appendix.)
A. Illustrations of Fashion Changes
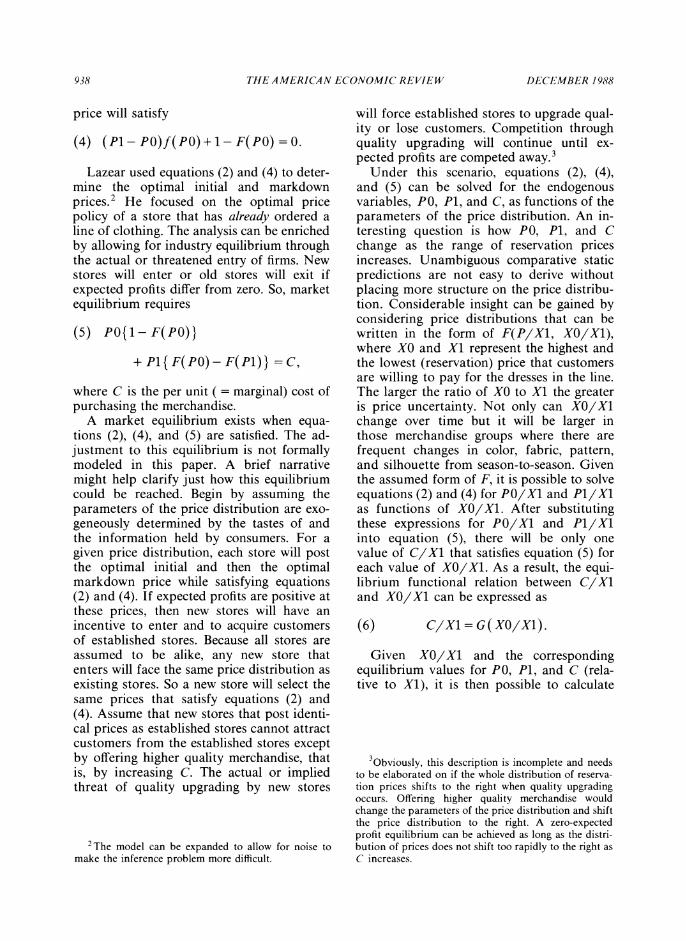
Some episodic evidence also indicates price uncertainty increased between the mid-1960s and mid-1970s. Color and fashon are inti- mately linked. Greater use of colors or prints would mirror a shft toward more fashion merchandise. Surprisingly, color use data are scarce and available for only a few products over long periods of time. Data showing the use of whtes, prints, and solids are available for bed sheets and to a more limited extent for men's dress shrts. Figure 2 shows the percentage of bed sheet sales (produced by domestic manufacturers) that are whte or fancies, which include prints, jacquards, and other special designs (the market share of
other solid colors is not shown). The market share of white sheets drops precipitously from about 65 percent in the mid-1960s to about 16 percent by 1975 whle the market share of fancies increases from 15 percent in the mid-1960s to 75 percent by the mid- 1970s. Over a 10-year span, there was a dramatic increase in the use of prints. Pre- dicting whch print patterns and colors will be popular is considerably more difficult than predicting the demand for whltes.
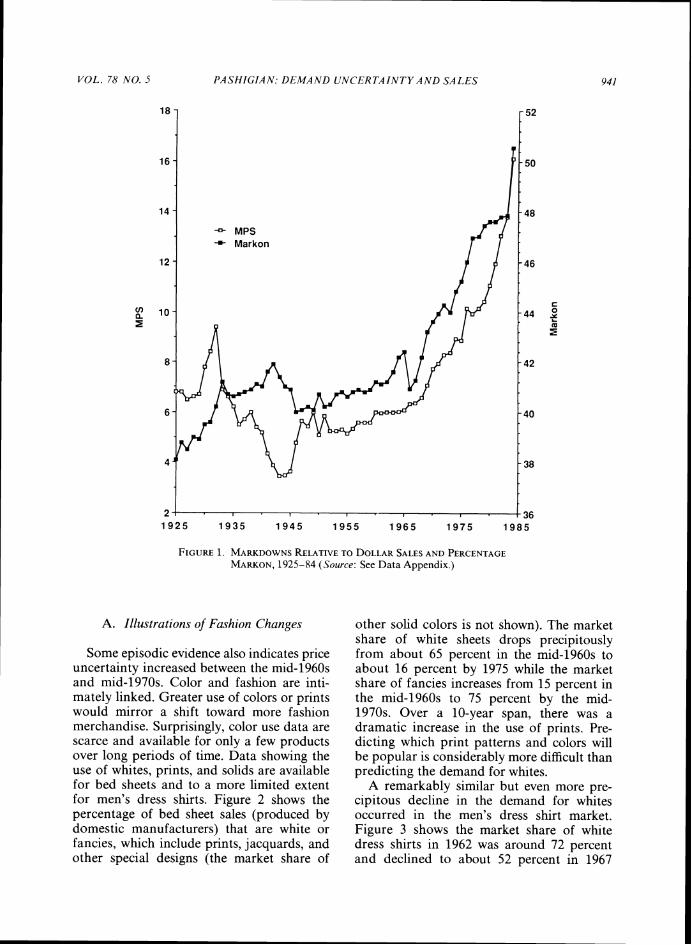
A remarkably similar but even more pre- cipitous decline in the demand for whltes occurred in the men's dress shr t market. Figure 3 shows the market share of white dress shirts in 1962 was around 72 percent and declined to about 52 percent in 1967
T H E AMERICAN ECONOMIC RE V I E W DECEMBER I988
FIGURE2. MARKETSHARESOF WHITEAND FANCYBED SHEETS, 1960-86 (Source: See Data Appendix.)
and to 19 percent in 1970. Complete data for the 1970s are unavailable. However, the mar- ket share of whte dress shrts probably re- mained low throughout the 1970s. Data for the eighties are available and show the mar- ket share of white shirts is between 19 and 22 percent while the percentage of fancy (patterns, stripes, etc.) is increasing. In this market as well, there has been a shlft away from whtes to other colors and fancies.
The declining use of more formal and tailored clothing, for whlch there are ac-cepted guidelines, and the greater reliance on sportswear, for which there are fewer ac-cepted guidelines, has also increased price uncertainty. For women's sportswear, the consumer has greater latitude to mix and
coordinate tops with bottoms and to match colors, patterns, and fabrics of blouses, shirts, and sweaters with those of skirts and pants. There are fewer guidelines and standards now and this means that store buyers are even less able to predict which combinations will be matched. The magnitude of the shft toward women's sportswear can be seen in Figure 3. The market share of women's sportswear as a percentage of total dollar sales of women's dresses and sportswear is graphed from 1963 to 1982.6 The market
6 ~ h emarket shares were calculated from the sales of sportswear and dresses by department stores, women's ready-to-wear stores, and family clothing stores.

V O L . 78 NO. 5 PASHIGIAN: DEMAND U N C E R T A I N T Y A N D S A L E S
White /
I Fancy
FIGURE 3. MARKET SHARES OF WHITEAND FANCY~ N ' SDRESS SHIRTS, 1962-86, A N D WOMEN'S SPORTSWEAR, 1963-82 (Source: See Data Appendix.)
share of sportswear remained roughly con- stant between 1963 and 1967, hovering around 41 or 42 percent. Since then, it in- creased to 56 percent in 1972, 69 percent in 1977, and reached 78 percent in 1982, the last available Census year. In women's ap- parel (and men's apparel) there has been a dramatic transition toward more casual clothlng where there is greater opportun-ity for individual expression and creativity through product selections.
Although these illustrations are episodic and selective, they do indicate the transition toward greater demand for product diversity began roughly in the mid- to-late 1960s and has continued throughout the 1970s and 1980s.
B. Regression Results
Figure 1 indicates the markdown and markup policies of department stores in the last 15 to 20 years were affected by different determinants than in the previous decades. The subsequent statistical analysis of mark- downs and markups will concentrate on the period from 1956 to 1984.' Markdowns rela- tive to sales and the percentage markup in the period between 1925 and 1955, and espe- cially from 1925 to the end of World War I1 were more affected by unexpected demand
7~ selected 1956 as the initial year because clothing import data first became available in that year.
944 T H E AMERICAN ECONOMIC REVIEW' DECEMBER 1988
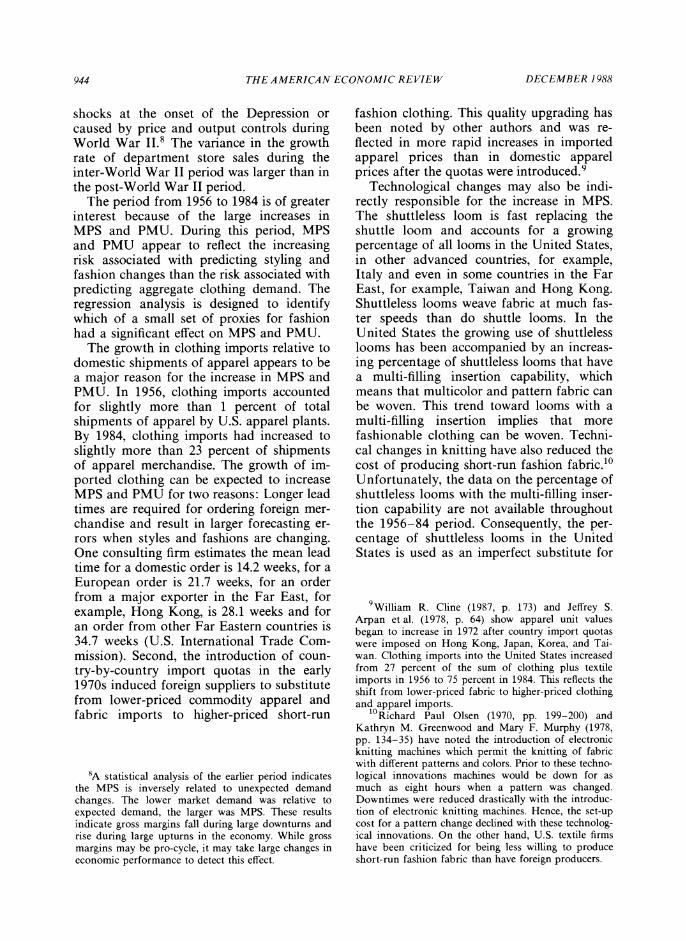
shocks at the onset of the Depression or caused by price and output controls during World War II.8 The variance in the growth rate of department store sales during the inter-World War I1 period was larger than in the post-World War I1 period.
The period from 1956 to 1984 is of greater interest because of the large increases in MPS and PMU. During t h s period, MPS and PMU appear to reflect the increasing risk associated with predicting styling and fashion changes than the risk associated with predicting aggregate clothing demand. The regression analysis is designed to identify whch of a small set of proxies for fashion had a significant effect on MPS and PMU.
The growth in clothng imports relative to domestic shpments of apparel appears to be a major reason for the increase in MPS and PMU. In 1956, clothing imports accounted for slightly more than 1 percent of total shipments of apparel by U.S. apparel plants. By 1984, clothng imports had increased to slightly more than 23 percent of shpments of apparel merchandise. The growth of im- ported clothing can be expected to increase MPS and PMU for two reasons: Longer lead times are required for ordering foreign mer- chandise and result in larger forecasting er- rors when styles and fashons are changing. One consulting firm estimates the mean lead time for a domestic order is 14.2 weeks, for a European order is 21.7 weeks, for an order from a major exporter in the Far East, for example, Hong Kong, is 28.1 weeks and for an order from other Far Eastern countries is 34.7 weeks (U.S. International Trade Com- mission). Second, the introduction of coun-try-by-country import quotas in the early 1970s induced foreign suppliers to substitute from lower-priced commodity apparel and fabric imports to hgher-priced short-run
'A statistical analysis of the earlier period indicates the MPS is inversely related to unexpected demand changes. The lower market demand was relative to expected demand, the larger was MPS. These results indicate gross margins fall during large downturns and rise during large upturns in the economy. While gross margins may be pro-cycle, it may take large changes in economic performance to detect t h s effect.
fashion clothing. This quality upgrading has been noted by other authors and was re-flected in more rapid increases in imported apparel prices than in domestic apparel prices after the quotas were i n t r o d ~ c e d . ~
Technological changes may also be indi- rectly responsible for the increase in MPS. The shuttleless loom is fast replacing the shuttle loom and accounts for a growing percentage of all looms in the United States, in other advanced countries, for example, Italy and even in some countries in the Far East, for example, Taiwan and Hong Kong. Shuttleless looms weave fabric at much fas- ter speeds than do shuttle looms. In the United States the growing use of shuttleless looms has been accompanied by an increas- ing percentage of shuttleless looms that have a multi-filling insertion capability, whch means that multicolor and pattern fabric can be woven. T h s trend toward looms with a multi-filling insertion implies that more fashionable clothing can be woven. Techni- cal changes in knitting have also reduced the cost of producing short-run fashon fabric.'' Unfortunately, the data on the percentage of shuttleless looms with the multi-filling inser- tion capability are not available throughout the 1956-84 period. Consequently, the per- centage of shuttleless looms in the United States is used as an imperfect substitute for
' ~ i l l i a m R. Cline (1987, p. 173) and Jeffrey S. Arpan et al. (1978, p. 64) show apparel unit values began to increase in 1972 after country import quotas were imposed on Hong Kong, Japan, Korea, and Tai- wan. Clothng imports into the United States increased from 27 percent of the sum of clothng plus textile imports in 1956 to 75 percent in 1984. Thls reflects the shlft from lower-priced fabric to higher-priced clothng and apparel imports.
10k c h a r d Paul Olsen (1970, pp. 199-200) and Kathryn M. Greenwood and Mary F. Murphy (1978, pp. 134-35) have noted the introduction of electronic knitting machnes which permit the knitting of fabric with different patterns and colors. Prior to these techno- logical innovations machnes would be down for as much as eight hours when a pattern was changed. Downtimes were reduced drastically with the introduc- tion of electronic knitting machnes. Hence, the set-up cost for a pattern change declined with these technolog- ical innovations. O n the other hand, U.S. textile firms have been criticized for being less willing to produce short-run fashon fabric than have foreign producers.

945 VOL. 78 NO. 5 PASHIGIAN; DEMAND L'NCERTAIh'TY AN D SALES
TABLE2 - D E T E R ~ ~ ~ N A N T S MARKDOWNS 10 DOLLARSALES(MPS)OF DOLLAR ~ L A ~ I V E
AND PERCENTAGEMARKON,1956-84 (r-statistics listed below coeficient estimates)
Dollar Markdowns Relative to Dollar Sales Markon
(1)
1. Constant
2. Percent Clothlng Imports ( t )
3. Percent Clothing Imports (r - 1)
4. Percent Shuttleless Looms ( I )
5. Percent of Population 10- to 34-years old ( i )
6. Markdown ( t - 1)
Note; For definition of variables, see Data Appendix
the growing capacity to produce fashion merchandise.
Finally, the fraction of the population be- tween 10 and 34 may be directly related to MPS. Younger members of the population appear to be more fashon conscious. This finding should, however, be considered with caution. The fraction of the population be- tween 10 and 34 was not found to be a significant determinant of MPS over the 1925-55 period even though this fraction of the population declined appreciably from 1940 to 1955. During the 1956-84 period, t h s fraction has been rising except for the last few years.
Regression results are presented in Table 2. In columns 1-3 the dependent variable is MPS whle the dependent variable in column 4 is the percentage markon. The coefficient estimates in column 1 indicate each of the above-mentioned variables is directly related to MPS with the t-ratios ranging from 2.1 to 3.5." The assumed first-order process for the
11The estimates in columns 1 and 4 were obtained using the Autoreg procedure in SAS.
(2) (3) (4)
residuals indicates the residuals of t h s equa- tion are positively correlated.12 The serial correlation of residuals in the MPS equation could be due to a variety of reasons, for example, partial adjustment of markdowns or a left-out variable that changes slowly over time, etc. Because stores can and do change prices quickly in response to changes in demand conditions, it is unlikely the serial correlation of residuals is due to a sluggish adjustment of prices by the stores. Mark- downs offered t h s year by a store should be determined by current demand conditions and not by the markdowns offered by the store in the previous year. A more plausible hypothesis is that the serial correlation of residuals is due to a left-out variable that changes slowly. A possible explanation for the serial correlation is the absence of a
12The correlation of residuals across the MPS and PMU equations was never very high, generally around .lo. Hence, little efficiency gain was achieved when seemingly unrelated methods were employed.
946 T H E AMERICA.\'
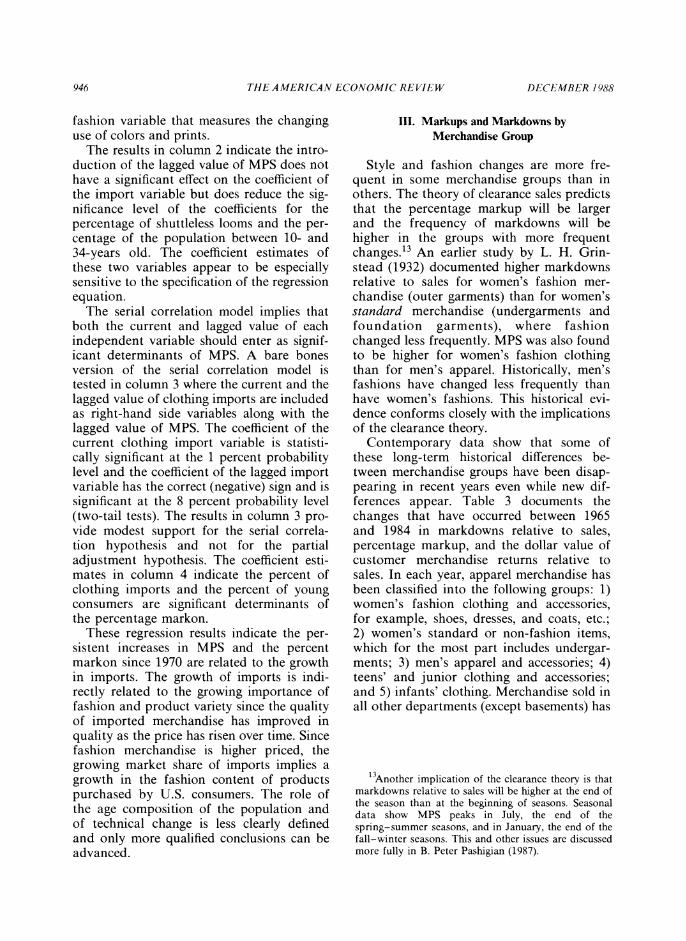
fashion variable that measures the changing use of colors and prints.
The results in column 2 indicate the intro- duction of the lagged value of MPS does not have a significant effect on the coefficient of the import variable but does reduce the sig- nificance level of the coefficients for the percentage of shuttleless looms and the per- centage of the population between 10- and 34-years old. The coefficient estimates of these two variables appear to be especially sensitive to the specification of the regression equation.
The serial correlation model implies that both the current and lagged value of each independent variable should enter as signif- icant determinants of MPS. A bare bones version of the serial correlation model is tested in column 3 where the current and the lagged value of clothng imports are included as right-hand side variables along with the lagged value of MPS. The coefficient of the current clothing import variable is statisti- cally significant at the 1 percent probability level and the coefficient of the lagged import variable has the correct (negative) sign and is significant at the 8 percent probability level (two-tail tests). The results in column 3 pro- vide modest support for the serial correla- tion hypothesis and not for the partial adjustment hypothesis. The coefficient esti- mates in column 4 indicate the percent of clothng imports and the percent of young consumers are significant determinants of the percentage markon.
These regression results indicate the per- sistent increases in MPS and the percent markon since 1970 are related to the growth in imports. The growth of imports is indi- rectly related to the growing importance of fashion and product variety since the quality of imported merchandise has improved in quality as the price has risen over time. Since fashion merchandise is hgher priced, the growing market share of imports implies a growth in the fashion content of products purchased by U.S. consumers. The role of the age composition of the population and of technical change is less clearly defined and only more qualified conclusions can be advanced.
EC0,VOMIC R E C7L-U' DECEMBER 19x8
111. Markups and Markdowns by Merchandise Group
Style and fashon changes are more fre-quent in some merchandise groups than in others. The theory of clearance sales predicts that the percentage markup will be larger and the frequency of markdowns will be hlgher in the groups with more frequent changes.13 An earlier study by L. H. Grin-stead (1932) documented hgher markdowns relative to sales for women's fashion mer-chandise (outer garments) than for women's standard merchandise (undergarments and foundation garments), where fashion changed less frequently. MPS was also found to be l g h e r for women's fashon clothng than for men's apparel. Historically, men's fashions have changed less frequently than have women's fashons. This historical evi- dence conforms closely with the implications of the clearance theory.
Contemporary data show that some of these long-term hstorical differences be-tween merchandise groups have been disap- pearing in recent years even w l l e new dif- ferences appear. Table 3 documents the changes that have occurred between 1965 and 1984 in markdowns relative to sales, percentage markup, and the dollar value of customer merchandise returns relative to sales. In each year, apparel merchandise has been classified into the following groups: 1) women's fashion clothng and accessories, for example, shoes, dresses, and coats, etc.; 2) women's standard or non-fashion items. which for the most part includes undergar- ments; 3) men's apparel and accessories; 4) teens' and junior clothng and accessories; and 5) infants' clothng. Merchandise sold in all other departments (except basements) has
1 3Another implication of the clearance theory is that markdowns relative to sales will be higher at the end of the season than at the beginning of seasons. Seasonal data show MPS peaks in July, the end of the spring-summer seasons, and in January, the end of the fall-winter seasons. Thls and other issues are discussed more fully in B. Peter Pashlgian (1987).

VOL. 78 NO. 5 PASHIGIAN: DEMAND C'NCERTAINTY AND SALES 947
TABLE3-MEAN OF ARKDO DOWNS RELATIVETO SALES, MARKONS, AND &.TURNS RELATIVETO SALESBY YEARAND MERCHANDISEGROUP"
Women's All Fashon Women's Men's Teens' All
Groups Apparel and Standard Apparel and and Junior Infants' Other Year Combined Accessories Apparel Accessories Apparel Apparel Depts.
Markdowns Relative to Sales 10.2 4.5 6.6 (3.6) (2.1) (1.6) 29 12 10 11.8 8.2 10.8 (6.0) (4.1) (4.0) 22 16 15 19.8 13.8 19.3 (8.0) (6.7) (6.7) 23 9 15
Markons (Percentage Markup) 42.2 40.7 40.6 (3.8) (1.9) (3.3) 29 12 10 48.9 48.2 48.6 (2.8) (1.8) (2.1) 22 16 15 51.9 51.6 50.6 (2.1) (1.5) (2.2) 23 9 15
Merchandise Returns Relative to Sales 9.0 6.1 5.7
(4.3) (4.3) (1.8) 29 12 10
8.1 7.7 8.8
Note: For sources, see Data Appendix. "Number in brackets represents the standard deviation. Number below standard deviation is sample size.
been combined into a catchall "other" Table 3 shows the simple mean, below class.14 which is the standard deviation and below
the standard deviation is the number of cate- gories within each group. In 1965 mark-downs relative to sales were higher for the
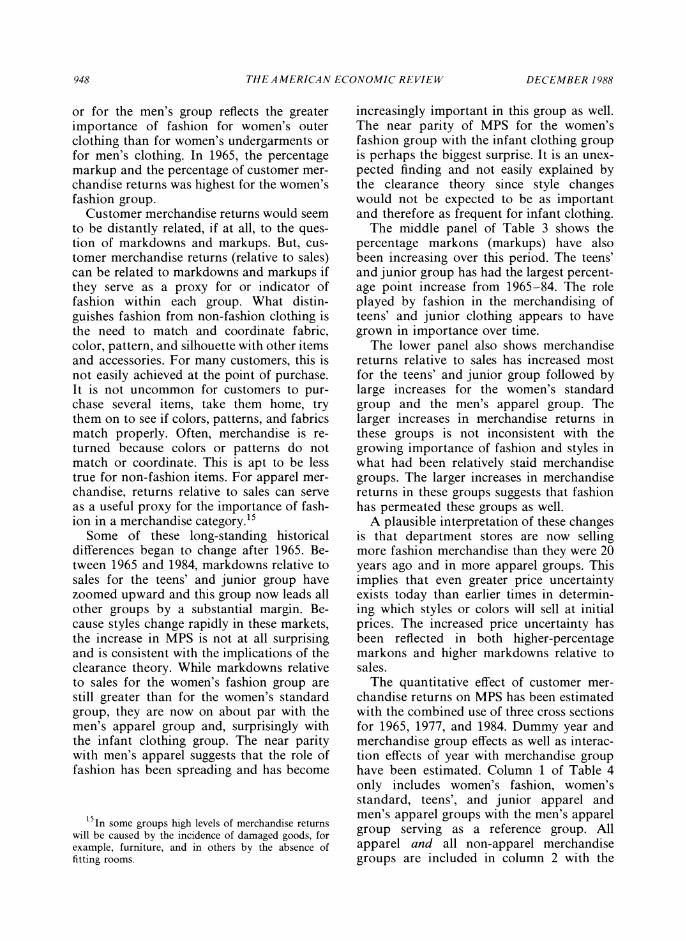
14The "all other departments" category includes a women's fashion group and for the teens' diverse collection of merchandise ranging from bed sheets to small home appliances to major appliances. and junior group than for the other groups. Some of t h s merchandise, for example, home furnish- The l g h e r MPS for the women's fashon ings, is subject to fashion trends and changes. Major group than for the women's standard group durables are not immune to color and style changes but are less subject to fashon changes. The average MPS for the radio and audio appliances, television and major appliances departments increased from 5.7 percent in 1977 to 7.8 percent in 1984 or by 38 percent which is indicates fashon changes have had a greater impact on lower than the mean increase of 68 percent for the five apparel merchandise than on some other types of mer- apparel groups listed in Table 3. Thls comparison also chandise sold in department stores.
948 T H E A IMERICAW FlCOh'OMIC REVIEM,' DECEMBER 1988
or for the men's group reflects the greater importance of fashion for women's outer clothng than for women's undergarments or for men's clothing. In 1965, the percentage markup and the percentage of customer mer- chandise returns was highest for the women's fashion group.
Customer merchandise returns would seem to be distantly related, if at all, to the ques- tion of markdowns and markups. But, cus- tomer merchandise returns (relative to sales) can be related to markdowns and markups if they serve as a proxy for or indicator of fashion withn each group. What distin-guishes fashion from non-fashon clothng is the need to match and coordinate fabric, color, pattern, and silhouette with other items and accessories. For many customers, this is not easily achieved at the point of purchase. It is not uncommon for customers to pur- chase several items, take them home, try them on to see if colors, patterns, and fabrics match properly. Often, merchandise is re-turned because colors or patterns do not match or coordinate. T h s is apt to be less true for non-fashon items. For apparel mer- chandise, returns relative to sales can serve as a useful proxy for the importance of fash- ion in a merchandise category.15
Some of these long-standing hstorical differences began to change after 1965. Be- tween 1965 and 1984, markdowns relative to sales for the teens' and junior group have zoomed upward and t h s group now leads all other groups by a substantial margin. Be-cause styles change rapidly in these markets, the increase in MPS is not at all surprising and is consistent with the implications of the clearance theory. Whle markdowns relative to sales for the women's fashon group are still greater than for the women's standard group, they are now on about par with the men's apparel group and, surprisingly with the infant clothng group. The near parity with men's apparel suggests that the role of fashion has been spreading and has become
15In some groups high levels of merchandise returns will be caused by the incidence of damaged goods, for example, furniture, and in others by the absence of fitting rooms.
increasingly important in t h s group as well. The near parity of MPS for the women's fashion group with the infant clothng group is perhaps the biggest surprise. It is an unex- pected finding and not easily explained by the clearance theory since style changes would not be expected to be as important and therefore as frequent for infant clothing.
The middle panel of Table 3 shows the percentage markons (markups) have also been increasing over t h s period. The teens' and junior group has had the largest percent- age point increase from 1965-84. The role played by fashion in the merchandising of teens' and junior clothng appears to have grown in importance over time.
The lower panel also shows merchandise returns relative to sales has increased most for the teens' and junior group followed by large increases for the women's standard group and the men's apparel group. The larger increases in merchandise returns in these groups is not inconsistent with the growing importance of fashon and styles in what had been relatively staid merchandise groups. The larger increases in merchandise returns in these groups suggests that fashon has permeated these groups as well.
A plausible interpretation of these changes is that department stores are now selling more fashion merchandise than they were 20 years ago and in more apparel groups. T h s implies that even greater price uncertainty exists today than earlier times in determin- ing which styles or colors will sell at initial prices. The increased price uncertainty has been reflected in both hgher-percentage markons and higher markdowns relative to sales.
The quantitative effect of customer mer-chandise returns on MPS has been estimated with the combined use of three cross sections for 1965, 1977, and 1984. Dummy year and merchandise group effects as well as interac- tion effects of year with merchandise group have been estimated. Column 1 of Table 4 only includes women's fashon, women's standard, teens', and junior apparel and men's apparel groups with the men's apparel group serving as a reference group. All apparel and all non-apparel merchandise groups are included in column 2 with the

V O L . 78 Y O . 5 PASHIGIA,V. DEMA'VD D“VCERTAIWTY A,VD S A L E S
TABLE~ - ~ ~ A K K D O W N SRELATIVETO SALES,1965, 1977, AND 1984, APPARELITEMS AND ALL MERCHANDISE ONLY GROUPS
(I-statistic below coefficient estimate)
Only Women's Teens', and All Merchandise Men's Apparel Groups Groups
(1) (2)
1. Constant 3.51 3.11 2.7 3.8
2. Year, 1977 - .47 .09 .2 .07
3. Year, 1984 2.40 2.46 1.1 1.6
4. Women's Fashlon 1.74 4.00 1.3 4.2
5. (Women's Fashion, 1977) - 1.68 - .15 .8 . I1
6. (Women's Fashion, 1984) -3.35 1.73 1.8 1.2
7. Men's 1.57 1.1
8. Men's 1977 2.60
9. Men's 1984
10. Women's Standard
11. (Women's Standard, 1977)
12. (Women's Standard, 1984)
13. Teens'
14. (Teens', 1977)
15. (Teens', 1984)
16. Infants
17. (Infants', 1977)
18. (Infants', 1984)
19. Merchandise Returns .55 4.4
20. (Merchandise Returns, 1977) .54 2.7
21. (Merchandise Returns, 1984) .88 4.7
R~ (adj) .78 Standard Error
of Regression 3.49 N 151
Note: For sources, see Data Appendix

950 T H E ,4 MERIC,4 N ECO!VO.MIC REVIE M: DECEMBER I988
"all other" group serving as the reference group.
The effect of fashion on MPS in the cross-section regressions should be captured through the coefficient of the variable for " merchandise returns. If fashon is more im- portant in a group, then customer merchan- dise return rates will be higher in that group. Under t h s assum~tion the merchandise re-turns variable will be a significant determi- nant of MPS. Over time, as merchandise return rates have increased, there will be a corresponding increase in MPS as long as merchandise returns is an effective proxy for fashon.16
Regression results are presented in Table 4. The constant in column 1 is significantly different from zero whle the coefficients of the year dummy variables are not statisti-cally significant. Hence, the intercept for men's clothing has not increased signifi-cantly over time. The coefficients for the other groups and group-year interaction dummy variables tend not to be significant except for women's fashlon in 1984, women's standard in 1965, and teens' in 1965. More importantly, all three of the coefficients of the merchandise return variables are ~osi t ive and significant. This means that in any year groups with higher merchandise return rates have higher-dollar markdowns relative to dollar sales. Assuming merchandise returns serve as a proxy for fashon, this finding suggests that fashion and MPS are directly related. The com~arative size of the three coefficients means a 1 percentage point in- crease in the merchandise return rate in-creases MPS more in 1984 than it did in 1977 and more in 1977 than it did in 1965.
Very similar results are obtained when all merchandise groups are included (column 2). The reference group in t h s regression is the "other" group. The intercept is significant in 1984 but not in 1977, so there is some evi- dence that MPS increased by about 2.5 per-
16While the rise in merchandise return rates over time could be due to the increase in lower-quality imports, thls is not plausible given the rising relative price of apparel imports over time. The quality of imports has been rising, not falling over time.
centage points between 1977 and 1984 in the "other" group after remaining constant be- tween 1965 and 1977. Assuming the fashon element is less important for products in the "other" group, this result suggests that some factors caused MPS to increase between 1977 and 1984. The estimated coefficients for the dummy variables indicate that the MPS for women's fashion and the teens' groups was significantly higher than the "other" group in 1965. By 1984, the MPS of the men's group, women's standard, teens', and infants has increased relative to the MPS of the "other" group.
The coefficients of the merchandise return variables are once again positive and signif- icant. These results also indicate groups with higher merchandise return rates have hgher-dollar markdowns relative to dollar sales. It is mildly comforting that the coef- ficients of the merchandise return variables are smaller when all groups are included than when only apparel groups are included. Because merchandise returns are less likely to be due to fashion reasons for items in the "other" group, the coefficients of the mer-chandise return variables would be expected to be lower when all groups are included in the regression. The increase over time of the effect of merchandise returns on MPS is left unexplained. T h s unexplained result sug-gests that the merchandise return measure is only an imperfect proxy for the importance of fashion. One obvious limitation of this analysis is that the effect of imports on MPS is not accounted for in these regressions.17
These results imply that the differences in MPS between groups are related in part to differences in merchandise return rates. In each of the three cross sections merchandise return rates were a significant determinant of MPS. A partial reason for the rise in MPS for teens' between 1965 and 1984 is that the merchandise return rates increased most in this group. Similarly, the narrowing of the differentials between the MPS of the women's
17The absence of detailed import data for all prod- ucts sold by department stores prevents a more compre- hensive study.

-- -
951 V O L . 78 NO. 5 PASHIGI,4 W. DEM,4,ND D'WCERT,41,VTY A N D S A L E S
fashion group and the MPS of the other apparel groups is that return rates have in- creased relatively more in these other ap- parel groups. These results provide some support for the notion that fashion and product diversity have grown in importance in these other apparel groups as well.
IV. Summary
The recent and large increases in mark- downs relative to dollar sales and the per- centage markup appear to be related to the growing importance of fashon and product assortment. The theory of clearance sales is helpful in explaining and understanding these recent trends. It predicts a rise in the percentage markup and the dollar mark-downs relative to dollar sales when price uncertainty increases and price uncertainty increases when more fashion-type merchan- dise is sold. Though markdowns relative to dollar sales have been hstorically larger for women's fashion merchandise than for women's undergarments, or for men's ap-parel, these differences have been narrowing since the mid-1960s. Markdowns relative to dollar sales for men's clothng are approach- ing those for women's fashion clothng. It is now larger for teens' and junior clothng than for any other apparel groups. T h s mar- ket evidence certainly suggests the role of fashion has expanded in recent years to en- compass other apparel groups in addition to women's fashion clothng.
The clearance theory has proven helpful in understanding recent time-series trends, in explaining differences in markdown policies between merchandise groups and in explain- ing why markdowns peak in July and Jan- uary, the end of the spring-summer and fall-winter seasons. These major regularities are not easily explained by other theories of sales. Still, not all sales can be explained by the clearance theory. Temporary promo-tional sales cannot be avoided by even the most casual reader of newspaper ads. These short-term price promotions are more dif-ficult to explain. It is unclear whether exist- ing primitive theories of temporary sales have enough testable implications to explain this type of sale.
The question of why fashlon has become more important in recent years has been touched upon but only briefly. Fashion is undoubtedly a superior good. Yet mark-downs and markups only began to rise around 1970 even though real per capita income has been increasing throughout the post-World War I1 period. T h s suggests the underlying explanation for the growing im- portance of fashion apparel may be found on the supply side and not the demand side. Though the preliminary time-series results failed to offer confirming evidence. the trend toward fashion may b i due to the recent technological changes in the weaving and knitting of fabric. These changes have low- ered the set-up cost of changing designs and patterns and thereby reduced the cost of producing short runs of fashon fabric. The deeper cause for the growing role of fashion may spring from these technological changes.
DATA APPENDIX
Figure 1: 1925-1960: Markdowns relative to dollar sales and
markon re~or ted in Malcolm P. McNair and Eleanor G. May, ~ h e ~ m e r i c a nDepartment Store, 1920- 1960, pp. 22-25
1961-1965: Markon estimated by taking the markon figures reported in National Retail Merchants Associa- tion, Merchandising and Operating Results of Depart-ment and Specialty Stores in 1965 and multiplying by 1.054 to adjust for the average percentage difference (in 1959 and 1960) between the level of markon reported by McNair and May and by the National Retail Mer- chants Association.
1966-1984: Markdowns relative to dollar sales and markon reported in selected issues of National Retail Merchants Association, Department and Specialfv Store Financial and Operating Results, annual.
Figure 2: Data for color of sheets are reported in Bureau of
Census, Sheets, P~llowcases, and Towels, Current In- dustrial Reports, MQ 23X. Market shares are based on value of shipments of flat and fitted sheets (except crib) by U.S. mills. Market shares are calculated from the sale of all types of sheets from 1960-74; from the sale of polyester-cotton blends from 1975-82 (major share of the market); and from all sheet sales from 1983-86.
Figure 3: Men's Dress Shirts: Data for color of men's dress
shirts were kindly supplied by Cluett Peabody and Company and are based on diary records of a panel sponsored by the Market Corporation of America. These data are purchased and used by numerous retailing and
952 T H E 4 MERICA,V ECO"V0MIC REVIEM DECEMBER 1988
the textile firms to study market trends. Panel composi- tion has changed periodically over the years so the data are not strictly comparable from year-to-year (the latest change occurred in 1983). Still, the large change from the 1960s to the 1980s in color used is primarily due to changes in the demand for colors and not to changes in the composition of the panel.
Women's Sportswear: Data for the market share of women's sportswear are derived from data published in the Census of Busmess-Retall Trade, Merchandise Line Sales.
For 1963-1967, the total market is defined as the sum of dollar sales of dresses (merchandise line code MLC 167 for department stores and MLC 172 for women's ready-to-wear stores) and women's sportswear (MLC 168 for department stores and MLC 168 for women's ready-to-wear) and is limited to combined sales of dresses and sportswear reported by department stores (SIC 531) and women's ready-to-wear (SIC 562) stores.
For 1972, dollar sales of dresses are for MLC 167 for department stores, MLC 224 for women's ready-to-wear, and family clotlung stores (SIC 565). Dollar sales of women's sportswear are for MLC 226 for department stores, ready-to-wear, and family clothng stores.
For 1977, dollar sales of dresses are for MLC 224 for department, ready-to-wear, and family clothng stores. Dollar sales of sportswear are for MLC 227 and 228 by department, ready-to-wear, and family clothing stores.
For 1984, dollar sales of dresses are for MLC 223 by department, ready-to-wear, and family clothing stores. Dollar sales of sportswear are the sum of sales totals for MLC 225, 226, 227, and 228. Suits are combined with pantsuits, sports jackets, and blazers in MLC 225 and cannot be excluded from the sportswear totals in 1982. Suits are excluded from the sportswear totals in previ- ous years.
Table 2: Clothng Imports Divided by Shpments of Apparel
Industry: Clothing imports reported in annual issues of Statis-
tical Abstract of the United States. Figures originally reported in U.S. Department of Commerce, Interna- tional Trade Administration, Overseas Business Re-ports, U . S . Foreign Trade, annual.
Value of Shipments for the Apparel and Other Tex- tile Products (SIC 23), U.S. Bureau of Census, Annual Surr~ey of Manufacturers, annual. Shipments from 1956 to 1960 are not available. Shpments for these years were estimated by multiplying the reported industry value added totals in each year by 2.214725. Percent of the Population between 15 and 34: U.S. Bureau of Census, Current Population Reports, Series P-25, Nos. 985,917,721,519,311.
Percent of Shuttleless Looms: U.S. Bureau of Cen- sus, Broadworren Fabrics (Gray), Current Industrial Re- ports, MQ 22T. Number of shuttleless looms first re-ported in 1968. Market share of shuttleless looms in 1968 was.2.2 percent. Market share of shuttleless looms is assumed to be zero from 1956 to 1965. Market share of shuttleless looms was linearly extrapolated between 1965 and 1968.
Tables 3 and 4: Data are taken from annual publication by the Na-
tional Retail Merchants Association in 1965, 1977, and 1984. The 1965 publication is entitled, Merchandislng and Operating Results of Department and Specialty Stores in 1965. The 1977 publication is entitled, Department and Specialty Store Merchandising and Operating Results of 1977. The 1984 edition is entitled, Department and Specialty Store Merchandising and Operating Results of 1984. These publications report operating results by department or demand center. The classification system for departments was revised between 1965 and 1977 so the system used in 1965 is different from the systems used in 1977 and 1984. The definition of each of the variables is reported in each publication. The author classified the departments into the groups reported in Tables 3 and 4.
REFERENCES
Arpan, Jeffrey S., de la Torre, Jose and Toyne, Brian et al., The U.S. Apparel Industry: In- ternational Challenge, Domestic Response, Georgia State University, 1978.
Cline, William R., The Future of World Trade in Textiles and Apparel, Institute for Inter- national Economics, 1987.
Greenwood, Kathryn M. and Murphy, Mary F., Fashion Innovation and Marketing, New York: Macmillan, 1978.
Grinstead, L. H., "The Reasons for the Ex- tent of Markdowns in Ohio Department Stores," Bureau of Business Research, College of Commerce and Administration, Ohlo State University, 1932.
Lazear, Edward P., "Retail Pricing and Clear- ance Sales," American Economic Review, March 1986, 76, 14-32.
McNair, Malcolm P. and May, Eleanor G., The Amerlcan Department Store, 1920 -1960, Bureau of Business Research, Bulletin No. 166, Harvard University, 1963.
Olsen, Richard Paul, The Textile Industry, Lex-ington: Lexington Books, 1970.
Pashigian, B. Peter, "Demand Uncertainty and Sales: A Study of Fashlon and Markdown Pricing," Center for the Study of the Econ- omy and the State, Working Paper No. 49, 1987.
Salop, Steven and Stiglitz, Joe E., "The Theory of Sales: A Simple Model of Equilibrium Price Dispersion with Identical Agents," American Economic Review, December 1982, 72, 1121-30.
Varian, Hal R., "A Model of Sales," American
Economic Review, September 1980. 70, 651-59.
Financial Executives Division, National Retail Merchandise Association, Merchandising and Operating Results of Department and Specialty Stores, New York. New York.
U.S. Bureau of Census, Annual Survey of Manufacturers. annual.
,Census of Business-Retail Trade. ,Current Industrial Reports, Broad-
woven Goods, (MQ-22T).
,Current Industrial Reports, Sheets, Pillowcases and Towels (MQ23X).
, Current Population Reports, Series P-25.
, Stutistical Abstract of the United States, Washington: USGPO, annual.
U.S. International Trade Commission, Cr.S. Glo- bal Competitiveness: The U.S. Textile Mill Industry, USITC Publication 2048, De-cember 1987.
You have printed the following article:
Demand Uncertainty and Sales: A Study of Fashion and Markdown PricingB. Peter PashigianThe American Economic Review, Vol. 78, No. 5. (Dec., 1988), pp. 936-953.Stable URL:
http://links.jstor.org/sici?sici=0002-8282%28198812%2978%3A5%3C936%3ADUASAS%3E2.0.CO%3B2-%23
This article references the following linked citations. If you are trying to access articles from anoff-campus location, you may be required to first logon via your library web site to access JSTOR. Pleasevisit your library's website or contact a librarian to learn about options for remote access to JSTOR.
References
Retail Pricing and Clearance SalesEdward P. LazearThe American Economic Review, Vol. 76, No. 1. (Mar., 1986), pp. 14-32.Stable URL:
http://links.jstor.org/sici?sici=0002-8282%28198603%2976%3A1%3C14%3ARPACS%3E2.0.CO%3B2-3
The Theory of Sales: A Simple Model of Equilibrium Price Dispersion with Identical AgentsS. Salop; J. E. StiglitzThe American Economic Review, Vol. 72, No. 5. (Dec., 1982), pp. 1121-1130.Stable URL:
http://links.jstor.org/sici?sici=0002-8282%28198212%2972%3A5%3C1121%3ATTOSAS%3E2.0.CO%3B2-4
A Model of SalesHal R. VarianThe American Economic Review, Vol. 70, No. 4. (Sep., 1980), pp. 651-659.Stable URL:
http://links.jstor.org/sici?sici=0002-8282%28198009%2970%3A4%3C651%3AAMOS%3E2.0.CO%3B2-A
http://www.jstor.org
LINKED CITATIONS- Page 1 of 1 -


![[Infographic] Proven Sales Growth Strategies for Fashion Retailers](https://img.pdfslide.us/doc/110x75/58ce9d481a28abb26e8b46e5/infographic-proven-sales-growth-strategies-for-fashion-retailers.jpg)