Embed Size (px)
Citation preview

Demand
Lecture 3
Reading: Perlo¤ Chapter 4
August 2015
1 / 58

Introduction
We saw the demand curve in chapter 2.
We learned about consumer decision making in chapter 3.
Now we bridge the gap between the two concepts.
In this lecture, we see how the demand curve is derived.
2 / 58

Outline
Deriving demand curves - Use consumer theory to see how achange in price causes a movement along demand.
E¤ects of an increase in income - How does an income changea¤ect demand?
E¤ects of a price increase - How does the change in price a¤ectdemand?
Cost-of-Living Adjustment - How do policy makers measure pricechanges?
Revealed preferences - We can recover an individual�s preferencesby observing their demand.
3 / 58

Deriving the Demand Curve
The demand curve plots quantity demanded against the price.If we want to draw my demand curve for beer, we need to �nd myoptimal consumption of beer for di¤erent prices.
We can do this derive demand graphically or analytically.
4 / 58

Deriving the Demand Curve
We do it graphically �rst.
The optimal bundle occurs where the indi¤erence curve is tangent tothe budget constraint.
The intercepts of the budget constraint for goods q1 and q2 are Yp1
and Yp2.
If the price of a good 1 decreases, the budget constraint will rotateout and we have a new optimal bundle.
5 / 58
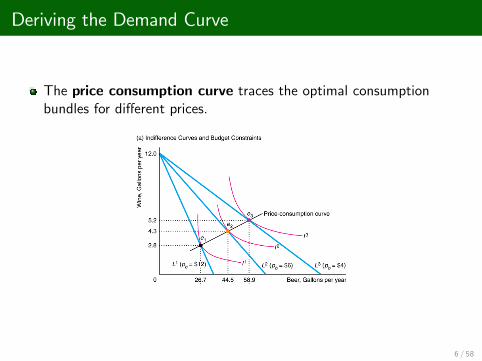
Deriving the Demand Curve
The price consumption curve traces the optimal consumptionbundles for di¤erent prices.
6 / 58
Deriving the Demand Curve
I drink 26.7 gallons of beer when the price of beer is $12, 44.5 gallonswhen it is $6, and 58.9 gallons when it is $4.
Just plot this points in price of beer and gallons of beer consumedspace and we have demand.
7 / 58

Deriving the Demand Curve
8 / 58

Deriving the Demand Curve
EXAMPLE
Let�s graphically derive the demand curve for wine (the good on thevertical axis).
9 / 58

Deriving the Demand Curve
We can do the same thing using math.
We want to �nd the optimal consumption of a good for di¤erentprices.
10 / 58

Deriving the Demand Curve
If we have a Cobb Douglas utility function
U(q1, q2) = (q1)a (q2)
1�α
Knowing that the optimal bundle occurs where MRS = p1p2we can
�nd the demand curves.
The marginal rate of substitution is
MU1MU2
=∂U/∂q1∂U/∂q2
=a (q1)
a�1 (q2)1�α
(1� a) (q1)a (q2)�α =a
1� aq2q1
11 / 58

Deriving the Demand Curve
Set this equal to the price ratio to �nd the optimal consumption ratio.
a1� a
q2q1
=p1p2
) a1� a
q2q1p2 = p1
Plug this into the budget constraint Y = q1p1 + q2p2 and solve forq2.
q2 = (1� a)Yp2
We would solve for p2 and plug that into the budget constraint to�nd demand for q1.
12 / 58

EXAMPLE
Find the demand curve for good x1 for the utility function U = x1x2.
13 / 58

EXAMPLE
Find the demand curve for good x1 for the utility functionU = ln (x1) + x2.
What does this tell you about quasi-linear utility functions?
14 / 58

EXAMPLE
Find the demand curve for x1 for the utility function U = minfx1, x2g.
15 / 58

EXAMPLE
Find the demand curve for x1 for the utility functionU = maxfx1, x2g.
16 / 58
E¤ect of an Increase in Income
If the price of beer changes, we move along the demand curve forbeer.
If something other than the price of beer changes (which a¤ects howmuch beer you drink) the demand curve shifts.
Now lets look at what happens when our income changes
17 / 58

E¤ect of an Increase in Income
a change in income leads to a parallel shift in the budget constraint(the intercepts are Y
p1and Y
p2, leading to a new optimal bundle).
The income consumption curve plots the optimal consumptionlevels of beer and wine for di¤erent levels of income.
18 / 58

E¤ect of an Increase in Income
Our income is higher. At every price we will now demand more beerso our demand curve shifts right.
19 / 58

E¤ect of an Increase in Income
It is also useful to draw the Engel curve, which shows therelationship between quantity demanded of a single good and income.
20 / 58

E¤ect of an Increase in Income
We mentioned income elasticity of demand before, this tells us theshape of the income consumption curve and the Engel curve.
Income elasticity of demand ξ tells us the percentage change inquantity demanded to a given percentage change in income.
ξ =%∆Q%∆Y
=∆Q/Q∆Y /Y
=∆Q∆Y
YQ
and as ∆Q and ∆Y go to zero we just use calculus
ξ =∂Q∂Y
YQ
21 / 58
E¤ect of an Increase in Income
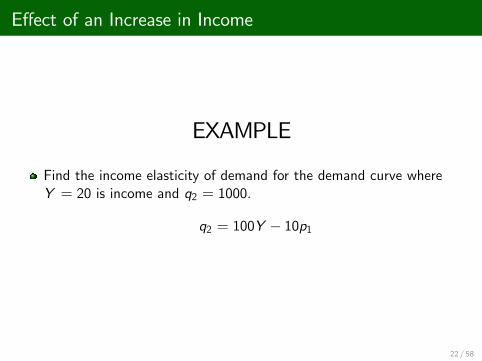
EXAMPLE
Find the income elasticity of demand for the demand curve whereY = 20 is income and q2 = 1000.
q2 = 100Y � 10p1
22 / 58

E¤ect of an Increase in Income
Is this always positive?
That is, does any increase in income always lead to an increase inquantity demanded?
Of course not, there are some goods you only consume when you arepoor.
23 / 58
E¤ect of an Increase in Income
If ξ > 0, a good is a normal good, we demand more of it whenincome rises.
If ξ < 0 , it is an inferior good, we demand less of it when incomerises.
if ξ > 1, we say it is a luxury good, quantity demanded rises more inproportion to a person�s income.
If 0 � ξ � 1 it is a necessity.
24 / 58

E¤ect of an Increase in Income
Books
ξ = 1.44
Restaurant Meals
ξ = 1.40
Tobacco
ξ = .64
Public Transportation
ξ = �.36Automobiles
ξ = 2.46
25 / 58

E¤ect of an Increase in Income
The shape of the income consumption curve is determined by incomeelasticities.Income increases, do we consume more or less of a good?
26 / 58

E¤ect of an Increase in Income
EXAMPLE
Is x1 a normal good or an inferior good if the demand for x1 is
x1 = (1� a)Yp1
27 / 58

E¤ect of an Increase in Income
EXAMPLE
Draw the income consumption curve and the Engel curve for a goodwhich is normal for low levels of income and inferior for high levels ofincome.
28 / 58

E¤ect of an Increase in Income
It is not possible for all goods to be inferior.
If both goods are inferior, the consumer would purchase less of bothgoods as income goes up.
This new basket would like in her original budget set, this violates theaxiom of revealed preferences.
29 / 58

E¤ects of a Price Increase
What exactly happens when prices change?
We can break a price change down into the income e¤ect and thesubstitution e¤ect.Income e¤ect + substitution e¤ect = total e¤ect of a price change.
30 / 58

E¤ects of a Price Increase
Suppose we have apples and oranges, and the price of applesdecreases.
Apples are now relatively cheaper than oranges.
If we were to hold utility constant, the consumer will alwayssubstitute towards the relatively cheaper good.
The substitution e¤ect always works in this direction.
31 / 58

E¤ects of a Price Increase
BUT, the change in price changes the consumers purchasing power.
If the price of apples went down, it is just as if I am richer. I can usethe leftover money to purchase more apples or more bananas.
The change in quantity demanded as a result of the change inpurchasing power, holding relative prices constant, is the incomee¤ect.We don�t always know which way this works.
32 / 58

E¤ects of a Price Increase
Recall that if a good is inferior, an increase in income will cause youto consume less of that good.
If a good is normal, an increase in income will cause you to consumemore of that good.
33 / 58

E¤ects of a Price Increase
Notice the income and substitution e¤ect go the same way... thegood below is normal.
34 / 58

E¤ects of a Price Increase
With an inferior good, you eat less of it when your income goes up(and more when it goes down).
The income and substitution e¤ects work in opposite directions.
35 / 58

E¤ects of a Price Increase
EXAMPLE
Lets show the income and substitution e¤ects when a good is inferior.
36 / 58

E¤ects of a Price Increase
Suppose the price of q1 decreases.
The substitution e¤ect will cause you to consume more q1.If q1 is inferior, the income e¤ect will cause you to consume less q1.If the income e¤ect causes you to consume less of q1 than you didinitially, this good is a Gi¤en good.
37 / 58

E¤ects of a Price Increase
That is, a decrease in the price will cause you to consume less of thatgood if it is Gi¤en.
Gi¤en goods violate the law of demand (their demand curves slopeupwards).
Potatoes during the Irish potato famine were an example of a Gi¤engood.
The price of potatoes went up and people started consuming morepotatoes.
38 / 58
E¤ects of a Price Increase
EXAMPLE
Lets draw the income and substitution e¤ects for a Gi¤en good.
39 / 58

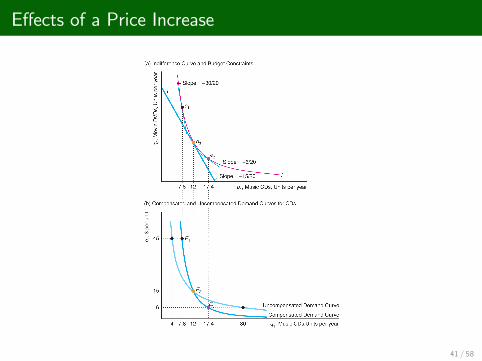
E¤ects of a Price Increase
At the start of the lecture, we derived the Marshallian demand.The Marshallian demand curve shows the total e¤ect of a pricechange (both the income and substitution e¤ect).
Compensated (or Hicksian) looks at the change in demand from aprice change resulting only from the substitution e¤ect.
Utility is constant at all points on the compensated demand curve.
We cannot observe compensated demand because we cannot observeutility levels.
40 / 58
E¤ects of a Price Increase
41 / 58

E¤ects of a Price Increase
The law of demand must hold for compensated demand curves.Why?
If the good is normal, the uncompensated demand curve will beshallower because the income e¤ect reinforces the substitution e¤ect.
If the good is inferior, the uncompensated demand curve will besteeper because the income e¤ect and substitution e¤ect work inopposite directions.
42 / 58

E¤ects of a Price Increase
EXAMPLE
Graphically derive the compensated and uncompensated demandcurves for an inferior good.
43 / 58
E¤ects of a Price Increase
EXAMPLE
Will the compensated demand curve of a Gi¤en good slopedownwards? Why?
44 / 58

E¤ects of a Price Increase
We saw price changes broken down into income and substitutione¤ects on a graph.
Now lets do it with math. This is called the Slutsky equation.
45 / 58

E¤ects of a Price Increase
We want to know how demand changes when the price changes.
We are looking for ε, the price elasticity of demand.
The price elasticity of demand can be broken down into the incomee¤ect and the substitution e¤ect.
46 / 58

E¤ects of a Price Increase
ε� the substitution elasticity of demand, the percentage change indemand for a given increase in price compensating the consumer tokeep utility constant. (substitution e¤ect)
ξ � θ, which is the income elasticity of demand ξ times the share ofbudget spent on the good θ.
ε = ε� + (�θ � ξ)
The larger is the θ, the larger is the income share of the good. Whatdoes this tell you about Gi¤en goods?
47 / 58

E¤ects of a Price Increase
EXAMPLE
You spend 34 of your income on potatoes. The income elasticity of
demand for potatoes is �4.The substitution elasticity of demand is �1.What can you say about potatoes?
48 / 58

Cost of Living Adjustments
The price of goods rise over time, and we have seen what consumersdo when the price of goods rises.
It is important to have an accurate measure of price changes. Thinkof long-term employment contracts which tract some measure of pricechanges.
The government frequently uses the consumer price index (CPI),which measures the cost of a given bundle of goods over time.
49 / 58

Cost of Living Adjustments
The consumer price index identi�es a "typical" basket of goods.For example, the basket of goods can be 3 bananas, 3 oranges and acar.
The CPI measure the price of this basket of goods over time.
50 / 58

Cost of Living Adjustments
Suppose the price of oranges increases much faster than the price ofbananas.
A contract which tracks the CPI would compensate you for theincrease in the price of bananas... but ignores the fact that people willsubstitute towards oranges.
The CPI overcompensates people for in�ation by ignoring the factthat substitution towards cheaper goods occurs.
51 / 58
Cost of Living Adjustments
We need a cost-of-living adjustment that takes the substitution intoaccount.
Utility is what we want to keep constant over time.
Should give people just enough more money such that their utilityremains the same.
52 / 58

Revealed Preferences
It is never possible to exactly see people�s preferences.
Preferences can be recovered, however, by observing purchasingbehaviour of individuals.
Recovering preferences from observed behaviour is known as thetheory of revealed preferences.
53 / 58

Revealed Preferences
For example.
Suppose bundle a is more expensive than bundle b.
If the consumer purchases bundle a, we can say that this individualprefers bundle a to bundle b.
Both a and b were available, and the consumer picked a.
As we observe the consumer�s behaviour in more situations, we canlearn more about her preferences.
54 / 58

Revealed Preferences
55 / 58

Revealed Preferences
EXAMPLEThe consumer faces budget line BL1 yesterday and chose bundle a.The consumer faced budget line BL2 today and chose bundle b.Use the concept of revealed preferences to show she is better o¤today than yesterday.
56 / 58
Summary
How do you derive the demand curve?
What is the income consumption curve and the price consumptioncurve?
What is the Engel curve?
What is the substitution e¤ect and income e¤ect?
57 / 58

Summary
What is an inferior good?
What is a Gi¤en good?
What is the di¤erence between compensated and uncompensateddemand?
What is the Slutsky equation?
Why does the CPI overcompensate for price changes?
What are revealed preferences?
58 / 58