Embed Size (px)
Citation preview

ORNL/TM-2006/565
Demand Response For Power System Reliability: FAQ
December 2006 Prepared by B. J. Kirby Oak Ridge National Laboratory

This report was prepared as an account of work sponsored by an agency of the United States Government. Neither the United States government nor any agency thereof, nor any of their employees, makes any warranty, express or implied, or assumes any legal liability or responsibility for the accuracy, completeness, or usefulness of any information, apparatus, product, or process disclosed, or represents that its use would not infringe privately owned rights. Reference herein to any specific commercial product, process, or service by trade name, trademark, manufacturer, or otherwise, does not necessarily constitute or imply its endorsement, recommendation, or favoring by the United States Government or any agency thereof. The views and opinions of authors expressed herein do not necessarily state or reflect those of the United States Government or any agency thereof.
DOCUMENT AVAILABILITY Reports produced after January 1, 1996, are generally available free via the U.S. Department of Energy (DOE) Information Bridge:
Web site: http://www.osti.gov/bridge Reports produced before January 1, 1996, may be purchased by members of the public from the following source:
National Technical Information Service 5285 Port Royal Road Springfield, VA 22161 Telephone: 703-605-6000 (1-800-553-6847) TDD: 703-487-4639 Fax: 703-605-6900 E-mail: [email protected] Web site: http://www.ntis.gov/support/ordernowabout.htm
Reports are available to DOE employees, DOE contractors, Energy Technology Data Exchange (ETDE) representatives, and International Nuclear Information System (INIS) representatives from the following source:
Office of Scientific and Technical Information P.O. Box 62 Oak Ridge, TN 37831 Telephone: 865-576-8401 Fax: 865-576-5728 E-mail: [email protected] Web site: http://www.osti.gov/contact.html

ORNL/TM-2006/565
Demand Response For Power System Reliability: FAQ
Prepared for the Office of Electricity Delivery and Energy Reliability
Transmission Reliability Program U.S. Department of Energy
Phil Overholt
Principal Author Brendan Kirby
December 2006
Prepared by
OAK RIDGE NATIONAL LABORATORY Oak Ridge, Tennessee 37831-6070
managed by UT-BATTELLE, LLC
for the U.S. DEPARTMENT OF ENERGY
under contract DE-AC05-00OR22725

iii
CONTENTS
Page
1. INTRODUCTION ...........................................................................................................1 2. FREQUENTLY ASKED QUESTIONS..........................................................................2
A What types of response can load provide? ..................................................................... 2 B What are the reliability services?....................................................................................2 C Which reliability services might responsive loads provide? .............................................3 D How are ancillary services characterized?.......................................................................5 E How often are spinning reserves called upon? What response length is required................6 F Why are some loads a particularly good match for power system reliability requirements?.8 G Why would loads rather provide reliability response than peak reduction?........................9 H How are ancillary services valued and what are the prices?..............................................9 I Why is regulation always the highest priced ancillary service? ........................................13 J What determines contingency reserve market prices? .....................................................15 K What characteristics are required for load to provide reliability services? What types of
loads have these characteristics? ................................................................................15 L Can load response really provide the critical spinning reserve reliability function? Isn’t it
better to let load provide peak reduction and replacement reserves? .............................16 M Do responsive loads have the technical capability to provide regulation? .......................16 N Do current reliability rules discriminate against responsive load?...................................19 O Should system operators encourage and facilitate load response? ...................................19 P Why not deploy responsive loads sequentially to meet the duration requirement? ............20 Q How is it that a responsive load can provide more capacity by supplying spinning reserve
than by providing peak reduction? .............................................................................21 R Will using responsive loads hurt power system stability?...............................................23 S Do customer overrides and voluntary response reduce the reliability value of load
response? .................................................................................................................24 T Is real-time monitoring needed or practical for responsive load? Does statistical response
help?........................................................................................................................24 U Will demand response forecast errors adversely impact reliability? ................................26 V Should demand response be treated as a regulated asset? ...............................................27 W Do NERC rules address demand response?..................................................................28 X How do Regional Reliability Councils treat reliability demand response? .......................28 Y Do capacity markets help or hurt demand response?......................................................29 Z Why is it so difficult for new technologies to gain acceptance in supplying power system
reliability?................................................................................................................31 AA Is co-optimization compatible with demand response? ...............................................32
3. CONCLUSIONS AND RECOMENDATIONS............................................................34 ACKNOWLEDGMENT....................................................................................................35 REFERENCES ..................................................................................................................36

iv
LIST OF FIGURES Figure Page
1 All five basic types of demand response impact power system reliability. .............2 2 Response time and duration differentiate ancillary services....................................5 3 Frequency immediately drops and spinning reserves respond autonomously in this
example where two nuclear plants tripped in ERCOT. ...........................................6 4 WECC experienced 77 events where frequency dropped by more than 0.1 hz
between January 1994 and February 2001...............................................................7 5 ISOs differ in the frequency of their use of contingency reserves but reserve
deployment is typically fairly short. ........................................................................7 6 Ideally, spinning and non-spinning reserves should be restored within 30 minutes
to prepare the system for the next contingency. ......................................................8 7 Monthly average regulation prices are typically (but not always) somewhat lower
than energy prices. .................................................................................................10 8 Ancillary service prices in all markets follow a pattern where regulation is most
expensive and replacement reserve is least expensive...........................................11 9 Regulation is always the most expensive ancillary service as shown by these 2005
monthly average ancillary service prices. ..............................................................12 10 June 2005 average hourly ancillary service prices show a consistent pattern. ......12 11 Regulation costs are dominated by generator opportunity costs. Cost at night can
be higher than during the day.................................................................................14 12 Regulation provides the minute-to-minute balancing of generation and load.......17 13 Thermal generators often fail to follow regulation commands closely. ................18 14 The 250 MW regulation requirement of a 30,000 MW control area (left) is
significantly reduced in terms of swing duration and swing frequency with the deployment of a simulated 50 MW of ideal regulation resource (right)................18
15 Which response best supports power system reliability? ......................................21 16 Significant spinning reserve capability remains even when demand reduction is in
effect, as shown in this 8/14/2002 curtailment. .....................................................22 17 WECC system stability is enhanced when 300 MW of responsive load (upper blue
curve) replaces an equal amount of generation (lower red curve). Stability runs performed by Donald Davies of WECC. ...............................................................23
18 Statistics from the LIPA Edge program show that manual override is not a problem during the spinning reserve time frame. The air-conditioning load matches the total load daily profile, as shown on this Monday, July 29, 2002. ....25
19 Larger numbers of individually less reliable responsive loads can provide greater aggregate reliability than fewer large generators...................................................26
20 Ancillary services contribute to capacity requirements just as peak load requirements do......................................................................................................30
21 The air-conditioning load matches the total load daily profile, as shown on this Monday, July 29, 2002...........................................................................................31
v
LIST OF TABLES Table Page
1 Definitions of Real-Power Ancillary Services......................................................4 2 Annual average and maximum ancillary service prices from four markets for
five years.............................................................................................................13 3 Current and pending ancillary service markets (adapted from MISO 2006)......29
vi
ACRONYMS CAISO California Independent System Operator ERCOT Electric Reliability Council of Texas FERC Federal Energy Regulatory Commission ISO-NE Independent System Operator of New England ISO Independent System Operator LIPA Long Island Power Authority MISO Midwest Independent System Operator MRO Midwest Reliability Organization MW megawatt MWh megawatt-hour of energy NERC North American Electric Reliability Council NYISO New York Independent System Operator PJM PJM Interconnection L.L.C. RFC Reliability First Corporation RRO regional reliability organization RTO regional transmission organization WECC Western Electricity Coordinating Council

1
1. INTRODUCTION Demand response is the largest underutilized reliability resource in North America. Historic demand response programs have focused on reducing overall electricity consumption (increasing efficiency) and shaving peaks but have not typically been used for immediate reliability response. Many of these programs have been successful but demand response remains a limited resource. The Federal Energy Regulatory Commission (FERC) report, Assessment of Demand Response and Advanced Metering (FERC 2006) found that only five percent of customers are on some form of demand response program. Collectively they represent an estimated 37,000 MW of response potential. These programs reduce overall energy consumption and they also reduce stress on the power system at times of peak loading. More recently demand response has begun to be considered, and in some cases actually used, to directly supply reliability services to the power system. Rather than reducing overall power system stress by reducing peak loading over multiple hours these programs are targeted to immediately respond to specific reliability events. This is made possible by advances in communications and controls and has benefits for the power system and the load. Unfortunately, preconceptions concerning load response capabilities, coupled with misunderstandings of power system reliability needs, are limiting the use of responsive loads. In many places loads are prohibited from providing the most valuable reliability services in spite of their being evidence that their response can be superior to that of generators. This is denying the power system of a valuable reliability resource. It is also denying loads the ability to sell valuable services. This report addresses a number of common misconceptions concerning responsive load and power system reliability interactions. It is structured as a set of short questions and answers and is intended for power system operators, planners, regulators, load owners, and other interested parties. The report is organized into three chapters. Chapter 1 is this introduction. Chapter 2 contains questions and answers on demand response and power system reliability. Chapter 3 provides conclusions and recommendations.
2
2. FREQUENTLY ASKED QUESTIONS
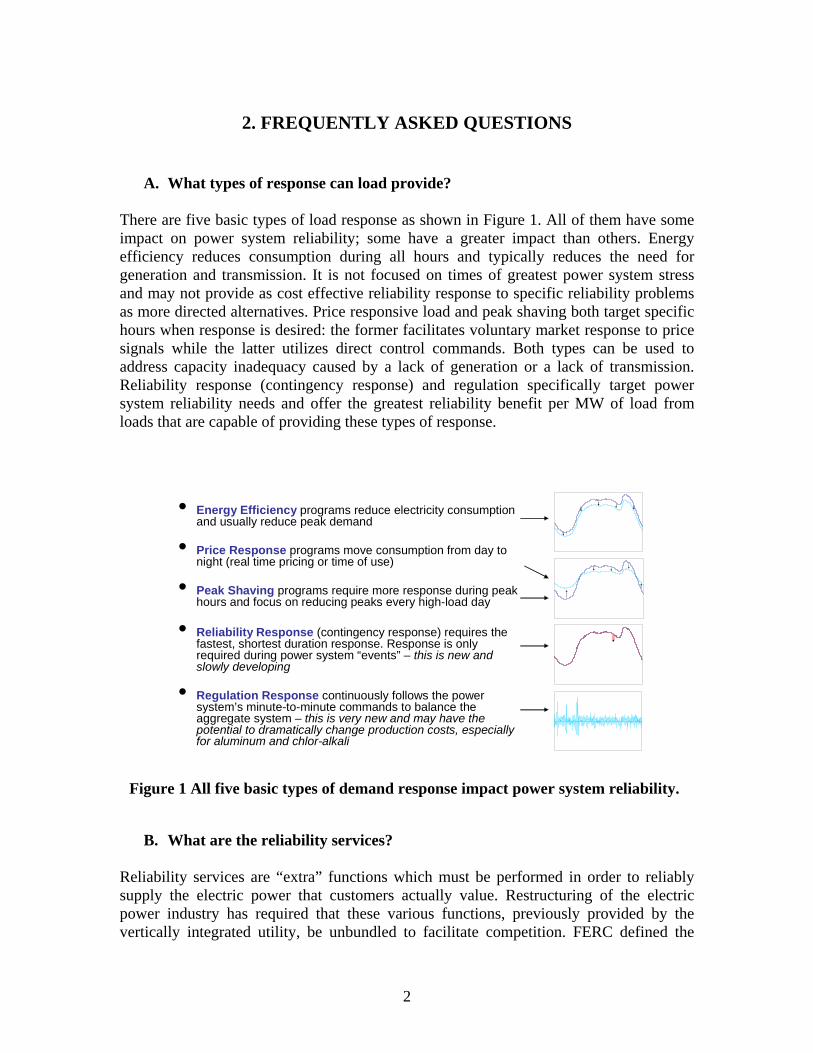
A. What types of response can load provide? There are five basic types of load response as shown in Figure 1. All of them have some impact on power system reliability; some have a greater impact than others. Energy efficiency reduces consumption during all hours and typically reduces the need for generation and transmission. It is not focused on times of greatest power system stress and may not provide as cost effective reliability response to specific reliability problems as more directed alternatives. Price responsive load and peak shaving both target specific hours when response is desired: the former facilitates voluntary market response to price signals while the latter utilizes direct control commands. Both types can be used to address capacity inadequacy caused by a lack of generation or a lack of transmission. Reliability response (contingency response) and regulation specifically target power system reliability needs and offer the greatest reliability benefit per MW of load from loads that are capable of providing these types of response.
B. What are the reliability services? Reliability services are “extra” functions which must be performed in order to reliably supply the electric power that customers actually value. Restructuring of the electric power industry has required that these various functions, previously provided by the vertically integrated utility, be unbundled to facilitate competition. FERC defined the
• Energy Efficiency programs reduce electricity consumption and usually reduce peak demand
• Price Response programs move consumption from day to night (real time pricing or time of use)
• Peak Shaving programs require more response during peak hours and focus on reducing peaks every high-load day
• Reliability Response (contingency response) requires the fastest, shortest duration response. Response is only required during power system “events” – this is new and slowly developing
• Regulation Response continuously follows the power system’s minute-to-minute commands to balance the aggregate system – this is very new and may have the potential to dramatically change production costs, especially for aluminum and chlor-alkali
Figure 1 All five basic types of demand response impact power system reliability.
3
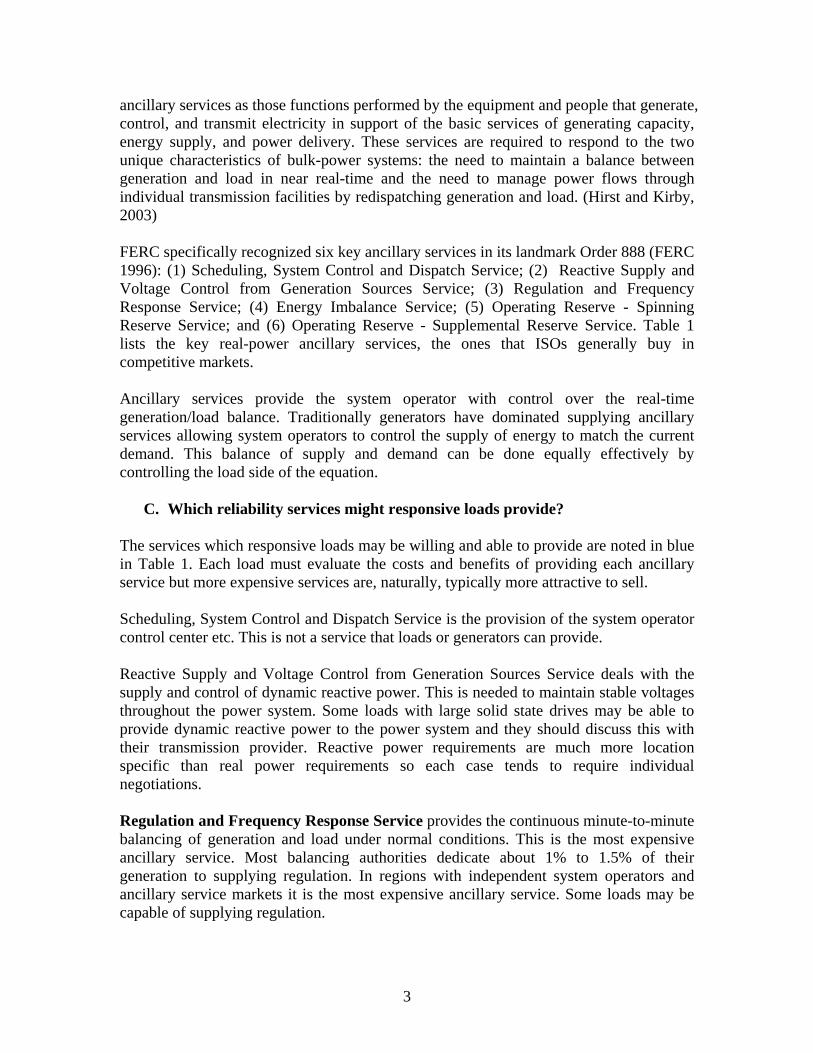
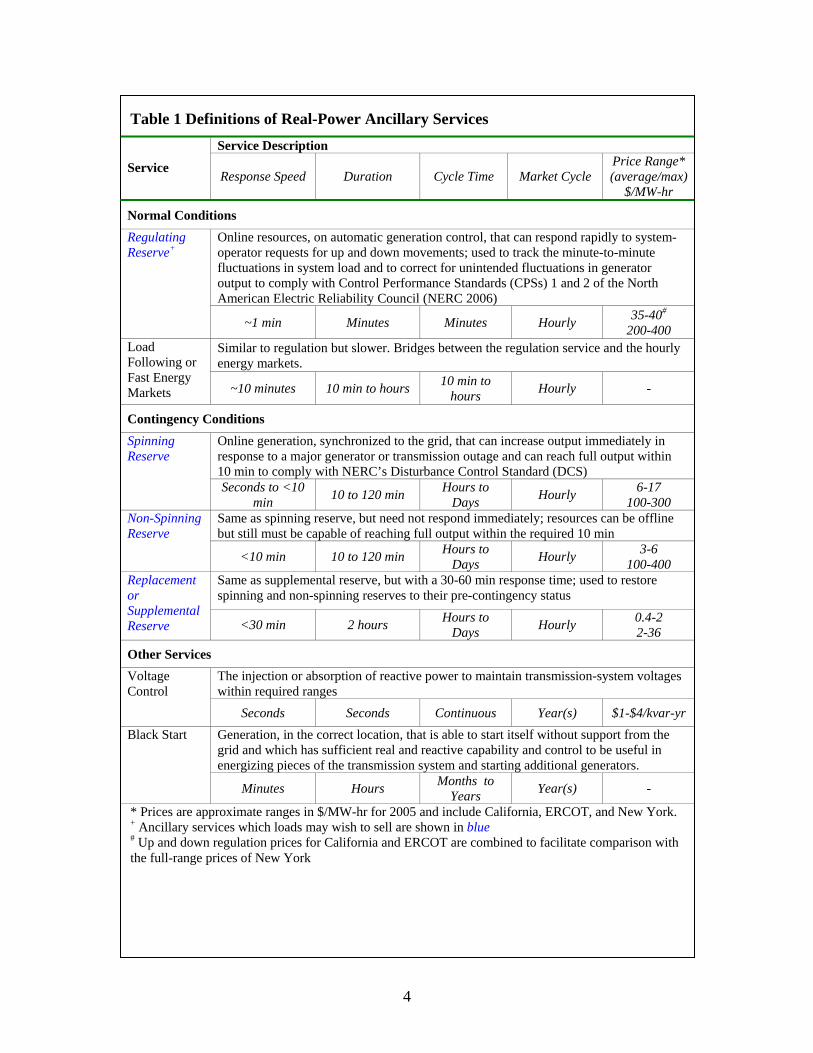
ancillary services as those functions performed by the equipment and people that generate, control, and transmit electricity in support of the basic services of generating capacity, energy supply, and power delivery. These services are required to respond to the two unique characteristics of bulk-power systems: the need to maintain a balance between generation and load in near real-time and the need to manage power flows through individual transmission facilities by redispatching generation and load. (Hirst and Kirby, 2003) FERC specifically recognized six key ancillary services in its landmark Order 888 (FERC 1996): (1) Scheduling, System Control and Dispatch Service; (2) Reactive Supply and Voltage Control from Generation Sources Service; (3) Regulation and Frequency Response Service; (4) Energy Imbalance Service; (5) Operating Reserve - Spinning Reserve Service; and (6) Operating Reserve - Supplemental Reserve Service. Table 1 lists the key real-power ancillary services, the ones that ISOs generally buy in competitive markets. Ancillary services provide the system operator with control over the real-time generation/load balance. Traditionally generators have dominated supplying ancillary services allowing system operators to control the supply of energy to match the current demand. This balance of supply and demand can be done equally effectively by controlling the load side of the equation.
C. Which reliability services might responsive loads provide? The services which responsive loads may be willing and able to provide are noted in blue in Table 1. Each load must evaluate the costs and benefits of providing each ancillary service but more expensive services are, naturally, typically more attractive to sell. Scheduling, System Control and Dispatch Service is the provision of the system operator control center etc. This is not a service that loads or generators can provide. Reactive Supply and Voltage Control from Generation Sources Service deals with the supply and control of dynamic reactive power. This is needed to maintain stable voltages throughout the power system. Some loads with large solid state drives may be able to provide dynamic reactive power to the power system and they should discuss this with their transmission provider. Reactive power requirements are much more location specific than real power requirements so each case tends to require individual negotiations. Regulation and Frequency Response Service provides the continuous minute-to-minute balancing of generation and load under normal conditions. This is the most expensive ancillary service. Most balancing authorities dedicate about 1% to 1.5% of their generation to supplying regulation. In regions with independent system operators and ancillary service markets it is the most expensive ancillary service. Some loads may be capable of supplying regulation.
4
Table 1 Definitions of Real-Power Ancillary Services Service Description
Service Response Speed Duration Cycle Time Market Cycle Price Range* (average/max)
$/MW-hr
Normal Conditions Online resources, on automatic generation control, that can respond rapidly to system-operator requests for up and down movements; used to track the minute-to-minute fluctuations in system load and to correct for unintended fluctuations in generator output to comply with Control Performance Standards (CPSs) 1 and 2 of the North American Electric Reliability Council (NERC 2006)
Regulating Reserve+
~1 min Minutes Minutes Hourly 35-40# 200-400
Similar to regulation but slower. Bridges between the regulation service and the hourly energy markets.
Load Following or Fast Energy Markets ~10 minutes 10 min to hours 10 min to
hours Hourly -
Contingency Conditions Online generation, synchronized to the grid, that can increase output immediately in response to a major generator or transmission outage and can reach full output within 10 min to comply with NERC’s Disturbance Control Standard (DCS)
Spinning Reserve
Seconds to <10 min 10 to 120 min Hours to
Days Hourly 6-17 100-300
Same as spinning reserve, but need not respond immediately; resources can be offline but still must be capable of reaching full output within the required 10 min
Non-Spinning Reserve
<10 min 10 to 120 min Hours to Days Hourly 3-6
100-400 Same as supplemental reserve, but with a 30-60 min response time; used to restore spinning and non-spinning reserves to their pre-contingency status
Replacement or Supplemental Reserve <30 min 2 hours Hours to
Days Hourly 0.4-2 2-36
Other Services The injection or absorption of reactive power to maintain transmission-system voltages within required ranges
Voltage Control
Seconds Seconds Continuous Year(s) $1-$4/kvar-yr Generation, in the correct location, that is able to start itself without support from the grid and which has sufficient real and reactive capability and control to be useful in energizing pieces of the transmission system and starting additional generators.
Black Start
Minutes Hours Months to Years Year(s) -
* Prices are approximate ranges in $/MW-hr for 2005 and include California, ERCOT, and New York. + Ancillary services which loads may wish to sell are shown in blue # Up and down regulation prices for California and ERCOT are combined to facilitate comparison with the full-range prices of New York

5
Energy Imbalance Service is really an accounting function that accommodates any differences between scheduled and actual transactions. It is not a “service” that individual generators or loads provide. Load following is a related service that compensates for the inter- and intra-hour changes in demand. This is the slower counterpart to regulation. Operating Reserve - Spinning Reserve Service is generation (or responsive load) that is poised, ready to respond immediately, in case a generator or transmission line fails unexpectedly. Spinning reserve begins to respond immediately and must fully respond within ten minutes. Enough contingency reserve (spinning and non-spinning) must be available to deal with the largest failure that is anticipated. Some regions allow appropriate loads to supply spinning reserve but many currently do not. Operating Reserve – Non-Spinning Reserve Service, is similar to spinning reserve except that response does not need to begin immediately. Full response is still required within 10 minutes. Appropriately responsive loads are typically allowed to supply non-spinning reserve. Replacement or Supplemental Reserve is an additional reserve required in some regions. It begins responding in 30 to 60 minutes. It is distinguished from non-spinning reserve by the response time frame. Appropriately responsive loads are typically allowed to supply replacement or supplemental reserve.
D. How are ancillary services characterized? The five real-power ancillary services are distinguished by the response speed, duration, and frequency of deployment. Exact definitions vary somewhat from region to region but the general characteristics for these services and voltage control are shown in Figure 2.
0.1 1 10 100
TIME (MINUTES)
RegulationLoad Following or Energy Imbalance
Spinning Reserve
Non-Spinning Reserve
Replacement or Supplemental Reserve
Voltage Control
Contingency Operations
Normal Operations
Figure 2 Response time and duration differentiate ancillary services.

6
Two services (regulation and load following or energy imbalance) continuously balance the system under normal conditions. Regulation provides the minute-to-minute balancing through automatic generation control. Load following and energy imbalance address the intra- and inter-hour balancing requirements. Three services (spinning reserve, non-spinning reserve, and replacement or supplemental reserve) are continuously poised to respond but are only deployed in the event of a contingency; the sudden failure of a generator or transmission line.
E. How often are spinning reserves called upon? What response length is required?
Spinning reserves continuously stand ready to respond whenever a generator or transmission line fails. They deploy autonomously and automatically through if the failure is large enough to shift system frequency outside of the governor deadband, as shown in Figure 3.
The system operator can also order spinning reserves to respond if the contingency is not large enough to depress system frequency but is large enough to adversely impact the real-power interchange between control areas (area control error – ACE). If the contingency is small enough the system operator may be able to address it with regulation and changes to the economic dispatch. Figure 4 shows the number times between January 1994 and February 2001 where WECC frequency dropped by more than 0.1 hz. WECC averaged slightly fewer than one 0.1 hz frequency event per month during this seven year period. Figure 5 shows the actual use of contingency reserves from both frequency excursions and system operator deployments for New York, New England, and California. Both California and New England deploy contingency reserves about twice per month. New York uses contingency reserves about ten times more frequently.
5 9 .9 0
5 9 .9 2
5 9 .9 4
5 9 .9 6
5 9 .9 8
6 0 .0 0
6 0 .0 2
6 0 .0 4
5 :5 0 6 :0 0 6 :1 0 6 :2 0 6 :3 0
T IM E (p m )
FR
EQ
UE
NC
Y
2 6 0 0 -M WG e n e ra t io n
L o s t A G C R E S P O N S E
G O V E R N O R R E S P O N S E
Figure 3 Frequency immediately drops and spinning reserves respond autonomously in this example where two nuclear plants tripped in ERCOT.

7
Figure 4 WECC experienced 77 events where frequency dropped by more than 0.1 hz between January 1994 and February 2001. Figure 5 also shows that in all three balancing areas the contingency reserve deployment is typically short, averaging around ten minutes, but is occasionally longer.
Figure 5 ISOs differ in the frequency of their use of contingency reserves but reserve deployment is typically fairly short.
0:00
0:10
0:20
0:30
0:40
0:50
1:00
1 51 101 151 201
NYISO, ISO-NE, & CAISO Reserve Deployment Events
Dep
loym
ent D
urat
ion
NYISO Deployed Reserves 239 times in 2002Average deployment was under 11 minutes
Average time between deployments was 1.5 days
ISO-NE activated shared reserves 19 times in 2005Average duration was under 11 minutes
Average time between deployments was 19 days
CAISO dispatched reserves 26 times in 2005Average duration was under 9 minutes
Average time between deployments was 14 days
NYISO
ISO-NE
CAISO
0
10
20
30
40
50
60
70
80
0.10 0.12 0.14 0.16 0.18 0.20 0.22 0.24
Frequency Drop (hz)
Num
ber o
f Eve
nts
8
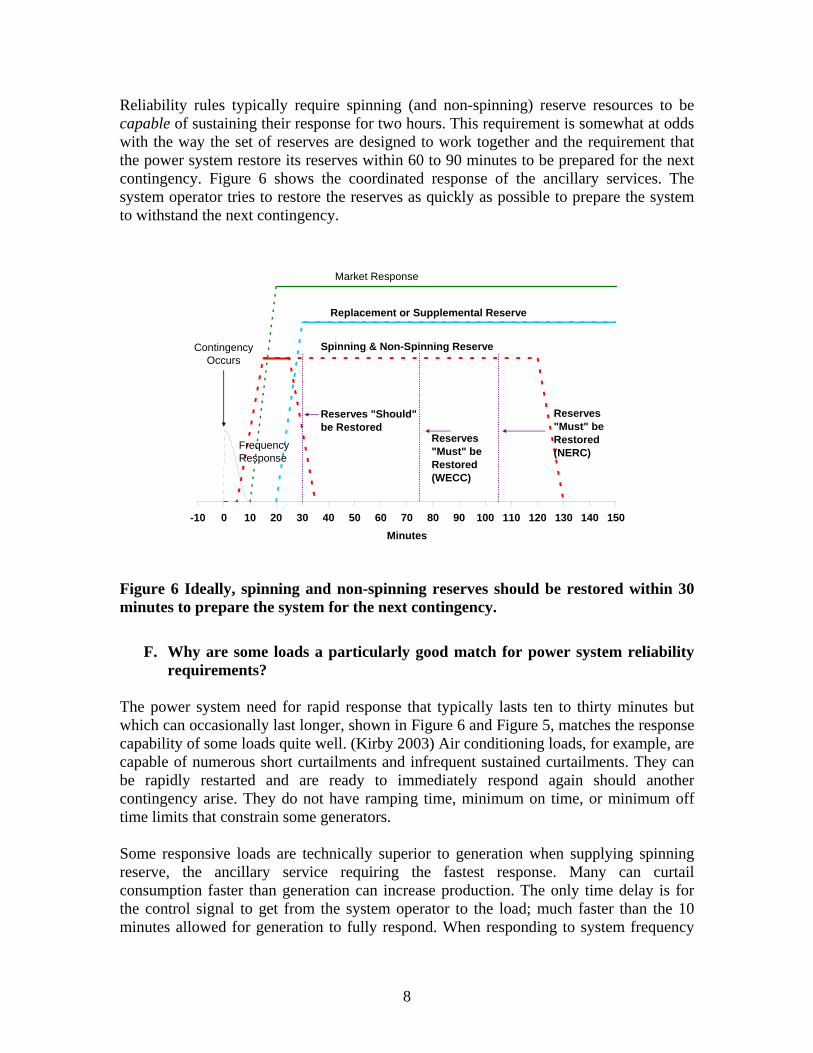
Reliability rules typically require spinning (and non-spinning) reserve resources to be capable of sustaining their response for two hours. This requirement is somewhat at odds with the way the set of reserves are designed to work together and the requirement that the power system restore its reserves within 60 to 90 minutes to be prepared for the next contingency. Figure 6 shows the coordinated response of the ancillary services. The system operator tries to restore the reserves as quickly as possible to prepare the system to withstand the next contingency.
Figure 6 Ideally, spinning and non-spinning reserves should be restored within 30 minutes to prepare the system for the next contingency.
F. Why are some loads a particularly good match for power system reliability requirements?
The power system need for rapid response that typically lasts ten to thirty minutes but which can occasionally last longer, shown in Figure 6 and Figure 5, matches the response capability of some loads quite well. (Kirby 2003) Air conditioning loads, for example, are capable of numerous short curtailments and infrequent sustained curtailments. They can be rapidly restarted and are ready to immediately respond again should another contingency arise. They do not have ramping time, minimum on time, or minimum off time limits that constrain some generators. Some responsive loads are technically superior to generation when supplying spinning reserve, the ancillary service requiring the fastest response. Many can curtail consumption faster than generation can increase production. The only time delay is for the control signal to get from the system operator to the load; much faster than the 10 minutes allowed for generation to fully respond. When responding to system frequency
-10 0 10 20 30 40 50 60 70 80 90 100 110 120 130 140 150Minutes
ContingencyOccurs
Spinning & Non-Spinning Reserve
FrequencyResponse
Reserves "Should" be Restored
Reserves "Must" be Restored (NERC)
Market Response
Reserves "Must" be Restored (WECC)
Replacement or Supplemental Reserve

9
deviations the curtailment can be essentially instantaneous. Communications delays are not encountered because frequency is monitored at the load itself.
G. Why would loads rather provide reliability response than peak reduction? Supplying contingency reserves is technically more attractive to some loads than providing peak reduction because the response duration and response frequency are shorter. Peak reduction requires actually responding, typically for multiple hours per day, often for multiple days in a row, during times when the load could be performing a useful function for its owner. Air conditioning loads provide a good example. Peak load reduction is typically required at exactly the time when the air conditioning itself is most needed. In fact, the power system peak is typically created by the air conditioning load. Providing contingency reserves requires that the load be poised to respond immediately if a power system emergency occurs but to operate normally otherwise. This imposes a technical communications and control requirement on the load but does no otherwise interfere with loads normal function. Supplying faster, shorter, ancillary services is often more attractive economically as well. Ancillary service prices value response speed rather than duration.
H. How are ancillary services valued and what are the prices? Hourly markets exist in several regions for up to five ancillary services: regulation (up and down in some markets), spinning reserve, non-spinning reserve, and replacement reserve. Regulation is always the most expensive service followed by spinning reserve, non-spinning reserve, and replacement reserve. Some markets split regulation into regulation up and regulation down. This distinction is semantic rather than technical. Regulation prices in split markets can be compared with combined markets simply by adding the up and down prices. Ancillary service costs are driven primarily by opportunity cost. In order to sell into the ancillary service markets, generators must withhold capacity from the energy market. The cost the generator has to charge (or bid) to supply a reserve service is based primarily on the difference between the generator’s production cost and the energy sale price for that hour. A generator with a production cost of $50/MWH, for example, would bid $10/MW-hr to sell spinning reserve if the energy price was $60/MWH ($60/MWH revenue - $50/MWH cost = $10/MWH profit or $10 per MW of generating capacity profit each hour from energy sales). At any price higher than $10/MW-hr for spinning reserve the generator makes more profit by forgoing the energy sale and selling spinning reserve. Conversely, at any price below $10/MW-hr for spinning reserve the generator would lose money by staying out of the energy market. One consequence of this linkage between energy and ancillary service markets is that ancillary service prices are inherently more volatile than energy prices. Contingency

10
reserve prices, for example, are typically zero at night when numerous generators are at minimum load and have capacity available at essentially no cost. Note that the price unit for reserves is $/MW-hr. This is because the generator is selling one MW of capacity (not energy) for one hour. The generator is standing ready to produce but it is not necessarily producing. In fact, if the generator does deliver any energy during the hour the cost of the energy will be settled separately, either at the generator’s cost or at the spot energy price. Typically the energy component of the ancillary services is not major. This terminology is not universal but it does make the distinction between the energy and capacity components clear. Hourly ancillary service market price data is available since September 2000 for California, since October 2001 for New York, and since April 2003 for ERCOT. Monthly averages of hourly prices are shown in Figure 7. Total regulation prices (regulation up plus regulation down) are shown for California and ERCOT to make them comparable to the New York regulation product which is a combined up and down service.
$0
$20
$40
$60
$80
$100
2002 2003 2004 2005 2006
$/M
W-h
r and
$/M
WH
CA Regulation Total CA Energy
NY Regulation NY West Energy
ERCOT Regulation Total ERCOT Energy
Figure 7 Monthly average regulation prices are typically (but not always) somewhat lower than energy prices. Figure 7 shows that regulation prices, which include no fuel component, are in the same range as real-time energy prices and are at times higher. Also, both energy and regulation prices are volatile, even on a monthly average basis. Regulation price also tends to track energy price, because of the lost opportunity cost.
11
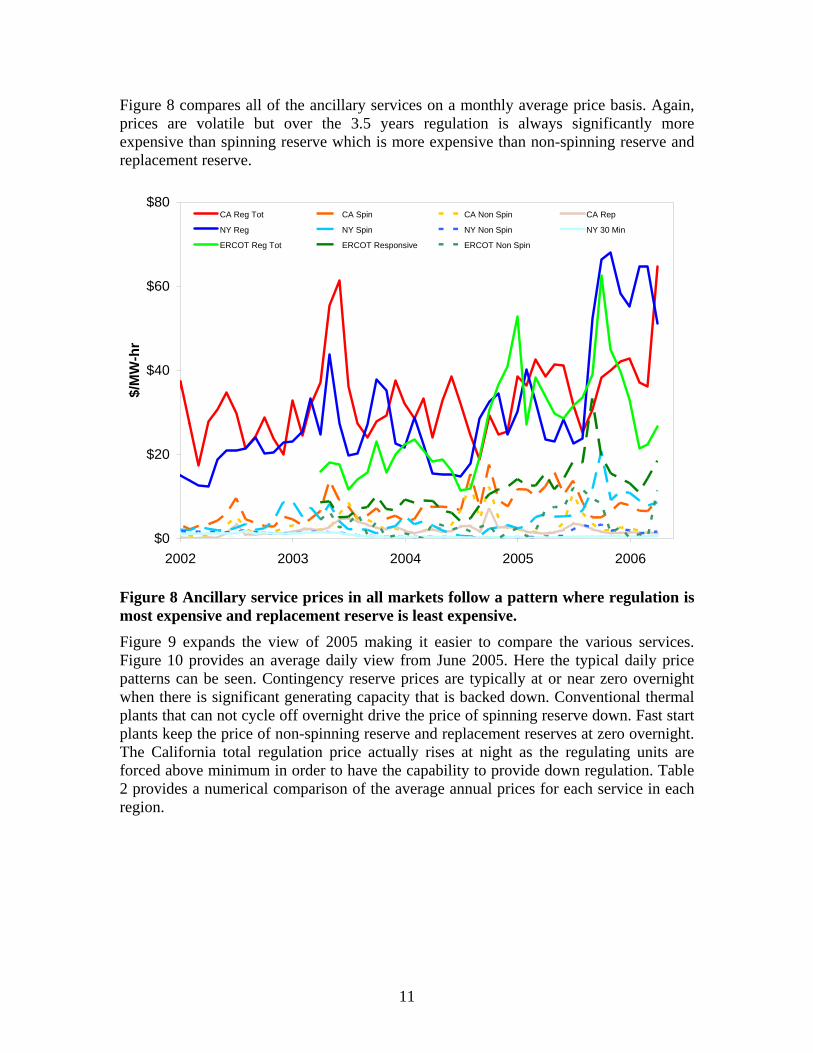
Figure 8 compares all of the ancillary services on a monthly average price basis. Again, prices are volatile but over the 3.5 years regulation is always significantly more expensive than spinning reserve which is more expensive than non-spinning reserve and replacement reserve.
$0
$20
$40
$60
$80
2002 2003 2004 2005 2006
$/M
W-h
r
CA Reg Tot CA Spin CA Non Spin CA Rep
NY Reg NY Spin NY Non Spin NY 30 Min
ERCOT Reg Tot ERCOT Responsive ERCOT Non Spin
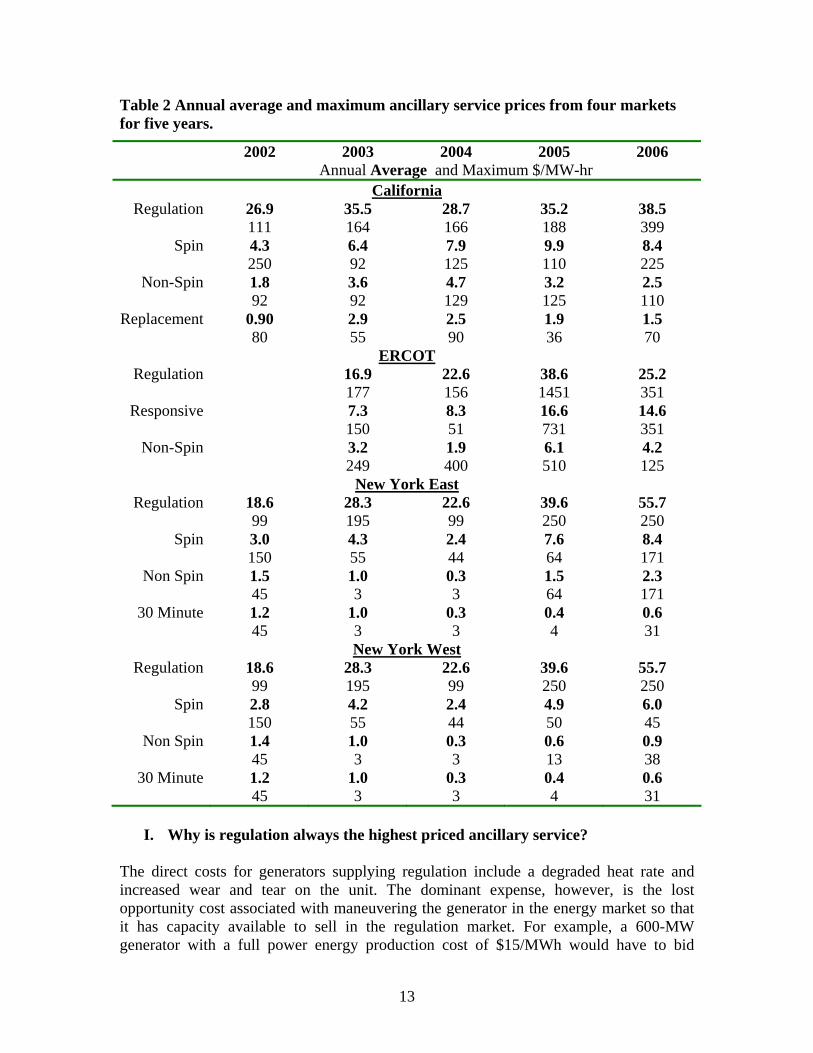
Figure 8 Ancillary service prices in all markets follow a pattern where regulation is most expensive and replacement reserve is least expensive. Figure 9 expands the view of 2005 making it easier to compare the various services. Figure 10 provides an average daily view from June 2005. Here the typical daily price patterns can be seen. Contingency reserve prices are typically at or near zero overnight when there is significant generating capacity that is backed down. Conventional thermal plants that can not cycle off overnight drive the price of spinning reserve down. Fast start plants keep the price of non-spinning reserve and replacement reserves at zero overnight. The California total regulation price actually rises at night as the regulating units are forced above minimum in order to have the capability to provide down regulation. Table 2 provides a numerical comparison of the average annual prices for each service in each region.

12
Figure 9 Regulation is always the most expensive ancillary service as shown by these 2005 monthly average ancillary service prices.
Figure 10 June 2005 average hourly ancillary service prices show a consistent pattern.
$0
$10
$20
$30
$40
$50
$60
$70
$80
Janu
ary
Februa
ryMarc
hApri
lMay
June Ju
ly
Augus
t
Septem
ber
Octobe
r
Novem
ber
Decem
ber
$/M
W-h
r
CA Reg Tot CA Spin CA Non Spin CA ReplacementNY Reg NY Spin NY Non Spin NY 30 MinERCOT Reg Tot ERCOT Responsive ERCOT Non Spin
$0
$10
$20
$30
$40
$50
$60
$70
0:00 6:00 12:00 18:00 0:00
$/M
W-h
r
CA Reg Tot CA Spin CA Non Spin CA Replacement
NY Reg NY Spin NY Non Spin NY 30 Min
ERCOT Reg Tot ERCOT Responsive ERCOT Non Spin
13
Table 2 Annual average and maximum ancillary service prices from four markets for five years.
2002 2003 2004 2005 2006 Annual Average and Maximum $/MW-hr
California Regulation 26.9
111 35.5 164
28.7 166
35.2 188
38.5 399
Spin 4.3 250
6.4 92
7.9 125
9.9 110
8.4 225
Non-Spin 1.8 92
3.6 92
4.7 129
3.2 125
2.5 110
Replacement 0.90 80
2.9 55
2.5 90
1.9 36
1.5 70
ERCOT Regulation 16.9
177 22.6 156
38.6 1451
25.2 351
Responsive 7.3 150
8.3 51
16.6 731
14.6 351
Non-Spin 3.2 249
1.9 400
6.1 510
4.2 125
New York East Regulation 18.6
99 28.3 195
22.6 99
39.6 250
55.7 250
Spin 3.0 150
4.3 55
2.4 44
7.6 64
8.4 171
Non Spin 1.5 45
1.0 3
0.3 3
1.5 64
2.3 171
30 Minute 1.2 45
1.0 3
0.3 3
0.4 4
0.6 31
New York West Regulation 18.6
99 28.3 195
22.6 99
39.6 250
55.7 250
Spin 2.8 150
4.2 55
2.4 44
4.9 50
6.0 45
Non Spin 1.4 45
1.0 3
0.3 3
0.6 13
0.9 38
30 Minute 1.2 45
1.0 3
0.3 3
0.4 4
0.6 31
I. Why is regulation always the highest priced ancillary service?
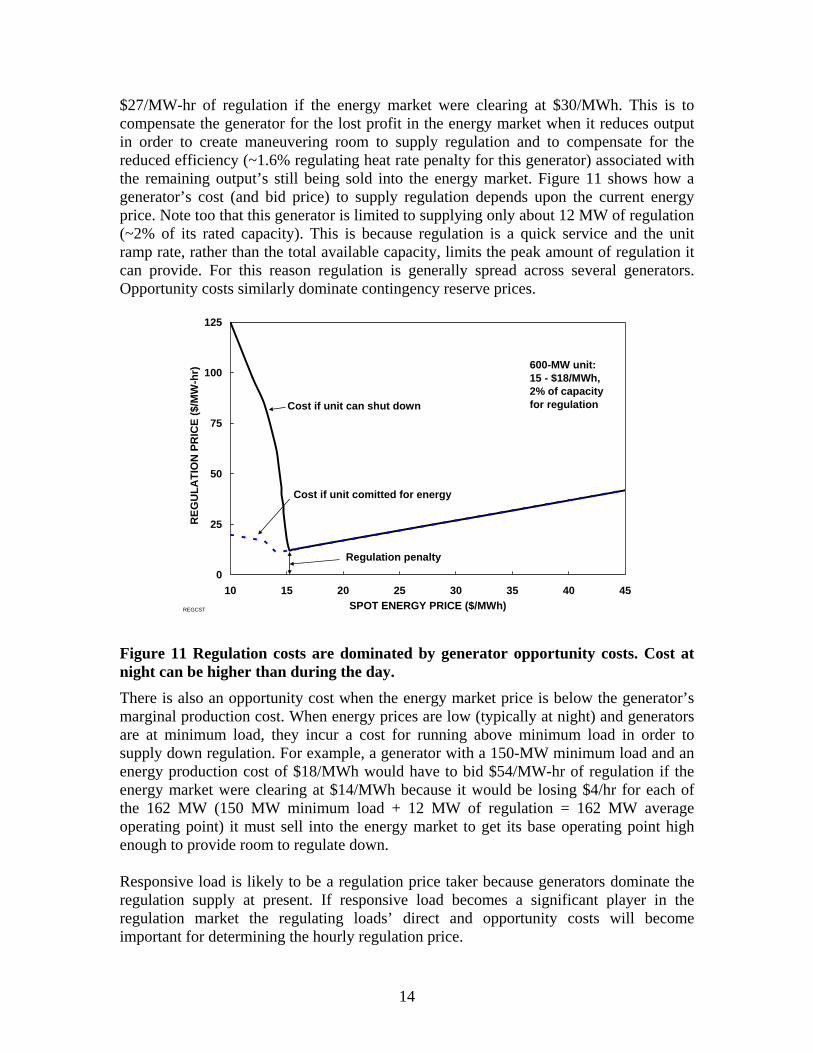
The direct costs for generators supplying regulation include a degraded heat rate and increased wear and tear on the unit. The dominant expense, however, is the lost opportunity cost associated with maneuvering the generator in the energy market so that it has capacity available to sell in the regulation market. For example, a 600-MW generator with a full power energy production cost of $15/MWh would have to bid
14
$27/MW-hr of regulation if the energy market were clearing at $30/MWh. This is to compensate the generator for the lost profit in the energy market when it reduces output in order to create maneuvering room to supply regulation and to compensate for the reduced efficiency (~1.6% regulating heat rate penalty for this generator) associated with the remaining output’s still being sold into the energy market. Figure 11 shows how a generator’s cost (and bid price) to supply regulation depends upon the current energy price. Note too that this generator is limited to supplying only about 12 MW of regulation (~2% of its rated capacity). This is because regulation is a quick service and the unit ramp rate, rather than the total available capacity, limits the peak amount of regulation it can provide. For this reason regulation is generally spread across several generators. Opportunity costs similarly dominate contingency reserve prices.
Figure 11 Regulation costs are dominated by generator opportunity costs. Cost at night can be higher than during the day. There is also an opportunity cost when the energy market price is below the generator’s marginal production cost. When energy prices are low (typically at night) and generators are at minimum load, they incur a cost for running above minimum load in order to supply down regulation. For example, a generator with a 150-MW minimum load and an energy production cost of $18/MWh would have to bid $54/MW-hr of regulation if the energy market were clearing at $14/MWh because it would be losing $4/hr for each of the 162 MW (150 MW minimum load + 12 MW of regulation = 162 MW average operating point) it must sell into the energy market to get its base operating point high enough to provide room to regulate down. Responsive load is likely to be a regulation price taker because generators dominate the regulation supply at present. If responsive load becomes a significant player in the regulation market the regulating loads’ direct and opportunity costs will become important for determining the hourly regulation price.
REGCST
0
25
50
75
100
125
10 15 20 25 30 35 40 45SPOT ENERGY PRICE ($/MWh)
REG
ULA
TIO
N P
RIC
E ($
/MW
-hr)
600-MW unit:15 - $18/MWh,2% of capacityfor regulation
Regulation penalty
Cost if unit comitted for energy
Cost if unit can shut down

15
J. What determines contingency reserve market prices?
Contingency reserve cost drivers are essentially a subset of the regulation cost drivers. Because contingency reserves deploy infrequently there is no significant degradation in heat rate and no increased wear-and-tear on the unit. Only the opportunity costs are incurred because the unit must withhold capacity from the energy market. On occasion a generator can incur additional costs to provide contingency reserves. For example, a generator would have to bid a significant price to supply spinning reserve if the generator’s production cost was higher than the market energy price and the generator could otherwise shut down. In this case the spinning reserve bid would have to cover all of the losses the generator was incurring in the energy market to operate at minimum load. Similarly, a generator could incur some costs to supply non-spinning and supplemental or replacement reserves if it was necessary to pay plant operators to standby. Responsive loads play a significant role in supplying spinning reserves in Texas but they are currently limited to supplying no more than 50% of the total requirement. Though allowed to participate in the non-spinning and replacement reserve markets responsive loads do not dominate those markets either. Consequently it is the generation cost drivers that currently set ancillary service prices.
K. What characteristics are required for load to provide reliability services? What types of loads have these characteristics?
Communications and control are the critical characteristics that determine if a load is capable of providing reliability reserves. Load must be controllable if it is to supply reliability services to the power system. The control must be fast and accurate. The load must also have a way to receive deployment commands from the power system operator. Faster services (spinning reserve and regulation) require automatic response to system operator commands. Spinning reserve also requires that the load sense and respond autonomously to reductions in power system frequency. The required response speed and duration depend on which reliability service is being provided. From the loads’ perspective important additional characteristics include sensitivity to electricity price and storage capability. Storage of product or energy within the load is valuable to free the load to respond to power system needs without hurting the loads’ primary function. Sensitivity to electricity prices is typically required to get the loads’ interest. Air conditioning loads (residential and commercial, central and distributed) can be ideal suppliers of spinning and non-spinning reserves. Many pumping loads are good candidates (water, natural gas, and other gasses). Any industrial process with some manufacturing flexibility is a good candidate (cement, paper, steel, aluminum, refining, air liquefaction, etc.). The list is endless.

16
Regulation is more difficult for loads to supply but electrolysis loads such as aluminum and chlor-alkali production appear to be excellent candidates.
L. Can load response really provide the critical spinning reserve reliability function? Isn’t it better to let load provide peak reduction and replacement reserves?
The inherent physical response capability of some loads is a better match to the fast, short, less frequent physical response requirements of spinning reserve than it is to the longer duration, more frequent response requirements of peak reduction or replacement reserves. For some loads, the advanced warning given before response is required for the slower services has little benefit. Advances in communications and control technologies make the fast response possible. Residential air conditioning loads, for example, can provide significantly more spinning reserve response, for example, than they can provide peak reduction. One fundamental characteristic that helps determine which service a responsive load can best provide is the amount of storage the load has available. Storage may be in terms of widgets a factory is producing, the thermal mass of a building, pressure in a gas pipeline, water in a reservoir, or any other result electricity is used to produce. There is typically enough thermal storage in a residence, for example, to allow the air conditioner to be turned off for ten to twenty minutes. Longer interruptions may be acceptable if they are infrequent. This matches the power system’s requirements for spinning reserves which are often deployed for ten minutes and infrequently deployed or an hour or more. Peak reduction typically requires response lasting many hours and occurring for at least several days in a row. Providing advanced warning does little to increase the residences’ ability to sustain longer response. Many (but not all) commercial and industrial loads have similar characteristics. Blocking responsive loads from providing the services that they are best matched to provide is bad for the power system and bad for the loads. It denies the power system of an excellent reliability resource for the most critical reliability needs. It denies the loads the ability to supply the most valuable response service.
M. Do responsive loads have the technical capability to provide regulation? Regulation, the minute-to-minute varying of generation or consumption at the system operator’s command in order to maintain the control area’s generation/load balance, is the most difficult ancillary service for loads to provide. Automatic generation control (AGC) commands are typically sent from the system operator to the regulating generators about every four seconds (Figure 12). Regulation is also the most expensive ancillary service so it may be the most attractive service to sell for loads that are capable of supplying it. Some loads may have the inherent capability to provide regulation. Loads that are electronically controlled potentially could follow automatic generation control commands.

17
Loads with large adjustable speed drives or solid state power supplies are candidates. Product quality must be independent of the rate of electricity consumption to allow the power system operator to adjust the load’s consumption. Energy efficiency can be impacted by the rate of electricity consumption. Efficiency reductions simply impact the cost of regulation from the process. Excess production capacity is required for loads to provide regulation. The load must back down from full production and average lower production in order to have sufficient capacity move up in load when directed by the system operator. Similarly, the load can not be at minimum production because there must be room to reduce consumption when directed.
A number of load types may have the capability and inclination to provide regulation:
• Induction & ladle metallurgy furnaces 1,000MW • Air liquefaction 1,000MW • Gas & water pumping with variable speed motor drives • Electrolysis: >14,000MW
− Aluminum 6,500MW − Chlor-alkali 4,500MW − Potassium hydroxide 1,000MW − Magnesium, sodium chlorate, copper
Interestingly, it is likely that electronically controlled responsive loads could provide regulation of significantly greater value than that provided by conventional generation.
15000
17500
20000
22500
25000
0:00 4:00 8:00 12:00 16:00 20:00 0:00
Sys
tem
Loa
d (M
W)
22200
22250
22300
22350
22400
8:00 8:15 8:30 8:45 9:00
Regulation
15000
17500
20000
22500
25000
0:00 4:00 8:00 12:00 16:00 20:00 0:00
Sys
tem
Loa
d (M
W)
22200
22250
22300
22350
22400
8:00 8:15 8:30 8:45 9:00
Regulation
Figure 12 Regulation provides the minute-to-minute balancing of generation and load.
18
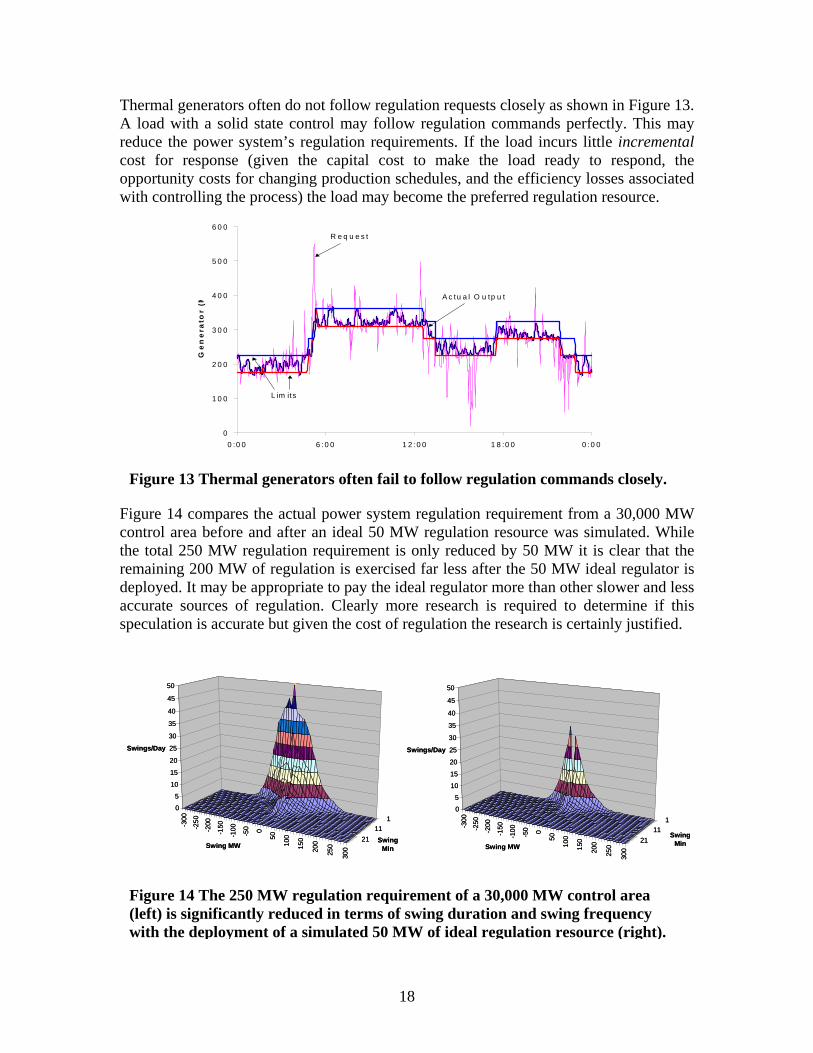
Thermal generators often do not follow regulation requests closely as shown in Figure 13. A load with a solid state control may follow regulation commands perfectly. This may reduce the power system’s regulation requirements. If the load incurs little incremental cost for response (given the capital cost to make the load ready to respond, the opportunity costs for changing production schedules, and the efficiency losses associated with controlling the process) the load may become the preferred regulation resource.
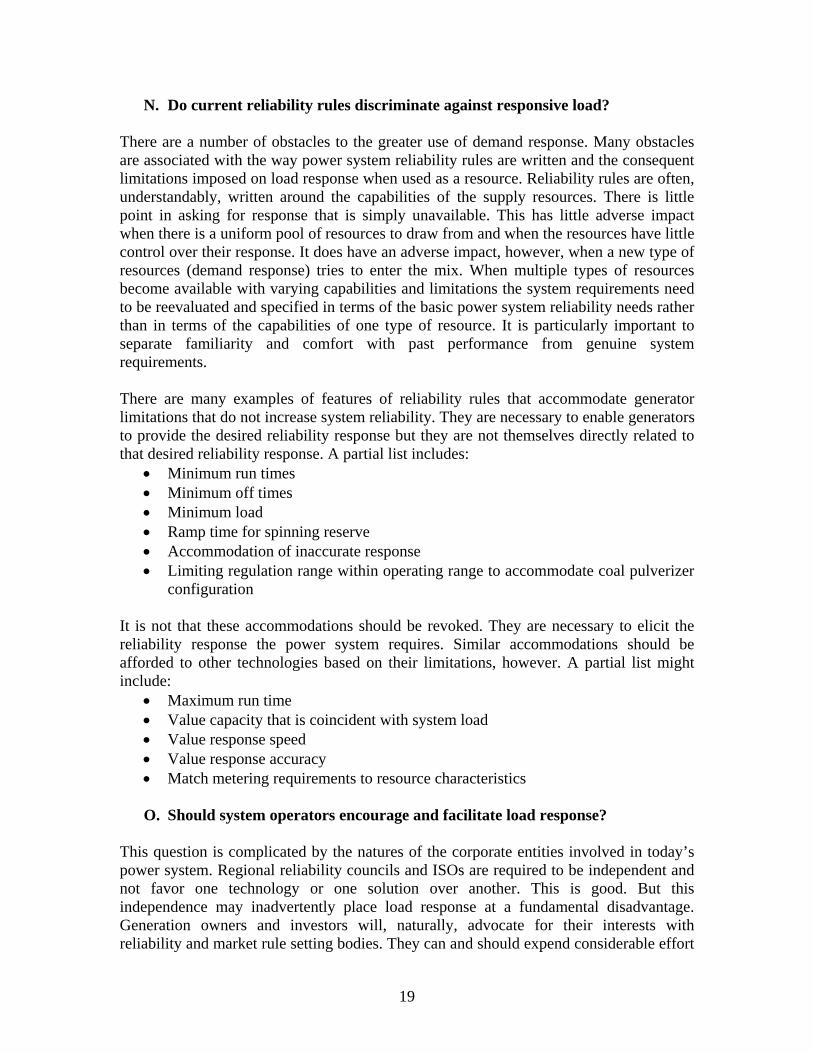
Figure 14 compares the actual power system regulation requirement from a 30,000 MW control area before and after an ideal 50 MW regulation resource was simulated. While the total 250 MW regulation requirement is only reduced by 50 MW it is clear that the remaining 200 MW of regulation is exercised far less after the 50 MW ideal regulator is deployed. It may be appropriate to pay the ideal regulator more than other slower and less accurate sources of regulation. Clearly more research is required to determine if this speculation is accurate but given the cost of regulation the research is certainly justified.
0
1 0 0
2 0 0
3 0 0
4 0 0
5 0 0
6 0 0
0 :0 0 6 :0 0 1 2 :0 0 1 8 :0 0 0 :0 0
Ge
ne
rato
r (M
R e q u e s t
L im its
A c tu a l O u tp u t
Figure 13 Thermal generators often fail to follow regulation commands closely.
-300
-250
-200
-150
-100
-50 0
50
100
150
200
250
300
111
21
0
5
10
15
20
25
30
35
40
45
50
Swings/Day
Swing MWSwing
Min
-300
-250
-200
-150
-100
-50 0
50
100
150
200
250
300
111
21
0
5
10
15
20
25
30
35
40
45
50
Swings/Day
Swing MWSwing
Min
-300
-250
-200
-150
-100
-50 0
50
100
150
200
250
300
111
21
0
5
10
15
20
25
30
35
40
45
50
Swings/Day
Swing MWSwing
Min
-300
-250
-200
-150
-100
-50 0
50
100
150
200
250
300
111
21
0
5
10
15
20
25
30
35
40
45
50
Swings/Day
Swing MWSwing
Min
Figure 14 The 250 MW regulation requirement of a 30,000 MW control area (left) is significantly reduced in terms of swing duration and swing frequency with the deployment of a simulated 50 MW of ideal regulation resource (right).
19
N. Do current reliability rules discriminate against responsive load? There are a number of obstacles to the greater use of demand response. Many obstacles are associated with the way power system reliability rules are written and the consequent limitations imposed on load response when used as a resource. Reliability rules are often, understandably, written around the capabilities of the supply resources. There is little point in asking for response that is simply unavailable. This has little adverse impact when there is a uniform pool of resources to draw from and when the resources have little control over their response. It does have an adverse impact, however, when a new type of resources (demand response) tries to enter the mix. When multiple types of resources become available with varying capabilities and limitations the system requirements need to be reevaluated and specified in terms of the basic power system reliability needs rather than in terms of the capabilities of one type of resource. It is particularly important to separate familiarity and comfort with past performance from genuine system requirements. There are many examples of features of reliability rules that accommodate generator limitations that do not increase system reliability. They are necessary to enable generators to provide the desired reliability response but they are not themselves directly related to that desired reliability response. A partial list includes:
• Minimum run times • Minimum off times • Minimum load • Ramp time for spinning reserve • Accommodation of inaccurate response • Limiting regulation range within operating range to accommodate coal pulverizer
configuration It is not that these accommodations should be revoked. They are necessary to elicit the reliability response the power system requires. Similar accommodations should be afforded to other technologies based on their limitations, however. A partial list might include:
• Maximum run time • Value capacity that is coincident with system load • Value response speed • Value response accuracy • Match metering requirements to resource characteristics
O. Should system operators encourage and facilitate load response?
This question is complicated by the natures of the corporate entities involved in today’s power system. Regional reliability councils and ISOs are required to be independent and not favor one technology or one solution over another. This is good. But this independence may inadvertently place load response at a fundamental disadvantage. Generation owners and investors will, naturally, advocate for their interests with reliability and market rule setting bodies. They can and should expend considerable effort
20
to do so because they are exclusively in the electric power business. Conversely, loads are not primarily in the electric power business. They use electric power to facilitate their primary objectives. They can not afford to expend the same effort on electric power issues as generators. Companies that specialize in load response facilitate that response but do not own the basic resources (the loads). Further, there are transmission and generation planning organizations within almost every RTO, ISO, and regional council. It would be rare indeed to find a responsive load planning organization with the same level of support. This results in a situation with strong advocates for, and significant infrastructure supporting, generation and transmission solutions but relatively little support for load response solutions.1 In one sense demand resources are treated perfectly equitably; they simply can not meet the published system requirements. In another sense demand resources are treated inequitably because the reliability rules are often written around generator capabilities rather than around system reliability requirements. If there are societal benefits to be gained by using load response to enhance the reliability and economy of the power system a simple neutrality that equally evaluates any generation, transmission, or responsive load based proposal offered in the current competitive environment may not be sufficient. Load response alternatives may need to be advocated just as generation and transmission solutions are advocated. Because society benefits from load response it may be appropriate for organizations that husband the societal interests in the power system to insure that load response solutions are fully considered, even absent a strong commercial advocate. This may be different than simply insuring that any proposed alternatives get an equal hearing. (Kirby, 2006)
P. Why not deploy responsive loads sequentially to meet the duration requirement?
Some loads would find it difficult to commit to regularly providing the two hour response often included in the specification of spinning reserve response. An air conditioning load might be able to regularly provide a 30 minute response but be willing to commit to a two hour response only if that was called upon very infrequently. While considering this apparent limitation in response capability it is important to keep in mind that contingency response is typically required for only a few minutes. Times when longer response is required are very important for power system reliability but they are infrequent. Also, the two hour response requirement was instituted when generators were the only reserve supplier. Generators are typically indifferent to the deployment response duration so there was no incentive to critically determine the real response duration need. Specifying a longer duration had no cost or consequence. In fact, some generators have a minimum response limitation. It is certainly possible for aggregations of responsive loads to meet any desired duration requirement but this is not a good idea. Figure 15 shows two alternative approaches to
1 Ancillary service rules provide an example. Rules governing the provision of ancillary services by generators often provide detailed accommodation to the limitations of generators. Minimum start times, minimum run times, ramp rates, minimum loads, and regulation range limitations are all accommodated. Similar accommodations for demand resources are only beginning to be made.

21
using a fleet of responsive loads that can only supply 30 minutes of response each. In one case (blue) the aggregation is split into four blocks which are scheduled to be deployed sequentially to maintain the potential for two hours of response. In the other case (red) the entire load is deployed immediately providing four times the response but for only 30 minutes. Establishing rules that require the load aggregator to present the system operator with only the first response option make no sense. From a power system reliability perspective this denies the system operator access to ¾ of an excellent spinning reserve resource during the most critical initial stages of a system emergency. It also denies the system operator the use of ¾ of the resource for the full length of the vast majority of contingency reserve deployments. If the system operator prefers the longer response during a specific event the “red” resource is always available to provide the longer “blue” response; simply deploy the block groups sequentially by system operator command.
Establishing rules that require the load aggregator to present the system operator with the longer response is also bad for the responsive loads because they only receive one quarter of the payment that they would get if they were fully utilized. This makes it more difficult to recover the capital cost for the communications and control equipment. While it reduces (nearly eliminates) the response that most of the loads provide (groups 2-4) this has little benefit for the loads. If they were unwilling or unable to respond they would not be offering spinning reserve.
Q. How is it that a responsive load can provide more capacity by supplying spinning reserve than by providing peak reduction?
Many loads can not curtail consumption for the multiple hours required to reduce the peak load. They cycle on and off during the peak reduction, consuming less than they would have on a normal day but still consuming some energy. They can respond quickly enough to provide spinning reserve, however, and can sustain that response consuming
0:00 0:30 1:00 1:30 2:00 2:30
MW
Res
pons
e
Group 1
Group 1
Group 4
Group 3
Group 2
Group 4Group 3Group 2
•A 2 hour response requirement provides ¼ of the capability
•A 30 minute response requirement retains both options
0:00 0:30 1:00 1:30 2:00 2:30
MW
Res
pons
e
Group 1
Group 1
Group 4
Group 3
Group 2
Group 4Group 3Group 2
•A 2 hour response requirement provides ¼ of the capability
•A 30 minute response requirement retains both options
Figure 15 Which response best supports power system reliability?

22
nothing for the duration of the contingency event. LIPA Edge is a typical peak demand reduction project that provides a good example. It could provide nearly three times the capacity in spinning reserve that it supplies for peak reduction. Remotely controllable Carrier Comfort Choice thermostats coupled with two-way communication provided by Silicon Energy and Skytel two-way pagers allows the Long Island Power Authority (LIPA) to monitor capability and response as well as to control load reductions. It also enables customers to control their individual thermostats via the Internet, a benefit that motivates participation (LIPA 2002a). Currently controlling 25,000 residential units and 5,000 small commercial units provides 36 MW of peak load reduction. (Marks 2006) The blue curve in Figure 16 shows the aggregate air conditioning load on a hot summer day. The green curve shows 25 MW of peak reduction that this system provides. The entire load (blue curve) can be curtailed for a spinning reserve event, however, providing 75 MW of response. Detailed discussions with Carrier revealed that the technology is fast enough to provide spinning reserve and provides ample monitoring capability at little or no additional cost at times of heavy system loading; this is a significant benefit for capacity-constrained Long Island. Significant spinning reserve capability remains even if the system is being used for peak reduction.
Figure 16 Significant spinning reserve capability remains even when demand reduction is in effect, as shown in this 8/14/2002 curtailment.
-10
0
10
20
30
40
50
60
70
80
0:00 4:00 8:00 12:00 16:00 20:00 0:00
Hour
MW
Available Spinning Reserve WithoutDemand Reduction Response
Available Spinning Reserve WithDemand Reduction Response
Demand Reduction Response

23
R. Will using responsive loads hurt power system stability?
When implemented correctly load response can improve power system stability. Loads providing spinning reserve must respond to power system frequency deviations, just as spinning reserve generators do. It is true that load response does not include the stabilizing inertia provided by large generators. Load can provide full response much more quickly than generation, however. Generation typically takes the full ten minutes allowed for ramping up spinning reserve response while responsive load can typically provide its full response in cycles to seconds for a frequency disturbance. An example where responsive load provides superior spinning reserve when compared with generation can be seen in Figure 17. Western Electricity Coordinating Council (WECC) interconnection frequency response is shown for the sudden loss of the Palo Verde unit 1 generator. The lower red curve shows system frequency response with generators providing all of the spinning reserve. The upper blue curve shows that system frequency would not dip as low and would recover more quickly if 300 MW of spinning reserve were provided by a large pumping load instead of from generation. (Kueck and Kirby 2005)
Figure 17 WECC system stability is enhanced when 300 MW of responsive load (upper blue curve) replaces an equal amount of generation (lower red curve). Stability runs performed by Donald Davies of WECC.

24
S. Do customer overrides and voluntary response reduce the reliability value of load response?
Customer overrides are a concern but less so for loads providing ancillary services than for loads providing peak load reduction. Load response programs often find that they must accommodate voluntary response in order to increase participation. This is not surprising. While the cost of electricity is important to most consumers it is only one of many costs. Loads often find it impossible to make firm, long-term curtailment commitments because there is some chance that external events (external to the power system) will prevent them from reducing power consumption when requested. Even if a customer is able to respond 99% of the time, the other 1% of the time may be perceived to be of such high importance that the load is unwilling to participate in a curtailment program. This reaction is surprisingly universal; it can be true for residential as well as commercial and industrial customers. Manual override provides an alternative with benefits for both the power system and the customer. The advantage to the power system is that this option increases the load participation and likely reduces the required compensation. The advantage to the customer is that it can opt out of a particular curtailment if the inconvenience or cost for the specific event is unusually high. The natural fear from the power system side is that many customers will always opt out. Manual override is less of a problem when spinning reserve and contingency response is being supplied than when the peak load is being reduced for two reasons. Contingency event duration is shorter and natural human inertia and the slow temperature rise prevents customer response within the typical spinning reserve deployment event as shown in Figure 18 (Kirby 2003). But there is a technical solution as well. Carrier’s ComfortChoice responsive thermostats, for example, offer the power system operator the additional option of distinguishing between events that the customer can override and events that the customer cannot. This provides the customer with the ability to opt out of longer demand reduction events while blocking the override during shorter contingency events.
T. Is real-time monitoring needed or practical for responsive load? Does statistical response help?
Real-time supervisory control and data acquisition (SCADA) monitoring is currently required for the large generators that typically provide reliability reserves to the power system. Similar real-time monitoring is appropriate when large loads provide reliability reserves. Traditional monitoring may be too expensive for large numbers of small responsive loads, however, but it also may not be necessary to obtain the same level of reliability we currently enjoy when large generators supply contingency reserves. Contingency reserve resources are closely monitored for three distinct reasons: (1) to inform the system operator of the availability of reserves before they are needed, (2) to monitor deployment events in real time so that the system operator can take corrective action in case of a reserve failure, and (3) to monitor individual performance so that compensation motivates future performance. Because the same monitoring system
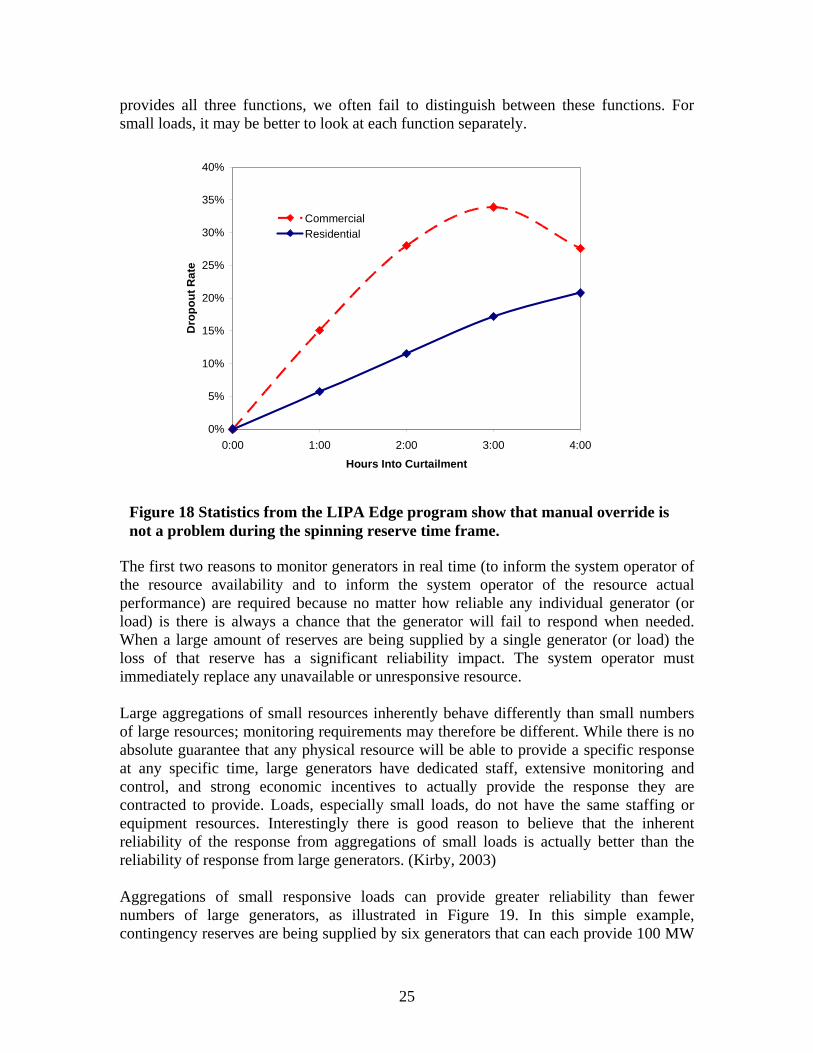
25
provides all three functions, we often fail to distinguish between these functions. For small loads, it may be better to look at each function separately.
The first two reasons to monitor generators in real time (to inform the system operator of the resource availability and to inform the system operator of the resource actual performance) are required because no matter how reliable any individual generator (or load) is there is always a chance that the generator will fail to respond when needed. When a large amount of reserves are being supplied by a single generator (or load) the loss of that reserve has a significant reliability impact. The system operator must immediately replace any unavailable or unresponsive resource. Large aggregations of small resources inherently behave differently than small numbers of large resources; monitoring requirements may therefore be different. While there is no absolute guarantee that any physical resource will be able to provide a specific response at any specific time, large generators have dedicated staff, extensive monitoring and control, and strong economic incentives to actually provide the response they are contracted to provide. Loads, especially small loads, do not have the same staffing or equipment resources. Interestingly there is good reason to believe that the inherent reliability of the response from aggregations of small loads is actually better than the reliability of response from large generators. (Kirby, 2003) Aggregations of small responsive loads can provide greater reliability than fewer numbers of large generators, as illustrated in Figure 19. In this simple example, contingency reserves are being supplied by six generators that can each provide 100 MW
0%
5%
10%
15%
20%
25%
30%
35%
40%
0:00 1:00 2:00 3:00 4:00
Hours Into Curtailment
Dro
pout
Rat
e
CommercialResidential
Figure 18 Statistics from the LIPA Edge program show that manual override is not a problem during the spinning reserve time frame.
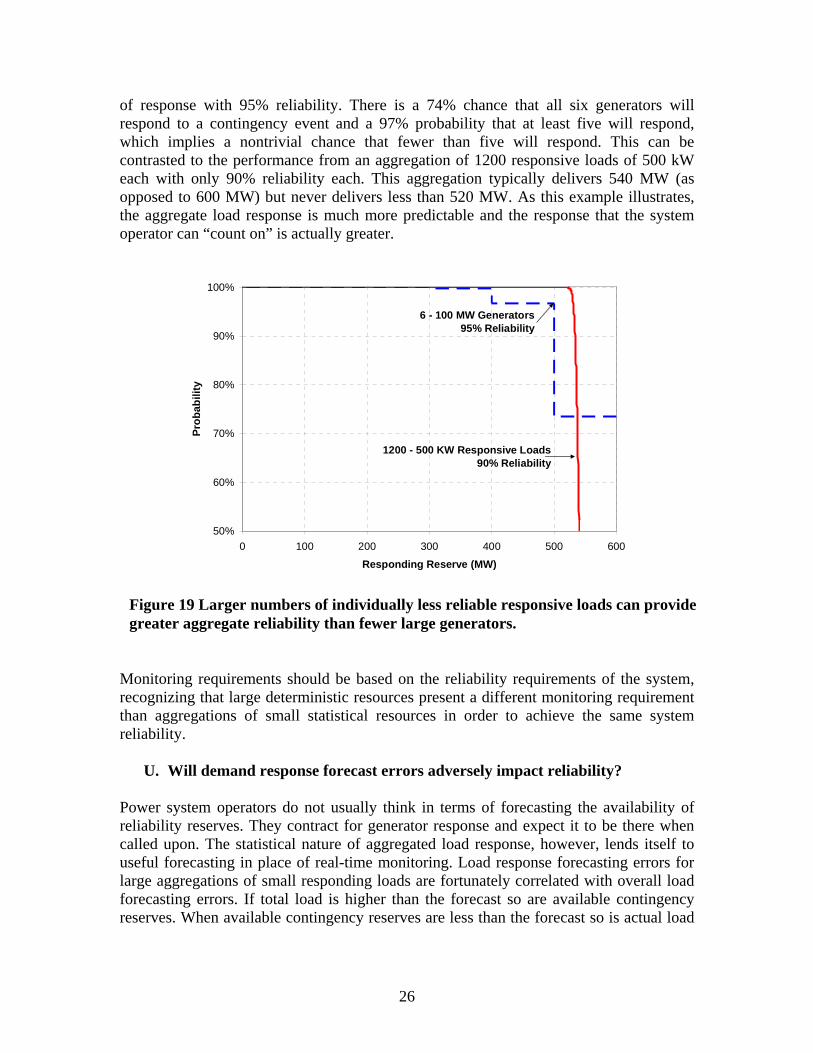
26
of response with 95% reliability. There is a 74% chance that all six generators will respond to a contingency event and a 97% probability that at least five will respond, which implies a nontrivial chance that fewer than five will respond. This can be contrasted to the performance from an aggregation of 1200 responsive loads of 500 kW each with only 90% reliability each. This aggregation typically delivers 540 MW (as opposed to 600 MW) but never delivers less than 520 MW. As this example illustrates, the aggregate load response is much more predictable and the response that the system operator can “count on” is actually greater.
Monitoring requirements should be based on the reliability requirements of the system, recognizing that large deterministic resources present a different monitoring requirement than aggregations of small statistical resources in order to achieve the same system reliability.
U. Will demand response forecast errors adversely impact reliability? Power system operators do not usually think in terms of forecasting the availability of reliability reserves. They contract for generator response and expect it to be there when called upon. The statistical nature of aggregated load response, however, lends itself to useful forecasting in place of real-time monitoring. Load response forecasting errors for large aggregations of small responding loads are fortunately correlated with overall load forecasting errors. If total load is higher than the forecast so are available contingency reserves. When available contingency reserves are less than the forecast so is actual load
50%
60%
70%
80%
90%
100%
0 100 200 300 400 500 600
Responding Reserve (MW)
Prob
abili
ty
6 - 100 MW Generators95% Reliability
1200 - 500 KW Responsive Loads90% Reliability
Figure 19 Larger numbers of individually less reliable responsive loads can provide greater aggregate reliability than fewer large generators.

27
and other generation which was scheduled to serve load is available to provide the reserves. Forecasting errors for load-supplied reserves can be more easily accommodated than forecast errors for the total load. A 10% error in the load forecast for a 30,000 MW balancing authority can result in a 3000 MW supply shortfall; a serious operating problem. A 10% error in 600 MW of expected reserve response from responsive load can be handled by derating the resource and calling for 10% more response than is needed. This derating can be refined as experience is gained.
V. Should demand response be treated as a regulated asset? Large loads that provide reliability services will likely want to be treated as commercial entities in the ancillary service markets. Their participation will be motivated by the markets’ financial rewards for performance. In that sense they are very like large generators. Small loads, especially residential loads, may be less motivated by and less able to participate in commercial ancillary service markets on their own. Electricity is only a small portion of their overall economic concerns. Still, they represent a large reliability resource with technical capabilities that are well matched to the power system’s reliability needs; a potentially large societal benefit. If commercial aggregators are unable to combine loads and enable their market participation it may be appropriate to treat responsive loads as a regulated resource. Transmission is almost always a regulated asset. Transmission facilitates rather than participates in the electricity market; it supports reliability. Costs are fully covered through the rate base. It is not motivated by energy market performance. Some large aggregations of small responsive loads have these characteristics as well. Some responsive residential load programs offer little economic motivation. Instead customers are motivated by a communal spirit of improving reliability, reducing pollution, and holding down overall costs. These resources could be treated as regulated assets with the capital and operating costs recovered through the rate base. The reliability response would be provided to the system operator at no cost and used to reduce the amount of purchased ancillary services. Responsive load could be treated as a regulated reliability asset that the system operator uses to optimize the operation of the power system. Load response would then be like other transmission assets such as capacitor banks and FACTS devices; equipment that’s cost is recovered by including it in the rate base or transmission tariff. This might be especially appropriate in cases where the load response is not driven primarily by energy market considerations and where the economic viability of the program is not driven by the loads’ opportunity costs. The cost of residential load response providing contingency reserves or peak reduction, for example, is dominated by the cost of communications and control, not by the response payment to the customer. Many customers receive no ongoing compensation. The communications and control could be considered part of the

28
SCADA system and the resource offered to the system operator as one more tool for maximizing transmission performance at minimal cost. Interestingly, involuntary load shedding is treated exactly this way.
W. Do NERC rules address demand response? There is surprisingly little in the North American Electric Reliability Council (NERC) reliability rules concerning demand response in general or the use of demand response for power system reliability. NERC is, of course, important to any discussion of power system reliability. It is the industry organization which addresses power system reliability for Canada, the U.S., and part of Mexico and has been selected by FERC to be the national Electric Reliability Organization (ERO). The voluntary structure of NERC’s past reliability rules is being replaced with enforceable reliability rules approved by FERC but the process is only partially completed. Demand response is not treated extensively in current NERC standards. The Modeling, Data, and Analysis (MOD) standards and the Transmission Planning (TPL) standards require those responsible for generating load forecasts to include (and document) controllable demand side management in the forecast if it exists. Depending on interpretation they may also require collecting data on demand side management performance. The NERC standards do not provide guidance on how or how much load response should be used. They only provide guidance on how to report load response capability. The NERC “Glossary of Terms Used in Reliability Standards” presents a concern. (NERC 2006 A) In it “Spinning Reserve” is defined as “unloaded generation that is synchronized and ready to serve additional demand” (emphasis added). In the recent past the Glossary has not been considered to be binding and specific requirements have been derived instead from the individual standards themselves. The increasing formality that is part of NERC’s transformation into the ERO, coming under FERC jurisdiction, and making NERC standards truly mandatory may give added legal weight to the Glossary. In the worst case this could disqualify PJM and ERCOT’s use of demand response as spinning reserve. Interestingly, the glossary also defines “Operating Reserves – Spinning” as “The portion of Operating Reserve consisting of: Generation synchronized to the system and fully available to serve load within the Disturbance Recovery Period following the contingency event; or Load fully removable from the system within the Disturbance Recovery Period following the contingency event.” It is not clear which definition applies and if responsive load is allowed by NERC rules to supply spinning reserve.
X. How do Regional Reliability Councils treat reliability demand response? All of the regional reliability councils allow demand response to be used as non-spinning and supplemental operating reserves. Most do not allow loads to provide spinning reserve but two regions, the Electric Reliability Council of Texas (ERCOT) and Reliability First Corporation (RFC) allow responsive load to provide spinning reserve. RFC changed its

29
rules in the spring of 2006 to allow loads to participate in all of PJM’s ancillary service markets. ERCOT obtains ancillary services and balancing energy (15 minutes) through markets. While ERCOT does simultaneous selection of ancillary service resources it does not force ancillary service providers into the energy market. ERCOT allows loads to provide spinning reserve but currently limits load to providing half of the total 2300 MW requirement until system operators gain further experience (Mickey, 2006) ERCOT has more loads offering to provide spinning reserve than they can accommodate. Responsive loads include air compressors, liquid oxygen plants, oil well fields, a cooperative’s 15 MW residential feeder, and an aluminum smelting plant. (Kueck-Patterson, 2006) Interestingly, though over 1600 MW of load offer to provide spinning reserve not a single load has offered to provide balancing energy. This may indicate that load response duration is more limited than response speed. The Midwest Independent System Operator (MISO) is in the midst of ancillary service market design and the supply rules are not yet clear. Markets for ancillary services typically develop shortly after markets for energy are established. The interdependence between the supply of energy and ancillary services makes this natural. Table 3 summarizes the current state of load participation in ancillary service markets.
Table 3 Current and pending ancillary service markets (adapted from MISO 2006)
Operating Reserves Regulation Spinning Non-spinning
Supplemental (10 min)
Long Term Supplemental
(30 min)
Replacement (60 min)
Co-optimization exemption
ISO-NE L L No NYISO L L No PJM L &C L &C L Yes MISO C C C Not yet set ERCOT L L L Yes CAISO L Yes
– Market based C – Cost based F – Fixed monthly MVAR payment L – Responsive load is allowed to participate
Y. Do capacity markets help or hurt demand response? Peak reducing demand response is frequently treated well in regions with capacity markets or capacity obligations. Reducing the peak demand has the added benefit that the reserve margin is reduced as well. Responsive loads providing ancillary services often do not fair as well. ISO-NE’s use of capacity markets designed around generation, for

30
example, makes it difficult for responsive loads to receive the same payment that generators receive and also reduce loads’ ability to participate in the ancillary service markets. Forward capacity markets mean that reserve costs are mostly sunk in real time and rational real time offers are expected to clear at $0. Further, ISO-NE utilizes forward reserve auctions, two to five months in advance, to procure ten minute non-spinning reserve and thirty minute operating reserves. These are difficult commitments for responsive loads to make. These markets are designed to satisfy 95% of the reserve requirements and include penalties for failure to respond in real time. Any resource can participate but it must look like a low capacity generator with a high energy price and capable of providing reserves 98% of the time. (DePillis, 2006) A responsive load can also register as a Dispatchable Asset Related Demand (DARD), in which case it will essentially be treated as a generator. The load can not restrict its response to contingency events; energy and ancillary services are co-optimized based upon the bid response price. Submitting a $999/MWH only partially mitigates the energy deployment risk and also undesirably reduces contingency event deployments. (DePillis, 2006)
Demand response programs are also sometimes economically disadvantaged in areas with formal capacity markets. Some markets impose an artificial requirement that response must be available 24 hours a day, all season long, for example. This is reasonable when the only source of response is generation whose availability is typically not time variant. Some load is not available to respond in blocks of a set size but it is always available when the power system is most heavily loaded and most stressed; at the time of the daily load peak. Figure 20 shows the stack-up of required capacity in real time. Figure 21 shows the coincidence of air conditioning load with total system load, justifying crediting
Load
Regulation
Spinning Reserve
Non Spinning Reserve
Capacity Reserve
Nee
ded
in R
eal T
ime
Figure 20 Ancillary services contribute to capacity requirements just as peak load requirements do.
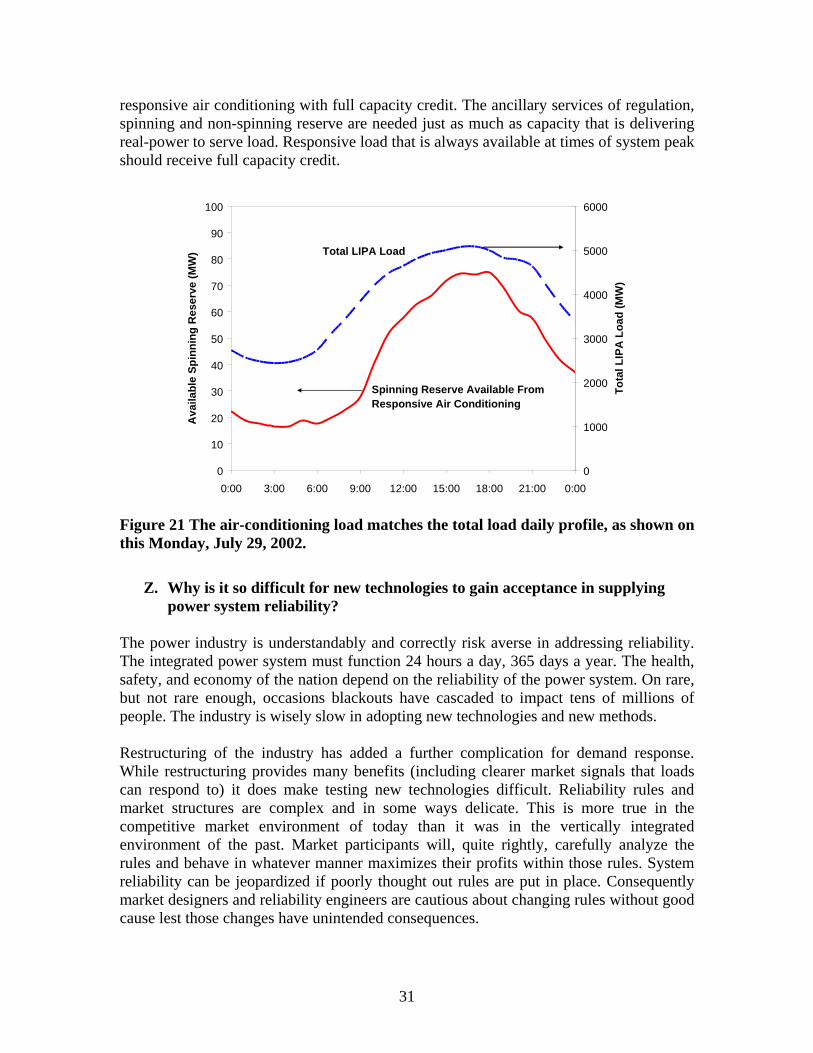
31
responsive air conditioning with full capacity credit. The ancillary services of regulation, spinning and non-spinning reserve are needed just as much as capacity that is delivering real-power to serve load. Responsive load that is always available at times of system peak should receive full capacity credit.
0
10
20
30
40
50
60
70
80
90
100
0:00 3:00 6:00 9:00 12:00 15:00 18:00 21:00 0:00
Ava
ilabl
e Sp
inni
ng R
eser
ve (M
W)
0
1000
2000
3000
4000
5000
6000
Tota
l LIP
A L
oad
(MW
)
Spinning Reserve Available From Responsive Air Conditioning
Total LIPA Load
Figure 21 The air-conditioning load matches the total load daily profile, as shown on this Monday, July 29, 2002.
Z. Why is it so difficult for new technologies to gain acceptance in supplying power system reliability?
The power industry is understandably and correctly risk averse in addressing reliability. The integrated power system must function 24 hours a day, 365 days a year. The health, safety, and economy of the nation depend on the reliability of the power system. On rare, but not rare enough, occasions blackouts have cascaded to impact tens of millions of people. The industry is wisely slow in adopting new technologies and new methods. Restructuring of the industry has added a further complication for demand response. While restructuring provides many benefits (including clearer market signals that loads can respond to) it does make testing new technologies difficult. Reliability rules and market structures are complex and in some ways delicate. This is more true in the competitive market environment of today than it was in the vertically integrated environment of the past. Market participants will, quite rightly, carefully analyze the rules and behave in whatever manner maximizes their profits within those rules. System reliability can be jeopardized if poorly thought out rules are put in place. Consequently market designers and reliability engineers are cautious about changing rules without good cause lest those changes have unintended consequences.
32
Reluctance to change rules can adversely impact new technologies and generate a chicken-or-egg problem. Technologies that are blocked from the market by current rules can not develop. Undeveloped technologies do not represent sufficient market force to warrant changing the rules to accommodate them. This is especially true for load response technologies which often require cooperation among a large number of entities. A load aggregator can not interest loads in being responsive until the rules allow the specific response and state what is required to provide it. Market designers will not consider changing market rules to accommodate load response technologies until they clearly see that there are sufficient MWs of response to make the effort worthwhile. Aggregators will not invest in response technology until the rules are clear and the loads are willing to respond. Testing new technologies is more difficult in the new restructured environment as well. Most ISOs do not have research budgets. It is very difficult for them to decide to conduct a limited test on a new technology. Their market rules are developed through large, slow consensus processes. Any test has to be agreed upon through the same slow, deliberative process. Simply allocating the cost of a test is often contentious and prevents progress.
AA. Is co-optimization compatible with demand response? Co-optimization (also called joint optimization, simultaneous optimization, or rational buying) minimizes the total cost of energy, regulation, and contingency reserves by allowing the substitution of “higher value” services for “lower value” services. If a generator offers spinning reserve at $8/MW-hr, for example, and other generators are offering non-spinning reserve at $12/MW-hr the co-optimizer will use the spinning reserve resource for non-spinning reserves (instead of the non-spinning reserves offered) and pay it the spinning reserve clearing price. Co-optimization has many benefits. It encourages generators to bid in with their actual costs for energy and each of the ancillary services. When they do so the co-optimizer is able to simultaneously minimize overall system costs and maximize individual generator profits. Unfortunately, co-optimization can effectively bar responsive loads as well as emissions-limited generators and water-limited hydro generators from offering to provide ancillary services. An aggregation of commercial refrigerators might be ideal providers of spinning reserve, for example. They could be instantaneously frequency responsive. They could respond to system operator commands much faster and more accurately than conventional generation. They might have nearly zero response cost (other than the initial capital cost). They might be able to easily sustain response for 30 to 60 minutes. But they would be completely unable to provide 8, 12, or 24 hour response. If there was a risk that their attractive offer to provide spinning reserve could be exercised as an energy source they would simply not enter the market. The power system would be denied the benefit of this excellent reliability resource. Many responsive loads differ from most generators in that the cost of response rises with response duration. An air conditioning load, for example, incurs almost no cost when it provides a ten minute interruption but incurs unacceptable costs when it provides a six
33
hour interruption. Conversely a generator typically incurs startup and shutdown costs even for short responses but only has ongoing fuel costs associated with its response duration. In fact, many generators have minimum run times and minimum shutdown times. This low-cost-for-short-duration-response (coupled with fast response speed) makes some responsive loads ideal for providing spinning reserve but less well suited for providing energy response or peak reduction. Unfortunately current market rules in New York and New England let the ISOs dispatch capacity assigned to reserves for economic reasons as well as reliability purposes. As long as the ISO has enough spinning and non-spinning reserve capacity to cover contingencies, it will dispatch any remaining resources economically regardless of whether that capacity is labeled as contingency reserve or not. Ancillary service and energy suppliers are automatically co-optimized. This policy works well for most generators but causes severe problems for loads that need to limit the duration or frequency of their response to occasional contingency conditions.2 Loads can submit very high energy bids in an attempt to be the last resource called but this is still no guarantee that they will not be used as a multi-hour energy resource. Submitting a high cost energy bid also means that the load will be used less frequently for contingency response than is economically optimal. Price caps on energy bids further limit the ability of the loads to control how long they are deployed for. The basic problem is that the co-optimizer is unable to recognize a cost curve that rises with time. This is opposite from most generators’ characteristic of declining cost curves (fixed transition costs spread over an increasing number of hours) which are accommodated. Most generators incur startup or transition costs. Many ISOs allow generators to specify these costs in their bids. These costs are spread over the length of the deployment. If 100 MW of generation is used for an hour a $1000 startup cost would add $10/MWH to the energy bid. The cost adder would be $5/MWH if the generation were run for two hours. Even if the startup cost is not explicitly accommodated the generator can factor it into the bid based on an expected operating duration. Generator profits typically rise with longer deployments and co-optimization. There is no similar accommodation of costs that rise with time. Fortunately there is a simple solution. California had this problem with their rational buyer but changed their market rules and now allows resources to flag themselves as available for contingency response only. PJM allows resources to establish different prices for each service and energy providing a partial solution. ERCOT does not have the problem because most energy is supplied through bilateral arrangements that the ISO is not part of. Energy and ancillary service markets are separate. Possibly as a consequence half of ERCOT’s contingency response comes from responsive load (the maximum currently allowed) while no loads offer to supply balancing energy.
2 Co-optimization often does not work for energy or emissions limited generators either.

34
3. CONCLUSIONS AND RECOMENDATIONS
Responsive load remains the largest underutilized reliability resource available to the North American power system today. Many loads have response characteristics that are technically well matched to the power system reliability needs. Unfortunately, market and reliability rules were developed when generators were the only resources available to the system operator. Consequently those rules often prohibit load response, especially for the fastest, most critical, and most expensive reliability services. This report examined a range of common concerns often expressed about load response. The advantages and disadvantages of utilizing load response have been discussed. Hopefully the report has shown that many of the commonly held biases against utilizing load response for reliability are no longer valid. Demand response is not a perfect reliability resource, but neither is generation. Some loads can respond much faster to reliability events than most generators making them more valuable than generation. Power system stability can be enhanced by the appropriate use of responsive load. Providing reliability services is a better match to the physical capabilities of some responsive loads than peak reduction or energy efficiency. Encouraging responsive loads to provide reliability services, including spinning reserve, can free up generating capacity to provide energy. Reliability council rules should be changed to capture the full potential that load response offers. The inherent characteristics of demand response should be accommodated, just as the inherent characteristics of generation are accommodated. Recognize that some responsive loads have maximum run times. Recognize the statistical nature of demand response from aggregations of numerous small loads. Recognize that the monitoring and communications requirements to maintain system reliability are fundamentally different for aggregations of large numbers of small resources than they are for fewer large resources. Recognize the coincidence of demand response capability and total system load and allocate appropriate capacity credit to demand response. Accommodate voluntary response and perform the research required to establish the level of reliable response capability. Assure that co-optimizers properly recognize the capabilities and characteristics of demand resources and do not let them force entities to provide services they are not capable of providing. Develop better load response forecasting tools for system operators to increase the usefulness and acceptability of demand response. Enable a mechanism that allows regional organizations to test new technologies without having to first permanently restructure markets. Include a mechanism to fund such tests. Consider treating some demand response resources as regulated transmission assets available for reliability response rather than as competitive entities acting in the energy markets. Given the societal benefits, it may be appropriate for independent transmission planning organizations to take a more proactive role in drawing demand response alternatives into the resource mix. Existing demand response programs provide a technical basis to build from.

35
ACKNOWLEDGMENT
This work was coordinated by the Consortium for Electric Reliability Technology Solutions for the U.S. Department of Energy, Office of Electricity Delivery and Energy Reliability. It is based upon research efforts concerning ancillary services and responsive load which has been supported for many years by Phil Overholt and the Department Of Energy. Thanks go to John Kueck, Fangxing Li, and Stan Hadley for reviewing a draft of the paper.

36
REFERENCES M. DePillis, 2006, The New Ancillary Services Markets of New England, MISO Ancillary Services Round Table, 26 April FERC 1996, Promoting Wholesale Competition Through Open Access Non-discriminatory Transmission Services by Public Utilities; Recovery of Stranded Costs by Public Utilities and Transmitting Utilities, Order 888, Federal Energy Regulatory Commission, May FERC Staff, 2006, Assessment of Demand Response and Advanced Metering, Federal Energy Regulatory Commission, Docket AD-06-2-000, August E. Hirst and B. Kirby, 2003, Opportunities for Demand Participation in New England Contingency Reserve Markets, New England Demand Response Initiative technical paper, February B. Kirby, 2006, The Role of Demand Resources In Regional Transmission Expansion Planning and reliable Operations, ORNL/TM-2006/512, Oak Ridge National Laboratory, July B. Kirby, 2003, Spinning Reserve From Responsive Loads, ORNL/TM-2003/19, Oak Ridge National Laboratory, March B. Kirby and E. Hirst, 2003, Technical Issues related to Retail Load Provision of Ancillary Services, New England Demand Response Initiative technical paper, February J. Kueck and B. Kirby, 2005, Presentation to the WECC CMOPS, 7 January J. Kueck and M. Patterson, 2006, telephone interview, October J. Mickey, 2006, Competitive Ancillary Services Market in ERCOT, MISO Ancillary Services Round Table, 26 April MISO 2006, Ancillary Services Round Table, Midwest Independent System Operator, Carmel Indiana, April 26-27 NERC, 2006A, Glossary of Terms Used in Reliability Standards, North American Electric Reliability Council, Princeton, NJ, May 2 NERC, 2006B, Reliability Standards for the Bulk Electric Systems of North America, North American Electric Reliability Council, Princeton, NJ, February 7, Downloaded from www.nerc.com on 20 March, 2006