Embed Size (px)
Citation preview

Chapter 2 Demand and supply 27
Introduction
Economic systems exist to attempt to deal with the economic problem. An economic system tries to coordinate the production and distribution of goods and services to satisfy the wants of society. In economics we refer to two important functions of an economic system:
• The allocation of resources
• The distribution of income
Economic systems vary from ‘free market’ to ‘planned’, but regardless of the type they must all answer the following fundamental questions:
• What goods and services will be produced and in what quantity?• How will the goods and services be produced in terms of
production technique and types of resources? • Forwhom will the goods and services be produced?
In this chapter, we outline how these questions are answered in a market economy. Markets are one way to coordinate economic activity - they allocate resources in order to resolve the economic problem. Markets help to allocate scarce resources to satisfy the many competing wants in an economic system. Markets coordinate economic activity and provide incentives for both consumersandproducers.Economistsbelievethatmarketsareanefficientway to deal with the economic problem because they do not require any resources to function. The market coordinates decisions between buyers and sellers in a decentralised way. Markets work because when people engage in exchange, they gain!
Demand and Supply
2

Discovering Economics28
A market is said to exist when buyers and sellers exchange goods, services or resources. A market consists of three important elements:
• buyers (demand)• sellers (supply)• something to exchange (a good, service or resource)
A market is also characterised by voluntary exchange. This means that buyers and sellers are not forced to participate in exchange, but do so willingly. This is important because Buyers and sellers might meet face-to-face, but could also exchange goods and services by mail, telephone, or the internet. Buyers and sellers may also deal with one another through an intermediary or middle-man, as happens in the stock market, where transactions are usually handled by brokers on behalf of their clients. Productmarkets deal with the buying and selling of goods and services. In a product market, consumers represent the demand side of the market, while producers or firmsrepresentthesupplyside.Firmsproducegoodsandservicesandsellthem to households (consumers). Factormarkets deal in the buying and selling of factors of production or resources such as the labour market, the capital market and natural resource markets. In a factor market, households sell their resources to firms. In a factormarket, households represent thesupplysideofthemarket,whilefirmsrepresentthedemandside.
Marketscanalsobeclassifiedaccordingtotheintensityofcompetitioninthemarket. A competitivemarket is characterised by:
• a large number of buyers and sellers• firmsarepricetakers• very similar (homogeneous) products • easy entry into the market (no barriers to entry or exit)
In a competitive market, price is determined by the interaction between buyersandsellers.Noindividualbuyerorsellercaninfluencethemarketprice-thismeansthatthereisnomarketpower.Firmsarecalledpricetakersbecause they must take the price that is established by the market. There are many examples of competitive markets - agricultural markets, fruit and vegetables,cafesandhairdressingsalons.Thesmallbusinesssectorsatisfiesmany of the assumptions of a competitive market. Any market with a large numberofrelativelysmallfirmssellingverysimilargoodsand/orservicesand with easy entry conditions is a competitive market. A market that is not competitive is called an imperfectornon-competitivemarket. An imperfect market is characterised by:
• asmallnumberoffirms• productdifferentiation• firmsarepricesetters-theyhavemarketpower• entry into the market is restricted
Chapter 2 Demand and supply 29
A monopoly market is an extreme type of imperfect market with just one dominantfirm.Anoligopolyisamarketwithafewdominantfirms.Firmswith market power can set their own price - they are called price setters. An imperfectmarketischaracterisedbyproductdifferentiationwherefirmstrytomaketheirproducts‘lookdifferent’intheeyesofconsumersandusebarrierstoentrytomakeitdifficultfornewfirmstoenterthemarket.InAustraliathere are many examples of imperfect markets. Coles and Woolworths are a virtual duopoly in the grocery market. The mobile phone services market is dominatedbyjustthreefirms:Telstra,OptusandVodaphone.
The role of prices
In the market system the three key economic questions are answered by the price mechanism - the interaction of buyers and sellers in the market. In a market economy, the consumer is king (consumer sovereignty), meaning that consumers determine what will be produced, and how much will be produced. Consumers signal their tastes and preferences to producers by casting their dollar votes when they buy goods and services. Producers respond to the levelofdemandsignalledbyconsumers. Forexample, inthe clothing market, striped shirts may become more popular than plain shirts.Ifretailersfindthatthesalesofstripedshirtsarehighandstocksarefalling, they will increase the production of striped shirts. When petrol prices increase, smaller cars become more popular and car producers will respond by increasing the production of small cars relative to large cars.
In the market economy, the how to produce question is answered by producers. Like consumers, producers are guided by the principle of self interest.Tooperateprofitably,firmshavetooperateefficientlyandminimisecosts. Producers will compare the prices of inputs when deciding what techniques of production to use. The market system provides an incentive fortheproducertobecomemoreefficientandlowercostsinordertoincreaseprofits.
Price also determines the ‘for whom’ question. The rewards of production reflect the pricewhich themarket iswilling to pay for resources. Wages and salaries are the reward for labour; owners of natural resources receive rent; the owners of capital receive dividends (or interest in the case of moneycapital);andtheownersofentrepreneurialskillsreceiveprofits.Theamountofincomeearnedbyresourceownersgenerallyreflectsthescarcityof the resource they have provided. Skilled workers, for example, are paid a higher wage than unskilled workers. Doctors and engineers will receive a higher income than clerical staff or sales staff. Elite sportsmen such asRafael Nadal and Tiger Woods earn millions of dollars annually because of their rare sporting skills. We will now turn our attention to how competitive markets determine prices. We will focus on the most important model in microeconomics - the model of demand and supply.
Discovering Economics30
Demand
Demand refers to the buying intentions of consumers. The quantity demanded of a good or service is the quantity that consumers are willing and able to purchase, at a particular price and at a particular time. Demand is not the same thing as a want. Many people may want a luxury yacht, but only a few are willing and able to purchase the yacht. Demand refers to the actualbuyingintentionsofconsumers.ImightwantaFerrari,butIactuallypurchaseaHondaCivicbecausethatiswhatIcanafford.
An important law in economics is the law of demand. The law of demand describes a negative relationship between price and quantity demanded. As the price of a good rises, people buy less of it, ceteris paribus (holding other factors constant). What is the explanation for the law of demand? There are two important reasons.
• Theincomeeffect-whenthepriceofagoodrises,consumersarenot willing to buy as much of the good because their real income or purchasing power has decreased. If you have $100 in income and the price of a pizza is $10 then your real income is 10 pizzas. If the price of pizzas increases to $20, then your real income halves to just 5 pizzas. When your real income falls you are poorer and thereforeyouwillpurchaseless.Theincomeeffectworksinbothdirections - when the price of a good falls, your real income rises and you will purchase more.
• The substitution effect - when the price of one good rises,other goods become more attractive to buyers because they are relatively cheaper. An increase in price will cause consumers to switchtorelativelycheapersubstitutes.Forexample,anincreasein the price of pizza will cause some consumers to switch to other typesoffastfood.Ontheotherhand,adecreaseinthepriceofpizza, will now make substitute goods relatively more expensive and consumers will purchase more pizza.
Noticethatboththesubstitutioneffectandtheincomeeffectworktogethertoreinforce the law of demand. Are there any exceptions to the law of demand? The simple answer is No! The law of demand holds for all goods and services - as long as the ceteris paribus condition holds. Don’t be fooled by people whoclaimthatthereareexceptionstothelawofdemand.Forexample,itis often argued that if a consumer buys an expensive brand rather than a cheap brand, this violates the law of demand. This is incorrect because we aredealingwithtwodifferentgoods.Theconsumermayusepriceasasignalof quality and have a preference for the more expensive brand. To break the law of demand, the consumer when given a choice of buying the same goodattwodifferentpriceschoosestopaythehigherprice.Forexampleifyou decide to purchase an item for $50 but the sales person says that it has a special 20% discount, reducing its price to just $40. Would you refuse the

Chapter 2 Demand and supply 31
discount? If you said to the sale person that you wanted to pay full price, then you would be breaking the law of demand. In other words, you would be a ‘stupid irrational person’!
Ofcourse,thelawofdemandvariesinstrengthbetweendifferenttypesofgoodsdependingonhowstrongtheincomeandsubstitutioneffectsare.Forexample, the law of demand for petrol will be relatively weak. There are few close substitutes for petrol. If the price of petrol increases, consumers will finditdifficulttosubstituteawayfrompetrol.Thelawofdemandfororangejuice will be much stronger. There are many close substitutes for orange juice such as apple, pineapple, guava and grape juice. If the price of orange juice increases, then consumers can readily substitute into another fruit juice.
Figure 2.1 shows a demand schedule and ademand curve for pizza. A demand schedule is simply a table showing the quantity demanded of a goodconsumersarewillingtopurchaseatvariousprices.Figure2.1showsthe weekly quantity of pizzas that consumers are willing to buy at various prices. It is called a market demand schedule because it is the summation of all the individual consumers in the market. As we would expect, rational consumers are willing to buy more pizzas at lower prices than they are at higher prices. We can convert the data from the schedule to a graph known as the market demand curve for pizza.
The graph’s axes represent price on the Y axis, and quantity demanded on the X axis. Note that the demand curve is negatively sloped (downward sloping totheright)reflectingthelawofdemand.Thereareotherfactorsapartfromprice,however,whichmayaffectthedemandforagoodorservice.Theseare all the factors that were held constant (ceteris paribus conditions) in derivingthedemandcurve.Non-pricefactorsaffectingdemandincludetheconsumer’s disposable income, the prices of related goods (e.g. substitutes
Demand schedulePrice ($) Quantity
demanded12 1000010 200008 300006 400004 50000
The demand schedule and graph illustrate the Law of Demand - price and quantity demanded are negatively related, ceteris paribus. As price rises, quantity demanded falls.
Figure 2.1 The demand curve
12
10
8
6
4
0 10 20 30 40 50
Price ($)
D
Quantity (’000)
Discovering Economics32
and complements), the tastes and preferences of consumers, consumer expectations and demographic (population) factors.
Non-price factors affecting demand
Price is an important but not the only determinant of demand. The demand curve shows that quantity demanded is a negative function of price, but there are non-price determinants such as the income of consumers; the prices of related goods; the preferences of consumers; expectations of consumers and demographic factors.
• Levels of disposable income
Your level of income determines your budget - what you can and cannot afford.Consumerswillnormallypurchasemoreofagoodwhentheirincomeincreases. Most goods in the economy are referred to as normal goods. A normalgoodisdefinedasonewheredemandincreasesasincomeincreases.An inferior good is a good where demand decreases as income rises. An example of an inferior good is a very low quality product such as a ‘plain wrap’ or ‘home’ brand product.
• The price of related goods
Onmostoccasions,consumerscanchoosebetweenanumberofgoodsandservices which satisfy the same wants. These are referred to as substitutes. Forexample,thereisawiderangeoffastfoodproductsonthemarketotherthan pizza. Consumers for example, can choose from chicken, hamburgers, kebabs,noodles,orfishandchips-thelistisverylongandvaried.Iftheprice of pizza rises, the quantity demanded of pizza will fall and consumers will increase their demand for other types of fast food. There are many other examplesofsubstitutegoodssuchasteaandcoffee,butterandmargarine,orange and apple juice.
Many goods are also consumed with other goods - these goods are called complements. For example, computers require software; filing cabinetsrequire document folders; cars require petrol; and the playing of tennis requires courts, racquets and balls. You might like to consume pizza with garlic bread or with a bottle of coke. If the price of pizza rises, the quantity demanded of pizza will fall, and the the demand for complement goods, such as garlic bread will decrease. Similarly, a rise in the price of computers will lead to a decrease in the demand for software while a decrease in the price of cars will lead to an increase in the demand for petrol.
• Tastes and preferences
The tastes and preferences of consumers are an important determinant of consumerdemand.Theadvertisingindustryattemptstoaffectconsumers’preferences through persuasion and information. Consumers have quickly
Chapter 2 Demand and supply 33
embraced products such as fast food, mobile phones, and tablets. Plasmas and LCDs have quickly replaced television sets. Cassettes replaced vinyl records and then were superseded by compact discs (CDs). Sales of CDs have now declined dramatically as consumer preferences shift towards digital recordings. Digital cameras have led to the death of the 35mm camera. Many consumers now indicate a preference for environmentally friendly ‘green’ and organic products.
• Expectations of consumers
If people expect conditions to change in the future, they may make decisions nowratherthanpostponethem.Forexample,ifthepriceofpetrolisexpectedto rise due to a crisis in the Middle East, consumers will increase their purchase now to beat the price rise. This is rational behaviour. Expectations of a future price rise will increase the current demand for the product. If you expected the price of petrol were to fall next week, then you would decrease your current demand and wait for the price to fall.
• Demographic factors
The size and age composition of the population can have an important bearing on the pattern of demand. A growing population increases the marketsizeforallgoodsandserviceswhereasachangeintheageprofilewillaffectspecificgoodsandservices.Forexample,astheAustralianpopulationages, the demand for child care facilities will decrease relative to the demand for retirement facilities. There is a growing demand for ocean cruises as the population ages and more people enter retirement age.
Changes in demand
We distinguish between two types of changes in demand:
• a movement along the curve - caused by a change in price.• a shift of the entire curve - caused by a non-price factor.
These changesare shown infigure2.2.Achange in thepriceof thegooditself will lead to a movement along the demand curve. A change in price willcauseachangeinquantitydemanded.Forexample,anincreaseintheprice of a good will cause a decrease in quantity demanded whereas a fall in price will cause an increase in quantity demanded (panel a). It is important to remember that when price changes, we move along the curve. A change in price cannot shift the curve.
Changes in any of the other non-price (ceteris paribus) factors affectingdemand will cause a shift in the entire demand curve. When non-price factors change, the result is a new demand curve. There are two types of shifts - an increase in demand occurs when the demand curve shifts to the right; a decrease in demand occurs when the demand curve shifts to the left

Discovering Economics34
(refertopanelbinfigure2.2).Anincrease in demand, for example, might result from any of the following events:
• An increase in consumer income (for a normal good)• A decrease in consumer income for an inferior good• A fall in the price of a complementary good • An increase in the price of a substitute good• A change in tastes and preference in favour of the good• The expectation that price will rise in the future• An increase in the number of consumers in the market
Supply
Supply represents the sellers or producers side of the market. Supply is the amount of a good or service that producers are willing and able to sell at a particular price and at a particular point in time. The relationship between the quantity supplied and the price of a good is a positive one. The law of supply states that as the price of a good or service rises, the quantity supplied will also rise. Notice that this is opposite to the law of demand. The law of supplyalsoassumesthatallnon-pricefactorsthatmayaffectsupplyareheldconstant - the ceteris paribus assumption. What is the economic reason for the law of supply? Rational, self-interested producers would prefer to sell theiroutputatahighpricethanatalowpricebecauseoftheprofitmotive.If you are selling a good or service you would prefer to sell at the highest pricepossible.Whenfirmsincreasetheiroutputtheymayalsofindthattheir
The supply curve
Figure 2.2 Changes in demand
0 10 20 30 40 50
Price$
D
Quantity
12
10
8
6
4
0 10 20 30 40 50
Price$
D
Quantity
12
10
8
6
4
A
B
C
A
B C
Movements Shifts
Decrease
A change in price causes a movementalong the curve. A rise in price decreasesquantity demanded, while a fall in priceincreases quantity demanded.
Increases or decreases indemand are shifts of the entirecurve, caused by a factor otherthan the price of the good.
D1
D2
Increase

Chapter 2 Demand and supply 35
production costs may increase which would require price to rise to maintain theirprofitmargin.
Figure2.3depictsthesupplyscheduleandthesupplycurveforpizzas.Asupply schedule is simply a table showing the quantity supplied of a good producersarewillingtosellatvariousprices.Figure2.3showstheweeklyquantity of pizzas that producers are willing to sell at various prices. It is called a market supply schedule because it is the summation of all the individual producers in the market. As we would expect, rational producers are willing to sell more pizzas at higher prices than they are at lower prices. We can convert the data from the schedule to a graph known as the market supply curve for pizza. Note that the supply curve is positively sloped, reflectingthelawofsupply.
Non-price factors affecting supply
Thereareotherfactorsapartfrompricewhichcanaffectthesupplyforagoodor service. These are all the factors that were held constant (ceteris paribus conditions) in deriving the supply curve. The most important factors are the pricesofinputs;pricesofothergoodsthefirmcanproduce;technology;thenumber of sellers; and expectations of producers.
• Prices of inputs
The price of resources such as labour, capital and raw materials determine thefirm’scostsofproduction.Asupplycurvecanbethoughtofasacostcurveforthefirm.Usually,afirm’slargestcostsarewagesandsalariesandthe cost of purchasing raw materials. An increase in production costs will meanthatforagivenprice,thefirmwilldecreaseitsproduction.
Supply schedulePrice ($) Quantity
supplied12 5000010 400008 300006 200004 10000
The supply schedule and graph illustrate the Law of Supply - price and quantity supplied are positively related, other things being equal. As price rises, quantity supplied rises.
Figure 2.3 The supply curve
Price$
S
Quantity (’000)0 10 20 30 40 50
12
10
8
6
4
Discovering Economics36
• Prices of other goods
Production is a process which involves combining productive resources to produceafinalgood. Inmanycases the sameresources couldbeused toproduce other goods. The producer will closely monitor movements in the prices of the goods he is capable of supplying so that he can take advantage of profitopportunities.Inagriculture,forexampleafarmermayshiftresourcesfrom wheat production to wool if the price of wool rises relative to wheat. A car manufacturer will decrease the supply of large cars if small cars become more popular.
• Technology
Technology is knowledge about the techniques of production. If technology improves, then more output can be produced from the same quantity of resources. Thismeans that the firm’s costs of productionwill fall. Otherthings being equal, an improvement in technology will result in an increase in supply. The supply curve will shift to the right. The cost of many products including computers, household appliances and electronic devices has continuously fallen over time as a result of improvements in technology.
• Expectations of producers
Suppliersexpectationsoffutureconditionsmayaffectthequantitysupplied.If a higher price is expected in the future, then firmswill decrease theircurrentsupplyinordertotakeadvantageoffuturehigherprices.Firmswillmake decisions about investing in plant and machinery on expected future prices. Expected high prices for oil for example, will encourage increased exploration. Similarly if afirmexpected a labour strike, itmight increasecurrentproductionsothatfuturesupplywillnotbeaffected.
Changes in supply
There are two types of changes in supply:
• A movement along the supply curve - caused by a change in price• A shift of the entire supply curve - caused by a change in a non-
price factor
Thesechangesareshowninfigure2.4.Changesinthepriceofthegooditselfwill lead to a movement along the supply curve. A change in price causes a change in quantity supplied. An increase in the price of the good will cause an increase in the quantity supplied while a fall in price leads to a decrease in the quantity supplied. It is important to remember that when price changes, we move along the curve. A change in price cannot shift the curve. Changes inanyoftheothernon-pricefactorsaffectingsupplywillcauseashiftinthewhole supply curve. These factors were all held constant when the initial supply curve was drawn. Allowing these factors to change will result in a new supply curve. There are two types of shift - an increase in supply occurs

Chapter 2 Demand and supply 37
when the supply curve shifts to the right; a decrease in supply occurs when the supply curve shifts to the left. An increase in the supply of a good will result from any of the following events:
• An improvement in technology • A decrease in production costs (input prices)• The expectation that prices will fall in the future• An increase in the number of producers in the market
Equilibrium price and quantity
It is important to remember that a market consists of both buyers (demand) and sellers (supply). To determine the market price and quantity we combine the demand and the supply curve on the one graph. The price that clears the market is referred to as the equilibrium price. This is the price that balances the buying intentions of consumers with the selling intentions of producers. Figure2.5bringsthetwosidesofthemarket(demandandsupply)together.The equilibrium price and quantity will be where quantity demanded equals quantity supplied. This will be the price where the demand curve intersects with the supply curve.
It is also important to understand how the market will automatically achieve the equilibrium price and quantity. Suppose that the price of pizzas happened tobe$12.Atthisprice,sellersareofferingaquantityof50,000forsale,whilebuyers only wish to purchase 10,000. There is an excess supply or surplus
Figure 2.4 Changes in supply
0 10 20 30 40 50
Price$ S
Quantity
12
10
8
6
4
Price$
Quantity
A
B
C
Movements Shifts
AB
C
S2
SS1
0 10 20 30 40 50
12
10
8
6
4
Decrease
Increase
Increases and decreases are shifts of the supply curve, causedby a factor other than the price of the good
A change in price causes a movementalong the curve. A rise in price increasesquantity supplied, while a fall in pricedecreases quantity supplied.
Discovering Economics38
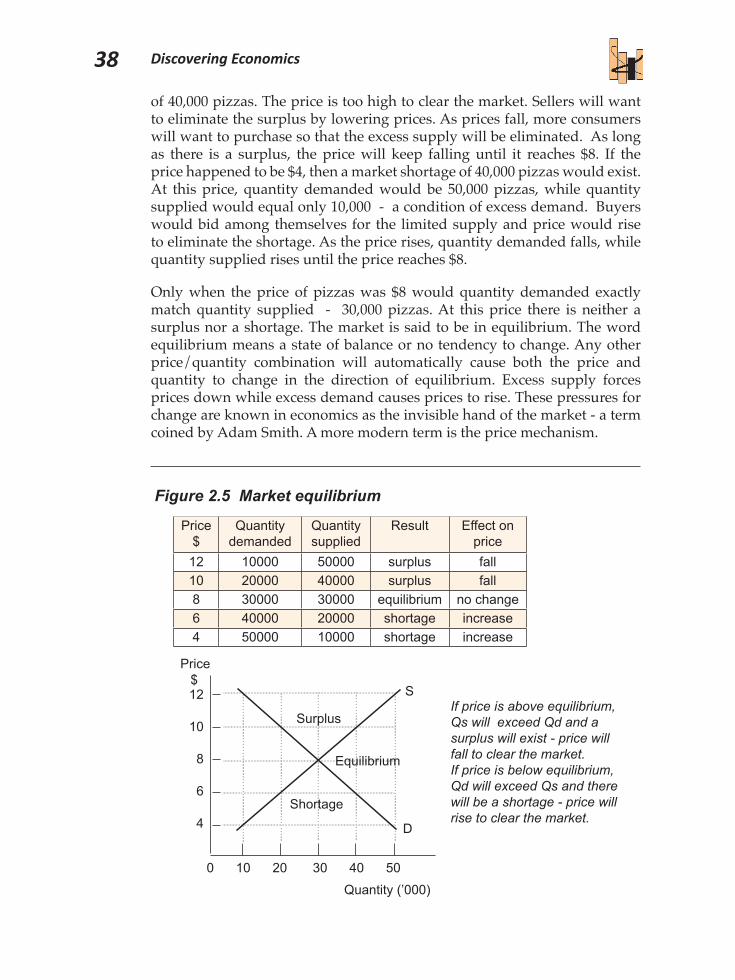
of 40,000 pizzas. The price is too high to clear the market. Sellers will want to eliminate the surplus by lowering prices. As prices fall, more consumers will want to purchase so that the excess supply will be eliminated. As long as there is a surplus, the price will keep falling until it reaches $8. If the price happened to be $4, then a market shortage of 40,000 pizzas would exist. At this price, quantity demanded would be 50,000 pizzas, while quantity supplied would equal only 10,000 - a condition of excess demand. Buyers would bid among themselves for the limited supply and price would rise to eliminate the shortage. As the price rises, quantity demanded falls, while quantity supplied rises until the price reaches $8.
Onlywhen theprice ofpizzaswas $8wouldquantitydemanded exactlymatch quantity supplied - 30,000 pizzas. At this price there is neither a surplus nor a shortage. The market is said to be in equilibrium. The word equilibrium means a state of balance or no tendency to change. Any other price/quantity combination will automatically cause both the price andquantity to change in the direction of equilibrium. Excess supply forces prices down while excess demand causes prices to rise. These pressures for change are known in economics as the invisible hand of the market - a term coined by Adam Smith. A more modern term is the price mechanism.
0 10 20 30 40 50
Price$
S
Quantity (’000)
12
10
8
6
4 D
Equilibrium
Surplus
Shortage
Price $
Quantity demanded
Quantity supplied
Result Effect on price
12 10000 50000 surplus fall10 20000 40000 surplus fall8 30000 30000 equilibrium no change6 40000 20000 shortage increase4 50000 10000 shortage increase
Market equilibrium
Figure 2.5 Market equilibrium
If price is above equilibrium, Qs will exceed Qd and a surplus will exist - price will fall to clear the market.If price is below equilibrium, Qd will exceed Qs and there will be a shortage - price will rise to clear the market.

Chapter 2 Demand and supply 39
Prices are always adjusting in competitive markets in response to changes in demand and supply conditions. Changes to the market will create either temporary shortages or surpluses which will then cause price to change to re-establish a new equilibrium. The length of time required to eliminate shortages and surpluses though will vary from one market to another. In the sharemarket,priceschangeveryquicklytofindabalancebetweenbuyersand sellers. The price of the Australian dollar in the foreign exchange market changes by the minute to balance supply and demand factors. In fruit and vegetable markets, prices adjust daily in response to supply and demand conditions. These are all good examples of competitive markets. As long as a market is able to operate freely, prices will always adjust to balance demand and supply.
Changes in demand and supply
Why do prices in markets fluctuate? The reason is that either demandconditions change which shifts the demand curve or supply conditions change which shifts the supply curve. Remember, a given demand curve and supply curve will establish a unique equilibrium price and quantity, but if the demand curve or the supply curve shift, then a new equilibrium will be established. We can refer to four types of changes to a market equilibrium, because both the demand curve and the supply curve can increase (shift to the right) or decrease (shift to the left):
• an increase in demand.• a decrease in demand.• an increase in supply.• a decrease in supply.
For eachof these changes,weneed to analyse the impacton equilibriumprice and quantity.
• Increase in Demand
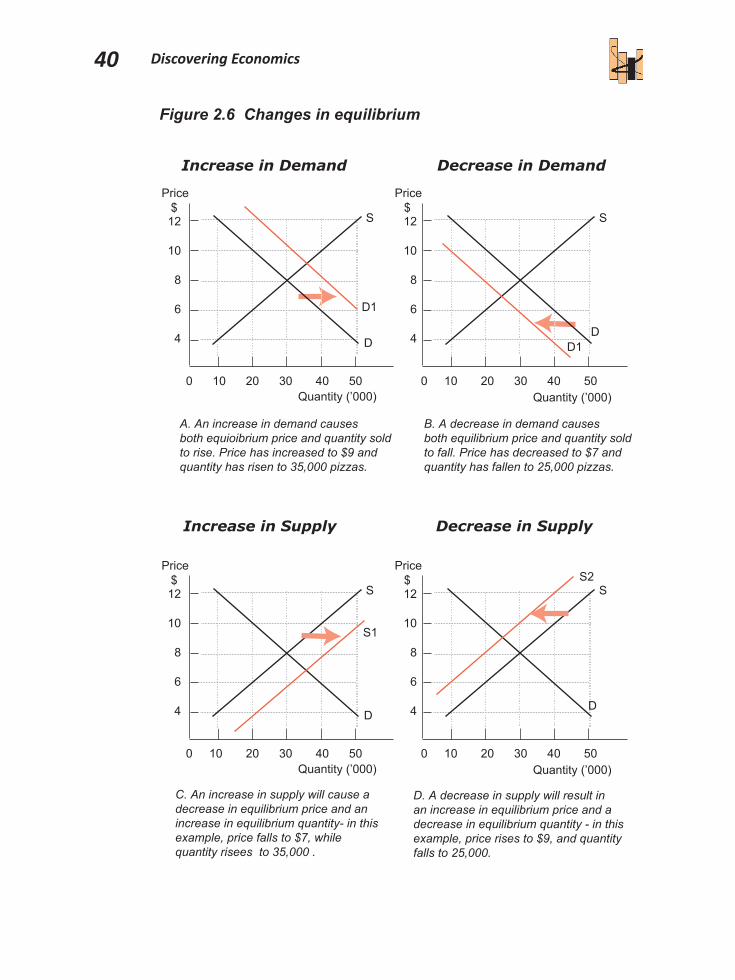
Imagine a new medical report that announced that pizza consumption improved your intelligence. This would lead to an increase in the demand for pizzas - the demand curve for pizzas will shift to the right, as consumers’ preferenceschange(seeFigure2.6,panela).Attheoriginalequilibriumpriceof $8, quantity demanded will now exceed quantity supplied. This excess demand for pizzas will cause the price to rise to a higher equilibrium where the new demand curve intersects with the supply curve. At the higher price, quantity supplied will increase. So an increase in demand will result in an increase in the equilibrium price and equilibrium quantity. Whenever you see rising prices and rising sales in a market, then you know that demand for the good is increasing.
Discovering Economics40
Increase in Demand Decrease in Demand
Increase in Supply Decrease in Supply
Figure 2.6 Changes in equilibrium
0 10 20 30 40 50
Price$
S
Quantity (’000)
12
10
8
6
4 D
Price$
S
Quantity (’000)
D
D1
A. An increase in demand causes both equioibrium price and quantity sold to rise. Price has increased to $9 andquantity has risen to 35,000 pizzas.
B. A decrease in demand causes both equilibrium price and quantity sold to fall. Price has decreased to $7 and quantity has fallen to 25,000 pizzas.
D1
12
10
8
6
4
0 10 20 30 40 50
0 10 20 30 40 50
Price$
S
Quantity (’000)
12
10
8
6
4 D
Price$
S
Quantity (’000)
D
S1
C. An increase in supply will cause adecrease in equilibrium price and an increase in equilibrium quantity- in thisexample, price falls to $7, whilequantity risees to 35,000 .
D. A decrease in supply will result in an increase in equilibrium price and a decrease in equilibrium quantity - in thisexample, price rises to $9, and quantityfalls to 25,000.
S212
10
8
6
4
0 10 20 30 40 50

Chapter 2 Demand and supply 41
• Decrease in Demand
Imagine if it was reported that pizza consumption was a cause of cancer. Now consumers would change their preferences away from pizza. This wouldleadtoadecreaseinthedemandforpizza(seeFigure2.6,panelb).The demand curve would shift to the left. The equilibrium price of pizza would fall and the equilibrium quantity of pizza would also fall. Whenever you see prices and quantities falling in a market, then you can safely assume that demand for the product is decreasing.
• Increase in Supply
A change in production costs or technology are important factors that can shift the supply curve. Suppose that a new pizza oven is created which reduces the time to cook pizza helping to lower production cost. This will causethesupplycurvetoshifttotheright-anincreaseinsupply(seeFigure2.6,panelc).Pizzaproducerswillnowbeabletosupplymorepizzasforthesame cost. The equilibrium price will fall, while the equilibrium quantity will rise - the intersection of the new supply curve will the demand curve. Price has fallen to $7 and quantity has increased to 35,000.
• Decrease in Supply
Suppose there was an increase in the price of mozzarella cheese - a key ingredient in producing pizzas. This would increase the cost of making pizza and would cause the supply curve to shift to the left - a decrease in supply (see Figure 2.6, panel d). The new equilibriumwill bewhere thenew supply curve intersects with the original demand curve - price will rise while quantity sold will fall. In our example, price has increased to $9, while quantity has fallen to 25,000.
Simultaneous shifts in demand and supply
When a single curve shifts, our model of demand and supply makes it relatively easy to predict the movement in price and quantity. However, what will happen to equilibrium price and quantity if both curves shift at the same time? While this is more complex, our model can still be used to analysethechangestopriceandquantity.Forexample,ifwecombineanincreaseindemandwithanincreaseinsupply(Figure2.7,panela),thentheequilibrium quantity must increase, but the equilibrium price may rise, fall or stay constant - it is indeterminate. This is because an increase in demand pushes price up while an increase in supply pulls price down. What happens to price will depend on the relative shift of each curve. If the demand curve shifts more than the supply curve, then the equilibrium price will rise. If the supply curve shifts by more, then the equilibrium price will fall. In our example, both curves have shifted the same amount so that the equilibrium price has not changed. An excellent example is the computer market. The demand for computers has been increasing over time, while the cost of
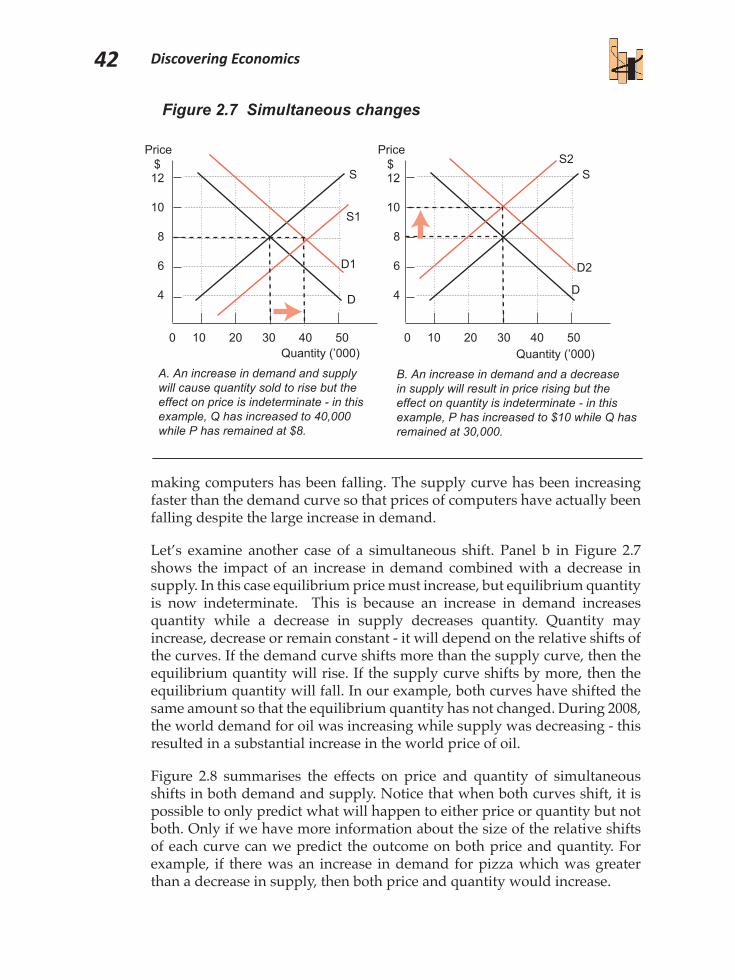
Discovering Economics42
making computers has been falling. The supply curve has been increasing faster than the demand curve so that prices of computers have actually been falling despite the large increase in demand.
Let’s examine another case of a simultaneous shift. Panel b in Figure 2.7shows the impact of an increase in demand combined with a decrease in supply. In this case equilibrium price must increase, but equilibrium quantity is now indeterminate. This is because an increase in demand increases quantity while a decrease in supply decreases quantity. Quantity may increase, decrease or remain constant - it will depend on the relative shifts of the curves. If the demand curve shifts more than the supply curve, then the equilibrium quantity will rise. If the supply curve shifts by more, then the equilibrium quantity will fall. In our example, both curves have shifted the same amount so that the equilibrium quantity has not changed. During 2008, the world demand for oil was increasing while supply was decreasing - this resulted in a substantial increase in the world price of oil.
Figure 2.8 summarises the effects on price and quantity of simultaneousshifts in both demand and supply. Notice that when both curves shift, it is possible to only predict what will happen to either price or quantity but not both.Onlyifwehavemoreinformationaboutthesizeoftherelativeshiftsofeachcurvecanwepredict theoutcomeonbothpriceandquantity.Forexample, if there was an increase in demand for pizza which was greater than a decrease in supply, then both price and quantity would increase.
Figure 2.7 Simultaneous changes
0 10 20 30 40 50
Price$
S
Quantity (’000)
12
10
8
6
4 D
Price$
S
Quantity (’000)
D
S1
A. An increase in demand and supplywill cause quantity sold to rise but the effect on price is indeterminate - in thisexample, Q has increased to 40,000while P has remained at $8.
B. An increase in demand and a decrease in supply will result in price rising but the effect on quantity is indeterminate - in this example, P has increased to $10 while Q has remained at 30,000.
S212
10
8
6
4
0 10 20 30 40 50
D1 D2

Chapter 2 Demand and supply 43
Demand & Supply - Case Study 1
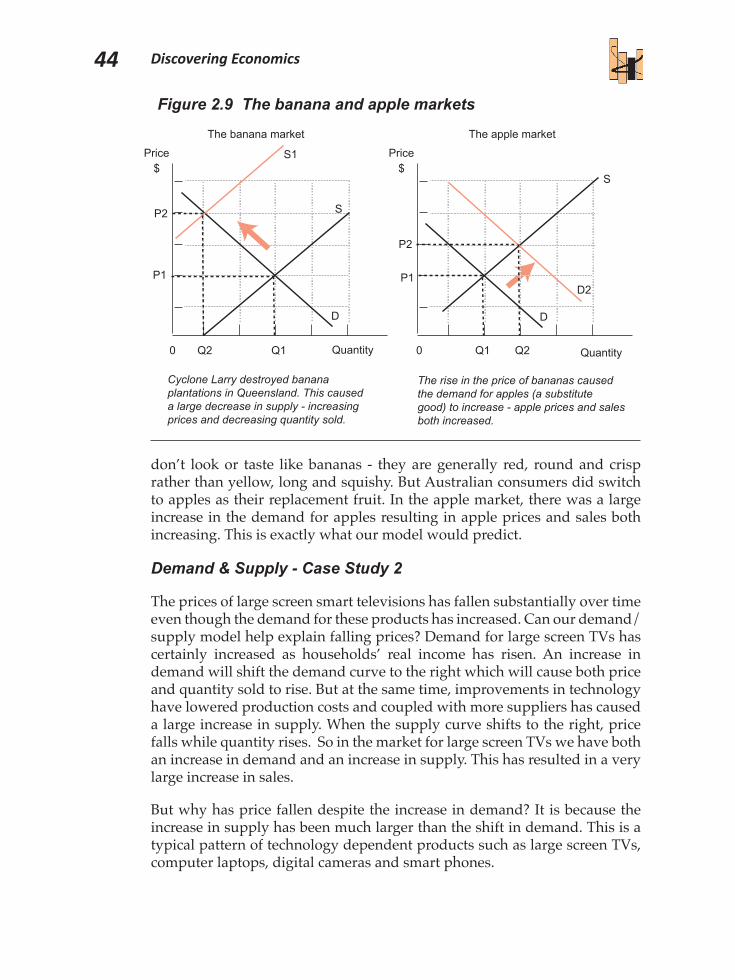
TheAustralianfruitandvegetablemarket isoftenaffectedbythecycloneseason in Queensland - destructive winds and rain can destroy much of Queenslands crops resulting in shortages and high prices.. In 2011, for example, Cyclone Yasi devastated Australia’s banana industry. It destroyed over $300 million of Queensland’s banana crop. Queensland accounts for around 95 per cent of Australia’s banana production. What would we predict wouldhappentobananapricesandsales?Usingourmodelofdemandandsupplywewould show theeffectofCycloneLarryasa largedecrease insupply. The supply curve for bananas would shift to the left resulting in a large increase in bananapricesandasignificantdecrease inbananasales.ThisisshowninFigure2.9.
The cyclone would be an example of a supply factor, not a demand factor. Is there a shift in the demand curve? The answer is no! The supply curve shifts and we move up along the demand curve. If a news report told you that a cyclone was approaching, would you immediately have a craving for bananas? Would eating bananas protect you from a cyclone? The answer is no - the demand curve for bananas does not shift! Do not make the mistake of thinking that if banana prices increase this will cause a decrease in the demand for bananas and shift the demand curve to the left. It is important to remember that a change in price cannot shift the curve - only a change in one of the ceteris paribus factors can shift the curve.
What did banana consumers do in response to banana prices tripling? They obviously stopped buying bananas - as the price of bananas rose, quantity demanded fell (a movement up along the demand curve) and looked for a substitute fruit. Is there a close substitute for bananas? Yes, Australian consumers actually increased their purchases of apples! Apples certainly
Type of Shift Effect on Price Effect on Quantity
Increase in Demand andIncrease in Supply
Indeterminate Increase
Increase in Demand andDecrease in Supply
Increase Indeterminate
Decrease in Demand andIncrease in Supply
Decrease Indeterminate
Decrease in Demand andDecrease in Supply
Indeterminate Decrease
Figure 2.8 Predicting market changes
Discovering Economics44
don’t look or taste like bananas - they are generally red, round and crisp rather than yellow, long and squishy. But Australian consumers did switch to apples as their replacement fruit. In the apple market, there was a large increase in the demand for apples resulting in apple prices and sales both increasing. This is exactly what our model would predict.
Demand & Supply - Case Study 2
The prices of large screen smart televisions has fallen substantially over time eventhoughthedemandfortheseproductshasincreased.Canourdemand/supplymodelhelpexplainfallingprices?DemandforlargescreenTVshascertainly increased as households’ real income has risen. An increase in demand will shift the demand curve to the right which will cause both price and quantity sold to rise. But at the same time, improvements in technology have lowered production costs and coupled with more suppliers has caused a large increase in supply. When the supply curve shifts to the right, price fallswhilequantityrises.SointhemarketforlargescreenTVswehavebothan increase in demand and an increase in supply. This has resulted in a very large increase in sales.
But why has price fallen despite the increase in demand? It is because the increase in supply has been much larger than the shift in demand. This is a typicalpatternoftechnologydependentproductssuchaslargescreenTVs,computer laptops, digital cameras and smart phones.
0 Q2 Q1
Price$
Quantity
P2
P1
D
Price$
S
Quantity
D
S1
Cyclone Larry destroyed bananaplantations in Queensland. This causeda large decrease in supply - increasingprices and decreasing quantity sold.
The rise in the price of bananas caused the demand for apples (a substitute good) to increase - apple prices and sales both increased.
P2
P1
0 Q1 Q2
D2
The banana market The apple market
S
Figure 2.9 The banana and apple markets

Chapter 2 Demand and supply 45
Chapter 2 Review
Worksheet1. What is a market? 2. Distinguish between a competitive market and an imperfect market.3. Explain the role of price in a market economy.4. Definedemand.5. State the law of demand.6. What is the income effect? What is the substitution effect?7. List the main non-price factors affecting demand.8. Explain the difference between a normal good and an inferior good.9. Explain the difference between a substitute good and a complement good.10. How does a change in price affect demand?11. How does a change in a non-price factor affect demand?12. What effect would an increase in income have on demand?13. Definesupply.14. State and explain the law of supply.15. List the main non-price factors affecting supply.16. How does a change in price affect supply?17. How does a change in a non-price factor affect supply?18. What effect would an increase in costs have on supply?19. When is the market in equilibrium?20. How does the market respond to a shortage? What about a surplus?21. Explain what happens to equilibrium price and quantity for each of the
following: a. An increase in demand b. A decrease in supply c. An increase in demand and a decrease in supply. d. An increase in demand and an increase in supply.
Data InterpretationThe table opposite shows the banana market.1. Graph the demand and supply curve
and determine the equilibrium price and quantity.
2. If the price was set at $2 per kg would there be a shortage or surplus of bananas? What would happen to the market price?
3. If the price was set at $5 per kg would there be a shortage or surplus of bananas? What would happen to the market price?
4. If the price of a substitute fruit increased, what would happen in the banana market? What curve would shift and what would happen to the price and quantity sold of bananas?
5. If the government introduced a new banana tax, show the impact on the banana market and explain the effect on price and quantity.
$ Price per kg
Quantity demanded (kg)
Quantity supplied (kg)
1 600 1002 500 2003 400 3004 300 4005 200 5006 100 600

Discovering Economics46
Demand and Supply - the market for cars1. The graph in the left panel shows the demand curve for cars. For each of
the cases below, indicate whether there will be a change in demand (shift - increase or decrease) or a change in the quantity demanded (movement - expansion or contraction)
a. The price of petrol increases. b. The price of public transport increases. c. Real incomes increase. d. The supply of cars increases. e. The price of cars falls. f. The price of cars is expected to rise in 6 months time.
2. The graph in the middle panel above shows the supply curve for cars. For each of the cases below, indicate whether there will be a change in supply (shift - increase or decrease) or a change in the quantity supplied (movement - expansion or contraction)
a. The price of oil increases. b. The price of steel decreases. c. Robotics are introduced on car assembly lines. d. The demand for cars increases. e. The price of cars falls. f. Tariffs (import taxes) on cars are reduced.
3. The graph in the right panel shows the combined demand and supply curves. a. What factors could cause the market price of cars to increase? b. Illustrate the impact of a recession on the car market. What would
happen to the market price and quantity. c. If both demand and supply both increased what would happen to price &
quantity? d. If demand increased and supply decreased, what would happen to price
& quantity? e. The real price of cars has fallen over time even though the demand for
cars has increased? How can this be explained?
D
$
Qty
S$
Qty
S$
Qty
D
Chapter 2 Demand and supply 47
Case Study - Oil Prices
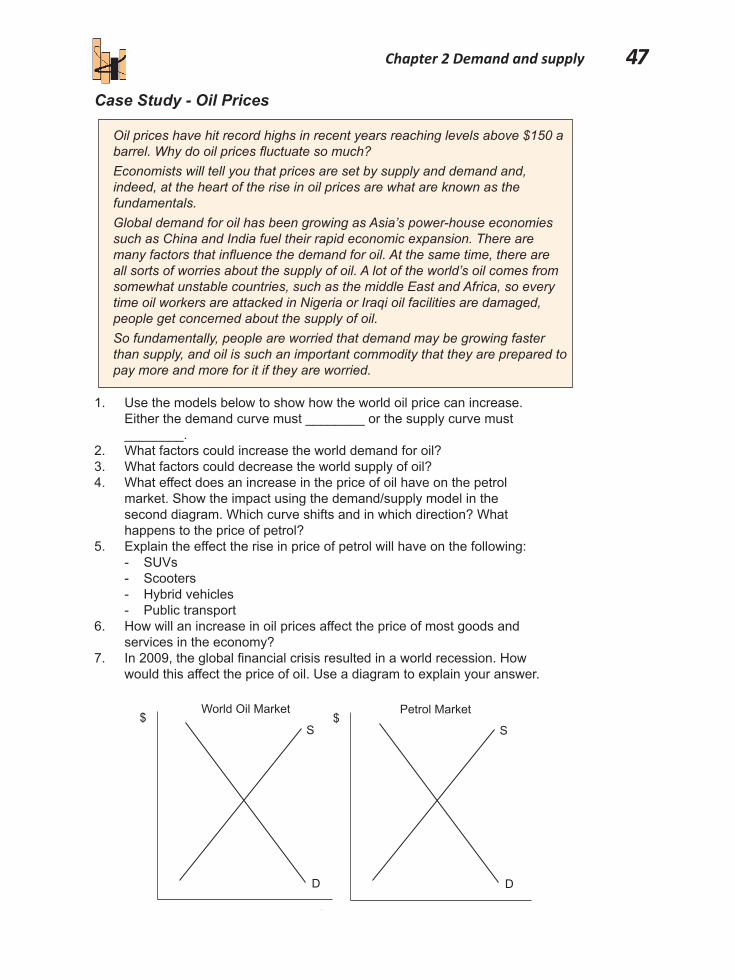
1. Use the models below to show how the world oil price can increase. Either the demand curve must ________ or the supply curve must ________.
2. What factors could increase the world demand for oil?3. What factors could decrease the world supply of oil?4. What effect does an increase in the price of oil have on the petrol
market. Show the impact using the demand/supply model in the second diagram. Which curve shifts and in which direction? What happens to the price of petrol?
5. Explain the effect the rise in price of petrol will have on the following: - SUVs - Scooters - Hybrid vehicles - Public transport6. How will an increase in oil prices affect the price of most goods and
services in the economy?7. In2009,theglobalfinancialcrisisresultedinaworldrecession.How
would this affect the price of oil. Use a diagram to explain your answer.
World Oil Market
D
S$
Qty
Petrol Market
D
S$
Qty
Oil prices have hit record highs in recent years reaching levels above $150 a barrel. Why do oil prices fluctuate so much? Economists will tell you that prices are set by supply and demand and, indeed, at the heart of the rise in oil prices are what are known as the fundamentals.Global demand for oil has been growing as Asia’s power-house economies such as China and India fuel their rapid economic expansion. There are many factors that influence the demand for oil. At the same time, there are all sorts of worries about the supply of oil. A lot of the world’s oil comes from somewhat unstable countries, such as the middle East and Africa, so every time oil workers are attacked in Nigeria or Iraqi oil facilities are damaged, people get concerned about the supply of oil.So fundamentally, people are worried that demand may be growing faster than supply, and oil is such an important commodity that they are prepared to pay more and more for it if they are worried.

Discovering Economics48
Case Study - Wine Market
1. Is wine likely to be a normal good or an inferior good?
2. Why has the demand for wine increased? Use the demand/supply model to show how this affects price.
3. Highprofitshaveattractedmoreproducers into the wine market. Which curve will this shift - demand or supply - and in which direction?
4. Show how a surplus in the market will cause price to fall.
5. ‘If the price of grapes falls, this will lead to an increase in demand which will push prices back up.’ What is wrong with this statement?
Fish becoming a luxury product?
1. Woulddecliningfishstocksshiftthe demand curve or the supply curveforfish?Inwhichdirection?Use a demand/supply model to show the impact on price and quantity.
2. What is happening to the cost of supplyingfish?Howwouldthisaffectthepriceoffish?
3. Fish prices usually increase at Christmas time. Explain why using the demand/supply model.
4. Why do the prices of other foods such as chicken and beef remain relativelystablecomparedtofish?
Fish in Western Australia may become too expensive for the average family to afford. Fish and chips was once viewed as a relatively inexpensive family takeaway meal. But this Aussie favourite may soon be priced out of the market. Fish stocks are falling and the costs of obtaining fish are increasing. Fish species such as Dhufish and Pink Snapper are being depleted rapidly which is causing their price to escalate. Sellers say that it is too expensive to sell fish like Dhufish. Due to its short supply it had become a real luxury product that few customers could afford.
The wine industry took off in Australia in the 1990s as the demand for wine increased. Wine is generally viewed as a luxury consumer good and as incomes have risen, so too has the demand for wine, especially premium wine. But high prices and profits led to a surge in new wineries being established. The wine industry is a good example of a competitive market - a large number of producers, similar products and relatively low entry barriers. With increased plantings of grapes, wine prices fell due to a surplus of grapes on the market. Good news for wine consumers but bad news for wine producers. Many small wine producers are now finding it difficult to survive in the market.
S$
Qty
D
Wine Market
Chapter 2 Demand and supply 49
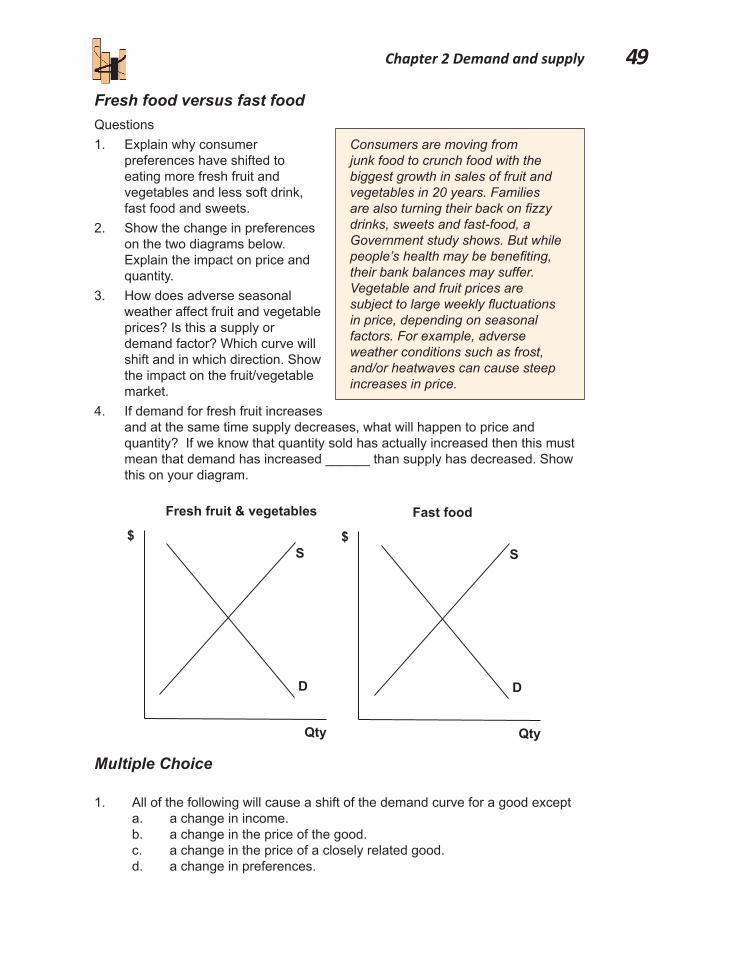
Fresh food versus fast foodQuestions1. Explain why consumer
preferences have shifted to eating more fresh fruit and vegetables and less soft drink, fast food and sweets.
2. Show the change in preferences on the two diagrams below. Explain the impact on price and quantity.
3. How does adverse seasonal weather affect fruit and vegetable prices? Is this a supply or demand factor? Which curve will shift and in which direction. Show the impact on the fruit/vegetable market.
4. If demand for fresh fruit increases and at the same time supply decreases, what will happen to price and quantity? If we know that quantity sold has actually increased then this must mean that demand has increased ______ than supply has decreased. Show this on your diagram.
Multiple Choice
1. All of the following will cause a shift of the demand curve for a good except a. a change in income. b. a change in the price of the good. c. a change in the price of a closely related good. d. a change in preferences.
Consumers are moving from junk food to crunch food with the biggest growth in sales of fruit and vegetables in 20 years. Families are also turning their back on fizzy drinks, sweets and fast-food, a Government study shows. But while people’s health may be benefiting, their bank balances may suffer. Vegetable and fruit prices are subject to large weekly fluctuations in price, depending on seasonal factors. For example, adverse weather conditions such as frost, and/or heatwaves can cause steep increases in price.
S$
Qty
D
Fresh fruit & vegetables
S$
Qty
D
Fast food
Discovering Economics502. A demand curve is usually drawn on the assumption that a. demand is not affected by the price of the good. b. factorsinfluencingdemandotherthanpriceareheldconstant. c. consumers buy whatever they want. d. people buy more of a good when its price is raised.
3. If the price for a product rises, then, ceteris paribus a. supply will increase (supply curve will shift to the right). b. the demand curve will shift to the left. c. quantity supplied will rise. d. quantity demanded will rise.
4. Mrs Smith recently announced that she was becoming a vegetarian and eliminated meat from her diet. Her behaviour represents
a. a change in her demand for meat. b. a movement to the end of her demand curve for meat. c. a reaction to higher meat prices. d. a movement to the end of her demand curve for vegetables.
5. A shift to the left of a demand curve could be due to a a. rise in the price of a complement. b. rise in the price of a substitute. c. fall in the price of the good. d. fall in the quantity supplied.
6. If goods A and B are close substitutes, a decrease in the price of good A would cause
a. the demand curve for good A to shift to the right. b. the demand curve for good A to shift to the left. c. the demand curve for good B to shift to the right. d. the quantity demanded of good B to increase.
7. The discovery of an improved production technique would result in a. A movement upwards along the supply curve. b. A movement downwards along the supply curve. c. A shift to the left to a new supply curve. d. A shift to the right to a new supply curve.
8. Which of the following pairs could be considered complements? a. coffee and tea. b. oranges and apples. c. bread and butter. d. coke and pepsi.
9. Which of the following is not a factor affecting demand? a. Price. b. Consumer income. c. Consumer preferences. d. Number of sellers.
Chapter 2 Demand and supply 51
10. “Market equilibrium” is achieved a. only after government intervention. b. at a price at which quantity demanded equals quantity supplied. c. when there is an equal number of buyers and sellers in the market. d. when there is no shortage of the commodity.
11. If quantity demanded exceeds quantity supplied then a. price will fall. b. price will rise. c. price is at equilibrium. d. the demand curve will shift to the right.
12. An increase in quantity supplied would be shown graphically as a: a. movement along a supply curve. b. rightward shift of a supply curve. c. leftward shift of a supply curve. d. movement along a demand curve.
13. Assume that apples and oranges are substitutes. If there is an increase in the supply of oranges, this will
a. shift the demand curve for apples to the right. b. shift the demand curve for oranges to the right. c. increase the price of apples. d. decrease the price of apples.
14. If buyers’ tastes changed in favour of pizza, and there was a simultaneous improvement in pizza cooking technology, we would expect
a. a shift to the right of both the demand and supply curves and an increase in both price and quantity.
b. a shift to the right of both the demand and supply curves and a decrease in both price and quantity.
c. a shift to the left of both the demand and supply curves with an increase in price and a decrease in quantity.
d. a shift to the right of both the demand and supply curves with an increase in quantity and either a rise or a fall in price.
15. Anormalgoodisdefinedasagoodforwhichdemandincreasesas a. its price decreases. b. the price of a substitute increases. c. the income of consumers increases. d. the number of consumers of the good increases.
16. Which of the following wold cause a decrease in the demand for tennis balls?
a. A rise in the price of tennis rackets. b. A rise in the price of tennis balls. c. A rise in the price of golf clubs. d. A fall in the price of tennis shirts.

Discovering Economics52
17. Suppose that there is a decrease in the fees charged to play golf at all golf courses. What effect will this have on the market for golf balls?
a. A decrease in supply. b. An increase in supply. c. A decrease in demand. d. An increase in demand.
18. If a surplus exists in the market for pizzas, an economist would predict that a. the price of pizzas will rise. b. producers will increase the production of pizzas. c. the supply of pizzas will increase. d. the price of pizzas will fall.
19. If both the demand and supply of a good increased, it could be predicted that a. equilibrium price and equilibrium quantity will increase. b. equilibrium price and equilibrium quantity will decrease. c. equilibrium quantity will increase but equilibrium price may rise or
fall. d. equilibrium price will increase but equilibrium quantity may rise or
fall.
20. During 2007, the price of housing in Perth increased and the quantity sold also increased. This implies that
a. the law of demand does not work. b. the supply of housing must have increased. c. the demand for housing must have increased. d. the demand for housing is upward sloping.
21. The market price of a good tends to rise when demand: a. and supply both decrease. b. decreases, while supply increases. c. increases, while supply decreases. d. and supply both increase.
22. If jeans become less popular while cotton prices soared, we could expect: a higher prices for jeans. b lower prices for jeans. c lower quantities of jeans. d higher quantities of jeans.
23. The “law of demand” refers to the fact that, other things remaining the same, when the price of a good rises,
a. the demand curve shifts rightward. b. the demand curve shifts leftward. c. there is a movement down along the demand curve to a larger
quantity demanded. d. there is a movement up along the demand curve to a smaller quantity
demanded.
Chapter 2 Demand and supply 53
24. An increase in the demand for bananas combined with an increase in the supply of bananas will cause the market:
a quantity to decrease. b price to decrease. c quantity to increase. d price to increase.
25. Vegemitesandwichesandtunafishsandwichesaresubstitutes.Supposean international agreement reduced the worldwide catch of tuna by half. The equilibrium price of vegemite would:
a. rise while the equilibrium quantity decreased. b. fall while the equilibrium quantity increased. c. fall and so would the equilibrium quantity. d. rise, and so would the equilibrium quantity.
26. If persistent shortages of petrol causes the price of petrol to rise by 10 percent each month, most economists would favor:
a. pricecontrolsonpetroltopreventinflation. b. government subsidies for the petrol industry. c. increasing the taxes on petrol. d. allowing the price of petrol to continue to rise until the shortage was
eliminated.
27. EBay a. willbeconsideredamarketwhentheInternetfirmsareprofitable. b. is a market because buyers and sellers are brought together to buy
and sell. c. would be a market if there was only one physical location. d. cannot function as a market.
28. Consider the market for mobile phones. Which of the following shifts the demand curve leftward?
a. studies showing using mobile phones can cause brain cancer b. an increase in the price of mobile phones c. a decrease in the quantity demanded of mobile phones d. an increase in the services provided by mobile phones, such as text
messaging
29. Suppose that the equilibrium price and quantity of new houses both increase. Which of the following could be a cause of this change?
a. Both the supply and the demand for new houses increased and the supply increased by more than the demand.
b. The demand for new houses increased and the supply did not change. c. Both the supply and demand for new houses decreased. d. The supply of new houses decreased and the demand for new houses
did not change.

Discovering Economics54
Extended writingWrite extended answers (about two pages of writing) to the following questions.
1. a. Explain the meaning of the term ‘market’. b. Outline the difference between product and factor markets. c. What are the characteristics of a competitive markets? Provide
examples.
2. a. Explain why consumers buy less of a good as its price rises. b. Explain how consumers react in markets when (i) their income increases; (ii) when the prices of related goods changes.
3. a. Explain the meaning of the term ‘market equilibrium’. b. Explain why surpluses and shortages may exist, and why they are
eliminated in competitive markets. c. Distinguish between an increase in demand, and an increase in
quantity demanded. 4. a. All markets are interrelated to varying degrees. Assume that the
demand for wheat increases. Explain, using diagrams the effects on the wheat market; the wool market; the market for tractors and farm machinery; the car market.
b. Suppose that the price of new cars is higher this year than last year, but sales of new cars are also higher. Does this disprove the law of demand?
5. What is the effect of each of the following on the equilibrium price and quantity of hamburgers such as a ‘Big Mac’ or a ‘Whopper’? Use diagrams to support your answers.
a. An increase in the price of chicken burgers. b. An increase in the price of french fries. c. An outbreak of ‘mad cow’ disease. d. A new tax on all fast food. e. New research discovers that eating hamburgers prevents hair loss.
6. Explain each of the following using the model of demand and supply: a. The demand for computers increases over time and yet computer
prices continually fall. b. The price of fruit and vegetables increases after a cyclone. c. Bicycle sales soar with rising petrol prices. d. As incomes rise consumers spend less on instant coffee and more
on espresso.