Embed Size (px)
Citation preview
Delticom AG: Company PresentationHanover, 19 March 2015

Company Presentation
Hanover, 19 March 20152
Agenda
3-7 | Delticom group overview
8-11 | Replacement tyre business
12-17 | Strategy
18-22 | Financials FY 2014
23-24 | Outlook 2015
Company Presentation
Hanover, 19 March 20153
Agenda
3-7 | Delticom group overview
8-11 | Replacement tyre business
12-17 | Strategy
18-22 | Financials FY 2014
23-24 | Outlook 2015

Company Presentation
Hanover, 19 March 20154
Delticom – Europe‘s leading online tyre retailer
► 163 online shops in 42 countries across the globe (Europe, North America & East Asia)
► Service partners: EU 35,344, Non-EU 5,780 + around 7,000 via Tyrepac
► More than 25,000 models from over 100 tyre brands for cars, motorcycles, commercial vehicles and buses
► Complete wheels, motor oil, replacement parts and accessories
► Multi-brand strategy

Company Presentation
Hanover, 19 March 20155
From e-commerce pioneer to European market leader
1999 – 2008:First mover and international expansion
1999
Delticom founded by a team
including Rainer Binder and
Andreas Prüfer
First mover advantage in
many European countries
2006
IPO on Frankfurt Stock
Exchange (Prime Standard)
2009 – 2011:Exceptionally goodmarkets
2012 – 2014:Challenging marketenvironment
2009 – 2011
Exceptionally good markets
due to wintery conditions and
regulations (scrapping
incentive schemes,
mandatory winter tyre
requirement)
2011
Investments in warehouse
infrastructure
2012 – 2014
Little snowfall and pull-forward
effect on tyre sales from
exceptional 2009 – 2011
regulatory and weather
conditions
2013
Tirendo acquisition
2014
Full integration of Tirendo
2015:Delticom market excellence
► 01/15: 15 years RDDE
► 03/15: 14y RDCH /
13y RDSE
► 05/15: 11y RDIT
► 08/15: 14y RDUK
► 10/15: 13y RDFR /
12y RDES
Company Presentation
Hanover, 19 March 20156
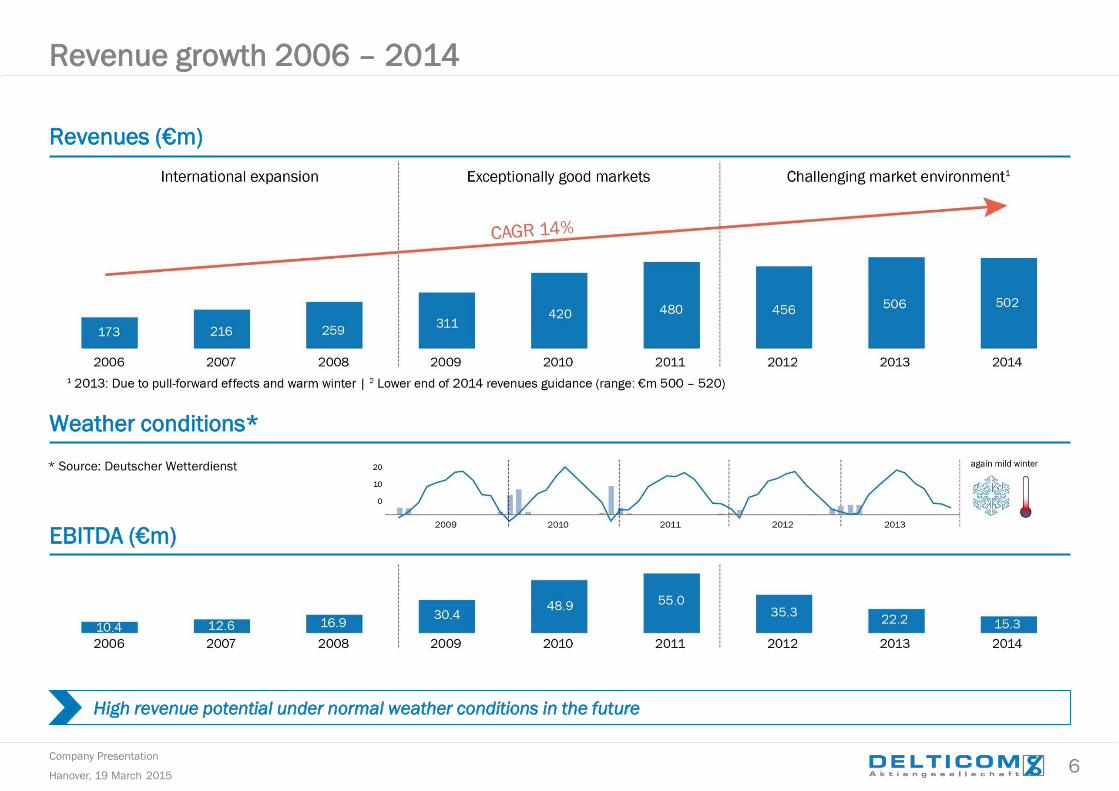
Revenue growth 2006 – 2014
Revenues (€m)
High revenue potential under normal weather conditions in the future
Weather conditions*
EBITDA (€m)
* Source: Deutscher Wetterdienst

Company Presentation
Hanover, 19 March 20157
Economies of scale
► Key player in all relevant European markets
► Margin advantages compared to smaller national players with respect to purchasing, logistics and operations
Delticom’s USPs are the basis for its market leading position
International player
► By far the largest E-Commerce tyre player in Europe► Together with Tirendo within the two top tyre online
shops in nearly every country
High cost efficiency
► Pooling of transportation► Outsourcing of support functions to low-cost countries
Logistics competence
► State-of-the-art warehousing► High delivery capacity and ability to
supply
► Loyal customer base: repeat customers bring overall acquisition costs down
► Substantial organic traffic in Delticom online shops► New Tirendo customer base has a minimal overlap
Customer base
USPs
Company Presentation
Hanover, 19 March 20158
Agenda
3-7 | Delticom group overview
8-11 | Replacement tyre business
12-17 | Strategy
18-22 | Financials FY 2014
23-24 | Outlook 2015
Company Presentation
Hanover, 19 March 20159
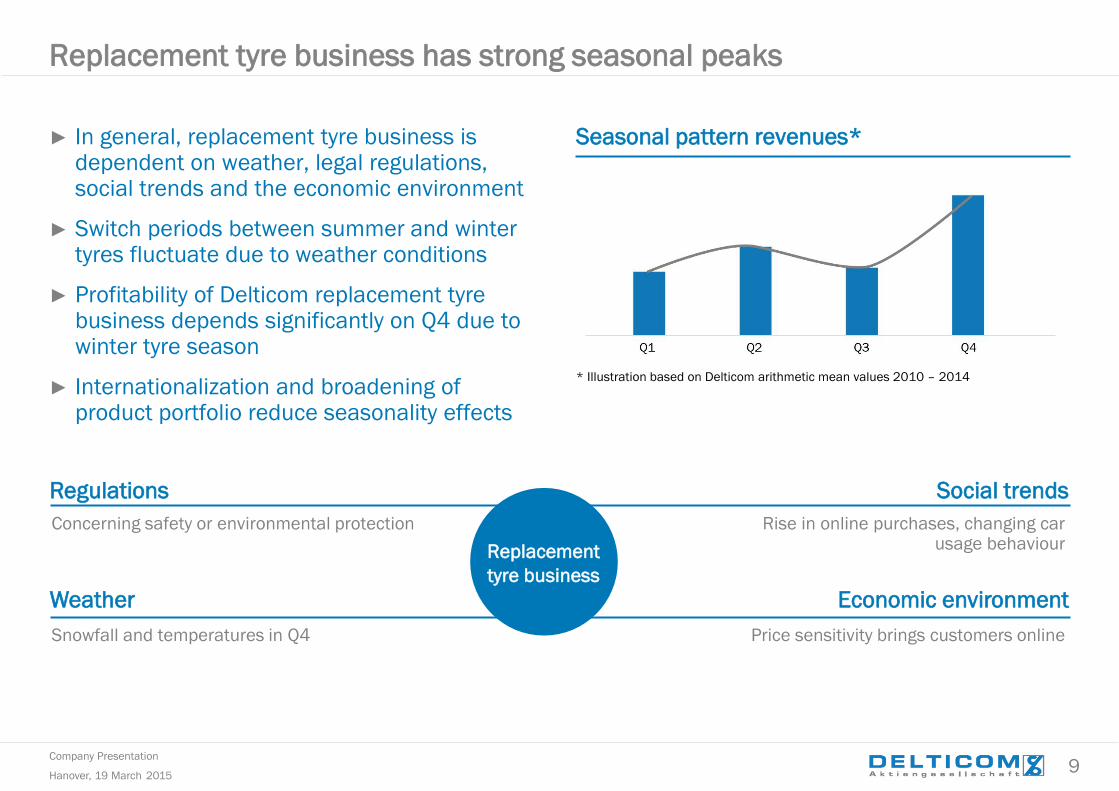
* Illustration based on Delticom arithmetic mean values 2010 – 2014
► In general, replacement tyre business is dependent on weather, legal regulations, social trends and the economic environment
► Switch periods between summer and winter tyres fluctuate due to weather conditions
► Profitability of Delticom replacement tyrebusiness depends significantly on Q4 due towinter tyre season
► Internationalization and broadening ofproduct portfolio reduce seasonality effects
Seasonal pattern revenues*
Replacement
tyre business
Social trends
Rise in online purchases, changing car usage behaviour
Regulations
Concerning safety or environmental protection
Economic environment
Price sensitivity brings customers online
Weather
Snowfall and temperatures in Q4
Replacement tyre business has strong seasonal peaks
Company Presentation
Hanover, 19 March 201510
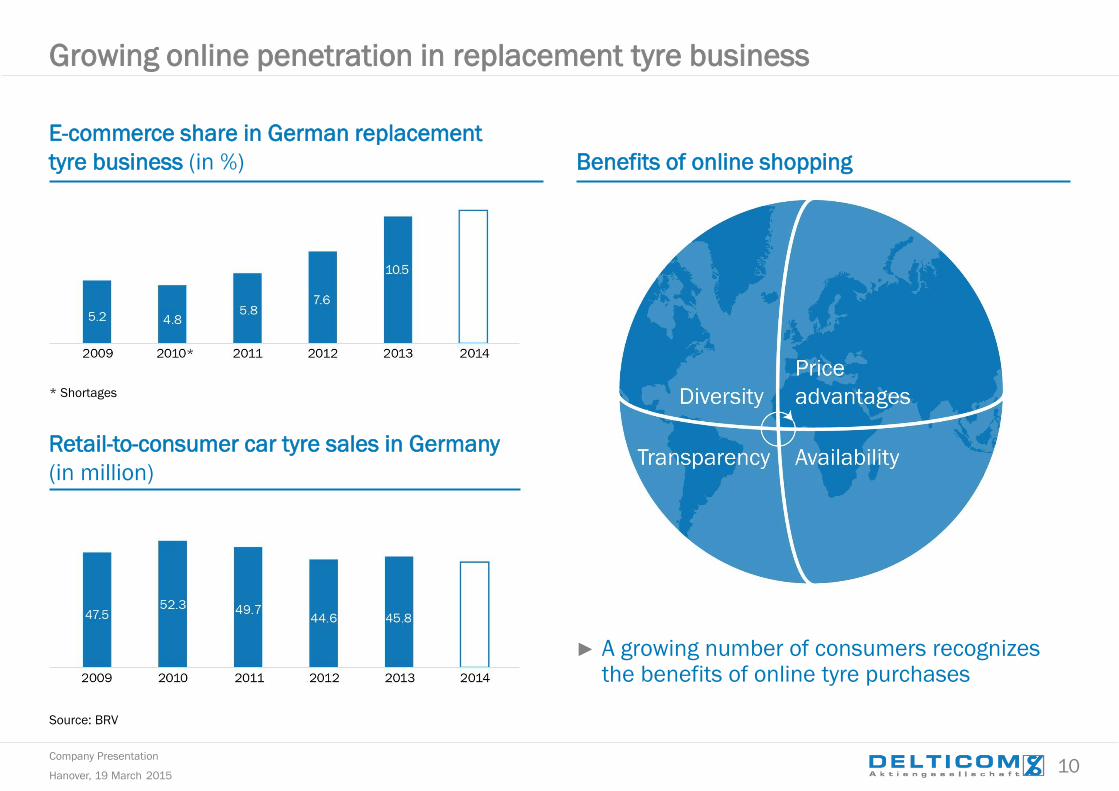
► A growing number of consumers recognizes the benefits of online tyre purchases
Growing online penetration in replacement tyre business
E-commerce share in German replacement
tyre business (in %)
Retail-to-consumer car tyre sales in Germany
(in million)
Benefits of online shopping
Source: BRV
* Shortages

Company Presentation
Hanover, 19 March 201511
* Sources: BRV, BMI, Statista, Eurostat, Euromonitor, IFH Köln, OECD, Roland Berger
► Internet usage is changing: increasing relevance as point of sale instead of just price and product comparison tool
► Combination of high basket value and low return rate for tyres
► Further offline to online shift expected
Growing online penetration in replacement tyre business
Online penetration (Germany)* (in %) Average basket value (Germany)* (in €)
Very low goods return rates (Germany)* (in %)

Company Presentation
Hanover, 19 March 201512
Agenda
3-7 | Delticom group overview
8-11 | Replacement tyre business
12-17 | Strategy
18-22 | Financials FY 2014
23-24 | Outlook 2015

Company Presentation
Hanover, 19 March 201513
Tirendo integration into Delticom – on track
Phase 1After acquisition 2013
Know-how exchange:
Existing IT infrastructure
complemented by modern
webshop technologies and new
analytical tools for online
marketing
Realizing synergy potential:
Integration of transport, storage
and finance operations
A house of strong B2C brands:
Integration of Tirendo business
under Delticom management
starting in H1/2014
Efficieny improvement process
started:
► Reducing Berlin headcount to
far below 50 (core team of
~20 employees in 2015)
► Less and more targeted TV
advertising
Reduced cost base implemented:
Reduced personnel expenses
Reduced rent and operating costs
Marketing costs with lower
cost/revenue ratio
Optimized TV advertising
spending
Using Tirendo strengths:
Tap into new customer group
Phase 2Start of full integrationH2/2014
Phase 3New organizational setupfrom 2015 onwards
Full integration of Tirendo completed
Quick wins realizedEfficiency improvement measures implemented
Way paved for break-even in 2015

Company Presentation
Hanover, 19 March 201514
► Increasing market share and drive penetration
► Focus on profitable growth and efficiency improvement
Strategic roadmap
Geographic expansion
Further developing of US business
Product portfolio expansion
Complete wheels, motorcycle tyres, specialty tyres
E-commerce tools
Conversion rate improvement with state-of-the-art tools
B2B
Broadening of B2B services
Cross-promotions
Cross-promoting between shops to keep customers in the group
Marketing
More targeted advertising
Spare parts and accessories
Tap market potential; one-stop shop for all parts
Price comparison
Using Toroleo to increase traffic on generic tyre-related domains
Logistics
Efficiency improvement measures
Purchasing
Data-driven purchasing organisation
Relaunch of online shops
Increase functionality
Mobile shops
Company Presentation
Hanover, 19 March 201515
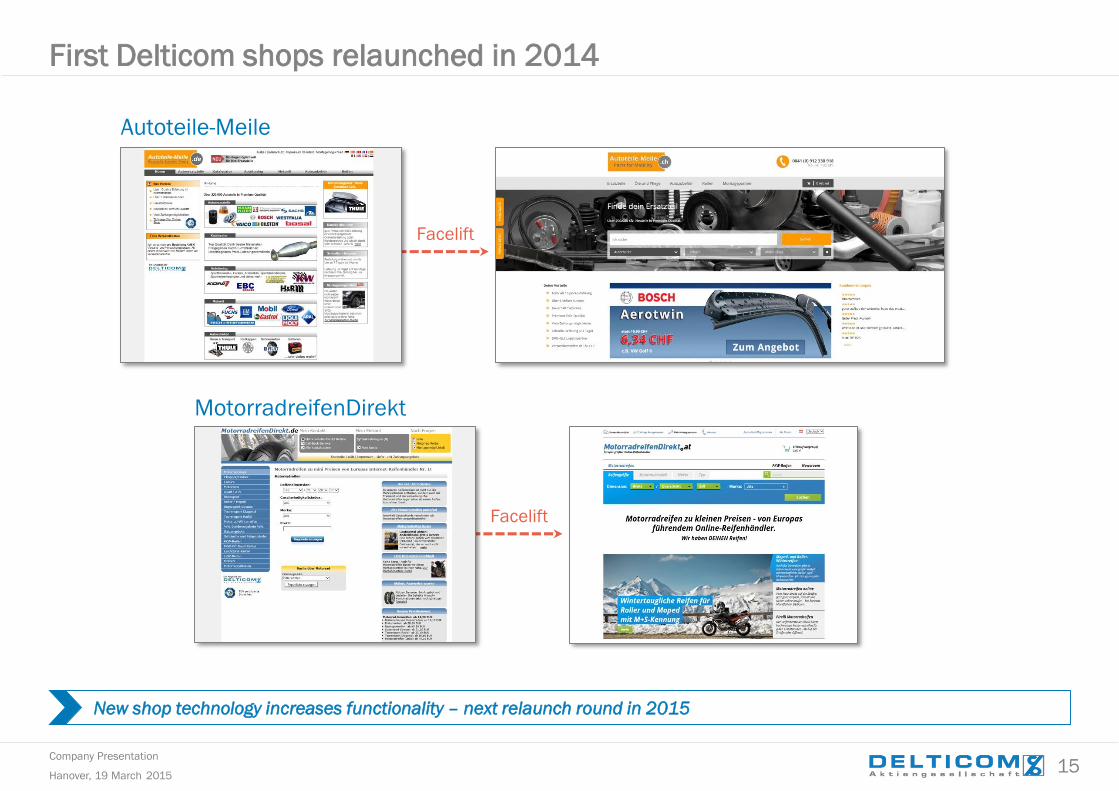
First Delticom shops relaunched in 2014
New shop technology increases functionality – next relaunch round in 2015
Facelift
Autoteile-Meile
Facelift
MotorradreifenDirekt

Company Presentation
Hanover, 19 March 201516
Complete Wheels
► Highly sophisticated own wheel assembly lines
► Professional assembly team for TPMS
► Wheel assembly of 13 up to 23 inch for passenger cars, SUVs, Vans, and Offroad cars
► Highest order flexibility and IT-based processes
► High availability of tires and rims through connected inventory > 100,000 rims
► Supplier for B2C, B2B, fleets, car dealers and industry
► Delticom wheels configurator for a quick and safe product advice – high quality pictures for a perfect impression of the selected wheel/tire combination on the customer's vehicle
► Easy ordering via the shops of Delticom

Company Presentation
Hanover, 19 March 201517
B2B services
B2B Retail
► 26 Onlineshops in 26 countries► More than 100K customers
► Car Dealer Business► Fastfitters► Garages► Fuel Stations► Franchise
Fleets
► 6 OnlineshopsDACH/FR/NL/UK
Fitting partner
► More than 40,000 fitting partners► > 9K in Germany► > 5K in France► > 4K in Italy► > 3K in Spain► > 2K in UK
► Tyre hotel
Mobile fitting
► Test in Germany (own branded)
Service
Company Presentation
Hanover, 19 March 201518
Agenda
3-7 | Delticom group overview
8-11 | Replacement tyre business
12-17 | Strategy
18-22 | Financials FY 2014
23-24 | Outlook 2015

Company Presentation
Hanover, 19 March 201519
Business FY 2014: Transition year
Macroeconomy
► Recovery in the Euro zone increasingly stumbled during the year
► Economic performance of the Euro countries remains divergent
► Consumption propensity of householdsin Germany remains high
Tirendo
► Reduced marketing spend in Q3+Q4 – higher efficiency► Reduced workforce: end of 01/15 <20 headcounts► EBITDA Q4/14 improved by € 1.3m
Tyre market
► Warm temperatures in March prompted early switch to summer tyres
► Q3: delayed start of winter season► Q4: mild winter in Europe► FY 2014: German winter tyre sales -13.3 %
(first BRV estimate)
Customer base FY
► 1,106 thousand new customers (including Tirendo)
► 774 thousand repeat customers► Customer base > 8 million
Revenues
► e-commerce revenues of 163 online shops flat yoy► Q4: volume growth > revenues growth
Toroleo acquisition in September
► tyre price comparison website Toroleo (toroleo.de, toroleo.at) will help increase traffic on up to 34 generic tyre-related domains owned by Delticom and not fully exploited yet
► Websites include e.g. reifen.de and pneus.fr
Transition
year 2014

Company Presentation
Hanover, 19 March 201520
FY2014: Key Financials Delticom Group
Unit FY 2014 FY 2013 -/+ (%, %p)
New customers k 1,016 1,037 -2.0 New methodology
Revenues €m 501.7 505.5 -0.8 76.3 % of revenues in EU countries
Gross margin *) % 24.5 24.8 -0.3p
Gross profit *) €m 122.8 125.2 -1.9
EBITDA €m 15.3 22.2 -31.1
EBITDA margin % 3.0 4.4 -1.4p
PPA effect of €m 5.2EBIT €m 7.0 17.8 -60.6
EBIT margin % 1.4 3.5 -2.1
Net income €m 2.9 11.6 -75.3
Earnings per share (undiluted) € 0.24 0.97 -75.3
Liquidity position €m 30.0 11.3 164.7 Swing back after Tirendo acquisition
Operating cash flow €m 36.7 8.1
Free cash flow €m 35.0 -35.2
Unit 31.12.14 31.12.13 -/+ (%, %p)
Inventories €m 56.2 72.8 -22.9 According to plan
Equity €m 50.3 51.7 -2.7
Equity ratio % 30.7 29.2 +1.5p
*) excl. other operating income
Company Presentation
Hanover, 19 March 201521
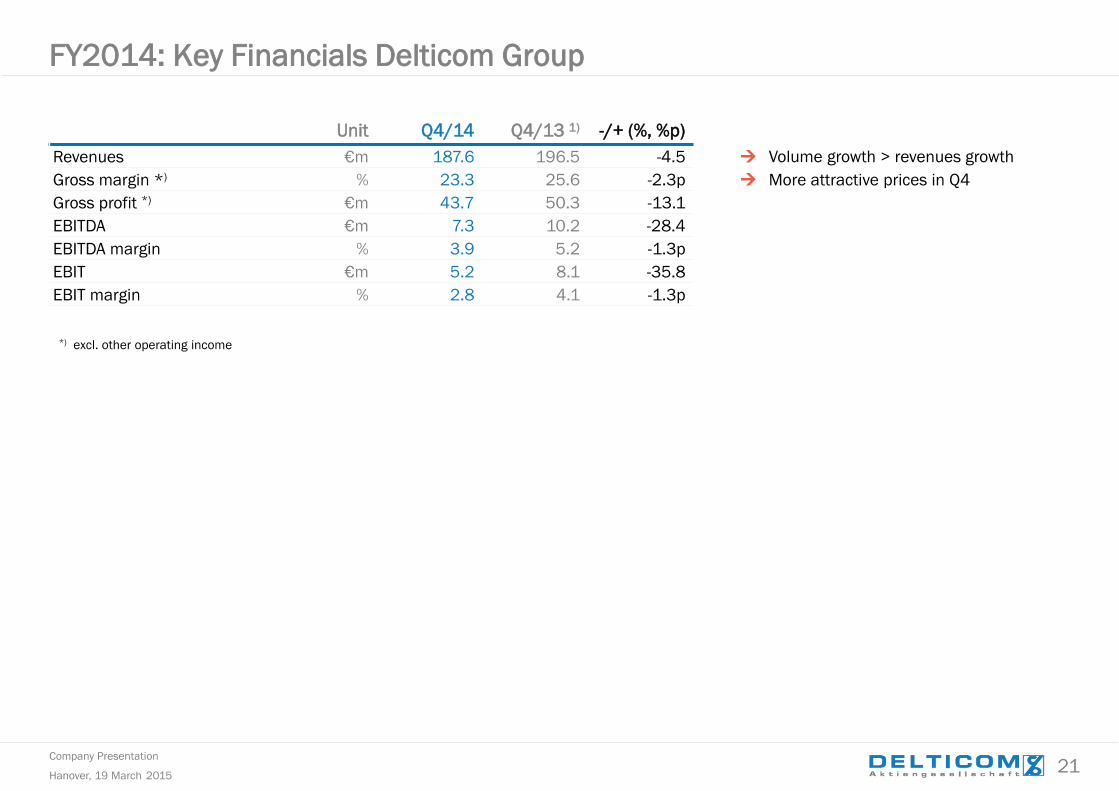
FY2014: Key Financials Delticom Group
Unit Q4/14 Q4/13 1) -/+ (%, %p)
Revenues €m 187.6 196.5 -4.5 Volume growth > revenues growth
Gross margin *) % 23.3 25.6 -2.3p More attractive prices in Q4
Gross profit *) €m 43.7 50.3 -13.1
EBITDA €m 7.3 10.2 -28.4
EBITDA margin % 3.9 5.2 -1.3p
EBIT €m 5.2 8.1 -35.8
EBIT margin % 2.8 4.1 -1.3p
*) excl. other operating income

Company Presentation
Hanover, 19 March 201522
in €m 31.12.14 % '-/+ (%) 31.12.13 %
Assets
Non-current assets 58.1 35.4 -12.8 66.7 30.2
Current assets 105.9 64.6 -4.0 110.3 69.8
Inventories 56.2 34.2 -22.9 72.8 51.8
Receivables 19.8 12.0 -24.4 26.2 14.1
Liquidity 30.0 18.3 +164.7 11.3 3.9
Assets 164.0 100.0 -7.4 177.0 100.0
Equity and Liabilities
Long-term funds 66.9 41.0 +3.6 64.6 23.2
Equity 50.3 31.0 -2.7 51.7 19.9
Long-term debt 16.7 10.2 +28.5 13.0 3.3
Provisions 0.4 0.2 +39.2 0.3 0.1
Liabilities 16.3 9.9 +25.4 13.0 3.2
Short-term debt 97.1 59.2 -13.6 112.4 76.8
Provisions 2.4 1.4 +26.4 2.0 0.8
Liabilities 94.7 57.7 -46.5 110.4 76.0
thereof accounts payable 75.9 46.3 +1.6 74.7 42.2
Equity and Liabilities 164.0 100.0 -7.4 177.0 100.0
FY2014: Abridged balance sheet

Company Presentation
Hanover, 19 March 201523
Agenda
3-6 | Delticom group overview
7-11 | Replacement tyre business
12-17 | Strategy
18-22 | Financials FY 2014
23-24 | Outlook 2015

Company Presentation
Hanover, 19 March 201524
Market
At present significant uncertaintities regarding
market and price trends in European
replacement tyres business (low visibility)
Excess inventory for winter goods in the supply
chain possible
US import duties for tyres made in China –
import to Europe?
BVR not expecting a far-reaching business
improvement for 2015
Outlook 2015
Investor Relations
Melanie GerekeDelticom AGBrühlstr. 1130169 Hanover, Germany
eMail: [email protected]: +49-511-93634-8903
Delticom
Turnover + EBITDA (abs.) at least flat yoy
Increase in volume vs. 2014
2015: Tirendo break-even
Over 1m new customers in 2015
Expand market leadership

Company Presentation
Hanover, 19 March 201525
Q&A

Company Presentation
Hanover, 19 March 201526
in €m FY 2014 FY 2013 -/+ (%, %p)
Revenues 501.7 505.5 -0.8
Other operating income 12.1 5.4 +123.4
Total operating income 513.8 511.0 +0.6
Cost of goods sold -379.0 -380.3 -0.4
Gross profit 134.9 130.6 +3.3
Personnel expenses -15.6 -11.3 +38.1
Other operating expenses -104.0 -97.2 +7.1
EBITDA 15.3 22.2 -31.1
Depreciation -8.3 -4.3 +90.2
EBIT 7.0 17.8 -60.6
Financial expense -0.8 -0.2 +350.0
Financial income 0.03 0.05 -30.6
Net financial result -0.8 -0.1 +492.6
EBT 6.3 17.7 -64.6
Income taxes -3.4 -6.2 -44.6
Consolidated net Income 2.9 11.6 -75.3
FY2014: P+L statement

Company Presentation
Hanover, 19 March 201527
in €m FY 2014 FY 2013
Earnings before interest and taxes (EBIT) 7.0 17.8
Cash flow from operating activities 36.7 8.1
Cash flow from investing activities -1.6 -43.3
Cash flow from financing activities -16.9 +0.5
Changes in cash and cash equivalents 18.4 -34.9
Cash and cash equivalents at the start of the period 11.3 46.2
Changes in the scope of consolidation 0.2 0
Cash and cash equivalents - end of period 30.0 11.3
FY2014: Abridged cash flow statement

Company Presentation
Hanover, 19 March 201528
in €m 31.12.14 % '-/+ (%) 31.12.13 %
Assets
Non-current assets 58.1 35.4 -12.8 66.7 37.7
Intangible assets 47.9 29.2 -9.2 52.8 29.8
Property, plant and equipment 9.0 5.5 -16.1 10.7 6.0
Financial assets 0.0 0.0 -97.0 0.8 0.5
Deferres taxes 0.7 0.4 -62.2 1.9 1.1
Other receivables 0.5 0.3 -3.2 0.5 0.3
Current assets 105.9 64.6 -4.0 110.3 62.3
Inventories 56.2 34.2 -22.9 72.8 41.1
Accounts receivable 14.5 8.8 -28.7 11.3 6.4
Other current assets 4.7 2.9 -62.6 12.6 7.1
Income tax receivables 0.5 0.3 -76.2 2.3 1.3
Cash and cash equivalents 30.0 18.3 +164.7 11.3 6.4
Assets 164.0 100.0 -7.4 177.0 100.0
FY2014: Balance sheet – Assets
Company Presentation
Hanover, 19 March 201529
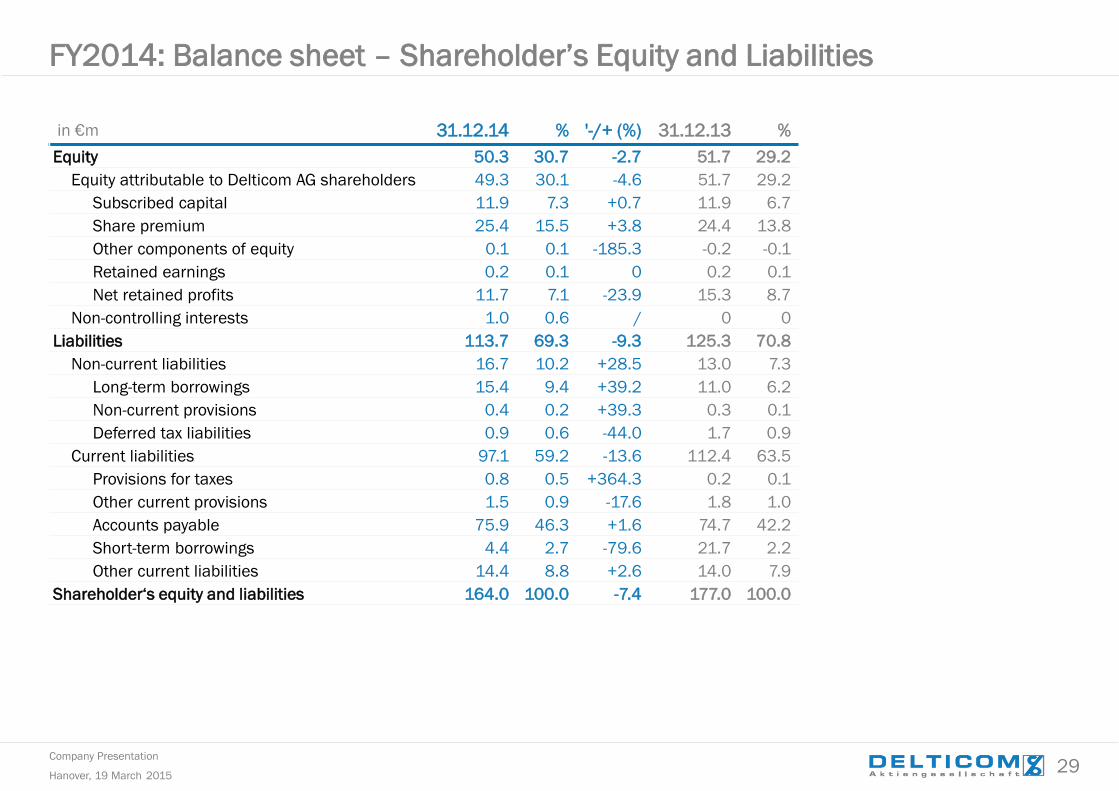
in €m 31.12.14 % '-/+ (%) 31.12.13 %
Equity 50.3 30.7 -2.7 51.7 29.2
Equity attributable to Delticom AG shareholders 49.3 30.1 -4.6 51.7 29.2
Subscribed capital 11.9 7.3 +0.7 11.9 6.7
Share premium 25.4 15.5 +3.8 24.4 13.8
Other components of equity 0.1 0.1 -185.3 -0.2 -0.1
Retained earnings 0.2 0.1 0 0.2 0.1
Net retained profits 11.7 7.1 -23.9 15.3 8.7
Non-controlling interests 1.0 0.6 / 0 0
Liabilities 113.7 69.3 -9.3 125.3 70.8
Non-current liabilities 16.7 10.2 +28.5 13.0 7.3
Long-term borrowings 15.4 9.4 +39.2 11.0 6.2
Non-current provisions 0.4 0.2 +39.3 0.3 0.1
Deferred tax liabilities 0.9 0.6 -44.0 1.7 0.9
Current liabilities 97.1 59.2 -13.6 112.4 63.5
Provisions for taxes 0.8 0.5 +364.3 0.2 0.1
Other current provisions 1.5 0.9 -17.6 1.8 1.0
Accounts payable 75.9 46.3 +1.6 74.7 42.2
Short-term borrowings 4.4 2.7 -79.6 21.7 2.2
Other current liabilities 14.4 8.8 +2.6 14.0 7.9
Shareholder‘s equity and liabilities 164.0 100.0 -7.4 177.0 100.0
FY2014: Balance sheet – Shareholder’s Equity and Liabilities