Embed Size (px)
Citation preview

1
Grant agreement no:
608571
Project acronym:
SUCCESS
Project full title:
Industrial steam generation with 100% carbon capture and insignificant efficiency penalty - scale-up of
oxygen carrier for chemical-looping combustion using Environmentally sustainable materials
Collaborative project
Theme:
FP7 – ENERGY.2013.5.1.1
Deliverable D6.3
Report on parameter studies within the
advanced CLC simulation environment
Due delivery date: 30/9/2015
Actual delivery date: 30/3/2017
Lead beneficiary:
Partner no. 3 - CSIC
Dissemination level:
Public (PU)

2
DELIVERABLE 6.3
Report on parameter studies within the advanced CLC simulation environment
SUCCESS - Industrial steam generation with 100% carbon capture and insignificant efficiency penalty - scale-up of oxygen carrier for chemical-looping combustion using Environmentally sustainable materials
Keywords: CLC 1.5D model, interconnected CFB reactors, model validation, sensitivity analysis, process simulation.
Work package: 6 – Detailed reactivity investigation, modelling and design optimization
Involved partners: CSIC CSIC- J. Adánez, A. Abad, P. Gayán
Dissemination level: Public (PU)
Objective
To develop a confident model for the CLC unit including both the fuel and air reactors.
Abstract or description
A theoretical model developed inside 6thFP CLC GAS POWER and 7thFP INNOCUOUS projects was adapted to the special characteristics and geometry of the existing 120 kWth CLC unit at TUV. The model was validated against experimental results obtained in this unit burning natural gas with the
Cu14Al-SCCa oxygen carrier developed in this project. Then, the model is used to simulate the methane conversion in the CLC unit with the purpose of obtaining optimized operating conditions to achieve complete combustion of natural gas.

3
Executive summary
A mathematical model for a Dual Circulating Fluidized Bed (DCFB) system was used to
simulate the behaviour of Cu14Al-SCCa oxygen carrier developed in this project in the 120
kWth CLC unit at Vienna University of Technology. The model consists on the coupling of
individual fuel and air reactor models to simulate steady state of the CLC unit. Individual
models consider both the fluid dynamic of the fluidized beds and the corresponding kinetics of
oxygen carrier reactions, i.e. reduction in the fuel reactor and oxidation in the air reactor.
Reaction kinetics was previously determined from TGA experiments. The model was validated
using results obtained in the CLC unit at TUV, in which operating conditions such as solids
circulation flow rate, temperature and pressure drop in the reactors were varied. In most of
cases, complete methane combustion was not achieved. The analysis of the results provided by
the model highlighted that the main reason for the uncomplete fuel conversion was a deficit in
the oxygen uptake by the oxygen carrier in the air reactor.
The theoretical model, after its validation, was used to identify the main factors affecting the
methane conversion. The methane conversion in the fuel reactor was mainly performed in the
dilute region. Thus, poor conversion of methane is achieved in the bottom bed because a high
fraction of gas is bypassed through the bubbles. As a consequence, it is not deserved to
increase the solids inventory in the fuel reactor to improve the methane conversion because the
additional solids will be mainly accumulated in the low-efficient dense bed.
On the contrary, it was identified that methane conversion can be highly improved by
increasing the solids circulation flow rate and the solids inventory in the air reactor. In this
way, it was possible to improve the fuel conversion by increasing the oxygen transferred both
in air and fuel reactors. Optimized conditions to achieve complete fuel combustion include an
oxygen carrier to fuel ratio = 4 and solids inventories in fuel and air reactors of 130 and 120
kg/MWth, respectively.

4
Table of contents
1. Introduction .............................................................................................................................. 5
2. Mathematical model................................................................................................................. 6
2.1. Fluid dynamics .................................................................................................................. 7
2.1.1. Fluid dynamic in the dense bed ................................................................................. 9
2.1.2. Fluid dynamic in the dilute region ........................................................................... 11
2.2. Mass balances ................................................................................................................. 12
2.3. Inputs and outputs to/from the model ............................................................................. 19
2.4. Structure and solving procedure of the mathematical model .......................................... 19
3. Experimental results for validation purposes ......................................................................... 23
4. Results .................................................................................................................................... 25
4.1. Fluid dynamics and CH4 conversion in fuel reactor ....................................................... 25
4.2. Fluid dynamics and O2 evolution in air reactor .............................................................. 27
4.3. Validation of the CLC model .......................................................................................... 30
4.4. Assessment on observed deviation between experimental and prediction results .......... 32
4.4. Sensitivity analysis to relevant operating conditions ...................................................... 34
4.5. Lessons learned from predictions on the performance of the CLC unit at TUV ............ 37
5. Conclusions ............................................................................................................................ 38
6. Nomenclature ......................................................................................................................... 40
7. References .............................................................................................................................. 46

5
1. Introduction
The method of impregnation is adequate for production of large amounts of solid particles at
low cost. The research group at Instituto de Carboquímica (ICB-CSIC) has optimized the
impregnation method to develop one highly reactive Cu-based oxygen carrier (de Diego et al.,
2005). Following the preparation method developed by ICB-CSIC, material Cu14Al-SCCa
has been produced by JM inside the SUCCESS project with materials available for industrial
scale production. This material has been tested in the 120 kW CLC unit at Vienna University
of Technology (TUV). This unit consists of two interconnected circulating fluidized bed
reactors. CH4 combustion was improved by increasing the solids circulation rate and the solids
inventory in the fuel reactor, but complete combustion was only achieved by increasing the
fuel reactor temperature. From experimental results, the ultimate reason for the low methane
conversion is unclear yet, and modelling the CLC unit can shed light on this issue.
Modelling and simulation of the CLC system is an important tool for analysing the effect of
various operational conditions. Thus, the main issues affecting the process can be identified. In
this work, a mathematical model for the Dual Circulating Fluidised Bed (DCFB) system built
at Vienna University of Technology (TUV) was used to evaluate the performance of this unit
when the Cu-based material was used as oxygen carrier. The model includes both fluid
dynamic and chemical reactions happening in the reactor. Thus, the reaction kinetics of the
oxygen carrier was implemented in the model, as well as the specific physical properties of
particles were considered. The mathematical model was validated against experimental results
obtained in the CLC unit. Later, this model was used to determine the more relevant
parameters influencing the performance of the CLC process. This information was then used to
identify the operating conditions which allowed the complete combustion of the fuel.

6
2. Mathematical model
The mathematical model considers the coupling of both the fuel and air reactors. Thus, each
reactor was modelled considering their specific fluid dynamics characteristics, as well as
kinetics of the involved gas-solid reactions. Then, the steady state of the CLC unit was
modelled by considering the connexion given by the solids circulating between both reactors.
The model developed was focused on the CLC unit built at TUV. Dimensions and operational
conditions for the Dual Circulating Fluidised Bed Concept (DCFB) unit at TUV are considered
for both the fuel and air reactor. Figure 1 shows a diagram of this unit. The CLC system
combines two circulating fluidised bed reactors with direct hydraulic communication via a loop
seal. Table 1 shows the main dimensions of the reactors.
Figure 1. Schematic diagram of the DCFB unit.
Table 1. Geometrical parameters of the fuel and air reactors in the DCFB unit.

7
Fuel reactor Air reactor
Bottom Riser
Height, Hr (m)
0.75 3.05 4.03
Diameter, Dr (m) 0.180 0.102 0.130
Height for inlet from loop seals (1)
(m) 0.35 0.0
Height for inlet from loop seals (2)
(m) 2.0 -
(1) Fuel reactor: steam from internal loop seal; Air reactor: steam from lower loop seal.
(2) Fuel reactor: steam and solids from upper loop seal
2.1. Fluid dynamics
Both air and fuel reactors were circulating fluidised beds. However, relevant differences are
found between them, which are highlighted in the Figure 2.
1.E-03
1.E-02
1.E-01
1.E+00
1.E+01
0.1 1 10 100
u*
dp*
10-3
10-2
10
1
10-1
1 10 102
dp*
u*
umf
ut
Bubbling
Spouted
Turbulent
Pneumatictransport Fast
fluidization
bottom
upFuel Reactor
Air Reactor
Figure 2. Fluidization regime for fuel reactor and air reactor in the flow regime map (adapted
from Kunii and Levenspiel, 1997). u* = Re/Ar
1/3; dp
* = Ar
1/3.

8
The fuel reactor has a bottom part with a wider section and the gas velocity is low. As a
consequence, the bottom part of the fuel reactor is in the bubbling regime. On the contrary, the
narrow section of the section makes that the regime was modified to turbulent fluidization.
Regarding the air reactor, it is characterized by a higher gas velocity, which makes that the
fluidization regime was fast fluidization or even pneumatic transport in most of cases.
In this work, the fluid dynamic model presented by Pallarès and Johnsson et al. (2006) has
been adapted to the characteristics of the CLC unit at TUV. Thus, the model can be considered
1.5 dimensional, with the main dimension in the axial direction. It considers the gas and solids
flows inside the reactor and the gas-solids mixing patterns in the different regions in which it
could be divided. The reactor was divided into two vertical regions with respect to axial
concentration and backmixing of solids, see Figure 3: 1) a dense region in the bottom bed with
a high and roughly constant concentration of solids; and 2) a freeboard above the dense region,
the dilute region, where there is a pronounced decrease in the concentration of solids as height
increases.
umfuvis+utf
Fc
FwFw
Emulsion phase
Bubble phase
Cluster phase
Core in transport phase
Annulus in transport phase
Bottom bed
Dilute region
Figure 3. Gas and solids distribution in the high-velocity fluidised bed reactors.

9
2.1.1. Fluid dynamic in the dense bed
Gas distribution between the emulsion and bubble in the dense bed is considered. Solids are in
the emulsion phase, where gas flow maintains the minimum fluidizing conditions, umf; whereas
the rest of gas goes through visible bubbles, uvis, and throughflow, utf, where there are not
solids. Thus, in terms of superficial gas velocities the total gas flow, ug, is divided following
the equation:
1g b mf vis tfu u u u (1)
Thus, the gas flow through the emulsion depends on the fraction of volume occupied by
emulsion, i.e. (1-b), and umf. The minimum fluidization velocity, umf, is calculated using the
following correlation (Grace, 1986):
2
p,mfRe = = 27.2 0.0408Ar 27.2mf g p
g
u d
(2)
The bubble fraction, b, depends on the expansion of the bed compared to minimum
fluidization conditions, i.e. the porosity of emulsion, mf, and the actual porosity of the bed, :
-
1-
mf
b
mf
(3)
The porosity at minimum fluidization conditions is calculated with the following equation
(Broadhurst and Becker, 1975):
0.021
0.72 0.0290.586 Ar
g
mf sh
p
(4)
whereas the bed porosity depends on the gas velocity of rising bubbles, uvis.
10.71
vismf mf
vis b
u
u gd (5)

10
db being the bubble size, which is calculated with the equation proposed by Darton et al.
(1977).
0.80.4
0.2
00.54 4b g mfd u u z A g (6)
The solids concentration can be calculated as:
1 db pC (7)
The bed porosity increases with the gas velocity up to the saturation value is reached, sat:
6
sat
495.5 4.9·10ε 0.5452
pP d
(8)
A higher value in the bed porosity than sat is not allowed, and the excess of gas goes directly
to the throughflow, uth. So, the excess of gas in bubbles is shared between gas in visible
bubbles and throughflow defined by the ratio of the visible bubble flow to the total flow
through the bubbles,, calculated as
33000.4
01/3
0.26 0.704
0.15
pd
g mf
ez A
u u
(9)
Thus, the visible bubble flow is calculated as follows:
1vis g mf bu u u (10)
excepting for the saturation conditions, i.e. when sat < (by Eq. 5), where uvis is calculated by
b,sat
,
b,sat
δ0.71
1 δ
vis vis sat pu u gd (11)
Once umf, b and uvis are known, utf is calculated with Eq. (1).

11
2.1.2. Fluid dynamic in the dilute region
The dilute region is composed by the cluster phase and a transport or dispersed phase. Both the
cluster and transport phases can be superimposed but with different mixing behaviour. The
cluster phase has a strong solids backmixing with solids in the dense bed, and the solids
concentration in this phase is given by the decay factor a:
d
d
cl tcl
g
C ua C
z u (12)
The transport phase is characterized by a core/annulus flow structure. A net flow up of solids
goes through the core and particles backmixing occurs at annulus near the reactor walls. Solids
at the annulus go until the dense bed. So, a lateral exchange of solids in the dilute region
between the core and an annulus, close to the reactor wall, was included. The gas flows up
through the core, which diameter just above the dense bed is calculated with the following
equation:
0.87C rD D (13)
The diameter of the core section is maintained constant up to the saturation height, zsat:
6sat r rz H D (14)
Then, the diameter of the core increases from the saturation height up to reach the exit zone of
solids to cyclone.
0.0217C r rD D H z (15)
The solids concentration in the core section decreases with the reactor height, and it is
calculated with the following equations:
d
d
trtr
g t
C KC
z u u (16)

12
A direct relation between solids flow and solids concentration in the transport phase is given by
the following equation, which considers the variation of both the gas velocity and core section
with height:
tr tr C g tF C A u u (17)
Once the solids flow in the core section is known, the net lateral flow of solids from the core to
annulus next the reactor wall can be calculated:
d d
d d
w trF F
z z (18)
The boundary condition for differential Eqs. (12) and (16) are given by Eqs. (19) and (20),
respectively, which consider the continuity balance of solids between the dense bed and the
dilute region, and the flow of solids entrained from the dense bed to the transport phase (de
Diego et al., 1995).
, , ,b b bcl H db H tr HC C C (19)
0.31
,
Re131.1
Ar
b
b
C g t
tr H g
H
A u uF
(20)
2.2. Mass balances
Mass balances for the different reacting compounds and products were developed considering
the pathway for methane conversion in the fuel reactor with the oxygen carrier as described by
Eq. (21). Correspondingly, the oxidation of the oxygen carrier in the air reactor follows Eq.
(22).
4 CuO + CH4 → 4 Cu + CO2 + 2 H2O (21)
2 Cu + O2 → 2 CuO (22)

13
Mass balances are considered in the model for every compound in each phase described in the
fluid dynamic model. Thus, mass balances are given by the following differential equations for
each gas, i.e. CH4, CO2 and H2O in the fuel reactor, or O2 in the air reactor:
Emulsion:
,,
, , , ,,
11
b mf e ie i excb g i b be e i b i e ie k
k
d u CdF dFr k C C y
dV dz dV
(23)
Bubble:
,,
, , ,
vis tf b ib i excb be e i b i e i
d u u CdF dFk C C y
dV dz dV
(24)
Dilute region:
,,
, ,
, ,
g dil idil i
g s g i g i
k kcl k tr k
d u CdFr r
dV dz
(25)
Mass balances include the main processes by which a compound can appear or disappear in a
phase. The following processes are considered:
a) Chemical reactions: , ,g i j kr is the average reaction rate of the gas i by reaction k with the
gas concentration in the phase j. Heterogeneous reactions happen only in the emulsion phase
and dilute region, i.e. where solids are present.
b) Diffusional gas exchange between bubbles (uvis and utf) and emulsion (umf) in the dense
phase, which is determined by the bubble-emulsion gas exchange coefficient, kbe. The kbe
coefficient is obtained using the correlation given by Foka et al. (1996):
0.37
g1.631 Scbek u (26)
c) Bulk gas exchange between emulsion and bubbles to maintain the gas flow in the emulsion

14
phase at minimum fluidization conditions, umf. Note that the gas suffers from a volumetric
expansion during methane conversion in the fuel reactor. So, the excess of the gas in the
emulsion, Fexc, must move to the bubble phase to maintain the minimum fluidization
condition in the emulsion. The opposite happens in the air reactor, where a volumetric
reduction during oxygen carrier oxidation occurs. In this case, some gas in the bubble
moves to the emulsion by bulk diffusion, and yb,i must be used instead ye,i in Eqs. (23) and
(24).
d) The steam flow coming from the lower loop seal (LLS), internal loop seal (ILS) and upper
loop seal (ULS) of the DCFB unit are added to the existing gas stream.
,, , xLS xLS
g xLSg H g HF F F (27)
The reaction rate of the oxygen carrier in every axial position and phase inside the reactor is
obtained considering the residence time distribution of the solids:
,, ,
, , 0
,
1 ( )
r i
intOC i OC OCj k OC OC
g i zj kk k O
i j
r d X XRr E t dt
b b M dt
(28)
, ,g i j kr and ,OC i j
r being the average reaction rate of the reacting gas and the oxygen
carrier, respectively, with the gas i in the phase j. Both reaction rates are related by the
stoichiometric coefficient bk shown in reactions (21) and (22). The average reaction rate to be
used in the differential mass balance is calculated with the following assumptions:
1. Perfect mixing of the solids between the dense bed and the cluster phase is assumed. The
residence time distribution curve of the solids is given by the following equation:
/1( ) mrt t
mr
E t et
(29)

15
tmr being is the mean residence time of particles in the reactor.
2. The reaction rate for gas i in every axial position in the phase j is calculated for the kinetic
of the oxygen carrier. It is assumed that one oxygen carrier particle entering to the reactor
initially reacts with a reaction rate equal to that existing when the oxygen carrier conversion
is zero (García-Labiano et al., 2004; Abad et al., 2007). Thus, the reaction rate is considered
for a modified conversion of oxygen carrier '
,OC OC OC inX X X .
3. Solids enter with a conversion value, in
OCX , higher than zero, i.e. solids can be partially
oxidised in the air reactor or partially reduced in the fuel reactor. Note that the solids
conversion at the outlet of one reactor is the same that the solids conversion at the inlet of
the other reactor. The upper limit of the integral in Eq. (28), tr,i, is defined as the reacting
time of an oxygen carrier particle from zero conversion until the maximum variation in solid
conversion, i.e. for ' 1 in
OC OCX X .
4. The reaction rate of a particle with a conversion XOC is calculated by using the gas
concentration inside the particle, which is assumed to be constant over the entire particle,
and equal to the gas concentration at the particle surface, Cp = Cps (García-Labiano et al.,
2005). The gas concentration in the particle surface, Cps, can be obtained by a mass balance
to the whole particle taking into account the external diffusion through the gas film around
the particle:
,' 3 2OC, , , ,
d ( )ρ 4 4
2 3 d
OC OC inOCg i p g i p g i ps ip
i Oi
X t XRr r k r C C
d M t (30)
The mass transfer coefficient for each gas, kg,i, is obtained with equations proposed by
Palchonok (1998) and Chakraborty and Howard (1981) for the dense bed and the dilute
region, respectively.

16
Dense bed: , 0.39 1/3
mf
,
Sh 2ε 0.117Ar Scg i p
g i
k d
D (31)
Dilute region: , 1/2 1/3
z
,
Sh 2ε 0.69Re Sc g i p
g i
k d
D (32)
Particles in both the fuel and air reactor are assumed to have a distribution of solids conversion.
The solids conversion distribution must accomplish that the average conversion of the
distribution must be equal to the average conversion of solids given by the mass balance. Thus,
the distribution of solids conversion is calculated with the following equation
0
1 1 ( ) ( ) mout
OC OCX X t E t dt
(33)
The mean reacting time, m, can be determined by an iterative process to obtain the
corresponding mean conversion at the reactor outlet, out
OCX . The mean conversion is obtained
from the following oxygen balance to the fuel reactor:
4
4 s OCOC CH comb
inFRO
F RX F
M (34)
The combustion efficiency, comb, was defined as the ratio of oxygen transferred to the fuel in
the fuel reactor to stoichiometric oxygen demanded by fuel.
4
4
1CH
outFRcomb
CHinFR
F
F (35)
Obviously, there is a different solids conversion distribution in the fuel and air reactors
andXOC reflects the variation of the mean conversion of solids in each reactor:
out in
OC OC OCX X X (36)
Note that particles exiting the fuel reactor are the same that entering into the air reactor, and
viceversa.

17
Different behaviour for the solids is assumed for the cluster and the transport phases, which
affects to the reactivity of the particles in every phase. Solids into the cluster phase are in
perfect mixing with the dense bed. These particles have the same average solids conversion in
all positions inside the reactor. On the contrary, solids in the transport phase have a net flow up
through the core. Thus, the solids conversion increases as the solids flow up through the core.
The solid conversion, as a function of the axial location in the transport phase is calculated
using the following equation
,
1OC OC OC
s c
dX dX dXdt
dz dt dz dt u (37)
us,c being the upward velocity of solids in the core.
Finally, special attention was paid on the inlet stream of solids to the fuel reactor coming from
the air reactor through the upper loop seal. This stream of solids is added to the transport phase
and modifies the solids distribution in the dilute region of the fuel reactor, thus modifying the
fuel conversion in this zone. Thus, the solids concentration is increased, which modifies the
fluid dynamic behaviour of the reactor.
, ,ULS ULSstr H tr H
F F F (38)
Fs being the solids circulation rate between both reactors.
In addition, this stream of solids from the upper loop seal has a different conversion
distribution than solids in the fuel reactor because these particles are just oxidised in the air
reactor. To consider the differences on solids conversion between solids in transport phase
from the dense bed or the upper loop seal, it was assumed the existence of two different
streams of solids in the dilute region above the feeding point. On the one hand, solids entrained
from the dense bed. The reaction rate of entrained solids are given by the distribution of
conversion in the dense bed and later the solids conversion increases upward, as shown in

18
Eq. (37). By the other hand, solids coming from the upper loop seal have a distribution of
conversion at the inlet which depends on the residence time distribution in the air reactor. This
distribution of the solids conversion is obtained by applying Eq. (33) to the air reactor. Later,
the solids conversion increases similarly than that for entrained solids, i.e. by using Eq. (37)
but with a different starting point. Thus, above the inlet point from the upper loop seal, the
variation in the solids conversion is performed separately, but in parallel, for the stream
coming from the dense bed and the stream entering from the upper loop seal.
Reduction and oxidation kinetics were included in the model; see Eqs. (28), (30) and (37). The
kinetics of Cu14Al-SCCa material was described in Deliverable D6.1. In short, the shrinking
core model (SCM) for grains with plate-like geometry was selected for kinetic determination.
The reaction rate was supposed to proceed by control of the chemical reaction and diffusion in
the product layer, described by the following equation:
2 ch i pl it X X (39)
τch and τpl being the times for complete reduction conversion of the particle for the chemical
and the diffusion through the product layer reactions, calculated as follows:
,
1 ch n
s ps ik C with /
,0
ch gE R T
s sk k e (40)
'
,
1
2 pl n
pl ps iD C with
/
,0e
pl g XE R T k X
pl plD D (41)
The calculated kinetic parameters for each reaction are shown in Table 2.
Table 2. Kinetic parameters for reaction of Cu14-Al-SCCa particles with CH4 and O2.
units CH4 O2
n Order of the reaction - 0.3 0.8
ks,0 Pre-exponential factor of ks m3n
mol-n
s-1
1.29·103 1.24·10
-1
Ech Activation energy for ks kJ/mol 90.8 20.4
n’ Order of diffussion - 1.0 -
Dpl,0 Pre-exponential factor of Dpl m3m
mol-n
s-1
2.09·1036
-
Epl Activation energy for Dpl kJ/mol 569.7 -
kx,0 Pre-exponential factor of kX - 30 -

19
2.3. Inputs and outputs to/from the model
Main operating conditions in the CLC unit are considered as inputs to the model, namely
temperature and pressure drops in the reactors, flow of gases (fuel, air and steam), and solids
circulation rate. Also, the geometrical characteristics shown in Figure 1 and Table 1, as well as
oxygen carrier properties such as mean particle size (dp = 0.152 mm) and density (p = 1530
kg/m3) are included in the input data to the model.
The main outputs of the model were (1) the fluid dynamics structure of the reactor, e.g. height
of the dense region and profiles of concentration and flow of solids in the dilute region; (2) the
axial profiles of gas composition and flows (CH4, CO2 and H2O in the fuel reactor, or O2, N2
and H2O in the air reactor); (3) the axial profiles of average conversions for the oxygen carrier;
and (4) the gas composition and solids conversion at the reactor exit.
From these outputs, the performance of the CLC system was assessed by calculating the CH4
conversion in the fuel reactor and the conversion of solids at the exit of each reactor. Methane
conversion was calculated by
4 4
4
4
, ,
,
CH in CH out
CH
CH in
F FX
F (42)
2.4. Structure and solving procedure of the mathematical model
Both models for the fuel reactor and the air reactor are developed to simulate steady state
conditions. At steady state the oxygen transferred to the fuel in the fuel reactor is equal to the
oxygen taken from air in the air reactor. This fact is taken into account to solve the CLC model
by coupling both fuel and air reactors by means of the solids conversion at the reactor exits.
Note that the solids conversion obtained from one reactor affects to the performance of the
other reactor. For example, conversion of the fuel is improved when the oxidation of oxygen

20
carrier in the air reactor was increased. Thus, steady state is given for determined values of
solids conversion both in the fuel and air reactors. So, the solids conversion at the outlet of
every reactor is also determined by the model when fuel and air reactors are linked. Therefore,
the fuel and air reactor models are run consecutively in an iterative process until auto-
convergence is reached.
The theoretical model for each reactor is developed in Fortran® code. Figure 4 shows the
general algorithm of the CLC model, which includes the coupling of the fuel and air reactor
models. As starting point in the iterative process, simulation of the fuel reactor is carried out.
To solve the mathematical model, convergence of the solids and gases profiles must occur
simultaneously. To obtain the variation of the gas concentration with the height, mass balances
for each gas (CH4, CO2 and H2O) were calculated for the emulsion and bubble phases in the
bottom bed and in the core for the dilute region. This system of equations is solved by a
Runge-Kutta method starting from the distributor plate. This system has to be solved coupled
with the fluidodynamic model in an iterative way.
Output data END
START
Input data FR: P0, T
Bottom bed height, Hb
FR REACTOR MODEL• Fluidodynamics• Mass balances
P k= P0
NO
NO
, ,i i
ox inAR ox outFRX X
Input data AR: P0, T
→ RTD curve, E(t)→Xs distribution
Bottom bed height, Hb
AR REACTOR MODEL• Fluidodynamics• Mass balances
Pk = P0
NO
NO
Average solids conversión
1 j j
s sX X
1
, 1 i
ox inFRX
j
sX
1 j j
s sX X
1
, ,
i i
ox outAR ox inFRX XNO
1 1
, ,
i i
ox inFR ox outARX X
Green loop:
- P and Hb
Orange loop
- X
Pink loop
- FR-AR
integration
(Xin-Xout)
→ RTD curve, E(t)→Xs distribution
Average solids conversión
j
sX
Figure 4. Algorithm of the mathematical model.

21
The fuel reactor model has the following calculation flow structure:
Input data: the external input data are the reactor characteristics and the operating
conditions.
The average reactivity of the solids in the reactor is calculated considering the residence
time distribution (RTD) of oxygen carrier particles in the fuel reactor. Initially, a variation
of the solids conversion is assumed, 1 j
OCX .
The solids profile is obtained by using the fluid dynamic model above described which is
affected by the CH4 reaction, as the gas flow increases with the conversion of CH4.
Therefore, the fluid dynamic model is solved simultaneously with the mass balance.
Initially, a height for the bottom bed is assumed, which gives as a result the pressure drop
in the reactor, 1 kP .
The solids distribution in the reactor is calculated by fitting the total pressure drop in the
reactor from the solids concentration profile:
00
gd gd b r
b
H H
db cl trH
P C z C C z (43)
Here, a first iterative process is required to determine the height of the dense bed to fulfil
the pressure drop in the reactor given as an input to the model, P0; see green loop in
Figure 4.
Once the height of the dense bed has been determined, the variation of the solids
conversion is calculated by the model, and it is compared to the value previously assumed;
orange loop in Figure 4. Thus, an iterative process is used to determine the proper value of
the variation of the solids conversion.
Output data.

22
After solving the fuel reactor model, the air reactor is modelled by using the value of the
conversion of solids at the fuel reactor exit as an input to the air reactor model, which was
developed with a similar structure that the fuel reactor described above. Once the air reactor
model was solved, the solids conversion achieved in the air reactor was determined, and
compared to the solids conversion assumed previously for solids entering to the fuel reactor.
Therefore, an iterative process is performed to calculate the values of the solids conversion
which fulfil the following requirement: the solids conversion at the fuel reactor exit must be
equal to the solids conversion at the air reactor inlet, and vice versa. This iteration includes the
entire fuel reactor and air reactor models; see pink loop in Figure 4.
To illustrate the iteration process involving the fuel and air reactors, Figure 5 shows the
evolution of the solids conversion obtained after every step. Initially, it was assumed that all
particles in the system are fully oxidized, i.e. ,ox inFRX = 1. The high oxidation degree assumed is
linked to a high reactivity of solids in the fuel reactor, which results in a high variation of
solids in the fuel reactor. But also a relatively high oxidation degree of solids exiting the fuel
reactor is obtained. At this condition, the air reactor is not able to achieve the same variation of
solids conversion than in the fuel reactor. Therefore, the solids are not fully oxidized from the
air reactor, which affect to the following iteration starting by the fuel reactor. The main factor
affecting to the low increase of oxygen carrier conversion in the air reactor is that the reaction
rate tends to zero as the oxygen carrier conversion approaches to the unity.
As a consequence, the solids conversion both in fuel and air reactor decreases till they
stabilized at a determined value. At the same time, the difference between the variations in the
solids conversion, XOC, in the fuel and air reactors decreases. When they converge, then the
iteration process finishes and the final result from the CLC model is obtained. This method is
auto-convergent, because the difference between the oxygen transferred in the fuel and air

23
reactors decreased in every loop until the convergence is reached when this difference becomes
zero, i.e. XOC is equal in both reactors.
At this point, it must be highlighted that the solid conversion values at the fuel reactor exit are
output data from the model, and they must be validated against experimental results.
0.0
0.2
0.4
0.6
0.8
1.0
0 5 10 15 20
Xo
x,in
or
Xs
Iteration
Xox,inFR
Xox,inAR
Xs,AR
Xs,FR
Figure 5. Evolution of both average and variation conversion of solids in the air and fuel
reactors, till convergence is achieved following the iterative process shown in Figure 4.
3. Experimental results for validation purposes
A relevant amount of experiments were done by the TUV team with Cu14Al-SCCa under
different operating conditions. Temperature, fuel power, solids inventories and solids
circulation flow rate were varied. The fuel gas was mainly composed by methane. Table 3
shows the experimental conditions in the fuel and air reactor, as well as the main experimental
results obtained. The oxygen carrier to fuel ratio, , was defined as the potential availability of
oxygen in the flow of oxygen carrier (considered completely oxidized) divided by the oxygen
required to fully convert the fuel to CO2 and H2O. So, = 1 corresponds to the stoichiometric
flow of oxygen carrier needed for a full conversion of the fuel assuming complete regeneration

24
of the oxygen carrier in the air reactor.
4 ,4
OC s
CH inFR O
R F
F M (44)
Steam flows to upper loop seal, lower loop seal and internal loop seal are also considered at the
reactor inlets showed in Table 3. It is assumed that steam to lower loop seal goes to the air
reactor, whereas steam to upper and internal loop seals go to the fuel reactor.
Table 3. Main operational conditions in experiments during methane combustion with
Cu14Al-SCCa in the DCFB at TUV.
Test
FUEL REACTOR AIR REACTOR
Power
(kW)
CH4 flow
(Nm3/h)
Temp.
(ºC)
Pressure drop
(kPa)
Air flow
(Nm3/h)
Temp.
(ºC)
Pressure drop
(kPa)
Solids flow
(kg/h)
1 51 4.9 802 5.1 72.6 785 3.9 1645
2 51 4.9 799 4.6 94.2 786 2.8 1814
3 71 6.8 800 4.1 99.3 785 2.6 2036
4 72 7.0 802 4.1 134.3 784 2.2 1704
5 71 6.9 807 3.3 100.8 786 1.8 1285
6 54 5.2 801 5.1 70.4 786 3.8 1998
7 76 7.3 801 5.4 105.6 785 3.7 2346
8 73 7.0 804 4.7 79.4 788 3.3 1972
9 71 6.9 806 3.8 100.8 788 2.0 1441
10 71 6.9 835 3.4 100.0 815 1.8 1448
11 61 5.9 806 4.0 67.3 787 3.1 1680
12 70 6.7 803 3.9 96.3 785 2.6 2037
13 71 6.8 806 4.9 101.1 789 3.4 1972
14 70 6.7 803 4.0 100.1 782 2.6 1769
15 70 6.7 807 3.8 100.5 779 2.4 1288
16 72 7.0 807 6.0 100.2 793 4.3 2804
17 73 7.0 803 5.1 102.3 789 3.3 2438
18 74 7.1 851 4.6 99.8 833 2.7 2062
19 73 7.1 902 4.5 100.5 883 2.6 2178
25
4. Results
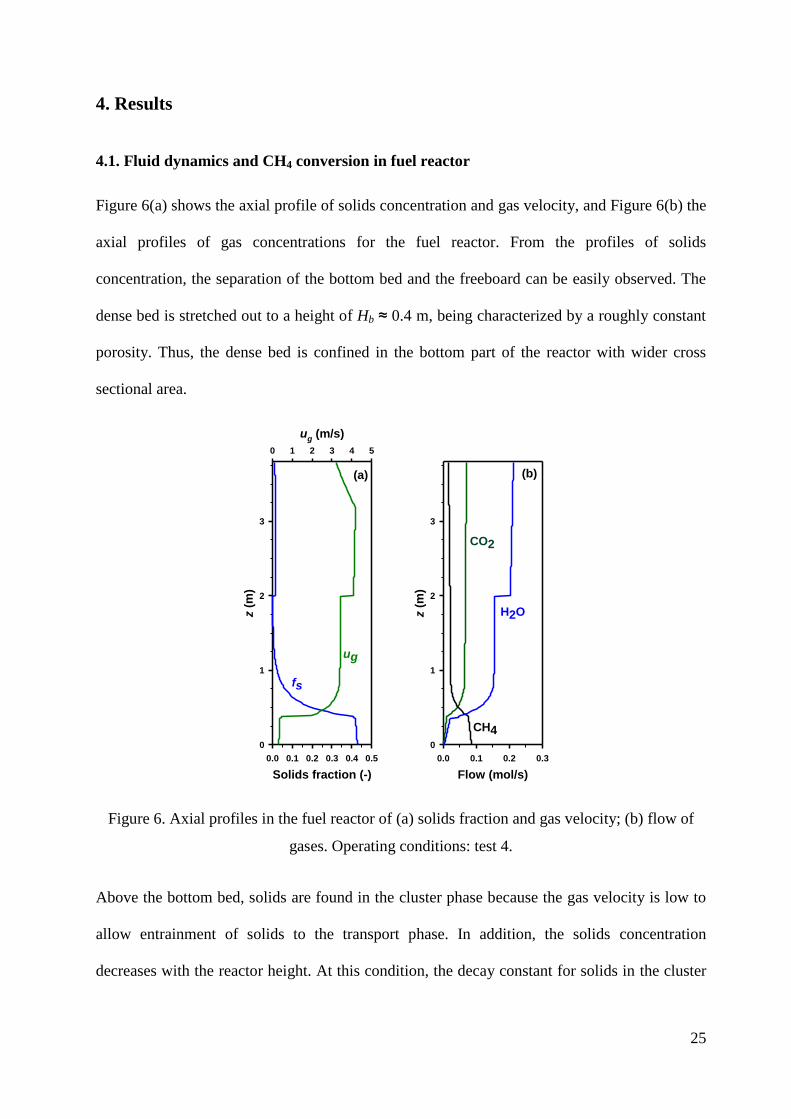
4.1. Fluid dynamics and CH4 conversion in fuel reactor
Figure 6(a) shows the axial profile of solids concentration and gas velocity, and Figure 6(b) the
axial profiles of gas concentrations for the fuel reactor. From the profiles of solids
concentration, the separation of the bottom bed and the freeboard can be easily observed. The
dense bed is stretched out to a height of Hb ≈ 0.4 m, being characterized by a roughly constant
porosity. Thus, the dense bed is confined in the bottom part of the reactor with wider cross
sectional area.
Solids fraction (-)
0.0 0.1 0.2 0.3 0.4 0.5
z (
m)
0
1
2
3
ug (m/s)
0 1 2 3 4 5
fs
ug
(a)
Flow (mol/s)
0.0 0.1 0.2 0.3
z (
m)
0
1
2
3
CO2
CH4
H2O
(b)
Figure 6. Axial profiles in the fuel reactor of (a) solids fraction and gas velocity; (b) flow of
gases. Operating conditions: test 4.
Above the bottom bed, solids are found in the cluster phase because the gas velocity is low to
allow entrainment of solids to the transport phase. In addition, the solids concentration
decreases with the reactor height. At this condition, the decay constant for solids in the cluster

26
phase in Eq. (12) was taken as a = 24.4, which was similar to values required in a bubbling
fluidized bed; see Abad et al. (2010).
The gas velocity increases through the reactor because the gas expansion during methane
conversion. Note that both the solids concentration and gas velocity increase at the point where
solids are recirculated from the air reactor via the upper loop seal. Solids entering to the fuel
reactor were added to the transport phase. The decay constant for solids in the transport phase
in Eq. (16) was K = 0.23 (Pallarès and Johnsson, 2006).
Although the gas flow is increasing throughout the entire reactor, a decrease in the gas velocity
is observed in the upper part of the reactor (z > 3.15 m). This fact is because the gas is assumed
to flow by the core. The core section only increases above the height at which the saturation
value in the annulus is reached, which is zsat = 3.15 m. Thus, the gas velocity decreases above
this position due to the increase in the core section.
At the bottom of the bed, a major flow of methane goes through the bubble phase. Methane is
slowly converted because the chemical reaction is restricted by the slower diffusion of methane
from the bubbles to the emulsion phase, where reaction with the oxygen carrier happens; see
Figure 6(b). In the freeboard methane is converted faster than in the bottom bed because an
improved contact between gas and solids is found in this region. Note also that CH4 conversion
is improved at z > 2 m because the addition of solids recirculated from the air reactor.
The fluid dynamic model for the fuel reactor was validated against experimental results
obtained in the CLC unit by comparing the axial profile of gauge pressure. As an example,
Figure 7 shows the results obtained for test 4, where it can be identified the regions for the
dense bed, the splash phase and the transport phase.

27
0.0
0.5
1.0
1.5
2.0
2.5
3.0
3.5
4.0
0 2000 4000 6000
h (
m)
P (Pa)
Solids inlet from the AR
Dense bed
Splash
Transport
Figure 7. Axial profile of gauge pressure in the fuel reactor. Symbols: experimental
measurements in the CLC unit; Line: prediction from the model. Test 4.
4.2. Fluid dynamics and O2 evolution in air reactor
Figure 8 shows a fluid dynamic map where effect of the gas velocity and the total solids
inventory in the CLC unit on the pressure drop in the air reactor was shown. Most experiments
were carried out using high gas velocities (ug > 7 m/s), but in some cases lower gas velocities
were used. Interestingly, it was observed that the shape of the pressure profile was different
depending on the gas velocity used. Thus, for experiments performed with the lower gas
velocity values the pressure profile was characterized by a curved shape, while a straight
profile was obtained when higher gas velocities were used; see Figure 9. This fact suggests that
a change in the fluidization regime could have happen when the gas velocity was increased
from fast fluidization to pneumatic transport; see Figure 2.

28
0
500
1000
1500
2000
2500
3000
3500
4000
4500
5000
0 2 4 6 8 10 12
P
(P
a)
Gas velocity (m/s)
mt=10 kg
mt=11.5 kg
mt=14 kg
mt=16 kg
mt=17 kg
Fast fluidization Pneumatic transport
Figure 8. Variation of the pressure drop in the air reactor as a function of the gas velocity and
the total solids inventory in the CLC unit.
0.0
0.5
1.0
1.5
2.0
2.5
3.0
3.5
4.0
0 20 40 60 80
h (
m)
P (Pa)
(a)
0.0
0.5
1.0
1.5
2.0
2.5
3.0
3.5
4.0
0 20 40 60 80
h (
m)
P (Pa)
(b)
Figure 9. Characteristic axial profiles of pressure in the air reactor for (a) test 1: gas velocity ug
< 7 m/s; (b) test 5: gas velocity ug > 7 m/s. Symbols: experimental measurements in the CLC
unit; Line: prediction from the model.

29
In this case, the separation of the bottom bed and the freeboard cannot be distinguished. A very
low concentration of solids is predicted everywhere in the reactor. Thus, a dense bed could not
be distinguished, assuming that all the solids are in a transport phase. The decay constant used
to predict the shape of the pressure profile was different depending on the gas velocity, i.e. the
fluidization regime. Thus, the value of decay constant in Eq. (16) was K = 5.2 for ug < 7 m/s,
but K = 0.23 for ug > 7 m/s.
The efficiency of gas-solid contact in the dilute region, g s in Eq. (25), was also affected by
the fluidization regime. Thus, in fast and turbulent fluidization the following equation proposed
by Furusaki et al. (1976) was used:
0.4
0
( )( ) 1 0.75
( )
dilg s
b
C zz
C z H
(45)
However, this equation was not valid for most of cases simulated in this work because of the
high velocity used in the air reactor. In these cases, the pressure profile in the air reactor
suggests that the fluidization regime was close to the pneumatic transport (see also Figure 2).
To obtain a valid efficiency of gas-solid contact, the g s parameter was obtained for each
experimental condition as a function of the average concentration of solids in the reactor; see
Figure 10. From these data, Eq. (46) was obtained to calculate the g s parameter in the model.
(46)
0.2
0.3
0.4
0.5
0.6
0.7
0.02 0.04 0.06 0.08
1-
g-s
Solids fraction = 1- (-)
Figure 10. Variation of gas-solid contact efficiency, g s , with the solids fraction in air reactor.
g s .
. ·
. ·
4
2 84
18 101
25 10 1

30
4.3. Validation of the CLC model
The developed theoretical model focuses on the processes occurring both in the fuel and air
reactor of the DCFB system at Vienna University of Technology (TUV). This model considers
both fluid dynamics and reaction kinetics in order to obtain the actual fuel conversion
depending on the operating conditions. Fluid dynamics of the reactors belonging to the CLC
unit was assessed in Sections 4.1 and 4.2. Now, the model was validated considering the
methane conversion obtained during the experimental campaign with the Cu14Al-SCCa
oxygen carrier. Thus, the model was used to predict the performance of the CLC unit using
parameters shown in Table 3.
To evaluate the goodness of model predictions, Figure 11 compares the experimental and
predicted values of methane conversion. In general, good agreement between experimental
values and model predictions are found, with a deviation lower than ±5% in most of cases.
50
70
90
50 70 90
CH
4co
nve
rsio
n P
RED
ICTE
D (%
)
CH4 conversion EXPERIMENTAL (%)
Error= ±5%
Figure 11. Comparison between experimental and predicted values of methane conversion.

31
Figure 12 shows the results obtained for every experimental condition. Complete combustion
was experimentally obtained only in the case of having a high temperature in the fuel reactor,
e.g. 900 ºC. However, this kind of impregnated Cu-based oxygen carriers is suitable for
temperatures lower than 850 ºC because the durability of the particles was negatively affected
(Cabello et al., 2016). In addition, the model predicted complete methane combustion for tests
1, 2 and 6, but experimental CH4 conversion was not complete despite being high. All these
test used a low fuel flow, corresponding to specific solids inventory in the fuel and air reactors
in the 200-210 kg/MWth and 65-100 kg/MWth intervals, respectively. Lower values of specific
solids inventory were used in the rest of tests.
Obviously, the XOC values shown in Figure 12(b) follow the tendency observed by the CH4
conversion because both parameters are closely connected by the oxygen balance for the fuel
combustion and the oxygen carrier conversion.
In addition, Figures 12(c) and 12(d) show a comparison of experimental and predicted values
of solids conversion at the fuel reactor and air reactor exits. Note that the solids conversion
values at the outlet of each reactor take the corresponding values to make equal the oxygen
transferred in both reactors. So, the solids conversion at the reactors outlet are calculated by the
model in order to make the oxygen taken in the air reactor equal to the oxygen transferred in
the fuel reactor, which is determined by the methane conversion. In general, good agreement is
found between experimental and predicted values; but relevant deviation can be found in some
cases. Interestingly, differences observed for tests 6-9 could not be easily be justified by
differences in the operational conditions. Considering the deviations observed in some cases
between experimental and predicted results, following a deeper analysis is done to evaluate the
relevance of these inconsistencies.

32
0
20
40
60
80
Xo
x,so
lIN
LET
FR
(%
)
0
20
40
60
80
0 1 2 3 4 5 6 7 8 9 10 11 12 13 14 15 16 17 18 19
Xo
x,so
lIN
LET
AR
(%
)
0
20
40
60
80
Xso
l(%
)
0
20
40
60
80
100
XC
H4
(%)
Figure 12. Comparison between experimental and predicted values for (a) methane conversion,
(b) variation of solids conversion, (c) solids conversion at the fuel reactor inlet, and (d) solids
conversion at the air reactor inlet. Closed symbols: experimental results; Open symbols: model
predictions.
4.4. Assessment on observed deviation between experimental and prediction results
Values for methane conversion were widespread in the 75-100% interval with no clear
tendency when the solids circulation rate or the solids inventory in the fuel reactor was varied.
This fact was due to several operating conditions were changed at the same time in the fuel and
air reactors, making difficult to assign their unequivocal effect on the methane conversion.
Nevertheless, it was identified one series consisting of tests 3, 4, 9, 12, 14 and 15. In these
tests, most of operating conditions were roughly constant, with the major difference was the
solids circulation rate increasing in the order 15<9<4<14<3<12.
Methane conversion achieved in experiments and predicted by the model are compared in
Figure 13. Although experimental conditions were roughly the same for this series, it can be

33
seen that methane conversion in experiments 12-14-15 are higher than that achieved in tests 3-
4-9. This difference could be due to the usual uncertainty linked to experimental results.
However, the mathematical model cannot simulate this uncertainty, and only one of these
results could be predicted. In this case, predictions were in line to results obtained in 3-4-9.
50
55
60
65
70
75
80
85
90
95
100
0 500 1000 1500 2000 2500 3000
CH
4co
nve
rsio
n (
%)
Solids circulation rate (kg/h)
15
9
14
4
12
3
Figure 13. Comparison between experimental and predicted values of CH4 conversion for
experiments 3, 4, 9, 12, 14 and 15. Most of operating conditions were roughly the same,
excepting the solids circulation rate. Closed symbols: experimental results; Open symbols:
model predictions
Similarly to the CH4 conversion, an evaluation of the discrepancies observed in the solids
conversion at the reactors outlets was also done. Figure 14 shows that the solids conversion at
the fuel and air reactor outlet were reasonably well predicted by the model, excepting for test 9.
Considering that the solids circulation rate was increased in the sequence 15<9<4<14<3<12,
the methane conversion predicted by the model follows the tendency observed for an increase
of solids circulation rate, but this was not observed during the experimental work in this
specific case. In fact, the solids conversion at the fuel reactor outlet was barely affected by the
solids circulation rate. But the oxygen carrier conversion at the air reactor outlet was
decreasing with the solids circulation rate, suggesting a limitation in the re-oxidation of the

34
oxygen carrier in the air reactor.
0
10
20
30
40
50
60
70
80
90
Xo
x,so
lIN
LET
(%
)
15 9 4 14 3 12
Test number
Solids conversion in test 9 is too low, which can not be predicted by the model
Figure 14. Comparison between experimental and predicted values of solids conversion at the
fuel and air reactor outlets for experiments 3, 4, 9, 12, 14 and 15. Most of operating conditions
were roughly the same, excepting the solids circulation rate. Closed symbols: experimental
results; Open symbols: model predictions
Considering the evaluation of the capability of the model to predict the experimental results, it
is logical to assume that the model could not properly predict all the results obtained in the
experimental campaign. Thus, the model succeeds in predicting the experimental CH4
conversion, as well as the solids conversion at the fuel and air reactor outlets, in most of
operating conditions used in the experimental campaign; but intrinsically could not be fitted the
experimental values in some cases, likely due to the uncertainty of the results obtained in the
CLC unit.
4.4. Sensitivity analysis to relevant operating conditions
Although high CH4 conversion was achieved in the experimental campaign, complete
combustion was not usually obtained. Several reasons can be argued to justify incomplete
combustion of methane in the CLC unit. Insufficient oxygen transference from the oxygen

35
carrier to the fuel in the fuel reactor can be claimed as a relevant limitation in the CLC unit. To
overcome this limitation, the oxygen transferred can be increased either by increasing the
solids inventory or by increasing the solids circulation flow rate, which in turn increases the
oxygen carrier to fuel ratio, , and the average reactivity of the particles (Abad et al., 2007).
But also, it was suggested that a limitation in the oxygen transference from air to the oxygen
carrier in the air reactor could result in a low re-oxidation of the oxygen carrier, which directly
affect to the methane conversion in the fuel reactor.
To clarify these points, a sensitivity analysis to the oxygen carrier to fuel ratio and solids
inventory in the fuel and air reactors is carried out to identify possible reasons responsible for
the uncomplete fuel conversion obtained. The sensitivity analysis was performed using
operating conditions for test 4 as a reference, characterized by an oxygen carrier to fuel ratio
= 2, solids inventory in the fuel and air reactor was 132 and 41 kg/MWth, respectively. The
methane conversion achieved was 81.6 %.
In Figure 15 it is clearly shown that the methane conversion can be improved by increasing the
solids circulation rate. A relevant increase in the methane conversion up to 94 % is expected by
increasing the value to 5. However, a further increase in the oxygen carrier to fuel ratio
results in a lower increase of the methane conversion. This fact was related to the asymptotic
increase of the average reactivity of particles with the parameter (Abad et al., 2007), which is
reflected in the shape of the conversion curve in Figure 15.
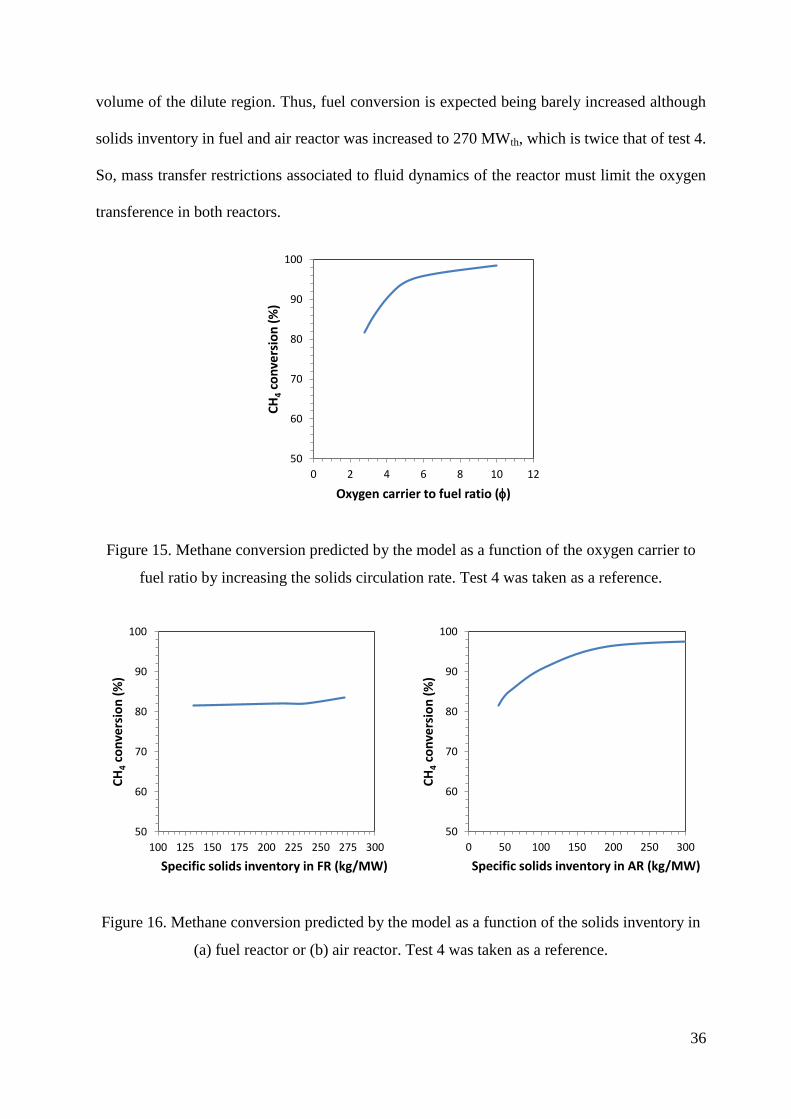
Now, an analysis about the performance of the fuel reactor was made, and later the evaluation
of the oxygen taken from the air reactor was done. Figure 16(a) shows that the methane
conversion could not be highly improved by increasing the solids inventory in the fuel reactor.
The ultimate reason for this behaviour was that any additional amount of solids goes to the
dense bed, which is low effectiveness converting fuel gas, and at the expense of reduce the
36
volume of the dilute region. Thus, fuel conversion is expected being barely increased although
solids inventory in fuel and air reactor was increased to 270 MWth, which is twice that of test 4.
So, mass transfer restrictions associated to fluid dynamics of the reactor must limit the oxygen
transference in both reactors.
50
60
70
80
90
100
0 2 4 6 8 10 12
CH
4co
nve
rsio
n (
%)
Oxygen carrier to fuel ratio ()
Figure 15. Methane conversion predicted by the model as a function of the oxygen carrier to
fuel ratio by increasing the solids circulation rate. Test 4 was taken as a reference.
50
60
70
80
90
100
100 125 150 175 200 225 250 275 300
CH
4co
nve
rsio
n (
%)
Specific solids inventory in FR (kg/MW)
50
60
70
80
90
100
0 50 100 150 200 250 300
CH
4co
nve
rsio
n (
%)
Specific solids inventory in AR (kg/MW)
Figure 16. Methane conversion predicted by the model as a function of the solids inventory in
(a) fuel reactor or (b) air reactor. Test 4 was taken as a reference.

37
Once operational conditions in the fuel reactor are analysed, the conditions in the air reactor
are evaluated. On the contrary to the case of the fuel reactor, the CH4 conversion is highly
sensitive to the solids inventory in the air reactor. Figure 16(b) shows that the predicted CH4
conversion was 96 % by using a solids inventory in the air reactor of 200 kg/MWth. This result
suggests that the solids inventory in the air reactor is insufficient to transfer the required
oxygen from air to the oxygen carrier. In other words, the oxygen carrier conversion in the air
reactor must be improved in order to transfer more oxygen to the fuel reactor. Thus, CH4
conversion can be improved even if conditions in the fuel reactor were unchanged.
Considering the effect of the parameters evaluated in this section on the methane conversion, it
can be stated that complete combustion of methane could not be reached by increasing only
one of them, i.e. modifying either the oxygen carrier to fuel ratio, or the solids inventory in the
fuel reactor, or the solids inventory in the air reactor. However, it can be inferred that it is
worth increasing both the oxygen carrier to fuel ratio and the solids inventory in the air reactor
to highly improve the CH4 conversion. Thus, complete combustion of methane is predicted by
using values for the oxygen carrier to fuel ratio and solids inventory in the air reactor of = 4
and *ARm = 120 kg/MWth. The solids inventory in the fuel reactor was maintained in the value
existing for test 4, i.e. *FRm = 132 kg/MWth. For the design of the CLC unit at TUV, this means
that the pressure drop in the fuel and air reactors should be 4.1 kPa and 5.7 kPa, respectively.
4.5. Lessons learned from predictions on the performance of the CLC unit at TUV
The basic parameters being considered in the design of a CLC system are the solids inventory
in the fuel and air reactors, and the solids circulation flowrate between both reactors. In order
to optimize the operation of the CLC unit with Cu14Al-SCCa oxygen carrier, the solids
circulation rate must be high enough to allow operating at an oxygen carrier to fuel ratio value

38
of ≈ 4.
In addition, the solids inventory depends not only on the reactivity of the oxygen carrier but
also on the fluid dynamic characteristics of the reactors. Thus, solids in the bottom bed of the
fuel reactor are low effectiveness converting methane, and most of methane was converted in
the dilute region. Therefore, adding more solids to the fuel reactor is not an appropriate
strategy in order to optimize the amount of solids in the CLC unit to fully convert the fuel.
On the contrary, the solids inventory in the air reactor has a relevant influence on the methane
conversion. Initially, the solids inventory in the air reactor was very low, usually in the order of
30-60 kg/MWth. In addition, the gas velocity was high (>8 m/s in most of the cases) and the
fluidization regime seems to be close to pneumatic transport. At this condition, the model
predicts that the residence time of solids in the air reactor is not high enough to take the
required oxygen to fully burn the fuel in the fuel reactor. For example, for the specific case of
test 4, a solids inventory in the air reactor of 120 kg/MWth would allow taking the required
oxygen. This fact shows the relevance of a proper design of the air reactor, in addition to the
fuel reactor. This design must consider the existence of the required amount of solids while a
high solids circulation rate is supported. The use of the validated model developed in this
project would be a powerful tool in order to obtain the general parameters for a proper design
of the CLC unit, as well as to determine the optimized operating conditions.
5. Conclusions
A model describing the behaviour of a Dual Circulating Fluidized Bed (DCFB) system for
Chemical Looping Combustion (CLC) process has been developed. The model includes fluid
dynamics of fuel and air reactors as well as kinetics of reduction and oxidation of the oxygen
carrier. The global model of the CLC unit considers the coupling of both reactors models. The
model was validated against experimental results obtained in the CLC unit at Vienna

39
University of Technology (TUV) using Cu14Al-SCCa as oxygen carrier. For the model
validation the methane conversion in the fuel reactor, as well as the solids conversion values at
the fuel and air reactor outlets, were obtained by considering 19 different operating conditions.
Reasonable good fitting between experimental results and predictions from the model were
achieved in most of the cases. The reasonable uncertainty associated to the experimental work
has been suggested as one of the possible reasons for some observed deviation.
At conditions in the CLC unit at TUV, it was determined that insufficient oxygen transference
rates both in fuel and air reactors were responsible for conditions with low methane
conversion. The solids circulation rate and the solids inventory in the air reactor were identified
as the most relevant parameters to be considered in order to achieve complete fuel combustion.
The mathematical model, after validation, can be used to optimize the operational conditions in
the CLC unit. Thus, the operational conditions were determined to allow complete combustion
in the CLC unit. The solids inventory would be 130 and 120 kg/MWth in the fuel and air
reactors, respectively, while an oxygen carrier to fuel ratio of = 4 must be considered.

40
6. Nomenclature
a decay constant for solids in the cluster phase (m-1
)
A0 section assigned to one orifice in the distributor plate (m2)
AC section of the core in the transport phase (m2)
Ar Archimedes number (-)
bk stoichiometric factor for gas-solid reaction for reaction k (mol solid/mol gas)
Cb,i concentration of gas i in the bubbles (mol/m3)
Ccl concentration of solids in the cluster phase (kg/m3)
Cdb concentration of solids in the dense bed (kg/m3)
Cdil,i concentration of gas i in the dilute region (mol/m3)
Ce,i concentration of gas i in the emulsion (mol/m3)
Cg,i bulk concentration of gas i (mol/m3)
Ctr concentration of solids in the transport phase (kg/m3)
Cp gas concentration in the particle (mol/m3)
Cps gas concentration in the particle surface (mol/m3)
db bubble diameter (m)
di stoichiometric coefficient for combustion of fuel i with O2 (mol O2/mol fuel)
dp particle diameter (m)
Dc diameter of the core of the transport phase (m)
Dg,i diffusivity of gas i (m)

41
Dpl effective diffusivity of gas i through the product layer (m3n’
mol-n’
s-1
)
Dpl,0 pre-exponential factor of the effective diffusivity of gas i through the product layer
(m3n’
mol-n’
s-1
)
Dr diameter of the reactor (m)
E(t) residence time distribution of solids in the reactor (-)
Ech activation energy of the kinetic constant ks (J/mol)
Epl activation energy of the diffusivity through the product layer Dpl (J/mol)
Fb,i molar flow of gas i by the bubbles (mol/s)
fs fraction of solids, 1- (-)
4CHF molar flow of methane (mol/s)
Fdil,i molar flow of gas i by the dilute region (mol/s)
Fe,i molar flow of gas i by the emulsion (mol/s)
Fexc excess flow in the emulsion with respect the minimum fluidization (mol/s)
Fg total gas flow (mol/s)
Fs circulation flow rate of oxygen carrier (kg/s)
Ftr flow of solids in the core of the transport phase (kg/s)
Fw flow of solids in the annulus of the transport phase (kg/s)
g gravity acceleration (=9.8 m s-2
)
Hb height of the dense bed (m)
Hr height of the reactor (m)

42
kbe mass transfer coefficient between bubble and emulsion phases (s-1
)
kg external mass transfer coefficient (m s-1
)
ks effective kinetic constant (m3n
mol-n
s-1
)
ks,0 pre-exponential constant of the kinetic constant (m3n
mol-n
s-1
)
kX decay constant with the solids conversion of the diffusivity through the product layer (-)
K decay constant for solids in the transport phase (s-1
)
*
jm specific solids inventory in the reactor j (kg/MWth)
MO atomic mass of oxygen (=16·10-3
kg O/mol)
n reaction order for the chemical reaction (-)
n’ reaction order for the diffusion through the product layer (-)
P pressure (Pa)
ROC oxygen transport capacity (kg oxygen per kg solids)
rp particle radius (m)
Rg constant for ideal gases (=8.314 J mol-1
K-1
)
, , g i j k
r average reaction rate of gas i in the j phase by reaction k (mol s-1
m-3
)
, OC i jr average reaction rate of the oxygen carrier with gas i in the j phase (mol s
-1 m
-3)
'
, g i pr average gas reaction rate of gas i in the particle (mol m
-3 s
-1)
Re Reynolds number (-)
Sc Schmidt number (-)

43
Sh Sherwood number (-)
t time (s)
tmr mean residence time of solids in the reactor (s)
tr reacting time until complete conversion (s)
T temperature (K)
ug gas velocity (m/s)
ut terminal velocity of particles (m/s)
umf minimum fluidization gas velocity (m/s)
us,c velocity of solids in the core (m/s)
utf velocity of through flow gas (m/s)
uvis velocity of visible bubbles (m/s)
uvis,sat velocity of visible bubbles at saturation condition (m/s)
V volume (m3)
4CHX methane conversion (-)
XOC oxygen carrier conversion (-)
in
OCX average oxygen carrier conversion at the reactor inlet (-)
out
OCX average oxygen carrier conversion at the reactor outlet (-)
oxX average oxidation conversion of solids (-)
ye,i molar fraction of gas i in the emulsion (-)
z position in the axial direction (m)

44
zsat saturation height(m)
Greek symbols
b volumetric fraction of bubbles (-)
b,sat volumetric fraction of bubbles at saturation condition (-)
P pressure drop in the reactor (Pa)
XOC variation of the oxygen carrier conversion in the reactor (-)
porosity of the bed (-)
mf porosity of the bed at minimum fluidization condition (-)
sat porosity of the bed at saturation condition (-)
sh shape factor of particles (-)
oxygen carrier to fuel ratio (-)
g gas viscosity (kg m-1
s-1
)
comb combustion efficiency (-)
g–s contact efficiency between gas and solids in the dilute region (-)
OC solids density (kg m-3
)
g gas density (kg m-3
)
p apparent density of the solid particle (kg m-3
)
time for complete conversion of solids (s)

45
ch time for complete conversion for chemical reaction control (s)
m average time for complete conversion of solids (s)
pl time for complete conversion for diffusion control in the product layer (s)
ratio of the visible bubble flow to the total flow through the bubbles (-)
Subscripts
AR air reactor
cl clusters
e emulsion
FR fuel reactor
in inlet
out outlet
ox oxidation
red reduction
tr transport

46
7. References
Abad, A.; Adánez, J.; García-Labiano, F.; de Diego, L.F.; Gayán, P.; Celaya, J. Mapping of the
range of operational conditions for Cu-, Fe-, and Ni-based oxygen carriers in chemical-
looping combustion. Chemical Engineering Science 2007, 62, 533-549.
Abad, A.; Adánez, J.; García-Labiano, F.; de Diego, L.F.; Gayán, P. Modeling of the chemical-
looping combustion of methane using a Cu-based oxygen-carrier. Combustion and Flame
2010, 157, 602-615.
Broadhurst, T.E.; Becker, H.A. Onset of fluidization and slugging in beds of uniform particles.
AIChE J. 1975, 21, 238-247.
Cabello, A.; Gayán, P.; Abad, A.; de Diego, L.F.; García-Labiano, F.; Izquierdo, M.T.;
Scullard, A.; Williams, G.; Adánez, J. Long-lasting Cu-based oxygen carrier material for
industrial scale in Chemical Looping Combustion. Int. J. Greenhouse Gas Control 2016,
52, 120-129.
Chakraborty, R.K.; Howard, J.R. Combustion of char in shallow fluidized bed combustors:
influence of some design and operating parameters. J. Institute Energy 1981, 54, 48-54.
Darton, R.C.; LaNauze, R.D.; Davidson J.F.; Harrisson, D. Bubble growth due to coalescence
in fluidized beds. TransIChemE 1977, 55.
de Diego, L.F.; Gayán, P.; Adánez, J. Modelling of flow structure in circulating fluidized beds.
Powder Technology 1995, 85, 19-27.
de Diego, L.F.; Gayán, P.; García-Labiano, F.; Celaya, J.; Abad, A.; Adánez, J. Impregnated
CuO/Al2O3 Oxygen Carriers for Chemical-Looping Combustion: Avoiding Fluidized Bed
Agglomeration. Energy Fuels 2005, 19, 1850.

47
Foka, M.; Chaouki, J.; Guy C.; Klvana, D. Gas phase hydrodynamics of a gas-solid turbulent
fluidized bed reactor. Chemical Engineering Science 1996, 51, 713-723.
Furusaki, S.; Kikuchi, T.; Miyauchi, T. Axial Distribution of Reactivity Inside a Fluid-Bed
Contactor. AIChE J. 1976, 22, 354-361.
García-Labiano, F.; de Diego, L.F.; Adánez, J.; Abad, A.; Gayán, P. Reduction and Oxidation
Kinetics of a Copper-Based Oxygen Carrier Prepared by Impregnation for Chemical-
Looping Combustion. Industrial Engineering Chemistry Research 2004, 43, 8168-8177.
García-Labiano, F.; de Diego, L.F.; Adánez, J.; Abad, A.; Gayán, P. Temperature variations in
the oxygen carrier particles during their reduction and oxidation in a chemical-looping
combustion system. Chemical Engineering Science 2005, 60, 851-862.
Grace, J.R. Contacting modes and behaviour classification of gas—solid and other two-phase
suspensions. Canadian Journal of Chemical Engineering 1986, 64, 353-363.
Kuuni, D.; Levenspiel, O. Circulating fluidized-bed reactors. Chem. Eng. Sci. 1997, 52, 2471-
2482.
Palchonok. G., 1998. PhD Thesis, Chalmers University of Technology, Göteborg, Sweden.
Pallarès, D.; Johnsson, F. Macroscopic modelling of fluid dynamics in large-scale circulating
fluidized beds. Progress in Energy and Combustion Science 2006, 32, 539-569.