Embed Size (px)
Citation preview

Assessing and predicting effects on water quantity and quality in Iberian rivers caused by global change (2009-2014). Consolider-Ingenio 2010
CSD2009-00065
1
WP5: PROCESS
DELIVERABLE 5.3
MODEL FOR RIVER FUNCTIONING
TECHNICAL DETAILS
Description: Report corresponding to the deliverable 5.3 of the Work Package 5:
PROCESS (Consolider-Ingenio 2010 CSD2009-00065)
Elaboration: WP5 Members (led by the Vicenç Acuña)
Contact: ICRA ([email protected])
Delivery date: July 20th, 2014
Assessing and predicting effects on water quantity and quality in Iberian rivers caused by global change (2009-2014). Consolider-Ingenio 2010
CSD2009-00065
2
WP5: PROCESS
EXECUTIVE SUMMARY
Chemical fate of pharmaceuticals was modelled at 2 different scales, the river segment scale
and the river basin scale. In the first case, a specific survey was performed in the WWTP and
the river flowing right upstream and downstream the WWTP (Segre near the Puigcerdà WWTP),
whereas in the second case, data from the field surveys encompassed in WP3-4-5 were used
(Llobregat River basin). In fact, pharmaceuticals, as other emerging pollutants, reach the
environment after human activity and consumption through sewage water. In the first case, we
modelled measured concentrations and estimated loads at the influent of the WWTP, at the
effluent of the WWTP, and at different distances from the WWTP effluent along the studied river
segment. In the second case, we estimate the loads entering the river network from WWTPs
based on consumption rates of different pharmaceuticals, and then model their chemical fate
along the river network. Our goal in the first case was to understand the mechanistic behind the
transformations, and we used a mechanistic model such as the ASM-RWQM, whereas in this
second case we used the model GREAT-ER.
The analyses presented of the first block are preliminary, and the related publications are not yet
published. However, results indicate the coupling between the ecosystem metabolism and the
attenuation, as light-mediated GPP seemed to play a significant role in the attenuation of several
compounds. At the same time, chemical pollution was abating the relationship between
irradiance and GPP at reaches closer to the WWTP effluent, that is, I1, I2, and I3, whereas this
was not the case of reaches I4, and I5, indicating that there was a likely threshold beyond which
there was an effect on the GPP-Irradiance relationship. In contrast, heterotrophic activity was
fuelled by the WWTP effluent, as it increased over one order of magnitude.
The GREAT-ER model has been used and calibrated with measured field concentrations in
order to predict diclofenac concentration in the Llobregat Catchment. The geo-referenced model
was able to estimate concentration values in most sampling points with an acceptable error.
However, there was a clear need for more accurate and longer data set for the study site, which
could improve model result reliability. Currently, available data of hydrological variables in
Llobregat Catchment and diclofenac degradation behaviour and consumption is rather limited
and uncertain. Calibrated parameters cover a wide range of values which certainly need to be
estimated with higher accuracy.

Assessing and predicting effects on water quantity and quality in Iberian rivers caused by global change (2009-2014). Consolider-Ingenio 2010
CSD2009-00065
3
WP5: PROCESS
1. INTRODUCTION
SCARCE is a multipurpose project that aims to describe and predict the relevance of global
change impacts on water availability, water quality and ecosystem services in Mediterranean
river basins of the Iberian Peninsula, as well as their impacts on the human society and
economy. The current and future necessity to face water shortages while making possible the
conservation of ecosystems is the departure point of SCARCE. The necessary knowledge to
make this possible will be filled by using a multidisciplinary, cross-scale research to give a
comprehensive assessment and prediction of the potential modifications in resources and
ecosystem services arising from climate change and human pressure in the Mediterranean
Iberian Peninsula.
Assessment of the effects of global change in freshwater ecosystems has been mainly done in
WPs 4 and 5, whereas prediction is supposed to be mainly done in WP5 (task 5.3) and WP 6. In
fact, it is known that global change affects processes in freshwater ecosystems, but the complex
responses of ecosystem functioning to stress still limit our prediction capacity. In order to
summarize the information gathered in WPs 4 and 5, and improve our prediction capacity, task
5.3 has focused on the development of mechanistic models on the functioning of stream
ecosystems. Furthermore, this task is also crucial to link the information gathered by the
previously mentioned WPs 4 and 5, and the WPs dealing directly with models (6.UPSCALE and
8.SERVICES).
2. OBJECTIVES AND APPROACH
The task 5.3 involves the development of a mechanistic model for the functioning in
Mediterranean stream ecosystems, in order to up-scale processes to the basin scale, and to
forecast future changes under different scenarios of global change. Rather than one model, task
5.3 has developed models at 2 spatial scales, the river segment and the river basin.
� The river segment is the scale at which the generated knowledge at WP 4 and 5 might be
easily integrated, as most measures were performed at this scale. It is also at this scale
that models can have a truly mechanistic basis, and interaction among different stressors
can be also simulated. In fact, information from the studies performed at the river

Assessing and predicting effects on water quantity and quality in Iberian rivers caused by global change (2009-2014). Consolider-Ingenio 2010
CSD2009-00065
4
WP5: PROCESS
segment scale under different conditions of anthropogenic impact (flow regulation,
chemical pollution, etc.) can be integrated in a single model.
� The river basin is the scale at which more easily the information from the field surveys
performed by WPs 3, 4, and 5 might be integrated. Furthermore, it is much easier to
translate the information from models working at the same spatial scale. Thus, this model
at the basin scale will be able to relate environmental variables (discharge and
temperature regimes, nutrient concentrations…) to community attributes and ecosystem-
level functional properties. In this way, the results from WP5 will be fed to WP UPSCALE
and then used in WP SERVICES.
A river segment scale model was developed for the Segre River near Puigcerdà using the River
Water Quality Model (RWQM) (Shanahan et al., 2001). In fact, the implemented model included
the waste water treatment plant (WWTP) of Puigcerdà, and a river segment of approximately
6km, 1 km upstream and 5 km downstream the WWTP effluent. The goal was to simulate
pollutant dynamics in a WWTP-River system, focusing on carbon, nitrogen and phosphorous
compounds, as well as on a series of pharmaceutical compounds and its transformation
products. The model followed the Lagrange modelling approach for pollutant transport without
the introduction of errors by numerical dispersion effects: transport and conversion processes
are modelled, based on the core principle of “water parcels” moving along the river, thus
avoiding numerical dispersion errors.
A river basin model was developed for the Llobregat basin, the GREAT-ER (Feijtel et al., 1998).
The GREAT-ER was developed to understand the pharmaceutical compound dynamics at the
basin scale, as this model links the pharmaceutical consumption, the water treatment at WWTP,
and the transport and fate of pharmaceuticals once inside the river network.
3. MODEL AT THE RIVER SEGMENT SCALE
3.1. Introduction
In the last decade the political awareness of river water quality issues has grown substantially
both in the United States (US) and the European Union (EU), where wastewater treatment
plants (WWTPs) have been identified as major sources of point source pollution. In fact, WWTP

Assessing and predicting effects on water quantity and quality in Iberian rivers caused by global change (2009-2014). Consolider-Ingenio 2010
CSD2009-00065
5
WP5: PROCESS
effluents can account for more than 50% of stream and river nitrogen (N) and phosphorus (P)
loads regardless of the climatic region where streams are located (Brooks et al., 2006).
Pharmaceutical compounds may reach the aquatic environment via human and animal excretion
both as active metabolites and in unmetabolized form (parental forms). They are considered
‘‘emerging pollutants’’ since are not currently covered by existing water-quality regulations, and
their effects on the environment or human health are still poorly understood. Wastewater
treatment plants are unable to effectively remove all pharmaceutical active compounds (Petrovic
et al., 2005), and WWTP effluents are an important and continuous source of entry of
pharmaceutical active substances into aquatic ecosystems where may reach concentrations
from ng L-1 to the low µg L-1 level. Even though these concentrations do not have acute toxic
effects on aquatic fauna and flora, can lead to long-term effects by bioaccumulation, as well as
by additive and synergistic effects of mixing different pharmaceuticals.
3.2. Material and methods
Study site - The study was conducted in the Segre River, a tributary to the Ebro River in the
Oriental Pyrenees (NE Iberian Peninsula). The stream system selected for this study was 5 km
long with a drainage area of 287 km2, with a rain-snow fed flow regime. It received the effluent
from the WWTP of Puigcerdà (UTM X: 411856 and UTM Y: 4698346, 31N/ETRS 89) with
30,000 population equivalents. The study site is located at an elevation of 1,108 m a.s.l, and
included riffles and pools through sedimentary and silicate substrata. The average annual
precipitations in the region range between 700 and 1000 mm and the average monthly air
temperatures range from 3ºC to 18ºC. The riparian vegetation of the river segment was well
developed and was mainly composed by deciduous (Alnus glutinosa, Fraxinus excelsior and
Salix alba). The stream watershed comprised of 85% natural vegetation, 11% agriculture, and
3% urban development by land cover.
Analytical methods - Analysis of pharmaceuticals (91 compounds) from several therapeutical
classes (NSAIDs, lipid regulators, diuretic, antihypertensive, psychiatric drugs, β-blockers and
antibiotics) was performed according to the method developed by (Gros et al., 2010). Briefly,
100 mL of water were pre-concentrated on Oasis HLB cartridges (3 cm3, 60 mg; Waters
Corporation, Milford, MA) in a Baker vacuum system (J.T. Baker, Deventer, The Netherlands)
after addition of 3 mL of 1 M EDTA (4%, v/v). Cartridges were further rinsed with 5 mL of high

Assessing and predicting effects on water quantity and quality in Iberian rivers caused by global change (2009-2014). Consolider-Ingenio 2010
CSD2009-00065
6
WP5: PROCESS
performance liquid chromatography (HPLC)-grade water, dried under vacuum for 30 min, and
eluted with 2 3 mL of methanol. Extracts were evaporated to dryness, reconstituted with 1 mL of
methanol–water mixture (10:90, v/v), and fortified with 10 µL of a mixture of internal standards.
Extracts were analysed by a ultra HPLC (UHPLC) using Waters Acquity Ultra-Performance™
(Milford, MA, USA) in tandem with a 5500 QTRAP mass spectrometer equipped with a turbo ion
spray source (Applied Biosystems–Sciex, Foster City, CA, USA). Chromatographic separations
for the compounds analysed under positive electrospray ionization were achieved with an
Acquity UPLC HSS T3 column (50 mm, 2.1 mm i.d., particle size 1.8 lm) with methanol and
HPLC-water with 10 mM ammonium formiate/formic acid (pH = 3.2) as mobile phase. For the
analysis in negative ionization mode an Acquity UPLC BEH C18 column (50 mm 2.1 mm i.d.,
particle size 1.7 lm) was used, with acetonitrile and 5 mM ammonium acetate/ammonia (pH = 8)
as the mobile phase. The target compounds were analysed in multiple reaction monitoring
(MRM) mode, monitoring two transitions between the precursor ion and the most abundant
fragment ions for each compound.
Ecosystem metabolism - Metabolism was calculated for each site (CR, IR1, IR2, IR3 and IR4)
from diel dissolved oxygen (DO) changes by the single-station method (Odum, 1956; Reichert et
al., 2009) using 11 days of base flow conditions. DO and temperature were recorded at 10-min
intervals at the upstream and downstream ends of each reach with optical oxygen probes (YSI
6150 connected to YSI 600 OMS, YSI Inc., Yellow Springs, Ohio, USA). Exchange of DO with
the atmosphere was estimated using a slug additions of mixed tracer solutions (Jin et al., 2012).
Six solutions of propane-saturated water were prepared in the laboratory by filling hermetic 20-L
plastic tanks with 10 L of distilled water and 10 L of 99%-pure propane gas (Linde Industrial
Gases, Barcelona, Spain). The solutions were prepared few days before the additions and
shaken to allow sufficient time for propane to dissolve into the water. A total of 3 slug additions
were performed: the first one covering IR3 and IR4, the second one covering IR1 and IR2, and
the third one covering CR. For each slug addition, two of the propane-saturated water solutions
were added in-situ to 60-L containers filled with a solution of 40 L of stream water with a
measured amount of conservative tracer (chloride, as NaCl). Immediately after mixing, the
solutions were injected into the stream channel approx. 50 m upstream from the first sampling
point to allow for complete lateral mixing. The breakthrough curves of chloride were followed at
each station using a hand-held conductivity meter (WTW, Germany). Five replicate water
samples were collected at the conductivity peak using 60-mL plastic syringes fitted with
stopcocks. After adding 30 mL of air to each syringe, these were shaken for ∼10 min to allow
Assessing and predicting effects on water quantity and quality in Iberian rivers caused by global change (2009-2014). Consolider-Ingenio 2010
CSD2009-00065
7
WP5: PROCESS
equilibration of the propane-gas into the air space. Then, the air space was collected in pre-
evacuated 20-mL glass vials, which were stored in the fridge until analysis on a gas
chromatograph (Thermo Fisher Scientific, CA, USA). Oxygen exchange (k) with the atmosphere
was calculated using the decline in conductivity-corrected propane concentrations between
sampling stations as described by (Jin et al., 2012). Nominal travel time of water (τ, in min) was
calculated measuring the time between the peaks of the 2 breakthrough curves at the upstream
and downstream stations (Kilpatrick & Cobb, 1985). Ecosystem respiration (ER) was calculated
as the sum of net DO production rate during the dark period and respiration values during the
light period, these being calculated as the linear interpolation between the net metabolism rate
values of sunrise and sunset of the nights before and after the day of interest. Gross primary
production (GPP) was the sum of net metabolism rate during the light period and respiration
rates during the light period. Net ecosystem production (NEP) was calculated as the sum of GPP
and ER, and EF as the sum of GPP and ER in absolute values.
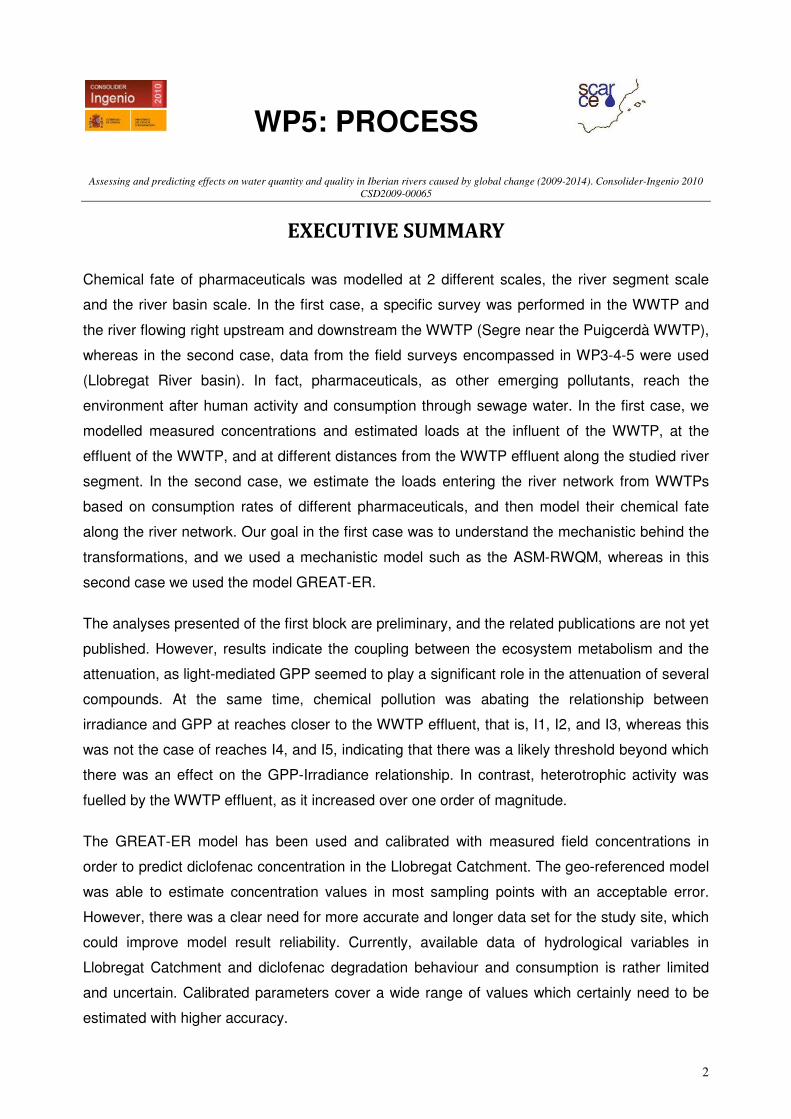
Figure 1. Integrated model for the WWTP-River system, including 10 reactors.
Modelling approach - An integrated model including the WWTP and the river was implemented
(Benedetti et al., 2009) in the software platform SIMBA-MATLAB. A series of completely mixed
reactors was defined to model the hydraulic behaviour of the system. Five reactors were used
for the WWTP (2 anoxic, 2 aerobic, and sludge) and 5 reactors for the river (with the WWTP
effluent discharging between the second and the third) (Figure 1). Biochemical processes were
modelled in the WWTP with the activated sludge model no. 2d (ASM2d)(Henze et al., 2000) and

Assessing and predicting effects on water quantity and quality in Iberian rivers caused by global change (2009-2014). Consolider-Ingenio 2010
CSD2009-00065
8
WP5: PROCESS
in the river with a simplified version of the River water quality model (RWQM no. 1)(Shanahan et
al., 2001), using the parameter values reported (Benedetti et al., 2009). Both models (ASM2d
and RWQM no. 1) include carbon, nitrogen and phosphorus substrates and account for
hydrolysis, growth and decay processes. Furthermore, chemical fate of pharmaceuticals was
also accounted for, thus modelling the fate of the chemical fate of the parental and metabolite
pharmaceutical compounds.
Attenuation rates were additionally calculated assuming first-order processes (Writer et al.,
2011) (Figure 2). The followed Lagrangian approach implies that a specific parcel of water was
sampled as it moved downstream, and this procedure was repeated every 4 hours in order to
grasp the potential diel variation of the first-order decay rates. In fact, attenuation were
expressed as half-life times for each compound.
Figure 2. Linear regression between travel time and the concentration of 4-Hydroxy-Diclofenac
as LN (Ct: C0) along the river segment. The slope of the regression is the first-order decay
constant of the pharmaceutical along the river segment downstream the WWTP.
3.3. Results and discussion
Twenty-two different compounds from seven therapeutical groups were detected in surface
water out of the 91 pharmaceuticals and metabolites analysed (Figure 2). Pharmaceutical
concentrations were higher in the impact sites, and the maximum concentration (considering the
sum of all therapeutic families) occurred in I1 (values up to 2300 ng L-1) (Figure 3). All the
identified therapeutic groups of pharmaceuticals (NSAIDs, lipid regulators, diuretics,

Assessing and predicting effects on water quantity and quality in Iberian rivers caused by global change (2009-2014). Consolider-Ingenio 2010
CSD2009-00065
9
WP5: PROCESS
antihypertensive, psychiatric drugs and b-blockers), except antibiotics, showed the same pattern
of longitudinal decrease of concentrations from I1 to I4 (Figure 3). This pattern was more marked
in the case of the NSAIDs. Among the 7 therapeutic groups of pharmaceuticals detected,
concentrations of the NSAIDs group were the highest in all sampling sites; being up to 3 times
higher in the most polluted sites (I1 and I2) than other groups (Figure 3). High concentrations of
NSAIDs at I1 (1120 ng L-1) decreased gradually in downstream sites reaching up at I4 290 ng L-
1. Ibuprofen and diclofenac occurred in the impact sites but not in the control site, and also
showed a decreasing gradient of pollution from I1 to I4. Moreover, ibuprofen metabolites
occurred at higher concentrations in the impact sites than ibuprofen itself. Up to 192.6, 572.6
and 87.7 ng L-1 were detected in I1 for Ibuprofen, 1-hydroxy-ibuprofen and 1-hydroxy-ibuprofen,
respectively. The levels of the metabolites also decreased from I1 to I4. Overall, among the
identified compounds, none is currently included in the list of priority pollutants by the EU,
though diclofenac is in the list of substances subject to review for possible identification as
priority or priority hazardous substance by the European Water Framework Directive (Directive
2008/105/EC).
C I1 I2 I3 I4
Concentr
ation (
ng L
-1)
0
10
20
30
40
50
60
70
Ibu
pro
fen c
oncentr
ation (
ng L
-1)
0
50
100
150
200
250
300
Carbamazepine
Venlafaxine
Diclofenac
Ibuprofen
Figure 3. Measured concentrations of 4 pharmaceuticals along the study river segment.
GPP values averaged 0.51 g O2 m-2 d-1 in the C reach. It did not increased significantly in the I
reach (Figure 4), but post-hoc Tukey test showed that this increase was significantly higher from
the IR3, increasing 4-fold the GPP values. ER values averaged 3.09 g O2 m-2 d-1 in the C reach
but was higher in the I reach increasing 3-fold in average , but ER decreased with distance from
the effluent (R2=0.15 P=0.006). Overall, there was a clear and sharp increase in ER as a result
of the discharge from the WWTP effluent, whereas this was not the case of GPP, which
remained almost unaltered. However, if considering the available light, there was a fall in the

Assessing and predicting effects on water quantity and quality in Iberian rivers caused by global change (2009-2014). Consolider-Ingenio 2010
CSD2009-00065
10
WP5: PROCESS
slope of the GPP-Irradiance relationships when passing from C to the I reaches, probably as a
consequence of the pollution. This likely production inhibition by the discharge of the WWTP
effluent lessened along the reach, as there was no inhibition by IR3, with GPP-Irradiance slope
similar to those observed in the C reach. The rates of ER were in contrast favoured by the input
of organic matter from the WWTP, and there were no changes in the proportion of heterotrophic
and autotrophic respiration resulting from the discharge of the WWTP effluent.
Figure 4. Average values of Gross Primary Production (GPP), Ecosystem Respiration (ER) and
Heterotrophic Respiration (Rh) in each site along the study river segment.
Attenuation rates determined in both the WWTP and the river were similar to those found in the
same river in a previous study (Acuña et al., 2014), with half-life times ranging from 1.59 to
6.56h. More interestingly, our approach allowed the determination of the attenuation rates along
the diel cycle, and to ascertain which processes (biotransformation, photodegradation, and
adsorption) were driving attenuation in the studied river segment. For example, light mediated
processes (either photodegradation or biotransformation linked to primary producers) seemed to
play a considerable role in the attenuation of most studied compounds (Figure 5). In fact, the
figure shows how maximum half-life times always occur during the night, especially at the end of
the night, whereas minimum half-life times always occur between 10 and 14h. Furthermore, the
figure also shows that variability was higher during the night, whereas it was lower during the
day, so that attenuation was more variable from night to night, but similar from day to day.

Assessing and predicting effects on water quantity and quality in Iberian rivers caused by global change (2009-2014). Consolider-Ingenio 2010
CSD2009-00065
11
WP5: PROCESS
Figure 5. Half-life times of 3 compounds, one parental compound (Ibuprofen) and 2
transformation products (4-Hydroxy-Diclofenac, and 2-Hydroxy-Carbamazepine) during the diel
cycle in the studied river segment.
3.4. Conclusion
The analyses presented here are preliminary, and the related publications are not yet published.
However, these preliminary results indicate the coupling between the ecosystem metabolism
and the attenuation, as light-mediated GPP seemed to play a significant role in the attenuation of
several compounds. At the same time, chemical pollution was abating the relationship between
irradiance and GPP at reaches closer to the WWTP effluent, that is, I1, I2, and I3, whereas this

Assessing and predicting effects on water quantity and quality in Iberian rivers caused by global change (2009-2014). Consolider-Ingenio 2010
CSD2009-00065
12
WP5: PROCESS
was not the case of reaches I4, and I5, indicating that there was a likely threshold beyond which
there was an effect on the GPP-Irradiance relationship. In contrast, heterotrophic activity (ER)
was fuelled by the WWTP effluent, as it increased over one order of magnitude.
4. MODEL AT THE RIVER BASIN SCALE
4.1. Introduction
If the previous section (3) aimed at modelling the chemical fate of pharmaceuticals and the river
segment scale with a mechanistic model, this section aims at modelling the chemical fate of
pharmaceuticals at the river basin scale. In the first case, a specific survey was performed in the
WWTP and the river flowing right upstream and downstream the WWTP, whereas in the second
case, data from the field surveys encompassed in WP3-4-5 were used.
In fact, pharmaceuticals, as other emerging pollutants, reach the environment after human
activity and consumption through sewage water. In the first case, we modelled measured
concentrations and estimated loads at the influent of the WWTP, at the effluent of the WWTP,
and at different distances from the WWTP effluent along the studied river segment. In the
second case, we estimate the loads entering the river network from WWTPs based on
consumption rates of different pharmaceuticals, and then model their chemical fate along the
river network. Given that our goal in the first case was to understand the mechanistics behind
the transformations, we used a mechanistic model such as the ASM-RWQM, whereas in this
second case we used the model GREAT-ER. The goal for the task 5.3 was to model several
pharmaceuticals, analysis were only completed and published for one pharmaceutical,
diclofenac (Aldekoa et al., 2013).

Assessing and predicting effects on water quantity and quality in Iberian rivers caused by global change (2009-2014). Consolider-Ingenio 2010
CSD2009-00065
13
WP5: PROCESS
4.2. Material and methods
Figure 6. The Llobregat Basin with indication of the mainstem and its tributaries, the location of
the three large reservoirs, and the urban land use (black areas). Note that only the biggest cities
are named.
Study site - The Llobregat River is located in NE Iberian Peninsula, draining an area of 4948 km2
and with a mainstem extending 165 km from the Pyrenees to the Mediterranean, with two main
tributaries: the Cardener and Anoia Rivers (Figure 6). The mean discharge at the basin outlet is
19 m3 s−1. Headwaters lie in the Eastern Pyrenees, but soon downstream there are several
sewage treatment plants and industrial effluents (estimated at 4.3 m3 s−1), and potash-mining
activities in the Cardener River. The lower course flows through one of the most densely
populated areas of the Mediterranean region (Barcelona Metropolitan Area, over 3 million
people), receiving large industrial and urban wastewater effluents. The Llobregat River was one
of the most polluted and degraded rivers in Western Europe during the 1980s and the
overexploitation of the underground water led to salinization of the deltaic aquifer, rendering 30%

Assessing and predicting effects on water quantity and quality in Iberian rivers caused by global change (2009-2014). Consolider-Ingenio 2010
CSD2009-00065
14
WP5: PROCESS
of it unusable. Since then, WWTPs with tertiary facilities have been built along the basin, and the
situation has improved drastically. However, the river still receives a considerable amount of a
myriad of contaminants, including nutrients, persistent organic pollutants, brominated flame
retardants, endocrine disruptors, perfluorinated compounds, illicit drugs, and pharmaceuticals.
GREAT-ER model - The GREAT-ER (Geo-referenced Regional Exposure Assessment Tool for
European Rivers) system is an aquatic exposure prediction tool for ‘down-the-drain’ chemicals
within environmental risk assessment schemes developed and validated by ECETOC (European
Centre for Ecotoxicology and Toxicology of Chemicals) (Boeije et al., 1997). The GREAT-ER
model structure involves two basic elements: the discharge points and river stretches, which
were simulated in a stationary way. The discharges represent WWTPs and through these points
the chemical flux was introduced, as mass per time, into the river network. This emission data
was calculated by GREAT-ER considering the attended population (P, capita) by each WWTP
and taking into account the medical consumption (kg per capita and per year) for that area
(Figures 7).
Figure 7. Annual emissions per capita of considered emerging pollutants (note that only
diclofenac was used in this first exercise with GREAT-ER).
Assessing and predicting effects on water quantity and quality in Iberian rivers caused by global change (2009-2014). Consolider-Ingenio 2010
CSD2009-00065
15
WP5: PROCESS
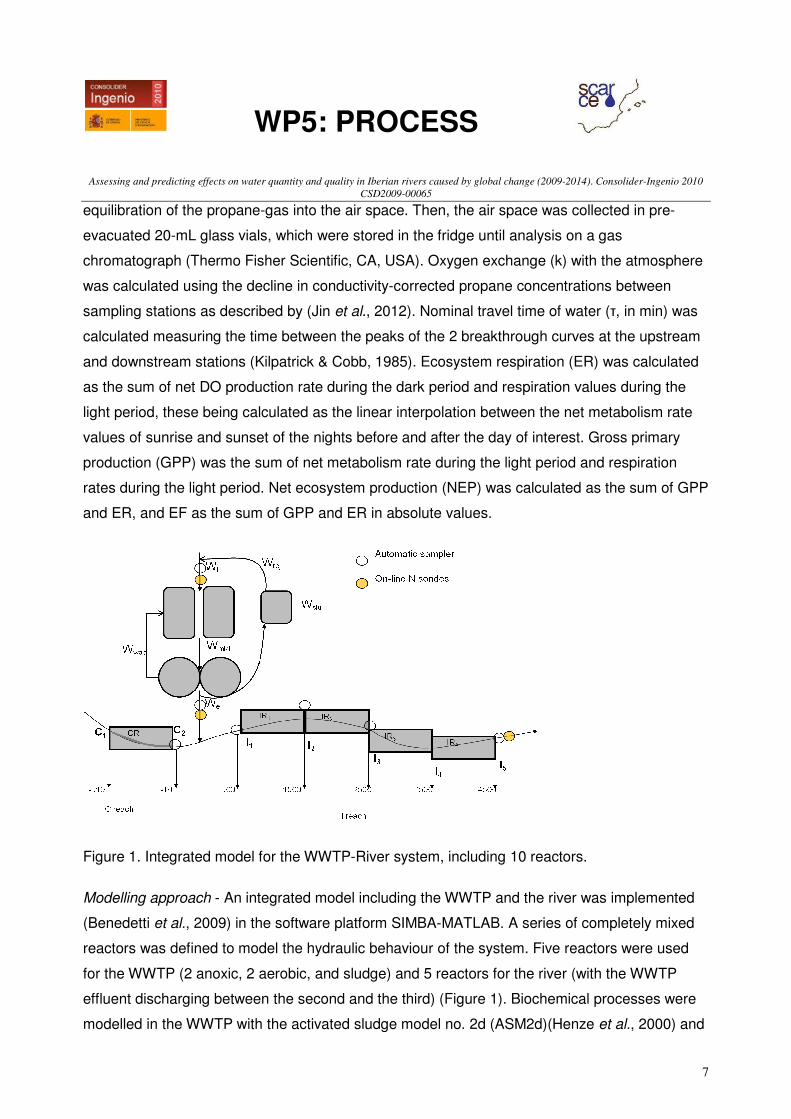
After consumption, diclofenac is degraded in WWTPs following a removal efficiency percentage.
In this first study, we assumed that consumption and degradation were uniform throughout the
river basin. Once the chemical mass is discharged into the water, it is transported through the
river stretches, where an in-stream first order decay model was applied (Figure 8).
Figure 8. River removal rates for the considered emerging pollutants based on a literature review
of ca. 30 studies on chemical fate of emerging pollutants in rivers (note that only diclofenac was
used in this first exercise with GREAT-ER).
Once the mass per time charge has been simulated through the entire river network, GREAT-ER
calculates the concentrations taking into account the water flow of each stretch. Therefore, the
degradation model and the final concentration results depend on the hydrological variables
(water flow and velocity) introduced with the input files. All this procedure represents GREAT-
ER’s deterministic approach, which involves a model where no randomness exists, and thus, it
always produces the same output from a given input.
The model was calibrated using the observed (Figure 9) and predicted diclofenac
concentrations. During the calibration, and according to the literature, a valid interval for the
diclofenac river removal rate was considered between 0.001 and 1.7 h-1 (Figure 8).
Assessing and predicting effects on water quantity and quality in Iberian rivers caused by global change (2009-2014). Consolider-Ingenio 2010
CSD2009-00065
16
WP5: PROCESS
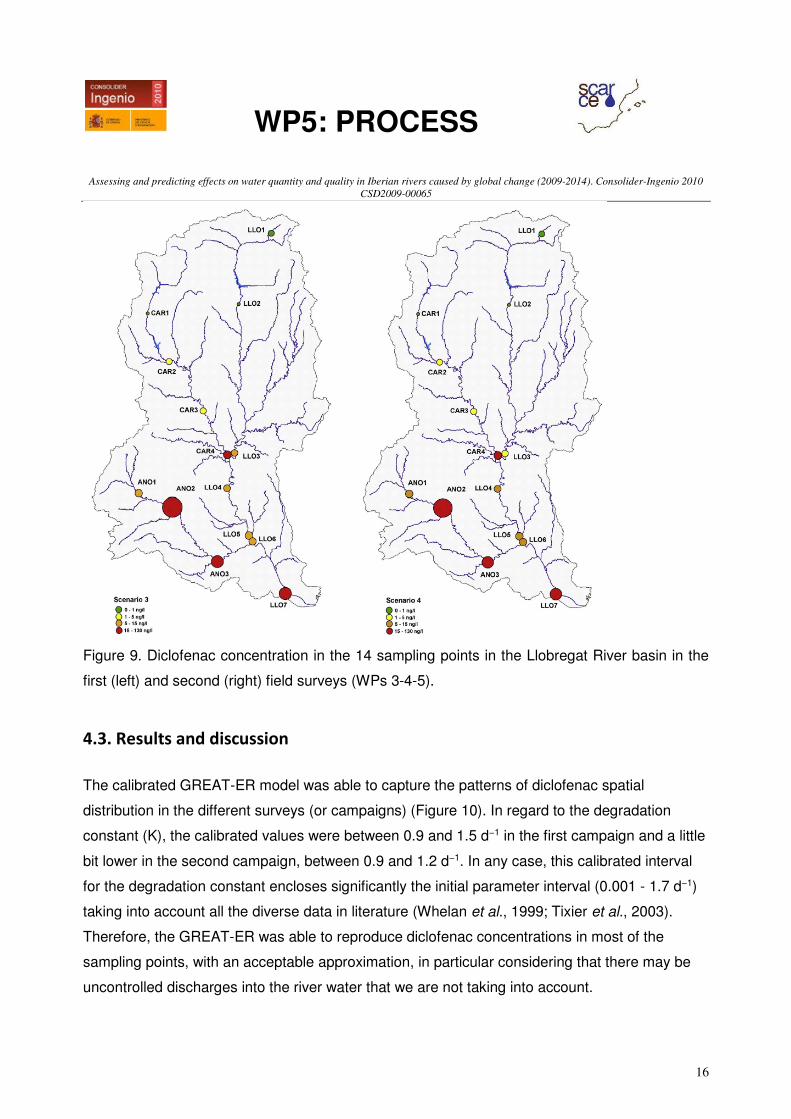
Figure 9. Diclofenac concentration in the 14 sampling points in the Llobregat River basin in the
first (left) and second (right) field surveys (WPs 3-4-5).
4.3. Results and discussion
The calibrated GREAT-ER model was able to capture the patterns of diclofenac spatial
distribution in the different surveys (or campaigns) (Figure 10). In regard to the degradation
constant (K), the calibrated values were between 0.9 and 1.5 d−1 in the first campaign and a little
bit lower in the second campaign, between 0.9 and 1.2 d−1. In any case, this calibrated interval
for the degradation constant encloses significantly the initial parameter interval (0.001 - 1.7 d−1)
taking into account all the diverse data in literature (Whelan et al., 1999; Tixier et al., 2003).
Therefore, the GREAT-ER was able to reproduce diclofenac concentrations in most of the
sampling points, with an acceptable approximation, in particular considering that there may be
uncontrolled discharges into the river water that we are not taking into account.

Assessing and predicting effects on water quantity and quality in Iberian rivers caused by global change (2009-2014). Consolider-Ingenio 2010
CSD2009-00065
17
WP5: PROCESS
Figure 10. Modelled vs. observed diclofenac concentration values in the two sampling surveys.
Note that values were logarithmically transformed to enhance readability, and the transformation
log(x + 1) was applied to include the zero values in the transformed axes.
In addition, it has also to be taken into account that a uniform diclofenac consumption has been
considered all over the catchment area; whereas, variations in the spatial distribution of drug
administration probably exist. Thus, it is more probable urban areas might be associated to high
pharmaceuticals consumption and rural regions to lower consumption rates. Based on these
results, it is clear that relatively simple GREATER model cannot predict exact concentrations, as
it has been mentioned before. Nonetheless, even more complex water quality programs,
accounting for degradation processes in a detailed mechanistic way, are unlikely to provide
better results due to the lack of detailed and geo-referenced input information on industry, illegal
discharges or unknown high temporal variation of consumption in a particular basin.
4.4. Conclusions
The GREAT-ER model has been used and calibrated with measured field concentrations in
order to predict diclofenac concentration in the Llobregat Catchment.

Assessing and predicting effects on water quantity and quality in Iberian rivers caused by global change (2009-2014). Consolider-Ingenio 2010
CSD2009-00065
18
WP5: PROCESS
The geo-referenced model was able to estimate concentration values in most sampling points
with an acceptable error, particularly taking into account the limited information available. The
mean ratio C simulated: measured of the four scenarios varies between 0.9 and 1.6. This means
an improvement comparing to another modelling work carried out in Switzerland with GREAT-
ER model to predict the fate of β-blocker human pharmaceuticals (Alder et al., 2010), where the
resulted ratio was between 1.6 and 2.5. Furthermore, the model was able to predict the spatial
pattern of diclofenac concentration all along the river network.
The GREAT-ER model may be a useful tool to understand the fate of emerging contaminants,
particularly for water quality and water resources management. However, there was a clear
need for more accurate and longer data set for the study site, which could improve model result
reliability. Currently, available data of hydrological variables in Llobregat Catchment and
diclofenac degradation behavior and consumption is rather limited and uncertain. Calibrated
parameters cover a wide range of values which certainly need to be estimated with higher
accuracy.

Assessing and predicting effects on water quantity and quality in Iberian rivers caused by global change (2009-2014). Consolider-Ingenio 2010
CSD2009-00065
19
WP5: PROCESS
5. REFERENCES
Acuña V, von Schiller D, García-Galán MJ et al. (2014) Occurrence and in-stream attenuation of wastewater-derived pharmaceuticals in Iberian rivers. The Science of the total environment.
Aldekoa J, Medici C, Osorio V, Pérez S, Marcé R (2013) Modelling the emerging pollutant diclofenac with the GREAT-ER model : Application to the Llobregat River Basin. Journal of Hazardous Materials, 263, 207–213.
Alder AC, Schaffner C, Majewsky M, Klasmeier J, Fenner K (2010) Fate of beta-blocker human pharmaceuticals in surface water: comparison of measured and simulated concentrations in the Glatt Valley Watershed, Switzerland. Water research, 44, 936–48.
Benedetti L, Prat P, Nopens I, Poch M, Turon C, De Baets B (2009) A new rule generation method to develop a decision support system for integrated management at river basin scale. Water science and technology, 60, 2035–2040.
Boeije G, Vanrolleghem P, Matthies M (1997) A geo-referenced aquatic exposure prediction methodology for “down-the-drain” chemicals. Water science and technology, 36, 251–258.
Brooks BW, Riley TM, Taylor RD (2006) Water quality of effluent-dominated ecosystem: ecotoxicological, hydrological, and management considerations. Hydrobiologia, 556, 365–379.
Feijtel T, Boeije G, Matthies M et al. (1998) Development of a geography-referenced regional exposure assessment tool for European rivers—GREAT-ER. Journal of Hazardous Materials, 61, 59–65.
Gros M, Petrović M, Ginebreda A, Barceló D (2010) Removal of pharmaceuticals during wastewater treatment and environmental risk assessment using hazard indexes. Environment international, 36, 15–26.
Henze M, Gujer W, Mino T, van Loosdrecht MCM (2000) Activated sludge models: ASM1,ASM2, ASM2d and ASM3. Scientific and technical report. IWA Publishing, London, U.K.
Jin SH, White DS, Ramsey JB, Kipphut GW (2012) Mixed Tracer Injection Method to Measure Reaeration Coefficients in Small Streams. Water, Air, & Soil Pollution, 223, 5297–5306.
Kilpatrick FA, Cobb ED (1985) Measurement of discharge using tracers. In: U.S. Geological Survey Techniques of Water- Resources Investigations, p. 52.
Odum HT (1956) Primary Production in Flowing Waters. Limnology & Oceanography, 1, 102–117.
Petrovic M, Hernando MD, Díaz-Cruz MS, Barceló D (2005) Liquid chromatography–tandem mass spectrometry for the analysis of pharmaceutical residues in environmental samples: a review. Journal of chromatography. A, 1067, 1–14.

Assessing and predicting effects on water quantity and quality in Iberian rivers caused by global change (2009-2014). Consolider-Ingenio 2010
CSD2009-00065
20
WP5: PROCESS
Reichert P, Uehlinger U, Acuña V (2009) Estimating stream metabolism from oxygen concentrations: Effect of spatial heterogeneity. Journal of Geophysical Research, 114, 1–15.
Shanahan P, Borchardt D, Henze M, Rauch W, Reichert P, Somlyódy L, Vanrolleghem P (2001) River Water Quality Model no. 1 (RWQM1): I. Modelling approach. Water science and technology : a journal of the International Association on Water Pollution Research, 43, 1–9.
Tixier C, Singer HP, Oellers S, Müller SR (2003) Occurrence and fate of carbamazepine, clofibric acid, diclofenac, ibuprofen, ketoprofen and naproxen in surface waters. Environmental science & technology, 37, 1061–1068.
Whelan MJ, Gandolfi C, Bischetti GB (1999) A simple stochastic model of point source solute transport in rivers based on gauging station data with implications for sampling requirements. Water research, 33, 3171–3181.
Writer JH, Keefe SK, Ryan JN, Ferrer I, Thurman ME, Barber LB (2011) Methods for evaluating in-stream attenuation of trace organic compounds. Applied Geochemistry, 26, S344–S345.