Embed Size (px)
Citation preview

Composite Shuctures 35 (1996) 309-322 Copyright 0 1996 Elsevier Science Ltd
Printed in Great Britain. All rights reserved 0263-8223/96/$15.00
PII:SO263-8223(96)00044-X
Delamination in asymmetrically tapered composites loaded in tension
Michael R. Wisnom, Rachael Dixon & Graham Hill Department of Aerospace Engineering, University of Bristol, University Walk, Bristol BS8 1 TR, UK
Tapered O/f 45” carbon fibre-epoxy specimens with one flat surface were tested in tension. Results were obtained for tapered specimens of similar geometry with O/ +45” and with only +45” discontinuous plies. Tests were also carried out on specimens with plies cut to produce similar dis- continuities, but with &45” fill-in plies to eliminate the tapered geometry. Specimens with discontinuous 0” plies delaminated into the thick section, with very similar results for tapered and untapered geometry. Good predictions of delamination load were obtained with an equation previously developed for symmetric specimens based on the strain energy release rate associated with the discontinuous plies. The asymmetry does not appear to be a critical factor for this type of delamination. Tapered specimens de- laminated into the thin section at lower loads, with the layup of the discontinuous plies having little effect on the behaviour. The driving mechanism is believed to be the straightening out of the outer plies due to the geometry of the taper, with the asymmetry of the specimens having only an indirect effect. Copyright 0 1996 Elsevier Science Ltd.
1 INTRODUCTION
Tapered sections with dropped plies can be very susceptible to delamination. In many practical applications tapers are made asymmetrically in order to maintain a smooth surface on one side. Curry et al. tested asymmetrically tapered composites,’ with the emphasis on com- pression loading. Other experimental studies on tapered sections in tension have been mainly concerned with symmetric tapers.2-9 This paper presents results of an experimental investigation of delamination in asymmetrically tapered car- bon fibre composites with O/ + 45” layups loaded in tension.
Research at Bristol University on symmetri- cally tapered specimens has highlighted the importance of delamination into the thick sec- tion.’ In the previous study, comparisons were made between tapered specimens with dropped plies and similar geometry specimens with the change in thickness produced with low stiffness fill-in material. Results were also compared between tapered and untapered sections with the same discontinuous plies. It was concluded
that the strain energy release rate associated with the discontinuous plies was the critical factor controlling delamination into the thick section, with the effect of the tapered geometry being of secondary importance. In the present study a similar systematic approach has been pursued to understand the effects of the tapered geometry and the stiffness of the dis- continuous plies for asymmetrically tapered sections.
Three different types of specimen have been tested, as shown schematically in Fig. 1. The first is the basic configuration, tapered from a nominal thickness of 4 mm down to 3 mm with a single block of dropped plies. The second is a similar geometry tapered spec- imen with the block of discontinuous plies made up of only low stiffness +45” material. The third type is a constant thickness spec- imen with the same block of discontinuous plies as the original taper, but with fill-in plies to maintain the thickness. A series of tension tests was carried out on each specimen type and the delamination behaviour studied in detail.
309

310 M. R. Wisnom, R. Dixon, G. Hill
i___________________-----------_i 0 0 0 0 + +
a) SPECIMEN TYPE 1
;: +I-
A ii 0 0 + +
bl SPECIMEN TYPE 2
0’ + 0
0 + iL_----------------____________ji
c) SPECIMEN TYPE 3
Fig. 1. Specimen configurations tested.
2 EXPERIMENTAL
2.1 Configurations investigated
Specimens were made up from blocks of eight plies each consisting of the layUp (04/ + 45J - 4&). The basic configuration of interest is a transition from four to three blocks, with one block of dropped plies. This gives a taper from 32 plies down to 24 with a nominal thickness change from 4 to 3 mm. The layup in the thick section from the top surface to the bottom surface is (-45,/+45,/O,)/ (04/+45&452)/(-45J +45,/0,)/(0,/-45*/ -45.J where the bar denotes the dropped plies. The bottom surface is flat, with the taper all on the top surface. Figure l(a) shows the config- uration.
The thick section is symmetric about the mid- plane, with no tendency to bend under tensile loading. However, the thin section is unsym- metric, giving rise to coupling between tensile loading and bending.
The second configuration is similar, with the same number of plies, but with the block of (OJ + 456 - 452) dropped plies replaced by a block of ( + 45/-45), plies. This results in a thick section layup of (-45,/+45d 0,) / ( +45 / - 45)4/(-45J +45,/0,)/(04/+45,/ -45,). Figure l(b) shows the configuration.
The reason for choosing this layup was to investigate the effect of reducing the disconti- nuity due to the dropped plies whilst keeping the geometry the same. The stiffness of this block of dropped plies is much lower than for the original configuration due to the absence of 0” plies. The load carried by the discontinuous plies will, therefore, be less, resulting in a less severe discontinuity at the ply terminations. Although the overall geometry is nominally the same, both thick and thin sections are now unsymmetric.
The final configuration has the same dropped ply arrangement as the original one, but without the taper. The thick section layup and the block of dropped plies from the original configuration are retained, but the taper has been eliminated by placing fill-in )45” plies beyond the dropped plies, as shown in Fig. l(c). The layup corre- sponding to the original thick section is ( - 45,/+ 45,/0,)/(04/ + 45,/- 45,) /( - 45, / + 45, / O,)/(OJ + 45+45J, and the layup on the other side of the dropped plies is (-45,/+45,/O,)/ ( + 45/ - 45),)/( - 45*/ + 45,/0,)/(0,/ + 45,/ - 45,). This is also the same layup as on the thick section of the second configuration.
The reason for selecting this layup was to investigate the effect of the discontinuous plies independent of the geometrical effect of the taper. Although the thickness has been kept constant, there will still be some tension-bend- ing coupling since the section with the fill-in plies is unsymmetric.
2.2 Specimen manufacture
All specimens were manufactured from the same batch of Fibredux T300/914C unidirec- tional pre-preg tape. Separate panels were made for each configuration. Material was laid up on a flat plate, with a vacuum applied at every three plies to ensure good consolidation. Care was taken to line up the ends of the dis- continuous plies as closely as possible. Continuous plies were then laid straight on top. No top tooling was used, and so the precise geometry of the taper was not controlled. The plates were cured according to the manufac- turer’s instructions in a press-clave at 180°C.
Plate thicknesses were somewhat greater than the nominal dimensions, but variation from specimen to specimen was minimal. The thick sections were between 4.98 and 5.15 mm, with averages of 5.10 mm for type 1, and 5.05 mm

Delamination of asymmetrically tapered composites 311
Fig. 2. (a) Cross-section of specimen type 1. (b) Cross-section of specimen type 2. (c) Cross-section of specimen 1 ype 3.

312 M. R. Wisnom, R. Dixon, G. Hill
for type 2 and both ends of type 3. The thin sections were between 3.69 and 3.86 mm, with an average of 3.81 and 3.80 mm for types 1 and 2.
Specimens, 240 mm long and 25 mm wide, were cut from the plates with a diamond wheel. To investigate the effect of width, some speci- mens of the basic configuration 10 and 40 mm wide were also prepared.
Figure 2 shows the cross-sections of the dif- ferent specimen types. For the two tapered configurations a triangular resin-rich pocket about 2.5 mm long can be seen in front of the dropped plies. There is a tendency for the ends of the terminated plies to be slightly com- pressed. The plies underneath have also been disturbed, and are no longer completely straight. In all cases the ends of the eight dis- continuous plies line up very well. No voids were observed in this area.
Specimens were numbered with a digit indicating configuration 1, 2 or 3, and a suffix to identify the particular specimen. For config- uration type 1, a second plate was made in exactly the same way as the first one. Specimens from the second plate are identified by a letter suffix.
2.3 Testing procedure
Aluminium alloy tabs 50 mm long were bonded to each specimen. An extra thickness of tab material was included on the outside of the thin ends of the tapered specimens in order to build them up to about the same total thickness.
Strain gauges 3 mm long were attached to the specimens. Gauges were placed in the centre on both surfaces in order to be able to monitor the bending and axial strain. Pairs of gauges were located on both sides of the drop, on flat por- tions of the surface between 10 and 20 mm from the end of the discontinuous plies.
The specimens were not completely flat. This was due to a slight bowing of the plate on which they had been cured. Residual stresses due to the unbalanced layups might also have contrib- uted. When the specimens were gripped in the hydraulic test machine, there was some bending, and a small amount of axial load was applied. Surface strains measured at the gauges were of the order of a few hundred microstrain and the effect of this small amount of bending was not believed to be important. The strain gauge readings were zeroed with the specimens out of
the machine, and were not reset after they were clamped.
The specimens were loaded under displace- ment control at a rate of 05 mm/min. Strains, load and cross-head displacement were logged on a computer. Specimens were observed closely during the tests for signs of delamina- tion. Most tests were stopped after de- lamination occurred, but at least one specimen of each type was loaded until ultimate failure. Figure 3 shows the specimen arrangement and nominal dimensions.
Some fatigue tests were also undertaken on specimens of the first type. These were done under load control at a rate of 2 Hz with a peak load of 20 kN and an R ratio of minimum to maximum load of 0.1.
3 RESULTS
3.1 Specimens of type 1
3.1.1 Initial delamination As the specimens were loaded, some bending was visible. At a certain point a transverse crack appeared in the resin pocket at the end of the discontinuous plies. Shortly afterwards, delami- nation into the thin section was observed. It appeared to start at the bottom of the trans- verse crack, and propagated quite rapidly to a length of about 25 mm. The precise load at which delamination initiated was hard to judge accurately either visually or from the experi- mental measurements. There was no drop in load, and only a slight change in slope in the load against cross-head displacement response, as can be seen in Fig. 4. There was a much more noticeable change in the slope of the strain gauge against load responses for the gauges in the thin section. The slope for the gauge on the top surface reduced, whilst for the gauge on the bottom surface it increased slightly, as seen on Fig. 5. The gauges in the thick section showed little change. On further loading the delamination opened up, making it
I= 50 70 70 I 50 -25-
Fig. 3. Specimen dimensions (mm, not to scale).

Delamination of asymmetrically tapered composites 313
0 IOCJO
s 600
4 600
400
200
0
0.4 0.6 0.6
Cross-head displacement (mm)
1 1.2
Fig, 4. Load-deflection response for specimen l-l.
6004
7060
6OCQ
-200 -1000
1600 - 1800
--I
2OOa
Load (N/mm)
Fig. 5. Strain gauge readings for specimen l-l.
more visible. The thin section strain gauge read- ing changed significantly as a result of the change in bending behaviour as the delamina- tion propagated. Since the initial onset of delamination was such a subtle event, it is possi- ble that it would have been missed if the specimen had not been strain gauged or observed very closely during the test.
Delamination loads were determined from the change in slope of the strain gauge against load response. This method was more sensitive than using the change in slope of the cross-head displacement against load response, and less subjective than taking the loads when delamina- tion was observed. This load was used together with the average width of each specimen to calculate the delamination load per unit width. Values are shown in Table 1, together with the corresponding readings from the strain gauges in the thin section. The mean load was 966 N/mm.
Figure 6 shows schematically a typical initial delamination. The dominant crack was in a dif- ferent position on each side of the specimen. On one side it was between the 0” and +45” plies, whilst on the other it was between the
+ 45” and -45” plies. The location of these cracks was consistent on all the specimens. Going further away from the drop, there was a tendency for them to move nearer to the neu- tral axis of the thin section. Some of the delaminations between + 45” and -45” plies moved to the +45”/0” interface, whilst in some cases the cracks on the other side between the 0” and +45” plies moved slightly into the block of 0” plies. Vertical cracks could be seen in the resin pocket, with a small amount of delamina- tion into the thick section in some cases. Additional delamination cracks were also visible above the resin pocket on some specimens.
3.1.2 Fatigue tests The maximum applied load based on the aver- age width was 776 N/mm, corresponding to 80% of the mean static delamination load. Under cyclic loading, delamination appeared quite quickly, and propagated steadily into the thin section. The locations of the cracks were similar to those observed in the static tests. The rate of propagation varied from specimen to specimen. After between about 1000 and 6000 cycles the amount of delamination was between about 2 and 20 mm.
3.1.3 Further static loading One of the static specimens was loaded well beyond the initial thin section delamination. The load continued to increase until delamina- tion into the thick section initiated. No strain gauges were fitted on this specimen, but it is estimated that delamination started at about 1630 N/mm.
As the loading was continued, at 1976 N/mm the delamination suddenly propagated into the thick section right up to the tabs. At this point the load dropped sharply. It then gradually recovered and increased to a value of 2589 N/ mm, at which point failure occurred with extensive fibre fracture. Figure 7 shows the complete load against cross-head displacement response.
Further static tests were also undertaken on the specimens which had been previously fatigue loaded. The thin section delamination produced by the fatigue loading was very similar to that from static loading. It is, therefore, believed that further loading of the static and fatigue specimens should be directly compara- ble. This was confirmed by the similar behaviour obtained. Firgure 8 shows the load

314 M. R. Wisnom, R. Dixon, G. Hill
Table 1. Summary of results for thin section delamination of type 1 specimens
Specimen
l-l l-2 l-4 l-5
Mean C.V. (%)
Loadhvidth (N/mm)
937 922 988
1018
966 4.6
Thin section strain Distance of (microstrain) gauge from
Top Bottom drop (mm)
4450 2300 15 4525 2150 4850 2325 :: 5150 2400 15
4740 2290 6.8 4.6
~~~~~~ ;~l&EEf t_____,___________2__--------- ; o_------_______---------------
Crack lengths in mm (not to scale)
Fig. 6. Thin section delamination of specimen type 1.
against strain response for a specimen with a few mm of initial thin section delamination, which compares closely with Fig. 5 for a specimen loaded only statically. The load- displacement responses were also very similar.
Loads for the initiation of thick section dela- mination were estimated based on the change in slope on the load-strain response. Loads for delamination propagation were also determined based on the maximum values prior to the sharp drop in load. These results are shown in Table 2. The propagation loads correspond to a definite and easily identifiable event, and so are less subjective than the initiation loads. Strains in the thick section are also given. The strains on the top surface at propagation show large
variability. This is because of differences in the amount of stable thick section delamination that occurred before propagation. It can be seen on Fig. 8 that the top surface strain increa- ses greatly just before the load drops. However, in other cases, and especially for specimen l-C, there was much less increase in strain just before propagation. At initiation of delamina- tion, the strains for different specimens are more comparable.
Figure 9 shows a typical thick section delami- nation. The whole block of discontinuous plies has sheared out, with the delamination extend- ing all the way to the tabs. The upper crack was between the continuous and discontinuous 0” plies on both sides of the specimen. The lower

Delamination of asymmetrically tapered composites 315
crack was between the 0” and +45” plies on both sides of the specimen towards the tabs, but the positions differed from side to side closer to the drop.
During the static loading of the fatigued specimens, some further delamination into the thin section was also observed. This appeared to occur at similar loads to the thin section dela- mination in the original static tests. However, the difficulty of distinguishing between the opening up of existing delamination and further propagation made it hard to judge the load
3000 1 2500 --
P 2000 --
i 1500 --
5 TOO0 --
500 -_
07
0 0.5 1 1.5 2 2.5 Cm disphement (mm)
Fig. 7. Load-deflection response for specimen l-3.
IJA I-) Figure 11 shows the delamination schemati- Fig. 8. Strain gauge readings for specimen 1-E. cally. The positions of the dominant cracks in
--I
2wa
accurately. The final length of thin section dela- mination was about 25 mm, similar to that obtained in the initial static tests.
3.1.4 Specimens of diflerent widths One specimen of type 1 with a width of 40 mm and three specimens of width 10 mm were also tested. Table 3 shows the delamination loads estimated from the change in slope of the strain gauge-load response. The wide specimen behaved very similarly to the previous ones. However, the narrow ones showed a much more rapid change in strain, consistent with more sudden delamination propagation. These speci- mens were also stronger than the original ones. The locations of the delaminations were the same for all three widths.
3.2 Specimens of type 2
32.1 Initial delamination These specimens initially behaved very similarly to those of type 1. Bending could be seen fol- lowed by delamination into the thin section. The load-strain response shown in Fig. 10 is similar to that in Fig. 5, although with less bending and less difference between thin and thick section strains due to the lower stiffness of the dropped plies. Table 4 shows the loads at which delamination occurred, estimated from the change in slope of the load-strain gauge response. The mean value was 902 N/mm. Due to minor differences in the flatness of the speci- mens, the strain gauges in the thin section were not attached at the same locations and so are not strictly comparable. However, the strains are quite similar, and for convenience an aver- age value is still shown in the table.
Table 2. Summary of results for thick section delamination of type 1 specimens
Specimen Delamination load (N/mm)
Initiation Propagation
Thick section microstrains Distance of Initiation Propagation gauge from
Top Bottom Top Bottom drop (mm)
l-3 1976 1-c* 1537 1725 3200 5525 4525 6400 15
l-E* 1696 1830 3700 5950 6500 7025 l-F* 1716 1830 3700 5900 6800 7175 :: l-G* 1552 1765 3275 5600 5675 6975 15
Mean 1625 1825 3470 5740 5875 6890 C.V. (%) 5.8 5.2 7-8 3.7 17.3 4.9
* Previously fatigued.

316 M. R. Wisnom, R. Dixon, G. Hill
Crack lengths in mm (not to scale)
Fig. 9. Thick section delamination of specimen type 1.
Table 3. Thin section delamination of different width type 1 specimens
Specimen Width Load/width
(mm) (N/mm)
1-I 10 1022 1-J 10 1093 1-K 10 1283 1-H 40 993
l-1,2,4,5 mean 25 966
-2
Load (N/mm)
Fig. 10. Strain gauge readings for specimen 2-4.
the thin sections on both sides were the same as for the type 1 specimens. For both types, the locations were different on the two sides, and were consistent from specimen to specimen.
There was a tendency for the delamination to move towards the neutral axis as it propagated further, as observed on the type 1 specimens. On one side some of the delaminations between + 45” and -45” plies jumped to the + 45”/0” interface, whilst in some cases the cracks between the 0” and +45” plies moved into the block of 0” plies. Some additional delamination cracks were also visible just above the resin pocket.
Figure 12 is a photograph of a delaminated specimen whilst still under load. The photo- graph shows the straightening up of the specimen and the opening up of the delamina- tion. Specimens of type 1 after thin section delamination looked very similar.
3.2.2 Further loading Two tests were continued past the point of thin section delamination. At higher loads there was a small amount of further non-linearity, and then catastrophic failure with fibre fracture at loads of 2331 and 2391 N/mm. In neither case was there any drop in load such as had occurred with the specimens of type 1 when delamination propagated into the thick section. In the first test it was thought that there may have been some delamination into the thick section. The

Delamination of asymmetrically tapered composites 317
Table 4. Summary of results for thin section delamination of type 2 specimens
Specimen
2-1 2-3 2-4 2-5
Mean C.V. (%)
Loadbvidth (N/mm)
864 884 906 952
902 4.2
Thin section strain Distance of (microstrain) gauge from
Top Bottom drop (mm)
3775 2150 15 3750 2475 20 3850 2600 20 4300 2500 15
3920 2430 - -
Crack lengths in mm (not to scale)
Fig. 11. Thin section delamination of specimen type 2.
Fig. 12. Delaminated specimen type 2 under load.
second one was, therefore, stopped at a load of 2094 N/mm and the specimen was removed from the test machine for inspection. No sig- nificant delamination into the thick section could be seen. The specimen was then put back and loaded to failure. Figure 13 shows the load-displacement response for the first speci- men loaded continuously to failure.
3.3 Specimens of type 3
These behaved rather differently from the pre- vious specimens. The response was more linear, with less bending, and delamination initiating at considerably higher loads. Delamination occur- red only in the section corresponding to the thick section of the basic configuration. As
318 M. R. Wisnom, R. Dixon, G. Hill
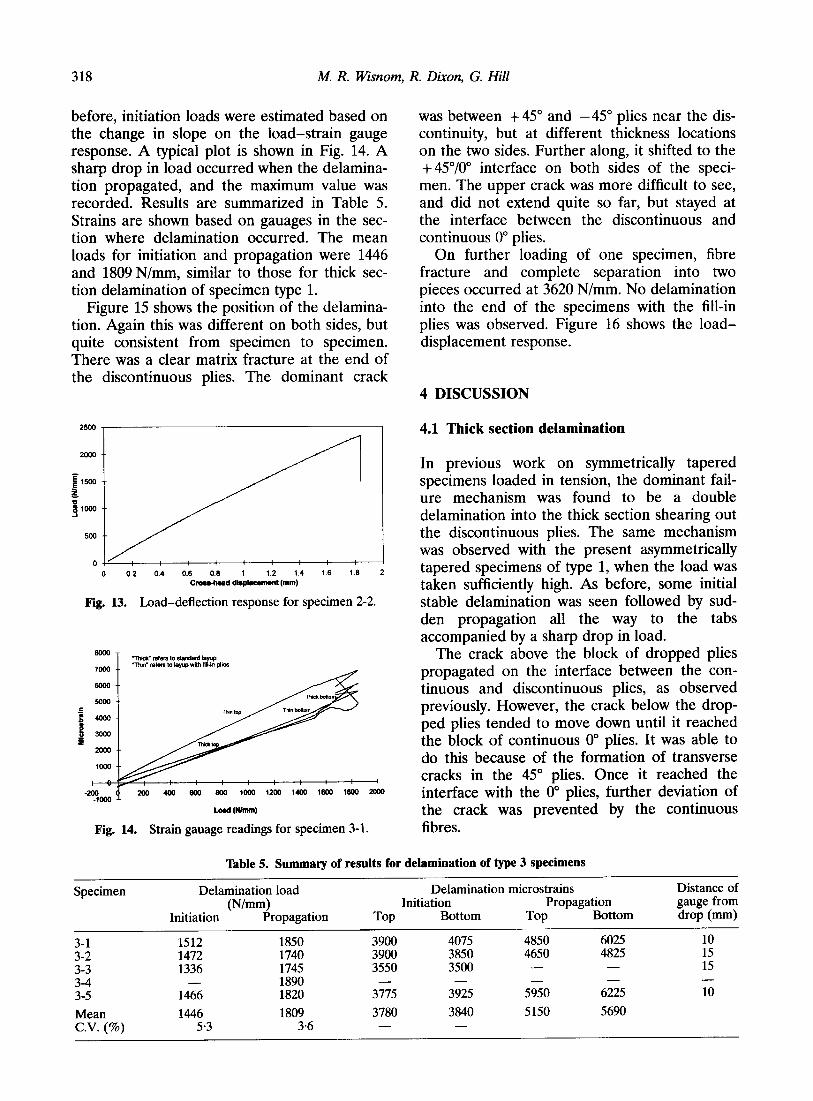
before, initiation loads were estimated based on the change in slope on the load-strain gauge response. A typical plot is shown in Fig. 14. A sharp drop in load occurred when the delamina- tion propagated, and the maximum value was recorded. Results are summarized in Table 5. Strains are shown based on gauages in the sec- tion where delamination occurred. The mean loads for initiation and propagation were 1446 and 1809 N/mm, similar to those for thick sec- tion delamination of specimen type 1.
Figure 15 shows the position of the delamina- tion. Again this was different on both sides, but quite consistent from specimen to specimen. There was a clear matrix fracture at the end of the discontinuous plies. The dominant crack
2503 , I 4.1 Thick section delamination
2oa --
0 -- E 1560
2
+C _-
500 --
oJ/ : I 0 0.2 0.4 0.6 0.6 1 1.2 1.4 1.6 1.6 2
Crou-had dbpbcement (mm)
Fig. 13. Load-deflection response for specimen 2-2.
L-d(-)
Fig. 14. Strain gauage readings for specimen 3-1.
was between + 45” and -45” plies near the dis- continuity, but at different thickness locations on the two sides. Further along, it shifted to the +45”/0” interface on both sides of the speci- men. The upper crack was more difficult to see, and did not extend quite so far, but stayed at the interface between the discontinuous and continuous 0” plies.
On further loading of one specimen, fibre fracture and complete separation into two pieces occurred at 3620 N/mm. No delamination into the end of the specimens with the fill-in plies was observed. Figure 16 shows the load- displacement response.
4 DISCUSSION
In previous work on symmetrically tapered specimens loaded in tension, the dominant fail- ure mechanism was found to be a double delamination into the thick section shearing out the discontinuous plies. The same mechanism was observed with the present asymmetrically tapered specimens of type 1, when the load was taken sufficiently high. As before, some initial stable delamination was seen followed by sud- den propagation all the way to the tabs accompanied by a sharp drop in load.
The crack above the block of dropped plies propagated on the interface between the con- tinuous and discontinuous plies, as observed previously. However, the crack below the drop- ped plies tended to move down until it reached the block of continuous 0” plies. It was able to do this because of the formation of transverse cracks in the 45” plies. Once it reached the interface with the 0” plies, further deviation of the crack was prevented by the continuous fibres.
Table 5. Summary of results for delamination of type 3 specimens
Specimen
3-l
3-2 3-3
3-4 3-5
Mean C.V. (%)
Delamination load
(N/mm) Initiation Propagation
1512 1850
1472 1740 1336 1745
1466 1890 1820
1446 1809 5.3 3.6
Delamination microstrains Distance of Initiation Propagation gauge from
Top Bottom Top Bottom drop (mm)
3900 4075 4850 6025 10
3900 3850 4650 4825 3550 3500 - - ::
3775 3925 5950 6225 lo
3780 3840 5150 5690 - -

Delamination of asymmetrically tapered composites 319
I
I I:
; 0 +
+ 0 ___--________------------ 0 ____________________--___ +
Crack lengths in mm (not to sate)
Fig. 15. Delamination of specimen type 3.
04’ : I I 0 0.5 1 1.5 2 2.5 3 3.5 4
Crcsr-head disk (mm)
Fig. 16. Load-deflection response for specimen 3-4.
It has been shown’ that thick section delami- nation in a symmetrically tapered specimen loaded in tension can be predicted using a sim- ple equation for the strain energy release rate:
P2t G=
4Eh(h -t) (1)
where P is the load per unit width, h is the total thickness, t is the thickness of discontinuous plies and E is Young’s modulus. The equation gives the constant value of strain energy release rate obtained after a short length of propaga-
Table 6. Material properties for T300/914
Fibre direction modulus (GPa) 135.2 Transverse modulus (GPa) 9.0 Shear modulus (GPa) 4.875 Poisson ratio 0.3
tion of cracks above and below the terminated plies. In an asymmetrically tapered specimen there is also bending present. However, it can be shown by finite element analysis, accounting for non-linear geometrical effects, that the same constant value of strain energy release rate is obtained, provided the specimen is sufficiently long. This is because the local stress field asso- ciated with the bending simply translates along the specimen as the delamination propagates, and so does not contribute to the strain energy release rate.
Using laminated plate theory and the mate- rial property data in Table 6, an effective in-plane modulus for the (OJ + 45d -45,) layup of 77-l GPa was calculated. Taking this value and the average thin and thick section thick- nesses for specimens of type 1 of 3.81 and 510 mm enables the strain energy release rate to be calculated. Equating it with the mode II

320 kl. R. Wisnom, R. Dixon, G. Hill
propagation fracture energy of O-664 N/mm” gives a predicted delamination load of 1756 N/mm, 3.8% lower than the measured propagation load of 1825 N/mm. The calcula- tion assumes delamination of the discontinuous plies only, ignoring the shift in lower crack loca- tion through the 45” plies. However, this would only have a small effect due to the low stiffness of the 45” plies.
The delamination obtained with specimen type 3 is very similar to the thick section dela- mination of type 1. Delamination propagated suddenly all the way to the tabs, with a sharp drop in load, and the location of the cracks was also similar. The average propagation load of 1809 N/mm is less than 1% different from that for thick section delamination of specimens of type 1.
Since failure occurred by the shearing out of the same block of discontinuous plies, eqn (1) gives the same predicted delamination load. For this case the prediction is even closer to the experimentally measured value, with a differ- ence of only 3.1%.
Similar comparisons have previously been made between specimens with the same discon- tinuous plies, with and without a taper.’ A large increase in delamination stress was found for the specimens with the taper, and this was attributed to the effect of through thickness compressive stresses induced by the tapered geometry. The main reason this effect was not observed in the present tests is thought to be because of the thin section delamination that occurred at first. This meant that the curved plies over the taper straightened up, relieving the through-thickness compressive stresses, and making the geometry more similar to the con- stant thickness specimens. Another point is that the delamination stress is relatively low as a result of the thick block of dropped plies. Through thickness compressive stresses are, therefore, also low, and so would be expected to have a lesser effect anyway. A further factor is that although the type 3 specimens are of con- stant thickness, there is still a step down in the neutral axis location at the discontinuity, and so some through-thickness compressive stresses would also arise in this case.
Specimens of type 2 did not delaminate into the thick section as the low stiffness of the +45” fill-in plies meant that there was insuffi- cent energy available to propagate the cracks. Calculations based on an extension of eqn (1)
using laminated plate theory indicated that no thick section delamination would be expected until well beyond the ultimate failure load of the specimens.
The behaviour of all three types of specimen is, therefore, consistent with previous results. The asymmetry does not appear to have a sig- nificant effect on thick section delamination, and the methods developed previously for pre- dicting this type of delamination can equally be applied to symmetrically and asymmetrically tapered composites.
4.2 Thin section delamination
The major difference between the delamination behaviour of the present specimens and the symmetric ones tested previously is the occur- rence of delamination into the thin section at a considerably lower load than the thick section delamination. This was observed for both speci- mens type 1 and 2, at very similar loads and similar locations. No delamination of this kind occurred on the constant thickness type 3 speci- mens. It is, therefore, concluded that it is the tapered geometry that is responsible for delami- nation into the thin section.
The effect of thin section delamination is less severe than thick section delamination. It only produces a relatively small and gradual change in stiffness, with no drop in load. This is in marked contrast to the sharp drop in load and more significant change in stiffness for thick section delamination. The thin section delami- nation stopped after about 25 mm propagation, whereas the thick section delamination propa- gated all the way to the tabs. Although further delamination may not occur under tensile load- ing, it is likely to propagate under compression. Also, delamination near the mid-plane would reduce the buckling load. Thin section delami- nation would therefore be unacceptable if significant compressive loads had to be carried. The low strains at which delamination occurred are of concern because they are less than typical allowable design strains.
High stresses arise in the resin pocket in front of the dropped plies. In particular, large through-thickness tension stresses occur near the tip of the pocket as a result of the taper angle, and these can cause initiation of delami- nation. However, sufficient energy is also required for the delamination to propagate. Ini- tially it was thought that asymmetry of the

Delamination of asymmetrically tapered composites 321
specimen geometry might be the main factor providing energy to drive this thin section dela- mination. There is considerable bending induced by the large displacement effect as the whole specimen tries to straighten out to mini- mize the offset between the neutral axes in the thick and thin sections. Thin section delamina- tion effectively splits the specimen into two, greatly reducing its bending stiffness and, there- fore, providing a release of strain energy. However, preliminary finite element analysis indicated that this effect is of secondary impor- tance. The mechanism driving the thin section delamination is mainly the straightening out of the outer plies. There is considerable bending in these plies, and substantial interlaminar shear stresses due to the angle between the plies and the loading direction. The redistribution of stresses due to this straightening out provides most of the strain energy release rate.
As the delamination propagates, the tendency of the plies to further straighten out is dimin- ished. Hence the strain energy release rate reduces, and would eventually drop to zero if the specimen was sufficiently long. The decrease in energy release rate with crack length explains why thin section delamination only propagates a certain distance and then stops. In contrast, fur- ther thick section delamination releases more energy as more of the discontinuous plies are unloaded. The energy release rate reaches a constant value, and propagation can continue unimpeded.
Thin section delamination under static ten- sion has also been reported for symmetrically tapered specimens.3,6 This supports the conten- tion that it is not primarily the asymmetry that is responsible for this type of delamination. However, the question arises as to why similar delamination was not observed in previous tests undertaken at Bristol University.8” Further investigation is needed to explain this fully, but some likely reasons can be identified. The angle of the taper is clearly an important parameter, with the local stresses and the strain energy release rate both increasing with increasing angle. The maximum angle in front of the drop- ped plies in the specimens tested here was around 20”, considerably higher than the values of 4-12” in previous tests.8,p The reason for the high angle is because of the large number of plies dropped together. This is exacerbated by the asymmetric geometry, which means that all the taper has to be taken up on one side. The
degree of consolidation in the region just in front of the dropped plies is also likely to be very important. In previous tests, additional till- in plies were placed on the outside of the release cloth, with a flat plate on top. This arrangement forced the plies together, helping to ensure good consolidation in the tapered region. The specimens tested here were cured with no top tooling, and it is possible that poorer consolidation or higher voidage local to the dropped plies contributed to early initiation of delamination.
4.3 Edge effects on delamination
Similar delamination behaviour and load per unit width was obtained for the specimen of width 40 mm as for those of 25 mm. Specimens 10 mm wide had delamination loads between 6 and 33% higher than the 25 mm wide ones. Once they did delaminate, propagation occur- red more rapidly. Very high interlaminar stresses can arise at the free edge of a laminate subjected to in-plane loading. For narrow speci- mens, any edge effects would exist over a much larger proportion of the width and, therefore, might be expected to have a greater effect. The fact that higher loads per unit width were obtained suggests that edge effects are not crit- ical. Although high interlaminar stresses may be present locally near the edge, the strain energy release rate due to delamination from the drop- ped plies is much larger than that due to delamination from the free edge. The delamina- tion is therefore driven primarily by the dropped plies.
The higher loads per unit width for the nar- row specimens, coupled with the more sudden delamination suggest that the loading across the width may actually have been more uniform than for the wider specimens. A possible expla- nation is the effect of anticlastic bending. This could lead to non-uniformity of in-plane stres- ses across the width, and would be worthy of further investigation.
Interlaminar stresses at the free edge may still have influenced the particular interfaces at which delamination occurred. Edge effects might, therefore, be responsible for the differ- ent crack locations observed on different sides of the specimens. Alternatively this could have been caused by asymmetry due to the unsym- metric layups.

322 M. R. Wisnom, R. Dixon, G. Hill
4.4 Fatigue loading
Failure mechanisms in fatigue were found to be very similar to those under static loading. This is consistent with other results for delamination of symmetrically tapered specimens.‘,” It has been found that when cyclic loads are normal- ized with respect to the static delamination loads, similar delamination rates are obtained for different materials and specimen geome- tries.” Extrapolation of this data for a maximum load of 80% of the static value gives a delamination rate of the order of 10W3 mm/ cycle, consistent with the preliminary fatigue results obtained here.
5 CONCLUSIONS
Asymmetrically tapered specimens showed similar thick section delamination failure mechanisms to previously tested symmetric specimens. Failure occurred by shearing out of the whole block of discontinuous plies, accom- panied by a sharp drop in load. Tapered and untapered specimens with the same block of discontinuous plies delaminated at similar loads, showing that it is the discontinuity due to the terminated plies which is critical rather than the specimen geometry. This is confirmed by the absence of thick section delamination in tapered specimens with the same geometry, where the dropped plies consisted of low stiff- ness +45” fill-in plies. Good predictions of delamination propagation load were obtained based on a simple equation for the strain energy release rate ignoring asymmetry, and the measured mode II fracture energy. It is concluded that the effect of the specimen asymmetry on this type of delamination is small.
Delamination was also observed in the thin section at considerably lower loads than in the thick section. Very similar delamination loads and locations were obtained with the same tapered geometry irrespective of the layup of the discontinuous plies. No early delamination of this kind was obtained in the constant thick- ness specimens. This shows that for thin section delamination, the geometric discontinuity is the main factor. It is believed that the main driving force is the straightening out of the kinked cover plies. This is controlled to a large extent
by the taper angle, with the asymmetry only having an indirect effect by forcing the taper to be all taken up on one side. More work is needed to investigate this phenomenon and the prediction of thin section delamination.
ACKNOWLEDGEMENTS
Support for this work from British Aerospace Airbus Ltd is gratefully acknowledged. Thanks are also due to Mr Mike Jones of Bristol Uni- versity for assistance with the manufacture and testing of specimens.
REFERENCES
1.
2.
3.
Curry, J. M., Johnson, E. R. & Starnes, J. H., Effect of dropped plies on the strength of graphite-epoxy laminates. Paper No. AIM 87-0874. In Proc. ofAL4A ASMEIASCEIAHS 28th Structures, Structural Dynamics and Materials Co& Monterey, AIAA, 1987, pp. 737-47. Hoa, S. V., Daoust, J., Du, B. L. & Vu-Khanh, T., Interlaminar stresses in tapered laminates. Polymer Composites, 9 (5) (1988) 337-43. Fish, J. C. & Lee, S. W., Delamination of tapered composite structures. Engng Fracture Mech., 34 (1989) 43-54.
4.
5.
6.
7.
8.
Murri, G. B., O’Brien, T. K. & Salpekar, S. A., Ten- sion fatigue of glass-epoxy and graphite-epoxy tapered laminates. NASA TM102628, 1990. Murri, G. B., Salpekar, S. A. & O’Brien, T. K., Fatigue delamination onset prediction in tapered composite laminates. In Composite Materials: Fatigue and Fracture, Vol. 3. ASTM STP 1110, 1991. Botting, A. D., Vizzini, A. J. & Lee, S. W., The effect of ply-drop configuration on the delamination strength of tapered composite structures. In Proc. of AIAAIASMEJASCEIAHS 33rd Structures, Structural Dynamics and Materials Conf, Dallas, AIAA, 1992. Fish, J. C. & Vizzini, A. J., Delamination of ply- dropped configurations. In 11th ASTM Symp. Composite Materials: Testing and Design, ASTM, 1992. Wisnom, M. R., Delamination in tapered unidirec-
9.
10.
11
, tional glass fibre-epoxy under static tension loading. In Proc. AIAA Structures, Structural Dynamics and Materials Conference, Baltimore, AL&$ 1991, pp. 1162-72. Wisnom, M. R., Jones, M. 1. & Cui, W., Failure of tapered composites under static and fatigue tension loading. AIAA I., 33 (5) (1995) 911-18. Backhouse, R., Blakeman, C. & Irving, P. E., Mech- anics of toughness enhancement in carbon fibre non-crimp fabric. In Proc. lnt. Conf on Deformation and Fracture of Composites, Guildford, Institute of Materials, 1995, pp. 307-16. Wisnom, M. R., Jones, M. I. & Cui, W., Delamination in composites with terminating internal plies under tension fatigue loading. Composite Materials: Fatigue and Fmcture, Vol. 5, pp. 486-508, ASTM, STP 1230, 1995.