Embed Size (px)
Citation preview
EVALUATION OF NYLON AND POLYESTER PEEL PLIESUSING THE RAPID ADHESION TEST
Brian Clark and Brian FlinnMaterials Science Department, University of Washington
Seattle, WA 98195-2120
Reprinted Permission ofSoceity of Advancement of Materials and Process Engineering (SAMPE),
Papers from 2007 SAMPE 2007 June 3-7, 2008.Additional copies of this publication may be obtained from
Society for the Advancement of Material and Process EngineeringSAMPE International Business Office
1161 Park View DriveCovina, CA 91724-3751
Web Page: www.sampe.orgE-mail: [email protected]
EVALUATION OF NYLON AND POLYESTER PEEL PLIESUSING THE RAPID ADHESION TEST
Brian Clark and Brian FlinnMaterials Science Department, University of Washington
Seattle, WA 98195-2120
ABSTRACT
Adequate surface preparation of composite parts for adhesive bonding by use of peel plies ishighly desirable, yet it remains necessary to test each combination of composite resin system,peel ply, and adhesive for successful adhesion. Furthermore, failure in adhesion, as opposed tointerlaminar or cohesive failure, is usually unacceptable for any application. The Rapid AdhesionTest (�RAT�) was developed as a simple, fast Mode I screening process for rejecting componentcombinations that fail in adhesion, taking advantage of the qualitative nature of thisdetermination. Here, various combinations of 127 °C (260 °F) cure glass fiber reinforcedpolymer prepreg, nylon and polyester peel plies, and film adhesives were tested using the RAT.It was found that all of the samples prepared with nylon peel plies failed cohesively, whereas allof the samples prepared with polyester peel plies failed in adhesion at least to some degree. Thetopography of the surfaces to be bonded was characterized using optical and scanning electronmicroscopy. The surface energy of each surface to be bonded was measured using sessile dropcontact angle measurements with at least 3 different fluids. The relationships between surfaceenergy and bond quality are explored.
KEY WORDS: Adhesives/Adhesive Bonding, Surface Preparation Materials/Processes, TestMethods/Test Standardization
1. INTRODUCTION
In composite materials, there are many reasons to prefer the use of adhesives over mechanicalfasteners. For one, a mechanical fastener such as a bolt that pierces a component introduces astress concentration into the component; while this is not necessarily critical for metals, it cancause a dramatic degradation of the performance of a composite part in which the matrixmaterial is more brittle. Adhesives, however, do not introduce such stress concentrations.Another reason for preferring adhesive bonding is that adhesives are often composed ofviscoelastic polymers that are more resistant to fatigue than typical mechanical fasteners. Forthese reasons and others, adhesive bonding is commonly used in the fabrication of compositestructures. However, implementing successful adhesion has special requirements, and allmethods that facilitate adhesive bonding are highly desirable. Here, a brief discussion ofadhesion will be followed by a discussion of peel plies as surface preparation and the RapidAdhesion Test (�RAT�) as a mode I screening process for new adherend-adhesive-surfacepreparation combinations.
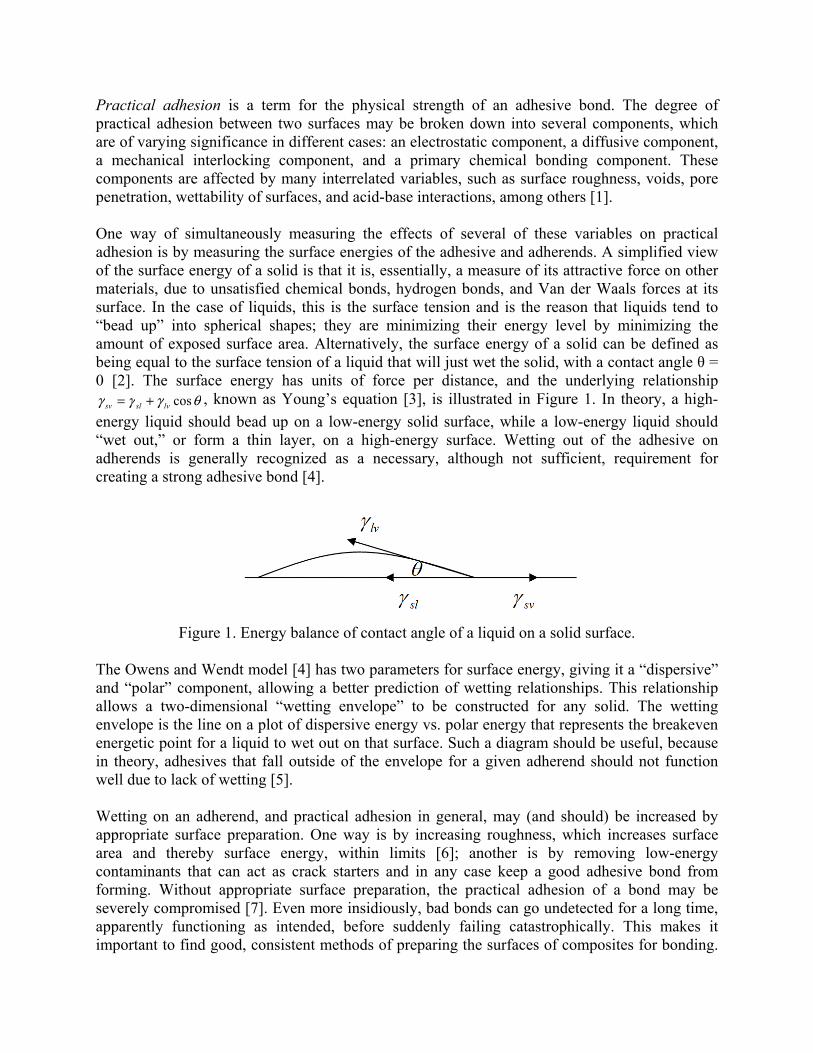
Practical adhesion is a term for the physical strength of an adhesive bond. The degree ofpractical adhesion between two surfaces may be broken down into several components, whichare of varying significance in different cases: an electrostatic component, a diffusive component,a mechanical interlocking component, and a primary chemical bonding component. Thesecomponents are affected by many interrelated variables, such as surface roughness, voids, porepenetration, wettability of surfaces, and acid-base interactions, among others [1].
One way of simultaneously measuring the effects of several of these variables on practicaladhesion is by measuring the surface energies of the adhesive and adherends. A simplified viewof the surface energy of a solid is that it is, essentially, a measure of its attractive force on othermaterials, due to unsatisfied chemical bonds, hydrogen bonds, and Van der Waals forces at itssurface. In the case of liquids, this is the surface tension and is the reason that liquids tend to�bead up� into spherical shapes; they are minimizing their energy level by minimizing theamount of exposed surface area. Alternatively, the surface energy of a solid can be defined asbeing equal to the surface tension of a liquid that will just wet the solid, with a contact angle θ =0 [2]. The surface energy has units of force per distance, and the underlying relationship
θγγγ coslvslsv += , known as Young�s equation [3], is illustrated in Figure 1. In theory, a high-energy liquid should bead up on a low-energy solid surface, while a low-energy liquid should�wet out,� or form a thin layer, on a high-energy surface. Wetting out of the adhesive onadherends is generally recognized as a necessary, although not sufficient, requirement forcreating a strong adhesive bond [4].
Figure 1. Energy balance of contact angle of a liquid on a solid surface.
The Owens and Wendt model [4] has two parameters for surface energy, giving it a �dispersive�and �polar� component, allowing a better prediction of wetting relationships. This relationshipallows a two-dimensional �wetting envelope� to be constructed for any solid. The wettingenvelope is the line on a plot of dispersive energy vs. polar energy that represents the breakevenenergetic point for a liquid to wet out on that surface. Such a diagram should be useful, becausein theory, adhesives that fall outside of the envelope for a given adherend should not functionwell due to lack of wetting [5].
Wetting on an adherend, and practical adhesion in general, may (and should) be increased byappropriate surface preparation. One way is by increasing roughness, which increases surfacearea and thereby surface energy, within limits [6]; another is by removing low-energycontaminants that can act as crack starters and in any case keep a good adhesive bond fromforming. Without appropriate surface preparation, the practical adhesion of a bond may beseverely compromised [7]. Even more insidiously, bad bonds can go undetected for a long time,apparently functioning as intended, before suddenly failing catastrophically. This makes itimportant to find good, consistent methods of preparing the surfaces of composites for bonding.
Grit blasting is widely considered the gold standard of surface preparation [8, 9], but, to theextent that they work, peel plies are an expedient and consistent alternative, making them anintriguing subject of study.
Given the wide range of variables that affect bond quality, successful approaches to the use ofadhesives need to be based on both theoretical considerations and empirical results; that is, it ispossible to predict how some adhesives and adherends will interact, but success cannot beguaranteed until it has been demonstrated in practice, with attention paid to all of the proceduraldetails. One test for this purpose is the double cantilever beam (�DCB�) test, commonly used toscreen new combinations of adhesive bond components, described in ASTM D5528-01 [10]. TheDCB test measures both mode I fracture toughness (GIc) and gives a mode of failure, such asinterlaminar or adhesion.
Unfortunately, the DCB test is expensive in terms of time and required machining accuracy,giving a motivation to find an easier method. The recently developed RAT [11] is a peel testpatterned off the climbing drum peel test; it is intended to give a fast, easy way to qualitativelyscreen new adherend � surface preparation � adhesive combinations. The RAT takes advantageof the fact that there is a strong correlation between mode of failure and GIc, so merelydetermining the mode of failure already gives very important information. An undesirable failuremode in a specimen � namely, a failure in adhesion, with its much lower GIc � does not require aquantitative measure of performance, because that combination would be rejected regardless. Ithas been shown that RAT results correlate to DCB results regarding the mode of failure [11].
Peel plies are often based on polyester or on nylon fibers, which have been shown to havedifferences in performance for various adhesives for one176 deg °C (350 °F) cure system; infact, nylon peel ply was shown to bond poorly in some cases [12], and the common failure ofnylon peel plies to prepare surfaces has actually been referred to by Hart-Smith as a �curse� [9].The goal of this research is to do initial testing on polyester and nylon peel plies with a selectionof substrate-adhesive combinations with 127 °C (260 °F) cure systems. Furthermore, thisresearch is intended to show applicability of the RAT as a fast evaluation tool for the purpose ofscreening such combinations.
2. EXPERIMENTAL
2.1 Materials All combinations of the following materials, using one each of substrate, peel ply,and adhesive, were evaluated:
• Three substrates, all glass fiber reinforced epoxy prepregs with a 0-90° plain weave and127 °C (260 °F) cure cycle:
o Hexcel 1581-F155o Yokohama F6986o Cytec Cycom MXB 7701/7781
• Two types of peel ply:o Nylon (Precision code 51789)o Polyester (Precision 60001)
• Six epoxy film adhesives:o 3M AF500o 3M AF 163-2Mo Cytec FM 94o Henkel Hysol EA 9696o Cytec FM x209o Henkel Hysol EA 9628
This resulted in a total of 36 bonded sample types; or, when only substrates and peel plies wereevaluated, 6 sample types. All of the substrates and adhesives here are epoxy-based systems,each with different proprietary toughening systems and other unspecified contents.
For the RAT proper, two types of aluminum sheet were used per sample: a �thin� 0.051 cm(0.020 inch) piece of anodized 2024-T3 clad alloy, 22.9 cm x 10.2 cm (9 inch x 4 inch), and a�thick� 0.16 cm (0.063 inch) piece, also 22.9 cm x 10.2 cm (9 inch x 4 inch). Fluorinatedethylene propylene (FEP) was used as a crack starter material.
2.2 Sample Preparation Characterization samples were laid up as flat squares approximately7.6 cm x 7.6 cm (3 inch x 3 inch), with four aligned plies apiece and peel plies on both sides.These samples were vacuum-bagged and cured in an autoclave. The curing cycle for the prepregs(and, later, for the adhesives) was the following: ramp-up temperature of +4.4 °C (8.0 °F) / minand fast pressure ramp-up; holding pressure of 62 kPa (89 psi) for 90 minutes at 127 °C (260 °F);and cool-down of -2.8 °C (5.0 °F) / min to at least 60 °C (140 °F) and fast pressure release.Subsequent to cure, the characterization samples were cut and peeled as needed for scanningelectron microscope (SEM) and contact angle measurements.
The RAT samples were prepared in two stages, in accordance with the test parameters describedby Shelley and Van Voast [11]. Briefly, a single ply of substrate was placed directly a �thin�aluminum sheet as described previously, with the corresponding peel ply on top, and theassembly cured using a similar curing cycle, but in a hot press apparatus, with the peel ply on thetool side. Then a piece of the chosen adhesive was placed against a �thick� aluminum sheet(again, described previously), with a 2.5 cm (1 inch) wide piece of FEP placed across one endbetween the adhesive and the aluminum across the width of the specimen. This adhesive wasthen cured against the already-cured prepreg, after removing the peel ply. Figure 2 shows thesesteps.
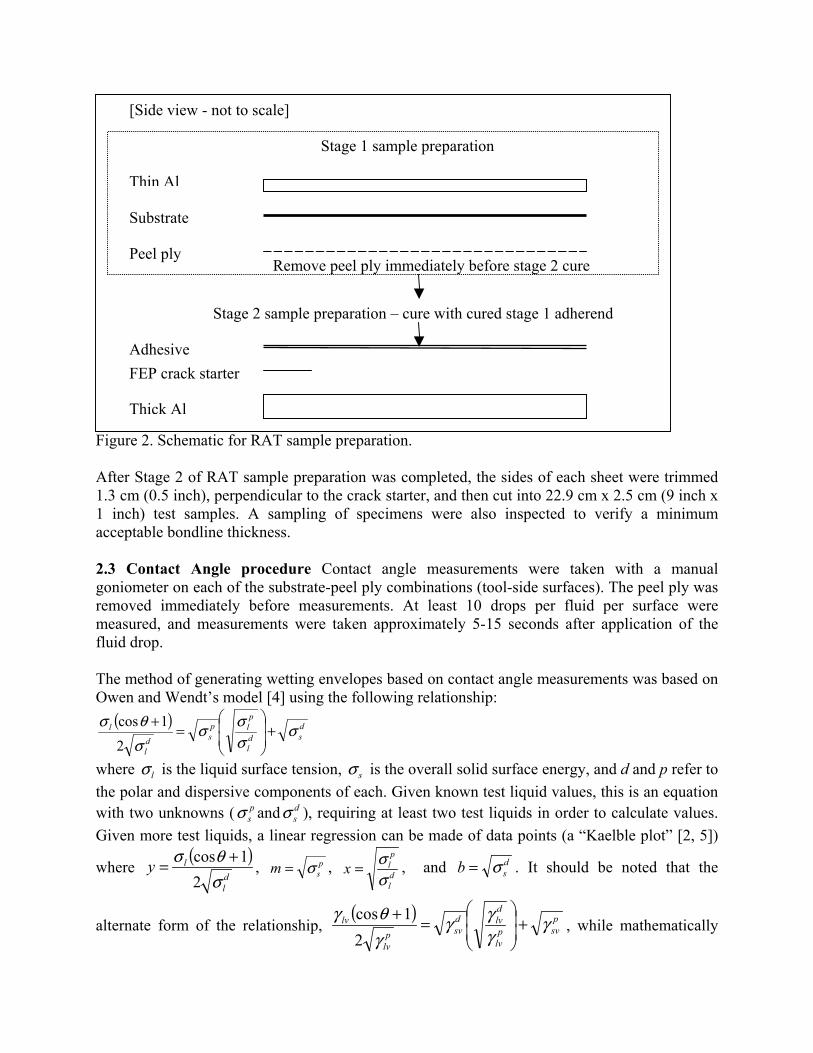
Figure 2. Schematic for RAT sample preparation.
After Stage 2 of RAT sample preparation was completed, the sides of each sheet were trimmed1.3 cm (0.5 inch), perpendicular to the crack starter, and then cut into 22.9 cm x 2.5 cm (9 inch x1 inch) test samples. A sampling of specimens were also inspected to verify a minimumacceptable bondline thickness.
2.3 Contact Angle procedure Contact angle measurements were taken with a manualgoniometer on each of the substrate-peel ply combinations (tool-side surfaces). The peel ply wasremoved immediately before measurements. At least 10 drops per fluid per surface weremeasured, and measurements were taken approximately 5-15 seconds after application of thefluid drop.
The method of generating wetting envelopes based on contact angle measurements was based onOwen and Wendt�s model [4] using the following relationship:
( ) dsd
l
plp
sdl
l σσσσ
σθσ
+
=
+
2
1cos
where lσ is the liquid surface tension, sσ is the overall solid surface energy, and d and p refer tothe polar and dispersive components of each. Given known test liquid values, this is an equationwith two unknowns ( p
sσ and dsσ ), requiring at least two test liquids in order to calculate values.
Given more test liquids, a linear regression can be made of data points (a �Kaelble plot� [2, 5])
where( )
dl
lyσθσ
21cos += , p
sm σ= ,dl
plx
σσ= , and d
sb σ= . It should be noted that the
alternate form of the relationship,( ) p
svplv
dlvd
svplv
lv γγγγ
γθγ +
=+
21cos
, while mathematically
[Side view - not to scale]
Thin Al
Substrate
Peel ply
Stage 1 sample preparation
Adhesive
Thick Al
FEP crack starter
Stage 2 sample preparation � cure with cured stage 1 adherend
Remove peel ply immediately before stage 2 cure
equivalent, was found to be less useful in practice because while some test liquids have no polarelement in their energy, rendering them incompatible with this latter version of the formula, theauthors have found no test liquid that lacked a dispersive element.
After dispersive and polar elements were calculated for each test sample, a wetting envelope was
generated from the quadratic roots of the relationship ( ) ( ) [ ] 02
=−+− plv
psv
plv
dlv
dsv
dlv γγγγγγ
[13]. The series of plotted points from this were generated by a computer program written byClark for the purpose, based on another wetting envelope software utility by Tuttle [14].
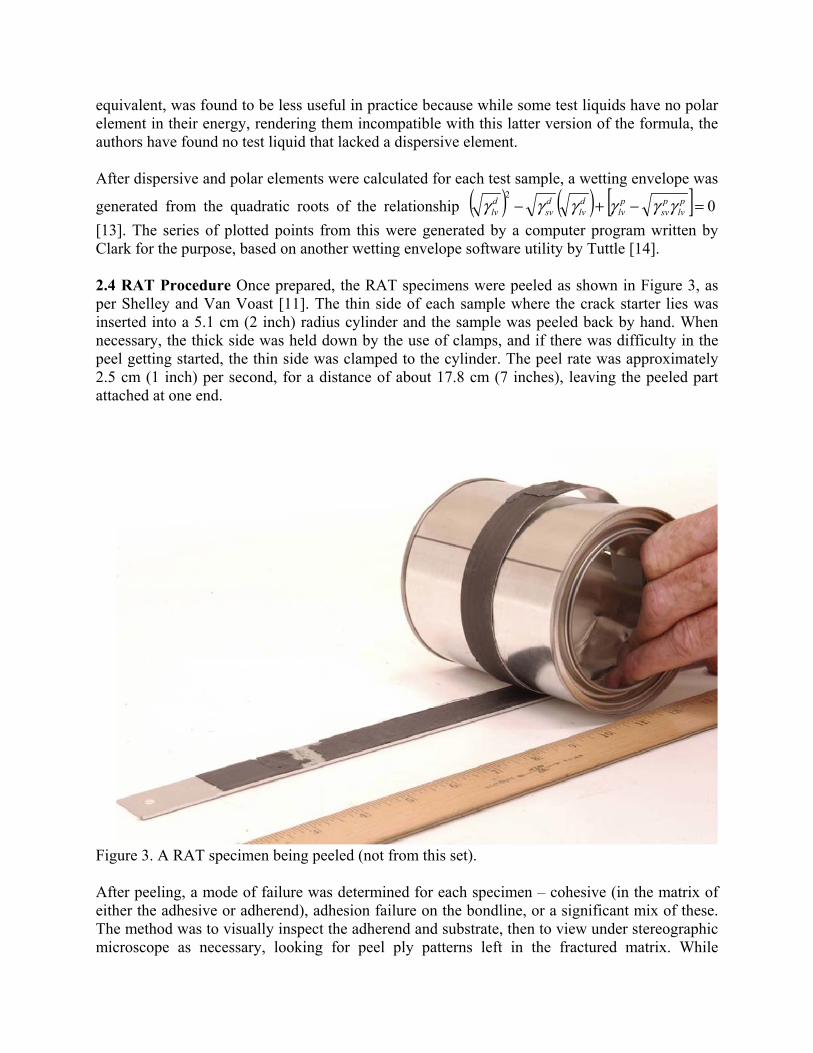
2.4 RAT Procedure Once prepared, the RAT specimens were peeled as shown in Figure 3, asper Shelley and Van Voast [11]. The thin side of each sample where the crack starter lies wasinserted into a 5.1 cm (2 inch) radius cylinder and the sample was peeled back by hand. Whennecessary, the thick side was held down by the use of clamps, and if there was difficulty in thepeel getting started, the thin side was clamped to the cylinder. The peel rate was approximately2.5 cm (1 inch) per second, for a distance of about 17.8 cm (7 inches), leaving the peeled partattached at one end.
Figure 3. A RAT specimen being peeled (not from this set).
After peeling, a mode of failure was determined for each specimen � cohesive (in the matrix ofeither the adhesive or adherend), adhesion failure on the bondline, or a significant mix of these.The method was to visually inspect the adherend and substrate, then to view under stereographicmicroscope as necessary, looking for peel ply patterns left in the fractured matrix. While
interlaminar failure was another possible failure mode in principle, the fact that the substrateswere of woven fibers rather than a unidirectional tape made that outcome highly unlikely.
2.5 SEM Procedure Two separate sets of SEM samples were made. The first set was takendirectly from the characterization samples, which were of the substrate surfaces after the peel plyhad been removed (but without further curing or addition of adhesive). Edges of thecharacterization sample squares were trimmed approximately 0.5 cm (0.2 inch) on all sidesbefore SEM specimens proper were cut. The second set of samples was taken from specimensafter the RAT had been performed on them; these samples were used to view and confirm thedifference in failure modes on the microscopic level. All SEM samples were sputter-coated witha layer of platinum shortly their surfaces were exposed.
3. RESULTS AND DISCUSSION
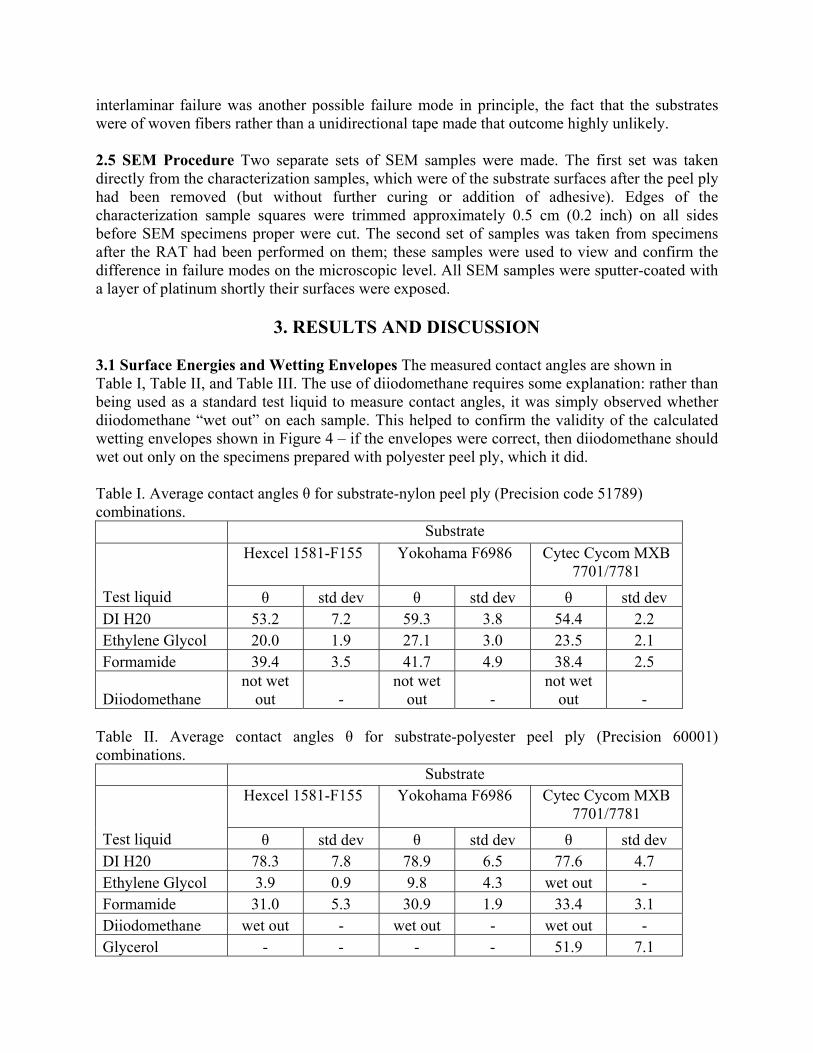
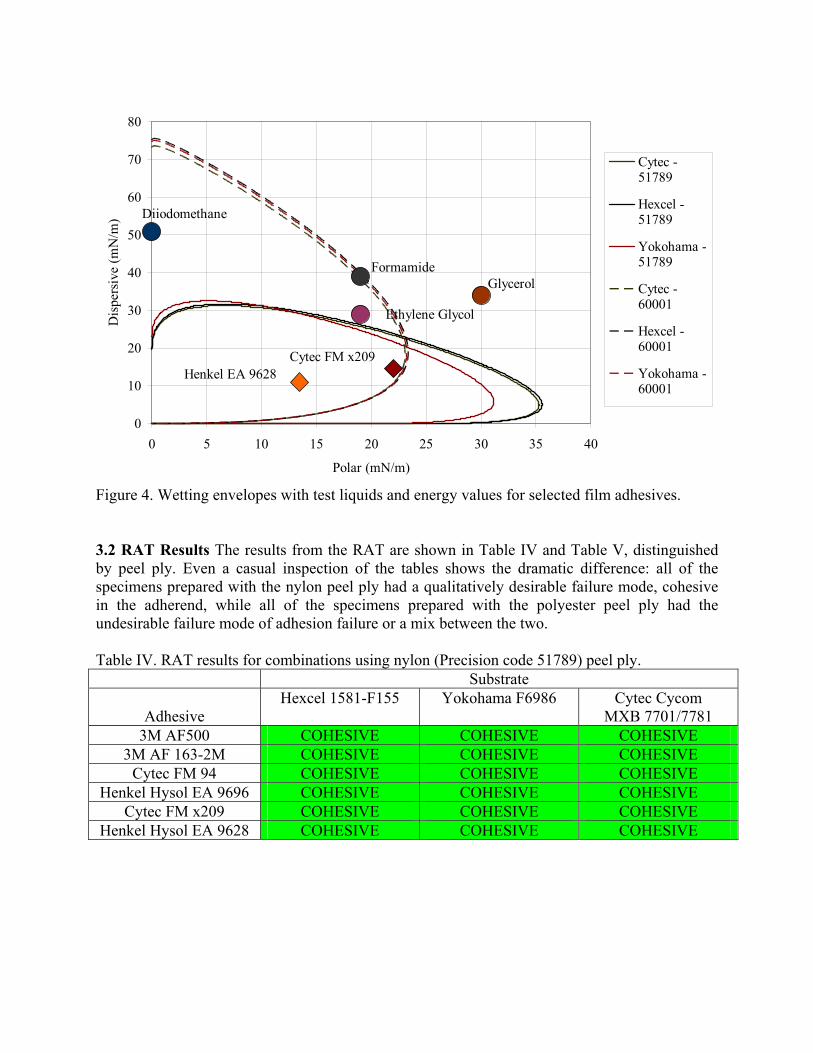
3.1 Surface Energies and Wetting Envelopes The measured contact angles are shown inTable I, Table II, and Table III. The use of diiodomethane requires some explanation: rather thanbeing used as a standard test liquid to measure contact angles, it was simply observed whetherdiiodomethane �wet out� on each sample. This helped to confirm the validity of the calculatedwetting envelopes shown in Figure 4 � if the envelopes were correct, then diiodomethane shouldwet out only on the specimens prepared with polyester peel ply, which it did.
Table I. Average contact angles θ for substrate-nylon peel ply (Precision code 51789)combinations.
SubstrateHexcel 1581-F155 Yokohama F6986 Cytec Cycom MXB
7701/7781Test liquid θ std dev θ std dev θ std devDI H20 53.2 7.2 59.3 3.8 54.4 2.2Ethylene Glycol 20.0 1.9 27.1 3.0 23.5 2.1Formamide 39.4 3.5 41.7 4.9 38.4 2.5
Diiodomethanenot wet
out -not wet
out -not wet
out -
Table II. Average contact angles θ for substrate-polyester peel ply (Precision 60001)combinations.
SubstrateHexcel 1581-F155 Yokohama F6986 Cytec Cycom MXB
7701/7781Test liquid θ std dev θ std dev θ std devDI H20 78.3 7.8 78.9 6.5 77.6 4.7Ethylene Glycol 3.9 0.9 9.8 4.3 wet out -Formamide 31.0 5.3 30.9 1.9 33.4 3.1Diiodomethane wet out - wet out - wet out -Glycerol - - - - 51.9 7.1

Table III. Average contact angles θ for selected uncured film adhesives.Adhesive
uncured CytecFM x209
uncured HenkelEA 9628
Liquid θ std dev θ std devDI H20 65.3 4.0 81.3 4.4EthyleneGlycol 52.4 6.2 70.7 6.8Formamide 62.3 4.3 61.4 4.7
The wetting envelopes generated from the data on these tables are shown in Figure 4. In theory,any liquids whose surface energy component coordinates within the envelopes should wet out onthose surfaces. The two primary variables here are peel ply used and differences in matrixcomposition; the fact that the envelopes are similar per peel ply type means that differences inmatrix composition make little difference.
According to the envelopes, ethylene glycol should have wet out on all three polyester-preparedsurfaces, and the contact angles for formamide on the polyester-prepared surfaces should havebeen lower. There may have been some variation in the energy of the liquids, or this may berepresentative of acknowledged limitations of the Owens and Wendt model.
The data points from selected film adhesives are included to give some indication of how wellthe adhesives may tend to wet out on the substrates. While it is beyond the scope of this study tomeasure energy changes with heat and pressure, it is clear that even at room temperature, theadhesives have lower energies than the substrates; thus, they may be expected to wet out. Thisimplies that any troubles with adhesion do not come from a lack of wetting, at least with theseadhesives.
Glycerol
Diiodomethane
Formamide
Ethylene Glycol
Cytec FM x209Henkel EA 9628
0
10
20
30
40
50
60
70
80
0 5 10 15 20 25 30 35 40
Polar (mN/m)
Dis
pers
ive
(mN
/m)
Cytec -51789
Hexcel -51789
Yokohama -51789
Cytec -60001
Hexcel -60001
Yokohama -60001
Figure 4. Wetting envelopes with test liquids and energy values for selected film adhesives.
3.2 RAT Results The results from the RAT are shown in Table IV and Table V, distinguishedby peel ply. Even a casual inspection of the tables shows the dramatic difference: all of thespecimens prepared with the nylon peel ply had a qualitatively desirable failure mode, cohesivein the adherend, while all of the specimens prepared with the polyester peel ply had theundesirable failure mode of adhesion failure or a mix between the two.
Table IV. RAT results for combinations using nylon (Precision code 51789) peel ply.Substrate
AdhesiveHexcel 1581-F155 Yokohama F6986 Cytec Cycom
MXB 7701/77813M AF500 COHESIVE COHESIVE COHESIVE
3M AF 163-2M COHESIVE COHESIVE COHESIVECytec FM 94 COHESIVE COHESIVE COHESIVE
Henkel Hysol EA 9696 COHESIVE COHESIVE COHESIVECytec FM x209 COHESIVE COHESIVE COHESIVE
Henkel Hysol EA 9628 COHESIVE COHESIVE COHESIVE
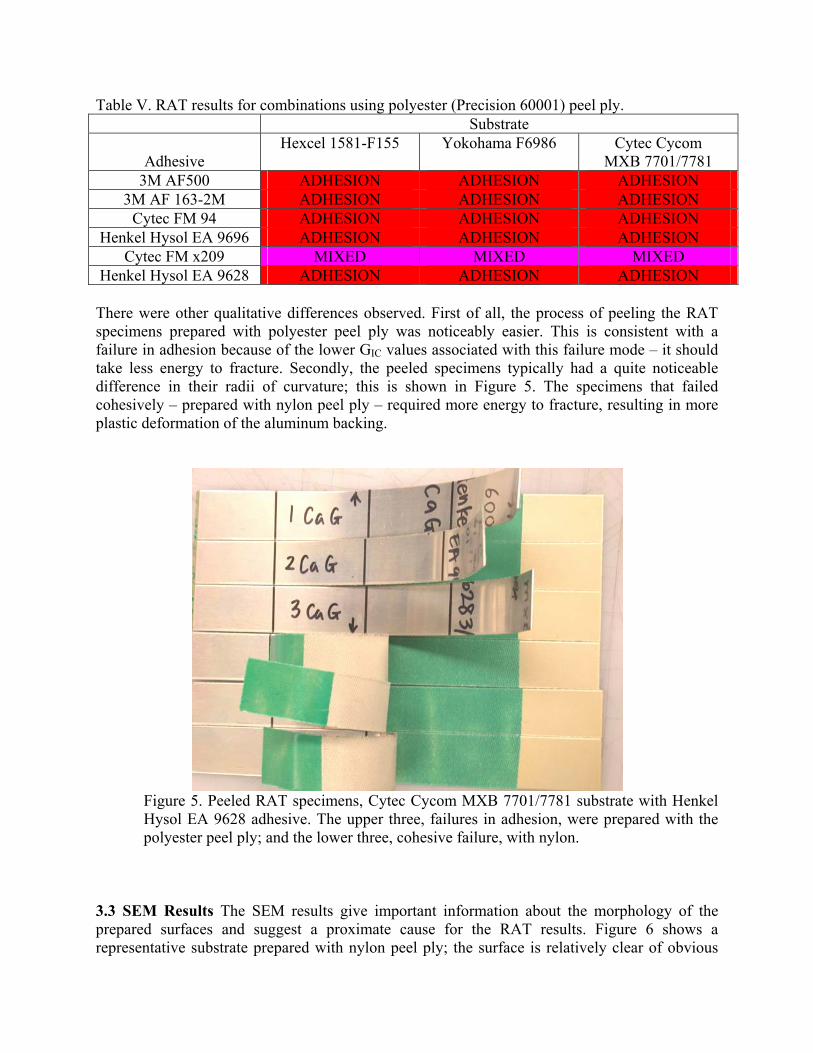
Table V. RAT results for combinations using polyester (Precision 60001) peel ply.Substrate
AdhesiveHexcel 1581-F155 Yokohama F6986 Cytec Cycom
MXB 7701/77813M AF500 ADHESION ADHESION ADHESION
3M AF 163-2M ADHESION ADHESION ADHESIONCytec FM 94 ADHESION ADHESION ADHESION
Henkel Hysol EA 9696 ADHESION ADHESION ADHESIONCytec FM x209 MIXED MIXED MIXED
Henkel Hysol EA 9628 ADHESION ADHESION ADHESION
There were other qualitative differences observed. First of all, the process of peeling the RATspecimens prepared with polyester peel ply was noticeably easier. This is consistent with afailure in adhesion because of the lower GIC values associated with this failure mode � it shouldtake less energy to fracture. Secondly, the peeled specimens typically had a quite noticeabledifference in their radii of curvature; this is shown in Figure 5. The specimens that failedcohesively � prepared with nylon peel ply � required more energy to fracture, resulting in moreplastic deformation of the aluminum backing.
Figure 5. Peeled RAT specimens, Cytec Cycom MXB 7701/7781 substrate with HenkelHysol EA 9628 adhesive. The upper three, failures in adhesion, were prepared with thepolyester peel ply; and the lower three, cohesive failure, with nylon.
3.3 SEM Results The SEM results give important information about the morphology of theprepared surfaces and suggest a proximate cause for the RAT results. Figure 6 shows arepresentative substrate prepared with nylon peel ply; the surface is relatively clear of obvious
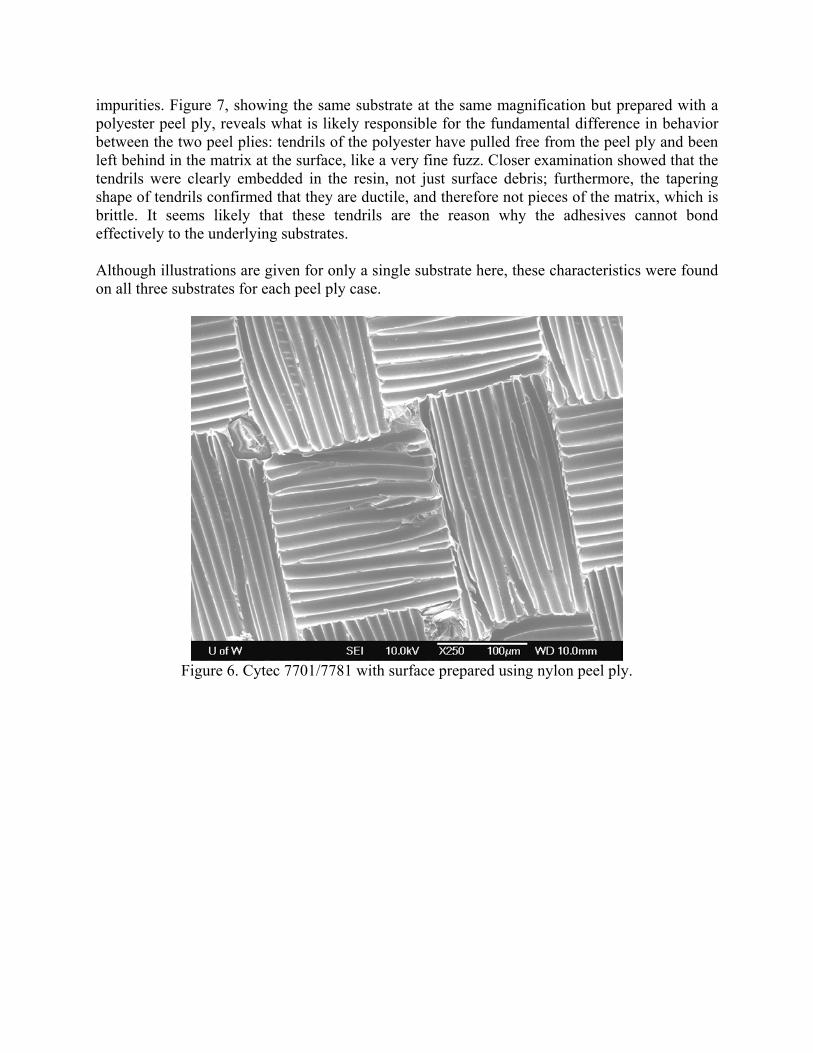
impurities. Figure 7, showing the same substrate at the same magnification but prepared with apolyester peel ply, reveals what is likely responsible for the fundamental difference in behaviorbetween the two peel plies: tendrils of the polyester have pulled free from the peel ply and beenleft behind in the matrix at the surface, like a very fine fuzz. Closer examination showed that thetendrils were clearly embedded in the resin, not just surface debris; furthermore, the taperingshape of tendrils confirmed that they are ductile, and therefore not pieces of the matrix, which isbrittle. It seems likely that these tendrils are the reason why the adhesives cannot bondeffectively to the underlying substrates.
Although illustrations are given for only a single substrate here, these characteristics were foundon all three substrates for each peel ply case.
Figure 6. Cytec 7701/7781 with surface prepared using nylon peel ply.
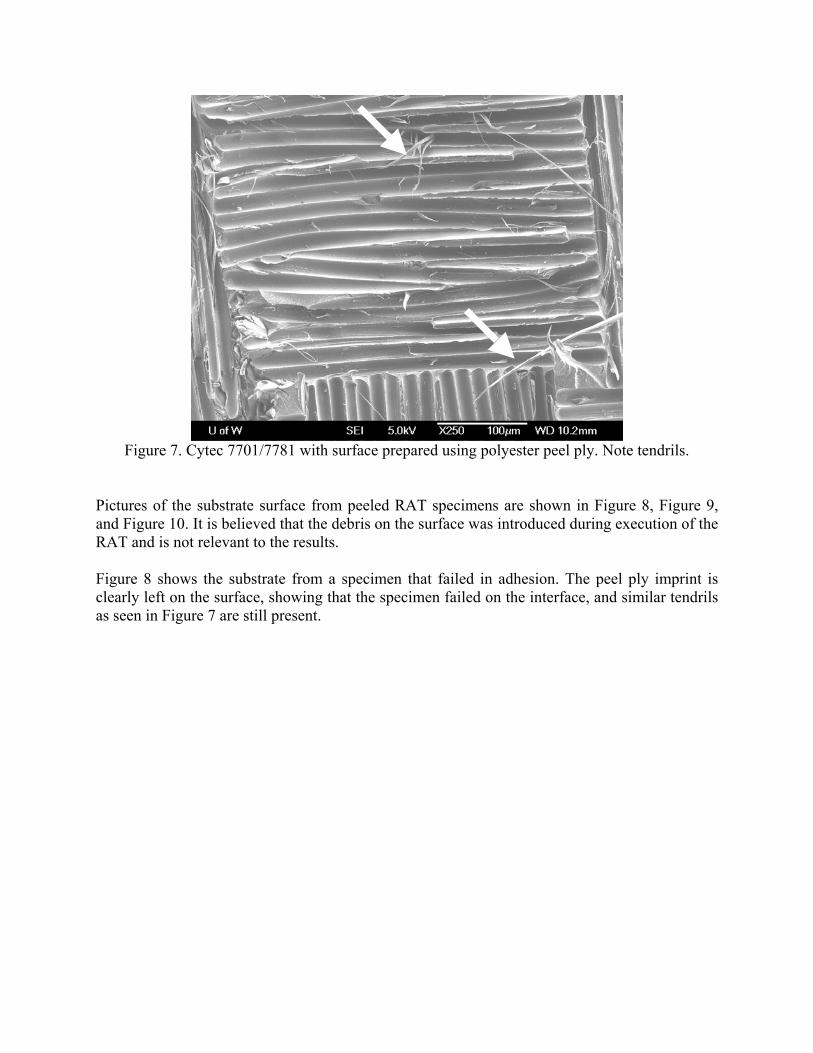
Figure 7. Cytec 7701/7781 with surface prepared using polyester peel ply. Note tendrils.
Pictures of the substrate surface from peeled RAT specimens are shown in Figure 8, Figure 9,and Figure 10. It is believed that the debris on the surface was introduced during execution of theRAT and is not relevant to the results.
Figure 8 shows the substrate from a specimen that failed in adhesion. The peel ply imprint isclearly left on the surface, showing that the specimen failed on the interface, and similar tendrilsas seen in Figure 7 are still present.
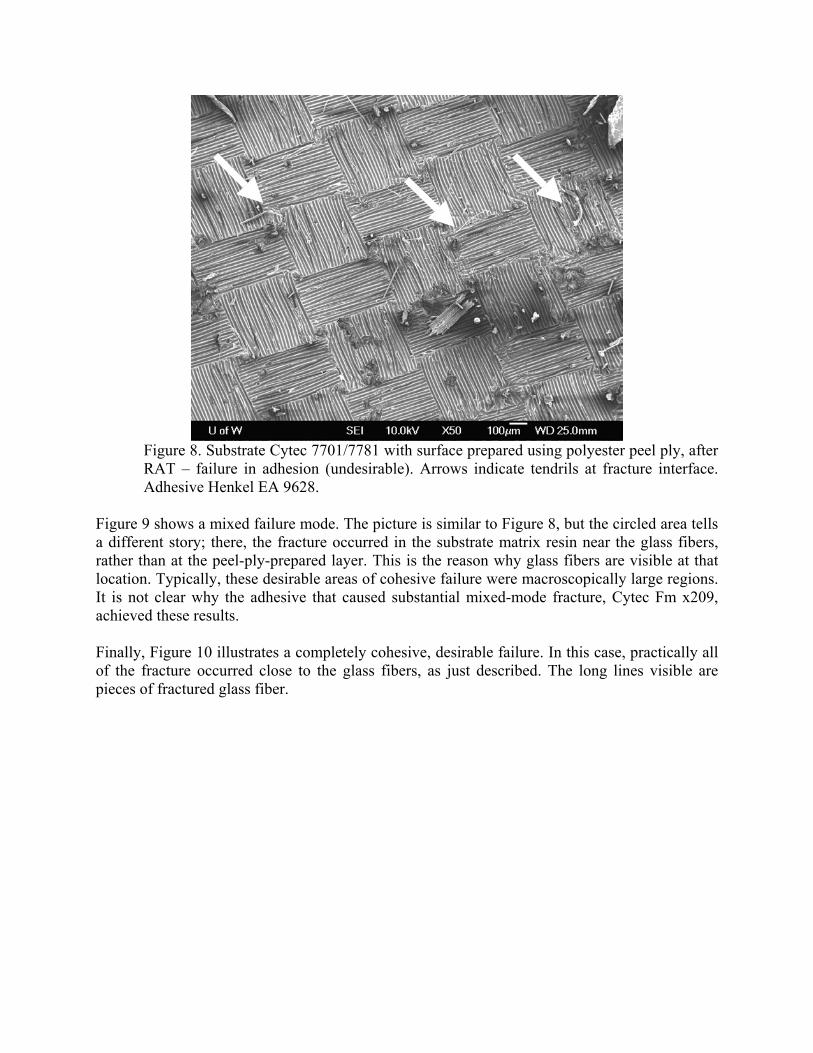
Figure 8. Substrate Cytec 7701/7781 with surface prepared using polyester peel ply, afterRAT � failure in adhesion (undesirable). Arrows indicate tendrils at fracture interface.Adhesive Henkel EA 9628.
Figure 9 shows a mixed failure mode. The picture is similar to Figure 8, but the circled area tellsa different story; there, the fracture occurred in the substrate matrix resin near the glass fibers,rather than at the peel-ply-prepared layer. This is the reason why glass fibers are visible at thatlocation. Typically, these desirable areas of cohesive failure were macroscopically large regions.It is not clear why the adhesive that caused substantial mixed-mode fracture, Cytec Fm x209,achieved these results.
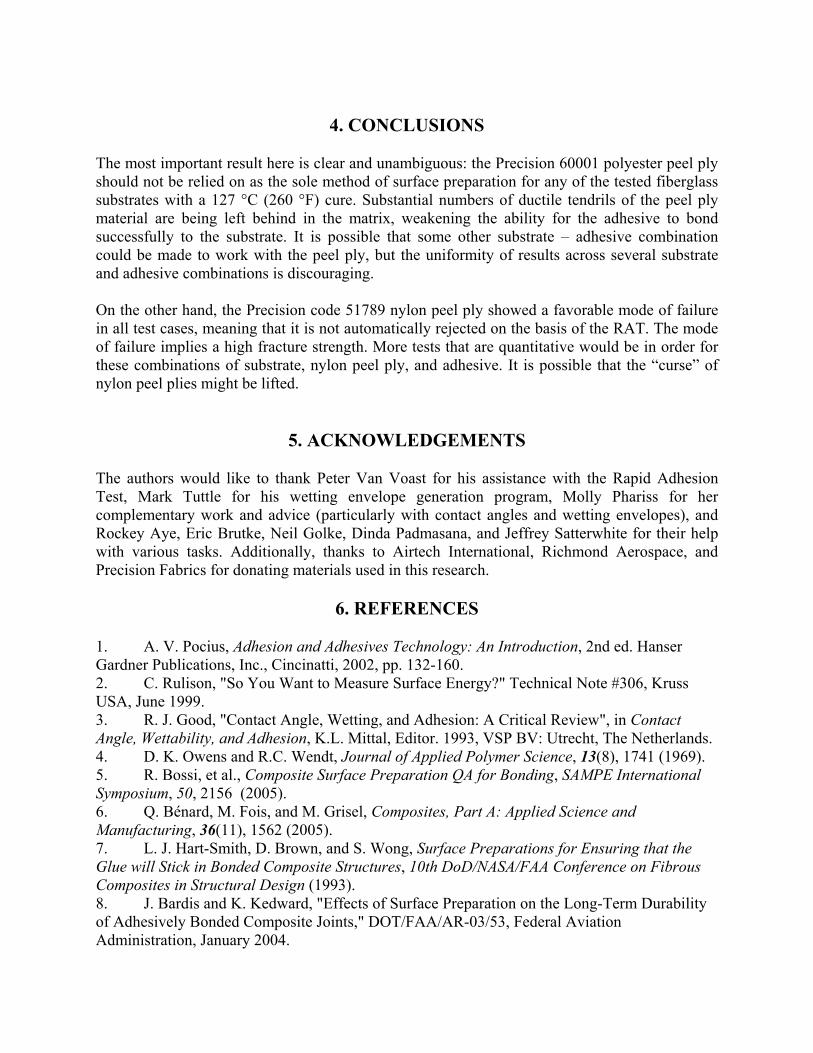
Finally, Figure 10 illustrates a completely cohesive, desirable failure. In this case, practically allof the fracture occurred close to the glass fibers, as just described. The long lines visible arepieces of fractured glass fiber.
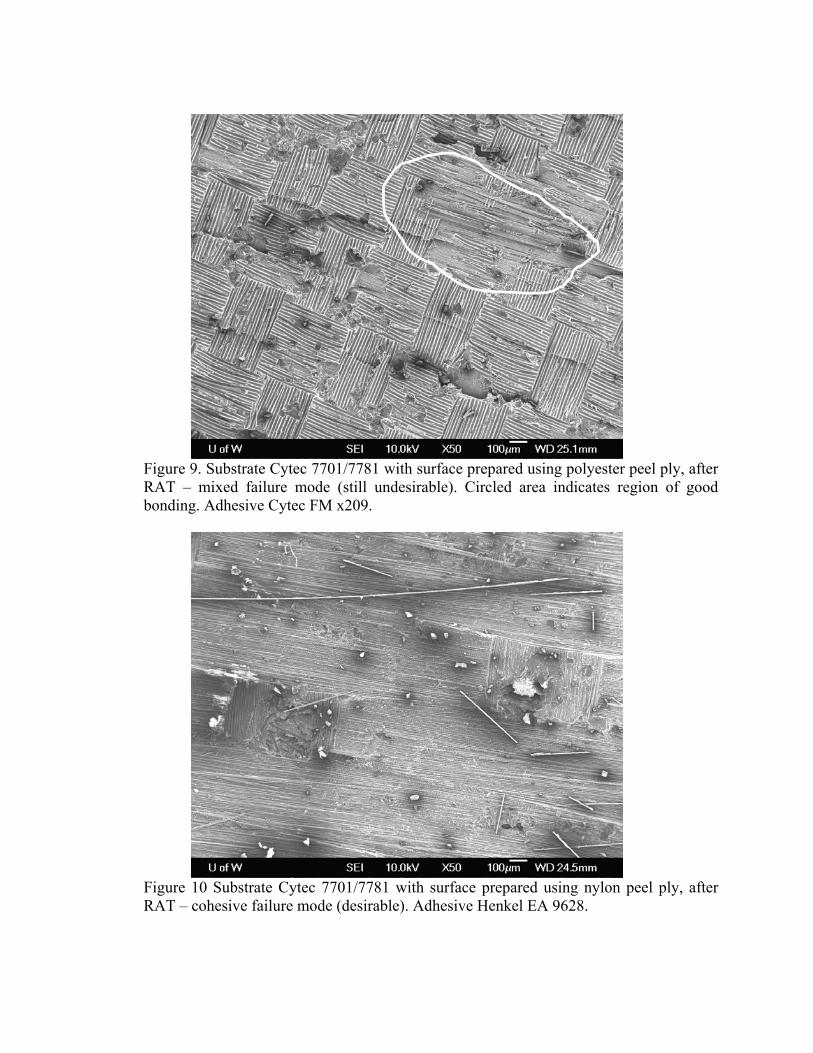
Figure 9. Substrate Cytec 7701/7781 with surface prepared using polyester peel ply, afterRAT � mixed failure mode (still undesirable). Circled area indicates region of goodbonding. Adhesive Cytec FM x209.
Figure 10 Substrate Cytec 7701/7781 with surface prepared using nylon peel ply, afterRAT � cohesive failure mode (desirable). Adhesive Henkel EA 9628.
4. CONCLUSIONS
The most important result here is clear and unambiguous: the Precision 60001 polyester peel plyshould not be relied on as the sole method of surface preparation for any of the tested fiberglasssubstrates with a 127 °C (260 °F) cure. Substantial numbers of ductile tendrils of the peel plymaterial are being left behind in the matrix, weakening the ability for the adhesive to bondsuccessfully to the substrate. It is possible that some other substrate � adhesive combinationcould be made to work with the peel ply, but the uniformity of results across several substrateand adhesive combinations is discouraging.
On the other hand, the Precision code 51789 nylon peel ply showed a favorable mode of failurein all test cases, meaning that it is not automatically rejected on the basis of the RAT. The modeof failure implies a high fracture strength. More tests that are quantitative would be in order forthese combinations of substrate, nylon peel ply, and adhesive. It is possible that the �curse� ofnylon peel plies might be lifted.
5. ACKNOWLEDGEMENTS
The authors would like to thank Peter Van Voast for his assistance with the Rapid AdhesionTest, Mark Tuttle for his wetting envelope generation program, Molly Phariss for hercomplementary work and advice (particularly with contact angles and wetting envelopes), andRockey Aye, Eric Brutke, Neil Golke, Dinda Padmasana, and Jeffrey Satterwhite for their helpwith various tasks. Additionally, thanks to Airtech International, Richmond Aerospace, andPrecision Fabrics for donating materials used in this research.
6. REFERENCES
1. A. V. Pocius, Adhesion and Adhesives Technology: An Introduction, 2nd ed. HanserGardner Publications, Inc., Cincinatti, 2002, pp. 132-160.2. C. Rulison, "So You Want to Measure Surface Energy?" Technical Note #306, KrussUSA, June 1999.3. R. J. Good, "Contact Angle, Wetting, and Adhesion: A Critical Review", in ContactAngle, Wettability, and Adhesion, K.L. Mittal, Editor. 1993, VSP BV: Utrecht, The Netherlands.4. D. K. Owens and R.C. Wendt, Journal of Applied Polymer Science, 13(8), 1741 (1969).5. R. Bossi, et al., Composite Surface Preparation QA for Bonding, SAMPE InternationalSymposium, 50, 2156 (2005).6. Q. Bénard, M. Fois, and M. Grisel, Composites, Part A: Applied Science andManufacturing, 36(11), 1562 (2005).7. L. J. Hart-Smith, D. Brown, and S. Wong, Surface Preparations for Ensuring that theGlue will Stick in Bonded Composite Structures, 10th DoD/NASA/FAA Conference on FibrousComposites in Structural Design (1993).8. J. Bardis and K. Kedward, "Effects of Surface Preparation on the Long-Term Durabilityof Adhesively Bonded Composite Joints," DOT/FAA/AR-03/53, Federal AviationAdministration, January 2004.
9. L. J. Hart-Smith, "The Curse of the Nylon Peel Ply," SAMPE International Symposium,41, 315 (1996).10. ASTM, D5528-01 Standard Test Method for Mode I Interlaminar Fracture Toughness ofUnidirectional Fiber-Reinforced Polymer Matrix Composites.11. P. Shelley and P. J. Van Voast, "Rapid Adhesion Test (RAT) Development," The BoeingCompany, August 2005.12. B. Flinn and M. Phariss, "The Effect of Peel-Ply Surface Preparation Variables on BondQuality," DOT/FAA/AR-06/28, Federal Aviation Administration, August 2006.13. C. Rulison, "Adhesion Energy and Interfacial Tension," Application Note #232e,Augustine Scientific, January 2003.14. M. Tuttle, WET v 1.0, University of Washington, Seattle, personally distributedexecutable for generating wetting envelopes, (2005).