Embed Size (px)
Citation preview

mma Om L.5.8 Confidential (F.R.) December 1, 1969.
LIBRARY
DEL 3 ,d)9
C5-- 6 CAPITAL MARKET DEVELOPMENTS
ro
Capital Markets Section, Division of Research and Statistics, Board of Governors of the Federal Reserve System, Washington, D. C.
Digitized for FRASER http://fraser.stlouisfed.org/ Federal Reserve Bank of St. Louis

3
TABLE 1: Yields, Volume and Reception
CORPORATE BOND MARKET YIELDS VOLUME 2
WEEK ENDING: MOODY'S PER CENT __ SEASONED GROSS SOLD BY END BONDS SCHEDULED
NEW ISSUE 1 OFFERINGS OF WEEK WITHIN 28 DAYS 1969 - Oct. 3 8.22 7.28 195 75 871
10 8.10 7.37 90 76 928 17 7.95 7.39 232 — ' 97 798 24 7.82 7.31 270 89 703 31 7.87 7.25 215 , 80e 844
Nov. 7 8.13 7.26 261 67 991 14 21 28
Dec. 5j>/
8.27 8.44 8.67
n.a.
7.29 7.38 , 7.48/
365 241 185
430e
81 79 91
,071 903 733
-MUNICIPAL BOND MARKET YIELDS VOLUME2
WEEK ENDING: MOODY'S BOND BUYER PER CENT SEASONED SEASONED 20 GROSS SOLD BY END BONDS SCHEDULED Aaa BOND INDEX OFFERINGS OF WEEK WITHIN 28 DAYS
1969 - Oct.
Nov.
Dec.
3 5.83 10 5.80 17 5.75 24 5.80 31 5.84
7 5.75 14 5.78 21 5.95 28 6.05 W r n.a.
6.19 6.14 5.92 6.07 6.13
6.11 6.17 6.36 6.58
n.a.
119 343 303 353 204
246 83 314 220 '
325e
72 79 59 56 82
48 67 59 86 .
745 454 528 769 789
903 954 913 683
n.a. 1 Derived by adjusting to a Aaa basis, new issues of publicly-offered corporate bonds with call protection, rated A, Aa, or Aaa by Moody's Investors Service (except serial and convertible issues, offerings of natural gas pipeline and foreign companies, and . bonds guaranteed by the Federal Government.) .
2 Millions of dollars unless otherwise indicated.
Note: Sue footnotes to Table 3
Digitized for FRASER http://fraser.stlouisfed.org/ Federal Reserve Bank of St. Louis

TABLE 2: Details on Inventories
CORPORATE BONDS IN SYNDICATE END OF LATEST WEEK DATE,. . . AMOUNT. . ORIGINAL RATING AND ESTIMATED PRO-OFFERED (MIL. $) ISSUER COUPON: YIELD CALL PROTECTION PORTION SOLD
11/25 25.0 Louisiana Pwr. & Lt. 9 -3 /8 9.25 A 5 years 50% , 11/24 13.0 General Tel. of New York 9 -1 /2 9.45 Baa 5 years 65% 11/19 80.0 Pacific Gas and Electric 9.00 8 .81 Aa 5 years 60% 11/13 100.0 B.F. Goodrich 8.25 8.25 A 10 years 90%
CORPORATE BONDS RELEASED FROM SYNDICATE DURING LATEST WEEK DATE
cbupoN ORIGINAL INCREASE RATING AND
OFFERED | RELEXSED AMOUNT ISSUER cbupoN YIELD IN YIELD CALL PROT.
11/18 11/13
11/25 11/25
50.0 20.0
ESTIMATED PRO-
May Credit Iowa Elec. Lt.& Pwf.
9.00 8 -5 /8
9.00 8.60
+20 +24
N.R. Aa
10 yrs. 5 yrs.
20% 30%
INVENTORIES 1
DATE MUNICIPALS CORPORATES DATE ' BLUE LIST 1 IN SYNDICATE IN SYNDICATE
1969 - Oct. 31 565 199 . "
Nov. 7 555 241 90 j , 14 560 164 88 21 r /609 223 68 2 8 £ / 584 142 59
All figures in millions of dollars which
Blue List is daily average for week ended Friday,except for latest week daily average of three days ended Wednesday. All other figures are as of Friday. Digitized for FRASER
http://fraser.stlouisfed.org/ Federal Reserve Bank of St. Louis

BONDS IN SYNDICATE Millions of dollars
CORPORATE BONDS IN SYNDICATE
200
T T—i—i—i—r—F—r—i—r ~ t r~~i i i i r~i i i i i r MUNICIPAL BONDS IN SYNDICATE
3 0 0
SEPT. DEC. MAR. JUN. SEPT DEC. MAR. JUN. SEPT. DEC. ' 6 7 1 9 6 8 1 9 6 9
Digitized for FRASER http://fraser.stlouisfed.org/ Federal Reserve Bank of St. Louis

TABLE 3". High Grade Bond Yields
• DATE \. NEW
CORPORATE . Aaa 1
MOODY'S SEASONED CORPORATE
Aaa 2
U.S. GOVERNMENT 20-YEAR
CONSTANT MATURITIES 3
BOND BUYER'S SEASONED
MUNICIPALS 4 1967 - High
Low 6.55(12/8) 5.11(2/10)
6.24(2/29) 5.00(2/10)
5.73(11/7) 4.48(1/20)
4.45(12/7) 3.40(2/2)
1968 - High Low
7.02(12/13) 6.13 (8/30)
6.55(1/27) 5.95(9/13)
5.90(1/20) 5.18(8/9)
4.85(1/26) 4.07(8/8)
1969 - High Low
8.67(11/28) 6.90(2/21)
7. 50(11/28) 6.55(1/3)
6.84(11/21) 5.96(1/24)
6.58(11/26) 4.82(1/28)
1969 - Oct. 24 3.1
7.82 7.87
7.31 7.25
6.30 6.58
6.07 6.13
Nov. ' 7 14 21 28j>/
8.13 8.27 8.44 8.67y •
7.26 7.29 7.38 . 7.50 z
6.61 6.71 6.84 6.80
6.11 6.17 6.36 6.58
1 New corporate, issues, with call protection, adjusted (as described in footnote 1 of Table 1) to a Aaa basis.
2 Weekly average of daily figures. Average term of bonds included is 22-24 years.
3 Weekly average of daily figures. 4 Thursday.figures. The average rating of the 20 bonds used in this index
falls midway between the four top groups as classified by Moody's In-vestors Service. . -
Note--Highs and lows are for individual series and may be on different dates for different series.
Digitized for FRASER http://fraser.stlouisfed.org/ Federal Reserve Bank of St. Louis

HIGH GRADE BOND YIELDS
1965 1966
J \ / Per cent I i !• i i i ii ii i i | ii i i i i i yil i | s
NEW CORPORATE Aaa t
MOODY'S CORPORATE Aaa
U.S. GOVT. 20-YR. CONSTANT MATURITIES
BOND BUYER MUNICIPAL
i i i i i i i i i i i I i i t i i ii i i i i
1968 1969
Digitized for FRASER http://fraser.stlouisfed.org/ Federal Reserve Bank of St. Louis

TABLE 4: Long-term Corporate and State and Local Government Security Offerings and Placements
(In millions of dollars)
PERIOD
GROSS- PROCEEDS
PERIOD CORPORATE1 STATE AND LOCAL 2 PERIOD
1969p 1968p 1967 1969 p. 1968p 1967
January 2,075 1,771 1,684 ' 1,262 1,178 1,492 February 2,045 1,608 1,418 1 987 1,158 1,236 March 2,098 1,799 2,362 538 1,404 1,450
April 2,748 1,428 2,015 I 1,801 1,318 1,130 May 2,076 1,866 1,518 ! 1,109 1,143 1,254 June 2,530 2,411 2,674 '
j 734 1,395 1,497
July ! 2,450 2,143 2,589 1,092 1,469 950. August 1,489 1,43.2 2,481 804 1,699 860 "September 2,480e 1,557 1,763 j 534- 1,444 1,340
October • 2,110e 2,129 2,409 1,250e 2,230 975 November 2,110e 1,767 1,500 860e 1,021 1,401 December l,900e 2,054 2,385 600e 1,115 1,182
1st Quarter 6,218 5,178 5,464 2,787 3,740 4,177 2nd Quarter 7,354 5,704 6,208 3,644 3,856 3,881 . 3rd Quarter 6,419e 5,133 6,832 2,430e 4,612 3,150 •4th Quarter 6,220e 5,95a 6,294 2,700e 4,366 3,557 -
2,710e 1st half 13,522 10,882' 11,672 6,431 7,956 8,059 Three quarters 19,991e 16,015 18,504 8,861 12,008 11,209 Year i6,211e 21,965 24,798 11,571e 16,574 14,766
Excluding finance compahies 3
1st Quarter 6,170 5,107 5,308 | 2nd Quarter 5,427 6,063 , 3rd Quarter 4,785 6,584 4th Quarter 5,654 5,859
Year 20,973 23,814
1 Securities and Exchange Commission estimates of gross proceeds. 2 Investment Bankers Association of America estimates of principal amounts. 3' Total gross proceeds excluding offerings of sales and consumer finance
companies.
Digitized for FRASER http://fraser.stlouisfed.org/ Federal Reserve Bank of St. Louis

TABLE 5: New Corporate Security Issues, Type of Issue and Issuer (In millions of dollars)
QUARTER OR MONTH
1968 - III IV
1969-1 II life/
1968 - Oct, Nov. Dec.
1969 - Jan. Feb. Mar. Apr. May June July Aug. Sept. Oct.
GROSS PROCEEDS BY TYPE OF ISSUE
TOTAL
5,133 5,951 6,218 7,354 6,419
2,129 1,767 2,055 2.075 2,045 2,098 2,748 2.076 2,530 2,450 1,489
4/2,480 1/2,110
PUBLICLY PRIVATELY OFFERED PLACED
2,606 2,555 2,657 3,411 3,194
COMMON AND— PFD. STOCK
1,009 939 607 980 842 835
1,268 871
1,272 1,279 .685
1,230 960
1,361 1,922 1,540 1,673 1,460
595 362 965 636 395 509 649 510 514 591 319 550 500
1,166 1,474 2,023 2,268 1,764
525 466 483 460 808 755 830 694 744 579 485 700 650
MEMO: ISSUES INCLUDED
FOREIGN CONVERTIBLE
124 113 215 227 n.a.
24 49 40 103 74 38 62 28 137 132 122 n.a. n. a.
1,037 902
1,355 1,126 . 673
365 211 326 376 578 401 430 463 233 206 167 300 50
GROSS PROCEEDS BY TYPE OF ISSUER
MFG. PUBLIC UTILITY
COMMUNI-CATIONS
1,657 1,712 1,407 1,773 1,954
640 421 651 403 513 491 513 569 691 881 382 700 450
1,160 1,435 1,346 1,878 "1,417
674 443 319 627 315 404 784 392 702 492 505 420 640
Other issuers are extractive, railroad and other transportation, real estate and finance, and commercial and other. , /-Source: Securities and Exchange Commission. Quarterly supplements are'avail-able. •
' ' • ' ' • • \ '
490 319 473 432 672
115 162 41 186 56
231 44 197 191 286 126 260 120
ISSUERS 1
1,825 2,483 2,993 3.266 X.368
700 741
1,044 860
1,161 972
1,405 915 946 792 476
1,100 900
Digitized for FRASER http://fraser.stlouisfed.org/ Federal Reserve Bank of St. Louis

TABLE 6: Large Long-term Public Security Issues for New Capital (Other than U.S. Treasury) 1
November 1 through November 28, 1969. AMOUNT COUPON (MILLIONS \ . RA i . : OR OFKI- R- • Moouy1
ISSUER TYPE 'y OF MATURITY M.i I..TER- INC • RA't l .\(, DOLLARS) 1 M' COST YIELD
Corporate
Signal Companies, Inc. S.F. debs. 100. 0 1994 8.85 8.85 Baa Public Service Elec. & Gas
Baa
Company Debs. 60. ,0 1996 8-3/4 8.65 A Consumers Power Company 1st mtg. 55. ,0 1999 8-1/4 8.30 Aaa Cleveland-Electric Illumina-
8-1/4 Aaa
ting Co. 1st mtg. 35, .0 1991 8-3/8 8.27 Aaa Columbia Pictures, Inc. Conv. sub. debs. 30. ,0 1994 5-3/4 5.75 B South Central Bell Debs. 125. ,0 2001 8-1/2 8.45 Aaa Zurn Industries, Inc. Conv; sub. data. 18. ,0 1994 5-3/4 5.75 Ba B.F. Goodrich Company S.F. debs. 100. ,0 1994 8-1/4 8.25 A Iowa Elec. Light & Pwr. Co. 1st mtg. 20. ,0 1999 - 8-5/8 8.60 A a Montgomery Wards Credit Corp. Debs. 50. ,0 1989 • 9.00 9.00 N.R. *; Motorola Com. stk. 59. ,4
• 9.00 9.00 N.R.
Boston Edison Company 1st mtg. 50. ,0 1999 9.00 8.90 Aa Texas Utilities Company Com. stk. 32. .9
8.90 Aa
May Department Store Credit Company Debs. 50. ,0 1989 , 9.00 9.00 . N.R. .
Union Electric Company Cum. pfd. stk. 32. 3 McCulloch Oil Corporation Debs. 30. .0 1989 6-1/4 6.25 Arlan's Dept. Store, Inc. ConV. sub. ( Jebs. 15. ,0 1994 6.00 6.00 Ba Pacific Gas & Elec. Co. 1st & ref. 80. ,0 2001 8.94 8.81 Aa
*Mtge. Trust of America Benef. int. 63 .4 8.94 8.81 Aa
Niagara Mohawk Pwr. Corp. Gen. mtge. 75, .0 1999 9.13 9.13 A Seatrain Lines, Inc. Conv. stb. i debs. 50, .0 1994 6.00 6.00 B Louisiana Pwr. & Lt. Co. 1st mtg. 25, .0 1999 9-3/8 9.25 A Hawaiian Elec. Co. 1st mtg. 18, .0 1974 9.00 8.81 A Capital Mtge. Investment benef. int. 2Q.0
8.81 A
Digitized for FRASER http://fraser.stlouisfed.org/ Federal Reserve Bank of St. Louis

TABLE 6: Large Long-term Public Security Issues for New Capital (Other than U.S. Treasury)1
(continued) , November 1 through November 28. 1969
ISSUER
State & local Government
Albany Co., New York Chicago Park Dist., 111. H. A. A* Louisville, Kentucky Vermont, State of Penna. High Ed. Fac. Auth. Gallipolis, Ohio Gallipolis, Ohio Washington, State of Washington, State of Plymouth Comm. S/D, Mich. Harrisburg Incinerator Auth,
Pennsylvania Dallas, Texas East Chicago Sanit. Dist.,
Ind. Penna. Sch. Bldg. Auth. Puerto Rico Boston, Massachusetts St. Paul, Minnesota Jersey City, New Jersey New Jersey Turnpike Auth.
TYPE
AMOUNT (MILLIONS
OF DOLLARS)
G.O. G.O. Bonds Wtr. rev. G.O. Rev. 1st. mt& & rev. 1st mt^&rev. Rev. Rev. .0.
Rev. G.O. & Rev.
0. Rev. .0. .0. .0.
Rev.
MATURITY
i.OUPON HAT.: OR , I;. i 1..THR-ist cost
OFFER-ING
Y] ELI)
MOOI'Y ' KATIM.
70.0 1970-89 6.19 5.20-6. .20 A 10.0 1975-79 6.00 5.75-5, ,90 A-l 32.9 1971-2010 6.00 5.00-5, .97 Aaa 25.0 1984 6.37 5.10-6. .35 A 25.0 1971-89 5.69 5.00-5. .75 Aaa 15.3 1973-09 6.67 5.80-6. .88 N.R, 2.8 1972-1999 - - - 7.10-7. .50 7.2 1972-1999 — — 5.10-5. .65
7 4.0 ' 1973-2000 6.95 5.90-7. ,00 15.0 1973-2000 6.95 5.90-7. 00 11.0 1972-1998 6.00 * N.R. Baa
12.5 1972-89 6.61 6.61 Aa 24.4
17 jO 52.7 50.0 24.0 11.5 10.0 137.0
1970-89
1972-93 1972-2008 1971-90 1970-1999 1970-99 1970-89 2009
5.89 5.25-6.15,8.00 Aa
7.06 7.00 6.41 6.86 N.R. 7.89 7.05
5.90-7.00 5.60-7.00 5.50-6.60 5.75-6.80 5.20-6.30 6.80-7.60
7.05
A Aa A-1 Baa Aa Baa N.R.
Digitized for FRASER http://fraser.stlouisfed.org/ Federal Reserve Bank of St. Louis

TABLE 6: Larcje Loiki term Public Security Issues for New Capital (contimii d lOthet than U.S. Treasury)1
(continued) November 1 through November 28, 1969.
Other
F.H.L.B. F.H.L.B. Manitoba (Prov. of) Nova Scotia (Prov. of) Canada
Consol. bds. Consol. bds. Debs.
S.F. debs.
AMOUNT (MILLIONS
OF
DOLLARS)
MATURITY
COUPON RATE OR
NET INTER -EST COST
250.0 200.0 50.0
35.0
1974 1972 1994
1994
8.00 8.20 8 -7 /8
9.00
> HTKR - ' MOODY'S i:.( : RATING
Vll.1.1)
8.00 8.20 8.89
9.20
Rights of Coring. i Includes corporate and other security offerings of $15 million and over; State and local security offerings of $10 million and over. In case of State and local government securities, G.O. denotes genera obi i gat i on ; '<ev. - Ut. , revenue obligations secured only by income from public'.ut i 1 i t i es ; Rev. -Q.-lit., revenue bonds secured only by income from quas i -ut i 1 i t i es; Rev.-S.T., revenue bonds secured by revenue from specific taxes only; Rev.-Kent., revenue bonds secured solely by lease payments. Includes foreign government and International Bank for Reconstruction and Development issues and non-quiranteed issues by Federal Agencies.
Digitized for FRASER http://fraser.stlouisfed.org/ Federal Reserve Bank of St. Louis
TABLE 7: Forthcoming Large Long-term Public Security Offerings for New Capital (Other than U.S. Treasury)1
(continued) As of November 28, 1969.
AMOUNT (MILLIONS APPROXIMATE DATE
ISSUER TYPE - OF OF OFFERING
DOLLARS)
Corporate
Union Tank Car Co. Equip.tr. ctfs. 25 .0 December 1 Kane-Miller Corporation S.F. debs. 22 .5 December 1 Natural Gas Pipeline Co. of America 1st pipeline 30 .0 December 1
Pacific Telephone & Tele-graph Debs. 150 .0 December 2
Quebec Hydro-Elec. Comm. Debs. 50 .0 December 2 Investors Funding Corp. of New York Debs. 21, .0 December 2
FirstT& Merchants Corp. Conv. sub. debs. 20, .0 December 2 Investment Properties Assoc. Jr. mtg. 78, .0 December 2 Mississippi Pwr. & Lt. 1st mtg. 20, ,0 December 3 Heller (Walter E.) & Co. Debs. 30, .0 December 3 Northwest Natural Gas Co. Bonds 15, .0 December 3 Columbus & Southern Ohio Elec. Co. 1st mtg. 20. .0 December 4
Detroit Edison Company Gen. ref. 75.0 . December 4 General Public Utilities Debs. 50. 0 December 8 Tenneco Corporation Debs. 75. ,0 December 9 Public Srv. Co. , Indiana Bonds 40. ,0 December 9 Ohio Power Company 1st mtg. 80. ,0 December 9 Public Services Elec. & Gas Company Pfd. stk. 35. ,0 December 9
Atlanta Gas & Light Co. Bonds 20. ,0 December 9 Northern Illinois Gas Co. Bonds 20.0 December 10 Arkansas Pwr. & Lt. Co. 1st mtg. 25. 0 December 11 *Florida Pwt. & Lt. Co. Bonds 50. 0 - 60.0 December 11 Southwestern Elec. Pwr. Co. 1st mtg. 35. 0 December 15 Baltimore Gas & Elec. Co. 1st mtg. 30. 0 December 16 General Telephone of Calif. 1st mtg. 60i0 December 16 Pennsylvania Company Debs. 50. 0 December 16 South Carolina Elec. & Gas Bonds 15. 0 December 17
*Central Telephone & Util. •-
Corporation S.F. debs. 25. 0 December 17 *Guardian Mtg. Investors Conv. sub. debs. 15. 0 December 22 Iowa Pwr. & Light Co. Bonds 15. 0 January 5 Ohio Bell Debs. 100. 0 January 6 Central Pwr. & Lt. Co. Bonds 25. 0 January 7
Digitized for FRASER http://fraser.stlouisfed.org/ Federal Reserve Bank of St. Louis

TABLE 7: Forthcoming Large Long-term Public Security Offerings for New Capital (Other than U.S. Treasury)V
AMOUNT (MILLIONS APPROXIMATE DATE
ISSUER TYPE OF OF OFFERING DOLLARS)
Others
Quebec Hydro-Elec Comm. *F.N.M.A.
Debs. Debs.
50.0 600
December December
Included in table for first time. . Includes corporate and other issues of $15. million and over; State and local Government issues of $10 million and over. • ' -Includes foreign government and International Bank for Reconstruction and Development issues and non-guaranteed issues of Federal Agencies. Postponed this week were: State of Maryland - 40.0, no bids received because of a 57o interest limitation. State of Mississippi - 20.0, no bids received because of a 6% interest limitation. New Jersey, State - 75.0; market conditions.
Digitized for FRASER http://fraser.stlouisfed.org/ Federal Reserve Bank of St. Louis

TABLE 7: Forthcoming Large Long-term Public Security Offerings for New Capital (Other than U.S. Treasury)1
1969. AMOUNT
(MILLIONS APPROXIMATE DATE ISSUER TYPE OF OF OFFERING
DOLLARS)
State and local Government i West Virginia, State of Rev. 90, .0 December 1 Chicago, 111. Airport rev. 56, .0 December 1 Mecklenburg co. N.C. G.O. 14. .3 December 1 Montgomery co. Md. G. 0. — 33, .0 December 2 New York State Dormitory Authority Rev. Eds. 32, .2 . December 2 Philadelphia, Pa. G.O. 64, .2 December 2 Richmond, Va. G.O. 38, ,0 December 3 , Atlanta, Georgia Rev. 18, .0 December 3 Texas, State of G.O. 15. .0 December 8 Chicago O'Hare Airport Rev 56. ,0 December 8 Oregon, State of G.O. 40. ,0 December 9 Oregon St. Bd. of Educ. G.O. .16- 0 December 9 ^Indianapolis, Ind. Rev. 10. ,0 December 10
Greater Chicago Metropoli-December. 11 tan Sanitary Dist., Ill G.O. 20. ,0 December. 11
Woodhaven S/D Michigan G.O. 12. ,0 ' . December 15
Oakland co. Wise. Rev. 11. 9 December 16 Port of Seattle, Wash. Bds. 16. 0 December 16
*Peabody, Mass. G.O. 15. 9 December 16 Ohio, State of Rev. 50. 0 December 16
Los Angeles JDWAPS Rev. 39. 0 December 17
San Francisco G.O. 49. 1 January . 12 San Francisco, Port Comm. Rev. 11. 0 January 14 Wheeler Ridge-Maricopa
21 Wtr. Dist., Col. Rev. 16. 0 January 21 Sacramento Municipal
22 Dist., Calif. Rev. 58. 0 January 22 *Hennepin,. Ramsey, Anoka,
Dakota. Washington, Scott; and Carver Cos. Metro-politan Council, Minn.
Rev. 11.0 January 22
Digitized for FRASER http://fraser.stlouisfed.org/ Federal Reserve Bank of St. Louis

it • ' • . ,
t . . TABLE 8: Stock Prices and Volume
. STOCK PRICESj1 TRADING VOLUME 2
DATE . S&cP 500 3 D.J. - IND. AMEX4 NYSE AMEX
1967 - High Low
1968 - High Low
1969 - High Low
1969 - Oct. 24 31
Nov. 7 14 21 28jj
97.59(9/25) 943.08(9/25) 24.52(12/29) 80.38(1/3) 786.41(1/3) 13.78(1/27)
108.37(11/29) 985.21(12/3) 33.24(12/20) 87.72(3/5) 825.13(3/21) 22.00(3/22)
105.94(5/16) 985.21(12/3) 33.24(12/20) 87.72(3/5) 825.13(3/21) 22.00(3/22)
98.12 862.26 * 28.37 97.32 855.99 28.37
98.26 860.48 28.61 97.07 849.85 28.31 94.-32 823.13 27.27
/93.81 812.30 27.34
60.7(8/14) 33.5(10/27) 27.4(1/6) 8.3(1/6)
82.1(6/7) 45.4(6/7) 34.0(2/23) 14.1(2/23)
82.1(6/7) 45.4(6/7) 34.0(2/23) 14.1(2/23)
79.5 32.7 62.8 25.0
60.0 26.4 47.1 19.1 54.2 18.1 41.7 15.9
1 Figures other than highs and lows are Fridays only. Highs and lows are for the year and are not necessarily for Fridays.
v 3 1941-43 =10.
2 Total number of shares traded per week (millions of shares). In the past, trading was normally conducted 5 days a week for 5 1/2 hours per day, or 27 1/2 hours per week. From August 8 through August 20, 1967, daily trad-ing was reduced to 4 hours per day or 20 hours per week. A 20-hour week was also in effect from January 22 through March 1, 1968. From June 30 through December 31, 1968, the exchangesSwere open 5 1/2 hours for 4 days a week or 22 hours. From January 3 through July 3, 1969, the exchanges were open 4 hours each day, 20 hours per week. Beginning July 7, 1969 the exchanges have been open 4 1/2 hours each day, 22 1/2 hours per week. NYSE is New York Stock Exchange; AMEX is American Stock Exchange.
4 Average dollar value of shares listed.
Digitized for FRASER http://fraser.stlouisfed.org/ Federal Reserve Bank of St. Louis

15
! •
I
STOCK PRICES AND TRADING VOLUME AMEX 37
STOCK PRICES
AMEX PRICE LEVEL INDEX
V S&P's 500
AMEX TRADING VOLUME (TOTAL FOR WEEK)
xillJl
NYSE TRADING VOLUME (TOTAL FOR WEEK)
|iil .! .i * .i I:'!- !.!" ••
;; jii&iiiiiiml!!!;-'Vi::v
1969
4 0
20
0
80
60
40
20
Digitized for FRASER http://fraser.stlouisfed.org/ Federal Reserve Bank of St. Louis

TABLE 9: Security Credit
END OF PERIOD
CREDIT EXTENDED MARGIN CUSTOMERS
TO BY:
CUSTOMERS' NET DEBIT
CUSTOMERS' NET FREE CREDIT BALANCES
NET CREDIT EXTENDED BY BROKERS AND DEALERS 3 END OF PERIOD BROKERS | BANKS 2 J TOTAL BALANCES
CUSTOMERS' NET FREE CREDIT BALANCES
NET CREDIT EXTENDED BY BROKERS AND DEALERS 3
Outstanding:
1968 - Sept. 6,390 .2,520 8,910 8,724 3,126 5,590 Oct. 6,250 2,560 8,810 8,859 3,407 5,452 Nov. 6,200 2,630 8,830 9,029 3,419 5,610 Dec. 6,200 2,710 8,900 . 9,970 3,717 6,073 \
1969 - Jan. 5,930 2,750 8,680 9,042 3,597 . 5,445 Feb. 5,750 2,810 8,560 9,148 3 ,"647 5,501 Mar. 5,590 2,780 8,370 8,318 3,294 5,024 Apr. 5,570 2,760 8,330 8,044 3,077 4,967 May 5,670 2,770 8,440 8,474 3,084 5,390 June 5,340 2,740 8,080 8,214 3,085 5,129 July 5,170 2,700 7,870 7,515 2,783 4,732 Aug.' r/5,000 2,670 7,670 7,019 2,577 4,442 Sept.j)/ ' 4,930 2,620 7,550 7,039 2,579 4,460
Change in Outstanding:
1968 - Sept. -70 30 -40 235 142 Oct. -140 40 100 135 281 -138 Nov. -50 70 20 170 12 158 Dec. 80 80 761 298 563
1969 - Jan. -270 40 -220 -928 -120 -628
Feb. -180 60 -120 -51 50, -9
1 Mar. -160 -30 -190 -830 -351 -477 Apr. -20 -20 -40 -274 -217 -57
May 100 10 110 430 7 423
June : -330 -30 -360 • -260. 1 •261 July -170 -40 -210 -699 -302 -397 Aug. r/-170 -30 -200 -496 -206 -290 Sept.2) -70 -50 -120 20 2 1 8 -
Margin debt, as reported by the New York Stock Exchange. Although margin debt until March 1968 included loans secured by U.S. governments, the amount of such loans included is thought to have been small.
2 "Bank loans to others than brokers and dealers for purchasing or carrying secu-rities other than U.S. governments." .
3 The difference between customers' net debit balances and customers'net free cre-dit balances, this figure represents the net credit extended by brokers and dealers to the. nonfinancial public.- / NOTE: With the exception of bank loan data, figures are supplied by the New York Stock Exchange and are end of month data. Bank loans are for weekly reporting large commercial banks, Broker data includes loans for regulated securi ties; bank ' ' data includes loans for the purpose of purchasing or carrying any security, whQt [un-regulated or not.
Digitized for FRASER http://fraser.stlouisfed.org/ Federal Reserve Bank of St. Louis

. . \ ./ ' ' ' \ ' a
TABLE 10: Savings, Flows at Nonbank Depositary Intermediaries - \ ($ millions) . \
MUTUAL SAVINGS-BANKS SAVINGS . St LOAN ASSOCIATIONS 'total REGULAR DEPOSITS 3 net SHARE CAPITAL NET . DEPOSITS | NET
DATE ANNUAL NEW ANNUAL NEW: ANNUAL NEW NET GROWTH MONEY2 , NET .GROWTH • MON EY 2 NET GROWTH ' money;2
FLOW RATE 1 FLOW RATE 1 FLOW RATE 1
Not Seasonally Adiusted i 1966 2,557 4.9 227 3,584 3.2 -552 6,141 3.8 -325 1967 5,082 9.3 2,376 10,687 9.4 6,129 15,769 9.4 8,505 1968 4,186 7.b\ 1,143 7,396 5.9 2,676 11,582 6.3 3,819 1969 to date 2,107 -684 3,684 -782 5,791 -1,466
1968 - Aug. 238 181 389 366 627 547 Sept. 505 -38 1,133 348 1,638 310 Oct. 202 89 495 - - 446 697 - - 535
1969 - Aug. 95 24 - 8 - 2 5 87 1 Sept. 3 % — e. -269 877 -104 1,184 -.373 Oct.£/ -138 -266 -379 -405 -517 - -671
Seasonally Adjusted 1969 - May 357 6.6 - — 498 4.5 855 5.2
June 178 3.3 - - 491 4.4 - - 669 4.0 July -47 -0.9 — — -40 -0.4 -87 -0.5 _ _
Aug. 191 3.6 — — 275 2.5 466 ' 2. 7 Sept. 172 3.1 — "" 500 4.5 672 4.0 Oct. j>/ 26 0.5 -101 >0.9 - -
-75 "0.4 - -
V 1 Annual growth rate for monthly data is the annualized monthly percentage increase in deposits; 2 Net New Money is new deposits net of both withdrawals and interest. Data for SM,s arc for
insured associations only, which represent 967. of industry total resources. 3 Regular deposits at mutual savings banks exclude items such as Christmas club and certain
escrow accounts, which represent a very small part of total deposits. SOURCES: National Association of Mutual Savings Hanks and Federal Home Loan Hank Hoard.
Digitized for FRASER http://fraser.stlouisfed.org/ Federal Reserve Bank of St. Louis

SAVINGS FLOWS (seasonally adjusted) Monthly Millions of dollars
2000
1600
TOTAL 1200
800
400
400
SAVINGS & LOANS
MUTUAL SAVINGS BANKS
1965 1966 1967 1968 1969
Digitized for FRASER http://fraser.stlouisfed.org/ Federal Reserve Bank of St. Louis

' • • • • • • ' . ' ' v ' /
TABLE 11: Mortgage Commitments at Selected Thrift Institutions 1
OUTSTANDING COMMITMENTS " I NET CHANGE ' ' ALL MUTUAL 1 ALL , MUTUAL .
DATE. TOTAL SAVINGS & . . SAVINGS TOTAL SAVINGS & SAVINGS LOAN v BANKS LOAN BANKS ,
ASSOCIATIONS (N.Y. v STATE) ASSOCIATIONS 22 I
(Billions of Dollars, Sea sonally Adjusted) 1/
1968 - Sept. 9.1 6.2 2.9 .14 V .10 • ,04 Oct. 9.5 6.4 3.0 .35 .22 , .13 Nov. 9.7 6.5 3.2 .27 .10 ' .17 Dec. 9.7 6.6 3.1 -.01 .08 -.10
1969 - Jan. 9.9 6.7 3.2 .15 .08 .07 Feb. 10.1 6.9 3.2 .25 .22 .03 Mar. 10.3 7.0 3.3 .17 . 09 . 08 Apr. 10.5 7.2 3.3 .19 .18 .01 May 10.3 .7.1 3.2 -.19 -.10 -.09 June 10.2 7.0 3.2 -.09 -.05 -.04 July 9.9 6.8 3.1 -.28 -.21 ' -.08 Aug. 9.5 " 6.5 3.0 -.43 - .32 -.11 Sept. 9.1 6.3 2.8 r. 36 -.21 . "-IS
i
Digitized for FRASER http://fraser.stlouisfed.org/ Federal Reserve Bank of St. Louis
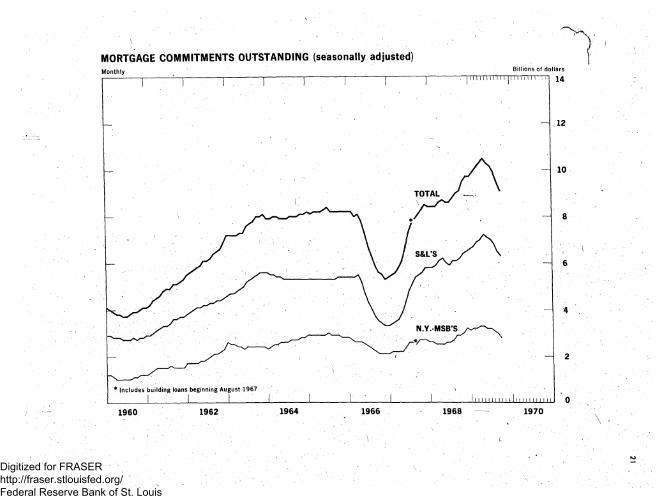
MORTGAGE COMMITMENTS OUTSTANDING (seasonally adjusted)
T O T A L
S & L ' S
N . Y . M S B ' S
* Includes building loans beginning August 1967
1 9 6 4 1 9 6 6 1 9 6 8 1 9 7 0 1 9 6 2 1 9 6 0
Digitized for FRASER http://fraser.stlouisfed.org/ Federal Reserve Bank of St. Louis

TABLE 12: Net Change in Mortgage Holdings 1
FINANCIAL INSTITUTIONS TOTAL
INCLUDING FNMA-GNMA
TOTAL I COMMERCIAL | BANKS
MUTUAL SAVINGS BANKS
SAVINGS &| TTFE LOAN INSURANCE"
ASSOC. COMPANIES
1966 1967 1965-
1968: - May June July
x Aug. Sept.
1969 - May June July
J Aug. Sept. Oct.
1969 - Jan. Feb. Mar. Apr. May June July Aug. Sept. Oct.
18,197 19,988 23,779
2,197 2,151 1,835 1,995 2,000
2,165 2,387 1,688 2,124
r/1,987
2,090 2,256 2,023 2,129 2,035 2,142 1,672 1,894
r/1,935
15,874 18,191 21,271
1,962 1,931 1,683 1,854 1,892
1,980 2,165 1,395 1,596
r/1,486
1^935 2,073 1,827 1,923 1,814 1,871 1,348 1,351
r/1,421
705 2,760 3 = ,761 369 3,118 7. ,538
677 2,796 9: ,330
597 203 957
645 219 901 517 248 718 549 233 874 746. 221 810
600. 233 988 575 230 1, ,216 200 215 865
400 181 844 500 r/120 687 300 158 595
638 672 637 571 535 437 147 277 421 243 .
Seasonally Adjusted
890 874
303 269 208 253 258 231 163 147
r/133 - 114
852 897 842
1,033 869 725 668 623
4,648 2,914 2,468
205 166 200 198 115
159 144 115 171 179 n.a.
104 258 130 202 179 170 169 202 199
Monthly data for commercial banks based on Federal Reserve estimates benchmarked to Call Report data on real estate loans outstanding as available. Other data derived from mortgage debt outstanding as reported separately by National Assn. of Mutual Savings Banks, Federal Home Loan Bank Board, Institute of Life Insurance and, through August 1968, the Federal National Mortgage Association, and there-after by FNMA and the Government National Mortgage Association. Data for mutual savings-banks and for Life Insurance companies may differ somewhat from those derived from regular quarterly series because of minor conceptual differences for which adjustments are not made in the monthly series. Altogether, these groups accounted for 87 per cent of the net, increase .estimated for all holders in 1967.
Digitized for FRASER http://fraser.stlouisfed.org/ Federal Reserve Bank of St. Louis

23
NET CHANGE IN MORTGAGE HOLDINGS (seasonally adjusted) Monthly Bil l ions of dollars
3.0
TOTAL, INCL. FNMA - GNMA
FINANCIAL INSTITUTIONS 1.5
1.0
1969 1967 1968 1966
Digitized for FRASER http://fraser.stlouisfed.org/ Federal Reserve Bank of St. Louis

24 .
TABLE 13: Net Increases in Mortage Debt Outstanding 1
Billions of dollars, SAAR 2
, 1- to 4- MULTI- MULTI-AND • QUARTER TOTAL RESIDENTIAL FAMILY FAMILY COMMERCIAL COMMERCIAL FARM
1965 - I 24.9 18.6 15.1 3.5 4.2 8. 0 2.2 II 25.2 18.5 15.1 3.5 4.5 8.1 2.1 III 25.8 19.3 15.5 3.8 4.4 8.4 2.2 IV 26.6 19 76 15.8 3.8 4.6 7.9 2.4
1966 - I 28.3 19.0 14.7 4.3 6.9 . 11.6 . 2.4 II ' 24.2 15.6 12.1 3.5 6.5 10.0 2.2 III 18.4 10.8 8.3 2.6 5.4 8.3 2.1 IV 15.6 '9.5 7.2 2.3 4.3 6.2 1.7 •
1967 - I p 15.5 9.9 6.8 3.0 3.8 7.3 1.8 H p 20.4 13.7 10.5 3.3 4.8 8.1 1.9 III , 26.3 19.1 15.3 3.8 4.8 . 8.8 2.4 IV p 28.6 20.9 16.5 4.4 5.1 8.8 2.6
1968 - IP 26.9 18.2 15.4 2.8 6.2 9.4 2.4 IIP 25.8 17.9 14.8 3.1 5.7 8.7 2.3 III! 25.8 17.7 14.1 2.5 6.4 10.2 1.8 ivp 31.3 21.5 17.0 4.5 - 8.1 11.8 1.7
1969 - Ip 30.2 21.6 18.0 3.6 6,4 10.4 2.2 • IIP 28.4 20.7 16.5 4.2 5.3 9.4 2.4
IIIp 26.6 19.5 15.6 3.8 5i 1 9.2 • 2.0
1 Derived from data on mortgage debt outstanding from Federal Deposit Insurance Corporation, Federal Home Loan Bank Board, Institute of Life Insurance, National Association of Mutual Savings Banks, Departments of Commerce and Agriculture, Federal National Mortgage Association, Federal Housing
4 Administration, Veterans Administration and Comptroller of the Currency. Separation of non-farm mortgage debt by type of property, where not available, and interpolations and extrapolations, where required, estimated by Federal Home Loan Bank Board and the Federal Reserve.
2 Residential mortgage debt includes nonfarm only and is sum of 1-to 4-family and multifamily mortgage debt combined.
Digitized for FRASER http://fraser.stlouisfed.org/ Federal Reserve Bank of St. Louis
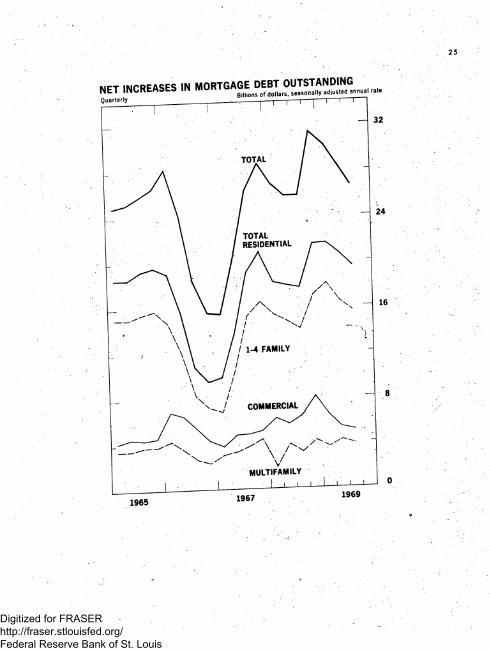
INCREASES IN MORTGAGE NET Quarterly
TOTAL
24
TOTAL RESIDENTIAL
I 1-4 FAMILY
COMMERCIAL y
X
MULTIFAMILY
1969 1967 1965
Digitized for FRASER http://fraser.stlouisfed.org/ Federal Reserve Bank of St. Louis

/ TABLE 14: FNMA Weekly vxAuction' ' Results
COMMITMENTS IN $ MILLIONS IMPLICIT YIELD2(per cent)
/ • ACCEPTED WEEK, TOTAL TOTAL , 90- 6- 4-YEARN 90- 6- 1-YEAR 1
ENDED. OFFERED DAY MONTH- & OVER DAY MONTH & OVER Sept. 2 252.5 150.5 22.9 94.8 32.9 8.33 8.34 8.21
8 242.7 152.4 29.0 98.7 24.6 8.34 8.36 8.22 15 241.8 144.8 33.4 81.7 29.7 8.36 8.40 8.24 22 247.5 145.1 38.1 72.6 34.3 8.40 8.44 8.27 29 257.7 144.2 45.5 69.5 29.2 8.45 8.48 8.30
Oct. 6 251.0 147.4 41.1 66.0 40.3 8.50 8.52 8.-34 13 217.7 145.7 48.6 50.1 46.9 8.54 8.59 8.39 20 161.6 134.9 35.7 60.8 38.3 8.58 8.63 8.44 27 120.6 118.4 r 37.7 52.8 28.0 8.54 8.60 8.45
Nov. 3 230.2 81.7 31. 0 44.1 6.6 8.44 8.49 8.45 10 267.4 101.9 45. ,1 50.6 6.2 8.47 8.49 8.47 17 242.6 122.7 45, .0 67.3 10.4 8.50 8.51 8.48 24 233.4 122.3 41 .6 67.7 13.0 8.53 8.54 8.50
Dec. l£y (120.0) 3/
Note: Under the FNMA auction system, approved sellers of Government-underwritten mortgages bid for FNMA forward purchase commitments, sub-ject to an over-all dollar limit announced by FNMA in advance. Bids accepted by FNMA are for delivery at the seller's option, and at any time within the specified period. Bids on proposed homes relate to construction not yet started on which mortgages may be. delivered only after completion and occupancy.
1 For "proposed construction" of new homes only.
Average secondary market yield after allowance for commitment fee and required purchase and holding"of FNMA stock, assuming prepayment of 15 years for 30-year Government-underwritten mortgages. Yields shown are. gross, before deduction of 50 basis points fee paid by investors" to servicers. ' •
3 FNMA announced limit of accepted bids for next week's auction. Digitized for FRASER http://fraser.stlouisfed.org/ Federal Reserve Bank of St. Louis

FN MA WEEKLY "AUCTION" RESULTS $ Mil l ions
120 AMOUNT OF ACCEPTED BIDS BY COMMITMENT PERIOD
100
1 YEAR AND OVER
4 0 6 MONTHS
20 3 MONTHS
Per cent
- I M P L I C i r Y I E L D ^ 8.6 6-MONTH COMMITMENTS
- - 8.0
7.4
1 1 1 1 ' 1 I . I . 1 • 1 1 1 1 - I I I I I I 6.8 $ Mil l ions
4 0 0
3 0 0
200 TOTAL BIDS RECEIVED
100 TOTAL BIDS ACCEPTED
FEB. APR. OCT. AUG. OCT. DEC. JUNE AUG. DEC. JUNE
1968 1969
Digitized for FRASER http://fraser.stlouisfed.org/ Federal Reserve Bank of St. Louis

(:
TABLE 15: Private Housing Starts and Permits
STARTS
SEASONALLY ADJUSTED ANNUAL RATE
TOTAL 1-FAMILY 2 OR MORE
UNADJUSTED
TOTAL TYPE OF FINANCING FHA | VA OTHER
BUILDING PERMITS (SEASONALLY ADJUSTED ANNUAL RATE) 2
1968 - Sept. Oct. Nov. Dec. <
1,592 1,570 1,733 1,509
1969 - Jan. % Feb.
Mar. Apr. May June July Aug. . Sept.£/jL Oct. £/L
1,878 1,686 1,584 1,563 1,509 1,469 L-,371 1,384 533 ,342
944 965 905 922
1,066 975 828 797 883 808 765 723 843 765
648 605 828 585
812 711 756 766 626 661 606 661 690 577
134.3 18.6 4 .6 . 111 .1 1,393 140.8 21.4 5 .3 114 .0 1,378 127.1 17.5 4 .2 105 .4 1,425 96.4 16.3 4, .4 75, .7 1,463
101.5 14.2 3. .8 83, .5 1,403 90.0 13.2 3, ,5 73. ,3 1,477 131.9 18.9 3. ,9 109. ,1 1,421 159.0 23.0 4. ,4 : 131. ,6 1,502 155.5 21.1 4. ,3 130. ,1 1,323 147.3 21.3 4. 6 121. 2 1,340 •125.2 20.8 4. 7 99. 7 1,228 124.9 22.4 4. 2 98. 3 1,245 128.6 18.3 4. 8 105. 5 1,201 118.7 24.9 5. 0 88. 8 1,119
Total starts are Census estimates including farm for both permit-issuing and noi.-issuing ar.eas. A dwelling unit is started when excavation begins; all units in an apartment structure are considered started at that time. FHA and VA starts .are units started under commitments by these agencies to insure or guar-antee the mortgages. As reported by FHA and VA, a unit is started when a field office receives the first compliance inspection report, which is made before footings are poured in some cases but normally after the foundations have been completed, Other starts are derived as a residual, although total and FHA and VA starts are not strictly comparable in concept or timing; other starts in-clude both units financed by conventional mortgages and units without mortgages. Building permits before January 1963 are Census estimates for about 10,000 areas identified as having a local building permit system in 1959. Estimates beginning January 1963 are for approximately 12,000 and beginning January 1967 13,000, or all known permit-issuing places. Unlike starts, seasonally adjusted building per-mits reflect direct adjustment for differences in the number of working days per month,'as well as other differences in timing and coverage.
V
Digitized for FRASER http://fraser.stlouisfed.org/ Federal Reserve Bank of St. Louis

PRIVATE HOUSING STARTS AND PERMITS Monthly,annual rates Millions of units
SEASONALLY ADJUSTED 2.0
HOUSING STARTS 1.6
1.2
BUILDING PERMITS (in issuing areas)
PER CENT OF UNADJUSTED TOTAL STARTS MULTI-FAMILY (2 or more) y
GOVERNMENT UNDERWRITTEN
1969 1965 1967 1963
Digitized for FRASER http://fraser.stlouisfed.org/ Federal Reserve Bank of St. Louis

TABLE 16: Mortgage and Bond Yields 1 .
FHA CONVEN- SPREAD BE- 1 " N EW SPREAD BETWEEN MORTGAGES 2 TIONAL TWEEN YIELDS Aa.a COR- YIELDS ON NEW
DATE . MORT- ON CONV. & PORATE CORPORATE BONDS 25-YEAR 30-YEAR GAGES FHA MORT- j BONDS AND
3 - GAGES 4 FHA MORTGAGES 1957 - High 5.63 n.a. . 6.00 .47 4.94 1.58 1968 - Low 5.35 n.a. 5.55 .15 3.65 .88 1959-60 - High 6.26 n.a. 6.30 .23 5.25 1.69 1961-66 - Low 5.43 5.44 5.80 .25 . 4.41 .77 1966 - High 6.73 6.81 6.70 .30 5.82 1.16 1967 - High n.a. 6.81 6.65 .11 6.51 1.28
Low n.a. 6.29 6.40 -.12 5.18 .27 . 1968 - High n.a. . 7.52 7.40 .12 6.79 1.20
Low n. a. 6.78 6.75 -.27 6.15 .26
1969 - Apr. 8.06 7.75 -.31 7.17 .89 May 8.06 7.75 ^ -.31 7.22 .84 June 8.38 8.00 -.35 7.58 .77 July n.a. 8.36 8.10 -.26 7.63 .73 Aug. . n.a. 8.36 8.20 -.16 7.65 .71 Sept. n.a. 8.40 8.25 - -.15 7.98 .42 Oct. n.a. 8.48 8.30 -.18 7.89 r59
1 Neither mortgage nor bond yields include allowance for servicing costs which are much higher for mortgages than for bonds. Generally, bonds pay interest semi-annually;" mortgages, monthly. Mortgage yields, if computed as equivalent to a semi-annual interest investment, would be slightly higher than given in the table. . . ^ :
2 Based on FHA-field-office opinions about average bid prices in the private secondary market for new-home mortgages for immediate delivery. Separate data available for 25-year and--beginning July 1961--30-year mortgages with minimum downpayments, weighted by probable volume of transactions. Yields computed by FHA, assuming prepayment period of 12 years for 25-year mortgages and 15 years for 30-year mortgages.' Over the period for which they can be compared, the movement of the two mortgage yield series has been similar. Dashed lines indicate periods of adjustment to changes in/contractual interest rates. • •
3 Based on FHA-field-office opinion on typical interest rates (rounded) on con-ventional first mortgages prevailing in the market areas of insuring office cities. Beginning with April 1960, rate rebates only to new-home mortgages; prior to that date, rate related to both new as well as existing-home mort-
• gages. Dashed line indicates this change in the series.. 4 See note for Table 1.
Digitized for FRASER http://fraser.stlouisfed.org/ Federal Reserve Bank of St. Louis

MORTGAGE AND BOND YIELDS Monthly Percent
HOME MORTGAGES: CONVENTIONAL
FHA
Aaa CORPORATE BONDS: NEW ISSUES / W
YIELD SPREAD (FHA MORTGAGE VS. NEW ISSUE Aaa CORPORATE BONDS) Basis points
200
100
1968 1962 1964 1966 1970
Digitized for FRASER http://fraser.stlouisfed.org/ Federal Reserve Bank of St. Louis

TABLET7: Conventional Mortgage Terms 1
NEW HOMES EXISTING HOMES CON- FEES &. LOAN/ CON- FEES & LOAN / TRACT CHARGES EFFEC- MATURITY PRICE LOAN TRACT CHARGES EFFEC- MATU- PRICE LOAN
DATE RATE (PER TIVE (YEARS) RATIO AMT. RATE (PER . TIVE RITY RATIO AMT. (PER CENT) RATE (PER ($000) (PER CENT) RATE (YEARS) (PER ($000) CENT) 2 3 CENT) . CENT) 2 3 CENT)
1968
Sept. 7.10 0.87 7.24 25 .5 74.2 22.1 7 .11 0.82 . 7.25 22.6 72.6 18.3 Oct. 7.09 0.88 7.23 25 .6 74.5 22.7 7 .09 0.84 7.22 22.5 72.4 18.3 Nov. 7.07 0.84 7.21 25. .4 "74.1 22.5 7, .07 0.82 7.21 22.7 72.9 18.9 Dec. 7.09 0.89 7.23 25, .9 74.0 24.7 7 .09 0.85 7.23 23.3 73.2 20.4
1969
Jan. 7.16 0.84 • 7.30 25, ,6 73.6 24.1 7. .18 0.86 7.32 22.8 72.6 20.0 Feb. . 7-26 0.81 7.39 25. .6. 73.3 23.5 7. ,28 0.86. 7.42 22.9 72.8 19.6 Mar. 7.32 0.93 7.47 25. .8 73.8 24.0 7. -35 6.84 7.49 < 23.0 72.7 20.2 Apr. 7.47 0.96 . 7.62 25. ,4 72.6 24.8 7. ,46 0.85 7.60 23.0 71.8 19.9 May 7.50 0.88 7:65 25, ,8 73.2 25.0 7. 54 0.83 ' 7.68 22.7 71.9, 19.7 June 7.62 0.84 7.76 25. 6 73.0 24.9 7. 64 0.86 7.79 22.8 71.4 20.1 July. 7.76 0.92 7.91 25. ,5 72.0 24.5 7. 79 0.91 7.94 22.8 71.7 20.1 Aug. 7.86 0.86 8.00 • 25. 2 72.a 24.3 7. 90 0.93 8.05 22.6 71.2 19.8 Sept. ,7.89 0.92 8.05 25. ,3 72.4 24.7 7. .92 0.92 8.08 22.2 70.7 19.2 Oct. £/ 7.97 0.§9 8.12 25. ,4 73.1 25.1 7. .98 0.91 8.13 22.3 70.3 19.6
1 Compiled by Federal Home Loan Bank Board in cooperation with Federal Deposit Insurance Corporation. Data are weighted averages based on probability sample survey of charac-teristics of conventional first mortgages originated by major institutional lender groups (including mortgage companies) for purchase of single family homes. Data cx-; elude loans for refinancing, reconditioning or modernization; construction loans to home-builders; and permanent loans which are coupled with construction loans to owner-builders. Related series on conventional mortgage rates only, based on unweighted opinions of field-office directors of the Federal Housing Administration, are available somewhat sooner than the results of the FHLBB-FDIC survey, and are included-in the case of new home mortgage rates--in Table 16.
2 Fees and charges--expressed as a percentage of the principal mortgage amount-rinclude loan commissions., fees, discounts, and other charges which provide added income to the lender and are paid by the borrower. They exclude any closing costs related solely to transfer of property ownership.
3 Includes fees & charges amortized over a 10 year period in addition to the* contract interest rate. \
Digitized for FRASER http://fraser.stlouisfed.org/ Federal Reserve Bank of St. Louis

- 33
CONVENTIONAL MORTGAGE TERMS Monthly Years
MATURITY
NEW 25
EXISTING
20
cent
LOAN/PRICE RATIO
NEW
EXISTING
70
1965 1963 1967 1969
• change in series
Digitized for FRASER http://fraser.stlouisfed.org/ Federal Reserve Bank of St. Louis