Embed Size (px)
Citation preview
Issue in Honor of Prof. Madeleine M. Joullié ARKIVOC 2007 (xii) 110-131
Degradation of rapamycin and its ring-opened isomer: role of base catalysis
Yuri V. Il’ichev*, Lori Alquier, and Cynthia A. Maryanoff
Cordis Corporation, a Johnson & Johnson Company,
Welsh and McKean Rds., Spring House, PA 19477 E-mail: [email protected]
Dedicated to Professor Madeleine M. Joullié on her 80th birthday
Abstract Rapamycin is a natural macrolide immunosuppressant with a distinct mechanism of action. Quantitative analysis of rapamycin poses many challenges associated with facile degradation and the multitude of isomeric forms. The primary goal of this study was to compare degradation of rapamycin and its ring-opened isomer, secorapamycin, in aqueous solution under identical conditions. Reaction kinetics and mechanisms were studied in 30/70 vol/vol acetonitrile-water mixtures containing either MeCOONH4 (apparent pH 7.3) or NaOH (apparent pH 12.2). Degradation kinetics was well described by the first-order rate law. For rapamycin in 237 and 23.7 mM solutions of MeCOONH4, apparent half-lives of 200 h and 890 h were obtained. When compared to the latter value, the rapamycin half-life was reduced by 3 orders of magnitude in the pH 12.2 solution. Under all conditions studied, secorapamycin degradation was significantly slower than that of the parent compound. Both specific and general base catalysis was observed for reactions of rapamycin and secorapamycin. Two primary products of rapamycin degradation were identified as individual isomers of secorapamycin and a hydroxy acid formed via lactone hydrolysis. No evidence for the interconversion between the products was obtained. In highly basic solutions, both products undergo fragmentation and water addition reactions. Keywords: Rapamycin, secorapamycin, degradation, kinetics, base catalysis
Introduction Rapamycin (Sirolimus, 1) is a natural macrolide immunosuppressant with a distinct mechanism of action.1-4 1 is a 31-membered macrocycle with 15 stereocenters and multiple functional groups. Antiproliferative activities of the compound found applications in the CYPHER® Sirolimus-eluting Coronary Stent used to prevent restenosis following angioplasty.
ISSN 1424-6376 Page 110 ©ARKAT-USA, Inc.
Issue in Honor of Prof. Madeleine M. Joullié ARKIVOC 2007 (xii) 110-131
NO
O
OOH
Me
OO
H
HMeO
Me
H
MeOH
OMeO
Me
MeOH
MeO O
Me
Me
1
5
43
26 7
8910
1112 14
1315
16
1718
19
2021
22
23 24
2526
2728
29
3031
3233
3435
3637
3839
4041
42
52
48
47
51
46
45
44
50
43
49
1
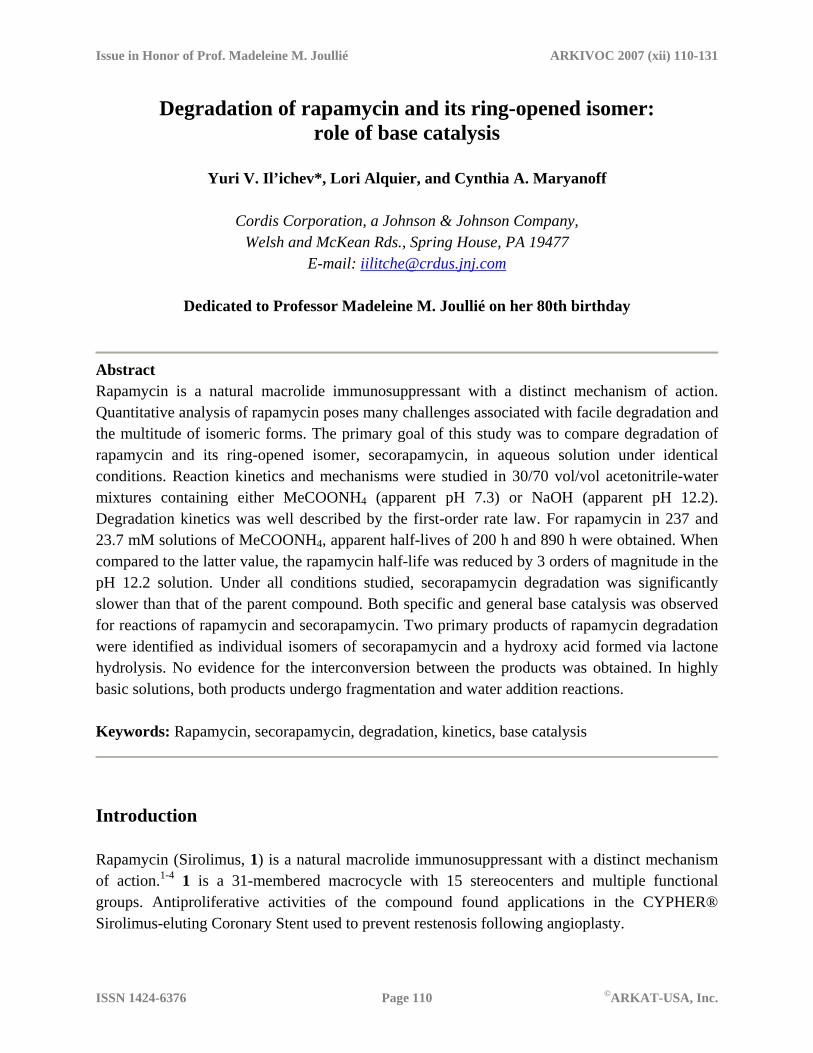
The use of rapamycin as an active pharmaceutical ingredient requires comprehensive
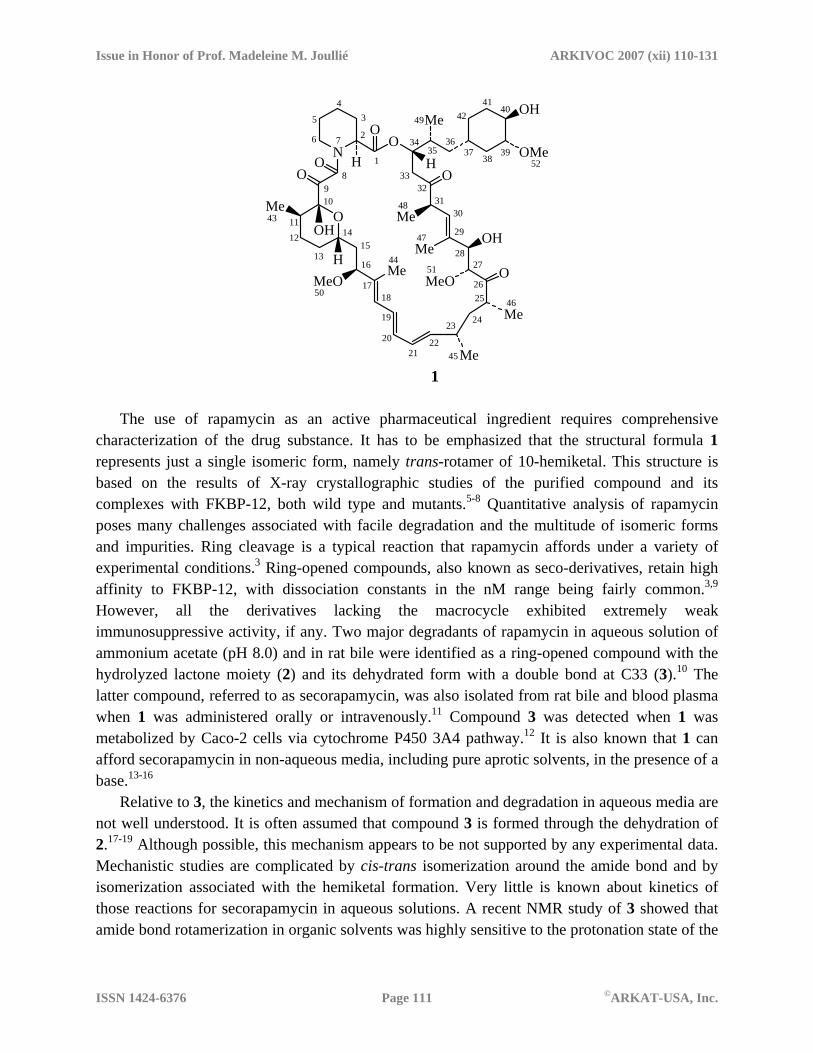
characterization of the drug substance. It has to be emphasized that the structural formula 1 represents just a single isomeric form, namely trans-rotamer of 10-hemiketal. This structure is based on the results of X-ray crystallographic studies of the purified compound and its complexes with FKBP-12, both wild type and mutants.5-8 Quantitative analysis of rapamycin poses many challenges associated with facile degradation and the multitude of isomeric forms and impurities. Ring cleavage is a typical reaction that rapamycin affords under a variety of experimental conditions.3 Ring-opened compounds, also known as seco-derivatives, retain high affinity to FKBP-12, with dissociation constants in the nM range being fairly common.3,9 However, all the derivatives lacking the macrocycle exhibited extremely weak immunosuppressive activity, if any. Two major degradants of rapamycin in aqueous solution of ammonium acetate (pH 8.0) and in rat bile were identified as a ring-opened compound with the hydrolyzed lactone moiety (2) and its dehydrated form with a double bond at C33 (3).10 The latter compound, referred to as secorapamycin, was also isolated from rat bile and blood plasma when 1 was administered orally or intravenously.11 Compound 3 was detected when 1 was metabolized by Caco-2 cells via cytochrome P450 3A4 pathway.12 It is also known that 1 can afford secorapamycin in non-aqueous media, including pure aprotic solvents, in the presence of a base.13-16
Relative to 3, the kinetics and mechanism of formation and degradation in aqueous media are not well understood. It is often assumed that compound 3 is formed through the dehydration of 2.17-19 Although possible, this mechanism appears to be not supported by any experimental data. Mechanistic studies are complicated by cis-trans isomerization around the amide bond and by isomerization associated with the hemiketal formation. Very little is known about kinetics of those reactions for secorapamycin in aqueous solutions. A recent NMR study of 3 showed that amide bond rotamerization in organic solvents was highly sensitive to the protonation state of the
ISSN 1424-6376 Page 111 ©ARKAT-USA, Inc.
Issue in Honor of Prof. Madeleine M. Joullié ARKIVOC 2007 (xii) 110-131
carboxylic moiety.19 Almost equal amounts of two rotamers were found for the protonated form; the cis-form predominated in solutions of the secorapamycin anion. The primary goal of this study was to compare the degradation of rapamycin and its isomer 3 in aqueous solution under identical conditions. Particular attention was given to kinetic aspects and acid/base catalysis.
NO
O
OOH
Me
OH
OH
HMeO
Me
MeOH
OMeO
Me
MeOH
MeOO
Me
Me
HOH
NO
O
OOH
Me
COOHH
HMeO
Me
HOOMe
O
Me
MeOH
MeOO
Me
Me
Me
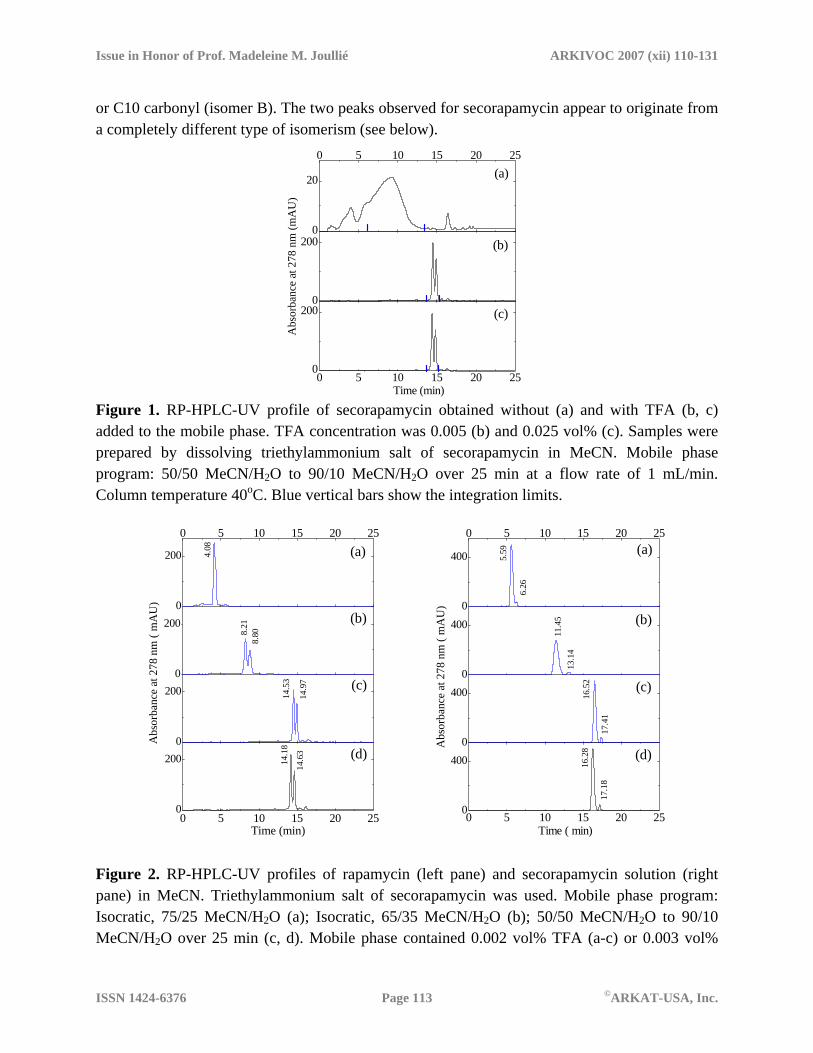
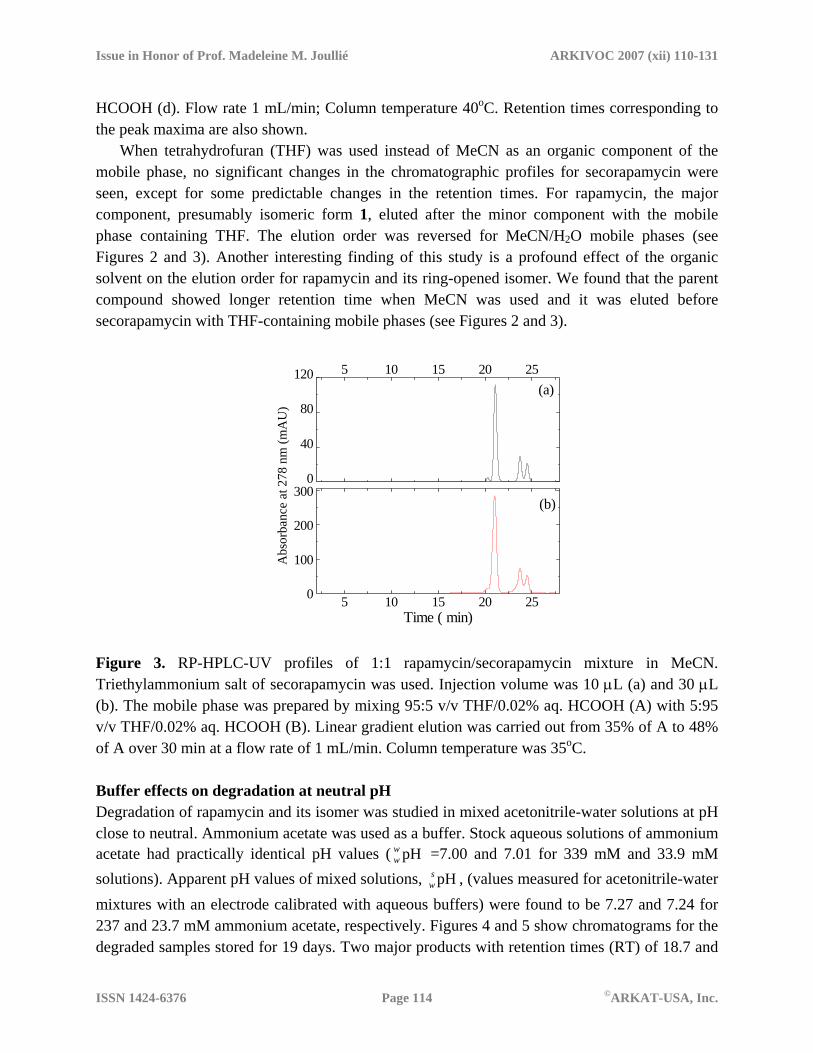
2 3 Results and Discussion Liquid chromatography of rapamycin and its isomer Reversed-phase liquid chromatography (RP-HPLC) of secorapamycin is strongly affected by acidic additives to the mobile phase. Figure 1 shows chromatograms obtained in the absence and in the presence of trifluoroacetic acid (TFA). Two distinct peaks were observed when the acid was present in the mobile phase. The area under each of the peaks was practically constant within the time limits shown with the blue bars. Absorption spectra showed little variation within those limits and were not affected by the mobile phase additive. Essentially the same chromatographic profiles were observed with TFA and HCOOH as mobile phase modifiers at concentrations as low as 0.002%. Only minor effects of the acid nature and concentration (up to 0.1%) on the retention times and peak shapes could be detected. Effects of the solvent program on the chromatographic profiles of rapamycin and its isomer are illustrated in Figure 2.
Chromatograms of both secorapamycin and rapamycin showed two distinct peaks. However, acidic modifiers did not affect rapamycin chromatography. Two peaks observed for rapamycin are typically attributed to two isomers with the cyclic hemiketal involving either C9 (isomer C)
ISSN 1424-6376 Page 112 ©ARKAT-USA, Inc.
Issue in Honor of Prof. Madeleine M. Joullié ARKIVOC 2007 (xii) 110-131
or C10 carbonyl (isomer B). The two peaks observed for secorapamycin appear to originate from a completely different type of isomerism (see below).
0
20
0 5 10 15 20 25
0
200
0 5 10 15 20 250
200
Abs
orba
nce
at 2
78 n
m (m
AU
)
(c)
(b)
(a)
Time (min)
Figure 1. RP-HPLC-UV profile of secorapamycin obtained without (a) and with TFA (b, c) added to the mobile phase. TFA concentration was 0.005 (b) and 0.025 vol% (c). Samples were prepared by dissolving triethylammonium salt of secorapamycin in MeCN. Mobile phase program: 50/50 MeCN/H2O to 90/10 MeCN/H2O over 25 min at a flow rate of 1 mL/min. Column temperature 40oC. Blue vertical bars show the integration limits.
0
2000
2000
200
0 5 10 15 20 25
0 5 10 15 20 250
200
(c)
14.6
3
14.1
8
4.08
8.808.
21
14.9
7
14.5
3
Abs
orba
nce
at 2
78 n
m (
mA
U)
(b)
(a)
(d)
Time (min)
0
4000
4000
400
0 5 10 15 20 25
0 5 10 15 20 250
400
16.5
2 (c)
17.4
1
(b)
11.4
5
Abs
orba
nce
at 2
78 n
m (
mA
U)
13.1
4
6.26
5.59 (a)
(d)
17.1
8
16.2
8
Time ( min)
Figure 2. RP-HPLC-UV profiles of rapamycin (left pane) and secorapamycin solution (right pane) in MeCN. Triethylammonium salt of secorapamycin was used. Mobile phase program: Isocratic, 75/25 MeCN/H2O (a); Isocratic, 65/35 MeCN/H2O (b); 50/50 MeCN/H2O to 90/10 MeCN/H2O over 25 min (c, d). Mobile phase contained 0.002 vol% TFA (a-c) or 0.003 vol%
ISSN 1424-6376 Page 113 ©ARKAT-USA, Inc.
Issue in Honor of Prof. Madeleine M. Joullié ARKIVOC 2007 (xii) 110-131
HCOOH (d). Flow rate 1 mL/min; Column temperature 40oC. Retention times corresponding to the peak maxima are also shown.
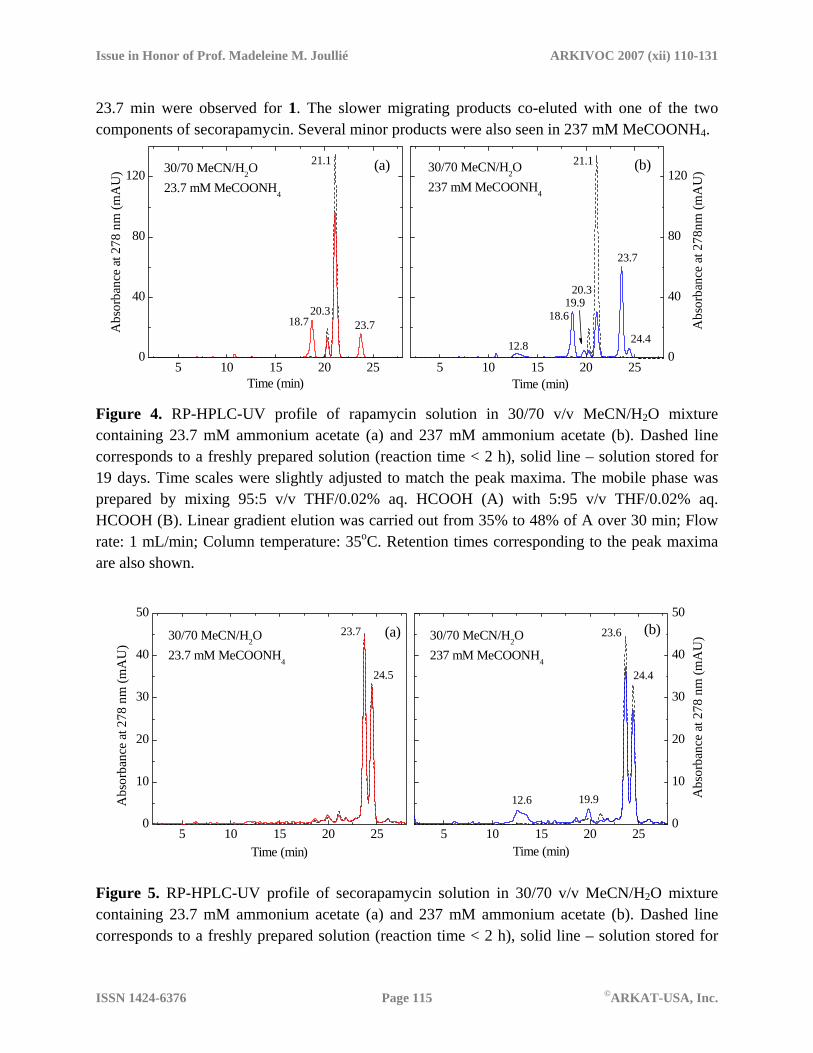
When tetrahydrofuran (THF) was used instead of MeCN as an organic component of the mobile phase, no significant changes in the chromatographic profiles for secorapamycin were seen, except for some predictable changes in the retention times. For rapamycin, the major component, presumably isomeric form 1, eluted after the minor component with the mobile phase containing THF. The elution order was reversed for MeCN/H2O mobile phases (see Figures 2 and 3). Another interesting finding of this study is a profound effect of the organic solvent on the elution order for rapamycin and its ring-opened isomer. We found that the parent compound showed longer retention time when MeCN was used and it was eluted before secorapamycin with THF-containing mobile phases (see Figures 2 and 3).
0
40
80
120 5 10 15 20 25
5 10 15 20 250
100
200
300
Abs
orba
nce
at 2
78 n
m (m
AU
)
(a)
(b)
Time ( min) Figure 3. RP-HPLC-UV profiles of 1:1 rapamycin/secorapamycin mixture in MeCN. Triethylammonium salt of secorapamycin was used. Injection volume was 10 µL (a) and 30 µL (b). The mobile phase was prepared by mixing 95:5 v/v THF/0.02% aq. HCOOH (A) with 5:95 v/v THF/0.02% aq. HCOOH (B). Linear gradient elution was carried out from 35% of A to 48% of A over 30 min at a flow rate of 1 mL/min. Column temperature was 35oC. Buffer effects on degradation at neutral pH Degradation of rapamycin and its isomer was studied in mixed acetonitrile-water solutions at pH close to neutral. Ammonium acetate was used as a buffer. Stock aqueous solutions of ammonium acetate had practically identical pH values ( =7.00 and 7.01 for 339 mM and 33.9 mM solutions). Apparent pH values of mixed solutions, , (values measured for acetonitrile-water mixtures with an electrode calibrated with aqueous buffers) were found to be 7.27 and 7.24 for 237 and 23.7 mM ammonium acetate, respectively. Figures 4 and 5 show chromatograms for the degraded samples stored for 19 days. Two major products with retention times (RT) of 18.7 and
pHww
pHsw
ISSN 1424-6376 Page 114 ©ARKAT-USA, Inc.
Issue in Honor of Prof. Madeleine M. Joullié ARKIVOC 2007 (xii) 110-131
23.7 min were observed for 1. The slower migrating products co-eluted with one of the two components of secorapamycin. Several minor products were also seen in 237 mM MeCOONH4.
5 10 15 20 250
40
80
120
5 10 15 20 250
40
80
12021.1
23.720.3
Abs
orba
nce
at 2
78 n
m (m
AU
)
Time (min)
(a)30/70 MeCN/H2O23.7 mM MeCOONH4
18.7 18.6
12.8
19.920.3
21.1
24.4
23.7
30/70 MeCN/H2O237 mM MeCOONH4
(b)
Abs
orba
nce
at 2
78nm
(mA
U)
Time (min)
Figure 4. RP-HPLC-UV profile of rapamycin solution in 30/70 v/v MeCN/H2O mixture containing 23.7 mM ammonium acetate (a) and 237 mM ammonium acetate (b). Dashed line corresponds to a freshly prepared solution (reaction time < 2 h), solid line – solution stored for 19 days. Time scales were slightly adjusted to match the peak maxima. The mobile phase was prepared by mixing 95:5 v/v THF/0.02% aq. HCOOH (A) with 5:95 v/v THF/0.02% aq. HCOOH (B). Linear gradient elution was carried out from 35% to 48% of A over 30 min; Flow rate: 1 mL/min; Column temperature: 35oC. Retention times corresponding to the peak maxima are also shown.
5 10 15 20 250
10
20
30
40
50
5 10 15 20 250
10
20
30
40
50
12.6
24.4
19.9
23.630/70 MeCN/H2O237 mM MeCOONH4
(b)
Abs
orba
nce
at 2
78 n
m (m
AU
)
Time (min)
23.730/70 MeCN/H2O23.7 mM MeCOONH4
Abs
orba
nce
at 2
78 n
m (m
AU
)
Time (min)
(a)
24.5
Figure 5. RP-HPLC-UV profile of secorapamycin solution in 30/70 v/v MeCN/H2O mixture containing 23.7 mM ammonium acetate (a) and 237 mM ammonium acetate (b). Dashed line corresponds to a freshly prepared solution (reaction time < 2 h), solid line – solution stored for
ISSN 1424-6376 Page 115 ©ARKAT-USA, Inc.
Issue in Honor of Prof. Madeleine M. Joullié ARKIVOC 2007 (xii) 110-131
19 days. Time scales were slightly adjusted to match the peak maxima. For chromatographic conditions, see Figure 4 caption.
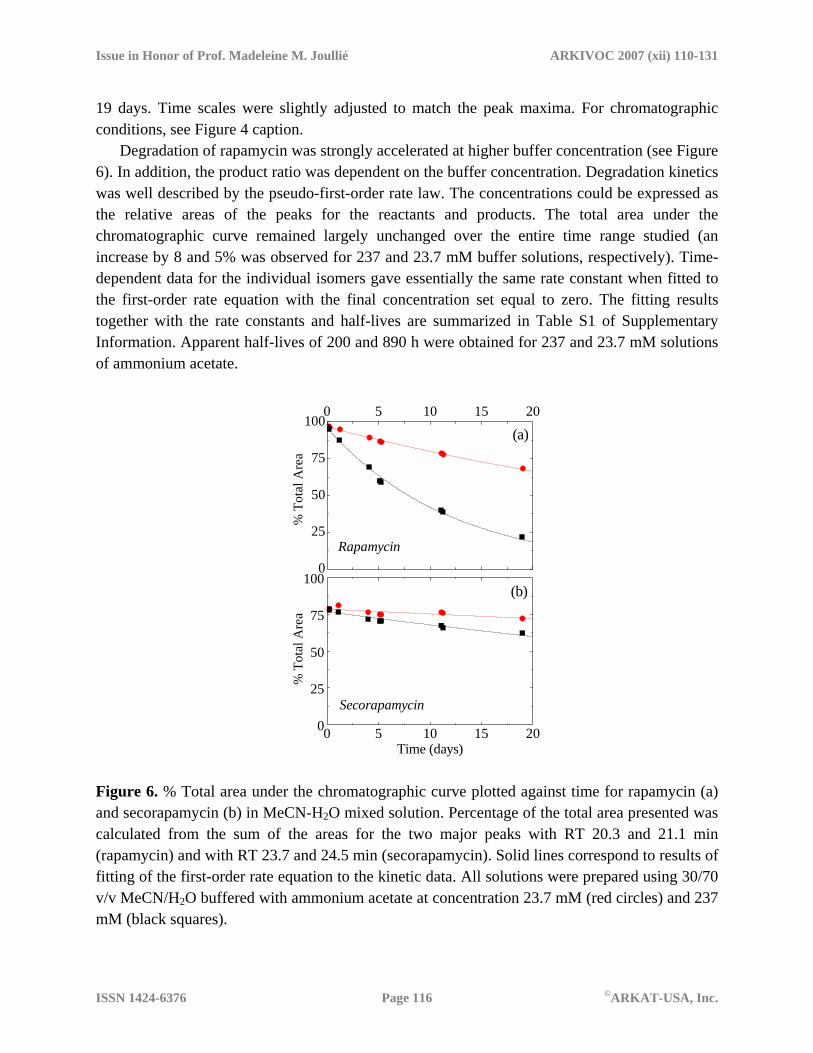
Degradation of rapamycin was strongly accelerated at higher buffer concentration (see Figure 6). In addition, the product ratio was dependent on the buffer concentration. Degradation kinetics was well described by the pseudo-first-order rate law. The concentrations could be expressed as the relative areas of the peaks for the reactants and products. The total area under the chromatographic curve remained largely unchanged over the entire time range studied (an increase by 8 and 5% was observed for 237 and 23.7 mM buffer solutions, respectively). Time-dependent data for the individual isomers gave essentially the same rate constant when fitted to the first-order rate equation with the final concentration set equal to zero. The fitting results together with the rate constants and half-lives are summarized in Table S1 of Supplementary Information. Apparent half-lives of 200 and 890 h were obtained for 237 and 23.7 mM solutions of ammonium acetate.
0
25
50
75
1000 5 10 15 20
0 5 10 15 200
25
50
75
100
% T
otal
Are
a
Rapamycin
(a)
(b)
Secorapamycin
% T
otal
Are
a
Time (days) Figure 6. % Total area under the chromatographic curve plotted against time for rapamycin (a) and secorapamycin (b) in MeCN-H2O mixed solution. Percentage of the total area presented was calculated from the sum of the areas for the two major peaks with RT 20.3 and 21.1 min (rapamycin) and with RT 23.7 and 24.5 min (secorapamycin). Solid lines correspond to results of fitting of the first-order rate equation to the kinetic data. All solutions were prepared using 30/70 v/v MeCN/H2O buffered with ammonium acetate at concentration 23.7 mM (red circles) and 237 mM (black squares).
ISSN 1424-6376 Page 116 ©ARKAT-USA, Inc.
Issue in Honor of Prof. Madeleine M. Joullié ARKIVOC 2007 (xii) 110-131
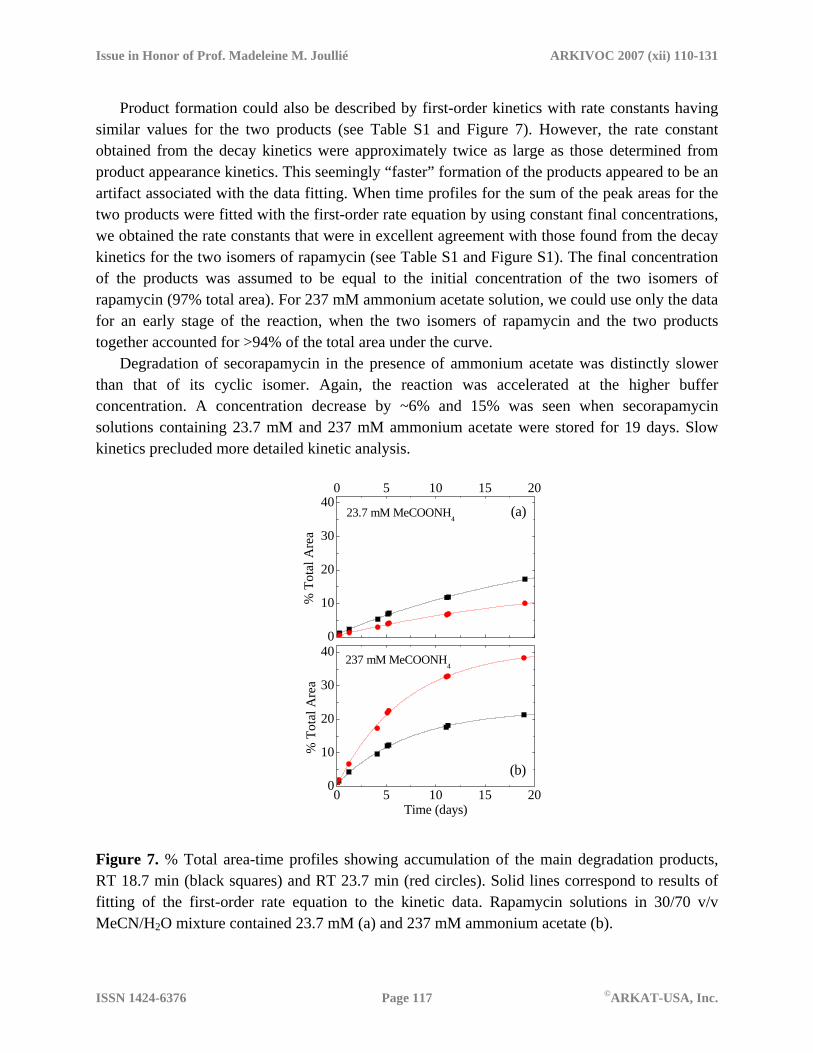
Product formation could also be described by first-order kinetics with rate constants having similar values for the two products (see Table S1 and Figure 7). However, the rate constant obtained from the decay kinetics were approximately twice as large as those determined from product appearance kinetics. This seemingly “faster” formation of the products appeared to be an artifact associated with the data fitting. When time profiles for the sum of the peak areas for the two products were fitted with the first-order rate equation by using constant final concentrations, we obtained the rate constants that were in excellent agreement with those found from the decay kinetics for the two isomers of rapamycin (see Table S1 and Figure S1). The final concentration of the products was assumed to be equal to the initial concentration of the two isomers of rapamycin (97% total area). For 237 mM ammonium acetate solution, we could use only the data for an early stage of the reaction, when the two isomers of rapamycin and the two products together accounted for >94% of the total area under the curve.
Degradation of secorapamycin in the presence of ammonium acetate was distinctly slower than that of its cyclic isomer. Again, the reaction was accelerated at the higher buffer concentration. A concentration decrease by ~6% and 15% was seen when secorapamycin solutions containing 23.7 mM and 237 mM ammonium acetate were stored for 19 days. Slow kinetics precluded more detailed kinetic analysis.
0
10
20
30
400 5 10 15 20
0 5 10 15 200
10
20
30
40
23.7 mM MeCOONH4
237 mM MeCOONH4
(b)
% T
otal
Are
a
(a)
% T
otal
Are
a
Time (days)
Figure 7. % Total area-time profiles showing accumulation of the main degradation products, RT 18.7 min (black squares) and RT 23.7 min (red circles). Solid lines correspond to results of fitting of the first-order rate equation to the kinetic data. Rapamycin solutions in 30/70 v/v MeCN/H2O mixture contained 23.7 mM (a) and 237 mM ammonium acetate (b).
ISSN 1424-6376 Page 117 ©ARKAT-USA, Inc.
Issue in Honor of Prof. Madeleine M. Joullié ARKIVOC 2007 (xii) 110-131
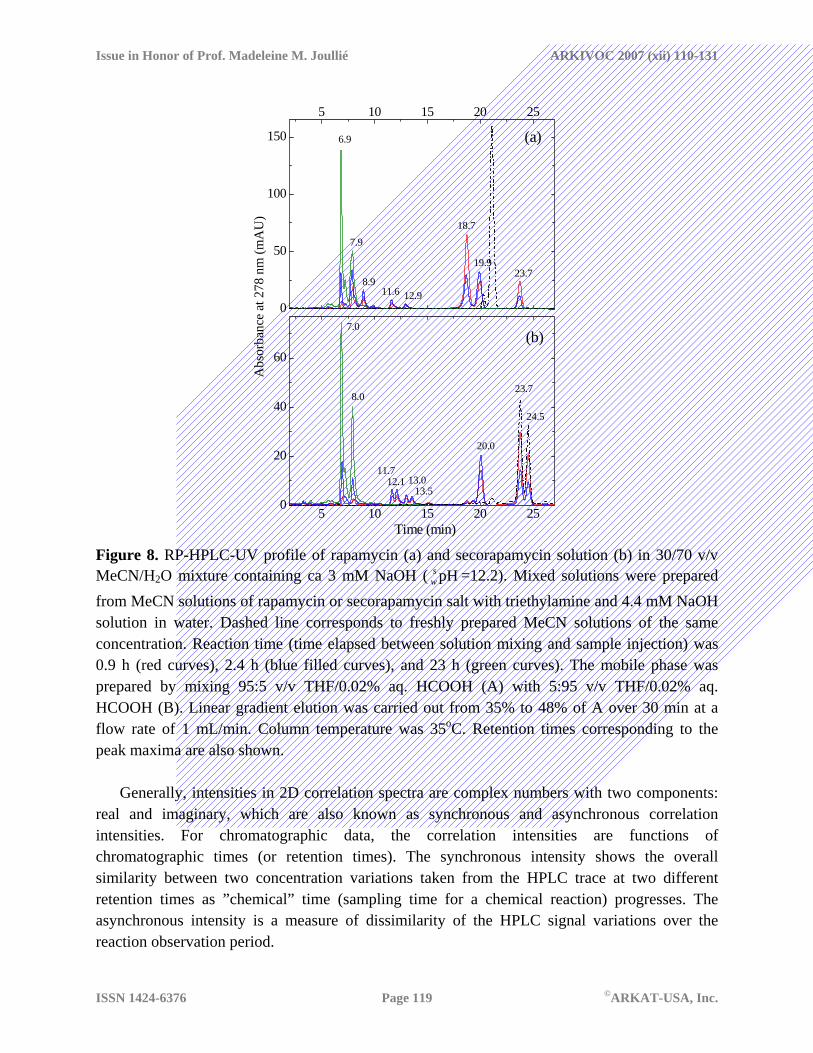
Degradation in highly basic solutions To gain a better understanding of acid-base catalysis in degradation of rapamycin and its isomer, we studied their behavior under conditions in which a stable pH value can be achieved without using an additional buffer. Figure 8 shows chromatographic profiles obtained for mixed solutions containing 3 mM NaOH ( =12.2). Rapamycin was completely decomposed after less than 1 h. The apparent half-life shortened by three order of magnitude in comparison to that obtained with 23.7 mM ammonium acetate at pH close to 7. The half-life of secorapamycin was also reduced at higher pH, but its degradation was still fairly slow. The same two products (RT 18.7 and 23.7 min, THF-based mobile phase) that were produced from 1 in the presence of ammonium acetate were detected in this system. Again, the faster eluting degradant was observed only for rapamycin. In addition, a large peak with a retention time of 20.0 min was observed for both 1 and 3. These three species were rather unstable at this pH and were eventually converted to other species. The HPLC profiles for both degraded samples stored for approximately 1 day were remarkably similar suggesting formation of a few stable products with RT in the range 6.8 – 8.0 min. Although only two prominent peaks with RT 7.0 and 8.0 are present in both chromatograms shown (Figures 8a and 8b), the time evolution of the traces for rapamycin was much more complex than that for secorapamycin. The ratio between the peak area for RT 7.0 and 8.0 min increased dramatically in the course of rapamycin degradation (0.32 at 1 h, 1.25 after 12 h) and only slightly varied for its isomer. This may suggest formation of several intermediates that co-elute with the stable products (see also discussion of 2D correlation spectra and LC/MS data below).
pHsw
Additional intermediates eluting in the range 11 – 14 min were also observed in the course of NaOH-catalyzed reactions of compounds 1 and 3. It is noteworthy that the number of peaks observed for those intermediates derived from 3 was doubled in comparison to that for 1. This may be attributed to the presence of two isomeric species in the secorapamycin material, each affording two isomeric intermediates (see discussion below).
Important structural and dynamic information about complex reactive systems can be obtained by using perturbation-based two-dimensional (2D) correlation spectroscopy.20 Dynamic data such as time-dependent absorption spectra can be “simplified” by spreading peaks along the second dimension, i.e. by using 2D spectroscopy. This type of spectroscopy represents a quantitative comparison of spectral intensity variations observed at two different wavenumbers over a fixed time interval. Notice that any perturbation-induced variation can be used so that a series of spectra collected in a sequential order may be manipulated to yield 2D correlation spectra. Perturbation-based 2D correlation spectroscopy was proven to be a powerful tool for analysis of complex IR and Raman data.20-24 It has been demonstrated that 2D correlation analysis could be combined with time-resolved gel permeation chromatography (GPC) to elucidate details of polymerization processes.25-27
ISSN 1424-6376 Page 118 ©ARKAT-USA, Inc.
Issue in Honor of Prof. Madeleine M. Joullié ARKIVOC 2007 (xii) 110-131
5 10 15 20 250
20
40
60
0
50
100
150
5 10 15 20 25
7.0
8.0
11.712.1 13.0
13.5
20.0
24.5
23.7
Time (min)
6.9
7.9
8.911.6 12.9
19.923.7
(b)
Abs
orba
nce
at 2
78 n
m (m
AU
)
(a)
18.7
Figure 8. RP-HPLC-UV profile of rapamycin (a) and secorapamycin solution (b) in 30/70 v/v MeCN/H2O mixture containing ca 3 mM NaOH ( =12.2). Mixed solutions were prepared from MeCN solutions of rapamycin or secorapamycin salt with triethylamine and 4.4 mM NaOH solution in water. Dashed line corresponds to freshly prepared MeCN solutions of the same concentration. Reaction time (time elapsed between solution mixing and sample injection) was 0.9 h (red curves), 2.4 h (blue filled curves), and 23 h (green curves). The mobile phase was prepared by mixing 95:5 v/v THF/0.02% aq. HCOOH (A) with 5:95 v/v THF/0.02% aq. HCOOH (B). Linear gradient elution was carried out from 35% to 48% of A over 30 min at a flow rate of 1 mL/min. Column temperature was 35oC. Retention times corresponding to the peak maxima are also shown.
pHsw
Generally, intensities in 2D correlation spectra are complex numbers with two components:
real and imaginary, which are also known as synchronous and asynchronous correlation intensities. For chromatographic data, the correlation intensities are functions of chromatographic times (or retention times). The synchronous intensity shows the overall similarity between two concentration variations taken from the HPLC trace at two different retention times as ”chemical” time (sampling time for a chemical reaction) progresses. The asynchronous intensity is a measure of dissimilarity of the HPLC signal variations over the reaction observation period.
ISSN 1424-6376 Page 119 ©ARKAT-USA, Inc.
Issue in Honor of Prof. Madeleine M. Joullié ARKIVOC 2007 (xii) 110-131
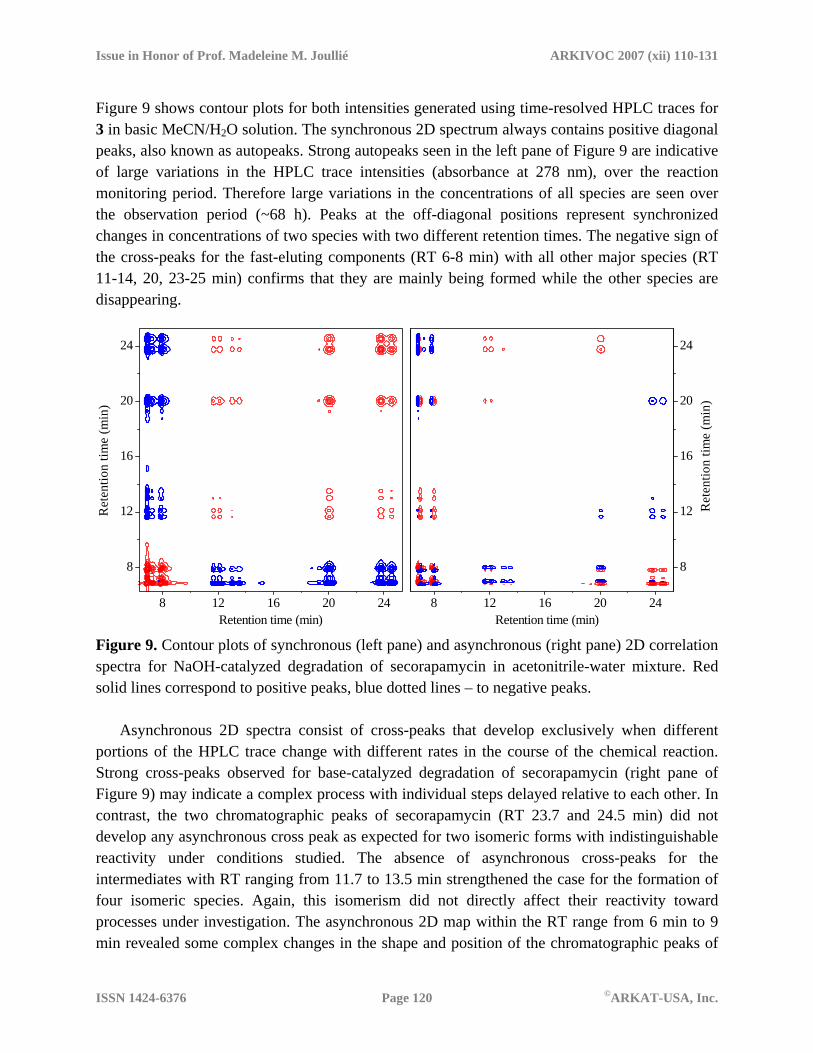
Figure 9 shows contour plots for both intensities generated using time-resolved HPLC traces for 3 in basic MeCN/H2O solution. The synchronous 2D spectrum always contains positive diagonal peaks, also known as autopeaks. Strong autopeaks seen in the left pane of Figure 9 are indicative of large variations in the HPLC trace intensities (absorbance at 278 nm), over the reaction monitoring period. Therefore large variations in the concentrations of all species are seen over the observation period (~68 h). Peaks at the off-diagonal positions represent synchronized changes in concentrations of two species with two different retention times. The negative sign of the cross-peaks for the fast-eluting components (RT 6-8 min) with all other major species (RT 11-14, 20, 23-25 min) confirms that they are mainly being formed while the other species are disappearing.
8 12 16 20 24
8
12
16
20
24
Ret
entio
n tim
e (m
in)
Retention time (min)8 12 16 20 24
8
12
16
20
24
Ret
entio
n tim
e (m
in)
Retention time (min) Figure 9. Contour plots of synchronous (left pane) and asynchronous (right pane) 2D correlation spectra for NaOH-catalyzed degradation of secorapamycin in acetonitrile-water mixture. Red solid lines correspond to positive peaks, blue dotted lines – to negative peaks.
Asynchronous 2D spectra consist of cross-peaks that develop exclusively when different portions of the HPLC trace change with different rates in the course of the chemical reaction. Strong cross-peaks observed for base-catalyzed degradation of secorapamycin (right pane of Figure 9) may indicate a complex process with individual steps delayed relative to each other. In contrast, the two chromatographic peaks of secorapamycin (RT 23.7 and 24.5 min) did not develop any asynchronous cross peak as expected for two isomeric forms with indistinguishable reactivity under conditions studied. The absence of asynchronous cross-peaks for the intermediates with RT ranging from 11.7 to 13.5 min strengthened the case for the formation of four isomeric species. Again, this isomerism did not directly affect their reactivity toward processes under investigation. The asynchronous 2D map within the RT range from 6 min to 9 min revealed some complex changes in the shape and position of the chromatographic peaks of
ISSN 1424-6376 Page 120 ©ARKAT-USA, Inc.
Issue in Honor of Prof. Madeleine M. Joullié ARKIVOC 2007 (xii) 110-131
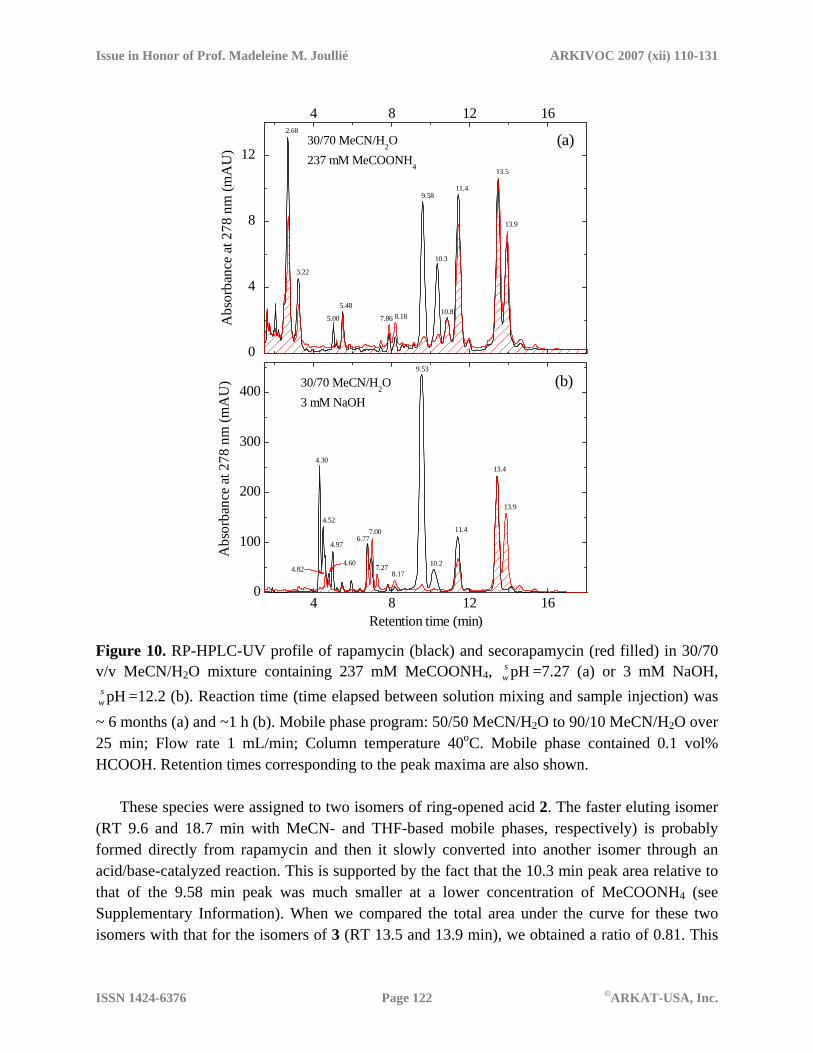
the final degradation products. The 2D maps suggest the presence of two groups of molecular species that may be formed asynchronously from different precursors. Additional transformation of those products in the course of solution aging cannot be excluded. Further studies are needed to clarify this issue. LC/MS analysis of degraded samples Degradation products in neutral and basic solutions were characterized by using LC/MS analysis (Figures S2-S9). Both negative and positive ion data together with UV absorption spectra were acquired in a single HPLC run using MeCN/H2O with 0.1% HCOOH as a mobile phase. The same mobile phase program as described in Figures 1 and 2 was utilized. Figure 10a presents the extracted single-wavelength (278 nm) traces obtained for the samples containing 237 mM ammonium acetate. Both solutions were stored for ca 6 months at room temperature.
Rapamycin (RT 15.3 min) degradation appears to be complete,28 but the sample contains a substantial amount of secorapamycin (RT 13.5 min) even after such an extended period of time. The most striking observation is the presence of the two species that co-elute with the two components of secorapamycin (RT 13.5 and 13.9 min). Mass spectra of these two compounds were identical; they were also practically indistinguishable from those of secorapamycin (see Supplementary Information, Figure S9). Ions with m/z of -912.6 ([M-H]-) and of +936.6 ([M+Na]+) observed within these two peaks confirm that the two species are isomers of secorapamycin (exact mass 913.56 u). Here and below, the negative and positive sign in front of the m/z values indicate negative and positive ions. The assignment was corroborated by the presence of a weak signal at m/z +958.6 (a sodium adduct of the secorapamycin sodium salt, [M-H+2Na]+), and of two distinct fragments with m/z +864.5 and +542.2 that are due dissociation of the ammonium adduct ([M+NH4]+, m/z +931.629). Formation of the isomer with a longer RT was distinctly slower at lower concentration of MeCOONH4 (see Figure S8 in Supplementary Info). This suggests isomerization through an acid/base-catalyzed reaction.
A strong peak seen at RT 11.4 min (20.0 min for the THF-based mobile phase, Figures 4 and 8) can be attributed to the C1-C27 portion of rapamycin, also referred to as the “southern” fragment. The mass spectra of this degradant showed signals with m/z –590.3 and +614.4, as expected. The two species eluted at 2.68 and 3.21 min gave similar mass spectra with the negative and positive ion peaks at m/z –941.4 and +943.6, respectively. Taken together, the HPLC-UV and MS data suggested a polar derivative with a triene-type absorption spectrum and a molar mass of ~942.5 u. Degradants with RT 10.8, 8.18, 7.86, and 5.48 min could not be identified because of weak MS signals and extensive ion fragmentation.
All the products observed in the secorapamycin solution containing 237 mM MeCOONH4 appear to be also formed in the rapamycin sample degraded under identical conditions. In addition, several distinct products were observed exclusively for rapamycin. The two degradants eluting at 9.6 and 10.3 min yielded the same ions with m/z –930.6 and +954.6.
ISSN 1424-6376 Page 121 ©ARKAT-USA, Inc.
Issue in Honor of Prof. Madeleine M. Joullié ARKIVOC 2007 (xii) 110-131
0
4
8
12
4 8 12 16
4 8 12 160
100
200
300
400
7.27
6.77
2.68
3.22
5.00
5.48
7.8610.8
9.58
30/70 MeCN/H2O3 mM NaOH
10.3
8.18
11.4
13.4
Abs
orba
nce
at 2
78 n
m (m
AU
)
13.9
30/70 MeCN/H2O237 mM MeCOONH4 13.5
13.9
11.4
10.2
9.53
8.17
7.00
(a)
(b)
4.30
4.52
4.824.60
4.97
Abs
orba
nce
at 2
78 n
m (m
AU
)
Retention time (min) Figure 10. RP-HPLC-UV profile of rapamycin (black) and secorapamycin (red filled) in 30/70 v/v MeCN/H2O mixture containing 237 mM MeCOONH4, =7.27 (a) or 3 mM NaOH,
=12.2 (b). Reaction time (time elapsed between solution mixing and sample injection) was ~ 6 months (a) and ~1 h (b). Mobile phase program: 50/50 MeCN/H2O to 90/10 MeCN/H2O over 25 min; Flow rate 1 mL/min; Column temperature 40oC. Mobile phase contained 0.1 vol% HCOOH. Retention times corresponding to the peak maxima are also shown.
pHsw
pHsw
These species were assigned to two isomers of ring-opened acid 2. The faster eluting isomer
(RT 9.6 and 18.7 min with MeCN- and THF-based mobile phases, respectively) is probably formed directly from rapamycin and then it slowly converted into another isomer through an acid/base-catalyzed reaction. This is supported by the fact that the 10.3 min peak area relative to that of the 9.58 min peak was much smaller at a lower concentration of MeCOONH4 (see Supplementary Information). When we compared the total area under the curve for these two isomers with that for the isomers of 3 (RT 13.5 and 13.9 min), we obtained a ratio of 0.81. This
ISSN 1424-6376 Page 122 ©ARKAT-USA, Inc.
Issue in Honor of Prof. Madeleine M. Joullié ARKIVOC 2007 (xii) 110-131
value is somewhat larger than the area ratio calculated for the single isomers observed at the initial stages of the reaction (0.56, see Figure 4b). This result clearly showed that acid 2 is not converted into 3, either directly or through reversible cyclization to 1, under conditions studied.
The third degradant that was observed only for rapamycin showed RT of 5.0 and 8.9 min with MeCN- and THF-based mobile phases, respectively. This compound was also observed in the basic solution of rapamycin (see Figure 10b). It afforded ions with m/z –763.5 and +787.3. Taken together, the data suggest this degradant is a rapamycin fragment (molecular mass 764.5) that was produced from acid 2 through removal of the pipecolic acid moiety (C1-C9). The acidic nature of this degradant is evident from the observation of ions with m/z –831.6 ([M-H+HCOONa]−) and +809.6 (([M-H+2Na]+).
Results of LC/MS analysis of rapamycin and its isomer in 3 mM NaOH solutions are presented in Figure 10b and Supplementary Information. The mass spectral data confirm that acid 2 (m/z -930.6, +954.6) and secorapamycin (m/z -912.6, +936.6) are primary degradation products of rapamycin in aqueous solution. Only small quantities of the second isomer for both compounds (RT 10.2 and 13.9 min) were seen in the NaOH solution, presumably because other reactions efficiently compete with the slow isomerization process. These other reactions are most likely responsible for the formation of multiple products with RT around 7.0 and 4.5 min that were not observed in the presence of ammonium acetate. Isobaric species (m/z –930.6, +954.6) eluting around 7 min were formed from both rapamycin and secorapamycin. These compounds formally correspond to addition of a single water molecule to the parent compound. Two other isobaric species with RT 4.30 and 4.52 min were observed exclusively for rapamycin. The mass spectral data (m/z –948.6, +972.6) suggested addition of two water molecules. No ions corresponding to a two-water adduct could be detected for secorapamycin.
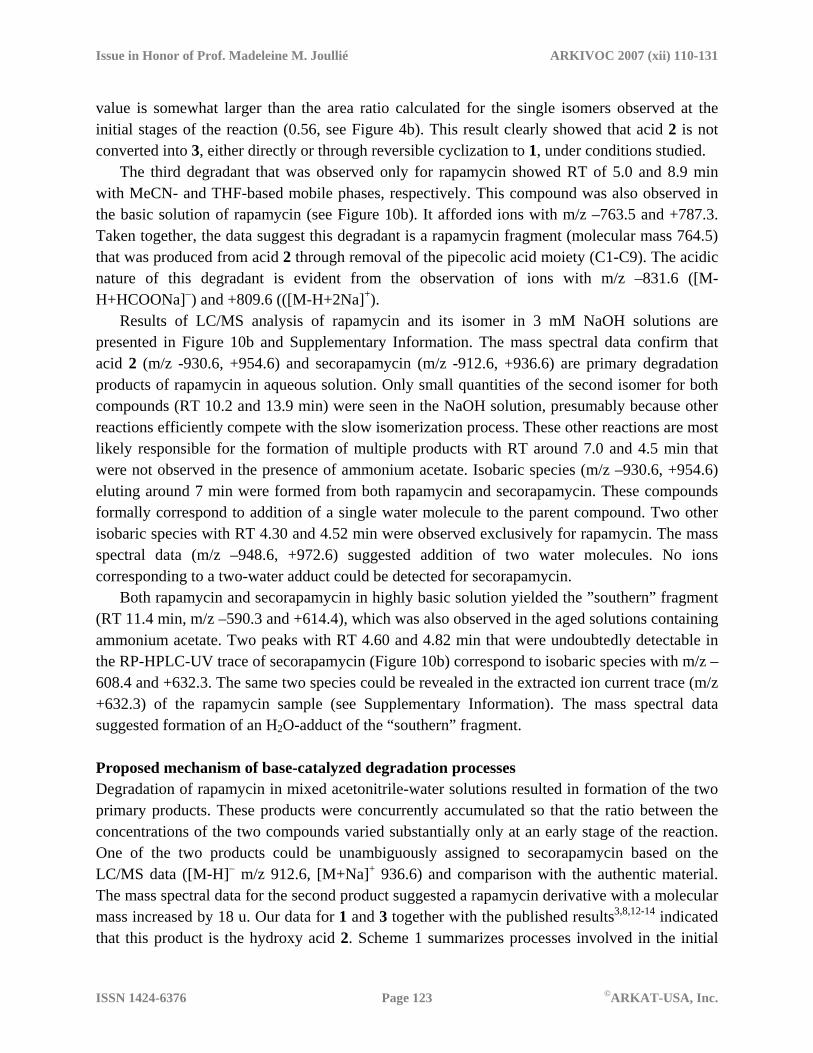
Both rapamycin and secorapamycin in highly basic solution yielded the ”southern” fragment (RT 11.4 min, m/z –590.3 and +614.4), which was also observed in the aged solutions containing ammonium acetate. Two peaks with RT 4.60 and 4.82 min that were undoubtedly detectable in the RP-HPLC-UV trace of secorapamycin (Figure 10b) correspond to isobaric species with m/z –608.4 and +632.3. The same two species could be revealed in the extracted ion current trace (m/z +632.3) of the rapamycin sample (see Supplementary Information). The mass spectral data suggested formation of an H2O-adduct of the “southern” fragment. Proposed mechanism of base-catalyzed degradation processes Degradation of rapamycin in mixed acetonitrile-water solutions resulted in formation of the two primary products. These products were concurrently accumulated so that the ratio between the concentrations of the two compounds varied substantially only at an early stage of the reaction. One of the two products could be unambiguously assigned to secorapamycin based on the LC/MS data ([M-H]− m/z 912.6, [M+Na]+ 936.6) and comparison with the authentic material. The mass spectral data for the second product suggested a rapamycin derivative with a molecular mass increased by 18 u. Our data for 1 and 3 together with the published results3,8,12-14 indicated that this product is the hydroxy acid 2. Scheme 1 summarizes processes involved in the initial
ISSN 1424-6376 Page 123 ©ARKAT-USA, Inc.
Issue in Honor of Prof. Madeleine M. Joullié ARKIVOC 2007 (xii) 110-131
degradation of rapamycin under neutral and basic conditions. Notice that all compounds are presented in the protonated form and both reactions are shown as irreversible ones, although lactone hydrolysis should generally be treated as a reversible process. If the cyclization of the hydroxy acid would proceed with a measurable rate and the β-cleavage would be irreversible as proposed, 2 should eventually disappear and only 3 should be observed. However, at pH close to neutral 2 could be observed even after 6 months (see Figure 10) and the ratio between two products did not change dramatically. It is conceivable that the lactone formation is completely suppressed under conditions studied because 2 is present in the deprotonated form that appears to be non-reactive.
+H2O
[M−H]− m/z 930.56[M+Na]+ m/z 954.55
[M−H]− m/z 912.55[M+Na]+ m/z 936.54
[M−H]− m/z 912.55[M+Na]+ m/z 936.54
NO
O
OOH
Me
COOHH
HMeO
Me
HOOMe
O
Me
MeOH
MeOO
Me
Me
MeN
OO
OOH
Me
OO
H
HMeO
Me
H
MeOH
OMeO
Me
MeOH
MeO O
Me
Me
NO
O
OOH
Me
OH
OH
HMeO
Me
MeOH
OMeO
Me
MeOH
MeOO
Me
Me
HOH
+H2O
[M−H]− m/z 930.56[M+Na]+ m/z 954.55
[M−H]− m/z 912.55[M+Na]+ m/z 936.54
[M−H]− m/z 912.55[M+Na]+ m/z 936.54
NO
O
OOH
Me
COOHH
HMeO
Me
HOOMe
O
Me
MeOH
MeOO
Me
Me
MeN
OO
OOH
Me
OO
H
HMeO
Me
H
MeOH
OMeO
Me
MeOH
MeO O
Me
Me
NO
O
OOH
Me
OH
OH
HMeO
Me
MeOH
OMeO
Me
MeOH
MeOO
Me
Me
HOH
3 1 2 Scheme 1. Proposed mechanism of rapamycin degradation in aqueous solutions. Only one isomer of rapamycin is shown; all compounds are presented in the protonated form. Under conditions studied, the two products are initially present almost exclusively in a single isomeric form. Slow formation of a second isomer was observed both for 2 and 3 upon prolonged storage.
The results of this study indicate that rapamycin degradation in aqueous solution exhibits
both specific and general base catalysis. The two reactions shown in Scheme 1 are differently affected by catalysts as can be judged from variations in the 2-to-3 ratio with the buffer concentration and pH (compare HPLC profiles in Figures 4 and 8). Both degradation products, 2 and 3, seem to be primarily produced in the form of a single isomer. Formation of those compounds is followed by slow isomerization reactions that are accelerated at higher buffer concentrations (see Figure S8). For secorapamycin, this slow isomerization in the degraded rapamycin sample containing 237 mM ammonium acetate apparently led to the same two species observed for the authentic sample.
Taken together, our kinetic and mass spectral data suggest that stereoisomerization in the “northern” part (C28-C42) of the molecule may be responsible for “doubling” of
ISSN 1424-6376 Page 124 ©ARKAT-USA, Inc.
Issue in Honor of Prof. Madeleine M. Joullié ARKIVOC 2007 (xii) 110-131
chromatographic peaks seen when secorapamycin solutions and aged samples of degraded rapamycin are analyzed. Our kinetic studies showed that the hemiketal equilibrium that is presumably responsible for the two peaks in non-degraded rapamycin samples is rapidly established under conditions studied.30 Therefore this process cannot be responsible for slow changes seen in ammonium acetate solutions. Acid-catalyzed cyclization that affords stereoisomers of hydroxydiketomorpholine in the course of LC separation can be excluded because only one peak was observed when degradation mixtures containing one isomer of 3 produced from 1 were analyzed.15,16 Moreover, no effect of acid concentration on the HPLC profiles was observed for secorapamycin.
NMR spectra of rapamycin and secorapamycin salt acquired under conditions mimicking the HPLC analysis (1:1 THF-d8/D2O) were consistent with a single structure shown above. In addition, the presence of cis- and trans-rotamer around the amide bond could be revealed (see Table S2 and Figures S10-S12). The trans/cis ratio was found to increase from 0.3 to ~0.9 when 0.025% trifluoroacetic acid was added to the secorapamycin solution.31 These results compare well with the recently reported data for CD3OD and other organic solvents.19 Although the isomeric ratio in acidic solution closely matches that seen in our HPLC analysis, it is highly unlikely that isomerization around the amide bond is responsible for the phenomena observed in this study. Moreover, if this reaction would be slow on the time scale of HPLC separation, one should expect an isomer ratio closely matching that seen in the starting material (the anion of 2). Contrary, we observed the ratio that is close to that for the protonated form. The amide bond isomerization in simple derivatives and short peptides containing L-pipecolic acid has characteristic times within the second range.32,33 A similar time scale may be expected for the trans → cis isomerization in 2 based on the fact that it is a linear molecule and the process is not energetically prohibited (trans/cis ratio close to 1). Notice that the trans form dominates in rapamycin solutions.34 The NMR spectra of 1 in THF-d8/D2O mixture supported this conclusion (see Figure S10).
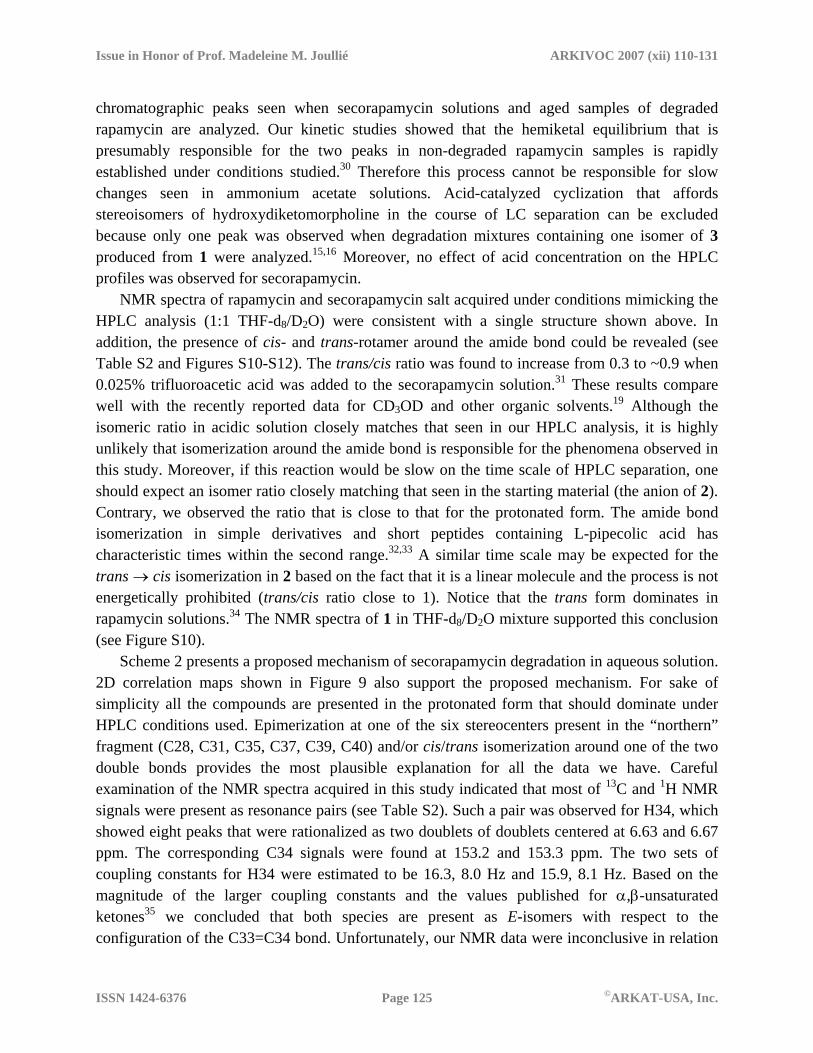
Scheme 2 presents a proposed mechanism of secorapamycin degradation in aqueous solution. 2D correlation maps shown in Figure 9 also support the proposed mechanism. For sake of simplicity all the compounds are presented in the protonated form that should dominate under HPLC conditions used. Epimerization at one of the six stereocenters present in the “northern” fragment (C28, C31, C35, C37, C39, C40) and/or cis/trans isomerization around one of the two double bonds provides the most plausible explanation for all the data we have. Careful examination of the NMR spectra acquired in this study indicated that most of 13C and 1H NMR signals were present as resonance pairs (see Table S2). Such a pair was observed for H34, which showed eight peaks that were rationalized as two doublets of doublets centered at 6.63 and 6.67 ppm. The corresponding C34 signals were found at 153.2 and 153.3 ppm. The two sets of coupling constants for H34 were estimated to be 16.3, 8.0 Hz and 15.9, 8.1 Hz. Based on the magnitude of the larger coupling constants and the values published for α,β-unsaturated ketones35 we concluded that both species are present as E-isomers with respect to the configuration of the C33=C34 bond. Unfortunately, our NMR data were inconclusive in relation
ISSN 1424-6376 Page 125 ©ARKAT-USA, Inc.
Issue in Honor of Prof. Madeleine M. Joullié ARKIVOC 2007 (xii) 110-131
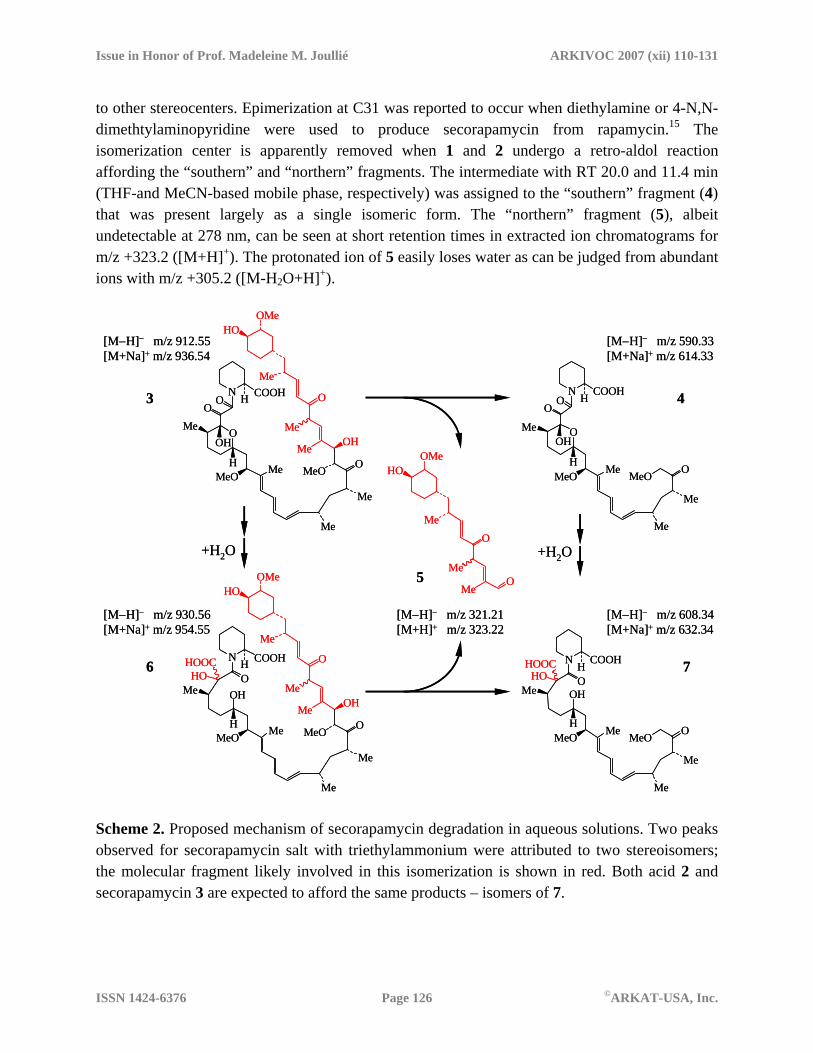
to other stereocenters. Epimerization at C31 was reported to occur when diethylamine or 4-N,N-dimethtylaminopyridine were used to produce secorapamycin from rapamycin.15 The isomerization center is apparently removed when 1 and 2 undergo a retro-aldol reaction affording the “southern” and “northern” fragments. The intermediate with RT 20.0 and 11.4 min (THF-and MeCN-based mobile phase, respectively) was assigned to the “southern” fragment (4) that was present largely as a single isomeric form. The “northern” fragment (5), albeit undetectable at 278 nm, can be seen at short retention times in extracted ion chromatograms for m/z +323.2 ([M+H]+). The protonated ion of 5 easily loses water as can be judged from abundant ions with m/z +305.2 ([M-H2O+H]+).
+H2O +H2O
[M−H]− m/z 912.55[M+Na]+ m/z 936.54
[M−H]− m/z 590.33[M+Na]+ m/z 614.33
[M−H]− m/z 930.56[M+Na]+ m/z 954.55
[M−H]− m/z 608.34[M+Na]+ m/z 632.34
[M−H]− m/z 321.21[M+H]+ m/z 323.22
3 4
5
6 7
HOOMe
O
Me
MeO
Me
NO
O
OOH
Me
COOHH
HMeO Me
HOOMe
O
Me
Me OH
MeO O
Me
Me
Me
N
OHOOC
OH
HOMe
COOHH
HMeO Me
HOOMe
O
Me
Me OH
MeO O
Me
Me
Me
N
OHOOC
HO
OHMe
COOHH
HMeO Me MeO O
Me
Me
NO
O
OOH
Me
COOHH
HMeO Me MeO O
Me
Me
Scheme 2. Proposed mechanism of secorapamycin degradation in aqueous solutions. Two peaks observed for secorapamycin salt with triethylammonium were attributed to two stereoisomers; the molecular fragment likely involved in this isomerization is shown in red. Both acid 2 and secorapamycin 3 are expected to afford the same products – isomers of 7.
ISSN 1424-6376 Page 126 ©ARKAT-USA, Inc.
Issue in Honor of Prof. Madeleine M. Joullié ARKIVOC 2007 (xii) 110-131
Degradation of rapamycin in highly basic solutions yielded several new products that were not observed at pH close to neutral. Under such conditions, rapamycin is rapidly converted into 2 and 3. Both molecules differing only in the “northern” part can undergo the same reactions shown in Scheme 2. We assumed that a benzilic acid rearrangement is the main reaction pathway. Rapamycin shares some common structural features with macrolides from the FK-506 family of immunosuppressants. Particularly, hemiketal-masked diketo pipecolic acid moiety is identical in these two classes. FK-506 and its analogs undergo a facile benzilic acid rearrangement under very mild conditions.36,37 A similar reaction was reported for rapamycin, albeit under harsher conditions.13-15 The mass spectral and chromatographic data are consistent with addition of a single water molecule to the “southern” part, as expected for this rearrangement, and introduction of a new stereocenter in 6.
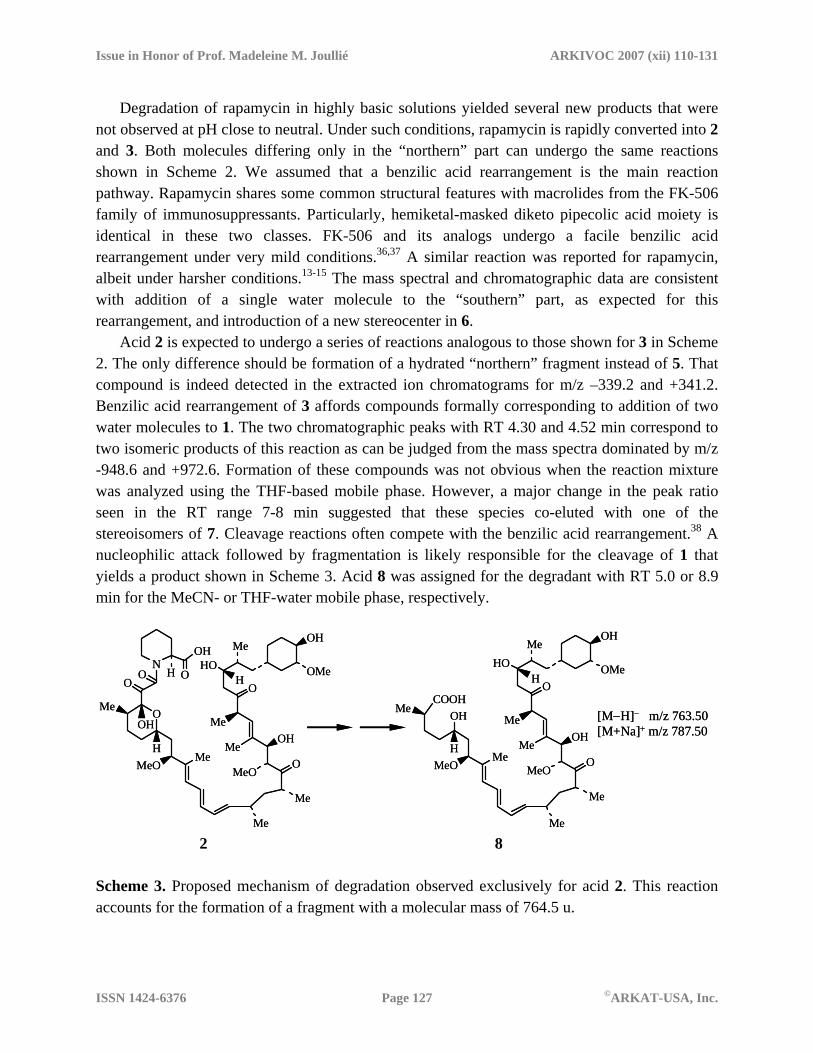
Acid 2 is expected to undergo a series of reactions analogous to those shown for 3 in Scheme 2. The only difference should be formation of a hydrated “northern” fragment instead of 5. That compound is indeed detected in the extracted ion chromatograms for m/z –339.2 and +341.2. Benzilic acid rearrangement of 3 affords compounds formally corresponding to addition of two water molecules to 1. The two chromatographic peaks with RT 4.30 and 4.52 min correspond to two isomeric products of this reaction as can be judged from the mass spectra dominated by m/z -948.6 and +972.6. Formation of these compounds was not obvious when the reaction mixture was analyzed using the THF-based mobile phase. However, a major change in the peak ratio seen in the RT range 7-8 min suggested that these species co-eluted with one of the stereoisomers of 7. Cleavage reactions often compete with the benzilic acid rearrangement.38 A nucleophilic attack followed by fragmentation is likely responsible for the cleavage of 1 that yields a product shown in Scheme 3. Acid 8 was assigned for the degradant with RT 5.0 or 8.9 min for the MeCN- or THF-water mobile phase, respectively.
[M−H]− m/z 763.50[M+Na]+ m/z 787.50
NO
O
OOH
Me
OH
OH
HMeO
Me
MeOH
OMeO
Me
MeOH
MeOO
Me
Me
HOH
COOHOHMe
HMeO
Me
MeOH
OMeO
Me
MeOH
MeOO
Me
Me
HOH
[M−H]− m/z 763.50[M+Na]+ m/z 787.50
NO
O
OOH
Me
OH
OH
HMeO
Me
MeOH
OMeO
Me
MeOH
MeOO
Me
Me
HOH
COOHOHMe
HMeO
Me
MeOH
OMeO
Me
MeOH
MeOO
Me
Me
HOH
2 8
Scheme 3. Proposed mechanism of degradation observed exclusively for acid 2. This reaction accounts for the formation of a fragment with a molecular mass of 764.5 u.
ISSN 1424-6376 Page 127 ©ARKAT-USA, Inc.
Issue in Honor of Prof. Madeleine M. Joullié ARKIVOC 2007 (xii) 110-131
Conclusions Liquid chromatography of rapamycin and secorapamycin is strongly affected by secondary equilibria due to isomerization and protolytic dissociation. HPLC analysis of secorapamycin salt with triethylamine was not feasible with unbuffered mobile phases. In the presence of an acid, RP-HPLC profiles of rapamycin and its ring-opened isomer showed two major components. These two components were attributed to two different isomerization processes proceeding with quite different rates.
Rapamycin degradation in mixed water-acetonitrile solutions resulted in two primary products that were identified as individual isomers of secorapamycin and a ring-opened hydroxy acid. Kinetic data suggested that these two products were formed via two parallel reactions. No evidence for the interconversion between the products was obtained. Stability of the two primary products strongly depends on solution pH. In highly basic solutions, they both rapidly decay to produce several compounds with much shorter retention times. LC/MS data suggested fragmentation and water addition as main degradation channels. A degradation mechanism involving a retro-aldol reaction at C27-C28 and benzilic acid rearrangement together with cleavage at the masked triketo moiety could be proposed to account for all the data obtained.
Both specific and general base catalysis was observed for degradation of rapamycin and secorapamycin in mixed solutions. However, the degradation rate was drastically reduced for the ring-opened isomer. These results suggest that buffered mobile phases with slightly acidic pH are better suited for HPLC analysis of rapamycin and its derivatives. When rapamycin has to be studied in aqueous solution, buffer concentration should be kept as low as possible to minimize degradation. Experimental Section Rapamycin and secorapamycin salt with triethylammonium were purchased from Wyeth-Ayerst and used without further purification. Ammonium acetate (J.T. Baker) was used as received. Water, acetonitrile, and tetrahydrofuran (THF) of HPLC grade were purchased from EMD. 1 N NaOH solution (VWR) and 0.15% HCOOH solution in water (J.T. Baker) were diluted to prepare aqueous solutions with required concentrations.
Liquid chromatography analysis was performed by using an Agilent 1100 LC system equipped with a diode-array detector. A Michrom Paradigm MS4B Biocompatible Multi-Dimensional HPLC combined with a Finnigan TSQ-7000 triple quadrupole mass spectrometer was utilized for LC/MS analysis. TSQ-7000 was equipped with an API-1 electrospray ion source. All experiments were carried on a Zorbax Eclipse XDB-C18 column (150 mm x 4.6 mm, 3.5 µm). Flow rate was set at 1 mL/min. Injection volumes were in the range 10-30 µL. Two solvents systems were used as the mobile phase. Mobile Phase 1 was comprised of water and acetonitrile with trifluoroacetic acid (TFA) or formic acid (HCOOH) as additives. Column
ISSN 1424-6376 Page 128 ©ARKAT-USA, Inc.
Issue in Honor of Prof. Madeleine M. Joullié ARKIVOC 2007 (xii) 110-131
temperature was set at 40oC. Mobile Phase 2 was prepared by mixing 5:95 v/v THF/0.02% HCOOH in water with 95:5 v/v THF/0.02% HCOOH in water. Column Temperature was maintained at 35oC.
NMR spectra were recorded on a Unity INOVA 500 MHz (Varian) equipped with a Varian Penta Probe. Data were processed with Varian VnmrJ 2.1B Software.
All degradation experiments were carried out in 30/70 v/v acetonitrile-water mixtures. Mixed solution were prepared by dissolving rapamycin or secorapamycin in acetonitrile and mixing those solutions with aqueous buffers. pH values were determined for both pure aqueous ( ) and mixed solutions ( ). pH Measurements were performed with a Beckman Φ 350 pH-meter equipped with a standard glass electrode. The pH electrode was calibrated using standard aqueous solutions of pH 4.0 and 7.0. All the samples were thoroughly protected from light by wrapping them into aluminum foil immediately after preparation, storing them in a dark cabinet, and covering the autosampler with aluminum foil.
pHww
pHsw
2D Correlation spectra were generated with a homemade program written in LabView programming language (National Instruments). Noda’s formalism for non-equally spaced data was applied.39 The time-average HPLC trace was used as a reference chromatogram. Supplementary Information Available Table S1 with kinetic data; Table S2 with 1H and 13C chemical shifts; Figures S1–S8 with RP-HPLC-UV and RP-HPLC–ESI-MS traces for degraded rapamycin and secorapamycin; Figure S9 with the mass spectra of secorapamycin; Figures S10–S12 with 1H-NMR spectra of rapamycin and secorapamycin. Acknowledgements The authors want to thank Charles Tirendi, Ken Ray, and David Detlefsen (Novatia, LLC) for acquisition of NMR and LC/MS data. References and Notes 1. Vezina, C.; Kudelski, A.; Sehgal, S. N. J. Antibiot. (Tokyo) 1975, 28, 721. (b) Sehgal, S. N.;
Baker, H.; Vezina, C. J. Antibiot. (Tokyo) 1975, 28, 727. 2. Martel, R. R.; Klicius, J.; Galet, S. Can. J. Physiol. Pharmacol. 1977, 55, 48. 3. Caufield, C. E. Curr. Pharmaceut. Design 1995, 1, 145. 4. Napoli, K. L.; Taylor, P. J. Therap. Drug Monitor. 2001, 23, 559. 5. Swindells, D. C. N.; White, P. S.; Findlay, J. A. Can. J. Chem. 1978, 56, 2491.
ISSN 1424-6376 Page 129 ©ARKAT-USA, Inc.
Issue in Honor of Prof. Madeleine M. Joullié ARKIVOC 2007 (xii) 110-131
6. Van Duyne, G. D.; Standaert, R. F.; Schreiber, S. L.; Clardy, J. J. Am. Chem. Soc. 1991, 113, 7433.
7. Deivanayagam, C. C.; Carson, M.; Thotakura, A.; Narayana, S.V.; Chodavarapu, R. S. Acta Crystallogr., Sect. D 2000, 56, 266.
8. Fulton, K. F.; Jackson, S. E.; Buckle, A. M. Biochemistry 2003, 42, 2364. 9. Holt, D. A.; Konialian, A. L.; Brandt, M.; Levy, M. A.; Bossard, M. J.; Luengo, J. I.;
Newman-Tarr, T.; Badger, A. Bioorg. Med. Chem. Lett. 1993, 3, 1977. 10. Wang, C. P.; Chan, K. W.; Schiksnis, R. A.; Scatina, J.; Sisenwine, S. F. J. Liq. Chromat.
1994, 17, 3383. 11. (a) Wang, C. P.; Lim, H.-K.; Chan, K. W.; Scatina, J.; Sisewine, S. F. J. Liq. Chromat. 1995,
18, 2559. (b) Wang, C. P.; Lim, H.-K.; Chan, K. W.; Scatina, J.; Sisenwine, S. F. J. Liq. Chromat. Rel. Technol. 1997, 20, 1689.
12. (a) Paine, M. F.; Leung, L. Y.; Lim, H. K.; Liao, K.; Oganesian, A.; Zhang, M.-Y.; Thummel, K. E.; Watkins, P. B. J. Pharmacol. Exper. Therapeutics 2002, 301, 174. (b) Paine, M. F.; Leung, L. Y.; Watkins, P. B. Ther. Drug Monit. 2004, 26, 463.
13. Luengo, J. I.; Konialian, A. L.; Holt, D. A. Tetrahedron Lett. 1993, 34, 991. 14. Yohannes, D.; Myers, C. D.; Danishefsky, S. J. Tetrahedron Lett. 1993, 34, 2075. 15. Steffan, R. J.; Kearney, R. M.; Hu, D. C.; Failli, A. A.; Skotnicki, J. S.; Schiksnis, R. A.;
Mattes, J. F.; Chan, K. W.; Caufield, C. E. Tetrahedron Lett. 1993, 34, 3699. 16. Skotnicki, J. S.; Failli, A. A.; Steffan, R. J.; Kearney, R. M. U.S. Patent, 9 pp US 5252579A,
19931012. 17. Hallensleben, K.; Raida, M.; Habermehl, G. J. Am. Soc. Mass Spectr. 2000, 11, 516. 18. Buchberger, W.; Ferdig, M.; Sommer, R.; Vo, T. D. T. Electrophoresis 2005, 26, 161. 19. Zhou, C. C.; Stewart, K. D.; Dhaon, M. K. Magn. Res. Chem. 2005, 43, 41. 20. (a) Noda, I. Appl. Spectrosc. 1993, 47, 1329. (b) Noda, I., Appl. Spectrosc. 2000, 54, 994. (c)
Noda, I. Vibr. Spectrosc. 2004, 36, 143. 21. Ozaki, Y.; Liu, Y.; Noda, I. Appl. Spectrosc. 1997, 51, 526 and references therein. 22. (a) Nabet, A.; Pézolet, I. Appl. Spectrosc. 1997, 51, 466. (b) Meskers, S.; Ruysschaert, J.-
M.; Goormaghtigh, E. J Am. Chem. Soc. 1999, 121, 5115. (c) Fabian, H.; Mantsch, H. H.; Schultz, C. P. Proc. Natl. Acad. Sci. U.S.A. 1999, 96, 13153.
23. (a) Elmore, D. L.; Dluhy, R. A. Coll. Surf. A 2000, 171, 225. (b) Elmore, D. L.; Shanmukh, S.; Dluhy, R. A. J. Phys. Chem. A 2002, 106, 3420.
24. (a) Ren, Y.; Shimoyama, M.; Ninomiya, T; Matsukawa, K.; Inoue, H.; Noda, I.; Ozaki, Y. J. Phys. Chem. B. 1999, 103, 6475. (b) Noda, I.; Marcott, C. J. Phys. Chem. A 2002, 106, 3371.
25. Izawa, K.; Ogasawara, T.; Masuda, H.; Okabayashi, H.; Noda, I. Macromolecules 2002, 35, 92.
26. Izawa, K.; Ogasawara, T.; Masuda, H.; Okabayashi, H.; O'Connor, C. J.; Noda, I. Phys. Chem. Chem. Phys 2002, 4, 1053.
ISSN 1424-6376 Page 130 ©ARKAT-USA, Inc.
Issue in Honor of Prof. Madeleine M. Joullié ARKIVOC 2007 (xii) 110-131
27. Izawa, K.; Ogasawara, T.; Masuda, H.; Okabayashi, H.; O'Connor, C. J.; Noda, I. J. Phys. Chem. B 2002, 106, 2867.
28. Although a weak signal with RT around 15.3 min and m/z values corresponding to rapamycin can be detected, it is likely to be a different isomeric compound because a similar signal was observed for secorapamycin solutions.
29. Kruppa, G.; Schnier, P. D.; Tabei, K.; Van Orden, S.; Siegel, M. M. Anal. Chem. 2002, 74, 3877.
30. No time-dependent change in the isomer ratio (~9.5) could be detected in the rapamycin solutions with different concentrations of ammonium acetate. However, it takes ca 5 days to reach approximately the same ratio in 30/70 v/v MeCN solution containing 7 mM acetate buffer with apparent pH of 4.95.
31. The trans/cis ratio was estimated from the integrals for the H2 signals assigned to trans- and cis-rotamers. The estimation procedure is associated with significant uncertainty because of the signal overlap.
32. Wu, W.-J.; Raleigh, D. P. J. Org. Chem. 1998, 63, 6689. 33. Swarbrick, M. E.; Gosselin, F.; Lubell, W. D. J. Org. Chem. 1999, 64, 1993. 34. Kessler, H.; Haessner, R.; Schueler, W. Helv. Chim. Acta 1993, 76, 117. 35. Concellón, J. M.; Rodríguez-Solla, H.; Concellón, C.; Díaz, P. Synlett 2006, (6), 837. 36. Askin, D.; Reamer, R. A.; Jones, T. K.; Volante, R. P.; Shinkai, I. Tetrahedron Lett. 1989,
30, 671. 37. Baumann, K.; Bacher, M.; Steck, A.; Wagner, T. Tetrahedron 2004, 60, 5965. 38. Rubin, M. B.; Gleiter, R. Chem. Rev. 2000, 100, 1121. 39. Noda, I. Appl. Spectrosc. 2003, 57, 1049.
ISSN 1424-6376 Page 131 ©ARKAT-USA, Inc.


![Target of Rapamycin Signaling in Plant Stress …Update on Target of Rapamycin Signaling in Plant Stress Responses Target of Rapamycin Signaling in Plant Stress Responses1[OPEN] Liwen](https://img.pdfslide.us/doc/110x75/5f05e4b57e708231d4153f1e/target-of-rapamycin-signaling-in-plant-stress-update-on-target-of-rapamycin-signaling.jpg)


![Ptc6 Is Required for Proper Rapamycin-Induced Down ...degradation process known as mitophagy (see [14] and references therein). As a consequence, Ptc6 is necessary for survival of](https://img.pdfslide.us/doc/110x75/60dea0a8b8e18d7e863bd918/ptc6-is-required-for-proper-rapamycin-induced-down-degradation-process-known.jpg)