Embed Size (px)
Citation preview

PROCEEDINGS: PROF-97ONML, JAM.SHEDPUR : pp.128./36
Determination of tungsten in benificiationproducts of wolframite bearing granites from
Degana area , Rajasthan
K. K. PADHI, A. K. CHATTERJEE and L. P. PANDEYNational Metallurgical Laboratory. Jannhedpur - 831 1007.
ABSTRACT
Large deposit of uolframite and scheelite become a source of an
important strategic metal like tungsten . During XRF analysis of
tungsten from low grade tungsten ore from Degana, it was ob-
served that there was marked difference in the analytical values of
tungsten estimated by different methods. The problem of martrix
in the low grade tungsten ore was found which adversely affects
the results even when standards for calibration were selected from
the similar origin. In the present study. influence coefficient (al-
pha) was calculated using secondary standards. Mathematical
correction models proposed by de jongh, Rasbern• and Heinrich
and Lucas-Tooth-P yne were applied. It was observed that the re-
sults were significantly improved after applying this correction.
Experimental condition as well as comparison between the results
obtained through these correction models have been computed.
Results obtained by this technique were compared with secondary
standards and found to be of high accuracy. Out of the three mod-
els it was observed that Rasbern• and Heinrich model is more
suitable for accurate results.
INTRODUCTION
Several low grade tungsten deposits have been located in the different parts
of the country e.g., Degana (Rajasthan ), Kuhi-Khobna ( Maharashtra ), Kolar
gold field ( Karnataka ). Bankura (West Bengal ), Almora (U.P.) etc.
The mineral processing division of NML had undertaken sustainedprogramme of study on the feasibility of beneficiating those ores. During the
progress of these studies a large number of beneficiation products containing
widely varying amounts of tungsten from high (concentrates) to very low (tail-
ing) up to 0.01 C7r were required to he analysed. The analyses were required to be
128

K. K. PADHI et. al.
very accurate specially in the lower range so that correct material balance could
be computed for planning further tests. The existing methods of analysis of
tungsten were found wanting in respect of both these requisites and the neces-
sity of a rapid at the same time sensitive method of analysis was keenly felt.
The chemical analysis of tungsten is difficult compared to many other transi-
tion elements specially in ppm level. Various methods for the analysis of tung-
sten in different ores are available in literature 11 111. Apart from the conventional
wet chemical methods these include Spectrophotometry, Emission Spectrogra-
phy. Polarography, Neutron activation analysis, X-ray fluorescence spectrom-
etry etc. A review on various methods used for the analysis of tungsten is given
by Topping 111. Spectrophotometric methods employing thio-cyanate and dithiol
are most commonly used for the tungsten in ores"' "'. Separation of tungsten is
invariably required for spectrophotometric procedures"" 1. Neutron activation
technique has been successfully used for the estimation of low percentage of
tungsten""" and is employed for the low grade ores"". This technique however
requires complex radio chemical procedure to minimise interference""'. Atomic
absorption spectrometry has though been applied to the estimation of high per-
centage of tungsten"' I", it can not be used for lower concentration due to the
poor sensitivity("'. Plasma emission spectroscopy offers a much higher sensitiv-
ity for tungsten and has been employed for its determination in steels and al-
loys'20-211 and tungsten ore'221. X-ray spectrometry has been in recent years
widely used for the estimation of tungsten in low level for its rapid, accurate and
reproducible results when a large number of samples are to he analysed. Several
workers have suggested various methods for its sample preparation which has a
vital importance in the XRF analysis. It is seen that fusion 121-251 or solution, 21 2 11
technique are in common use so as to reduce the effect of particle size,
heterogenity and mineralogical compositions. Since sample preparation by fu-
sion or solution is a time consuming process. ultrafine grinding followed by
pelletalizationl'"1 was preferred. Pelletization technique and use of secondary
standards for the calibration of XRF spectrometer are in common use for the
analysis of various ores and concentrates, presuming that matrix effect can he
minimised by selecting standards from the same origin having similar mineral-
ogical composition as that of the samples to he analysed. However, during the
analysis of tungsten in beneficiation products of wolframite hearing granite
from Degana using similar secondary standards it was observed that no linearity
could be obtained. This nonlinearity may be due to some inter elemental effect
which has to be accounted for (Fig. 1).
In the present paper, correction algorithms proposed by de jongh. Lucaus-
Tooth-Pyne, Rasberry and Heinrich have been used to study the matrix ef-
fects'29 301. Alfa coefficient has been calculated using intensity and concentra-
129

K. K. P4l )Hl rt, al.
W03 Y. --
Fig. / : Shaving the anal vocal curve.
tion data with the secondary as well as the synthetic standards.
EXPERIMENTAL.
Selection and preparation of standards
In the XRF analysis matrix corrections is important for accurate analysis.
This can he achieved either by mathematically or by using suitable calibration
standards of identical compositions with unknowns. In the present work few
samples of the ores from the same origin having the same mineral composition
were accurately analysed by conventional wet-chemical methods for a number
of times and preserved in a desiccator to he used for the preparation of analytical
curves. In addition to these, some synthetic standards were also prepared to pro-
vide the intensity data to cover a wide range of analysis. For this, accurately
analysed gaunge materials containing low amounts of tungsten was used as a
basic matrix and wolframite concentration (70% WO1were added to make var-
ied WO, concentration. The standards used for the analysis covered the range
from 0.008 to 8.0%7 to accomodate some of the heneficiation products. The con-
centration of the standard used for the calibration and regression analysis are
shown in Table 1. Care was taken to ensure that the standards and samples were
of the same particle size distribution as far as possible. Any adverse effect in
accuracy due to a particle size variation was minimised by high pressure
briquetting.
130
K. K. P,AI) HI el. al.
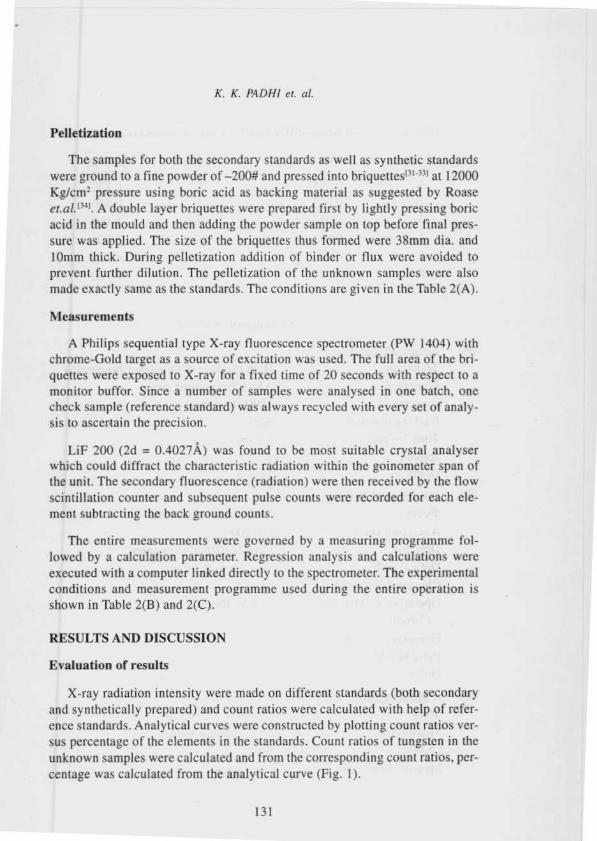
Pelletization
The samples for both the secondary standards as well as synthetic standards
were ground to a fine powder of -200# and pressed into hriquettes" " , at 12000
Kg/cm= pressure using boric acid as hacking material as suggested by Roase
er.al.13 ". A double layer briquettes were prepared first by lightly pressing boric
acid in the mould and then adding the powder sample on top before final pres-
sure was applied. The size of the briquettes thus formed were 38mm dia. and
10mm thick. During pelletization addition of binder or flux were avoided to
prevent further dilution. The pelletization of the unknown samples were also
made exactly same as the standards. The conditions are given in the Table 2(A).
Measurements
A Philips sequential type X-ray fluorescence spectrometer (PW 1404) with
chrome-Gold target as a source of excitation was used. The full area of the bri-
quettes were exposed to X-ray for a fixed time of 20 seconds with respect to a
monitor buffor. Since a number of samples were analysed in one batch, one
check sample (reference standard) was always recycled with every set of analy-
sis to ascertain the precision.
LiF 200 (2d = 0.4027A) was found to be most suitable crystal analyser
which could diffract the characteristic radiation within the goinometer span of
the unit . The secondary fluorescence (radiation) were then received by the flow
scintillation counter and subsequent pulse counts were recorded for each ele-
ment subtracting the back ground counts.
The entire measurements were governed by a measuring programme fol-
lowed by a calculation parameter. Regression analysis and calculations were
executed with a computer linked directly to the spectrometer. The experimental
conditions and measurement programme used during the entire operation is
shown in Table 2(B) and 2(C).
RI'SULTS AND DISCUSSION
Evaluation of results
X-ray radiation intensity were made on different standards ( both secondary
and synthetically prepared ) and count ratios were calculated with help of refer-
ence standards . Analytical curves were constructed by plotting count ratios ver-
sus percentage of the elements in the standards. Count ratios of tungsten in the
unknown samples were calculated and from the corresponding count ratios, per-
centage was calculated from the analytical curve (Fig. 1).
131

K. K. PADHI cr. a!.
Table I : Concentration of WO4 used in calibration and regression
SI.No. _%WO, SI. No. % WO
1L 0.008 7. 0.430
2. 0.023 8. 0.670
3. 0.056 9. 1.160
4. 0.085 l0. 2.100
5. 0 . 1 1 8 1 I . 4.920
6. 0.240 12. 7.100
Table 2 : Experimental conditions
(A) Sample Preparation
Technique
Equipment
Pressure
Backing material
Time for pressure
applied
Diameter
High pressure double layer briquetting
AMIL Briquetting press
12000 Kg/cm'
Boric acid
2 minutes
38 min
(B) Instrumental Parameters
Target
Analysing crystal
Detector
Optical path
Characteristic radiation
Operating Voltage and
Current
Goniometer setting (20)
Pulse height distribution
Order
(C) i) Measurement Programme
Mask
Measurement
Channel
Measurement Time
Chromium - Gold tube
LiF 200
Flow Scintillation counter
Vacuum (- 0.2 torr)
La
60 KV, 50mA
42.98
Fine
I
Nil
w.r.t., monitor buffor
w
20 seconds
132

K. K. PADHI el. a!.
ii) Calculation Parametersa) de jongh 's correction algorithms
D = -0.03995 E = 1.0046 Alpha(W) = 3.7648
K = 0.01205 a = 0.0145
h) Lucas-Tooth-Pyne correction algorithm
D = -0.04026 E = 1.00743 Alpha(W) = 3.55146K = 0.01158 a = 0.01520
c) Lucas-Tooth-Pyne correction algorithm
D = -0.03956 E = 0.99814 Alpha(W) = 4.37009K = 0.01158 (T = 0.0140
Precision and Accuracy
Samples were analysed by this method for tungsten contents for a number of
times and the data obtained is shown in Table 3. The coefficient of variation (v)
were calculated by the following relation
/()0 ed'V
.c (n-I )
where x =
d =
n =
average concentration in percent
difference of determination from the mean and
number of determinations.
Results obtained by using the described method have been compared with
the results obtained by wet chemical methods. In general, the analytical errors
(% deviation from chemical values) were obtained with in 6% of the amount
present as shown in Table 3. So correction algorithms of the existing three mod-
els were applied to achieve reproducible and accurate results.
Discussion
It is well known that, in XRF spectrometry, analysis of an element is affected
by the matrix and when there is wide variation in the analyte concentration, the
matrix correction also changes accordingly. To minimise the inter elemental ef-
fect over the analytical accuracy, different sets of standards were selected judi-
ciously as shown in Table I. so that the mineralogical compositions of standards
and the unknown were almost similar. This avoided the mathematical correction
115_shi for matrix effect. The correlation between the net countrate, or ratio, and
133
K. K. P4l)/Il rt. at.
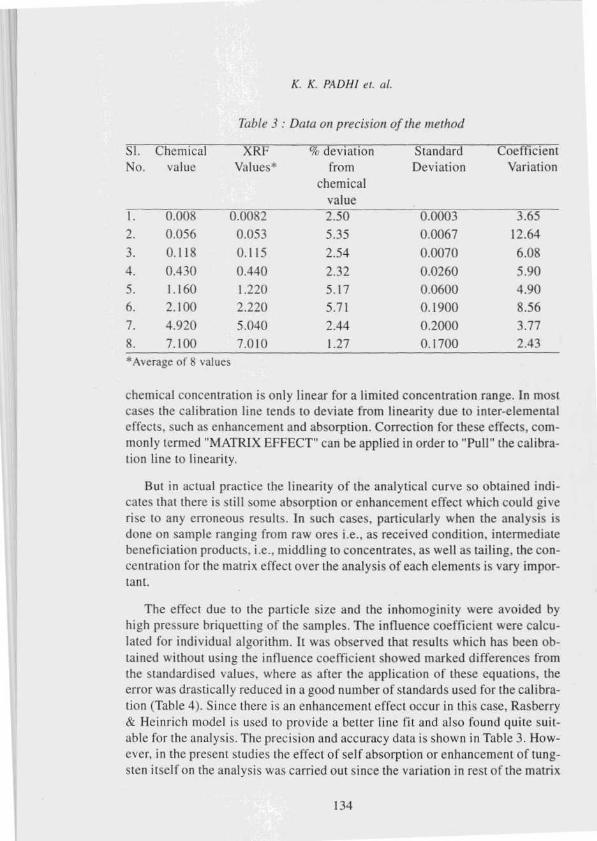
Table 3 : Data on precision of the method
Sl. Chemical XRI % deviation Standard Coefficient
No. value Values* from
chemical
value
- -
Deviation Variation
1. 0.000 0.0082 2.50 3.65
2. 0.056 0.053 5.35 0.0067 12.643. 0.118 0.115 2.54 0.0070 6.08
4. 0.430 0.440 2.32 0.0260 5.905. 1.160 1.220 5.17 0.0600 4.90
6. 2.100 2.220 5.71 0.1900 8.567. 4.920 5.040 2.44 0.2000 3.77
8. 7.100 7.010 1.27 0.1700 2.43
*Average of 8 values
chemical concentration is only linear for a limited concentration range . In most
cases the calibration line tends to deviate from linearity due to inter-elementaleffects, such as enhancement and absorption. Correction for these effects, com-
monly termed "MATRIX EFFECT" can be applied in order to " Pull" the calibra-
tion line to linearity.
But in actual practice the linearity of the analytical curve so obtained indi-
cates that there is still some absorption or enhancement effect which could give
rise to any erroneous results. In such cases, particularly when the analysis is
done on sample ranging from raw ores i.e., as received condition, intermediate
beneficiation products, i.e., middling to concentrates , as well as tailing , the con-
centration for the matrix effect over the analysis of each elements is vary impor-
tant.
The effect due to the particle size and the inhomoginity were avoided by
high pressure briquetting of the samples. The influence coefficient were calcu-
lated for individual algorithm. It was observed that results which has been ob-
tained without using the influence coefficient showed marked differences from
the standardised values, where as after the application of these equations, the
error was drastically reduced in a good number of standards used for the calibra-
tion (Table 4). Since there is an enhancement effect occur in this case. Rasberry
& Heinrich model is used to provide a better line fit and also found quite suit-
able for the analysis. The precision and accuracy data is shown in Table 3. How-
ever, in the present studies the effect of self absorption or enhancement of tung-
sten itself on the analysis was carried out since the variation in rest of the matrix
134

K. K. P.41)N1 et. al.
Table 4 : Comparision of the correction algorithm models
Sl. % XRF results XRF Results after correction
No. WO, without
correction
(%) (17c) dj Model L.T.P. Model R.H. Model
WO, Error (%) (%) (%) (%) (%) (%)WO1 Error WO, Error WO, Error
1. 0.023 0.0245 6.52 0.024 4.35 0.0235 2.17 0.0228 0.862. 0.085 0.0875 2.94 0.083 2.35 0.0841 1.05 0.0842 0.94
3. 0.24 0.263 9.58 0.25 4.17 0.235 2.08 0.243 1.25
4. 0.67 0.647 3.43 0.685 2.23 0.682 1.79 0.0676 0.895. 2.10 2.22 5.71 2.081 0.90 2.085 0.70 2.086 0.19
6. 4.92 5.04 2.44 4.856 1.30 4.883 0.75 4.901 0.38
7. 7.10 7.01 1.27 7.088 0.17 7.110 0.14 6.995 0.07
concentration is not very significant . The range of tungsten percentage varied
only upto 5.0% and the standards were selected upto 7.0%.
CONCLUSIONS
It may he stated that XRF equipment is being acquired by many laboratories
and possibly in course of time this would he used to a large extent. The method
is to be highly recommended, especially for tungsten bearing material, for
which dissolution procedures are not satisfactory. Moreover, the sample once
prepared can be preserved indefinitely, for recheck whenever necessary. A ma-
jor factor is in the preparation of samples and standards which should ideally
match each other in the physical and chemical parameters. This is very often not
possible so mathematical corrections of the experimentally measured intensity
becomes a must. Therefore care has been taken to apply some correction algo-
rithms on XRF analysis of tungsten in low grade tungsten ore of degana andC, efound that a reproducible and accurate results were obtained after applying the
Rasberry and Heinrich model for correction.
ACKNOW LEI)GE\IENT
The authors wish to express their grateful thanks to Prof. P. Ramachandra
Rao. Director, National Metallurgical Laboratory, Jamshedpur, for his kind per-
mission to publish this paper.
135

K. K. PADHI et, a!.
REFERENCES
[ 1 ] Topping, J.J., (178), Talanta, 25, p.61.[21 Sandell. E.B.. (1959),Colorimetric Determination of Traces of Metals', 3rd ed.
New York, Interscience Publishers Inc., p.886.
[ 3) Brenner, 1. B., et. al., (1984), Appl. Spectose, 38(6), p.887.
141 Sastri, V. S.. (1983), Talanta. 29(5), p.405.
[5] Feng, Lou., (1986). Anal. Abstract., 45(2), 2B, p.133.
[6] Chang, C, et. al., (1987), Analyst, 112, p.627.
[7) Nazarenko, V.A., et. al., (1987),Talanta. 34. p.215.
[8] Wilson, E.P., (1983),Talanta, 30, p.876.
191 Harris, A.M., et.a!., (1979),X-Ray Spectrom., 8(3), p.129.
[10] Nomoto, K., et.al., (1978).Nippon Tungsten Revv 11., p.56.
[ I 1 ] Elwell, W. T., et.a!., '(1971).Anal vtical Chemistry of Molybdenum and Tungsten',Oxfod , Pergamon press.
[121 Topping. J. J., (1978),Anal. Lett., 25, p.61.
[1 3 ] Glandey, E.S., (1978), Anal. Lett., A l 1, p.429.[ 14] Nadkarni , R. A, et.al., (1978), Anal. Chem.. 50, pp.294.
[15] Iyer, C. S. P., et.al., (1972), Radio Chem. Radional Lett. 12. p.201
[16] Edger, R.M., (I976),Anal. Chem., 48, p.1653.
[17] Spreng, E.C., et.al., (1981),Analyst, 106, p.1210.
[1 8 1 Raoot, S., et.a!., (1986), Analyst, 1 I I, p.115.[ 19] Manning, D.C., (1966). Atom. Absorp. News Lett., 5, p.127.[201 Wunsch. G., (1976),Talanta, 26. p.291.[211 Czech, N., et.al., (1981), .Spectrochim Acta., 36B, p.6.
1221 Raoot, S.. et.al., (1987). Proceedings Tungsten Resources Development, p.153.
[231 Lassner. E., et.al ., (1966). Metal, 20, p.724.
[24] Domel. C, et.al., (1976),Rep. Natn. Inst . Metal., 12, p.1817.[251 Hams, A.M.. et.a!., (1979), X-Ray Spectrom., 8. p.129.[26] Nomoto, K., et.al., (1978),Nippon Tungsten Rev., 11. p.56.[271 Chan, F.L., et.al., (1972)Adv. X-Ray Anal., 15. p.209.[281 Carr Brion, K.G., et. al., (1968 ). Analyst, 93. p.441.
[29] de jongh, W. K.. (1973), X-Ray Spectrom, 2, p.151.
[301 Tertian , R.. et.al ., "(1982). Principles of Quantitative X-ray fluorence Analysis',Hoyden and Sons Ltd.. Chapter 10.
[311 Adler, 1., et.a!., (1980),Anal. Chem., 29, p.1980.[321 Gagel. J.E., et.al., (1957), Anal. Chem., 29, p.2187.
[331 Jenkins, R., et.al ., (1967), 'Practial X-Ray Spectrometry' Philips Tech.Lib..Netherland.
[341 Rose. J. R., et.al., (1971), ASTM 'Methods of Emission Spectchemical Analysis E-2SM11.
[351 Tertion, R., (1973). X-Ray Spectrometry, 2, p.95.
[361 IDEM. ibid, 3. (1974), p.102.
136