Embed Size (px)
Citation preview
DEFORMATION AND ANNEALING RESPONSE
OF TD-NICKEL CHROMIUM SHEET
by
R. D. Kane and L. J. Ebert
D NPORCEATION AND NNBALING RESPONSE OFRepor-NICKtL COul1973 SEET Annual Status N74-1224Report, Ju. 1973 (Case Inst. of Tech.)
CSCL IFp UnclasG3/17 15427
ANNUAL STATUS REPORT
July 1973
Prepared for
NATIONAL AERONAUTICS AND SPACE ADMINISTRATION
Grant NGR 36-003-094
PRICES SUBJECT TO CHANGE
Reproduced by
NATIONAL TECHNICALINFORMATION SERVICE
US Department of CommerceSpringfield, VA. 22151
School of EngineeringDepartment of Metallurgy and Materials Science
Case Western Reserve UniversityCleveland, Ohio 44106
PRICES SUBJECT TO cHANGE
https://ntrs.nasa.gov/search.jsp?R=19740004136 2018-09-13T14:29:02+00:00Z
DEFORMATION AND ANNEALING RESPONSE
OF TD-NICKEL CHROMIUM SHEET
NGR 36 -003-094
Annual Status Report
July 1973
Prepared by R. D. Kane and L. J. Ebert
Submitted to:
Office of Grants and Research Grants
Attention Code SC
National Aeronautics and Space Administration
Washington, D. C. 20546
School of EngineeringDepartment of Metallurgy and Materials Science
Case Western Reserve UniversityCleveland, Ohio 44106
Ir
DEFORMATION AND ANNEALING RESPONSEOF TD-NICKEL CHROMIUM SHEET
ABSTRACT
by
Russell D. Kane
The deformation and annealing response of TD-nickel chromium (TD-NiCr)
0.1 inch thick sheet was examined using various cold rolling and annealing treat-
ments. Upon annealing (above 816 0 C (1500 0 F)), the as-received material was
converted from an initially ultra-fine grain size (average grain dimension 0.5 -
1 micron) to a large grain structure. Increases in grain size by a factor of
100 to 200 were observed for this transformation. However, in those material
states where the large grain transformation was absent, a fine grain recrystal-
lized structure formed upon annealing (above 7320 C (1350 0 F)). The deformation
and annealing response of TD-NiCr sheet was evaluated with respect to the pro-
cessing related variables as mode and severity of deformation and annealing
temperature. Results indicate that the large grain transformation in TD-NiCr
sheet is abnormal grain growth. In the absence of this transformation, classical
primary recrystallization occurs.
Using selected materials produced during the deformation and annealing
study, the elevated temperature tensile properties of TD-NICr sheet were examined
in the temperature range 5930C (11000 F) to 1093 0C (20000 F). It was observed
that the elevated temperature tensile properties of TD-NiCr sheet could be
optimized by the stabilization of a large grain size in this material using the
cold working and/or annealing treatments developed during the present investigation.
Limited studies were conducted by Department undergraduates in the areas
of deformation and annealing response of TD-NiCr sheet. The starting materials
were (1) the 0.275 inch thick sheet and (2) the 0.1 inch thick sheet following
annealing at 15000 F (816 0 C) for 90 hours. It was observed that grain size and
L/D ratio of the 0.275 inch thick sheet were relatively insensitive to the pro-
cessing-related variables as mode and severity of deformation and annealing
temperature. It was possible to produce material states of TD-NiCr from the
0.1 inch sheet which were characterized by large grain sizes and L/D ratios of
about 30 by using repeated combinations of cold rolling and annealing.
ii
FOREWORD
This Annual Status Report represents investigations conducted under
NASA Grant NGR 36-003-094 from June 1972 to June 1973. The initial portion of
this presentation describes the work presented to Case Western Reserve University
by Russell D. Kane in partial fulfillment of the requirements for the degree of
Master of Science. Additional data obtained during the course of the past year
by (unsupported) student projects has been included in the Appendix of this
report.
iii
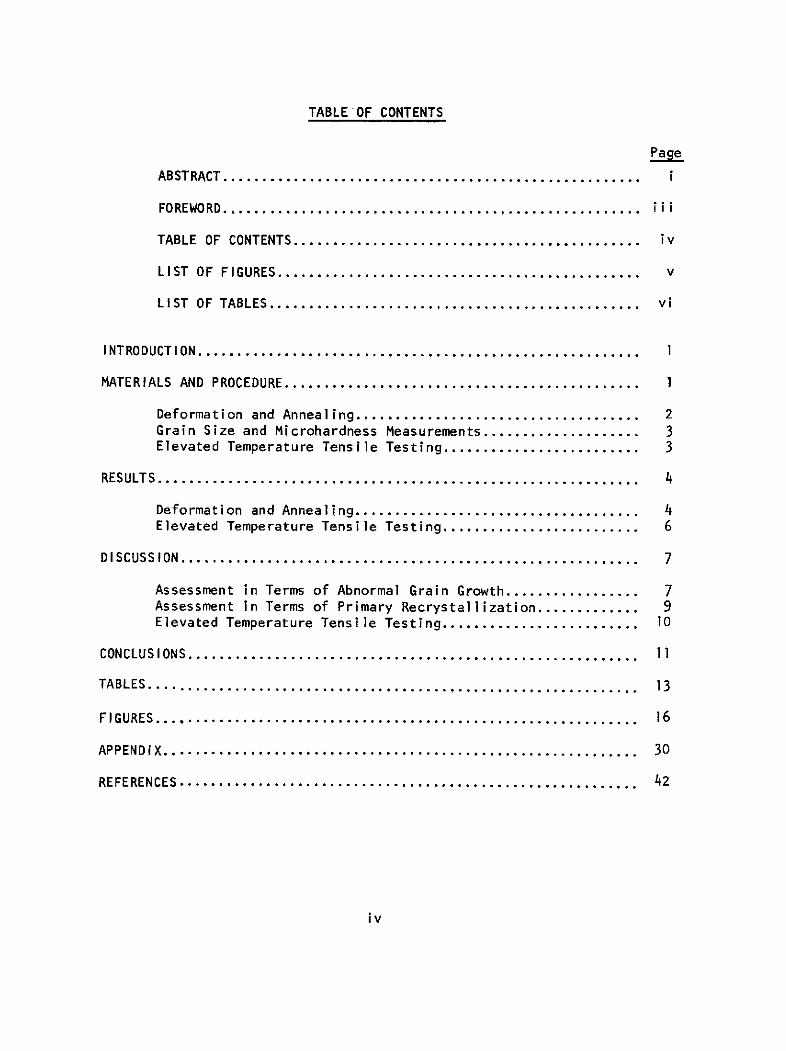
TABLE OF CONTENTS
Page
ABSTRACT.................................................... i
FOREWORD.................................................... iii
TABLE OF CONTENTS............................................ iv
LIST OF FIGURES.............................................. v
LIST OF TABLES............................................... vi
INTRODUCTION....................................................... 1
MATERIALS AND PROCEDURE............................................. 1
Deformation and Annealing.................................... 2Grain Size and Microhardness Measurements.................... 3Elevated Temperature Tensile Testing......................... 3
RESULTS............................................................. 4
Deformation and Annealing.................................... 4Elevated Temperature Tensile Testing......................... 6
DISCUSSION.......................................................... 7
Assessment in Terms of Abnormal Grain Growth................. 7Assessment In Terms of Primary Recrystallization............. 9Elevated Temperature Tensile Testing......................... 10
CONCLUSIONS......................................................... 11
TABLES ......................... .................................... 13
FIGURES........................... ................................. 16
APPENDIX........................... ................................ 30
REFERENCES.......................................................... 42
iv
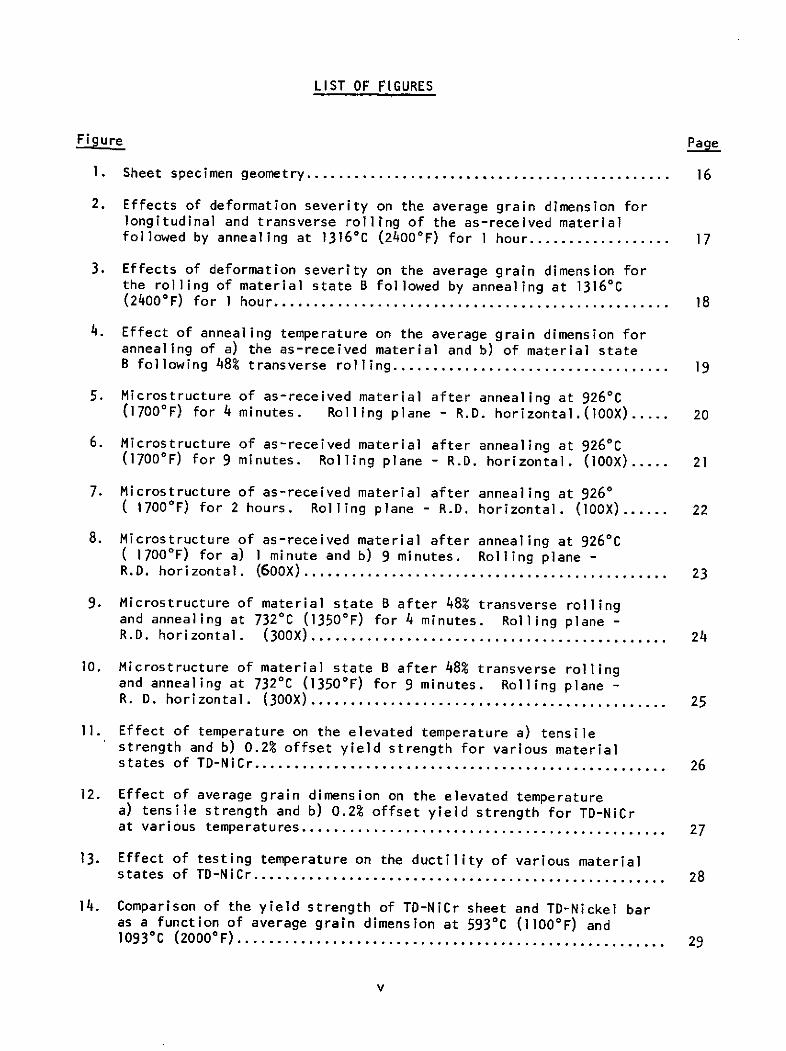
LIST OF FIGURES
Figure Page
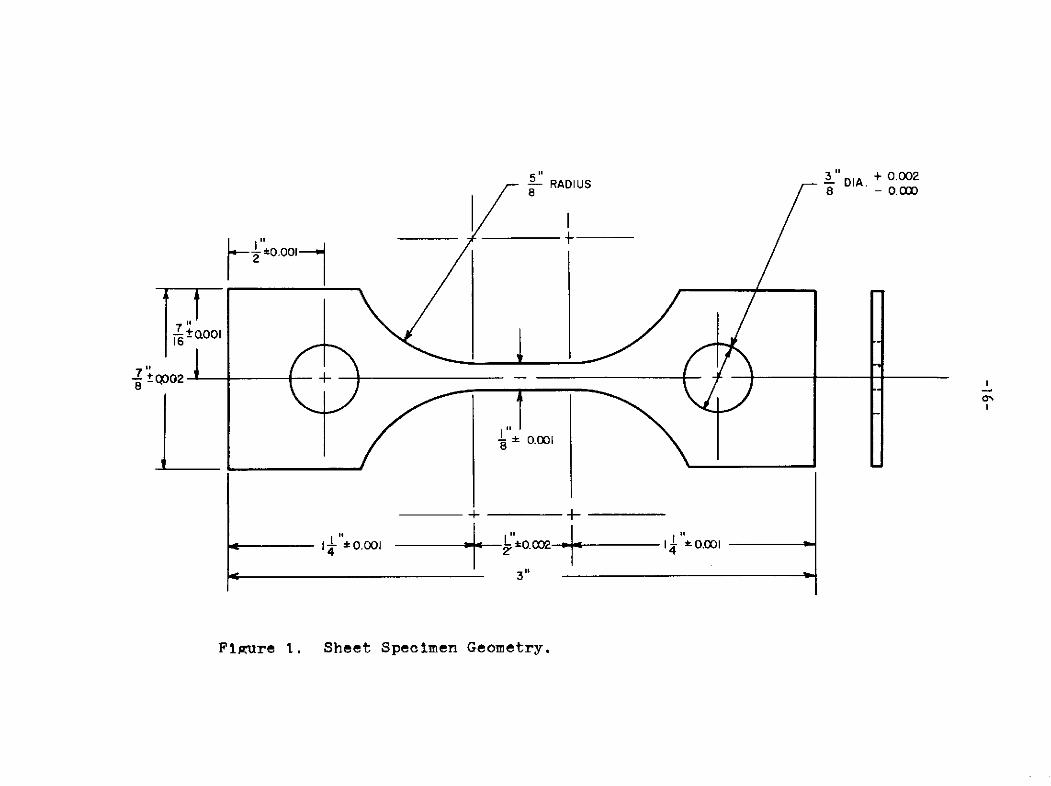
1. Sheet specimen geometry.............................................. 16
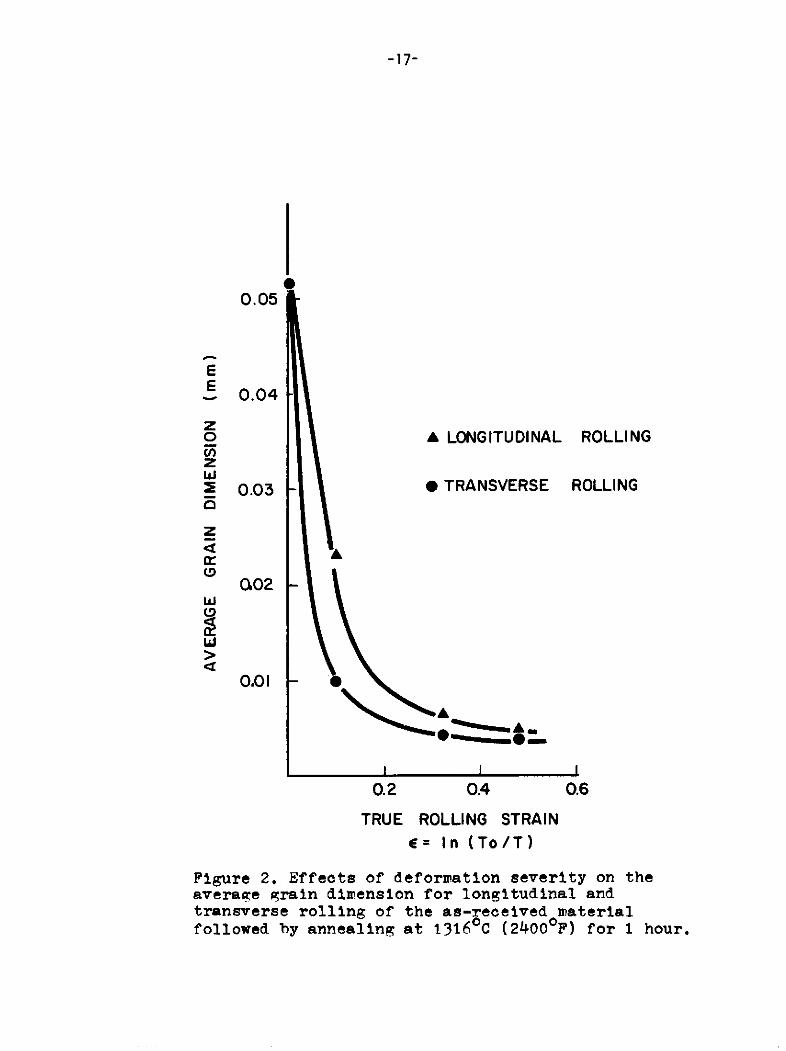
2. Effects of deformation severity on the average grain dimension forlongitudinal and transverse rolling of the as-received materialfollowed by annealing at 1316 0 C (2400*F) for 1 hour................... 17
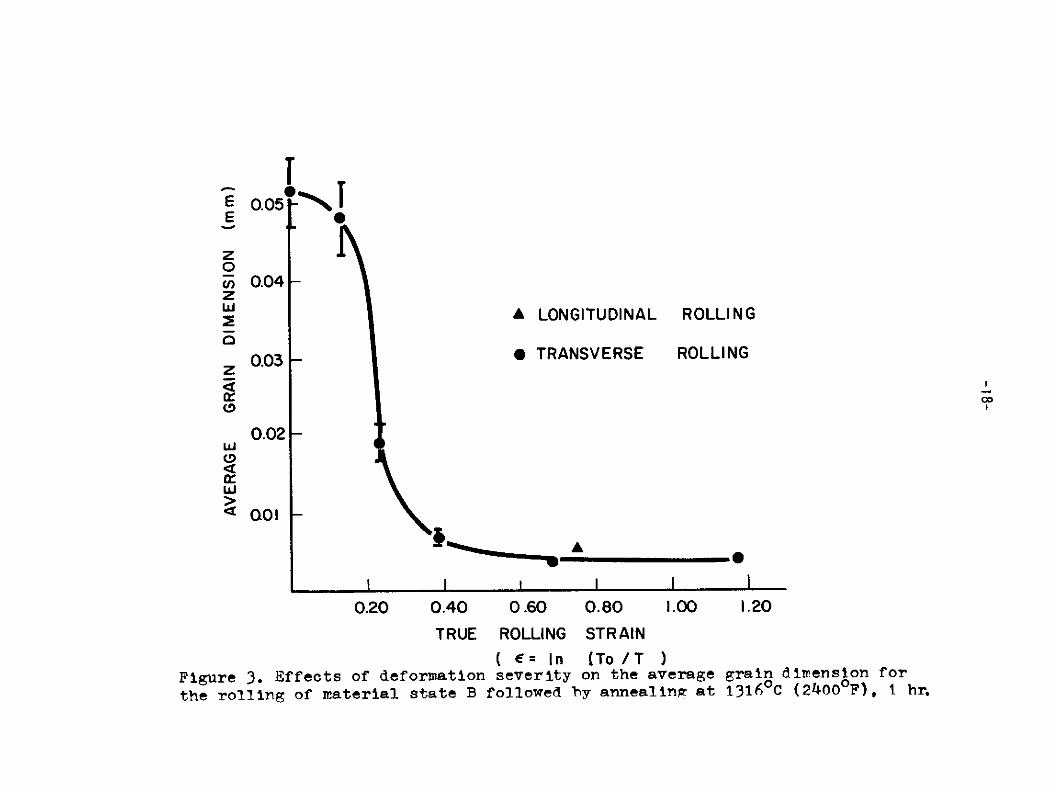
3. Effects of deformation severity on the average grain dimension forthe rolling of material state B followed by annealing at 1316 0C(2400°F) for 1 hour................................................... 18
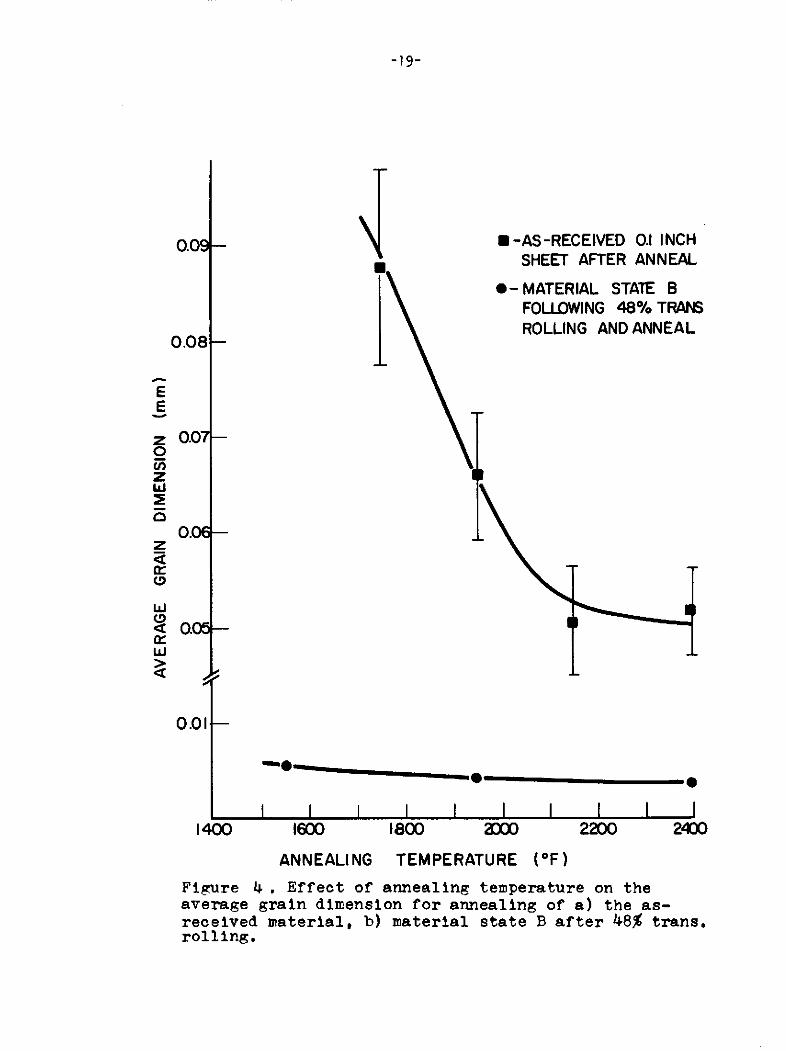
4. Effect of annealing temperature on the average grain dimension forannealing of a) the as-received material and b) of material stateB following 48% transverse rolling................................... 19
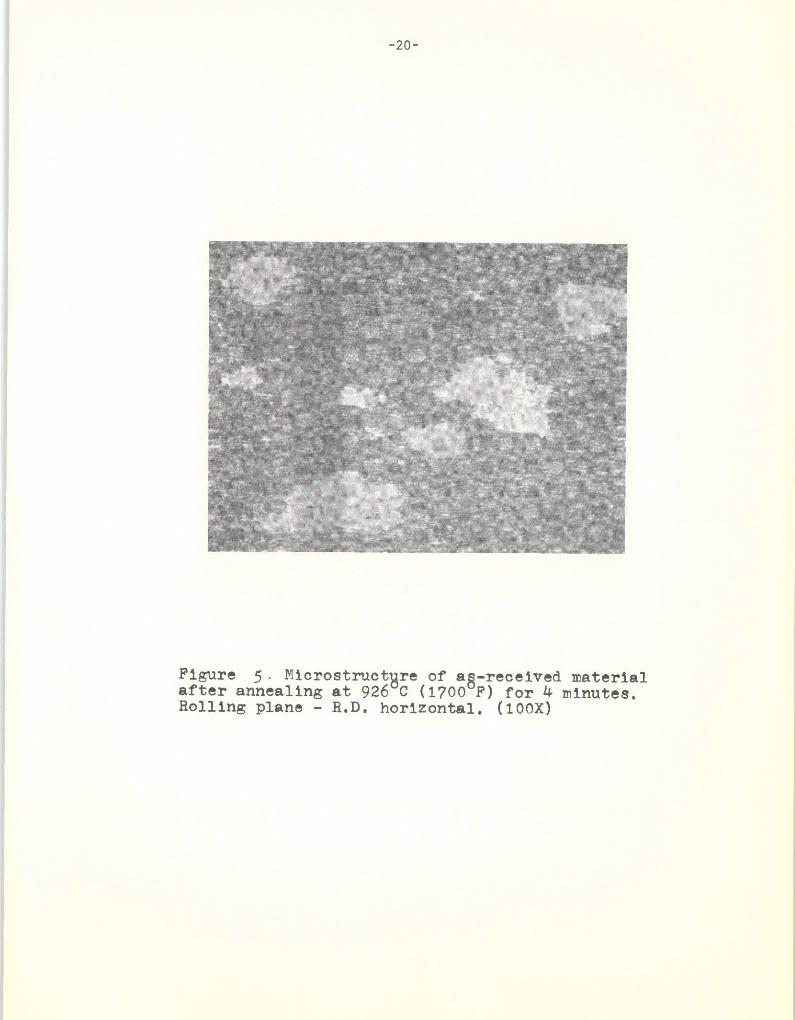
5. Microstructure of as-received material after annealing at 9260 C(1700°F) for 4 minutes. Rolling plane - R.D. horizontal.(lOOX) ..... 20
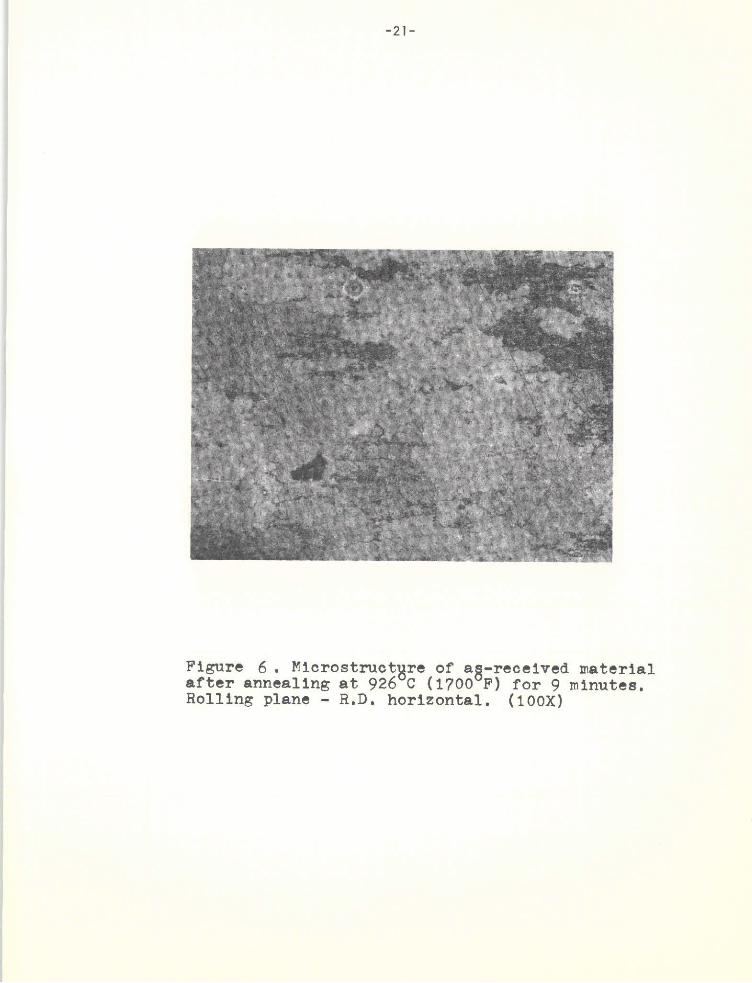
6. Microstructure of as-received material after annealing at 9260 C(1700 0 F) for 9 minutes. Rolling plane - R.D. horizontal. (100X)..... 21
7. Microstructure of as-received material after annealing at 9260( 1700F) for 2 hours. Rolling plane - R.D. horizontal. (100X)....... 22
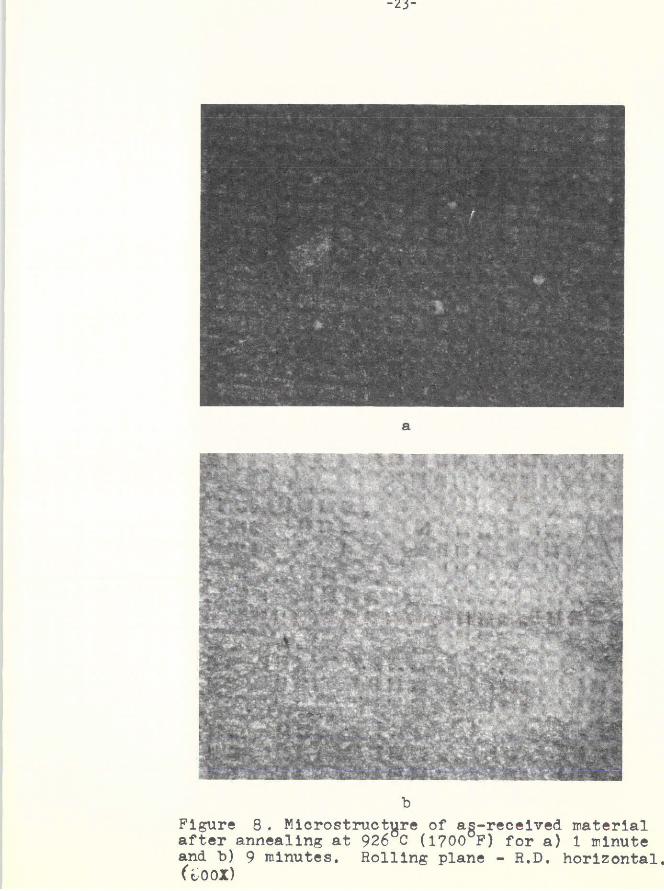
8. Microstructure of as-received material after annealing at 9260 C( 1700 0F) for a) 1 minute and b) 9 minutes. Rolling plane -R.D. horizontal. (600X).............................................. 23
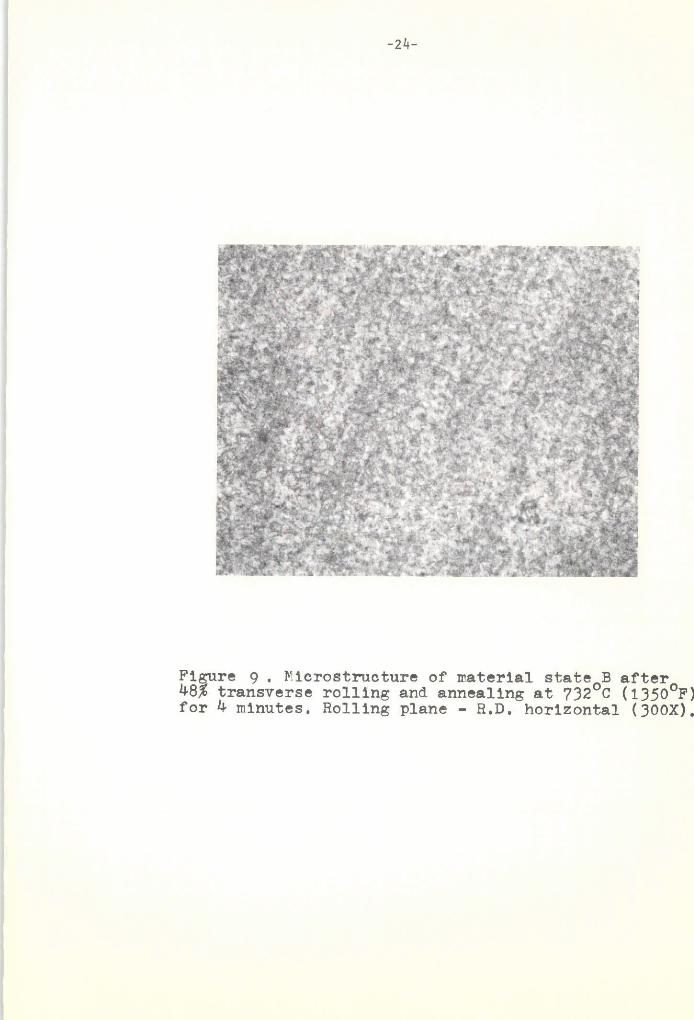
9. Microstructure of material state B after 48% transverse rollingand annealing at 7320 C (1350*F) for 4 minutes. Rolling plane -R.D. horizontal. (300X)............................................. 24
10. Microstructure of material state B after 48% transverse rollingand annealing at 732 0C (1350 0 F) for 9 minutes. Rolling plane -R. D. horizontal. (300X)............................................. 25
11. Effect of temperature on the elevated temperature a) tensilestrength and b) 0.2% offset yield strength for various materialstates of TD-NICr .................................................... 26
12. Effect of average grain dimension on the elevated temperaturea) tensile strength and b) 0.2% offset yield strength for TD-NiCrat various temperatures.............................................. 27
13. Effect of testing temperature on the ductility of various materialstates of TD-NiCr .................................................... 28
14. Comparison of the yield strength of TD-NICr sheet and TD-Nickel baras a function of average grain dimension at 5930C (11000 F) and1093 0C (200 0 F)...................................................... 29
v
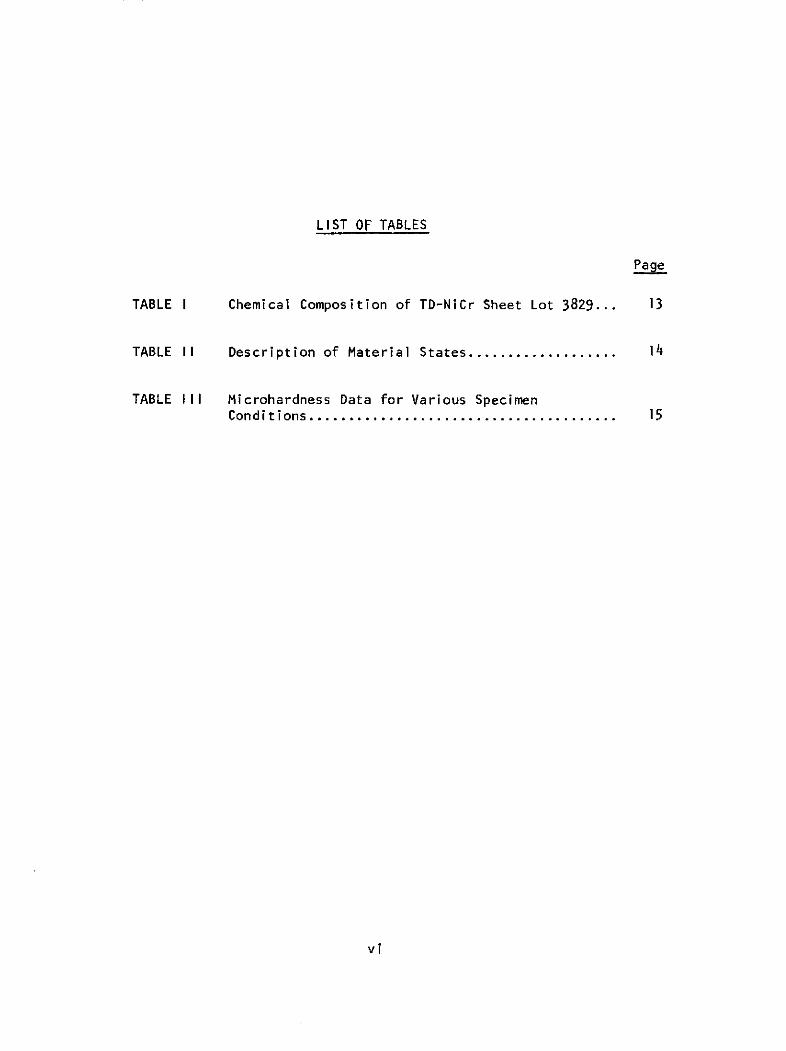
LIST OF TABLES
Page
TABLE I Chemical Composition of TD-NiCr Sheet Lot 3829... 13
TABLE II Description of Material States ................... 14
TABLE III Microhardness Data for Various SpecimenConditions....................................... 15
vi
INTRODUCTION
In recent years, much has been learned of the recrystallization charact-
eristics and of the elevated temperature deformation mechanisms of TD-Nickel
(1-8), the forerunner of TD-Nickel-Chromium (TD-NiCr). However, the recentness
of the development of TD-NiCr has not permitted ample opportunity to evaluate
the material in light of the work which has been done on either the SAP (Sintered
Aluminum Powder) or TD-Nickel alloys. Even more importantly, it was not known
whether the unique recrystallization response(2 '3) and the high temperature
deformation mechanisms(4'5 ) which make TD-Nickel a very unusual alloy as also
characteristic of TD-NiCr. Such knowledge becomes mandatory if optimization of
high temperature use of TD-NiCr materials is to be achieved.
The primary purpose of the present study was the determination of the
nature of the recrystallization and grain growth processes in TD-NiCr sheet
material, and their evaluation in terms of classical primary recrystallization
and abnormal grain growth concepts. Research performed on TD-Nickel has indicated
that the development of an understanding of these phenomena played a key role in
the development of processing procedures with which the elevated temperature
(4)properties of TD-Nickel could be brought to their full potential . Because
of the inherent similarities of TD-Nickel and TD-NiCr, it was felt that such an
understanding would be equally important in gaining the optimization of the high
temperature mechanical properties of the more recent TD-Nickel-Chromium material.
MATERIALS AND PROCEDURE
For the present study, TD-Nickel-Chromium (TD-NiCr) was supplied by the
Fansteel Company in the form of 0.1 inch thick sheet. The product is fabricated
by conventional powder metallurgical techniques. Thoria containing nickel-
-2-
chromium powder (approximately 80% nickel - 20% chromium) is consolidated and
sintered, and then hot and warm rolled to final thickness. Typical composition
and thoria content of this material is shown in Table I.
Deformation and Annealing
The deformation and annealing response of TD-NiCr sheet was determined
with respect to the following parameters: mode and severity of deformation, and
the time and temperature of annealing. In the present investigation the material
was both longitudinally and transversely rolled without varying the rolling plane
from that of the as-received material. These rolling operations were then fol-
lowed by annealing treatments. The rolling was performed in step reductions of
approximately 10% per pass. Annealing was carried out in an argon atmosphere
for one hour at 1316 0 C unless specified otherwise.
To study the effects of the mode and severity of deformation on the
final annealed grain structure in TD-NiCr, the unannealed, as-received TD-NiCr
sheet was reduced 10%, 28% and 44% for both longitudinal and transverse cold
rolling operations. The as-received and annealed material was rolled 12%, 21%,
28%, 48% and 67% in the transverse direction, and 53% longitudinally in separate
operations. These materials were then annealed at 1316*C for one hour.
The influence of the annealing temperature in determining the final
grain size was studied by annealing two different material states of TD-NiCr
sheet at various temperatures between 7320 C and 1316 0C for two hours. The two
material states chosen were the as-received material, and the as-received and
annealed material reduced 48% by transverse rolling. As a corollary to this
study, the effect of annealing time on the final annealed grain structure was
determined by using the same material states and annealing temperature as those
mentioned previously, but reducing the annealing time from two hours to one minute.
-3-
Grain Size and Microhardness Measurements
The grain size in the annealed materials was determined as a function of
the severity and mode of prior deformation and annealing temperatures. In general,
the grain shapes were not equiaxed; therefore, measurements of the grain dimensions
were made in the rolling direction and in the transverse and thickness directions.
The grain dimensions in each direction were determined by a line intercept tech-
nique and were the result of over 25 or more separate observations. By using a
statistical analysis, the average grain dimension was found. This value was the
statistical mean of over 200 separate grains.
To delineate the grains preparatory to grain size measurements, the
various material states of TD-NiCr were metallographically polished and etched
using either one of two etching techniques. The first consisted of electro-
chemical etching with a solution consisting of 6 parts ethanol, I part H2 S04
and 21 parts water using a 5-volt power. The second was a thermal etch and con-
(9)sisted of heating the polished specimen at 5930C for 5-10 minutes
In addition to determining the grain size of the deformed and annealed
materials, the microhardness of selected specimens was measured. The most impor-
tant use of the microhardness readings was that associated with the characteriza-
tion of transformed and non-transformed regions in the TD-NiCr sheet. A 300 gram
load was employed in the microhardness measurements. Prior to testing, the
specimen surface was either thermally or electrochemically etched by the tech-
niques noted above.
Elevated Temperature Tensile Testing
In order to investigate the effect of grain size on the elevated temper-
ature tensile properties of TD-NiCr sheet, tensile tests were performed on
selected material states of TD-NiCr. These materials were produced by use of
-4-
the processing methods developed during the deformation and annealing study.
Tests were conducted in the temperature range 5930C (0.52 T ) to 1093 0C (0.82 Tm)
on (average) grain sizes of TD-NiCr sheet between 0.0037mm to 0.0515mm.
The elevated temperature tensile tests were performed in a vacuum of
-5 f28C b enapproximately 5 x 10⁻⁵ torr. The temperature was controlled to + 2.80C by means
of a platinum - 10% rhodium thermocouple in contact with the middle of the gage
section of the tensile specimen. The specimen design is shown in Figure 1.
Generous radii of curvature at the specimen shoulders were employed to minimize
shoulder breaks, thus insuring reliable measurements of ductility. For all speci-
mens tested, the initial strain rate was 0.01/minute for the 0.5 inch gage section.
RESULTS
Deformation and Annealing
Upon cold rolling and subsequent annealing at 1316*C of the as-received,
unannealed TD-NiCr 0.1 inch thick sheet, the average grain dimension (AGD) was
found to decrease with increasing severity of prior deformation for both longi-
tudinal and transverse rolling as shown in Figure 2. The true rolling strain
has been used to indicate deformation to permit a more basic representation of
the data. The combination of transverse rolling and annealing was observed to
have a somewhat greater effect on reducing the AGD than did similar longitudinal
rolling and annealing treatments.
Figure 3 shows similar curves for the rolling and annealing of TD-NiCr
sheet where the starting material is in the as-received annealed condition. The
AGD following these treatments was also found to decrease with increasing rolling
severity for both longitudinal and transverse rolling. It was observed that the
-5-
decrease in grain size observed was due to a monotonic decrease in each of the
three linear grain dimensions. It was also noted that the L/D* (grain aspect)
ratio remained approximately the same during rolling and annealing. Values of
L/D determined during this portion of the study were consistently between 2 and 4.
Five different material conditions of TD-NiCr sheet that were chosen as
"standard states" for further investigation are shown in Table II. They have
essentially a constant L/D ratio and differ only in grain size (grain volume).
The effect of the value of the annealing temperature on the grain size in
TD-NiCr sheet is shown in Figure 4. The AGD of material state A (see Table II)
following annealing was shown to increase with decreasing annealing temperature
over the range 9540C to 1316C for constant annealing time (2 hours). Only very
small, insignificant effect was observed when material state B was transversely
rolled 48% and annealed.
Figure 5 through 7 show the microstructure in material state A after
annealing times of 1 minute to 2 hours at 9260 C. After 2 hours at temperature,
the entire specimen was transformed to a relatively large grain structure (AGD
= O.09mm). With shorter annealing times, the amount of material transformed to
this structure is considerably less. As shown in Figures 8a and 8b, the untrans-
formed areas appear as regions of extremely fine grains. The microhardness of
these untransformed regions was not comparable to that of the initial material,
but was, as shown in Table III, considerably less. It was only slightly higher
than the regions which had undergone complete transformation to a large grain
structure.
A similar investigation was performed on material state B following 48%
transverse rolling. For annealing at 9260 C, the material was completely trans-
formed to a fine grain structure (-0.004mm) after only one minute at temperature
Ratio of average length to average diameter of elongated grains.
-6-
with little observable grain growth for times up to 2 hours. However, at 7320 C
this material state is not transformed to a high degree until approximately nine
minutes (as shown in Figures 9 and 10). Microhardness measurements show that
there is little observable decrease in hardness until the material transforms
to the fine grain structure, and then there is no further significant change
once the transformation is complete.
Elevated Temperature Tensile Testing
Using material states B, L, C. and D, the standard tensile properties
consisting of tensile strength, 0.2% offset yield strength and ductility (in terms
of percent elongation) were measured over the temperature range 5930C to 1093 0C.
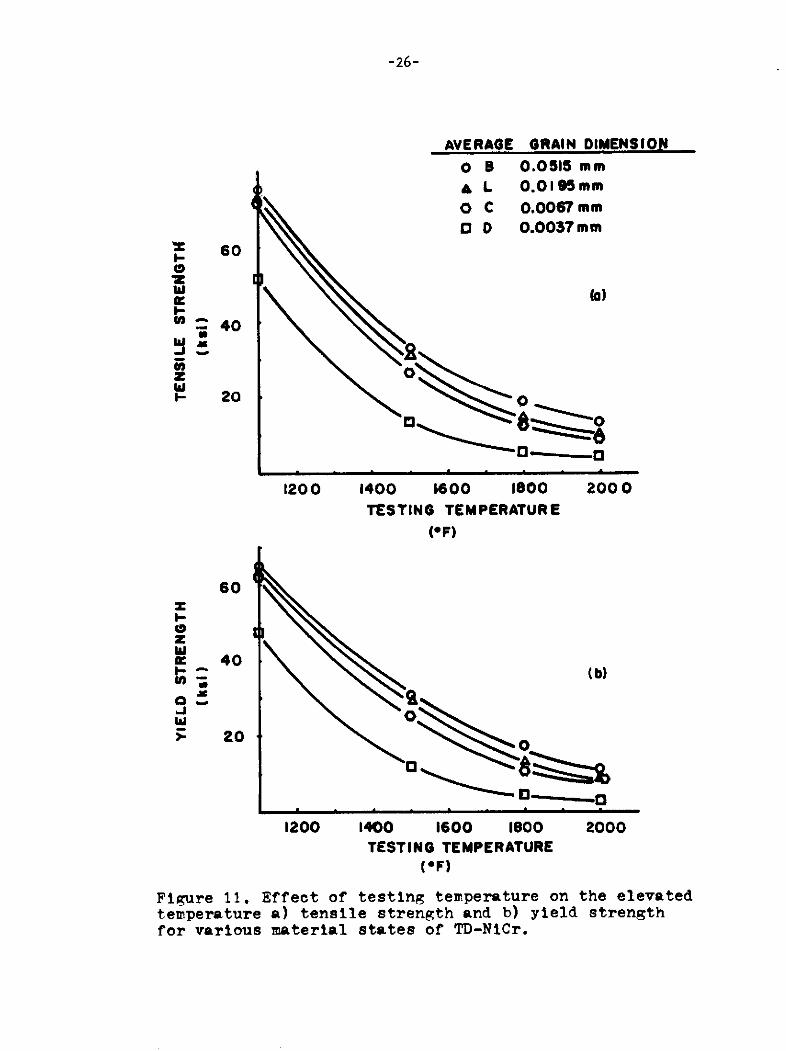
Figure 11 shows the tensile and yield strength of TD-NiCr sheet material as a
function of temperature. All stress values were observed to decrease uniformly
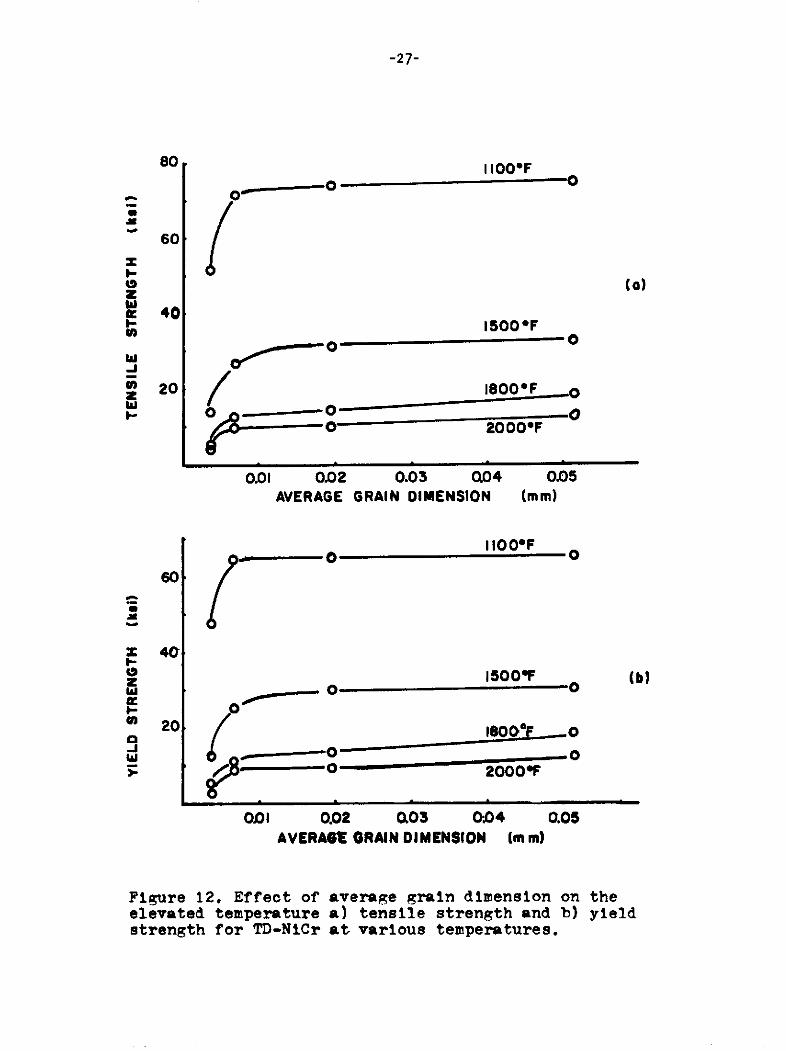
with increasing temperature. The grain size dependence of the tensile and yield
strength is shown particularly well in Figure 12. Over the range of grain sizes
tested, it was observed that there is a relatively large increase in the strength
properties with grain size in the smaller grain size region (0.0037mm to 0.0067mm)
but thereafter, these properties are nearly independent of grain size.
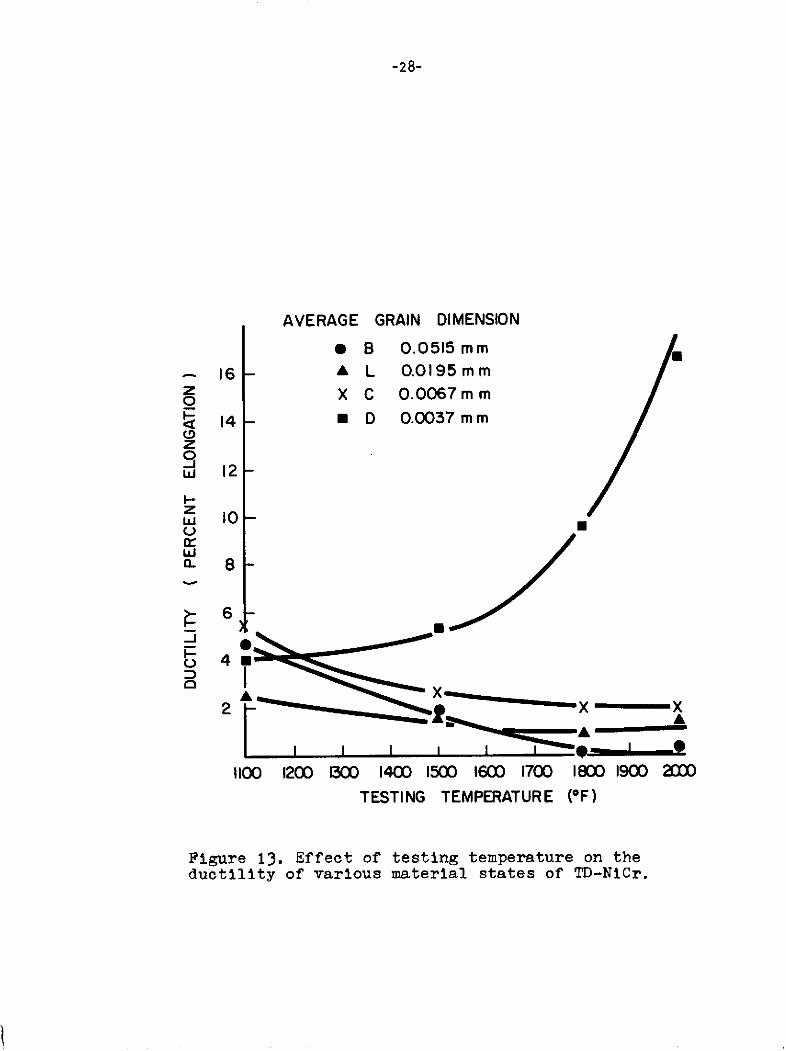
Figure 13 shows the ductility of these materials as a function of temper-
ature for various grain sizes. At 593 0C, all elongation values were clustered
around 4 ± 2 percent. As the temperature was increased, the ductility began to
show a definite grain size dependence. In the temperature range 9820C to 1093 0C,
the ductility increases significantly with decreasing grain size.
-7-
DISCUSSION
On the basis of the results of the present study it appears that two
basically different annealing responses of TD-NiCr sheet were observed, depending
on the initial state of the material and/or on the processing history prior to
annealing. The as-received TD-NiCr 0.1 inch thick sheet (material state A)
exhibited a particularly large increase in grain size upon annealing. The char-
acteristics of this transformation are such as to indicate that abnormal grain
growth processes were present. However, subsequent rolling and annealing pro-
duced a decrease in grain size with increasing rolling severity. This effect was
very similar to classical primary recrystallization in pure non-thoriated metals.
Assessment in Terms of Abnormal Grain Growth
A complete discussion of abnormal grain growth in pure metals, as well
as in dispersion strengthened metals, is given by Hillert(10) and is critically
reviewed by Petrovic(3,ll) in relation to TD-Nickel dispersion strengthened system.
The importance of the particle dispersion in promoting abnormal grain growth
arises from its effect in terms of the following equation for a normal grain
growth in dispersion strengthened alloys:
V = My(l/Rcr - 1/R-Z); Z = 3kf/4r
where the boundary mobility, M, boundary surface energy, y, actual grain radius,
R, grain radius at V=O, Rcr, and grain growth rate, V, are related as shown.
The term yZ, is the Zener drag term, k is a constant of value 1.5, f is the
volume fraction of dispersoid phase and r is the dispersed particle radius.
This equation predicts that normal grain growth should cease when Rcr = 1/Z and
that this is an inherent property of dispersion hardened materials. Therefore,
abnormal grain growth develops from normal grain growth if two conditions are
-8-
simultaneously fulfilled:
(1) Normal grain growth ceases at an average matrix grain size
below the value of 1/Z, and
(2) There must be at least one grain larger than average to act
as a nucleus for abnormal grain growth.
For TD-NiCr, the value of 1/Z is approximately 1 micron where f = 0.02,O
r = 200A and k = 1.5. As shown in Figure 8 the size of the fine grains produced
prior to the large grain transformation were approximately 1.4 microns. Because
of the approximate nature of the calculation of 1/Z, it is justified to conclude
that recrystallization and normal grain growth has ceased near this value. It
is also evident (see Figures 5 through 8) that there are isolated grains larger
than this average size which do act as nuclei for the large grains transformation.
These observations indicate that the conditions for abnormal grain growth have
been fulfilled in this material state of TD-NiCr.
Further investigation also supports the presence of these processes.
Hardness measurements taken at various times during annealing showed considerable
softening occurring on the formation of the fine grains prior to the large grain
transformation. This indicated the existence of recovery and/or recrystalliza-
tion before the formation of the large grains. Observations were also made
which indicate that the kinetics of the large grain transformation in TD-NiCr
(at 9260 C) are significantly slower than those processes occurring in material
states of TD-NiCr where this transformation was absent, thus showing the sluggish
nature of the large grain transformation. The grain size following annealing
was found to decrease with increasing annealing temperature. All of these
findings are consistent with those of Petrovic for abnormal grain growth in TD-
Nickel.
-9-
Assessment in Terms of Primary Recrystallization
While the as-received TD-NiCr sheet fulfilled the conditions for, and
exhibited the characteristics of, abnormal grain growth during annealing, that
material rolled from the as-received and annealed TD-NiCr sheet (material state
B) behaved quite differently upon annealing. This material exhibited a decrease
in the final annealed grain size with increasing amounts of prior deformation.
Such behavior is predicted by primary recrystallization. For a constant annealing
temperature, the number of recrystallization nuclei increases with deformation
severity as a result of the increased distortion of the lattice and the accom-
panying increase in stored strain energy. The increased number of nuclei in the
material with increased deformation, results in a decrease in the grain size fol-
lowing annealing.
Using microhardness measurements and electron microscopy, it was found
that little observable recovery occurs before the transformation to relatively
perfect grains. Similar findings have been reported for primary recrystallization
in pure nickel(12,l3,. 4) As shown in Figure 10, the average size of the recry-
stallized grains in these material states of TD-NiCr was approximately 4 to 6
microns.
In agreement with the argument presented in the previous section, it
must be concluded that primary recrystallization and normal grain growth occurs
in these material states because the conditions for abnormal grain growth were
not satisfied. The experimental findings of the present study support this
conclusion. The as-received TD-NiCr sheet formed a very fine grain structure
comparable to the value 1/Z of about I micron before transforming to the large
grain size,whereas the material rolled from material state B formed recrystallized
grains of about 4 to 6 microns in size which stabilized at a size greater than i/Z.
-10-
Therefore, the grain size in this material state was limited to that attainable
by recrystallization and normal grain growth processes.
The present study also indicates that the particular annealing response
may depend on the initial grain structure. The as-received material which exhi-
bited abnormal grain growth characteristics upon annealing was initially observed
to have grains between 1/4 to 1 micron in size. The material states which showed
primary recrystallization characteristics had a large grain size prior to rolling
and annealing. Similar results were reported by Petrovic (3,11) for material
states of TD-Nickel produced by cold rolling of bar material. It is possible
that the ultrafine grain structure prior to deformation and/or annealing could
influence the annealing behavior because of the close proximity of deformation
defects to the grain boundaries. These boundaries could act as vacancy sources
and sinks for deformation defects, thereby facilitating large scale recovery
and recrystallization without increasing the grain size to a value greater than
I/Z.
Elevated Temperature Tensile Testing
Previous sections of this study have indicated that the grain size in
TD-NiCr sheet can be significantly, yet predicably, varied by various deformation
and annealing treatments. Because of the anticipated use conditions for this
material, the importance of grain size control lies in the effect of the micro-
structure in determining the elevated temperature load carrying capabilities.
Recent theories(4,5,8) have attempted to explain elevated temperature
deformation of dispersion strengthened alloys in terms of two co-existing mech-
anisms: (1) grain boudary sliding and (2) grain interior deformation. It can
be predicted that, as the grain size increases, the relative contribution of
grain boundary mechanisms will decrease because of the decrease in the grain
-11-
boundary area. These mechanisms become increasingly significant with temperature
(above 0.5 Tm). At temperatures above 0.5 Tm , the grain boundaries are weaker
than the grains themselves. According to these theories, the elevated temperature
strength properties will increase with increasing grain size, whereas the ductil-
ity will decrease. The results of the present study are in accord with these
theories.
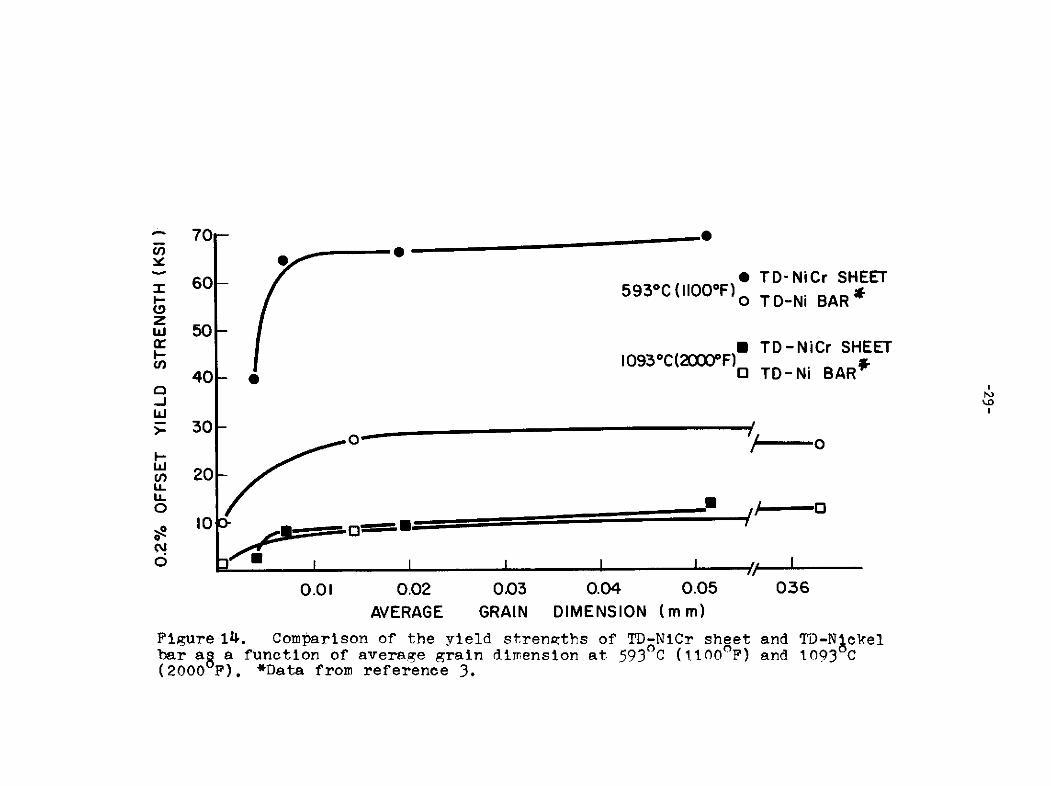
The elevated temperature mechanical properties of TD-NiCr sheet are also
important in relation to those reported for TD-Nickel. The yield strengths of
both are shown in Figure 14 (TD-Nickel data from Petrovic ) as a function of
grain size. The only major difference in the materials is the addition of 20%
chromium in solid solution in TD-NiCr. At 5930 C (0.52 Tm) the higher yield
strength of TD-NiCr may be due to solid solution hardening since the temperature
is still low enough for dislocation glide to be the major deformation mechanism.
As the temperature is raised, and diffusion processes become more significant,
the solution hardening effects of the chromium would be expected to decrease.
Therefore, the flow stress differential separating TD-NiCr and TD-Nickel would
also decrease. Such is the case observed at 10930 C shown in Figure 14.
CONCLUSIONS
(1) Two basic annealing responses of TD-NiCr sheet were observed. They depended
on the initial state and/or on the processing history prior to annealing.
(2) The characteristics of the large grain transformation in TD-NiCr sheet are
siqnificantly different from those of primary recrystallization, and consequently,
cannot be rationalized in terms of these concepts.
(3) The characteristics of this transformation indicate that abnormal grain
growth processes are present.
-12-
(4) In those material states of TD-NiCr which did not exhibit the large grain
transformation upon annealing, primary recrystallization was observed.
(5) The elevated temperature tensile properties of TD-NiCr sheet could be signi-
ficantly altered by controlling the grain size in this material, using cold
working and/or annealing schedules developed during this investigation.
(6) Because of the congruity between the deformation and annealing response
observed in the present study for TD-NiCr and that reported for TD-Nickel, it
appears that other similar dispersion strengthened alloys may behave in much the
same manner. Therefore, the elevated temperature mechanical properties of these
materials may be optimized by methods similar to those developed for TD-NiCr
and TD-Nickel.
-13-
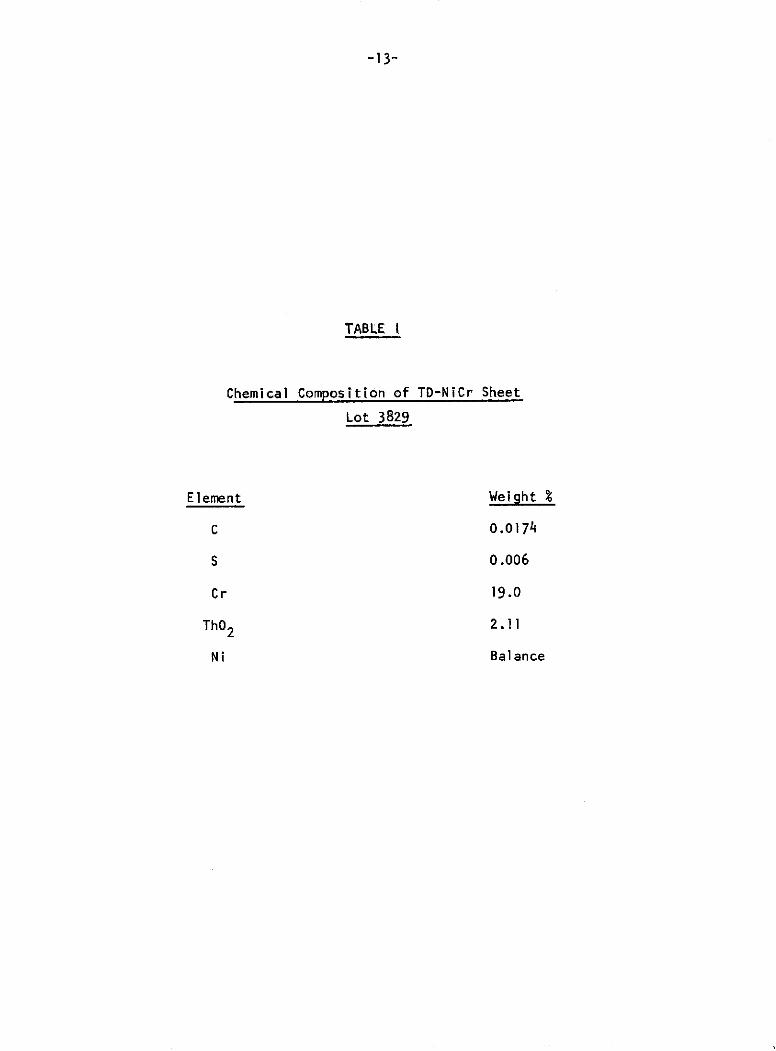
TABLE I
Chemical Composition of TD-NiCr Sheet
Lot 3829
Element Weight %
C 0.01 74
S 0.006
Cr 19.0
Th0 2 2.11
Ni Balance
-14-
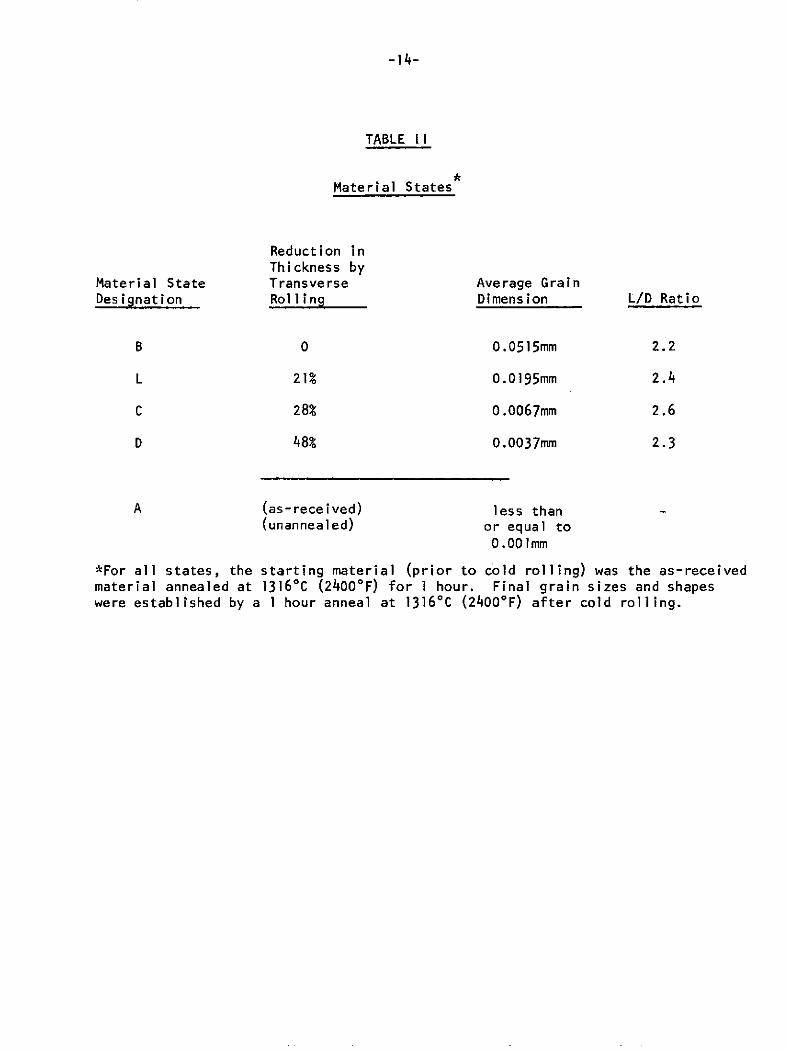
TABLE II
Material States
Reduction inThickness by
Material State Transverse Average GrainDesignation Rolling Dimension L/D Ratio
B 0 0.0515mm 2.2
L 21% 0.0195mm 2.4
C 28% 0.0067mm 2.6
D 48% 0.0037mm 2.3
A (as-received) less than(unannealed) or equal to
0.001mm
*For all states, the starting material (prior to cold rolling) was the as-receivedmaterial annealed at 1316 0C (24000 F) for I hour. Final grain sizes and shapeswere established by a 1 hour anneal at 1316 0C (24000 F) after cold rolling.
-15-
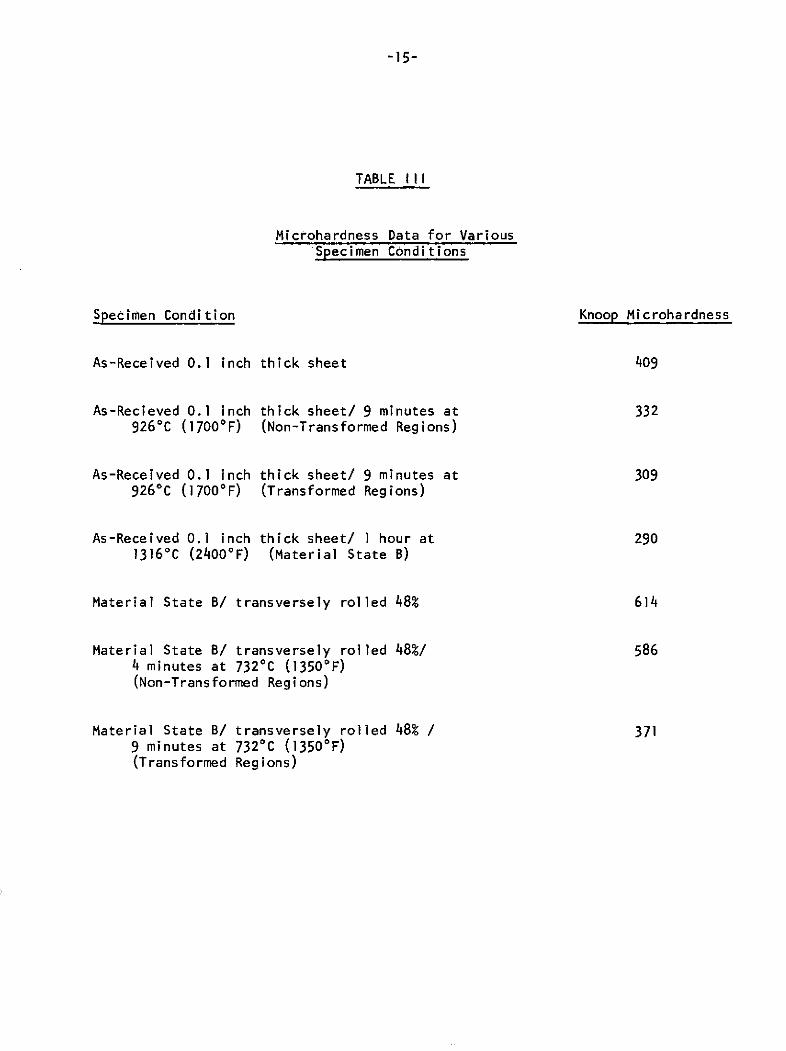
TABLE III
Microhardness Data for VariousSpecimen Conditions
Specimen Condition Knoop Microhardness
As-Received 0.1 inch thick sheet 409
As-Recieved 0.1 inch thick sheet/ 9 minutes at 332926 0 C (1700 0 F) (Non-Transformed Regions)
As-Received 0.1 inch thick sheet/ 9 minutes at 3099260 C (17000 F) (Transformed Regions)
As-Received 0.1 inch thick sheet/ 1 hour at 2901316 0C (24000 F) (Material State B)
Material State B/ transversely rolled 48% 614
Material State B/ transversely rolled 48%/ 5864 minutes at 732 0C (1350 0 F)(Non-Transformed Regions)
Material State B/ transversely rolled 48% / 3719 minutes at 7320 C (1350 0F)(Transformed Regions)
5" 3" + 0.002- RADIUS DIA. + 0.0028 8 0.000
'0.001
7i
+-002 I
F"0 2
0.001Se -
8r .e
FiPure 1. Sheet Specimen Geometry.
-17-
0.05
EE.- 0.04
zo A LONGITUDINAL ROLLING
wW 0.03 * TRANSVERSE ROLLING
0
z
002w
0.01
0.2 0.4 0.6
TRUE ROLLING STRAINE= In (To/T)
Figure 2. Effects of deformation severity on theaverage grain dimension for longitudinal andtransverse rolling of the as-received materialfollowed by annealing at 1316 0C (24000 F) for 1 hour.
E 0.05 Tz0i, 0.04
W A LONGITUDINAL ROLLING
z 0.03 - 0 TRANSVERSE ROLLING
0C 00
0.02
I I i I I I0.20 0.40 0.60 0.80 1.00 1.20
TRUE ROLLING STRAIN
( E= In (To /T )Figure 3. Effects of deformation severity on the average grain dimension for
the rolling of material state B followed by annealing at 13160C (2400F), 1 hr.
-19-
0.09- U -AS-RECEIVED 0.1 INCHSHEET AFTER ANNEAL
*-MATERIAL STATE BFOLLOWING 48% TRANSROLLING AND ANNEAL
0 .0 8
0
z
0.06-z
w
.
0.01
1400 1600 1800 2000 2200 2400
ANNEALING TEMPERATURE (OF)
Figure 4. Effect of annealing temperature on theaverage grain dimension for annealing of a) the as-received material, b) material state B after 48% trans.rolling.
-20-
Figure 5 Microstructre of ag-received materialafter annealing at 926 C (1700 F) for 4 minutes.Rolling plane - R.D. horizontal. (100X)
-21-
Figure 6 . Microstruct re of ag-received materialafter annealing at 926 C (1700 F) for 9 minutes.Rolling plane - R.D. horizontal. (100X)

-22-
Figure 7. NMicrostruct re of ag-received materialafter annealing at 926 C (1700 F) for 2 hours.Rolling plane - R.D. horizontal. (100X)
-23-
a
bFigure 8. MicrostructUre of ag-received materialafter annealing at 926 C (1700 F) for a) 1 minuteand b) 9 minutes. Rolling plane - R.D. horizontal(E 001)
-24-
Figure 9. Yicrostructure of material stateoB after48% transverse rolling and annealing at 7320C (1350°F)for 4 minutes. Rolling plane - R.D. horizontal (300X).
-25-
Figure 10. icrostructure of material state B after48% transverse rolling and annealing at 7320 C (13500 F)for 9 minutes. Rolling plane - R.D. horizontal (300X).
-26-
AVERAGE GRAIN DIMENSIONO B 0.0515 mmA L 0.0195 mmO C 0.0067 mmD D 0.0037 mm
60
I-
usZ40
40
z20 0
1200 1400 $600 1800 2000TESTING TEMPERATURE
(OF)
60
z
I o
wd 40I. "(b)
0
1200 1400 1600 1800 2000TESTING TEMPERATURE
(OF)
Figure 11. Effect of testing temperature on the elevatedtemperature a) tensile strength and b) yield strengthfor various material states of TD-NiCr.
-27-
80 I100*F
(a)z40
15000F
0.01 0.02 0.03 0.04 0.05AVERAGE GRAIN DIMENSION (mm)
0 0(60 / "'0
60
I-
IS00F (b)
w -0 0
a 20 0 2000F
O o000F
0.01 0.02 0.03 004 0.05AVERAGE GRAIN DIMENSION (m m)
Figure 12. Effect of average grain dimension on theelevated temperature a) tensile strength and b) yieldstrength for TD-NICr at various temperatures.
-28-
AVERAGE GRAIN DIMENSION
0 B 0.0515 mm
16 - A L 0.0195 mm
o X C 0.0067 m m
S14 - N D 0.0037 mm
-J-w 12
w 10 -
w
68
-J
S4_I2- X X
1100 1200 1300 1400 1500 1600 1700 1800 1900 2000
TESTING TEMPERATURE (OF)
Figure 13. Effect of testing temperature on theductility of various material states of TD-NICr.
70- *
S60 593C(100F)O T D-Ni BARzw 50x- 0 TD-NiCr SHEET
1093oC(20000F)Cn40 0 TD-Ni BARoJ
5: 30-
I 20Li
U-U
10 0__-
d :3 • I I I I I I0.01 0.02 0.03 0.04 0.05 036
AVERAGE GRAIN DIMENSION (m m)
Figure 14. Comparison of the yield strengths of TD-NiCr shset and TD-Nlckelbar ag a function of average grain dimension at 5930C (IOO F) and 1093 C(2000 F). *Data from reference 3.
-30-
APPENDIX
The results presented in this section were obtained during the course
of the past year by (unsupported) student projects using the basic materials
of this study. They are not necessary for support of the conclusions made in
the preceding section. However, this data has been included for completeness
because it does provide added information regarding the recrystallization and
grain growth processes in TD-NICr sheet materials.
This presentation has been separated into two parts, representing two
different starting states of TD-NiCr sheet which were examined: (1) 0.275 inch
thick TD-NiCr sheet (as-received condition), and (2) 0.1 inch thick TD-NiCr
sheet (as-received condition plus annealing at 1500 0 F (816*C) for 90 hours).
This latter material state will be designated B1500 in further discussions.
TD-NiCr 0.275 Inch Thick Sheet
A limited investigation of the deformation and annealing response of
TD-NiCr 0.275 inch thick sheet was conducted. A portion of this work was in
fulfillment of the Senior Project requirement (Spring 1973) of R.R.Hornack,
an undergraduate in the Department. The purpose of this work was one of exam-
ining the effects of cold rolling severity and annealing temperature on the
final grain size and shape in this material state of TD-NiCr sheet.
The as-received, 0.275 inch thick TD-NiCr sheet was separated into two
lots, one annealed for 2 hours at 1500 0 F and the other annealed for 2 hours at
2000°F. Both lots were rolled longitudinally with respect to the original rolling
direction. Rolling reductions of 20, 40 and 60% were made in steps of approxi-
mately 10% per pass. Following cold rolling, both lots of material were annealed
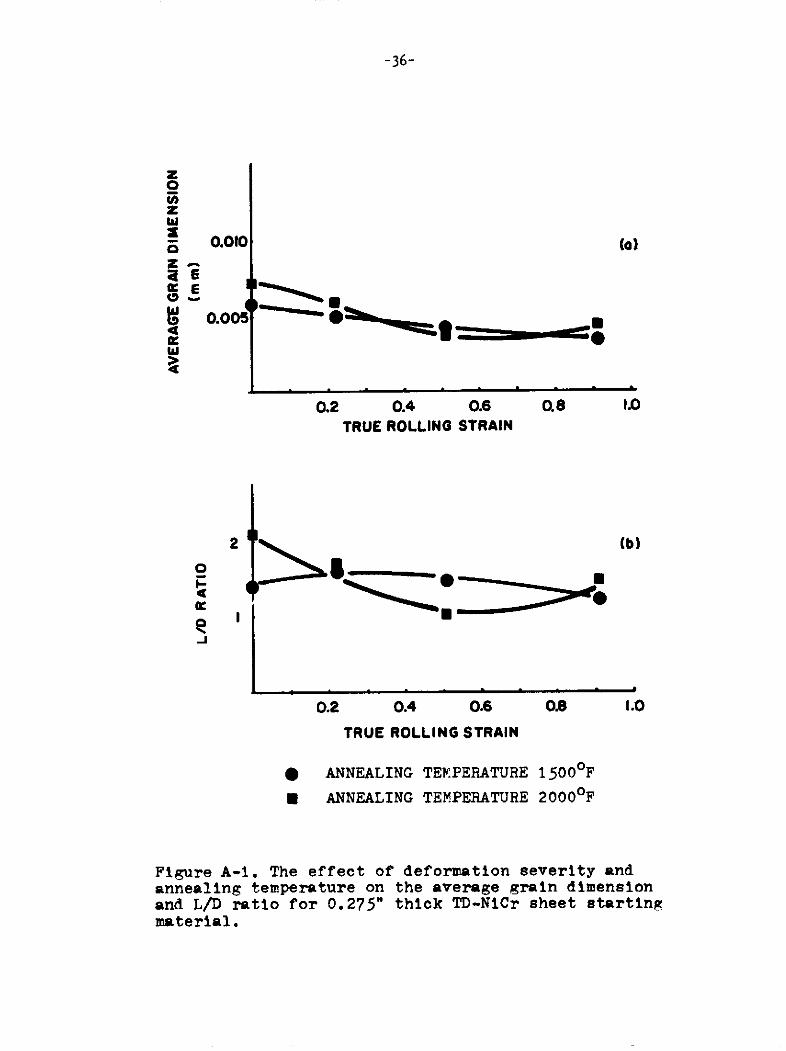
in the same manner as before. Figure A-1 shows the average grain dimension and
-31-
grain aspect (L/D ratio) as a function of rolling severity. As indicated by
Figure A-la, the annealed grain size of this material decreases only slightly
with increasing amounts of prior cold rolling. Initially, the TD-NiCr sheet
had an annealed grain size of between 0.005mm and 0.007mm (5-7 microns); this
decreased to only 3 to 4 microns after 60% reduction and annealing. In Figure
A-lb it can be seen that L/D. ratio varies only between 1 and 2. It is evident
from these plots that both grain size and L/D ratio following cold rolling and
annealing are essentially insensitive to annealing temperature. Similar results
were obtained for the combination of transverse rolling and annealing treatments.
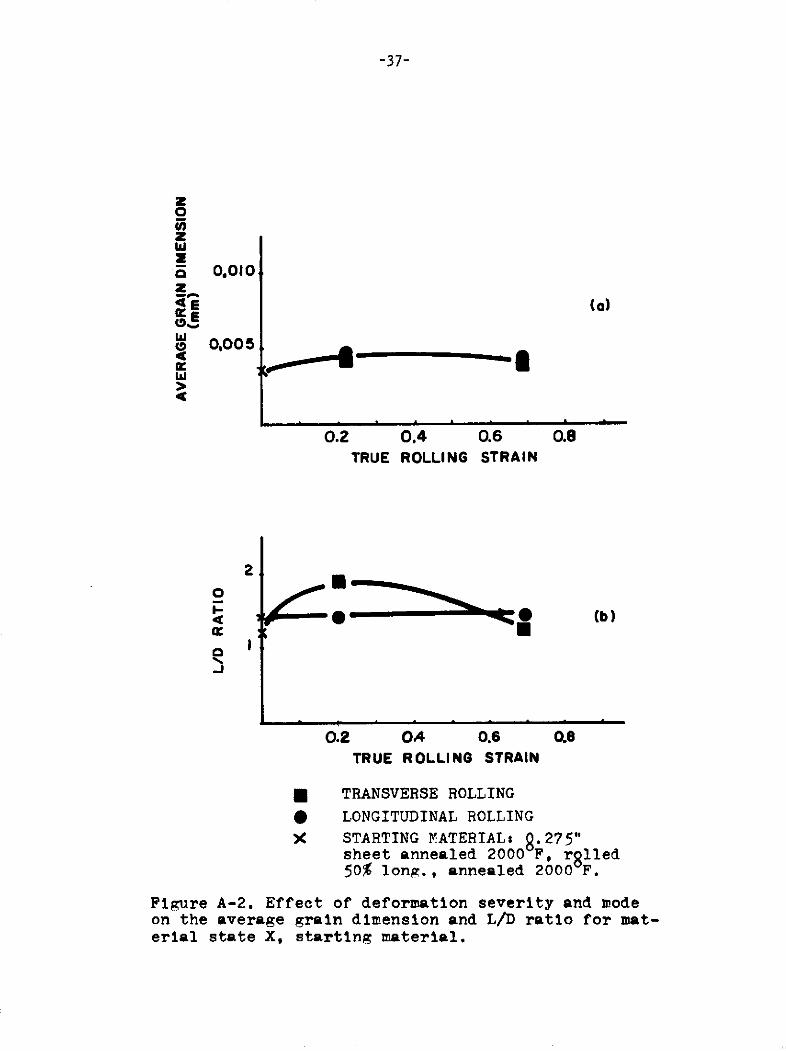
As a corollary to this study, some of the as-received 0.275 inch thick
sheet was annealed at 20000 F for 2 hours, then reduced 50% by cold rolling in
the longitudinal direction, and then re-annealed at 20000 F (material state X).
Specimens were then rolled 20 and 50% in the longitudinal and transverse direc-
tions (in separate rolling operations). A final annealing treatment of 2 hours
at 2000'F was used. Figure A-2 indicates the effect of such material processing
on the final grain size and L/D ratio. As shown for the previous material states
of the TD-NiCr sheet, the processing-related variables of rolling and annealing
had little effect on the grain structure in this material.
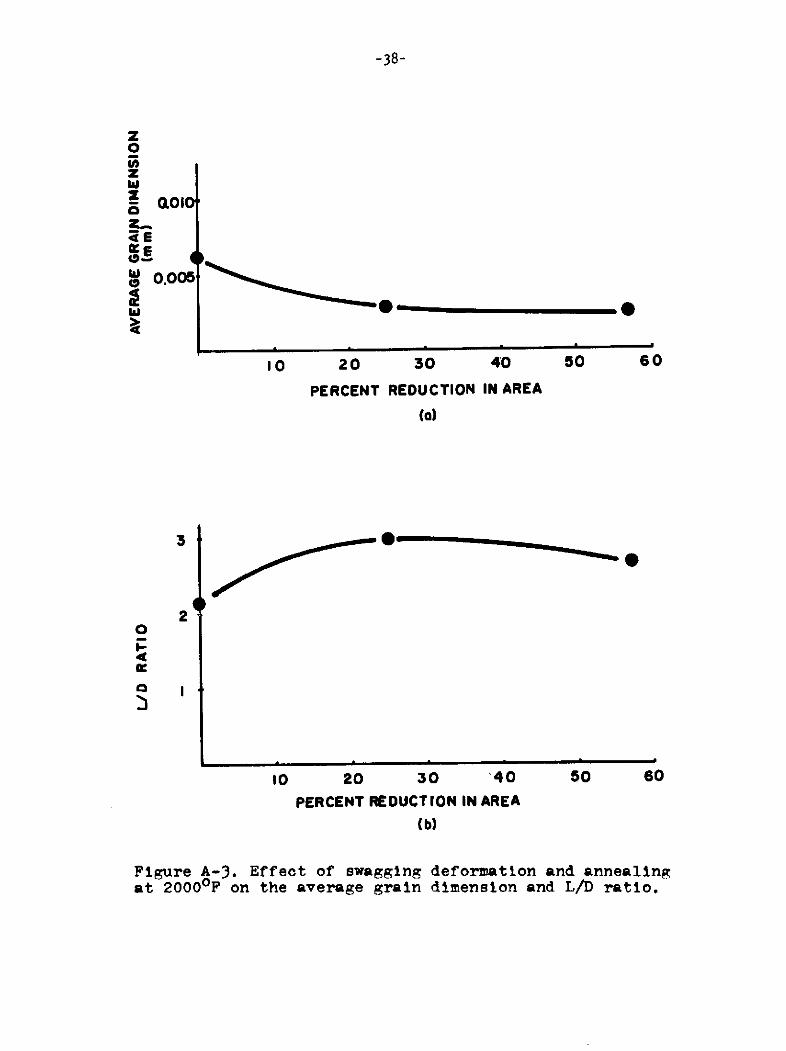
The effect of swaging deformation prior to annealing at 20000 F was also
examined using the 0.275 inch thick TD-NiCr sheet (annealed at 20000 F for I hour)
as the starting material. Swaging rods, 0.25 inch in diameter, obtained from
this material, were oriented such that the rod axis was parallel to the original
sheet rolling direction. Swaging deformations of 25 and 57% reduction in area
were performed in steps of approximately 15% per pass. The grain size and L/D
ratio for these materials following annealing is shown in Figure A-3. The
average grain dimension decreased from the initial value of 6.3 microns with
-32-
increasing amounts of prior deformation to 2.4 microns at 57% reduction in area.
The L/D ratio increased with prior deformation severity to a value of 3 at 25%
reduction in area, then decreased slightly to a value of 2.7 at 57% reduction
in area.
B1500
It was indicated in the first section of this report that TD-NiCr 0.1 inch
thick sheet could be transformed to a large grain structure by the annealing of
the as-received material without further processing. An investigation of the
effect of further thermo-mechanical processing on this large grain size material
was conducted. A portion of this work constituted the Senior Project of
C. Oldfather, an undergraduate in the Department.
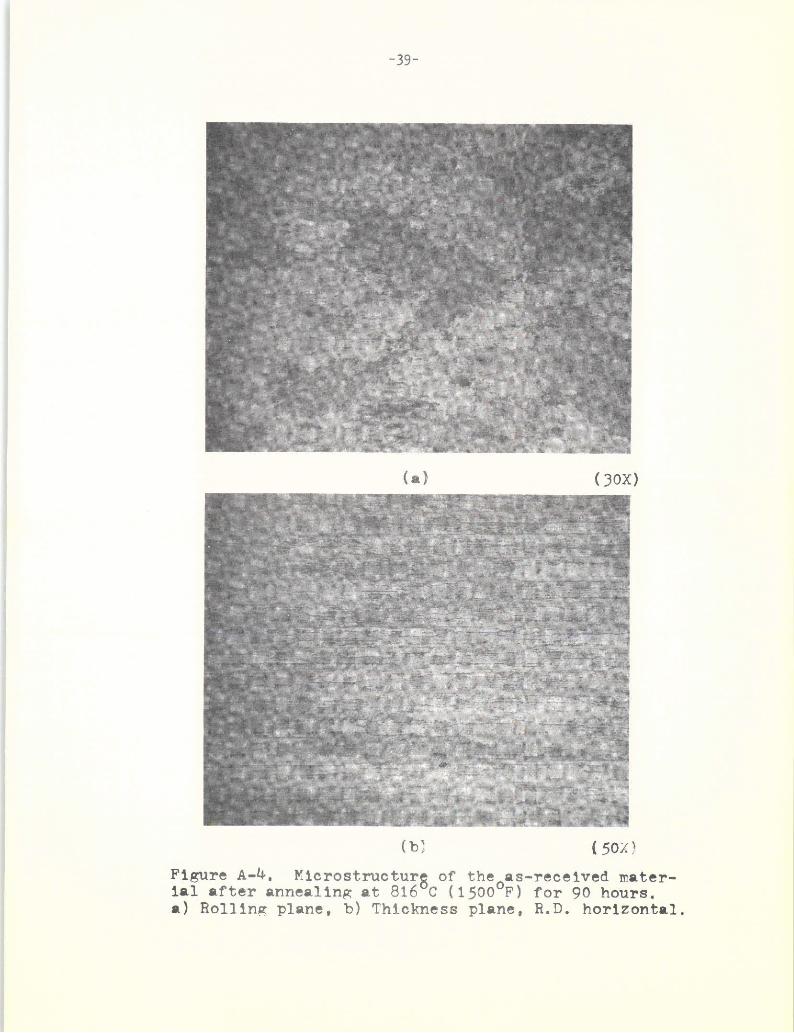
The starting material for this examination was the as-received 0.1 inch
thick TD-NiCr sheet after annealing at 1500 0 F for 90 hours (B150 0 ). The average
grain size of this material was 0.23mm with an L/D ratio of 6. Elevated temper-
ature tensile tests conducted on this material revealed the following properties
at 20000 F (1093 0 C): yield strength 14.4 ksi; tensile strength 14.6 ksi; ductility
1.8% elongation. Representative micrographs are shown in Figure A-4. The B1500
was cold rolled longitudinally with respect to the original rolling direction
to reductions of 10, 28 and 50%. Rolling was performed in step reductions of
approximately 5%. Following rolling, specimens of each reduction were annealed
at 1500*F for 115 hours and also at 20000 F for 1 hour.
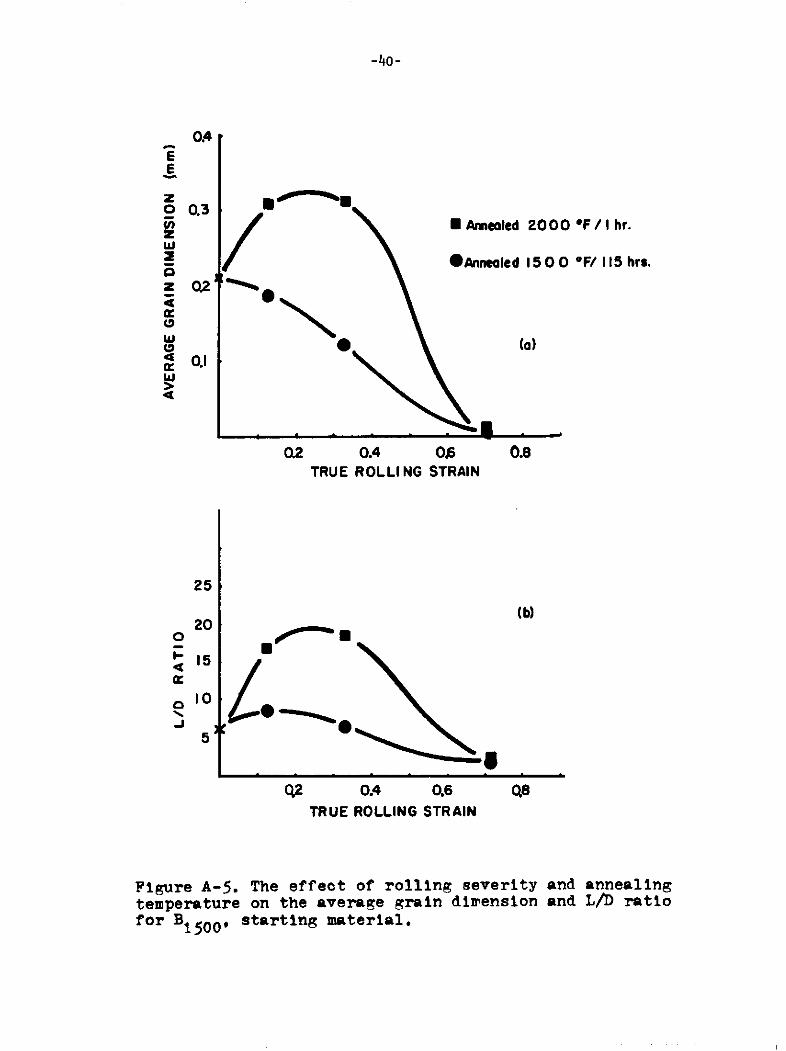
Figure A-5 shows the effect of rolling severity and annealing temperature
on the grain size and L/D ratio following annealing. The specimens annealed at
1500"F were observed to have a steadily decreasing grain size with increasing
Test conditions the same as those indicated on page 4 of previous section.
-33-
amounts of prior deformation. The L/D ratio increased slightly at moderate
deformations to a value of 8.6 before decreasing to 2.2 at 50% reduction. The
material annealed at 20000 F was shown to increase in both grain size and L/D
ratio for moderate deformations (10-30%); this then decreased with increasing
amounts of prior deformation. The maximum values of grain size and L/D ratio
observed were those for 28% reduction preceding annealing at 2000 0 F. The average
grain dimension and L/D ratio for this material state were 0.31mm and 18.6,
respectively.
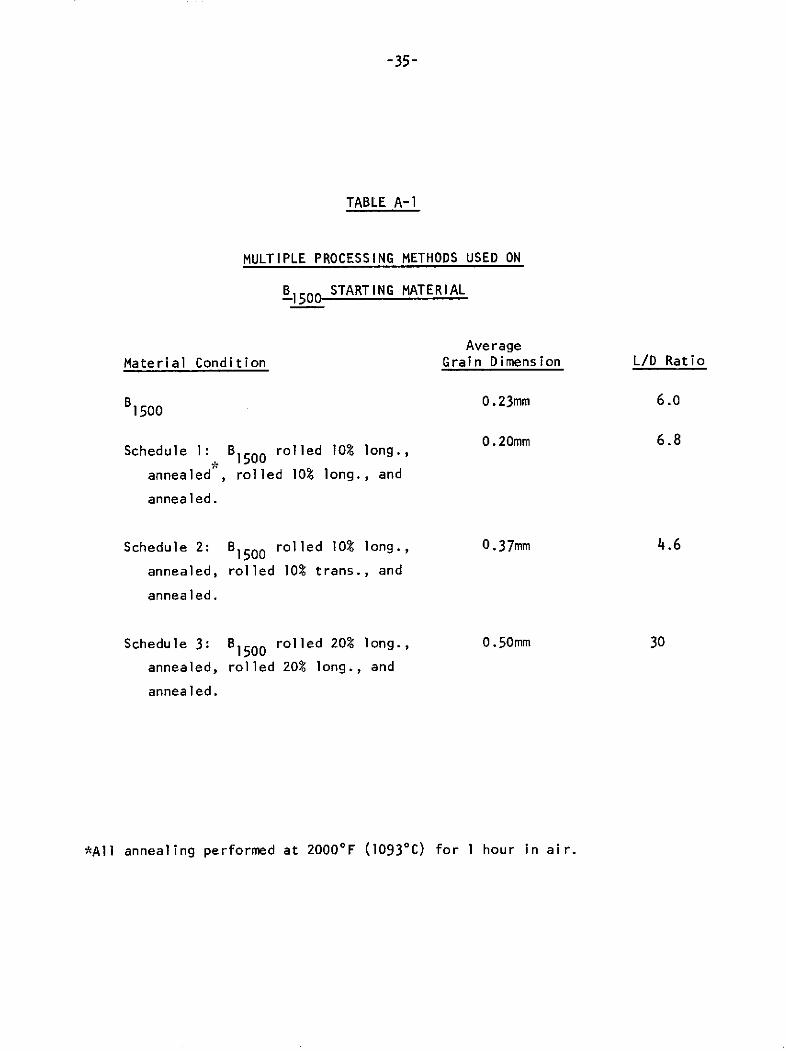
Since the combination of moderate rolling deformations (10-30% rolling
reduction performed longitudinally with respect to the original rolling direction)
and annealing at 2000 0 F for 1 hour produced an increase in the grain size and
L/D ratio, it was felt that repeated combinations of the procedures described
above would further increase the value of these properties. Three different
processing methods were investigated; (1) the starting material, B1500, was
rolled 10% longitudinally, annealed (at 2000'F), re-rolled 10% in the same
direction, (2) B1500 was rolled 10% longitudinally, annealed, rolled 10%
in the transverse direction and annealed, and (3) B1500 was rolled 20% longi-
tudinally, annealed, re-rolled 20% in the same direction and annealed. Table
A-i represents a summary of this investigation.
It was observed that repeated combinations of 10% longitudinal rolling
reductions and annealing produced little change in the grain structure of the
TD-NiCr sheet (B1500 ). Alternate longitudinal and transverse rolling reductions
of 10% followed by annealing treatments had the effect of increasing the grain
size while decreasing the L/D ratio. However, the most effective method found
to produce large, elongated grain structures in TD-NiCr sheet was the combina-
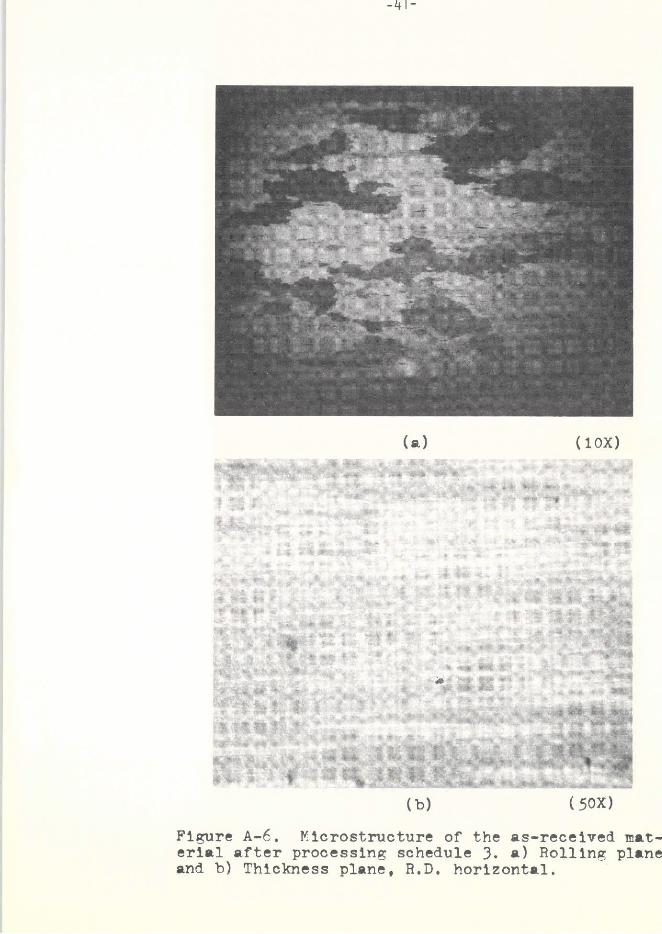
tion of 20% longitudinal rolling reductions separated by annealing treatments.

-34-
The method, as described, produced large grain structures of TD-NiCr (average
grain dimension 0.50mm) with an L/D ratio of 30. Representative micrographs
of this material state are shown in Figure A-6.
-35-
TABLE A-1
MULTIPLE PROCESSING METHODS USED ON
B STARTING MATERIAL-1500
AverageMaterial Condition Grain Dimension L/D Ratio
B1500 0.23mm 6.0
0.20mm 6.8Schedule 1: B rolled 10% long.,
S1500annealed , rolled 10% long., and
annealed.
Schedule 2: Bl500 rolled 10% long., 0.37mm 4.6
annealed, rolled 10% trans., and
annealed.
Schedule 3: B1500 rolled 20% long., 0.50mm 30
annealed, rolled 20% long., and
annealed.
*All annealing performed at 20000 F (10930 C) for I hour in air.
-36-
z0
z
-IS0.010 (b)
ZI
0.2 0.4 0.6 0.8 1.0
TRUE ROLLING STRAIN
* ANNEALING TEMPERATURE 15000F
N ANNEALING TEMPERATURE 20000F
Figure A-1. The effect of deformation severity andannealing temperature on the average grain dimensionand L/D ratio for 0.275" thick TD-NICr sheet startingmaterial.
-37-
oz
TE (a)ME
3 0.005
w
0.2 0.4 0.6 0.8TRUE ROLLING STRAIN
2
S0 (b)
-j
0.2 OA 0.6 0.8TRUE ROLLING STRAIN
TRANSVERSE ROLLING
) LONGITUDINAL ROLLING
X STARTING MATERIALs 8.275"sheet annealed 2000 F, r8 lled50% long., annealed 2000 F.
Figure A-2. Effect of deformation severity and modeon the average grain dimension and L/D ratio for mat-erial state X, starting material.
-38-
Z
2
z
0.00
10 20 30 40 50 60
PERCENT REDUCTION IN AREA
(a)
3
20
o
10 20 30 40 50 60
PERCENT REDUCTION IN AREA
(b)
Figure A-3. Effect of swagging deformation and annealingat 2000oF on the average grain dimension and L/D ratio.
-39-
(a) (30x)
(b' (501)
Figure A-4. Ficrostructurs of the as-received mater-ial after annealing at 816 C (15000 F) for 90 hours.a) Rolling plane, b) Thickness plane, R.D. horizontal.
-40-
0.4E
o 0.3 m m/ Amealed 2000 F/ I hr.
SAnnealed 15 0 0 F/ IIS hrs.
z Q2 ~%
M0.I
0.2 0.4 0.6 0.8TRUE ROLLING STRAIN
25
(b)20
10
5
2 0.4 0.6
TRUE ROLLING STRAIN
Figure A-5. The effect of rolling severity and annealing
temperature on the average grain dirension and L/D ratiofor B1 5 0 0 , starting material.
(a) (10ox)
(b) (50X)
Figure A-6. Microstructure of the as-received mat-erial after processing schedule 3. a) Rolling planeand b) Thickness plane, R.D. horizontal.
-42-
REFERENCES
1. D. Webster, Trans. AIME, 1968, vol. 242, p. 640.
2. J. J. Petrovic and L. J. Ebert, Met. Trans., 1972, vol. 3, p. 1123.
3. J. J. Petrovic and L. J. Ebert, Met. Trans., 1972, vol. 3, p. 1131.
4. J. J. Petrovic and L. J. Ebert, Met. Trans., 1973, vol. 4, p. 1301
5. J. J. Petrovic and L. J. Ebert, Met. Trans., 1973, vol. 4, p. 1309.
6. B. A. Wilcox and A. H. Clauer, Trans. AIME, 1965, vol. 233, p. 253.
7. B. A. Wilcox and A. H. Clauer, Met. Scl. J., 1967, vol. 1, p. 86.
8. B. A. Wilcox and A. H. Clauer, Acta Met., 1972, vol. 20, p. 743.
9. R. D. Kane, M. S. Thesis, Division of Metallurgy and Materials Science,Case Western Reserve University, Cleveland, Ohio, January 1973.
10. M. Hillert, Acta Met., 1965, vol. 13, p. 227.
11. J. J. Petrovic, M. S. Thesis, Division of Metallurgy and Materials Science,Case Western Reserve University, Cleveland, Ohio, January 1970.
12. W.Bollman, J. Inst. Metals, 1959, vol. 87, p. 439.
13. K. Detert and G. Dressler, Acta Met., 1965, vol. 13, p. 845.
14. L. C. Michels and B. G. Ricketts, Trans. AIME, 1967, vol. 239, p. 1841.
![ANNEALING STUDIES OF PURE AND ALLOYED TANTALUM … · The annealing response of forged tantalum, reported by O™Brien et al. [1], demonstrated that significant differences in grain](https://img.pdfslide.us/doc/110x75/5c88b2fc09d3f2ff638beffc/annealing-studies-of-pure-and-alloyed-tantalum-the-annealing-response-of-forged.jpg)