Embed Size (px)
Citation preview

D E F O R E S TAT I O N I N S O U T H - W E S T G H A N A ( 2 0 0 1 - 2 0 1 5 )
direct drivers , the size of clearings , and emerging hotspots
Anne-Juul Welsink
Minor thesis submitted in partial fulfilment of the requirementsfor the degree of Master of Science
31-08-2020

Deforestation in South-West Ghana (2001-2015), Direct Drivers, the Sizeof Clearings, and Emerging Hotspots
Anne-Juul WelsinkRegistration number: 96 03 24 938 040
supervisors:Dr. V. de SyDr. N.E. Tsendbazar
Minor thesis submitted in partial fulfilment of the requirementsfor the degree of Master of Science, Wageningen University and Re-search, Wageningen, 31-08-2020
Thesis code number: GRS-80424
Thesis Report: GIRS-2020-45
Wageningen University and Research CentreLaboratory of Geo-Information Science and Remote Sensing
A B S T R A C T
Ghana is among the countries with the highest net deforestation ratesworldwide. Open source high resolution satellite imagery is used forforest monitoring to support compliance to REDD+. However, quantita-tive national-level information on the drivers of deforestation driversremains generally incomplete or largely absent. This thesis aims toidentify important direct drivers of deforestation and their character-istics in South-West Ghana between 2001 and 2015. The follow-uplandcover from 2017/2018 serves as a proxy to identify direct drivers.Cocoa was found to be responsible for most deforestation, followedby orchards, low vegetation, rubber and palm. A peak in deforesta-tion in the year 2014 is potentially related to the fact that several me-dia reported an expected cocoa shortage that year. Direct drivers wererelated to the size of deforested patches to provide insight in the scaleof deforestation associated with different drivers. No association wasfound between the drivers of forest loss and the scale of clearings,which implies that patch size cannot be used to track drivers. Patchesbelow 0.5 ha were responsible for the largest area of deforestation.This provides an indication that smallholder and/or subsistence agri-culture are important causes of forest loss in the study area. Newhotspots of deforestation in 2015 are identified in order to provideinsight as to which emerging drivers are of growing importance. Thepresence of palm and water in new hotspot areas was particularlyhigh compared to their overall importance. This provides guidanceto future conservation efforts.
iii

A C K N O W L E D G E M E N T S
This research would not have been possible without the support andconstructive criticism of my supervisors Niki de Sy and NandikaTsendbazar. They have guided me with patience through the analyt-ical and writing processes, and were present for me in spite of thecurrent reality of physical distance.
I owe an acknowledgement to Eric Rahn from CocoaSoils and theAlliance of Biodiversity International and CIAT for his ideas and in-spiration for this project after I was faced with the urgency for adjust-ment in these turbulent times. I would like to thank CIAT’s ThibaudVantalon and Louis Reymondin for thinking with me on the analysis,and for urging me to conduct it in R.
At home, Monne, my family, and friends have been a constant sourceof support, enthusiasm, and patience. I would not do this withoutyou.
The cover art of this thesis was made by Gigi van Grevenbroek, whosework on socially and environmentally relevant themes can be foundvia gigivangrevenbroek.com.
iv

C O N T E N T S
1 introduction 1
1.1 Research objectives . . . . . . . . . . . . . . . . . . . . . 3
2 data and methods 4
2.1 Study area . . . . . . . . . . . . . . . . . . . . . . . . . . 4
2.2 Data . . . . . . . . . . . . . . . . . . . . . . . . . . . . . . 5
2.2.1 Deforested areas and forest mask . . . . . . . . 5
2.2.2 Follow-up landcover . . . . . . . . . . . . . . . . 6
2.3 Methods . . . . . . . . . . . . . . . . . . . . . . . . . . . 7
2.3.1 Direct drivers between 2001 and 2015 . . . . . . 8
2.3.2 Size of forest clearings in relation to the defor-estation driver . . . . . . . . . . . . . . . . . . . . 8
2.3.3 Emerging hotspot analysis . . . . . . . . . . . . 9
3 results 11
3.1 Direct drivers between 2001 and 2015 . . . . . . . . . . 11
3.2 Size of forest clearings in relation to the deforestationdriver . . . . . . . . . . . . . . . . . . . . . . . . . . . . . 12
3.3 Emerging hotspot analysis . . . . . . . . . . . . . . . . . 14
4 discussion 16
4.1 Direct drivers between 2001 and 2015 . . . . . . . . . . 16
4.2 Size of forest clearings in relation to the deforestationdriver . . . . . . . . . . . . . . . . . . . . . . . . . . . . . 18
4.3 Emerging hotspot analysis . . . . . . . . . . . . . . . . . 19
5 conclusion 20
bibliography 22
v

L I S T O F F I G U R E S
Figure 1 Deforestation in the study area between 2001
and 2015. . . . . . . . . . . . . . . . . . . . . . . 4
Figure 2 Landcover map used to identify drivers. . . . . 6
Figure 3 Workflow for the first research objective. . . . . 8
Figure 4 Workflow for the second research objective. . . 8
Figure 5 Workflow for the third research objective. . . . 9
Figure 6 Deforested area (ha) attributed to direct driversof deforestation between 2001 and 2015. . . . . 11
Figure 7 Deforested area (ha) attributed to direct driversof deforestation between 2001 and 2015 per year. 12
Figure 8 Deforested area per patch size interval. . . . . 12
Figure 9 Area proportion of deforestation by patch sizeper driver. . . . . . . . . . . . . . . . . . . . . . 13
Figure 10 New hotspot areas in 2015. . . . . . . . . . . . 14
Figure 11 Area proportion of different drivers in all de-forested areas and new hotspots. . . . . . . . . 15
vi

L I S T O F TA B L E S
Table 1 Map accuracy of the Random Forest landcoverclassification. . . . . . . . . . . . . . . . . . . . . 7
vii

A C R O N Y M S
UNFCCC The United Nations Framework Convention on ClimateChange
REDD+ Reducing Emissions from Deforestation and Degradation,conserving and enhancing forest carbon stocks, andsustainably managing forests
CIAT The Alliance of Biodiversity International and the InternationalCenter for Tropical Agriculture
ICCO International Cocoa OrganizationOSM OpenStreetMap
viii

1I N T R O D U C T I O N
Between 2001 and 2019, a total area of 386 million ha was deforestedworldwide, resulting in a 9.7 percent decrease in tree cover [1]. De-forestation and forest degradation have severe adverse ecological andsocio-economic effects [2]. Among the ecological effects is the reduc-tion of natural habitat, with potential biodiversity loss as a result [3],[4]. In addition to that, loss of forest contributes to climate change bylimiting the uptake of greenhouse gas, and fostering its emission [5],[6]. Socio-economic effects include loss of medicinal plants, shortageof food and water, low agricultural productivity, and unemployment[2].
Ghana is among the countries with the highest net deforestation ratesworldwide [7]. At the start of the 1900s, around one-third of Ghanawas covered by tropical forest, of which an estimated 78 percent haddisappeared by 1989 [8], [9]. More recently, an annual deforestationrate of around 3 percent has been recorded [10]. Agricultural cropssuch as cocoa, palm, and rubber are important drivers of deforesta-tion in the area [11]–[14]. The industries behind these crops are in-creasingly concerned about brand equity. The international commu-nity is concerned about the loss of globally important biodiversityand ecosystem services, including issues such as threatened species,carbon sequestration and climate regulation. Ghana is one of over30 countries that has committed to the implementation of policiesfor Reducing Emissions from Deforestation and Degradation, con-serving and enhancing forest carbon stocks, and sustainably manag-ing forests (REDD+) [15]. The REDD+ mechanism was initiated by TheUnited Nations Framework Convention on Climate Change (UNFCCC)and offers financial incentives for developing countries to reduceemissions from deforestation and forest degradation.
Open source high resolution satellite imagery is used to supportcompliance to REDD+ through forest monitoring. At the global scale,Hansen et al. have published annual quantifications of global forestloss and gain since 2001 based on Landsat imagery [16]. In addition,national governments are developing their own forest monitoring sys-tems [17]. A study on the status of forest monitoring in tropical coun-tries has quantified Ghana’s capacity to use remote sensing data andmeasure forest area change as ‘good’ [17]. The availability of glob-ally consistent and locally relevant remote sensing imagery allows for
1

introduction 2
large scale identification and quantification of forest loss in a trans-parent and cost-effective manner [18].
However, quantification of forest loss is not sufficient to understandthe drivers of deforestation. Drivers can be either direct (proximate)or indirect (underlying). Proximate drivers are human activities oractions that originate from intended land use and directly result inforest loss [19]. Underlying drivers are social processes and contextsthat have an indirect influence on deforestation, e.g. population dy-namics or agricultural policies [19]. Insight regarding the drivers ofdeforestation can complement forest loss monitoring by allowing formore direct targeting of the roots of the problem.
Earlier research on the drivers of tropical deforestation has been doneglobally [20], [21], as well as specifically in the tropics [19], [22]. How-ever, quantitative national-level information on deforestation driversremains generally incomplete or largely absent; for many developingcountries it is unclear how much deforestation is caused by specificdrivers [23]. Quantitative analysis of the drivers of deforestation isfundamental to the development of policies and measures to reducedeforestation [23]. It allows for direct targeting of the supply chains ofdifferent crops, thereby helping industries and countries to minimizeforest loss. In addition, it can support the development of landscapelevel approaches, where different supply chains join efforts to haltdeforestation and improve ecosystem services in a given landscape.
Remote sensing data is a useful tool for large scale driver analysis.Use of satellite imagery allows for accurate quantification of the im-portance of different drivers on a national level. At the same time, thehigh spatial resolution of satellites such as Landsat and Sentinel maketheir products suitable for detailed regional or local analyses. Further-more, high-resolution imagery allows for analysis of driver charac-teristics, such as the typical size of deforested areas. This providesan indication as to whether deforestation is for commercial or sub-sistence agricultural purposes [22]. Insight in the scale of forest lossassociated with different drivers could foster identification of driversin the future. Furthermore, use of satellite imagery with statisticalmodels can provide insight in spatio-temporal trends of deforesta-tion and its drivers. These trends could not be easily identified on alarge scale through fieldwork or by visual inspection of the data [24].The identification of new clusters of forest loss can provide guidanceas to which areas and drivers require further attention for analysisor conservation efforts [24], [25]. This information is of use for con-servationists, national governments, as well as agricultural industrieswhich are looking to conserve the forest as well as their image.

1.1 research objectives 3
1.1 research objectives
This thesis aims to identify the most important direct drivers of defor-estation and their characteristics in South-West Ghana between 2001
and 2015. The follow-up landcover from 2017/2018 serves as a proxyto identify direct drivers. Thus, deforestation of an area between 2001
and 2015 is attributed to the landcover that was present in the areain 2017/2018. It is important to note that follow-up landcover caneither be the primary motive for forest clearance, or replace forestpreviously degraded by wood extraction or fire [2]. This distinctionis beyond the scope of this research. Therefore, the signification of’follow-up landcover’ and ’driver’ is interchangeable in this thesis.
The rest of this thesis addressed the following research objectives:
1. Identify direct drivers of deforestation in South-West Ghana be-tween 2001 and 2015 based on a 10 m resolution landcover clas-sification.
2. Analyse the size of forest clearings in relation to the directdrivers addressed in objective 1 in order to provide insight intothe scale of deforestation.
3. Analyse the drivers found in new hotspots of deforestation in2015 in order to provide insight as to which emerging driverswere of growing in importance.
2D ATA A N D M E T H O D S
This chapter first introduces the study area, followed by the data andmethods.
2.1 study area
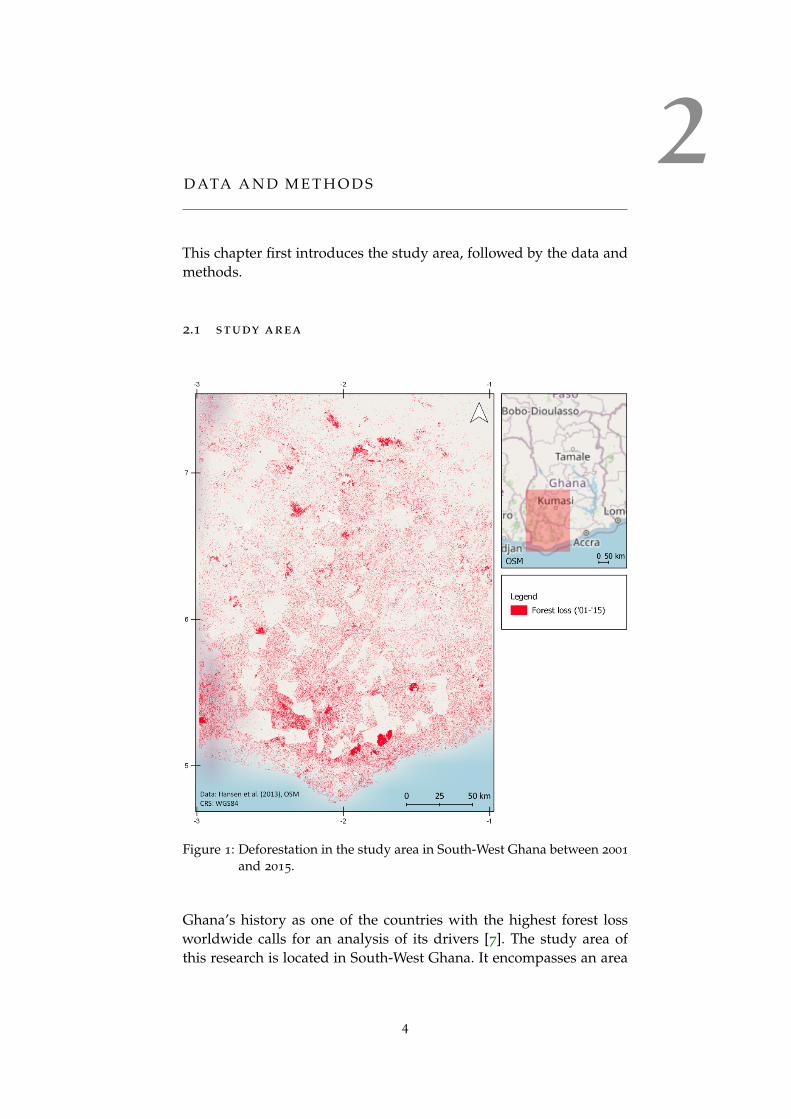
Figure 1: Deforestation in the study area in South-West Ghana between 2001
and 2015.
Ghana’s history as one of the countries with the highest forest lossworldwide calls for an analysis of its drivers [7]. The study area ofthis research is located in South-West Ghana. It encompasses an area
4

2.2 data 5
of around 67 800 km2, which has been deforested significantly in re-cent years (Figure 1) [16]. Ghana’s tropical forests are located in thesouth and west, while the central and northern zones are savanna [26].The area of interest includes protected and deforested areas aroundKumasi. The location of the study area was determined by the avail-ability of a landcover classification that includes classes for importantdrivers of deforestation in the area, such as cocoa, palm, and rubber[11]–[14].
2.2 data
This section introduces the deforestation data that was used, followedby the data that was used to analyse drivers.
2.2.1 Deforested areas and forest mask
Deforestation data for the years 2001 until 2015 were obtained in a30-meter resolution from the Global Forest Change dataset producedby Hansen et al. [16]. The year 2015 was used as a cut-off, becausefollow-up landcover data was only available for the years 2017/2018.The 2-year gap between 2015 and 2017 was left to ensure a reliableestimation of drivers, as tree crops like cocoa, rubber, and palm takea while to mature [27], [28]. All layers were clipped to the extent ofthe study area in QGIS 3.12.3. The forest loss layer, indicating theyear that a particular patch of forest was lost, served as the basis ofthe current analysis. Hansen et al. define ‘tree cover’ as all vegeta-tion above 5 meters in height, which includes both natural forest andplantations [16]. In order to limit the inclusion of non-forest cover, alayer with the percentage tree cover from the same dataset was usedto mask out areas with a canopy cover below 30 percent. Applying arelatively high tree cover threshold of 30 percent helps to eliminateless densely planted plantations [29]. The dataset does not includeareas that were deforested a second time after reforestation.

2.2 data 6
2.2.2 Follow-up landcover
Figure 2: Landcover map used to identify drivers of deforestation between2001 and 2015. The classification was produced by a Random For-est trained with 800 points per class on Sentinel-1 and Sentinel-2composites from 2017 and 2018.
The current analysis makes use of a recent 9-class landcover classifi-cation of South-West Ghana that was made in collaboration with theThe Alliance of Biodiversity International and the International Cen-ter for Tropical Agriculture (CIAT) (Figure 2) [30]. The classificationwas based on Sentinel imagery from the years 2017 and 2018 andis used to established follow-up landcover after deforestation eventsbetween 2001 and 2015. It was produced by a Random Forest algo-rithm trained with 800 points per class on Sentinel-1 and Sentinel-2composites with a resolution of 10 meters. The classification includesclasses for cocoa, rubber, palm, and orchards, which are importantknown drivers of deforestation in Ghana [11]–[14], [31]. In additionto these classes, seasonal crops are featured, which are planted andharvested annually and therefore have a different temporal signature
2.3 methods 7
than the other classes. The classification is completed with classes forlow vegetation, urban, and water.
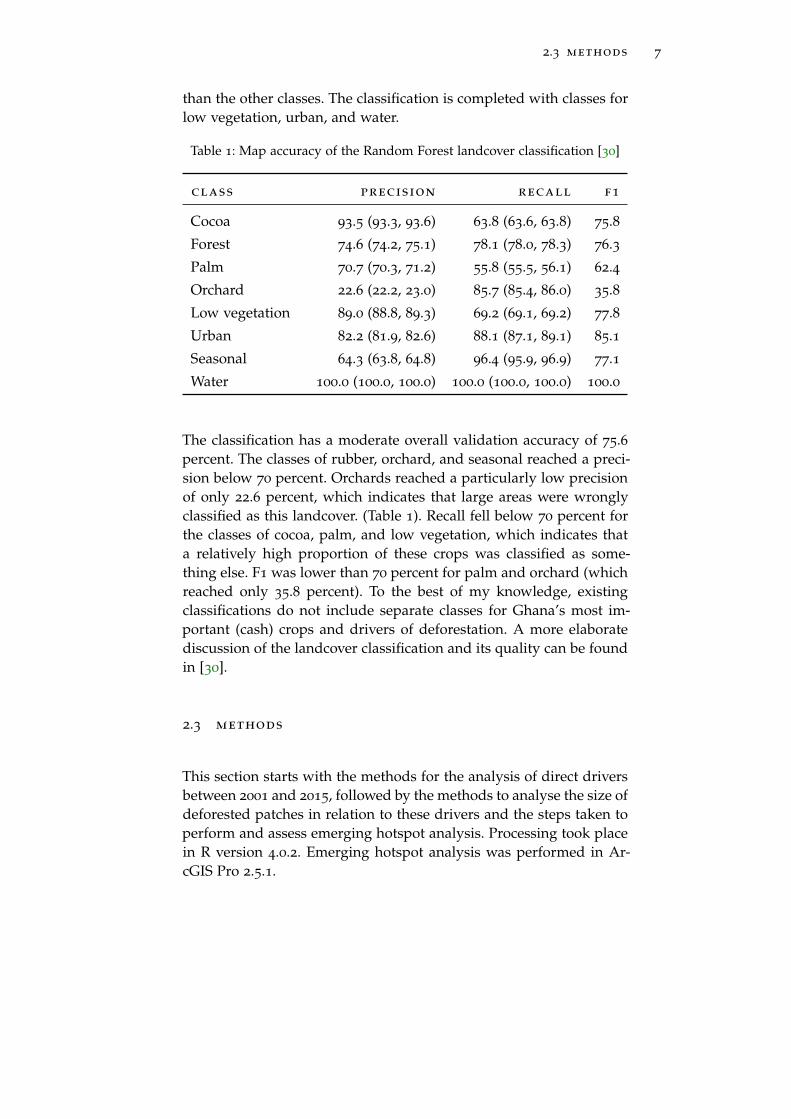
Table 1: Map accuracy of the Random Forest landcover classification [30]
class precision recall f1
Cocoa 93.5 (93.3, 93.6) 63.8 (63.6, 63.8) 75.8
Forest 74.6 (74.2, 75.1) 78.1 (78.0, 78.3) 76.3
Palm 70.7 (70.3, 71.2) 55.8 (55.5, 56.1) 62.4
Orchard 22.6 (22.2, 23.0) 85.7 (85.4, 86.0) 35.8
Low vegetation 89.0 (88.8, 89.3) 69.2 (69.1, 69.2) 77.8
Urban 82.2 (81.9, 82.6) 88.1 (87.1, 89.1) 85.1
Seasonal 64.3 (63.8, 64.8) 96.4 (95.9, 96.9) 77.1
Water 100.0 (100.0, 100.0) 100.0 (100.0, 100.0) 100.0
The classification has a moderate overall validation accuracy of 75.6percent. The classes of rubber, orchard, and seasonal reached a preci-sion below 70 percent. Orchards reached a particularly low precisionof only 22.6 percent, which indicates that large areas were wronglyclassified as this landcover. (Table 1). Recall fell below 70 percent forthe classes of cocoa, palm, and low vegetation, which indicates thata relatively high proportion of these crops was classified as some-thing else. F1 was lower than 70 percent for palm and orchard (whichreached only 35.8 percent). To the best of my knowledge, existingclassifications do not include separate classes for Ghana’s most im-portant (cash) crops and drivers of deforestation. A more elaboratediscussion of the landcover classification and its quality can be foundin [30].
2.3 methods
This section starts with the methods for the analysis of direct driversbetween 2001 and 2015, followed by the methods to analyse the size ofdeforested patches in relation to these drivers and the steps taken toperform and assess emerging hotspot analysis. Processing took placein R version 4.0.2. Emerging hotspot analysis was performed in Ar-cGIS Pro 2.5.1.

2.3 methods 8
2.3.1 Direct drivers between 2001 and 2015
Figure 3: Workflow for the first research objective.
After masking out deforested areas with a tree cover below 30 percent,the forest loss raster was resampled and aligned (nearest-neighbour)to the landcover raster to ensure that cells overlapped (Figure 3). Asa result, the forest loss raster was resampled to a resolution of 10
meters.
Next, the forest loss raster was reclassified to create 1 raster per yearwith a binary cell value of 0 or 1 that indicated whether it had beendeforested in the year in question. The resulting 15 rasters were usedto identify the most important deforestation drivers for each year.
The landcover dataset was masked to the deforested areas in eachraster, resulting in 15 rasters with the landcover of deforested areaof each year. These rasters formed the basis of the calculation of thedeforested area that could be attributed to each driver for each year.In addition, they allowed for the calculation of the total deforestedarea that could be attributed to each driver.
2.3.2 Size of forest clearings in relation to the deforestation driver
Figure 4: Workflow for the second research objective.
The 15 rasters with the landcover of deforested areas per year weremerged in order to calculate the size of forest clearings associatedwith different drivers (Figure 4). The merged landcover raster wasprojected to a metric system (ESPG:32630 - WGS 84 - UTM zone 30N)in QGIS in order to be able to calculate area statistics.
One raster was created for each landcover in order to calculate statis-tics on the (proportional) patch size by driver. A patch in this contextconsists of consecutive raster cells of deforested area. This also al-lowed for calculations of the deforested area per patch size for eachclass, which provides an indication as to whether overall deforesta-

2.3 methods 9
tion is is mostly in small or big patches. Bin sizes were 0.5 and 1 haintervals up to patches of 5 ha. Patches bigger than 5 ha were consid-ered to have a relatively high chance of being commercial plantations.They were placed in a single bin due to their relatively low frequency.It is important to note that very small deforested patches may some-times result from sensor noise. However, field research found thatslash and burn agriculture resulted in land holdings between 0.06
and 0.5 ha [10]. The smallest patches in the analysis are therefore notconsidered unrealistically small.
2.3.3 Emerging hotspot analysis
Figure 5: Workflow for the third research objective.
Emerging hotspot analysis in ArcGIS Pro was performed to identifynew hotspots of forest loss. A hotspot in this context is an area thatexhibits statistically significant clustering of forest loss in the com-bined spatial and temporal domains [24]. The analysis applies theGetis-Ord Gi-statistic to evaluate the location and the degree of spa-tial clustering [32], and the Mann-Kendall trend test to evaluate tem-poral time-series trends [33], [34]. The cluster and trend results fromthese statistics are used to categorize square bins (in this case 1 by 1
km in size). Emerging hotspot analysis allows for the identification ofdifferent types of hot- and coldspots over time, depending on when inthe period of interest high or low activity was measured. The currectanalysis was limited to new hotspots. A new hotspot is as a statisti-cally significant hotspot (p value 6 0.05) in the final time step thathas never been a significant hotspot before. This provides insight asto which emerging drivers require attention in upcoming years.
In preparation for the emerging hotspot analysis, the 15 rasters withdeforested area per year were aggregated to a resolution of 1 km (Fig-ure 5). The choice for a 1 km resolution was made after empiricallytesting 1 km and 5 km bins. The 1 km bin preserved a varied distri-bution of forest loss counts, caught more localized trends, and suitedthe scale of the analysis. Aggregated cell values were the sum of alldeforested cells.
A space-time cube was created from these aggregated rasters in Ar-cGIS Pro. In the space-time cube, each bin with data represents itsown independent time series [24]. The aggregated cells constituted

2.3 methods 10
the spatial dimension; the resolution of the time dimension was yearly.The resulting cube served as an input to the emerging hotspot analy-sis.
The hotspot raster was exported and projected to the metric WGS 84
- UTM zone 30N crs before further analysis. R was used to calculatethe absolute, as well as the proportional area per landcover in areaswith new hotspots. The proportional area was obtained by dividingthe area per class in new hotspots by the total deforested area of thatclass.

3R E S U LT S
This section first presents the results from the analysis of direct drivers(objective 1) followed by the analysis of the size of forest clearings (ob-jective 2) and the hotspot analysis (objective 3).
3.1 direct drivers between 2001 and 2015
Figure 6: Deforested area (ha) attributed to direct drivers of deforestationbetween 2001 and 2015.
The analysis showed that between 2001 and 2015, a total area of 558
150 ha of forest was lost. Cocoa was the most prominent driver, cov-ering an area of 183 137 ha (Figure 6). Orchards (102 408 ha) and lowvegetation (96320 ha) are second and third in line, followed closelyby rubber (51 240 ha), palm (47 565 ha), and forest (44 183 ha). Urban(15 531 ha), seasonal (10 018 ha) and water (7 747 ha) are the leastimportant drivers.
11
3.2 size of forest clearings in relation to the deforestation driver 12
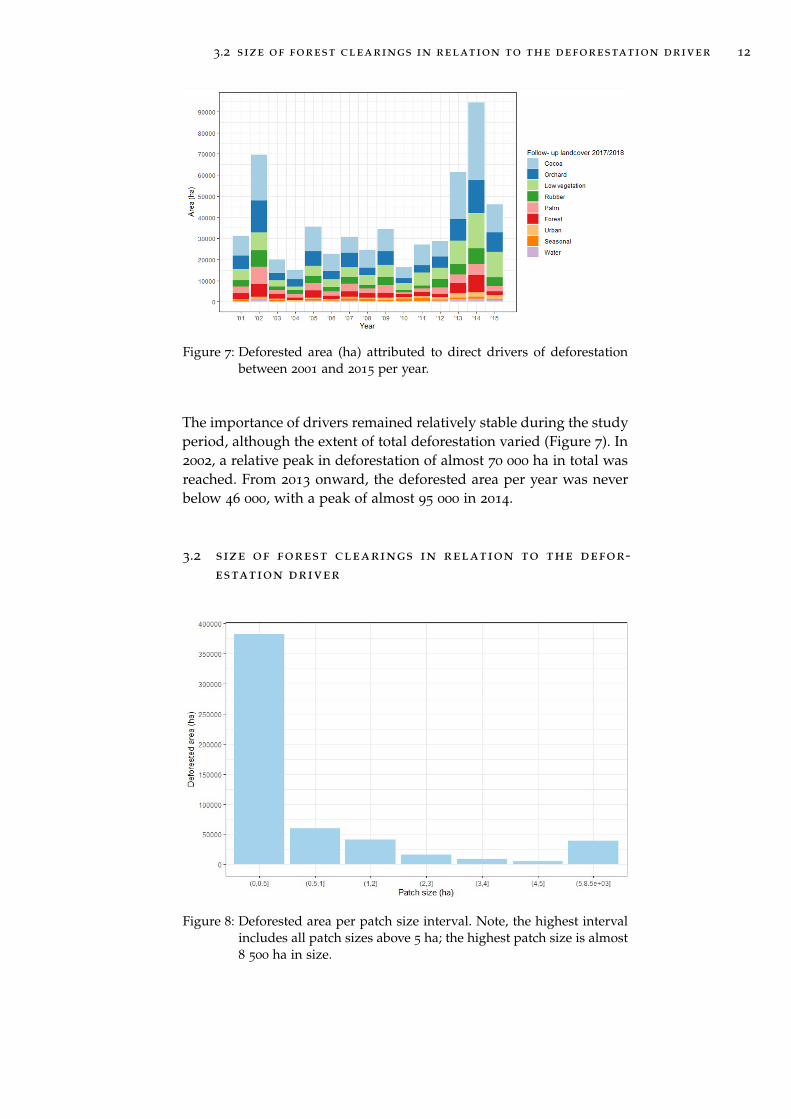
Figure 7: Deforested area (ha) attributed to direct drivers of deforestationbetween 2001 and 2015 per year.
The importance of drivers remained relatively stable during the studyperiod, although the extent of total deforestation varied (Figure 7). In2002, a relative peak in deforestation of almost 70 000 ha in total wasreached. From 2013 onward, the deforested area per year was neverbelow 46 000, with a peak of almost 95 000 in 2014.
3.2 size of forest clearings in relation to the defor-estation driver
Figure 8: Deforested area per patch size interval. Note, the highest intervalincludes all patch sizes above 5 ha; the highest patch size is almost8 500 ha in size.
3.2 size of forest clearings in relation to the deforestation driver 13
Despite their small size, patches with an area between 0 and 0.5 haare responsible for the highest total area of deforestation due to theirhigh frequency of occurrence (Figure 8). In second place are patcheswith a size between 0.5 and 1 ha, followed by patches between 1 and2 ha, and patches between 5 and 8 500 ha.
The median patch size of forest clearings does not differ much fordifferent drivers. It falls between 0.02 ha for the classes of orchard, lowvegetation, rubber, palm, forest, and seasonal and 0.03 ha for cocoa,urban, and water. The mean patch sizes is higher than the medianfor all classes, which indicates a positively skewed distribution. Thedifference between the median and the mean is the largest for cocoa,followed by seasonal, urban, and water.
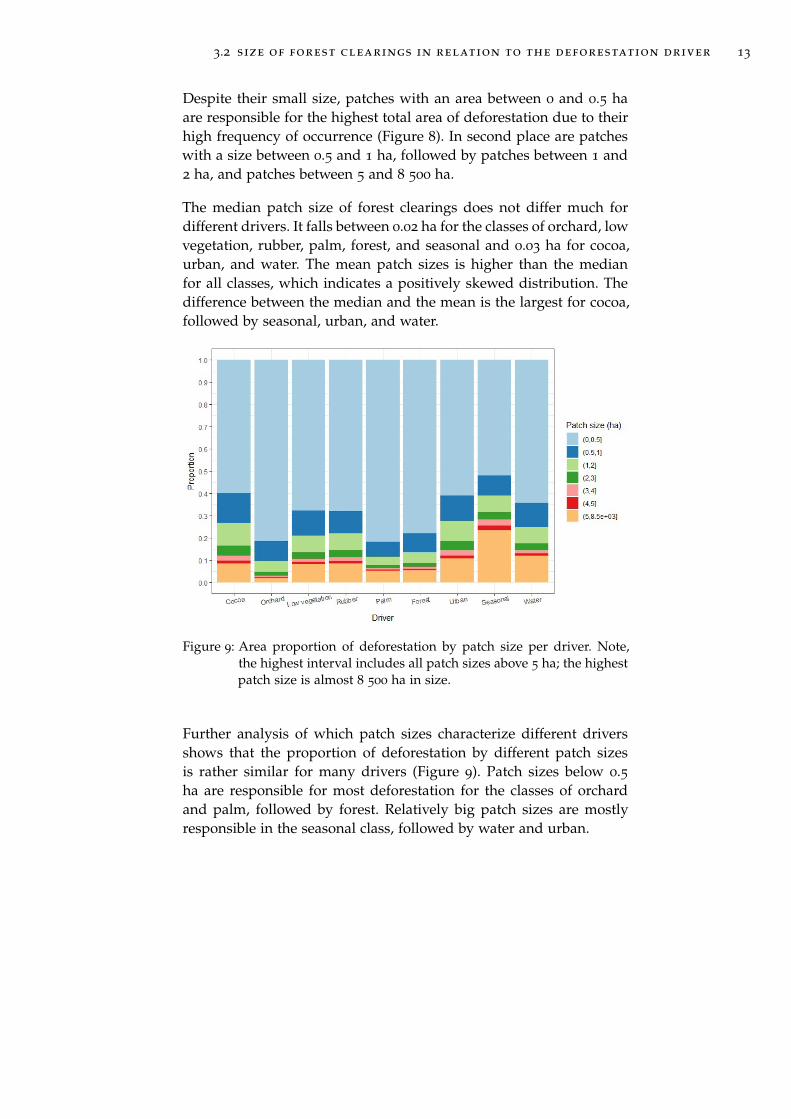
Figure 9: Area proportion of deforestation by patch size per driver. Note,the highest interval includes all patch sizes above 5 ha; the highestpatch size is almost 8 500 ha in size.
Further analysis of which patch sizes characterize different driversshows that the proportion of deforestation by different patch sizesis rather similar for many drivers (Figure 9). Patch sizes below 0.5ha are responsible for most deforestation for the classes of orchardand palm, followed by forest. Relatively big patch sizes are mostlyresponsible in the seasonal class, followed by water and urban.

3.3 emerging hotspot analysis 14
3.3 emerging hotspot analysis
Figure 10: New hotspot areas in the study area in Ghana in 2015, contextual-ized by the locations of primary forest, existing palm plantations,and open-cast mines (Data source: OSM.
Emerging hotspot analysis provides insight into the location of newhotspots of forest loss and their drivers.New hotspots were exclu-sively found in the Southern part of the study area (Figure 10). A totalof 12 hotspots were found, of which 6 are located relatively close toone another near the town of Tarkwa, where the ‘Gold Fields TarkwaMine’ is located.
In the West, the two Northern hotspots partly cover fragmented pri-mary forest areas along relatively small (dirt) roads that are not cap-tured by the OpenStreetMap (OSM) layer (Figure 10). The area has sev-eral (relatively small) existing plantations, including palm and rubber.The more Southern hotspots are located near the large ‘Plantationd’Ehania’, which reference with data from Hansen et al. confirmswas gradually expanded between 2002 and 2015 [16]. A last hotspotis found in the east of the study area, just South of an another existingpalm plantation between Twifo Praso and Twifo Hemang, which wasexpanded between 2003 and 2015.
3.3 emerging hotspot analysis 15
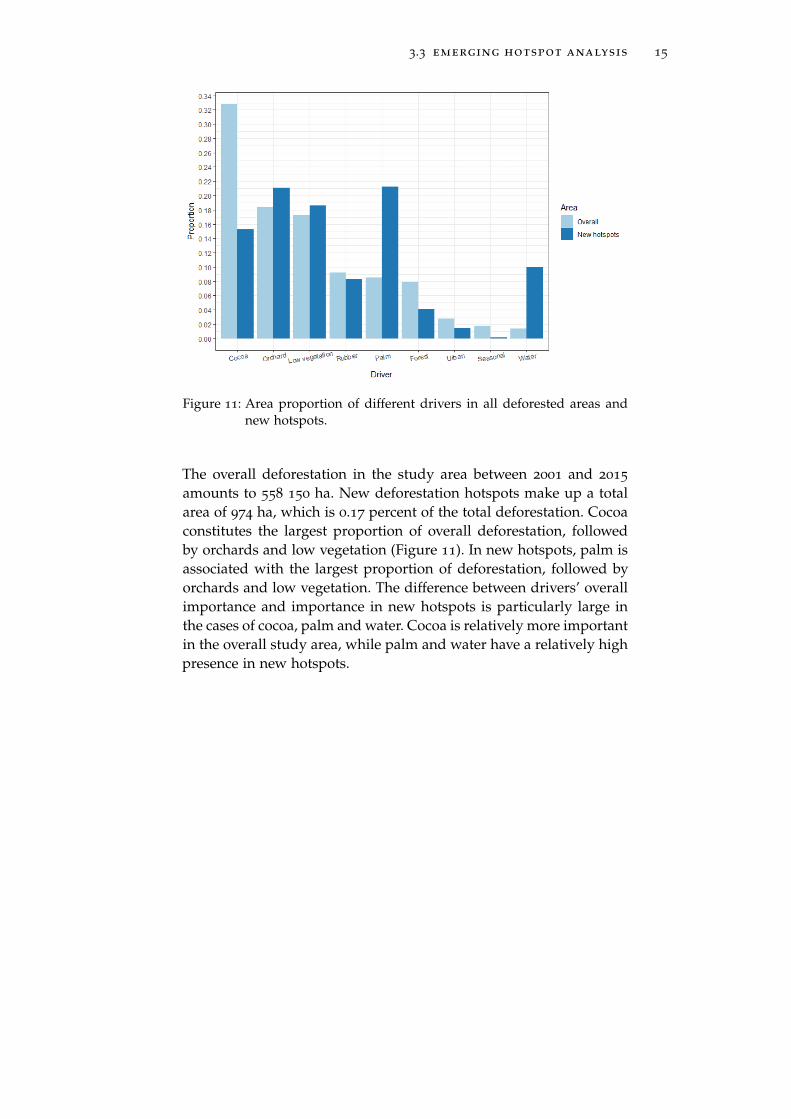
Figure 11: Area proportion of different drivers in all deforested areas andnew hotspots.
The overall deforestation in the study area between 2001 and 2015
amounts to 558 150 ha. New deforestation hotspots make up a totalarea of 974 ha, which is 0.17 percent of the total deforestation. Cocoaconstitutes the largest proportion of overall deforestation, followedby orchards and low vegetation (Figure 11). In new hotspots, palm isassociated with the largest proportion of deforestation, followed byorchards and low vegetation. The difference between drivers’ overallimportance and importance in new hotspots is particularly large inthe cases of cocoa, palm and water. Cocoa is relatively more importantin the overall study area, while palm and water have a relatively highpresence in new hotspots.
4D I S C U S S I O N
This section interprets the findings that were presented in the pre-vious section in light of existing research, highlighting the three re-search objectives one at a time.
4.1 direct drivers between 2001 and 2015
The analysis of the most important drivers of forest loss between 2001
and 2015 showed that cocoa was the most prominent driver (Figure 6),which is in line with earlier (localized field) research [11], [12], [35].Previous research has furthermore pointed to palm and rubber asmain agricultural drivers [13], [14]. The current analysis found thatalthough these crops caused 47 565 and 51 240 ha of deforestationrespectively, they were surpassed in importance by orchards and lowvegetation.
The importance of low vegetation suggests that some deforested areasremained fallow for at least two years (from 2015-2017), or that newlyplanted crops were still too small to be identified at the time thatlandcover was classified. This could partly be solved by increasingthe time between the year of deforestation and classification. How-ever, the time series of forest loss show that low vegetation makes upa relatively stable proportion of landcover over time (Figure 7). Fur-ther research is needed to better understand the use of these areas,which may include for example the maintenance of livestock and/orfrequent slash and burn cycles.
The apparent importance of orchards as drivers also requires furtherverification. Although the production of fruits and nuts is of impor-tance to Ghana’s local and national economies, these crops have notbeen identified as main drivers of deforestation in earlier research[36]. The results from the current analysis provide insight in theirpotential importance as drivers, but this may partly be explained bytheir overrepresentation in the landcover map (Table 1). Classificationof orchards is challenging due to their dense canopy cover which re-sembles non-productive trees [37]. Improvement of the classificationis desired to obtain a more reliable estimation of the contribution oforchards (and other drivers) to forest loss. The limited quality of the
16

4.1 direct drivers between 2001 and 2015 17
current classification should be taken into account in the interpreta-tion of the results.
The presence of forest as a driver of deforestation is paradoxical, eventhough it ’only’ covered an area of 44 183 ha. The results can be ex-plained by a number of factors, some of which are likely methodolog-ical errors. In some areas, conservation efforts may result in forestregrowth after deforestation caused by illegal logging, forest fires, etc.[37]. In addition to that, de- and reforestation cycles may be observedin areas that are planted and logged cyclically to meet the country’sdemand for timber [38]. However, the presence of forest as a driverwill be partly due to inconsistencies between the landcover classifica-tion and the forest loss dataset. Importantly, the definitions of forestof the two datasets were not fully in line [16], [30]. The landcover clas-sification was trained with natural forest, while the definition used byHansen includes all vegetation above 5 meters in height, includingboth natural forest and plantations [16]. The forest mask of 30 per-cent canopy cover cannot exclude all plantations, which implies thatdense plantations that are cut and replanted will be included in theforest loss layer. Use of a primary forest mask could help to solve thisproblem, although it implies a loss of information about non-primaryforest loss. In addition to that, local discrepancies result from differ-ences in the methods to detect forest and the imagery used (Landsat[16]/Sentinel [30]).
Besides methodological differences between the two datasets, eitherdataset has its own errors. Clouds will always impact passive opticalsensors such as Landsat and Sentinel in areas with persistent cloudcover such as West Africa, which compromises the quality of result-ing classifications [39]. Furthermore, the quality of classifications de-pends on the quality of the training dataset, which was relativelylow for the landcover classification Table 1. This classification oftenconfused cocoa plantations and intercrops for natural forests. Suchcrops with a dense canopy resemble forest, which results in ‘defor-estation [or reforestation] in disguise’ [37]. Once again, this stressesthe need to improve the landcover classification. In addition, a distinc-tion should be made between natural forest and production forestswith trees planted in a regular pattern.
The time series analysis of deforestation showed a number of yearswith particularly high forest loss, with the highest peak in 2014 (Fig-ure 7). No one driver stood out particularly in that year, which com-plicates the search for an explanation of this apparent increase indeforestation. However, it is clear that cocoa was the primary driver,and a tentative explanation for an increase in forest loss for cocoaproduction in the year 2014 is available. Two years earlier, in 2012,large chocolate manufacturers such as Barry Callebaut and Mars ex-
4.2 size of forest clearings in relation to the deforestation driver 18
pressed concerns about future cocoa shortages [40]. Media pickedthis up two years later, reporting on the expectation that the worldwould be running out of chocolate [41]–[43]. The International Co-coa Organization (ICCO) issued a statement in which it explained thatno extreme shortages were expected [44]. Nevertheless, the idea thatthere would be a cocoa shortage may have induced increased defor-estation activity. Newly cleared forest areas produce up to 25 per-cent higher yields than replanted areas, and clearing a new forestarea costs about half the effort of replanting an existing plantation[45]. Areas that were deforested in response to the expected cocoashortage may sometimes eventually have been planted by crops otherthan cocoa (perhaps after consideration of the statement by the ICCO).The expected cocoa shortages and resulting economic opportunitiesmay thus also partly explain relatively high forest loss in areas thatwere eventually planted by crops other than cocoa. More researchis needed to verify this theory and understand the cause-and-effectrelationships involved.
4.2 size of forest clearings in relation to the defor-estation driver
The analysis of patch size in relation to different drivers showed thatpatches below 0.5 ha were responsible for the largest total deforestedarea (Figure 8). Small patches are associated with smallholder or sub-sistence agriculture, while bigger patches provide an indication ofcommercial plantations [22]. In 2016, smallholder farms had an av-erage size of just over 2 ha [46]. Contrary to expectations, the meanpatch size was similar for all classes, far below 2 ha. This is surprisingas some drivers (palm, rubber) were expected to be associated withlarge scale plantations, while others (cocoa, seasonal) were expectedto be grown by smallholders relatively often [47]. The low variation inpatch size by driver suggests that small scale deforestation was mostcommon for all drivers. The fact that there was no clear associationbetween the driver of forest loss and the scale of deforestation impliesthat patch size cannot be used as a guide to pinpoint drivers.
The apparent importance of subsistence agriculture over commercialplantations is in line with previous research, which states that agri-cultural commercialization in Ghana has been largely small-holderbased in Ghana, as opposed to other African countries [48]. In spite ofseveral large-scale international land acquisitions, smallholders stillconstituted 90 to 95 percent of the farms in the previous decade [49],[50]. Continuous small-scale deforestation in spite of forest manage-ment efforts may be partly explained by the fact that 80 percent ofGhana’s land is held under customary land tenure, which compli-

4.3 emerging hotspot analysis 19
cates forest management structure and conservation reinforcement[48]. Field research is needed to verify the importance of subsistenceagriculture over commercial plantations for different drivers, as patchsize will not always suffice to make this distinction.
4.3 emerging hotspot analysis
The identification of drivers in new hotspots provides guidance asto which upcoming drivers deserve further attention for the purposeof conservation [24], [25]. Cocoa was highly represented in hotspotsareas, but passed by palm as the most prominent driver, in spiteof its overall importance from 2001 to 2015. Palm and water werehighly presented in new hotspot areas in 2015 compared to theiroverall importance from 2001 to 2015. The presence of palm can beexplained by the development of palm plantations over the years. The‘Plantation d’Ehania’ and the ‘Twifo’ plantation were both expandedfrom 2002/2003 until 2015. These large commercial plantations wereexpanded relatively quickly, which makes their appearance in newhotspots more likely. The prevalence of water in new hotspots canbe explained by the practice of open-cast mining. The water areas innew hotspots were found near the ‘Gold Fields Tarkwa Mine’. Open-cast mines like the ’Tarkwa’ mine are generally filled with water andwill therefore often be classified as such. Verification with satelliteimagery verified that this was the case here as well. The Ghanaianmining industry is an important driver of deforestation. Companieswith permits for surface mining have cleared large tracts of forests [9],[51]. Besides commercial legal mining, illegal artisanal mining prac-tices, which result in severe soil erosion, are deeply rooted in the localculture and supported by traditional leaders [52], [53]. Future classi-fications for the purpose of driver analysis should include a separateclass for open-cast mines.

5C O N C L U S I O N
This thesis has analysed direct drivers of deforestation and their char-acteristics in South-West Ghana between 2001 and 2015. Drivers wereidentified as follow-up landcover after deforestation based on a 9-class landcover classification of the year 2017/2018. Cocoa was foundto be responsible for most deforestation, in line with earlier research[11], [12], [35]. Orchards were found to be the second most promi-nent driver, followed by low vegetation. Rubber and palm, which aretraditionally considered important drivers of deforestation in othergeographies, came 4th and 5th [13], [14]. Further analysis is neededto validate these findings.
The analysis showed a peak in deforestation in the year 2014. A ten-tative explanation for the high forest loss in that year relates to thefact that several media reported an expected cocoa shortage that year[41]–[43]. This may have led people to clear land for cocoa produc-tion. The fact that the proportion of cocoa driven deforestation wasnot much higher than in other years suggests that newly cleared for-est was eventually partly used for other crops when it became clearthat cocoa shortage was overstated [44]. Further research is needed toverify this hypothesis.
The second objective of this thesis was to analyse the size of forestclearings in relation to their driver. No association was found betweenthe drivers of forest loss and the scale of clearings, which implies thatpatch size cannot be used to track drivers. Patches below 0.5 ha wereresponsible for the largest area of deforestation. This provides an indi-cation that smallholder and/or subsistence agriculture are importantcauses of forest loss in the study area. Forest monitoring should notoverlook such small scale deforestation, as its total impact on forestloss has proven bigger than that of large plantations.
Thirdly, emerging hotspots of deforestation in 2015 were analysed.Palm and water were particularly important in new hotspot areas,compared to their overall importance. Cocoa was relatively unimpor-tant, due to its high presence as a driver in earlier years. The emer-gence of palm in hotspot areas was explained by the expansion of ex-isting plantations. Water was found in an open gold mine; a separateclass for mines should be included in future versions of the landcovermap. These emerging hotspots can guide monitoring activities by pro-
20

conclusion 21
viding a statistical tool to identify new hotspots of deforestation andtheir associated drivers.
The analyses in this thesis have demonstrated the potential use ofremote sensing for the analysis of deforestation drivers. Analysis ofsatellite imagery can complement fieldwork by allowing for objectiveanalyses of drivers and associated trends over large areas at a rela-tively low cost [11].

B I B L I O G R A P H Y
[1] G. F. Watch, Global Deforestation Rates & Statistics by Country |GFW, en, 2020. [Online]. Available: https://www.globalforestwatch.org/dashboards/global (visited on 08/11/2020).
[2] J. Teye, “Deforestation in Ghana,” Acta Geographica-Trondheim,vol. A, no. 10, 2005.
[3] A. H. Mas and T. V. Dietsch, “Linking Shade Coffee Certifica-tion to Biodiversity Conservation: Butterflies and Birds in Chia-pas, Mexico,” en, Ecological Applications, vol. 14, no. 3, pp. 642–654, 2004, issn: 1939-5582. doi: 10.1890/02-5225.
[4] J. E. Tondoh, F. N. Kouamé, A. Martinez Guéi, B. Sey, A. WowoKoné, and N. Gnessougou, “Ecological changes induced by full-sun cocoa farming in Côte d’Ivoire,” Global Ecology and Con-servation, vol. 3, pp. 575–595, Jan. 2015, issn: 2351-9894. doi:10.1016/j.gecco.2015.02.007.
[5] J. Mascaro, G. P. Asner, D. E. Knapp, T. Kennedy-Bowdoin, R. E.Martin, C. Anderson, M. Higgins, and K. D. Chadwick, “A Taleof Two “Forests”: Random Forest Machine Learning Aids Trop-ical Forest Carbon Mapping,” en, PLoS ONE, vol. 9, no. 1, B.Bond-Lamberty, Ed., e85993, Jan. 2014, issn: 1932-6203. doi: 10.1371/journal.pone.0085993.
[6] F. Ruf, G. Schroth, and K. Doffangui, “Climate change, cocoamigrations and deforestation in West Africa: What does the pasttell us about the future?” en, Sustainability Science, vol. 10, no. 1,pp. 101–111, Jan. 2015, issn: 1862-4057. doi: 10.1007/s11625-014-0282-4.
[7] FAO, Global forest resources assessment 2015. en. Rome: Food andAgriculture Organization of the United Nations, 2015, OCLC:964529974, isbn: 978-92-5-108826-5.
[8] W. Hawthorne, “The flora and vegetation of Ghana’s forests,”Forestry Department, Accra, Ghana, Tech. Rep., 1989, pp. 8–14.
[9] M. Hirons, “Mining in Ghana’s forests: Cross-sectoral linkagesand the prospects for REDD,” English, International DevelopmentPlanning Review; Liverpool, vol. 35, no. 3, pp. 283–302, 2013, NumPages: 20 Place: Liverpool, United Kingdom, Liverpool Pub-lisher: Liverpool University Press, issn: 14746743. doi: 10.3828/idpr.2013.18.
22

bibliography 23
[10] M. Appiah, D. Blay, L. Damnyag, F. K. Dwomoh, A. Pappinen,and O. Luukkanen, “Dependence on forest resources and trop-ical deforestation in Ghana,” en, Environment, Development andSustainability, vol. 11, no. 3, pp. 471–487, Jun. 2009, issn: 1573-2975. doi: 10.1007/s10668-007-9125-0.
[11] B. DeVries, J. Verbesselt, L. Kooistra, and M. Herold, “Robustmonitoring of small-scale forest disturbances in a tropical mon-tane forest using Landsat time series,” Remote Sensing of Envi-ronment, vol. 161, pp. 107–121, May 2015, issn: 0034-4257. doi:10.1016/j.rse.2015.02.012.
[12] A. Kroeger, H. Bakhtary, F. Haupt, and C. Streck, EliminatingDeforestation from the Cocoa Supply Chain, en. World Bank, Mar.2017. doi: 10.1596/26549.
[13] K. Asubonteng, K. Pfeffer, M. Ros-Tonen, J. Verbesselt, and I.Baud, “Effects of Tree-crop Farming on Land-cover Transitionsin a Mosaic Landscape in the Eastern Region of Ghana,” en,Environmental Management, vol. 62, no. 3, pp. 529–547, Sep. 2018,issn: 0364-152X, 1432-1009. doi: 10.1007/s00267-018-1060-3.
[14] T. Chiti, E. Grieco, L. Perugini, A. Rey, and R. Valentini, “Effectof the replacement of tropical forests with tree plantations onsoil organic carbon levels in the Jomoro district, Ghana,” en,Plant and Soil, vol. 375, no. 1-2, pp. 47–59, Feb. 2014, issn: 0032-079X, 1573-5036. doi: 10.1007/s11104-013-1928-1.
[15] R. M. Ochieng, I. J. Visseren-Hamakers, and K. S. Nketiah, “In-teraction between the FLEGT-VPA and REDD+ in Ghana: Rec-ommendations for interaction management,” en, Forest Policyand Economics, Emerging Forest Regimes, vol. 32, pp. 32–39, Jul.2013, issn: 1389-9341. doi: 10.1016/j.forpol.2012.07.003.
[16] M. Hansen, P. Potapov, R. Moore, et al., “High-resolution globalmaps of 21st-century forest cover change,” Science, no. 342, pp. 850–853, 2013.
[17] E. Romijn, C. B. Lantican, M. Herold, E. Lindquist, R. Ochieng,A. Wijaya, D. Murdiyarso, and L. Verchot, “Assessing change innational forest monitoring capacities of 99 tropical countries,”en, Forest Ecology and Management, Changes in Global ForestResources from 1990 to 2015, vol. 352, pp. 109–123, Sep. 2015,issn: 0378-1127. doi: 10.1016/j.foreco.2015.06.003.
[18] R. DeFries, F. Achard, S. Brown, M. Herold, D. Murdiyarso,B. Schlamadinger, and C. d. Souza, “Reducing greenhouse gasemissions from deforestation in developing countries: Consid-erations for monitoring and measuring,” en-US, Global Terres-trial Observing System (GTOS), Tech. Rep. 46, 2006.
[19] H. Geist and E. Lambin, “Proximate causes and underlyingdriving forces of tropical deforestation,” BioScience, no. 52, 2002.
bibliography 24
[20] R. S. DeFries, T. Rudel, M. Uriarte, and M. Hansen, “Deforesta-tion driven by urban population growth and agricultural tradein the twenty-first century,” en, Nature Geoscience, vol. 3, no. 3,pp. 178–181, Mar. 2010, Number: 3 Publisher: Nature Publish-ing Group, issn: 1752-0908. doi: 10.1038/ngeo756.
[21] K. Rademaekers, L. Eichler, J. Berg, M. Obersteiner, and P. Hav-lik, “Study on the evolution of some deforestation drivers andtheir potential impacts on the costs of an avoiding deforestationscheme.,” ECORYS and IIASA, Rotterdam, Netherlands, Tech.Rep., 2010.
[22] V. de Sy, “Remote sensing of land use and carbon losses fol-lowing tropical deforestation,” en, ISBN: 9789462578036, PhDthesis, Wageningen University, Wageningen, Jun. 2016. doi: 10.18174/380263.
[23] N. Hosonuma, M. Herold, V. D. Sy, R. S. D. Fries, M. Brockhaus,L. Verchot, A. Angelsen, and E. Romijn, “An assessment of de-forestation and forest degradation drivers in developing coun-tries,” en, Environmental Research Letters, vol. 7, no. 4, p. 044 009,Oct. 2012, Publisher: IOP Publishing, issn: 1748-9326. doi: 10.1088/1748-9326/7/4/044009.
[24] N. L. Harris, E. Goldman, C. Gabris, et al., “Using spatial statis-tics to identify emerging hot spots of forest loss,” en, Environ-mental Research Letters, vol. 12, no. 2, p. 024 012, Feb. 2017, Pub-lisher: IOP Publishing, issn: 1748-9326. doi: 10 . 1088 / 1748 -
9326/aa5a2f.
[25] A. Etter, C. Mcalpine, S. Phinn, D. Pullar, and H. Possingham,“Characterizing a tropical deforestation wave: A dynamic spa-tial analysis of a deforestation hotspot in the Colombian Ama-zon,” en, Global Change Biology, vol. 12, no. 8, pp. 1409–1420,2006, _eprint: https://onlinelibrary.wiley.com/doi/pdf/10.1111/j.1365-2486.2006.01168.x, issn: 1365-2486. doi: 10.1111/j.1365-2486.2006.01168.x.
[26] J. Förster, “The Potential of Reducing Emissions from Defor-estation and Degradation (REDD) in Western Ghana,” en, PhDthesis, University of Bayreuth, Bayreuth, Germany, Aug. 2009.
[27] A. Ismail and M. Mamat, “The optimal age of oil palm replant-ing,” Oil Palm Industry Economic Journal, vol. 2, no. 1, pp. 11–18,2002.
[28] V. H. L. Rodrigo, C. M. Stirling, Z. Teklehaimanot, and A. Nu-gawela, “Intercropping with banana to improve fractional inter-ception and radiation-use efficiency of immature rubber planta-tions,” en, Field Crops Research, vol. 69, no. 3, pp. 237–249, Mar.2001, issn: 0378-4290. doi: 10.1016/S0378-4290(00)00147-7.

bibliography 25
[29] S. S. Saatchi, N. L. Harris, S. Brown, et al., “Benchmark map offorest carbon stocks in tropical regions across three continents,”en, Proceedings of the National Academy of Sciences, vol. 108, no. 24,pp. 9899–9904, Jun. 2011, issn: 0027-8424, 1091-6490. doi: 10.1073/pnas.1019576108.
[30] A.-J. Welsink, Comparing Classification of Ghana’s Complex Agro-forestry Land Cover by a Random Forest and a Convolutional NeuralNetwork with a Small Training Set, English, Mar. 2020.
[31] V. Vijay, S. L. Pimm, C. N. Jenkins, and S. J. Smith, “The Impactsof Oil Palm on Recent Deforestation and Biodiversity Loss,” en,PLOS ONE, vol. 11, no. 7, M. Anand, Ed., e0159668, Jul. 2016,issn: 1932-6203. doi: 10.1371/journal.pone.0159668.
[32] J. K. Ord and A. Getis, “Local Spatial Autocorrelation Statis-tics: Distributional Issues and an Application,” en, GeographicalAnalysis, vol. 27, no. 4, pp. 286–306, 1995, issn: 1538-4632. doi:10.1111/j.1538-4632.1995.tb00912.x.
[33] M. Kendall and J. Gibbons, Rank Correlation Methods. London:Griffin, 1990.
[34] H. B. Mann, “Nonparametric Tests Against Trend,” Economet-rica, vol. 13, no. 3, pp. 245–259, 1945, Publisher: [Wiley, Econo-metric Society], issn: 0012-9682. doi: 10.2307/1907187.
[35] R Bymolt, A Laven, and M Tyszler, “Demystifying the CocoaSector in Ghana and Côte d’Ivoire,” en, The Royal Tropical In-stitute, Amsterdam, Tech. Rep., 2018.
[36] M. Pouliot, T. Treue, B. D. Obiri, and B. Ouedraogo, “Deforesta-tion and the Limited Contribution of Forests to Rural Liveli-hoods in West Africa: Evidence from Burkina Faso and Ghana,”en, AMBIO, vol. 41, no. 7, pp. 738–750, Nov. 2012, issn: 1654-7209. doi: 10.1007/s13280-012-0292-3.
[37] E. O. Acheampong, C. J. Macgregor, S. Sloan, and J. Sayer, “De-forestation is driven by agricultural expansion in Ghana’s forestreserves,” en, Scientific African, vol. 5, e00146, Sep. 2019, issn:2468-2276. doi: 10.1016/j.sciaf.2019.e00146.
[38] K. A. Oduro, G. M. J. Mohren, M. Peña-Claros, B. Kyereh, and B.Arts, “Tracing forest resource development in Ghana throughforest transition pathways,” en, Land Use Policy, vol. 48, pp. 63–72, Nov. 2015, issn: 0264-8377. doi: 10.1016/j.landusepol.2015.05.020.
[39] M. C. Hansen, A. Krylov, A. Tyukavina, P. V. Potapov, S. Tu-rubanova, B. Zutta, S. Ifo, B. Margono, F. Stolle, and R. Moore,“Humid tropical forest disturbance alerts using Landsat data,”en, Environmental Research Letters, vol. 11, no. 3, p. 034 008, Mar.2016, issn: 1748-9326. doi: 10.1088/1748-9326/11/3/034008.

bibliography 26
[Online]. Available: https://doi.org/10.1088%2F1748-9326%2F11%2F3%2F034008 (visited on 07/16/2019).
[40] R. Pendrous, Mars urges action on cocoa to beat shortage, en-GB,Library Catalog: www.foodmanufacture.co.uk, 2012. [Online].Available: https://www.foodmanufacture.co.uk/Article/2012 / 06 / 13 / Mars - Chocolate - warns - action - on - cocoa -
needed-to-beat-shortage (visited on 08/03/2020).
[41] R. A. Ferdman, “The world’s biggest chocolate-maker says we’rerunning out of chocolate,” en-US, Washington Post, Nov. 2014,issn: 0190-8286. [Online]. Available: https://www.washingtonpost.com/news/wonk/wp/2014/11/15/the-worlds-biggest-chocolate-
maker- says- were- running- out- of- chocolate/ (visited on08/03/2020).
[42] T. Ford, J. Vit, N. Rupert, T. Branigan, and E. Saner, “The cocoacrisis: Why the world’s stash of chocolate is melting away,” en,the Guardian, Nov. 2014, Library Catalog: www.theguardian.comSection: Food. [Online]. Available: http://www.theguardian.com/lifeandstyle/2014/nov/21/cocoa-crisis-world-chocolate-
stash-melting-away (visited on 08/03/2020).
[43] R. Moss, “The World Is Running Out Of Chocolate, This Is NotA Drill,” en, The Huffington Post UK, Nov. 2014, Library Catalog:www.huffingtonpost.co.uk Section: Life.
[44] I. C. Organization, ICCO Statement on Reports of a Cocoa SupplyDeficit in 2020, International Cocoa Organization, 2014.
[45] R. A. Rice and R. Greenberg, “Cacao Cultivation and the Con-servation of Biological Diversity,” AMBIO: A Journal of the Hu-man Environment, vol. 29, no. 3, pp. 167–173, May 2000, issn:0044-7447, 1654-7209. doi: 10.1579/0044-7447-29.3.167.
[46] M. Kansanga, P. Andersen, D. Kpienbaareh, S. Mason-Renton,K. Atuoye, Y. Sano, R. Antabe, and I. Luginaah, “Traditionalagriculture in transition: Examining the impacts of agriculturalmodernization on smallholder farming in Ghana under the newGreen Revolution,” International Journal of Sustainable Develop-ment & World Ecology, vol. 26, no. 1, pp. 11–24, Jan. 2019, issn:1350-4509. doi: 10.1080/13504509.2018.1491429.
[47] G. C. Schoneveld and L. German, “Translating Legal Rights intoTenure Security: Lessons from the New Commercial Pressureson Land in Ghana,” The Journal of Development Studies, vol. 50,no. 2, pp. 187–203, Feb. 2014, issn: 0022-0388. doi: 10.1080/00220388.2013.858129.
[48] J. A. Yaro, J. K. Teye, and G. D. Torvikey, “Agricultural commer-cialisation models, agrarian dynamics and local development inGhana,” en, The Journal of Peasant Studies, vol. 44, no. 3, pp. 538–
bibliography 27
554, May 2017, issn: 0306-6150, 1743-9361. doi: 10.1080/03066150.2016.1259222.
[49] J. Chamberlin, “It’s Small World After All: Defining SmallholderAgriculture in Ghana,” en, International Food Policy Research In-stitute, IFPRI Discussion Paper, no. 00823, 2008.
[50] K. Lanz, J.-D. Gerber, and T. Haller, “Land Grabbing, the Stateand Chiefs: The Politics of Extending Commercial Agriculturein Ghana,” en, Development and Change, vol. 49, no. 6, pp. 1526–1552, 2018, issn: 1467-7660. doi: 10.1111/dech.12429.
[51] C. P. Hansen, J. F. Lund, and T. Treue, “Neither Fast, Nor Easy:He Prospect of Reduced Emissions from Deforestation and Degra-dation (REDD) in Ghana,” International Forestry Review, vol. 11,no. 4, pp. 439–455, Dec. 2009, Publisher: Commonwealth ForestryAssociation, issn: 1465-5489, 2053-7778. doi: 10.1505/ifor.11.4.439.
[52] S. M. Banchirigah, “Challenges with eradicating illegal miningin Ghana: A perspective from the grassroots,” en, Resources Pol-icy, vol. 33, no. 1, pp. 29–38, Mar. 2008, issn: 0301-4207. doi:10.1016/j.resourpol.2007.11.001.
[53] J. M. Kusimi, “Assessing land use and land cover change inthe Wassa West District of Ghana using remote sensing,” en,GeoJournal, vol. 71, no. 4, pp. 249–259, Apr. 2008, issn: 0343-2521, 1572-9893. doi: 10.1007/s10708-008-9172-6.