Embed Size (px)
Citation preview
DEFINITIONS1 SAMPLE MEAN Z-TEST1 SAMPLE MEAN T-TEST1 PROPORTION Z-TEST
2 INDEPENDENT SAMPLES T-TEST2 RELATED SAMPLES PAIRED DATA
TYPE OF ERRORS
Chapter 8Hypothesis Testing
Definition
HypothesesTest StatisticP-valueDecision and Conclusion
Definition
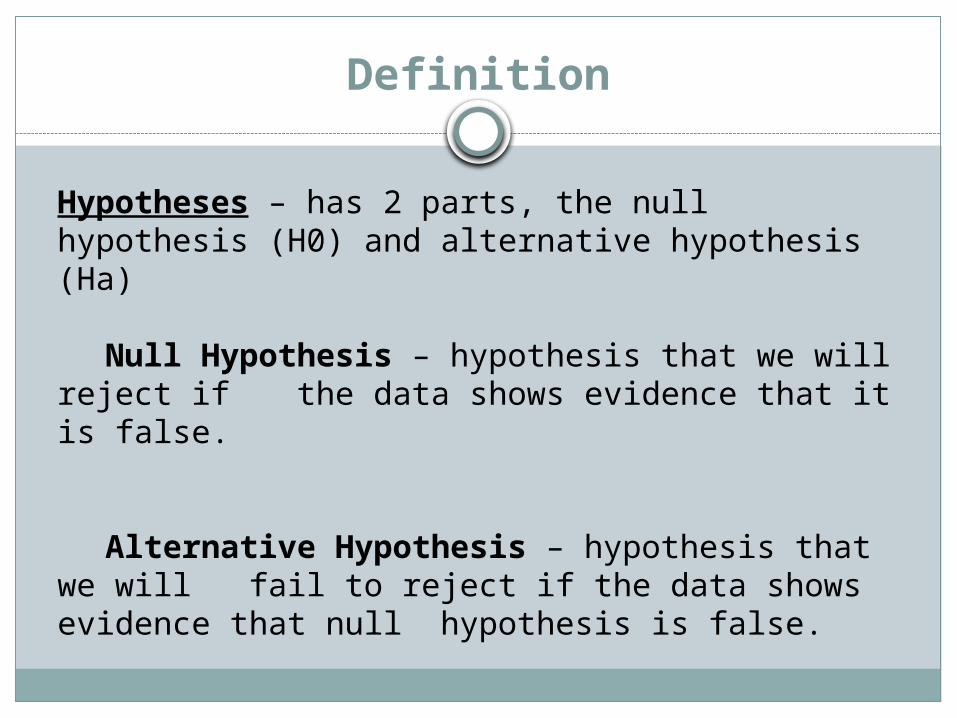
Hypotheses – has 2 parts, the null hypothesis (H0) and alternative hypothesis (Ha)
Null Hypothesis – hypothesis that we will reject if the data shows evidence that it is false.
Alternative Hypothesis – hypothesis that we will fail to reject if the data shows evidence that null hypothesis is false.
Definition
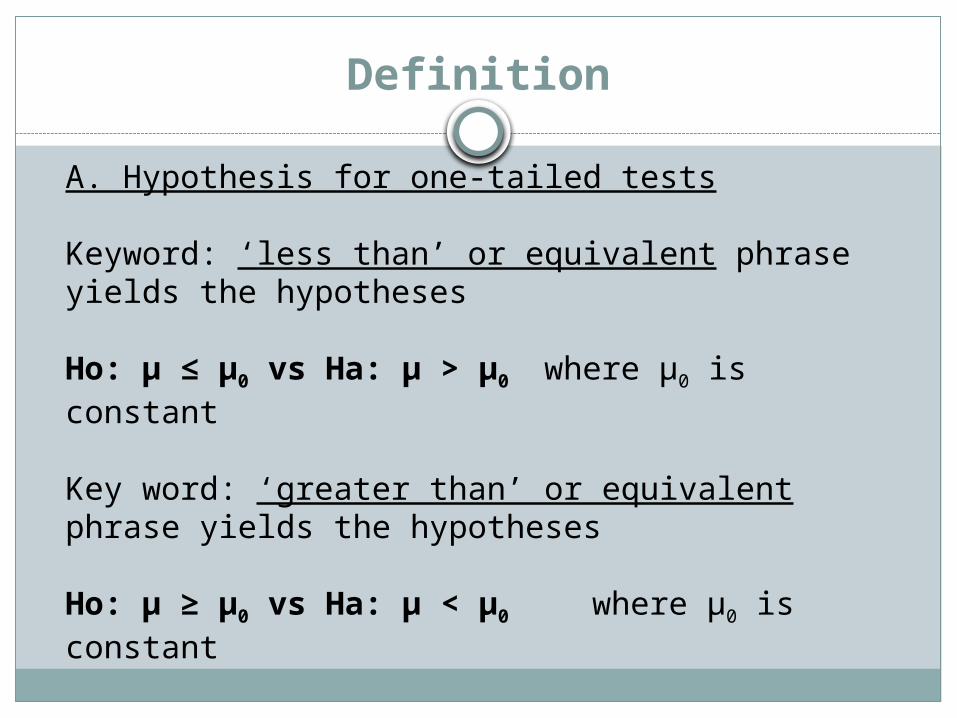
A. Hypothesis for one-tailed tests
Keyword: ‘less than’ or equivalent phrase yields the hypotheses
Ho: µ ≤ µ0 vs Ha: µ > µ0 where µ0 is constant
Key word: ‘greater than’ or equivalent phrase yields the hypotheses
Ho: µ ≥ µ0 vs Ha: µ < µ0 where µ0 is constant
Definition
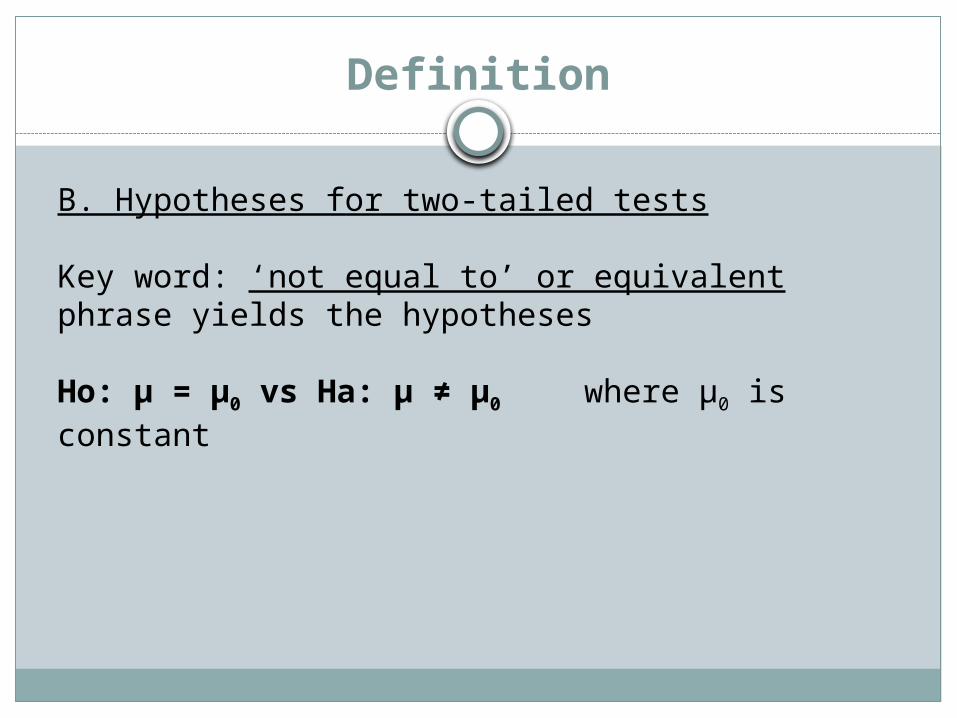
B. Hypotheses for two-tailed tests
Key word: ‘not equal to’ or equivalent phrase yields the hypotheses
Ho: µ = µ0 vs Ha: µ ≠ µ0 where µ0 is constant

iClicker

Definition
Test Statistic
The test statistic can either be a Z or a T test statistic.
Z test statistic is used if the population standard deviation (σ) is known.
T test statistic is used if the population standard deviation (σ) is not known.
ESTIMATE THE OF SE
VALUE EDHYPOTHESIZ - ESTIMATE or t) (z statistictest
Definition
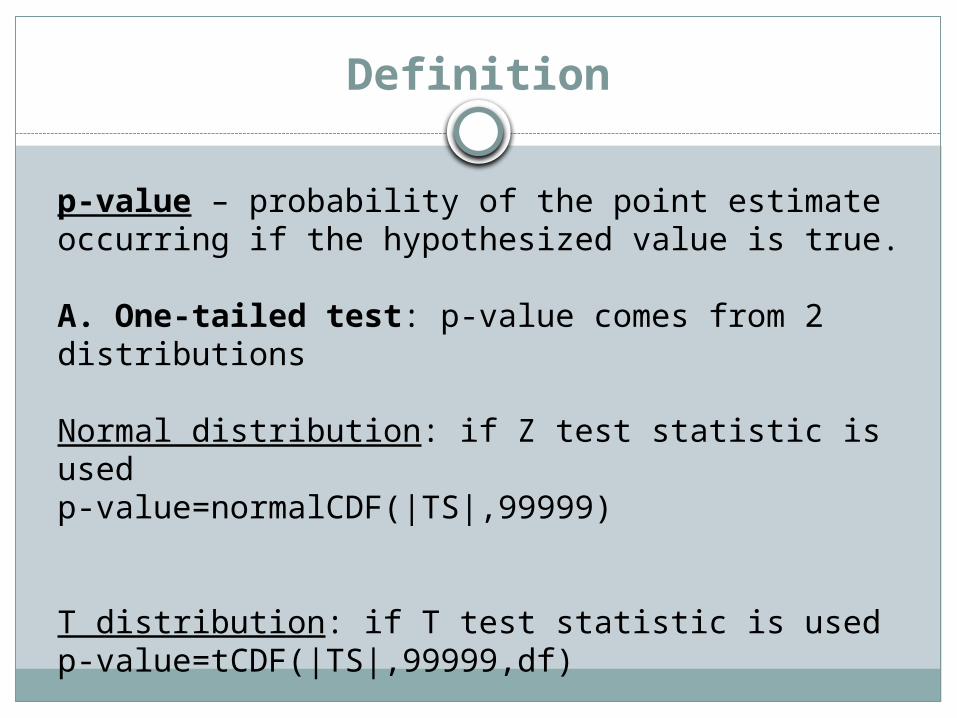
p-value – probability of the point estimate occurring if the hypothesized value is true.
A. One-tailed test: p-value comes from 2 distributions
Normal distribution: if Z test statistic is usedp-value=normalCDF(|TS|,99999)
T distribution: if T test statistic is usedp-value=tCDF(|TS|,99999,df)
Definition
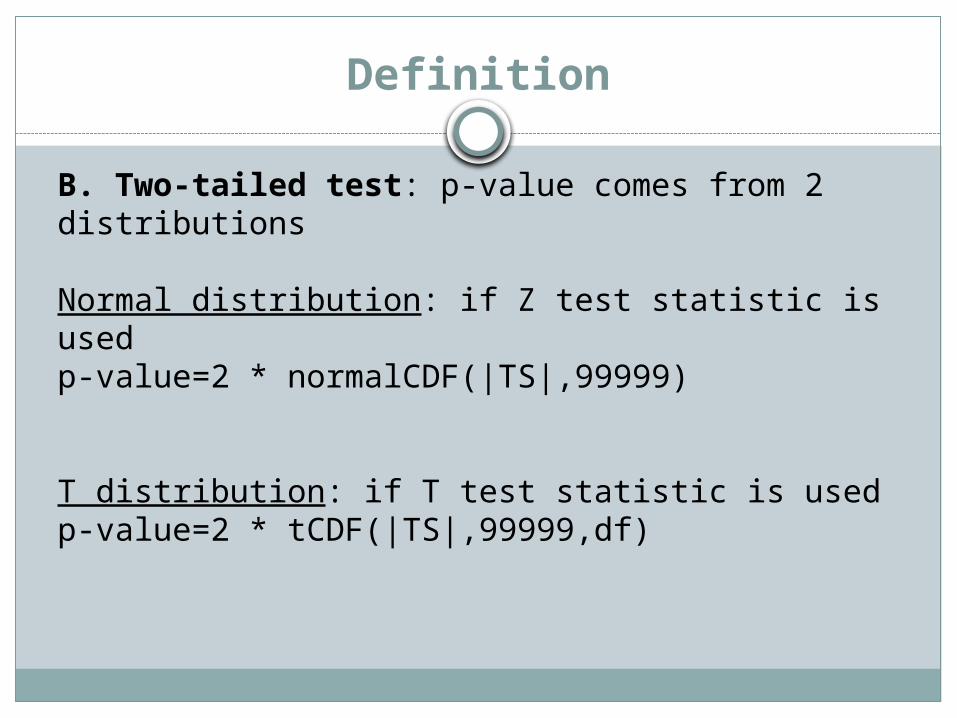
B. Two-tailed test: p-value comes from 2 distributions
Normal distribution: if Z test statistic is usedp-value=2 * normalCDF(|TS|,99999)
T distribution: if T test statistic is usedp-value=2 * tCDF(|TS|,99999,df)
Definition
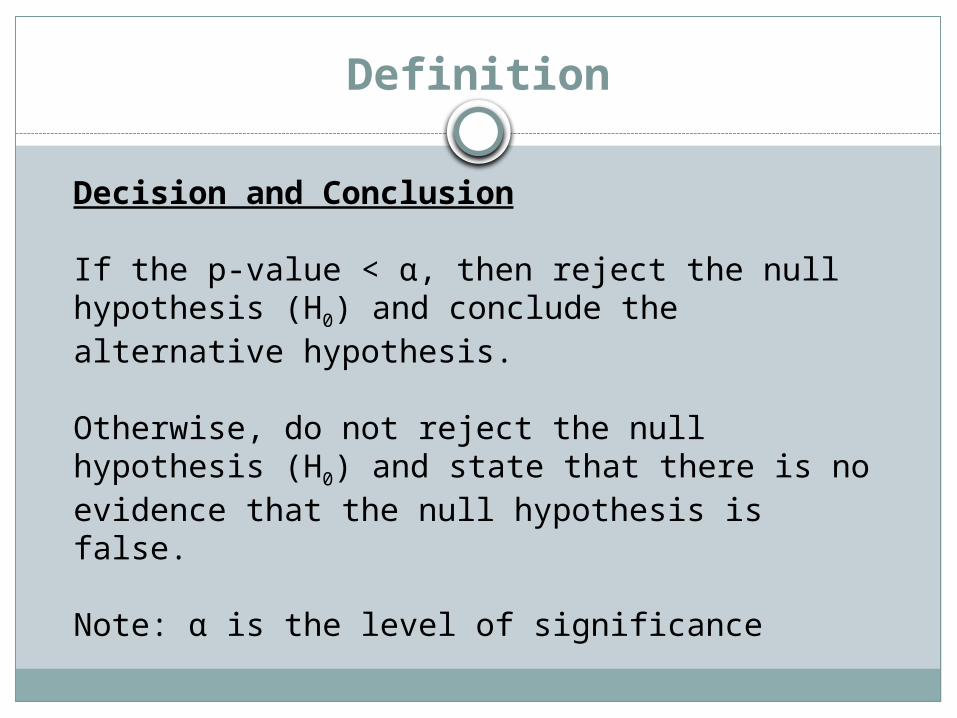
Decision and Conclusion
If the p-value < α, then reject the null hypothesis (H0) and conclude the alternative hypothesis.
Otherwise, do not reject the null hypothesis (H0) and state that there is no evidence that the null hypothesis is false.
Note: α is the level of significance
General procedure
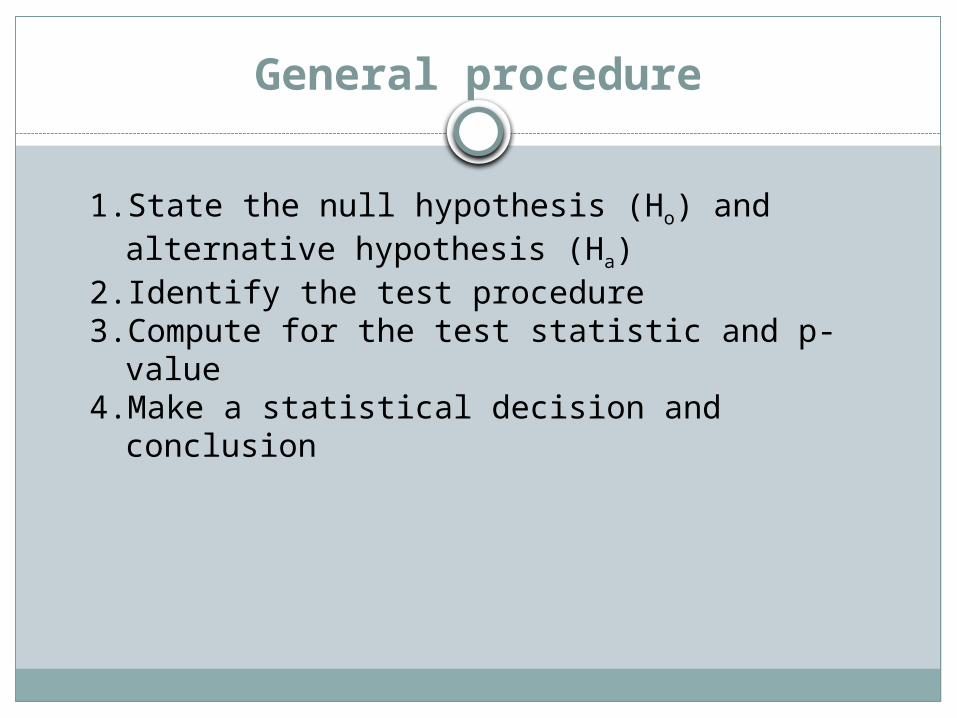
1. State the null hypothesis (Ho) and alternative hypothesis (Ha)
2. Identify the test procedure3. Compute for the test statistic and p-value4. Make a statistical decision and conclusion
1 Sample Mean t-Test
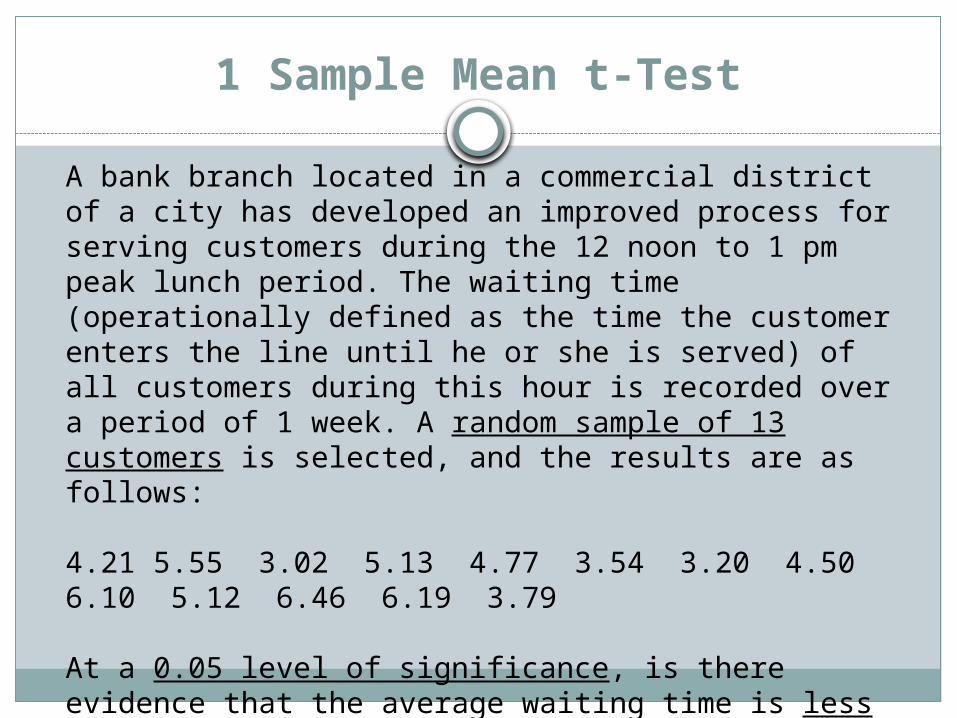
A bank branch located in a commercial district of a city has developed an improved process for serving customers during the 12 noon to 1 pm peak lunch period. The waiting time (operationally defined as the time the customer enters the line until he or she is served) of all customers during this hour is recorded over a period of 1 week. A random sample of 13 customers is selected, and the results are as follows: 4.21 5.55 3.02 5.13 4.77 3.54 3.20 4.50 6.10 5.12 6.46 6.19 3.79 At a 0.05 level of significance, is there evidence that the average waiting time is less than 5 minutes?
1 Sample Mean t-Test
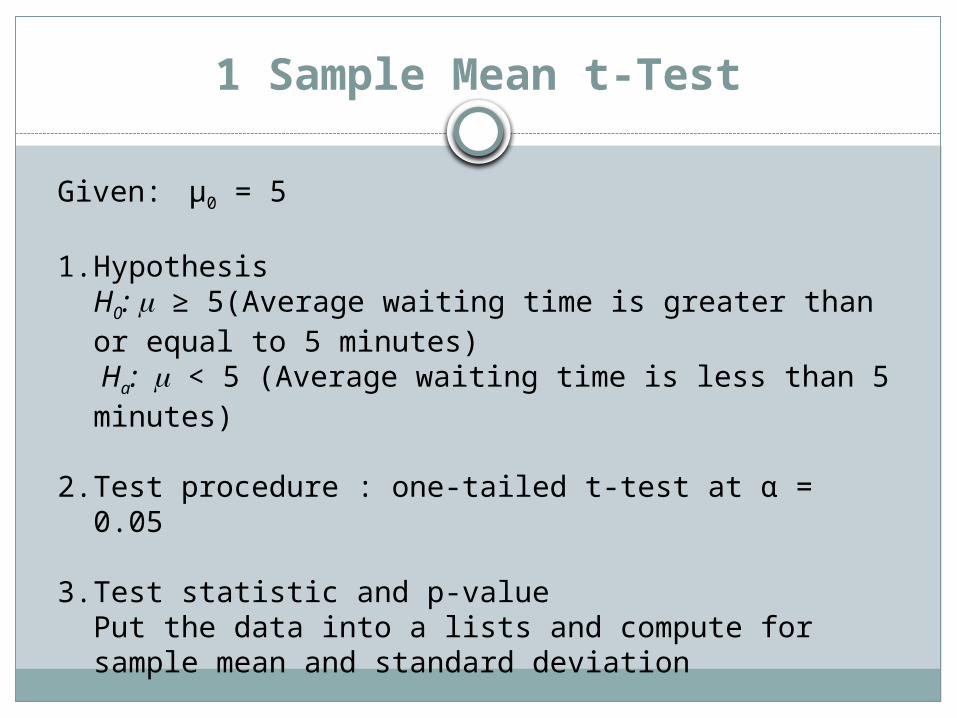
Given: µ0 = 5
1. HypothesisH0: ≥ 5(Average waiting time is greater than or equal to 5 minutes) Ha: < 5 (Average waiting time is less than 5 minutes)
2. Test procedure : one-tailed t-test at α = 0.05
3. Test statistic and p-valuePut the data into a lists and compute for sample mean and standard deviation
1 Sample Mean t-Test
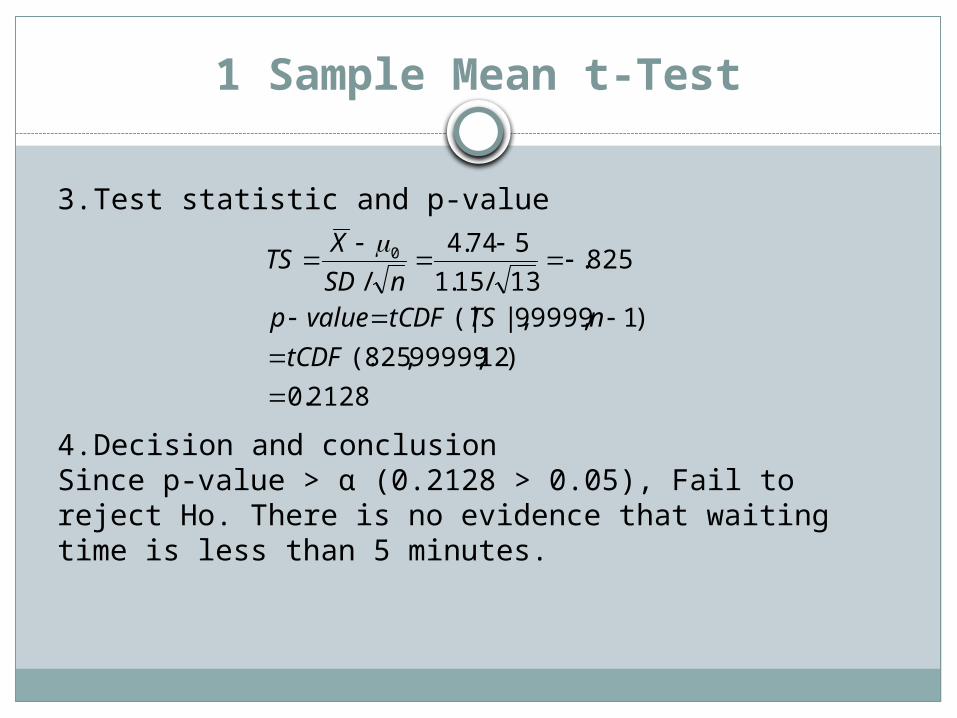
3. Test statistic and p-value
4. Decision and conclusionSince p-value > α (0.2128 > 0.05), Fail to reject Ho. There is no evidence that waiting time is less than 5 minutes.
2128.0
)12,99999,825(.
)1,99999|,(|
825.13/15.1
574.4
/0
tCDF
nTStCDFvaluepnSD
XTS
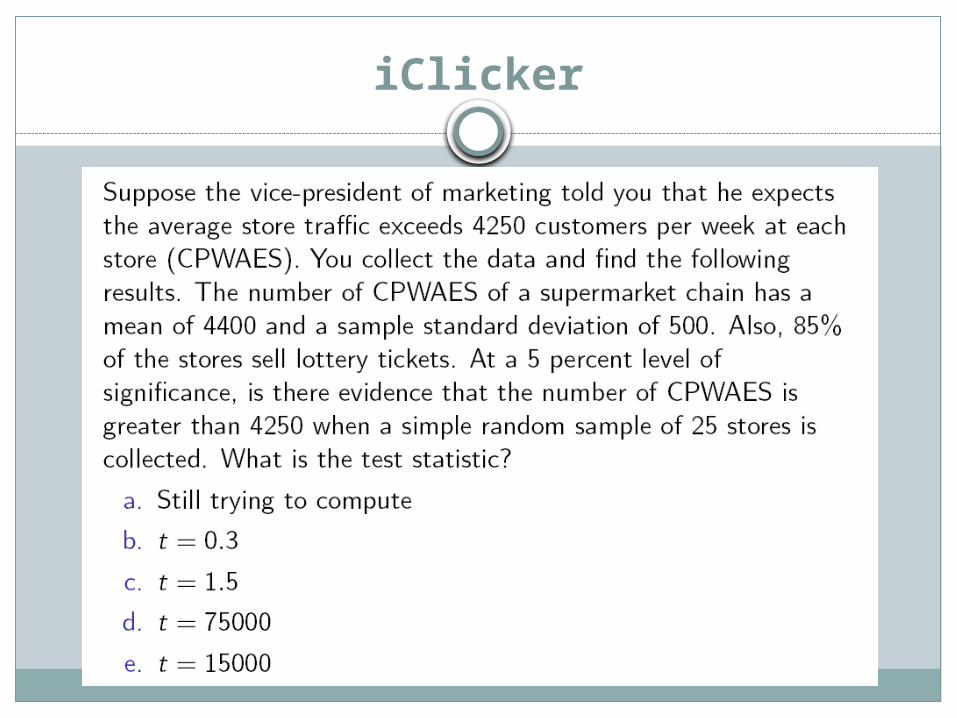
iClicker

1 Sample Mean t-Test
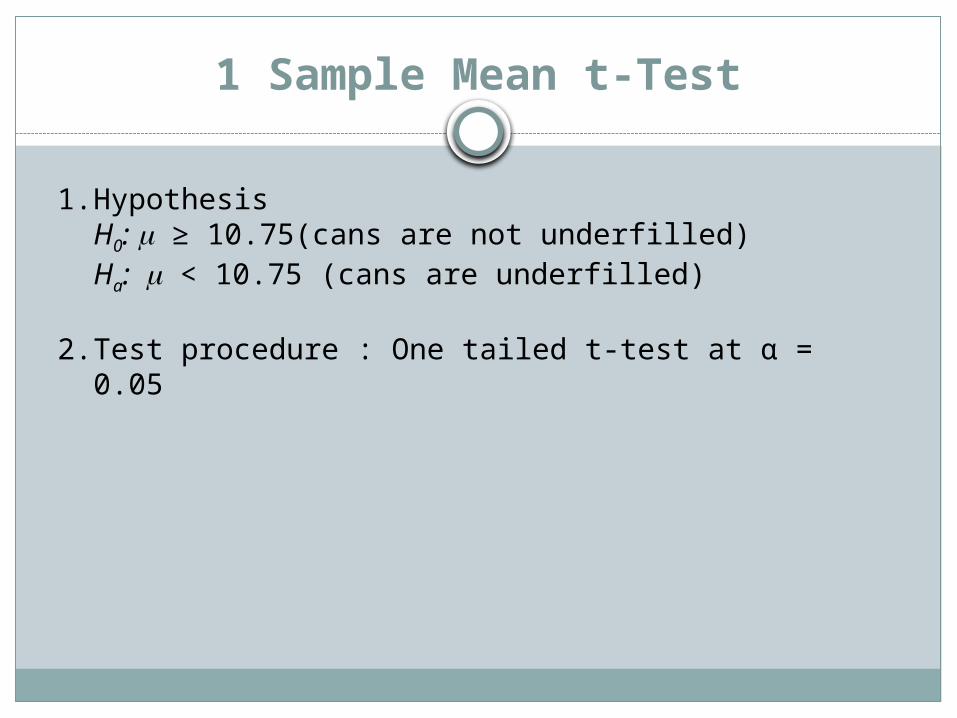
A random sample of 25 cans of infant milk each labeled “Net Weight: 10.75 oz.,” has an average net weight of 10.5 oz. with a standard deviation of 0.3 oz. Does this sample information support the claim of a consumer group that the infant cans are under filled at a 0.05 level of significance? Assume that net weight is normally distributed.
Given:n=25sample mean = 10.5SD = 0.3α = 0.05µ0 = 10.75
1 Sample Mean t-Test
1. HypothesisH0: ≥ 10.75(cans are not underfilled)Ha: < 10.75 (cans are underfilled)
2. Test procedure : One tailed t-test at α = 0.05

1 Sample Mean t-Test
3. Test statistic and p-value
4. Decision and conclusionSince p-value < α (0.000173 < 0.05), reject Ho. The cans of milk are under filled.
000173.0
)99999,167.4(
)99999|,(|
167.425/3.0
75.105.10
/0
tCDF
TStCDFvaluepnSD
XTS
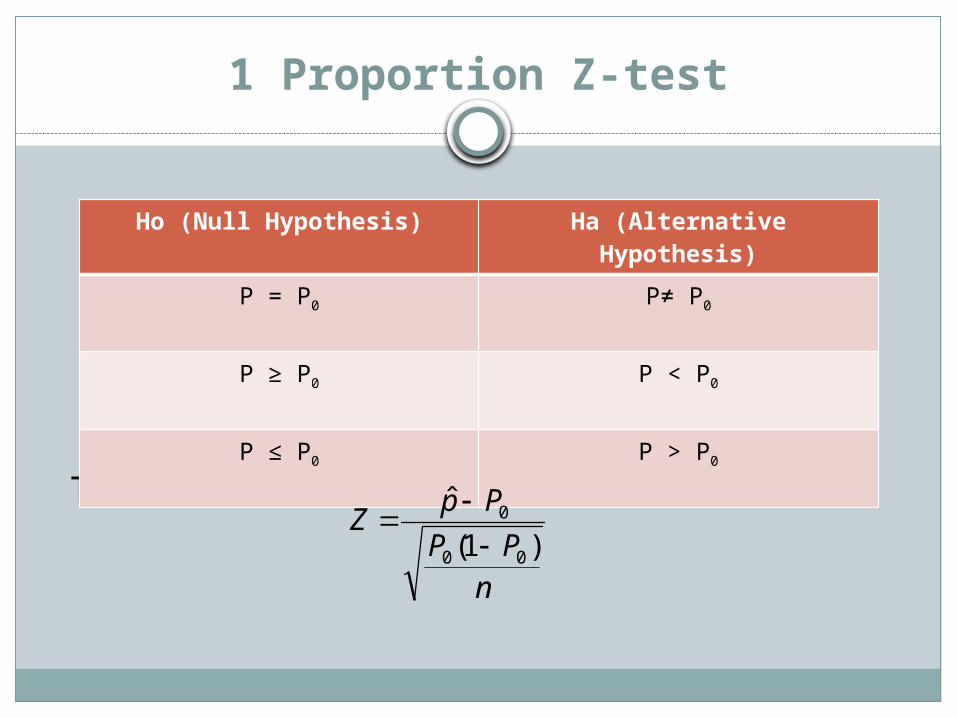
1 Proportion Z-test
Test Statistic:
Ho (Null Hypothesis) Ha (Alternative Hypothesis)
P = P0 P≠ P0
P ≥ P0 P < P0
P ≤ P0 P > P0
nPP
PpZ
)1(
ˆ
00
0

1 Proportion Z-test
The marketing branch of the Mexican Tourist Bureau would like to increase the proportion of tourists who purchase silver jewelry while vacationing in Mexico from its present estimated value of 0.40. Toward this end, promotional literature describing both the beauty and value of the jewelry is prepared and distributed to all passengers on airplanes arriving at a certain seaside resort during a 1-week period. A sample of 500 passengers returning at the end of the 1-week period is randomly selected, and 228 of these passengers indicate that they purchased silver jewelry. At a 0.05 level of significance, is there evidence that the proportion has increased above the previous value of 0.40?
1 Proportion Z-test
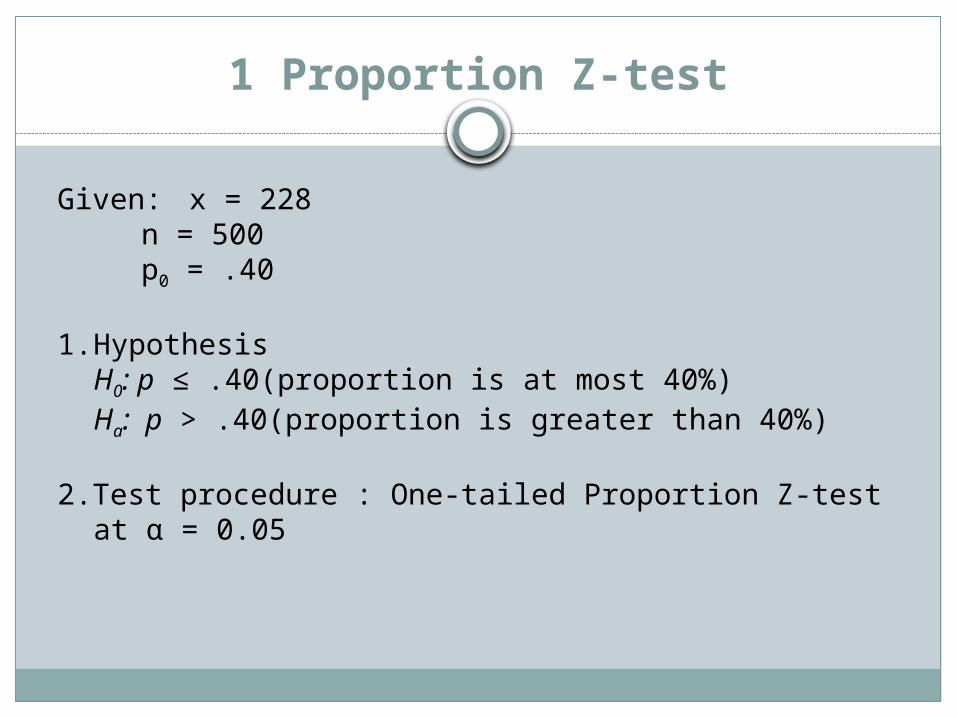
Given: x = 228n = 500p0 = .40
1. HypothesisH0: p ≤ .40(proportion is at most 40%)Ha: p > .40(proportion is greater than 40%)
2.Test procedure : One-tailed Proportion Z-test at α = 0.05

1 Proportion Z-test
3. Test statistic and p-value
4. Decision and conclusionSince p-value < α (0.0053 < 0.05), reject Ho. The proportion of passengers who purchase the silver jewelry is greater than 40%.
0053.0
)99999,56.2(
)99999|,(|
56.2
500)40.1(40.
40.456.
)1(
ˆ 0
normalCDF
TSnormalCDFvaluepnpp
ppTS
1 Proportion Z-test
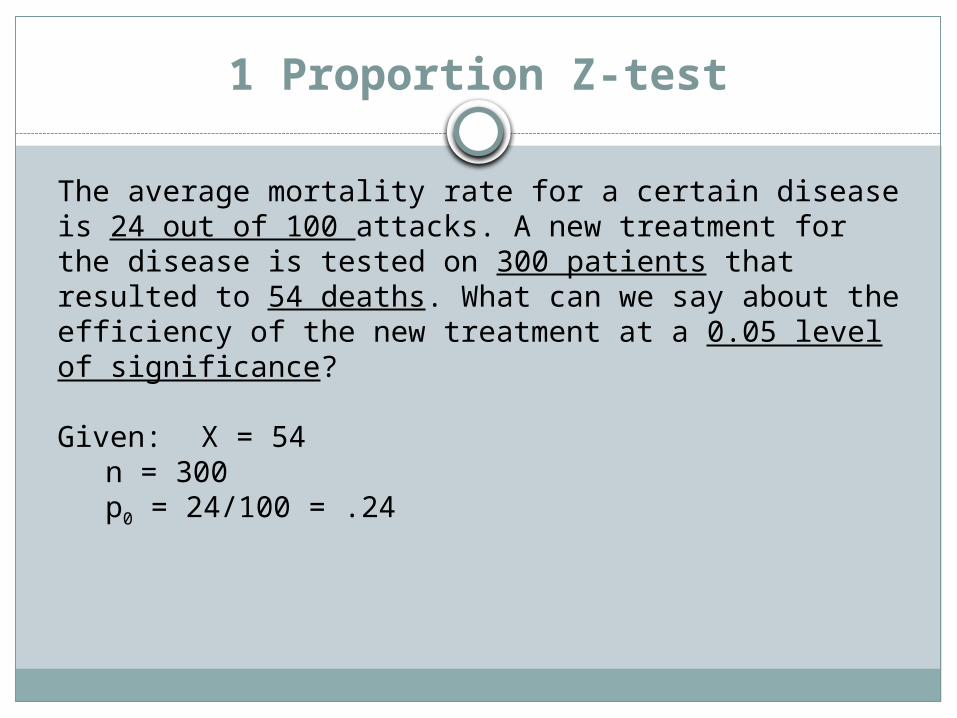
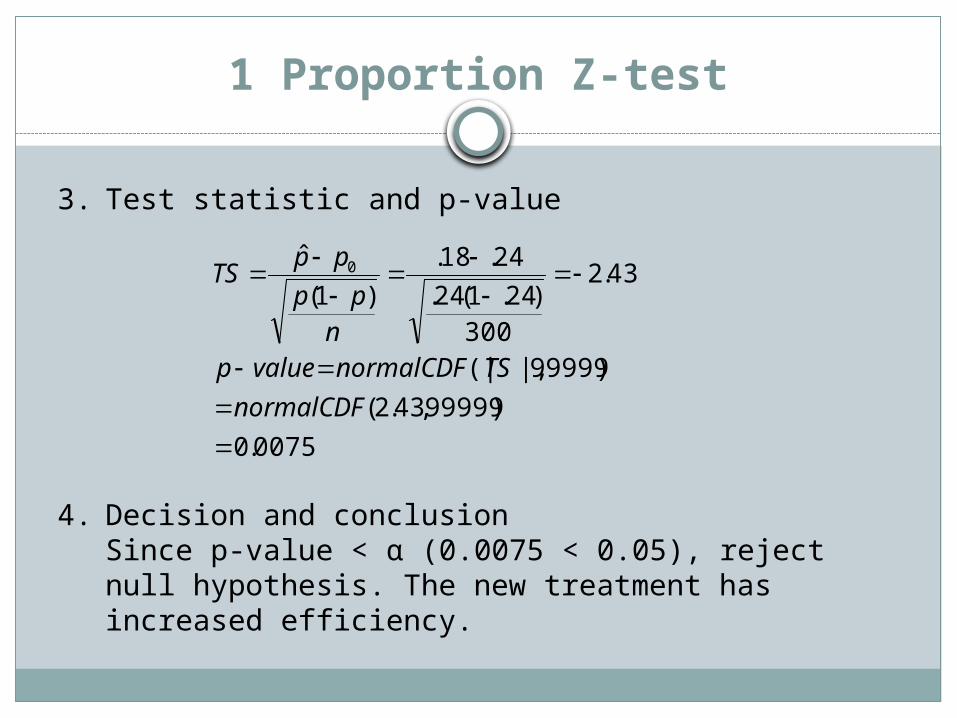
The average mortality rate for a certain disease is 24 out of 100 attacks. A new treatment for the disease is tested on 300 patients that resulted to 54 deaths. What can we say about the efficiency of the new treatment at a 0.05 level of significance?
Given: X = 54n = 300p0 = 24/100 = .24
1 Proportion Z-test
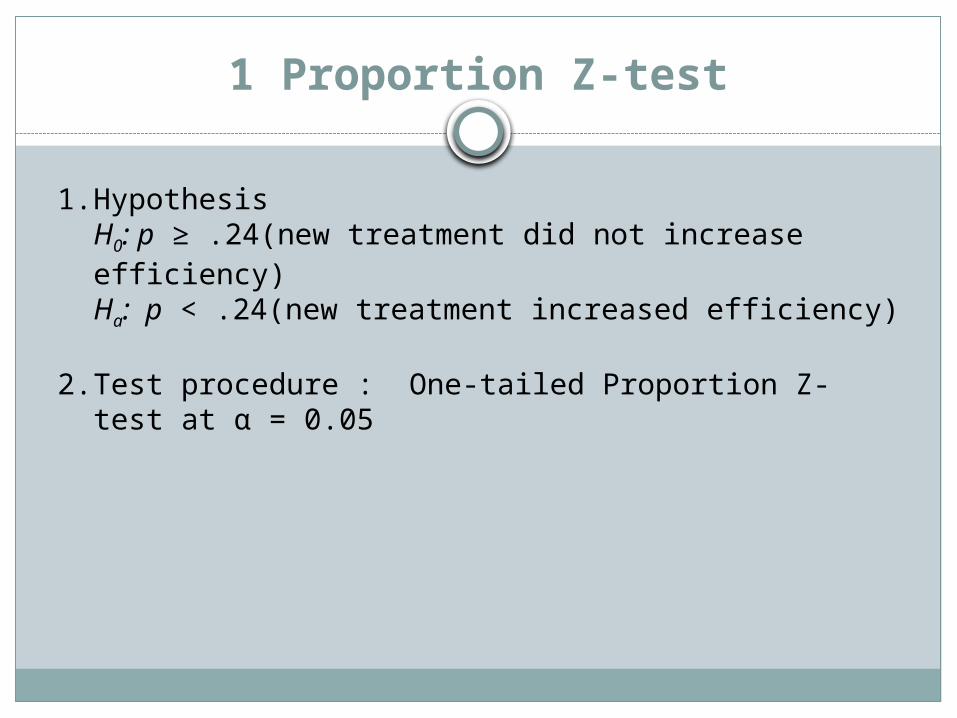
1. HypothesisH0: p ≥ .24(new treatment did not increase efficiency)Ha: p < .24(new treatment increased efficiency)
2. Test procedure : One-tailed Proportion Z-test at α = 0.05
1 Proportion Z-test
3. Test statistic and p-value
4. Decision and conclusionSince p-value < α (0.0075 < 0.05), reject null hypothesis. The new treatment has increased efficiency.
0075.0
)99999,43.2(
)99999|,(|
43.2
300)24.1(24.
24.18.
)1(
ˆ 0
normalCDF
TSnormalCDFvaluepnpp
ppTS
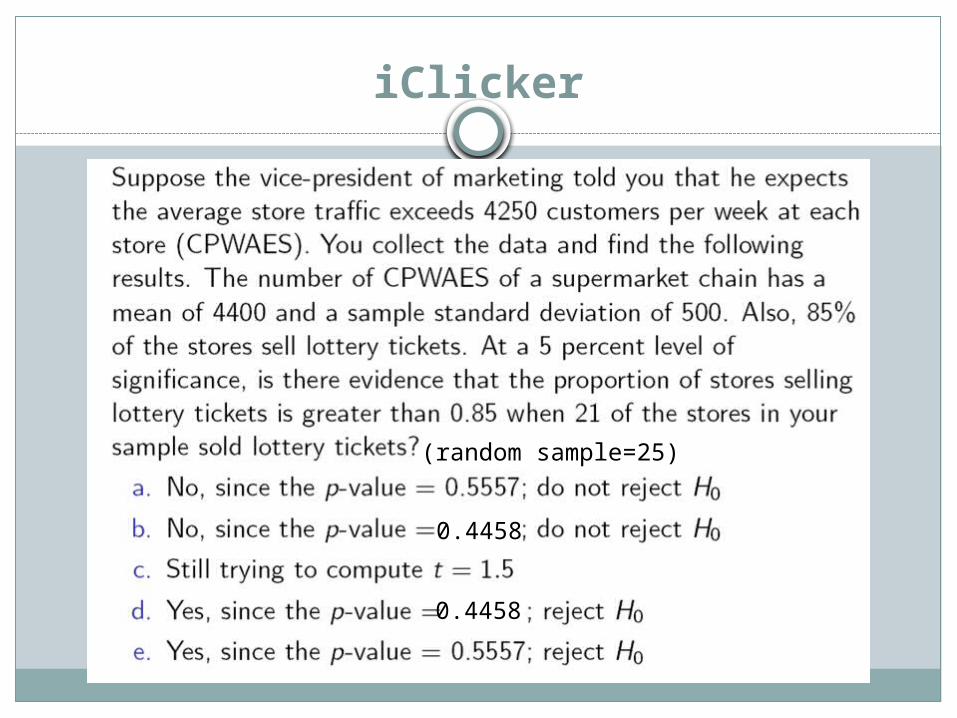
iClicker
(random sample=25)
0.4458
0.4458
2 Independent Sample t-Test
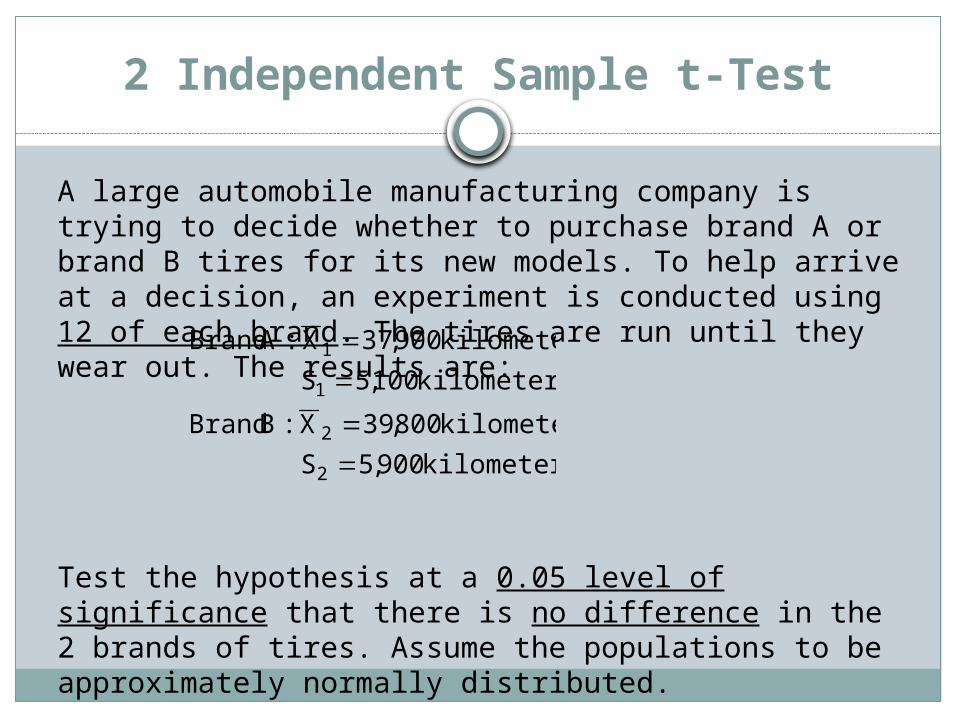
A large automobile manufacturing company is trying to decide whether to purchase brand A or brand B tires for its new models. To help arrive at a decision, an experiment is conducted using 12 of each brand. The tires are run until they wear out. The results are:
Test the hypothesis at a 0.05 level of significance that there is no difference in the 2 brands of tires. Assume the populations to be approximately normally distributed.
kilometers 900,5S
kilometers 800,39X :B Brand
kilometers 100,5S
kilometers 900,37X :A Brand
2
2
1
1
2 Independent Sample t-Test
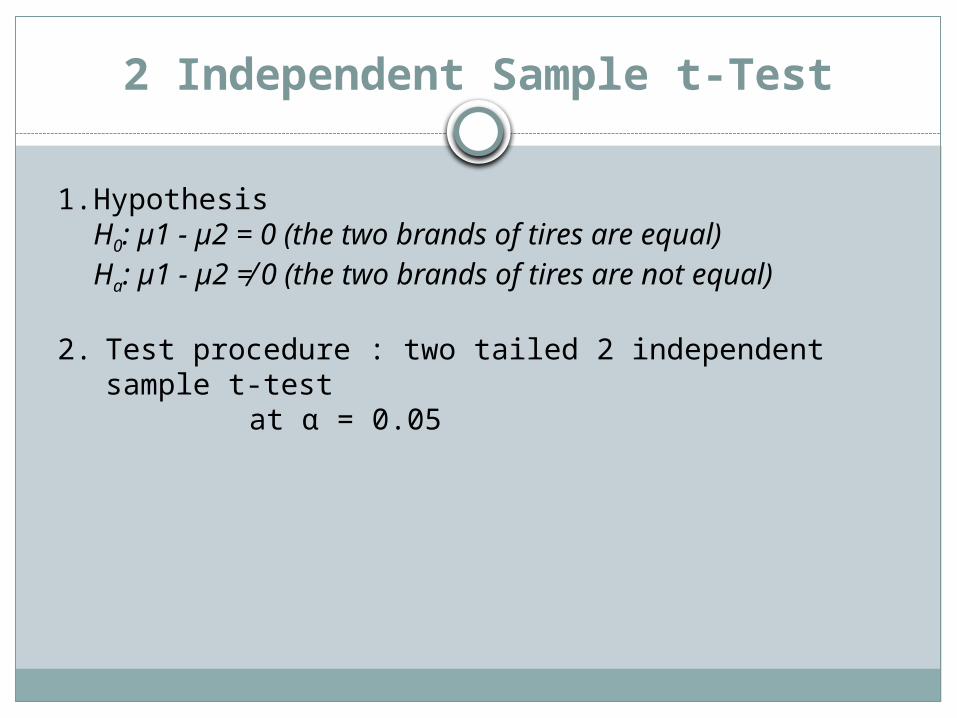
1. HypothesisH0: µ1 - µ2 = 0 (the two brands of tires are equal)Ha: µ1 - µ2 ≠ 0 (the two brands of tires are not equal)
2. Test procedure : two tailed 2 independent sample t-test
at α = 0.05
2 Independent Sample t-Test
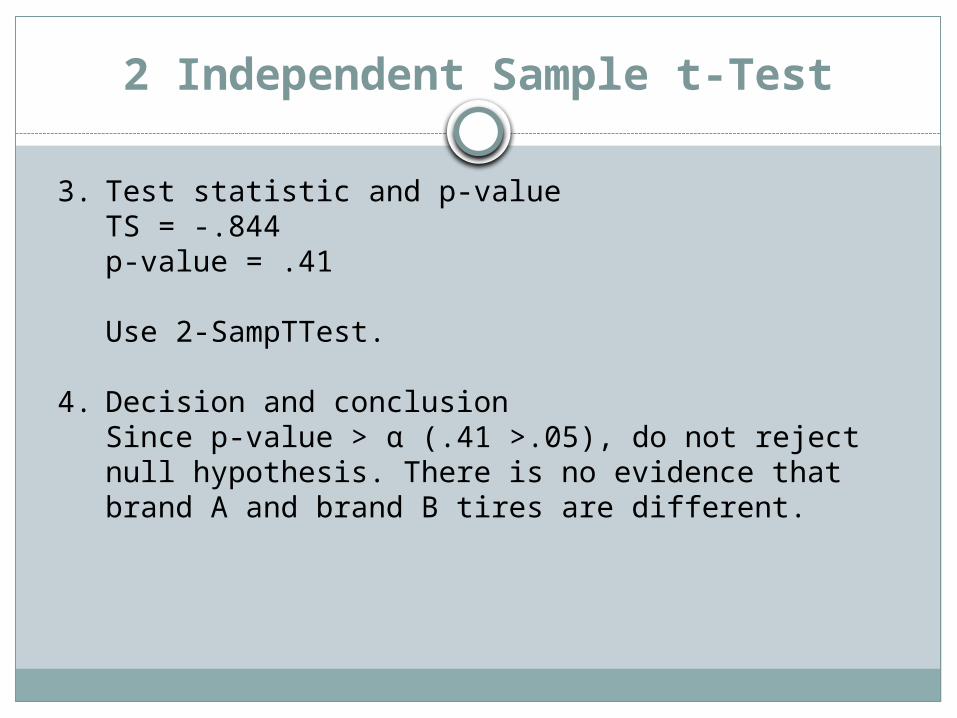
3. Test statistic and p-valueTS = -.844p-value = .41
Use 2-SampTTest.
4. Decision and conclusionSince p-value > α (.41 >.05), do not reject null hypothesis. There is no evidence that brand A and brand B tires are different.
2 Dependent Sample t-Test
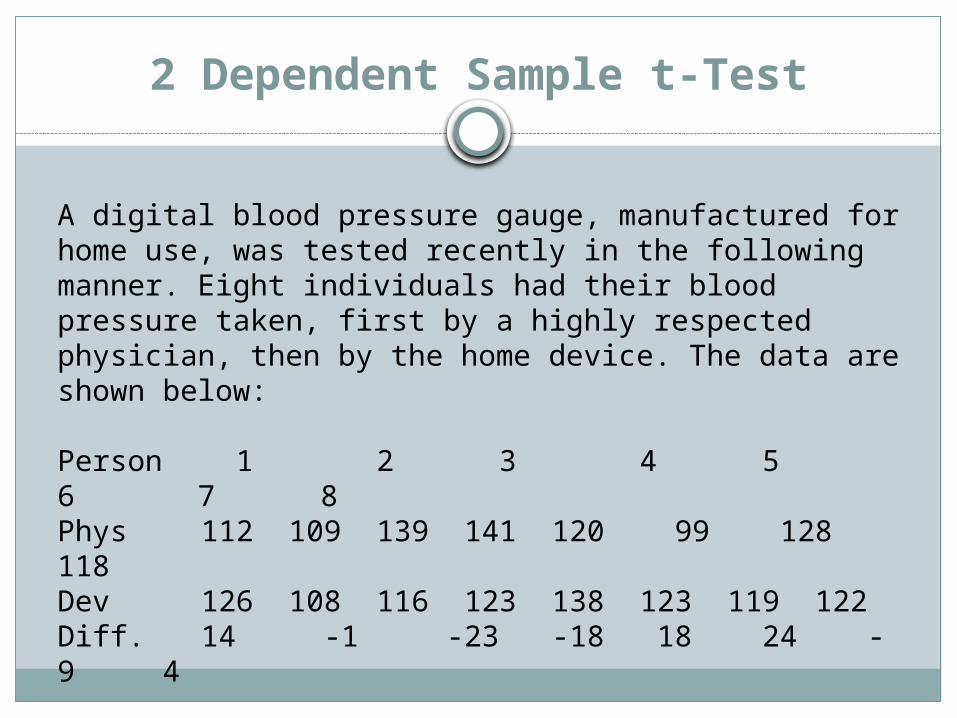
A digital blood pressure gauge, manufactured for home use, was tested recently in the following manner. Eight individuals had their blood pressure taken, first by a highly respected physician, then by the home device. The data are shown below:
Person 1 2 3 4 5 6 7 8Phys 112 109 139 141 120 99 128 118Dev 126 108 116 123 138 123 119 122Diff. 14 -1 -23 -18 18 24 -9 4
Test if the measurements are not equal at 0.05 level of significance.

2 Dependent Sample t-test
1. Hypothesisµdiff = 0 (physician and device have the same accuracy)µdiff ≠ 0 (physician and device does not have the same accuracy)
2. Test procedure: two-tailed 2 dependent sample t-test
3. Test statistic and p-valuePut the data into 2 lists in TI-83/84 and compute for the differences. Conduct a 1 sample t-test on the differences.
2 Dependent Sample t-test
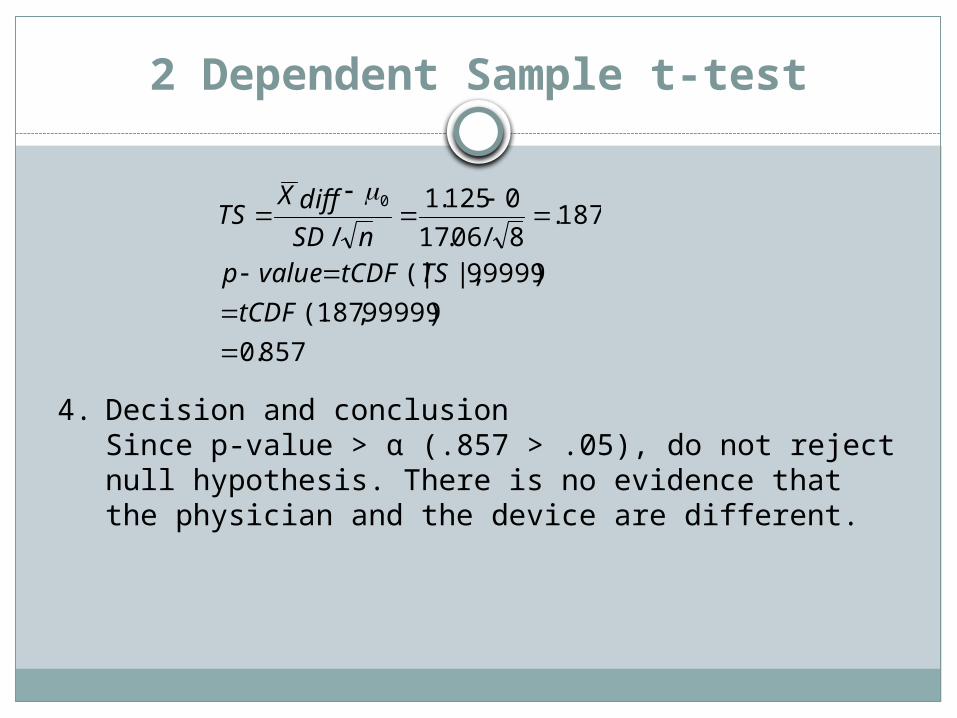
4. Decision and conclusionSince p-value > α (.857 > .05), do not reject null hypothesis. There is no evidence that the physician and the device are different.
857.0
)99999,187(.
)99999|,(|
187.8/06.17
0125.1
/
0
tCDF
TStCDFvaluepnSD
X diffTS
Type of Errors
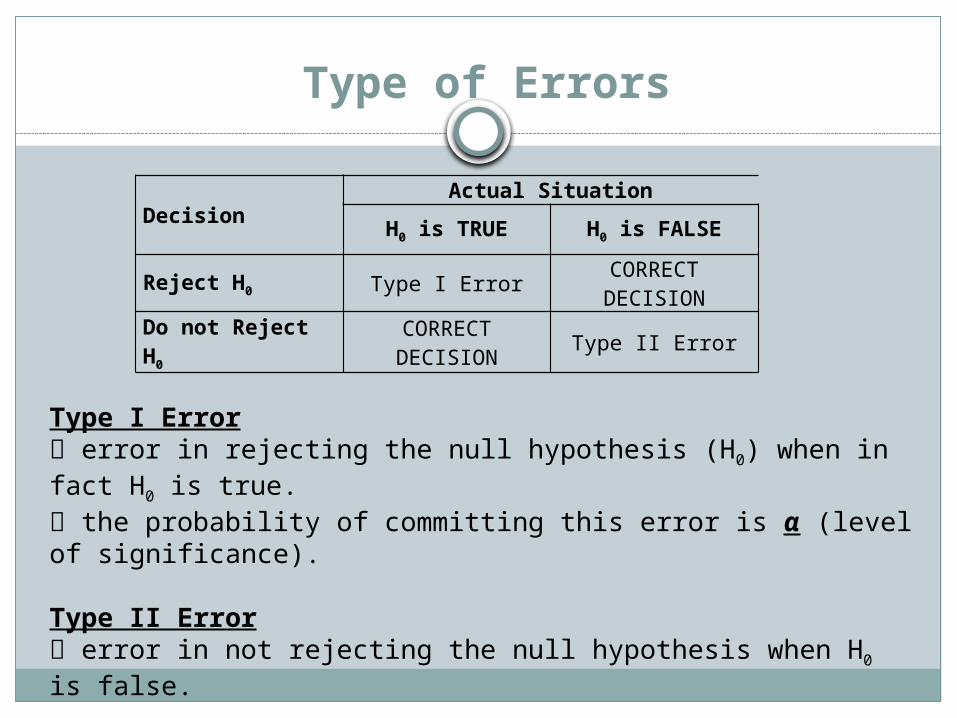
DecisionActual Situation
H0 is TRUE H0 is FALSE
Reject H0 Type I ErrorCORRECT DECISION
Do not Reject H0CORRECT DECISION
Type II Error
Type I Error error in rejecting the null hypothesis (H0) when in fact H0 is true. the probability of committing this error is α (level of significance). Type II Error error in not rejecting the null hypothesis when H0 is false.
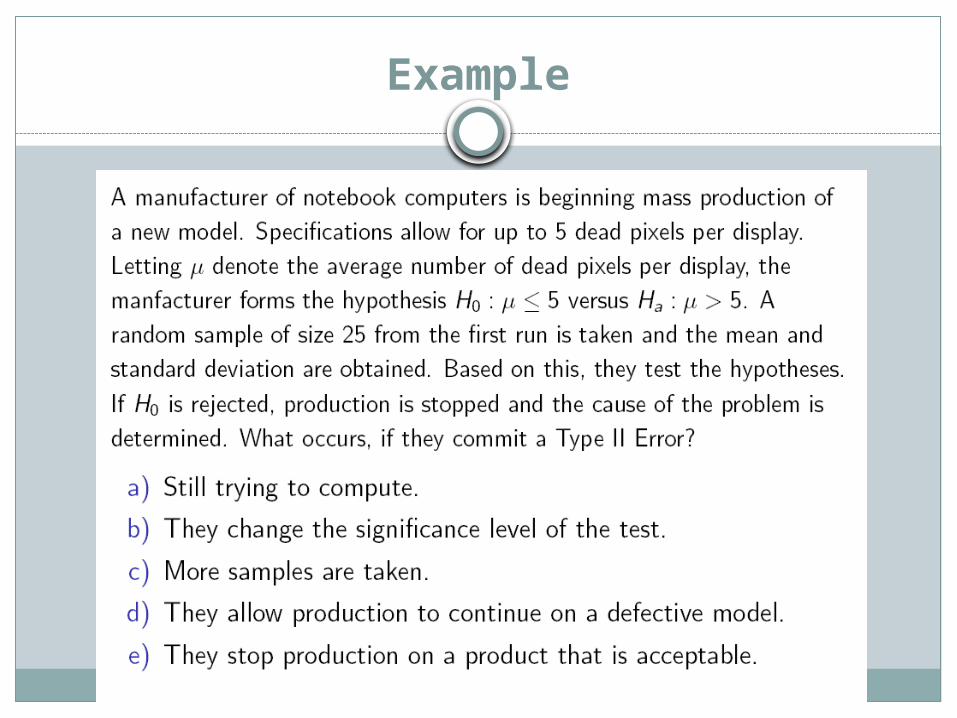
Example