Embed Size (px)
Citation preview
Definition and Applications of a Versatile Chemical PollutionFootprint MethodologyMichiel C. Zijp,*,†,‡ Leo Posthuma,† and Dik van de Meent†,‡
†Department of Sustainability, Environment and Health, National Institute for Public Health and the Environment (RIVM), P.O. Box1, 3720 BA Bilthoven, The Netherlands‡Department of Environmental Science, Radboud University Nijmegen (RUN), P.O. Box 9010, 6500 GL Nijmegen, The Netherlands
*S Supporting Information
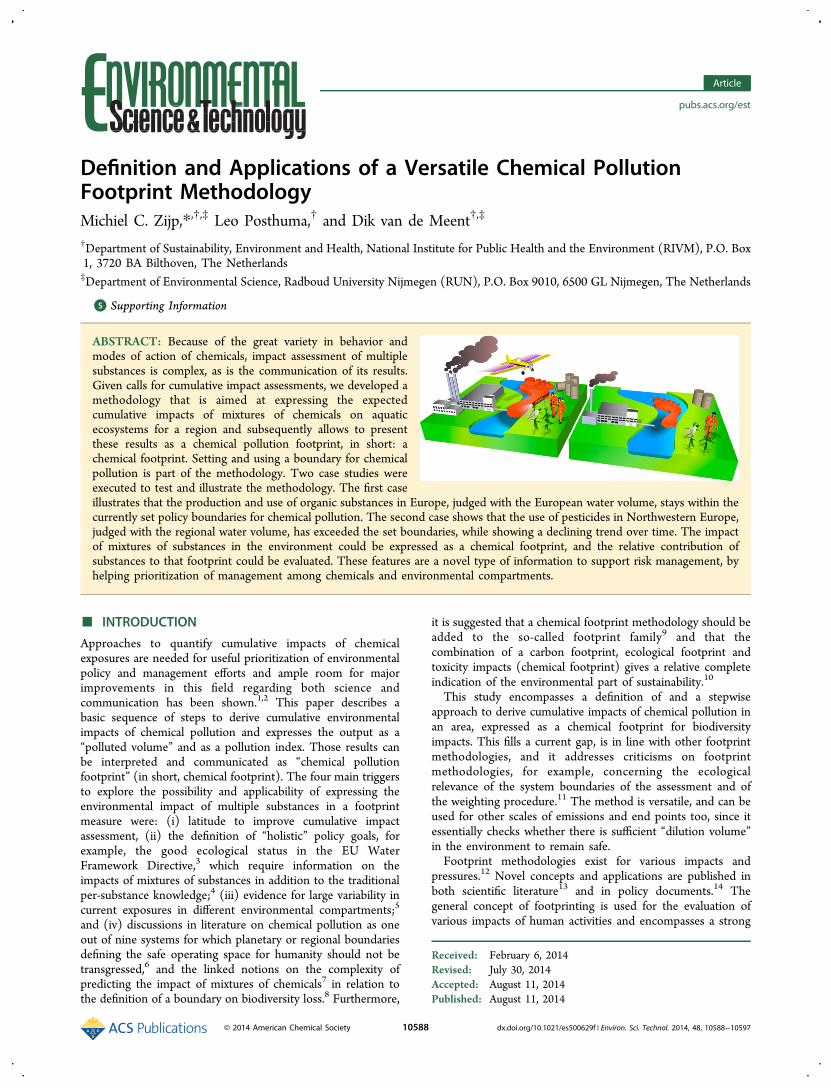
ABSTRACT: Because of the great variety in behavior andmodes of action of chemicals, impact assessment of multiplesubstances is complex, as is the communication of its results.Given calls for cumulative impact assessments, we developed amethodology that is aimed at expressing the expectedcumulative impacts of mixtures of chemicals on aquaticecosystems for a region and subsequently allows to presentthese results as a chemical pollution footprint, in short: achemical footprint. Setting and using a boundary for chemicalpollution is part of the methodology. Two case studies wereexecuted to test and illustrate the methodology. The first caseillustrates that the production and use of organic substances in Europe, judged with the European water volume, stays within thecurrently set policy boundaries for chemical pollution. The second case shows that the use of pesticides in Northwestern Europe,judged with the regional water volume, has exceeded the set boundaries, while showing a declining trend over time. The impactof mixtures of substances in the environment could be expressed as a chemical footprint, and the relative contribution ofsubstances to that footprint could be evaluated. These features are a novel type of information to support risk management, byhelping prioritization of management among chemicals and environmental compartments.
■ INTRODUCTION
Approaches to quantify cumulative impacts of chemicalexposures are needed for useful prioritization of environmentalpolicy and management efforts and ample room for majorimprovements in this field regarding both science andcommunication has been shown.1,2 This paper describes abasic sequence of steps to derive cumulative environmentalimpacts of chemical pollution and expresses the output as a“polluted volume” and as a pollution index. Those results canbe interpreted and communicated as “chemical pollutionfootprint” (in short, chemical footprint). The four main triggersto explore the possibility and applicability of expressing theenvironmental impact of multiple substances in a footprintmeasure were: (i) latitude to improve cumulative impactassessment, (ii) the definition of “holistic” policy goals, forexample, the good ecological status in the EU WaterFramework Directive,3 which require information on theimpacts of mixtures of substances in addition to the traditionalper-substance knowledge;4 (iii) evidence for large variability incurrent exposures in different environmental compartments;5
and (iv) discussions in literature on chemical pollution as oneout of nine systems for which planetary or regional boundariesdefining the safe operating space for humanity should not betransgressed,6 and the linked notions on the complexity ofpredicting the impact of mixtures of chemicals7 in relation tothe definition of a boundary on biodiversity loss.8 Furthermore,
it is suggested that a chemical footprint methodology should beadded to the so-called footprint family9 and that thecombination of a carbon footprint, ecological footprint andtoxicity impacts (chemical footprint) gives a relative completeindication of the environmental part of sustainability.10
This study encompasses a definition of and a stepwiseapproach to derive cumulative impacts of chemical pollution inan area, expressed as a chemical footprint for biodiversityimpacts. This fills a current gap, is in line with other footprintmethodologies, and it addresses criticisms on footprintmethodologies, for example, concerning the ecologicalrelevance of the system boundaries of the assessment and ofthe weighting procedure.11 The method is versatile, and can beused for other scales of emissions and end points too, since itessentially checks whether there is sufficient “dilution volume”in the environment to remain safe.Footprint methodologies exist for various impacts and
pressures.12 Novel concepts and applications are published inboth scientific literature13 and in policy documents.14 Thegeneral concept of footprinting is used for the evaluation ofvarious impacts of human activities and encompasses a strong
Received: February 6, 2014Revised: July 30, 2014Accepted: August 11, 2014Published: August 11, 2014
Article
pubs.acs.org/est
© 2014 American Chemical Society 10588 dx.doi.org/10.1021/es500629f | Environ. Sci. Technol. 2014, 48, 10588−10597
communicative element. Since the introduction of the term“ecological footprint” in 1992,15 footprint methodologies onmore than 26 environmental issues have been developed, ofwhich the ecological footprint, the water footprint, the carbonfootprint and the energy footprint are the most frequentlyused.9 In general, a footprint has been defined as12 “Aquantitative measure describing the appropriation of naturalresources by humans”. Appropriation refers to the centralprinciple of footprints that all natural resources necessary tosupport the human activities under consideration should beincluded. Specified for the chemical footprint we propose thefollowing definition (based on Environmental Space Theory16
and the Grey Water Footprint17):A quantitative measure describing the environmental spaceneeded to dilute chemical pollution due to human activitiesto a level below a specified boundary condition.
Conceptually, such boundary conditions can be related toclassically used environmental quality standards as applied inpreventive chemical regulations18 or to impacts observed orestimated in ecosystems, for example, tipping points.19
Chemical footprinting has been discussed in literature for awhile17,20,21 (see Supporting Information). Apart from single-chemical footprints such as proposed by Hitchcock et al.21,22
and pressure-focused chemical footprints such as the GreyWater Footprint,17 the chemical footprint of impacts due tocumulative emissions to an area is novel, especially regardingthe boundary condition.20 By combining earlier works incumulative impact analyses23,24 with ecological analyses andboundary proposals, we now propose a comprehensive versatilemethodology to derive a chemical footprint.The methodology proposed here consists of classical
elements of chemical risk assessment (emission analysis, singlecompound exposure assessments and effects assessments),expanded with mixture impact assessment and quantitativeapproaches for defining the boundary condition and “environ-mental space occupied”. Mixture toxic pressure was quantifiedas multisubstance potential affected fraction of species(msPAF),25,26 which closely relates to biodiversity im-pacts.27−29 Others already used this method to predictecological impacts of 343 high production volume chemicalsand of the use of pesticides in the combined catchments of therivers Rhine Meuse and Scheldt (RMS) the RMS catch-ment.23,24
Building forth on this work, and in line with general footprintdefinitions and considerations on protective chemical policiesand boundaries for the safe operating space of humanity, theaims of this study are (i) to propose a versatile methodology toexpress the expected ecotoxicological impact of a mixture ofsubstances in the environment, and express the results as achemical footprint; (ii) to apply the methodology in two case
studies; and (iii) to discuss the results and explore its usabilityfor policy.
■ METHODS
Calculation Procedure. The aforementioned definition ofa chemical footprint encompasses the elements of (1) exposureassessment, (2) impact assessment, (3) the boundary condition,and (4) the dilution volume needed to reach the set boundarycondition. Given these elements, the developed chemicalfootprint methodology consists of the following procedure:(1) target and scope, define compounds and areas of interest;(2) quantification of emissions, quantify emissions to theenvironment (unit, g); (3) quantification of the aquaticexposure to chemical pollution (units g/L); (4) quantificationof the ecological impact because of chemical pollution (unit, %of species affected); (5) quantification of chemical pollutionboundary (unit, % of species affected); (6) express the resultsas footprint (unit, m3), or as an index, relative to a selectedavailable environmental space (unit-less).The technical design of the procedure’s individual steps
comprises both existing methodologies and new elements, asdetailed below.
1. Target and Scope. The target and the scope of theassessment must be chosen. This determines the conditions forthe following steps, and it is key to the final interpretation. Thefollowing four types of questions delineate the assessment andthe footprint interpretation generated: (i) Which humanactivity is under consideration? Is the object, for example, achemical, a product, a region or a policy measure. (ii) Whatquestion is to be answered? Is the required outcome absolute,for example, what is the impact of an activity? Or is it relative,for example, which chemicals/activities/sectors/etc. contributemost to the total impact? Or how does the impact change overtime, given altered use patterns, related to policy measuresplanned or taken. (iii) What are the system boundaries of theactivity? For example, which phases of the chemicals life cycleare included (raw material extraction, production, use,disposal)? Or what is the spatial scale of the activity? Is itlocal, regional, worldwide, or organizational, and what is thetemporal scale of the activity, for example, seasonal and yearly.(iv)What are the receptor end points (e.g., biodiversity), and onwhich scale are the end point impacts considered? Does theassessment address ecological integrity in water, soil, sedimentor air, and on a local, regional, or global scale?
2. Quantification of Emissions. Next, the amounts ofchemical substances, released into the environment as a resultof the activity considered, within the set scope of theassessment, need to be quantified (E in g year−1). To focusthe assessment and limit data gaps it could be considered toinclude only a smart selection of the original list of substancesin the assessment, for example only the chemicals with the
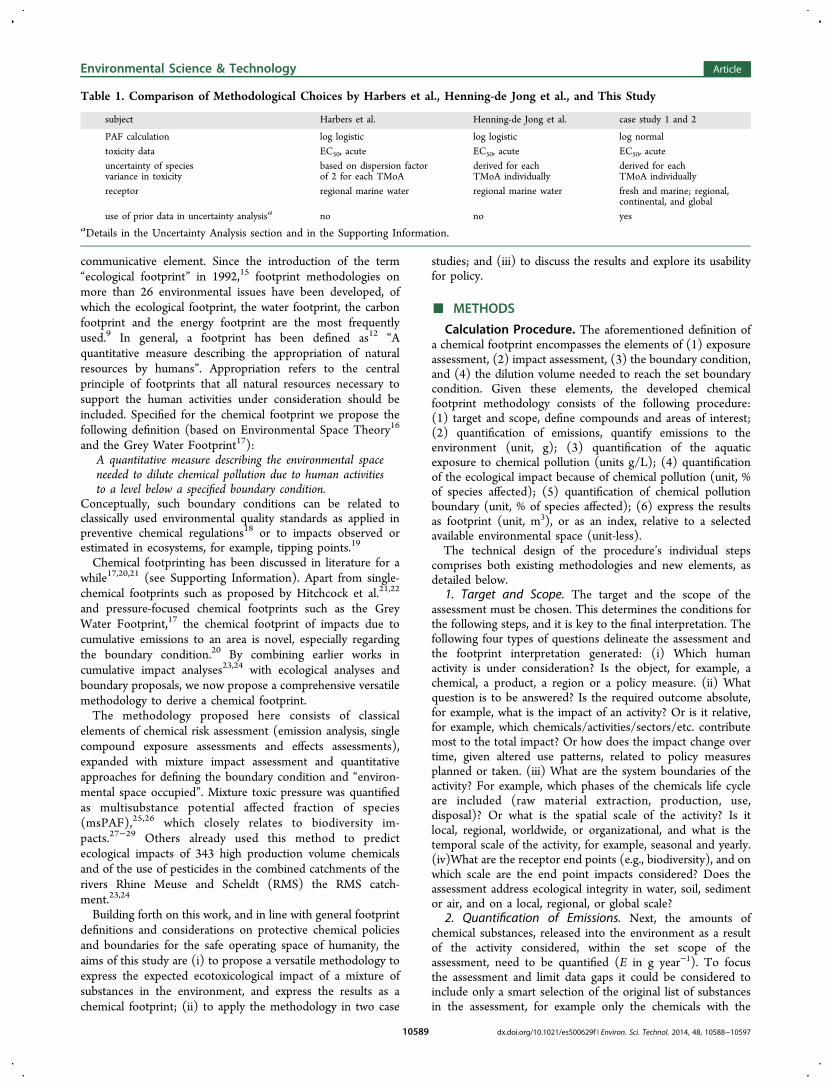
Table 1. Comparison of Methodological Choices by Harbers et al., Henning-de Jong et al., and This Study
subject Harbers et al. Henning-de Jong et al. case study 1 and 2
PAF calculation log logistic log logistic log normaltoxicity data EC50, acute EC50, acute EC50, acuteuncertainty of speciesvariance in toxicity
based on dispersion factorof 2 for each TMoA
derived for eachTMoA individually
derived for eachTMoA individually
receptor regional marine water regional marine water fresh and marine; regional,continental, and global
use of prior data in uncertainty analysisa no no yesaDetails in the Uncertainty Analysis section and in the Supporting Information.
Environmental Science & Technology Article
dx.doi.org/10.1021/es500629f | Environ. Sci. Technol. 2014, 48, 10588−1059710589
highest volumes23 and most hazardous characteristics.30 Inpractice, emissions often need to be estimated by application ofuse- and substance-specific emission factors (EF),31 becausemeasurements are often not available for all the chemicals andgeographical scales relevant for the assessment. Productionvolumes may be available, although not always accessible(confidential), for example, from REACH dossiers.3. Quantification of the Exposure. The concentrations of
the released substances in the different receptor compartmentson different geographical scales ([C] in g l−1) need to beestimated. Multimedia fate models were developed and areapplied for this purpose since 1978.32 These models generatesteady state concentrations in various environmental compart-ments, given compartment and compound characteristics. Theresults of the model can be validated with field data. Whenthese are not available, transparent reporting of model choices,input and output, accompanied by uncertainty and sensitivityanalysis becomes essential according to Good ModelingPractice Guidelines proposed by Buser et al.33 In the casestudies, we built forth on earlier studies23,24 without majorchanges (Table 1). We used the nested multimedia massbalance model SimpleBox34 to estimate compartment concen-trations.4. Quantification of Ecological Impact. Mixture toxic
pressure was derived from the concentration data using themixture models developed by De Zwart and Posthuma,25 usingEC50 data (acute), because EC50 values have been shown torepresent actual damage in aquatic ecosystems.27−29 Furtherdetails are described elsewhere23,25,26 and in the SupportingInformation. Differences with earlier studies23,24 are summar-ized in Table 1. Major differences are the use of log-normalinstead of log-logistic SSDs and the calculation of theuncertainty of species variance in toxicity. Lognormal SSDswere preferred above the log-logistic distribution functionsbecause of reasons summed by van Zelm et al.:35 abundant usein many scientific fields, the central limit theorem and thephenomenon that the use of a log-logistic distribution functioncan result in unrealistic effect factor values. The uncertainty ofspecies variance in toxicity was calculated per toxic mode ofaction (TMoA) like in Henning-de Jong et al., while Harbers etal. assumed a dispersion factor of 2 for each TMoA.5. Quantification of Chemical Pollution Boundaries.
Adriaanse16 mentioned two elements needed to evaluateappropriation of natural resources: (1) a sustainability level orpolicy target expressing which impact is still acceptable (alsoreferred to as a boundary for chemical pollution,6,36 and as“carrying capacity” by Sala et al.20) and (2) the amount of“environmental space” of the system under consideration.A boundary for chemical pollution is ideally based on natural
thresholds that express the vulnerability of an ecosystem.7,8,36,37
The safe boundary must be below such a threshold, in order toaccount for uncertainties and other stressors, to eventuallyprevent impacts. As such, the boundary concept encompassesboth science (thresholds) and value judgment. In our case theboundary should be expressed as the fraction of species abovewhich ecosystems are expected to be affected by chemicals toan irreversible extent (msPAFmax). The use of such a boundaryfor footprint exercises has recently been mentioned by Fang etal.,9 Sala and Goralczyk,20 and Posthuma et al.36 but has not yetbeen applied. Examples of ecosystem vulnerability basedthresholds are present in literature, for example, an analysisof food webs by Isbell and Loreau38 resulted in their discussion
statement that complete restructuring of marine food webs canappear when one in four species are affected.As an alternative for an ecosystem vulnerability based
boundary (further referred to as natural boundary), there isno conceptual argument against expressing the footprint basedon boundaries defined in chemical management policies(further referred to as policy boundary), acknowledging thatsuch a boundary is aimed to be lower than expected naturalthresholds. The case studies illustrate the use of both boundarytypes.The policy boundary used here is based on the policy
criterion known as the 95%-protection level and is derived froma statistical distribution of species sensitivities (speciessensitivity distribution, SSD) based no effect concentrations(NOEC) derived in chronic ecotoxicity studies, also named theHC5 (hazardous concentration for 5% of the species). Becausethe technical footprint derivation was based on SSDs as derivedfrom acute EC50-data instead of NOEC data, we recalculatedthe HC5 to an EC50 based value. The technical details can befound in the Supporting Information. This resulted in aboundary of 0.1%, which we applied as EC50-based policyboundary equal to the NOEC-based 95%-protection principle.The natural boundary we applied was derived from aquatic
food web models. Mulder et al.39 describe how food webstructures of fish assemblages in surface waters are affected bydifferent sequences of deletions of species. They described atwhich fraction of primary deletions (direct local extinction ofspecies caused by the pressure) secondary deletions (localextinction of species caused by the extinction of other species)occurred. We took the level of pressure at which no secondary(indirect) deletions occur in any of the studied food webs as anexample of a natural boundary. Given a high variance the lowestvalue was 3% (Table 5 in ref 39).In short, the footprint methodology requires setting of
boundaries, for which we used respectively 0.1% of the speciesaffected at EC50 level and 3% of the species deleted asillustrations of a policy and a natural boundary.
6. Express Results as Footprint. To derive the footprintfrom the impact predictions across compartments, impacts invarious environmental media at various spatial scales need beaggregated into one number that expresses the overallecological impact of the production and use of chemicals forthe scope. We propose to aggregate the calculated mixture toxicpressures over the compartments for which the footprint is tobe calculated (scope) by means of weighting. Two possibleways to do the weighting come to mind, viz. by volume of thecompartments or by species richness. Because impact isexpressed as potential affected fraction of species in a speciesassemblage, weighting by species richness would intuitively be alogical first choice. Literature estimates for species richness inmarine and fresh water can be found on world level,40 but noton the different scales needed for this study, so this option wasnot applied in the case studies. As second option, goodestimates of compartment volumes are available, and these werethus used in the case studies, acknowledging that the higherspecies variability of fresh water compared to marine water isnot taken into account.41 Since distribution of substancesreaching the ocean will in the first instance be limited to theupper layer, only the first 200-m (photic zone) of the oceanswas taken into account.The volume-weighted mixture toxic pressure (msPAF, % of
species) was calculated by
Environmental Science & Technology Article
dx.doi.org/10.1021/es500629f | Environ. Sci. Technol. 2014, 48, 10588−1059710590
=∑ ·
∑∑msPAFmsPAF Volume
Volumess s
s (1)
in which Volumes are the volumes of the compartments ondifferent geographical scales (s).Given compartment-specific exposures, impacts, a defined
boundary, and known compartment volumes, all necessary dataare available to calculate the environmental space filled up tothe boundary by emissions from a source area, or with otherwords, the chemical footprint (ChF)
= = ·∑ESChFmsPAF
msPAFES
sused
maxtotal
(2)
in which msPAFmax (% of species) is the maximum acceptableimpact (the boundary), EStotal is the total environmental space(here km3) in which the impact takes place (specified under thescope) and ESused the calculated environmental space needed(here km3) to dilute the calculated impact to a level below themsPAFmax. For a scope considering the footprint of a singlecompartment, the formula boils down to the ratio of calculated-and maximum affected fraction, multiplied by volume.Note that the footprint can easily be converted in a chemical
pollution index, by dividing the occupied volume by theavailable volume, so that index values >1 indicate boundaryexceedance.Case Studies. The methodology was applied in two case
studies, to illustrate technical feasibility, the kind of results itprovides and how those results can be interpreted and used.Organics in Europe. The first case study aimed to derive the
footprint of the production and use of monoconstituent organicchemicals in Europe, given the impact of the resultingemissions worldwide, and to derive the relative contributionsof these chemicals to the net impact. Emissions of thechemicals during the production, the use and the disposal phasewere taken into account, under the assumption that chemicalsproduced in Europe, are also used and disposed in Europe.Emissions of other substances which may be used in the lifecycle of these chemicals (e.g., in their production phase) werenot taken into consideration. Production volumes as knownfrom REACH registration dossiers submitted with the Euro-pean Chemical Agency (ECHA) were used. At the time of thisstudy, dossiers had been submitted for over 6000 differentchemical substances. Anonymized emission summary data were
used, given data confidentiality issues and the purpose ofmethod illustration. Per April 2011, registration dossiers helddata on production and use in Europe of 873 so-calledmonoconstituent organic substances. Their cumulative marketvolume was 190 million ton, ranging from 19 million to 1 tonfor individual substances. Because reliable toxicity data was notavailable for all these substances, we focused this study on 630substances, representing 95% of the total production volume inthis category of chemicals. Emissions factors (EF) weretentatively based on the environmental release categories(more detail in Supporting Information).
Pesticides in RMS. The target of the second case was toevaluate the time trend of the worldwide impact of pesticidesused in agricultural practice in the combined catchments of therivers Rhine, Meuse, and Scheldt (RMS) by deriving footprintsof the use of pesticides in the RMS in 1998, 2004 and 2008,given consideration to all scales. In this case study, emissionsduring production and transport were neglected and only theuse phase of the pesticides was included. Emission data werederived from the Dutch environmental risk indicator for plantprotection products (NMI)42 and are based on the Dutchpurchase figures and per crop usage data regarding plantprotection products for 1998, 2004, and 2008. This dataincludes 287 substances, of which 13 substances could not betaken into account due to lack of toxicity data (less than 2% ofthe modeled yearly emission volumes). The emissions for TheNetherlands were extrapolated to the RMS catchment using theformulas provided by Henning-de Jong et al.24 (see SI).SimpleBox (3.0) was used to estimate the steady stateconcentrations in the various environmental compartments.The estimated concentrations were compared to observedconcentrations at drinking water intake points (REWABdatabase43).
Data. The data sources used for the application of thefootprint derivation procedure in the two case studies aresummarized in Table 2.The degradation constants for water (kdeg,water) are not
directly obtained from EPIsuite but are based on EPIsuite’sBIOWIN estimation program and calculated following Rorije etal.50
=· · · −k
eln(2)
24 3600 7300deg,water 2BIOWIN3 (3)
Table 2. Sources of Data Used for the Case Studies Described in This Paper
processstep data required data sources for case study 1: organic substances data sources for case study 2: pesticides
2 production anduse volumes
The European Chemical Agency (ECHA) REACh dossiers purchase figures per substance and use patterns percrop42
2 emissions emission factors (SI) Dutch environmental risk indicator for plant protectionproducts (NMI);42 extrapolation factors derived fromHenning-de Jong24 and the CAPRI database44
3 physical−chemi-cal parameters
EPI Suite45 NMI and EPI Suite45
3 validation of es-timated con-centrations
Waterbase46 REWAB database43
4 toxicity data E-toxBase47 supplemented with data from De Zwart, the ECHA, the EuropeanChemical Substances Information System (ESIS) and Assessment Tools for theEvaluation of Risk (ASTER) of the U.S. Environmental Protection Agency (EPA)
E-toxBase47 supplemented with data from De Zwart,48
and the university of Hertfordshire49
5 boundary for safeoperation
policy boundary (0.1% of the species affected at EC50 level) and Natural boundary (3%of the species deleted)
natural boundary (3% of the species deleted)
6 available envi-ronmentalspace
volumes used in Simplebox 3.034 volumes used in Simplebox 3.034
Environmental Science & Technology Article
dx.doi.org/10.1021/es500629f | Environ. Sci. Technol. 2014, 48, 10588−1059710591
where kdeg,water is the degradation constant for water (s−1) andBIOWIN3 is the biodegradability estimate derived with EPISuite’s BIOWIN estimation program. Half-life in soil andsediment are estimated to be respectively twice and nine timesthe half-life in water, conform Rorije et al. (ibid). Allphysicochemical parameters used are included in the SI.Uncertainty Analysis. Calculated mixture toxic pressures,
and hence ChF’s, are uncertain as a result of uncertainties in theestimated concentration, median toxicity values (μx, EC50) andTMoA-specific spreads in species sensitivities (σTMoA, EC50).The uncertainties in the footprints and relative importance’s ofindividual chemicals are derived in two consecutive MonteCarlo simulations. In a first step, the uncertainty of the fatemodeling was simulated. This resulted in distributions ofplausible concentrations, which were subsequently combinedwith uncertainties in toxicity data and used as input into asecond simulation of uncertain ecological impacts. Thissequential simulation of uncertainty in mixture toxic pressure(msPAF) has been described elsewhere.23,24,35 Uncertainty inthe toxicity data was described by means of joint normal-gamma distributions of plausible, but uncertain, true values ofthe toxicity parameters μx and σTMoA of the various chemicals.Toxicity parameters were estimated by combining the, oftenscarce, observational information with prior existing informa-tion on many other, data-rich chemicals, by Bayesian inference.In this work, we have used an approximation of the so-calledempirical Bayes estimation procedure; the formulations usedare given in the Supporting Information. Our assessmentsyielded considerably reduced uncertainty for many data-poor
chemicals, which led to less outlier prone estimations of toxicpressures then reported earlier.22,23,29
3. RESULTS
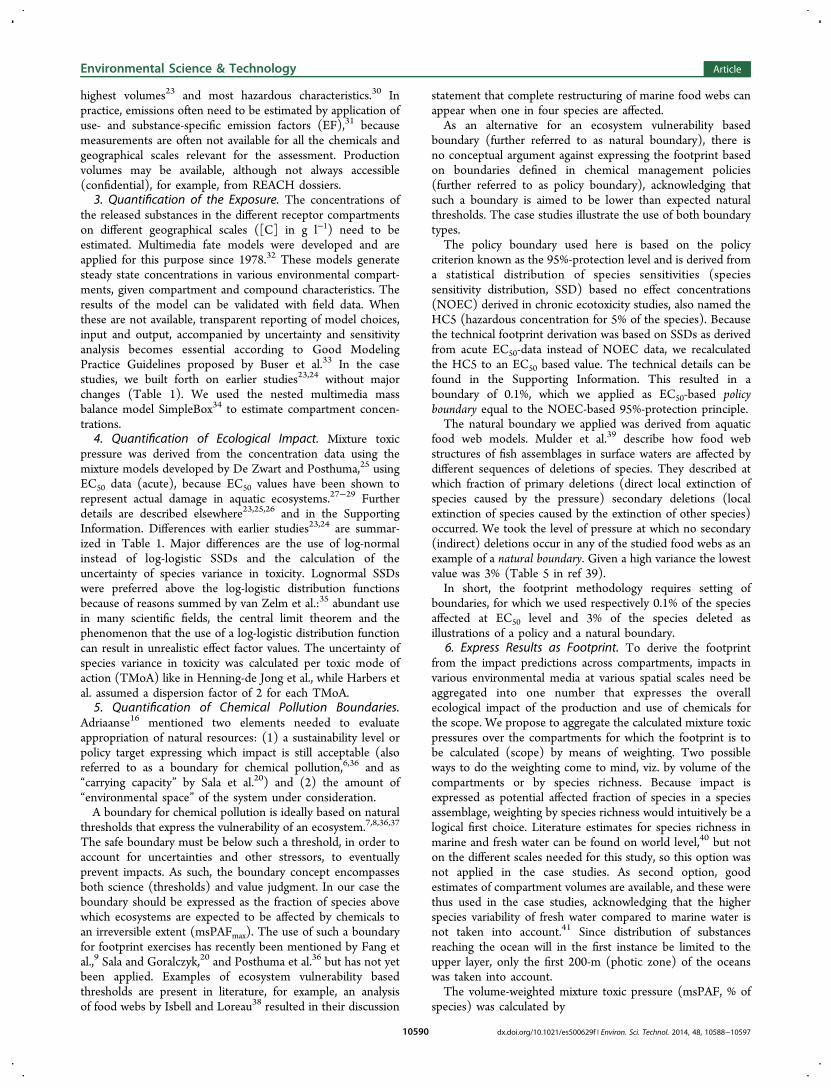
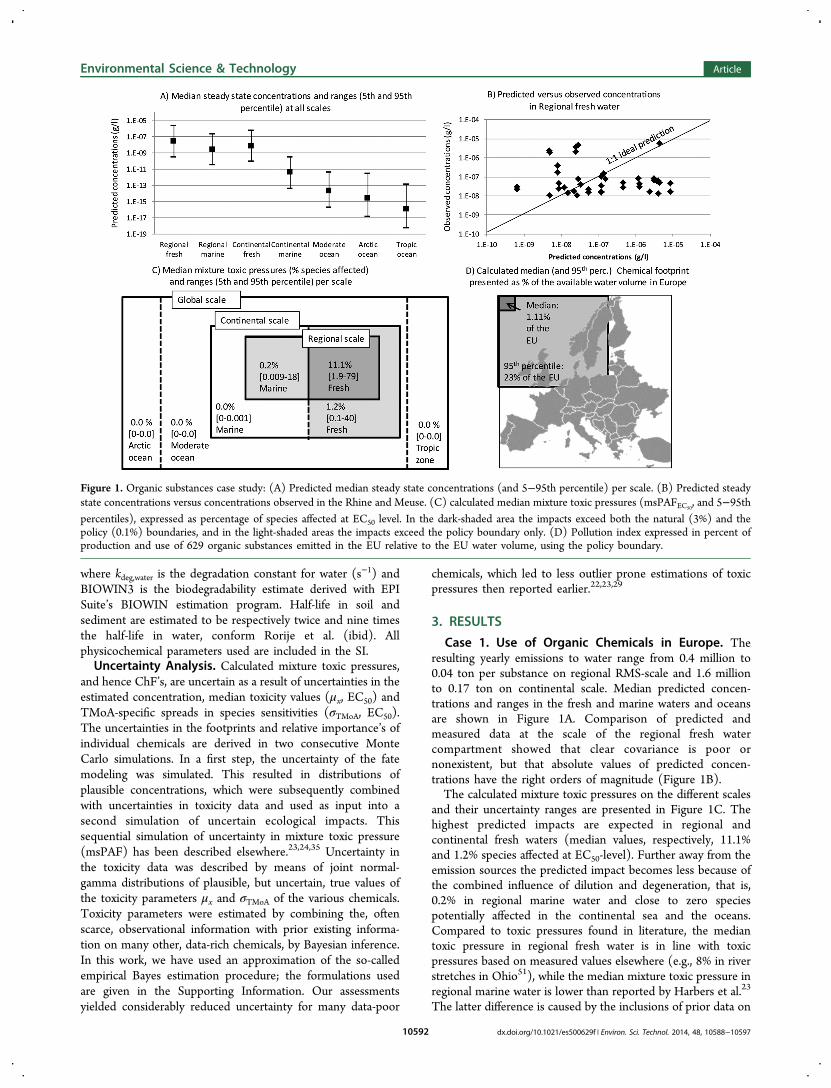
Case 1. Use of Organic Chemicals in Europe. Theresulting yearly emissions to water range from 0.4 million to0.04 ton per substance on regional RMS-scale and 1.6 millionto 0.17 ton on continental scale. Median predicted concen-trations and ranges in the fresh and marine waters and oceansare shown in Figure 1A. Comparison of predicted andmeasured data at the scale of the regional fresh watercompartment showed that clear covariance is poor ornonexistent, but that absolute values of predicted concen-trations have the right orders of magnitude (Figure 1B).The calculated mixture toxic pressures on the different scales
and their uncertainty ranges are presented in Figure 1C. Thehighest predicted impacts are expected in regional andcontinental fresh waters (median values, respectively, 11.1%and 1.2% species affected at EC50-level). Further away from theemission sources the predicted impact becomes less because ofthe combined influence of dilution and degeneration, that is,0.2% in regional marine water and close to zero speciespotentially affected in the continental sea and the oceans.Compared to toxic pressures found in literature, the mediantoxic pressure in regional fresh water is in line with toxicpressures based on measured values elsewhere (e.g., 8% in riverstretches in Ohio51), while the median mixture toxic pressure inregional marine water is lower than reported by Harbers et al.23
The latter difference is caused by the inclusions of prior data on
Figure 1. Organic substances case study: (A) Predicted median steady state concentrations (and 5−95th percentile) per scale. (B) Predicted steadystate concentrations versus concentrations observed in the Rhine and Meuse. (C) calculated median mixture toxic pressures (msPAFEC50
, and 5−95thpercentiles), expressed as percentage of species affected at EC50 level. In the dark-shaded area the impacts exceed both the natural (3%) and thepolicy (0.1%) boundaries, and in the light-shaded areas the impacts exceed the policy boundary only. (D) Pollution index expressed in percent ofproduction and use of 629 organic substances emitted in the EU relative to the EU water volume, using the policy boundary.
Environmental Science & Technology Article
dx.doi.org/10.1021/es500629f | Environ. Sci. Technol. 2014, 48, 10588−1059710592
ecotoxicity in the uncertainty analysis, resulting in less extremeresults in the Monte Carlo simulations.Acknowledging that impacts exceeds boundaries close to the
emission source, we illustrate the integration of the impactscores by volume weighting, and we calculated the European-level ChF by using the policy boundary (0.1% of the speciesaffected at EC50-level). This resulted in a chemical footprint of7.8 × 103 km3. This equates to 1.1% of the total EU watervolume (Figure 1D). In other words: the virtual water volumefilled up to the maximum acceptable limit because of theemissions of organic substances in Europe is 1.1% of theavailable water volume in Europe (but note the variability ofexposure levels at the different scales). When calculated againstthe natural boundary (3% of the species affected), a footprint of2.6 × 1011 m3 (0.04% of the EU water volume) was obtained.A contribution to variance analysis showed that, on average,
variance in compound toxic pressures derives mainly fromuncertainty in ecotoxicity parameters (μx and σTMoA, both 30%)and to lesser extent from the modeled concentrations (19%),which, in turn, derives mainly from uncertainties in theemissions and degradation rate constants.Case 2. Use of Pesticides in the Rhine/Meuse/Scheldt
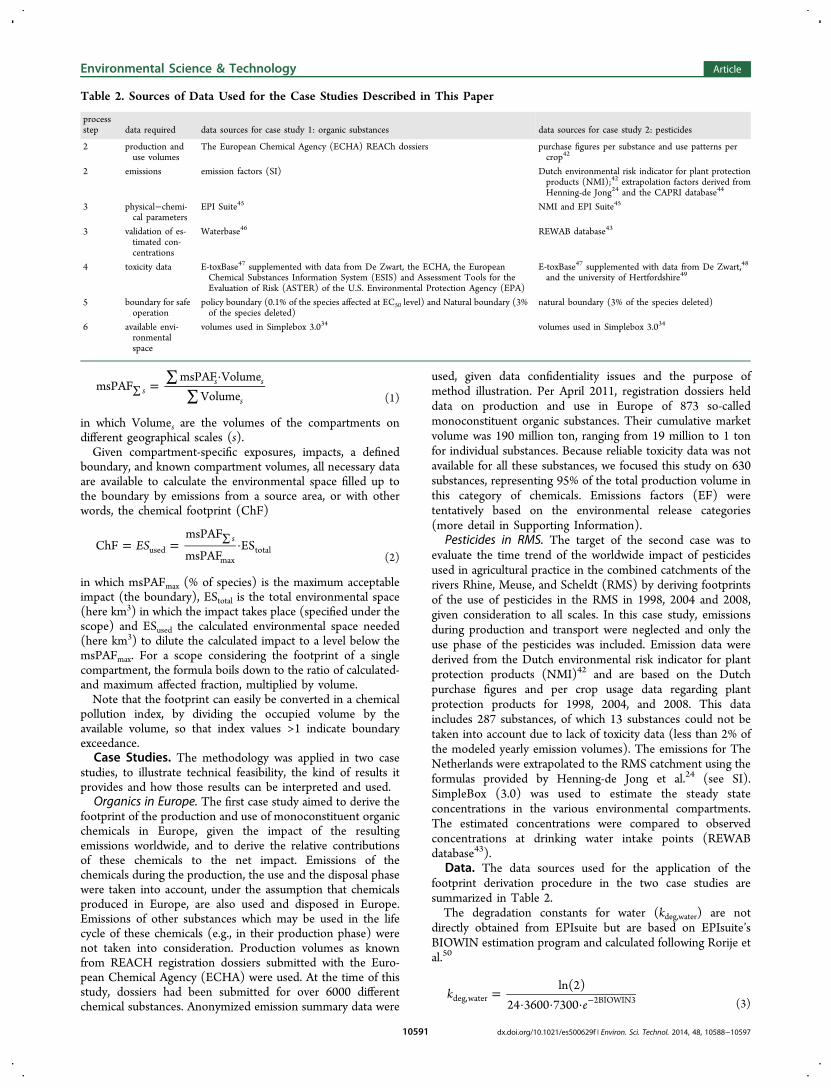
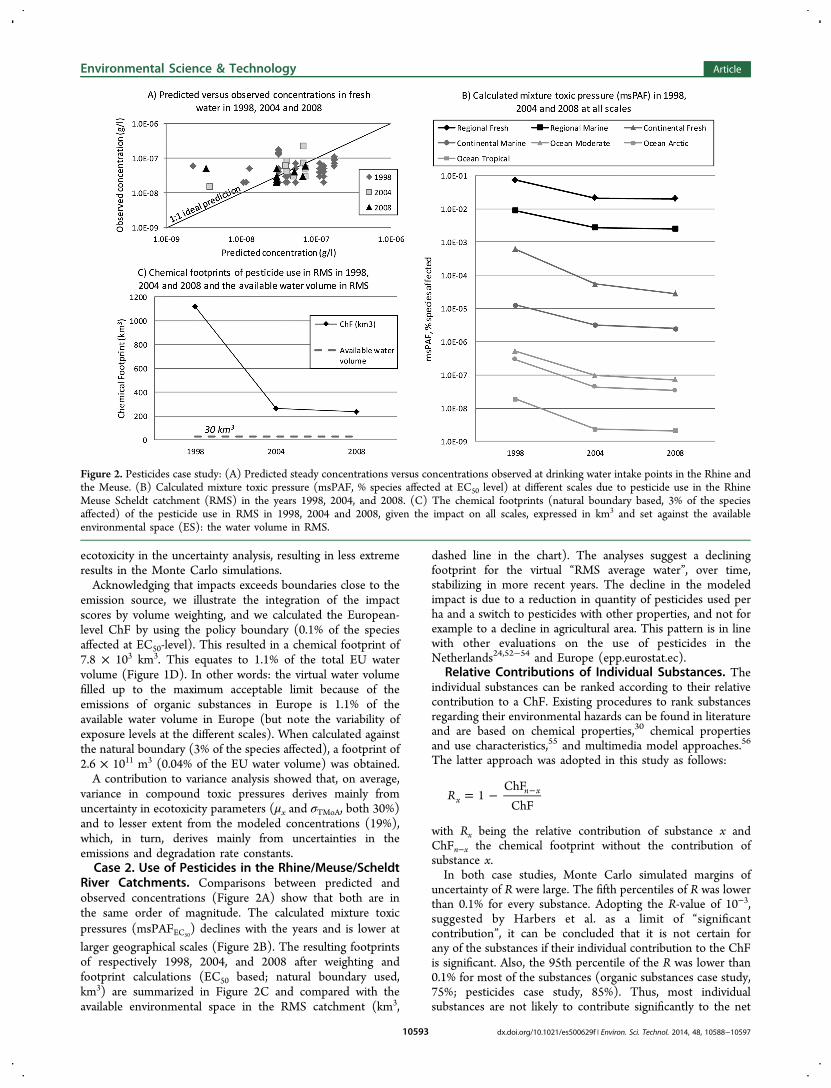
River Catchments. Comparisons between predicted andobserved concentrations (Figure 2A) show that both are inthe same order of magnitude. The calculated mixture toxicpressures (msPAFEC50
) declines with the years and is lower atlarger geographical scales (Figure 2B). The resulting footprintsof respectively 1998, 2004, and 2008 after weighting andfootprint calculations (EC50 based; natural boundary used,km3) are summarized in Figure 2C and compared with theavailable environmental space in the RMS catchment (km3,
dashed line in the chart). The analyses suggest a decliningfootprint for the virtual “RMS average water”, over time,stabilizing in more recent years. The decline in the modeledimpact is due to a reduction in quantity of pesticides used perha and a switch to pesticides with other properties, and not forexample to a decline in agricultural area. This pattern is in linewith other evaluations on the use of pesticides in theNetherlands24,52−54 and Europe (epp.eurostat.ec).
Relative Contributions of Individual Substances. Theindividual substances can be ranked according to their relativecontribution to a ChF. Existing procedures to rank substancesregarding their environmental hazards can be found in literatureand are based on chemical properties,30 chemical propertiesand use characteristics,55 and multimedia model approaches.56
The latter approach was adopted in this study as follows:
= − −R 1ChF
ChFxn x
with Rx being the relative contribution of substance x andChFn−x the chemical footprint without the contribution ofsubstance x.In both case studies, Monte Carlo simulated margins of
uncertainty of R were large. The fifth percentiles of R was lowerthan 0.1% for every substance. Adopting the R-value of 10−3,suggested by Harbers et al. as a limit of “significantcontribution”, it can be concluded that it is not certain forany of the substances if their individual contribution to the ChFis significant. Also, the 95th percentile of the R was lower than0.1% for most of the substances (organic substances case study,75%; pesticides case study, 85%). Thus, most individualsubstances are not likely to contribute significantly to the net
Figure 2. Pesticides case study: (A) Predicted steady concentrations versus concentrations observed at drinking water intake points in the Rhine andthe Meuse. (B) Calculated mixture toxic pressure (msPAF, % species affected at EC50 level) at different scales due to pesticide use in the RhineMeuse Scheldt catchment (RMS) in the years 1998, 2004, and 2008. (C) The chemical footprints (natural boundary based, 3% of the speciesaffected) of the pesticide use in RMS in 1998, 2004 and 2008, given the impact on all scales, expressed in km3 and set against the availableenvironmental space (ES): the water volume in RMS.
Environmental Science & Technology Article
dx.doi.org/10.1021/es500629f | Environ. Sci. Technol. 2014, 48, 10588−1059710593
toxic pressure, considering their spread over Europe’s totalwater volume. It follows from the uncertainty analyses thatfrom the remaining substances (25% and 15%, respectively, ofthe substances) only a small fraction of the chemicals (6% of allthe organics and 3% of all the pesticides) account for the largerfraction of the total toxic pressure on aquatic ecosystems. Inspite of the meaning of this outcome pattern that only fewchemicals contribute to impacts, it cannot be determined withcertainty which of the chemicals belong to the contributinggroup at the studied scale due to the wide confidence bands.This is not so much a weakness of the method; it relates touncertainties in and lack of data and the scale of study. Theresults are comparable with results found by De Zwart et al.48
They found that 95% of the predicted risk due to pesticide usein The Netherlands is attributable to only 2.7% of thesubstances.
4. DISCUSSIONA versatile and comprehensive novel methodology has beendeveloped that provides a quantitative measure describing theenvironmental space (here, water volume) needed to dilutechemical pollution due to human activities to a level below aspecified impact boundary condition. The methodologyproceeds beyond the works of Harbers et al.23 and Henning-de Jong et al.24 by expressing mixture-impact related outcomesin terms of a chemical footprint, in line with general requisitesfor footprints,12 and considering an explicitly defined set ofoptional boundaries from the realms of chemical managementpractice (policy boundary) and research on ecosystemvulnerability (natural boundary). The methodology combinesyears of experience in the field of fate and effect modeling, withcontemporary developments concerning footprinting andplanetary boundaries, and adds novelties on different levels,for example, the derivation and application of two types ofboundaries for chemical pollution, the way uncertainty analysisis designed and the use of up to date data from policy dossiers.The methodology is flexible in the sense that it can be adjustedand applied on different scenarios and assessment targets,ranging from assessing the chemical footprint of single-chemicalemissions from a point source or product to nearby waterbodies up till worldwide assessments from regional use ofmultiple chemicals, as illustrated in both case studies. Finally,the methodology consists of a logical, robust sequence ofanalytical steps that allows for validation of outcomes of theseparate steps, it technically results in outputs of the desiredkinds, as illustrated in two case studies, and the results of thosecase studies are in line with other data, while appearing to bemeaningful. The results of ChF assessments can be used toevaluate management of chemicals on different spatial levels inthe light of set boundaries, to support decision making byexploring the ChF of alternative scenarios and to supportprioritizing of chemicals or sectors or areas to focus on. A needrecently voiced in literature.1,2
The first application of the methodology in two case studieshas highlighted that individual steps can be improved regardingquality of input data and the subsequent modeling steps, suchas the emission estimation and uncertainty assessment, and/orfurther discussed, such as the used boundaries and theweighting method. Given uncertainty bounds in the results ofthe current case studies, we prefer exploring relative outcomes(policy-evaluation, prioritization, etc.) rather than absoluteoutcomes. We address various influential aspects specificallybelow.
First, the uncertainty in the ChF and R calculations stemsfrom uncertainties in the substance-specific toxicity value (μx),the TMoA-specific spread in sensitivities of species (σTMoA),and in the modeled steady-state concentrations. Uncertaintiesin the steady-state concentrations in turn originated largelyfrom the uncertainties in emissions and degradation rateconstants. Use- and substance-specific emission factors areusually hard to obtain and uncertain.56,57 This was also true forthe two case studies in this study. Because the purpose of thecase studies was testing and improving the outlines of themethodology, rough emission estimates sufficed. To improvethe accuracy of chemical footprints obtained with ourcalculation procedure, research on derivation of emissionfactors is recommended. Uncertainty in the toxicity parametersμx and σTMoA could be reduced by including more toxicity dataper substance, more substances per TMoA and improvedTMoA assignments. Van Zelm et al. proposed research on theuse of quantitative structure−activity relationships to supple-ment experimental toxicity data35 and also the use of prior datain these assessments should (and will) be further investigated.Second, the application of a multimedia mass balance model
(SimpleBox) and the two biological models (concentrationaddition and response addition) to estimate predictedecological impacts of mixtures of substances comes withsimplifying assumptions. Such assumptions need be madeexplicit and detailed to support the interpretation of the finalresults. The box-modeling approach assumes environmentalcompartments to be spatially homogeneous. In reality impactswill be lower in the larger subcompartments of the environmentand higher at so-called “hot-spots”. Instead of box models,spatially resolved models could be used, which would give moreinsight in hot spots, but simultaneously make the analysis moredata demanding and the aggregation more difficult. Further, themethodology can also proceed based on measured concen-trations. Likewise, variability in time, which is shown to berelevant for e.g. pesticides by de Zwart et al.,48 is neglected.Also, the case studies did not treat bioavailability; the model asapplied assumed dissolved concentrations in water are fullyavailable to the aquatic species. This can be added to themethodology, which is of particular importance for e.g. metals,as shown by Gandhi et al.58 Finally, the mixture modeling asksfor identifying the toxic mode of action or mechanism of actionper substance. However, the appropriation of TMoA persubstance varies among different sources of toxicity data used inthis study and was missing for many substances. Applying amode of action needs detailed information on the substance atstake, which is not always readily available, especially in the caseof organic substances. Furthermore, substances can havemultiple modes of action, which makes categorizing substancescomplex. Despite this, quantitative mixture impact predictionsmay be considered robust.59
Third, reconsideration of the scopes of the case studiesreveals important aspects. When working on (results of a) ChFanalysis one must always be aware of what has actually beenanalyzed. In our case we focused on the impact on aquaticecosystems. The methodology could be applied to includeterrestrial and aerial impacts, but because of the (relative) lackof ecotoxicity data for these compartments they were excludedfrom the study. Next to impacts on other compartments, othertypes of impacts could in principle be included in themethodology. For example SSDs for ozone exposure of plantspecies have recently been developed,60 so that an ozonefootprint may be derived. In addition, it would be interesting to
Environmental Science & Technology Article
dx.doi.org/10.1021/es500629f | Environ. Sci. Technol. 2014, 48, 10588−1059710594
apply the methodology on risks of mixtures of substances foradverse impacts on humans.Fourth, weighting is a key step in the methodology. The
application of weighting to aggregate the impacts on differentscales and compartments needs to be explicit, and could be(and is) disputed, because aggregation implies information loss.However, policy usage often implies that information ispresented in an easy to interpret and communicate way.61
The latter explains the success of footprint methodologies,despite the suite of methodological questions and suggestionsraised in literature.62,63 Next to loss of information, aggregationmay lead to results with higher uncertainty ranges.64 That iswhy the aggregated results should always be accompanied bythe underlying intermediate results and explicit descriptions ofthe assumptions and aggregation methodologies applied.Of particular interest is, fifth, the issue of boundaries. Our
approach presents two operational methods to define this keyitem for the footprint methodology for the first time. There issubstantial latitude to further discuss and derive boundaries, inline with the general issues discussed in the PlanetaryBoundaries papers, ongoing specific (policy) discussions onsafe single-chemical boundaries, and current works onbiodiversity impact boundaries. The complexity of naturalsystems should be acknowledged,37 and would suggest adistribution of spatially variable, and ecosystem specific naturalboundaries. Some unifying principles needs be chosen, whichcould build on analyses of known tipping or bifurcation pointsfor local ecological processes, such as lake eutrophication orloss of semiarid vegetation due to dryness19 or the humaninduced restructuring of marine food webs.38 The naturalboundary used in this paper was taken from a study that clearlyshows variability of secondary species deletions across foodwebs. The idea of natural boundary diversity based on food webcollapse will be further explored, within the context of bothfood web structure and function. The so-called ecosystemservices concept can be a unifying principle here, implying thatboundaries are derived in relation to services offered byecosystems and their processes to man. Applied to all globalemission sources and combined with a distribution of naturalboundaries conditions or a uniform policy boundary ourmethodology would yield a proposal to define the globalboundary for chemical pollution as discussed by Rockstrom etal.6,7
Finally, it should be noted and clearly communicated that theresulting footprint, or: environmental space (water volume)needed, is hypothetical. Critics state that this could be easilymisinterpreted,11 especially because the hypothetical environ-mental space is compared with the actual environmental spaceavailable to express the sustainability of a system, neglectinggradients from emission source to distant compartments. Whencomparing the footprint (volume needed) with the environ-mental space available (volume present), the latter should beobtained and communicated with care. A visualization of thispoint can be found in the Supporting Information (Table S4).From an environmental (biocapacity) perspective, derivation ofthe available environmental space of a bioregion (e.g., riverbasin) makes more sense than that of a political region (e.g.,country).11
The points discussed so far do not invalidate the foundations,logics, and versatility of the proposed methodology. Rather, theissues define where there is latitude for technical improvementsof the various steps, while our analyses suggest that the finalresults of the presented footprint methodology already in their
current status can very well be used, that is, to support prioritysetting in chemical management (both case studies), or in theevaluation of the success of measures taken by risk managers(second case study).
■ ASSOCIATED CONTENT*S Supporting InformationSummary of existing environmental footprint methodologiesand history of chemical footprinting in literature, description ofderivation of emission estimates, degradation constants,potential affected fractions, the uncertainty and sensitivityanalysis, table of physical−chemical and toxicity data used perchemical, validation of modeled concentrations, and derivationof boundary for chemical pollution. This material is availablefree of charge via the Internet at http://pubs.acs.org.
■ AUTHOR INFORMATIONCorresponding Author*E-mail: [email protected]. Phone: +31 30 2744087.NotesThe authors declare no competing financial interest.
■ ACKNOWLEDGMENTSFunding by the Strategic Research Program of RIVM isgratefully acknowledged (project number S/607020). We thankM. Huijbregts, J. Struijs, A. Hollander, D. de Zwart, R.Heijungs, and C. Mulder for fruitful discussions and A. M. A.van der Linden and H. van Wijnen for support with datapreparation.
■ REFERENCES(1) Giubilato, E.; Zabeo, A.; Critto, A.; Giove, S.; Bierkens, J.; DenHond, E.; Marcomini, A. A risk-based methodology for rankingenvironmental chemical stressors at the regional scale. Environ. Int.2014, 65, 41−53.(2) Bu, Q.; Wang, D.; Wang, Z. Review of screening systems forprioritizing chemical substances. Crit. Rev. Environ. Sci. Technol. 2013,43 (10), 1011−1041.(3) EC. Directive No. 2000/60/EC of the European Parliament andof the Council of 23 October 2000 establishing a framework forCommunity action in the field of water policy. Off. J. Eur. Communities:Legis. 2000, 1−72.(4) EEA. Hazardous Substances in Europe’s Fresh and Marine Waters.An Overview; European Environmental Agency: Copenhagen, 2011; pp1−66.(5) U.S. EPA. The National Study of Chemical Residues in Lake FishTissue, EPA-823-R-09-006; Environmental Protection Agency, Officeof Water: Washington, DC, U.S., 2009.(6) Rockstrom, J.; Steffen, W.; Noone, K.; Persson, Å.; Chapin, F. S.;Lambin, E. F.; Lenton, T. M.; Scheffer, M.; Folke, C.; Schellnhuber, H.J.; Nykvist, B.; De Wit, C. A.; Hughes, T.; Van der Leeuw, S.; Rodhe,H.; Sorlin, S.; Snyder, P. K.; Costanza, R.; Svedin, U.; Falkenmark, M.;Karlberg, L.; Corell, R. W.; Fabry, V. J.; Hansen, J.; Walker, B.;Liverman, D.; Richardson, K.; Crutzen, P.; Foley, J. A. A safe operatingspace for humanity. Nature 2009, 461 (7263), 472−475.(7) Rockstrom, J.; Steffen, W.; Noone, K.; Persson, A.; Chapin Iii, F.S.; Lambin, E.; Lenton, T. M.; Scheffer, M.; Folke, C.; Schellnhuber,H. J.; Nykvist, B.; de Wit, C. A.; Hughes, T.; Van der Leeuw, S.;Rodhe, H.; Sorlin, S.; Snyder, P. K.; Costanza, R.; Svedin, U.;Falkenmark, M.; Karlberg, L.; Corell, R. W.; Fabry, V. J.; Hansen, J.;Walker, B.; Liverman, D.; Richardson, K.; Crutzen, P.; Foley, J.Planetary boundaries: Exploring the safe operating space for humanity.Ecology and Society 2009, 14 (2), 1−33.(8) Persson, L.; Breitholtz, M.; Cousins, I.; de Wit, A.; MacLeod, M.;McLachlan, M. Confronting unknown planetary boundary threats
Environmental Science & Technology Article
dx.doi.org/10.1021/es500629f | Environ. Sci. Technol. 2014, 48, 10588−1059710595
from chemical pollution. Environ. Sci. Technol. 2013, 47 (22), 12619−12622.(9) Fang, K.; Heijungs, R.; De Snoo, G. R. Theoretical explorationfor the combination of the ecological, energy, carbon, and waterfootprints: Overview of a footprint family. Ecol. Indic. 2014, 36, 508−518.(10) Mattila, T. Input−output analysis of the networks of production,consumption and environmental destruction in Finland. DoctoralDissertation, Aalto University, Helsinki, Finland, 2013, 120 p.(11) Van den Bergh, J. C.; Grazi, F. Ecological footprint policy? Landuse as an environmental indicator. J. Ind. Ecol. 2014, 18 (1), 10−19.(12) Eueek, L.; Klemes, J. J.; Kravanja, Z. A review of footprintanalysis tools for monitoring impacts on sustainability. J. Cleaner Prod.2012, 34, 9−20.(13) Gleeson, T.; Wada, Y.; Bierkens, M. F. P.; Van Beek, L. P. H.Water balance of global aquifers revealed by groundwater footprint.Nature 2012, 488 (7410), 197−200.(14) EC. Commission recommendation of 9 April 2013 on the use ofcommon methods to measure and communicate the life cycleenvironmental performance of products and organisations. Off. J.Eur. Union 2013, 56, 1−210.(15) Rees, W. E. Ecological footprints and appropriated carryingcapacity: what urban economics leaves out. Environ. Urbanization1992, 4 (2), 121−130.(16) Adriaanse, A. Environmental Policy Performance Indicators; S.D.U.Uitgevery: The Hague, The Netherlands, 1993.(17) Hoekstra, A. Y.; Chapagain, A. K.; Aldaya, M. M.; Mekonnen,M. M. Water Footprint Manual. State of the Art 2009; Water FootprintNetwork: Enschede, The Netherlands, 2009; pp 1−131.(18) EC. Directive no 1907/2006 of the European Parliament and ofthe Council of 18 december 2006 concerning the Registration,Evaluation, Authorisation and Restriction of Chemicals (REACH),establishing a European Chemicals Agency, amending Directive 1999/45/EC and repealing Council Regulation (EEC) no 793/93 andCommission Regulation (EC) No 1488/94 as well as CouncilDirective 76/769/EEC and Commission Directives 91/155/EEC,93/67/EEC, 93/105/EC and 2000/21/EC. Off. J. Eur. Communities:Legis. 2006, 1−849.(19) Scheffer, M.; Bascompte, J.; Brock, W. A.; Brovkin, V.;Carpenter, S. R.; Dakos, V.; Held, H.; Van Nes, E. H.; Rietkerk, M.;Sugihara, G. Early-warning signals for critical transitions. Nature 2009,461 (7260), 53−59.(20) Sala, S.; Goralczyk, M. Chemical footprint: A methodologicalframework for bridging life cycle assessment and planetary boundariesfor chemical pollution. Integr. Environ. Assess. Manage. 2013, 9 (4),623−632.(21) Panko, J.; Hitchcock, K. Chemical footprint, ensuring productsustainability. Air Waste Manage. Assoc. 2011, 12−15.(22) Hitchcock, K.; Panko, J.; Scott, P. Incorporating chemicalfootprint reporting into social responsibility reporting. Integr. Environ.Assess. Manage. 2012, 8 (2), 386−388.(23) Harbers, J. V.; Huijbregts, M. A. J.; Posthuma, L.; Van de Meent,D. Estimating the impact of high-production-volume chemicals onremote ecosystems by toxic pressure calculation. Environ. Sci. Technol.2006, 40 (5), 1573−1580.(24) Henning-De Jong, I.; Van Zelm, R.; Huijbregts, M. A. J.; DeZwart, D.; Van Der Linden, A. M. A.; Wintersen, A.; Posthuma, L.;Van de Meent, D. Ranking of agricultural pesticides in the Rhine−Meuse−Scheldt basin based on toxic pressure in marine ecosystems.Environ. Toxicol. Chem. 2008, 27 (3), 737−745.(25) De Zwart, D.; Posthuma, L. Complex mixture toxicity for singleand multiple species: Proposed methodologies. Environ. Toxicol. Chem.2005, 24 (10), 2665−2676.(26) Posthuma, L.; Suter, G. W.; Traas, T. P. Species SensitivityDistributions in Ecotoxicology; Lewis Publishers: Boca Raton, FL, 2002.(27) Posthuma, L.; De Zwart, D. Predicted effects of toxicantmixtures are confirmed by changes in fish species assemblages in Ohio,USA, rivers. Environ. Toxicol. Chem. 2006, 25 (4), 1094−1105.
(28) Posthuma, L.; de Zwart, D. Predicted mixture toxic pressurerelates to observed fraction of benthic macrofauna species impacted bycontaminant mixtures. Environ. Toxicol. Chem. 2012, 31 (9), 2175−2188.(29) Smetanova, S.; Blaha, L.; Liess, M.; Schafer, R. B.; Beketov, M.A. Do predictions from species sensitivity distributions match withfield data? Environmental polution 2014, 189, 126−133.(30) Strempel, S.; Scheringer, M.; Ng, C. A.; Hungerbuhler, K.Screening for PBT chemicals among the “existing” and “new”chemicals of the EU. Environ. Sci. Technol. 2012, 46 (11), 5680−5687.(31) CEFIC. CEFIC Guidance Specific Environmental ReleaseCategories (SPERCs) Chemical Safety Assessments, Supply ChainCommunication and Downstream User Compliance; CEFIC: Brussels,Belgium, 2012.(32) MacLeod, M.; Scheringer, M.; McKone, T. E.; Hungerbuhler, K.The state of multimedia mass-balance modeling in environmentalscience and decision-making. Environ. Sci. Technol. 2010, 44 (22),8360−8364.(33) Buser, A. M.; MacLeod, M.; Scheringer, M.; Mackay, D.;Bonnell, M.; Russell, M. H.; DePinto, J. V.; Hungerbuhler, K. Goodmodeling practice guidelines for applying multimedia models inchemical assessments. Integr. Environ. Assess. Manage. 2012, 8 (4),703−708.(34) Den Hollander, H.; Van Eijkeren, J. C. H.; Van de Meent, D.Multimedia Mass Balance Model for Evaluating the Fate of Chemicals inthe Environment, RIVM 602100003; National Institute of PublicHealth and the Environment: Bilthoven, the Netherlands, 2004.(35) Van Zelm, R.; Huijbregts, M. A.; Harbers, J. V.; Wintersen, A.;Struijs, J.; Posthuma, L.; Van de Meent, D. Uncertainty in msPAF-based ecotoxicological effect factors for freshwater ecosystems in LifeCycle Impact Assessment. Integr. Environ. Assess. Manage. 2007, 3 (2),203−210.(36) Posthuma, L.; Bjørn, A.; Zijp, M. C.; Birkveld, M.; Diamond, M.L.; Hauschild, M. Z.; Huijbregts, M. A. J.; Mulder, C.; Van de Meent,D. Beyond safe operating space: Finding chemical footprint feasible.Environ. Sci. Technol. 2014, 48, 6057−6059, DOI: 10.1021/es501961k.(37) Brook, B. W.; Ellis, E. C.; Perring, M. P.; Mackay, A. W.;Blomqvist, L. Does the terrestrial biosphere have planetary tippingpoints? Trends Ecol. Evol. 2013, 28 (7), 396−401.(38) Isbell, F.; Loreau, M. Human impacts on minimum subsets ofspecies critical for maintaining ecosystem structure. Basic Appl. Ecol.2013, 14 (8), 623−629.(39) Mulder, C.; Boit, A.; Mori, S.; Vonk, J.; Dyer, S.; Faggiano, L.;Geisen, S.; Gonzalez, A.; Kaspari, M.; Lavorel, S.; Marquet, P.;Rossberg, A.; Sterner, R.; Voigt, W.; Wall, D. Distributional(in)congruence of biodiversity−ecosystem functioning. Adv. Ecol.Res. 2012, 46, 1−88.(40) Dudgeon, D.; Arthington, A. H.; Gessner, M. O.; Kawabata, Z.I.; Knowler, D. J.; Leveque, C.; Naiman, R. J.; Prieur-Richard, A. H.;Soto, D.; Stiassny, M. L. J.; Sullivan, C. A. Freshwater biodiversity:Importance, threats, status, and conservation challenges. Biol. Rev.Cambridge Philos. Soc. 2006, 81 (2), 163−182.(41) Goedkoop, M.; Heijungs, R.; Huijbregts, M. A. J.; De Schryver,A. M.; Struijs, J.; Van Zelm, R. ReCiPe 2008. A Life Cycle ImpactAssessment Method Which Comprises Harmonised Category Indicators atthe Midpoint and the Endpoint Level; Ministerie van VROM: Den Haag,The Netherlands, 2009.(42) Kruijne, R.; Van der Linden, A. M. A.; Deneer, J.; Groenwold, J.G.; Wipfler, E. L. Dutch Environmental Risk Indicator for PlantProtection Products; Alterra−Wageningen UR: Wageningen, TheNetherlands, 2011.(43) Versteegh, J.; Dik, H. The Quality of Drinking Water in theNetherlands in 2011, RIVM 703719090; RIVM, National Institute forPublic Health and the Environment: Bilthoven, 2012; pp 1−41.(44) Hierderer, R. EFSA spatial data version 1.1; Data properties andprocessing. Publ. Off. Eur. Union 2012, No. 25546.(45) U.S. EPA. Estimation Programs Interface (EPI) Suite, version4.11; U.S. Enironmental Protection Agency: Washington, DC, 2000.
Environmental Science & Technology Article
dx.doi.org/10.1021/es500629f | Environ. Sci. Technol. 2014, 48, 10588−1059710596
(46) Rijkswaterstaat Waterbase. http://www.rijkswaterstaat.nl/water/waterdata_waterberichtgeving/watergegevens/ (16-12-2013).(47) RIVM. The e-tox database. www.e-toxbase.com (16-12-2013),.(48) De Zwart, D. Ecological effects of pesticide use in TheNetherlands: Modeled and observed effects in the field ditch. Integr.Environ. Assess. Manage. 2005, 1 (2), 123−134.(49) The University of Hertfordshire. Pesticide Properties Databasehttp://sitem.herts.ac.uk/aeru/footprint/en/index.htm (16-12-2013).(50) Rorije, E.; Verbruggen, E. M. J.; Hollander, A.; Traas, T. P.;Janssen, M. P. M. Identifying Potential POP and PBT Substances.Development of a New Persistence/Bioaccumulation-Score, RIVM601356001; National Institute for Public Health and the Environment:Bilthoven, The Netherlands, 2011.(51) De Zwart, D.; Dyer, S. D.; Posthuma, L.; Hawkins, C. P.Predictive models attribute effects on fish assemblages to toxicity andhabitat alteration. Ecol. Appl. 2006, 16 (4), 1295−1310.(52) De Snoo, G. R.; Vijver, M. G. Bestrijdingsmiddelen enWaterkwaliteit; Universiteit Leiden: Leiden, The Netherlands, 2012.(53) Van Eerdt, M.; Van Dam, J.; Tiktak, A.; Vonk, M.; Wortelboer,R.; Van Zeijts, H. Evaluatie van de Nota Duurzame Gewasbescherming,PBL 500158001; Netherlands Environmental Assessment Agency(PBL): The Hague, The Netherlands, 2012.(54) Struijs, J.; Van der Grinten, E.; Aldenberg, T. Toxic Pressure inthe Dutch Delta Measured with Bioassays. Trends over the Years 2000−2009, RIVM 607013013; National Institute for Public Health and theEnvironment (RIVM): Bilthoven, the Netherlands, 2010.(55) Mitchell, J.; Pabon, N.; Collier, Z. A.; Egeghy, P. P.; Cohen-Hubal, E.; Linkov, I.; Vallero, D. A. A decision analytic approach toexposure-based chemical prioritization. PLoS One 2013, 8 (8), 1−13.(56) Arnot, J. A.; Brown, T. N.; Wania, F.; Breivik, K.; McLachlan, M.S. Prioritizing chemicals and data requirements for screening-levelexposure and risk assessment. Environ. Health Perspect. 2012, 120 (11),1565−1570.(57) Warmbaugh, J. F.; Woodrow Setzer, R.; Reif, D. M.; Gangwal,S.; Mitchell-Blackwood, J.; Arnot, J. A.; Jolliet, O.; Frame, A.;Rabinowitz, J.; Knudsen, T. B.; Judson, R. S.; Egeghy, P.; Vallero, D.;Cohen Hubal, E. A. High-throughput models for exposure-basedchemical prioritization in the ExpoCast project. Environ. Sci. Technol.2013, 47, 8479−8488.(58) Gandhi, N.; Diamond, M. L.; Van de Meent, D.; Huijbregts, M.A. J.; Peijnenburg, W. J. G. M.; Guinee, J. New method for calculatingcomparative toxicity potential of cationic metals in freshwater:Application to copper, nickel, and zinc. Environ. Sci. Technol. 2010,44 (13), 5195−5201.(59) Drescher, K.; Boedeker, W. Assessment of the combined effectsof substances: The relationship between concentration addition andindependent action. Biometrics 1995, 51 (2), 716−730.(60) Van Goethem, T. M. W. J.; Azevedo, L. B.; Van Zelm, R.; Hayes,F.; Ashmore, M. R.; Huijbregts, M. A. J. Plant species sensitivitydistributions for ozone exposure. Environ. Pollut. 2013, 178, 1−6.(61) OECD. Sustainable Development Strategies: A Resource Book;Organisation for Economic Co-Operation and Development: Paris,2002; p 358.(62) Fiala, N. Measuring sustainability: Why the ecological footprintis bad economics and bad environmental science. Ecol. Econ. 2008, 67(4), 519−525.(63) Bohringer, C.; Jochem, P. E. P. Measuring the immeasurableAsurvey of sustainability indices. Ecol. Econ. 2007, 63 (1), 1−8.(64) Heijungs, R.; Goedkoop, M.; Struijs, J.; Effting, S.; Sevenster,M.; Huppes, G. Towards a Life Cycle Impact Assessment Method WhichComprises Category Indicators at the Midpoint and the Endpoint Level.Report of the First Project Phase: Design of the New Method; Ministry ofVROM: The Hague, The Netherlands, 2003.
Environmental Science & Technology Article
dx.doi.org/10.1021/es500629f | Environ. Sci. Technol. 2014, 48, 10588−1059710597