Embed Size (px)
Citation preview

Global Gray Water Footprint and Water Pollution Levels Related toAnthropogenic Nitrogen Loads to Fresh WaterMesfin M. Mekonnen* and Arjen Y. Hoekstra
Twente Water Centre, University of Twente, P.O. Box 217, 7500 AE Enschede, The Netherlands
*S Supporting Information
ABSTRACT: This is the first global assessment of nitrogen-related water pollution in river basins with a specification of thepollution by economic sector, and by crop for the agriculturalsector. At a spatial resolution of 5 by 5 arc minute, we estimateanthropogenic nitrogen (N) loads to freshwater, calculate theresultant gray water footprints (GWFs), and relate the GWFsper river basin to runoff to calculate the N-related waterpollution level (WPL) per catchment. The accumulated globalGWF related to anthropogenic N loads in the period 2002−2010 was 13 × 1012 m3/y. China contributed about 45% to theglobal total. Three quarters of the GWF related to N loads camefrom diffuse sources (agriculture), 23% from domestic pointsources and 2% from industrial point sources. Among the crops,production of cereals had the largest contribution to the N-related GWF (18%), followed by vegetables (15%) and oil crops(11%). The river basins with WPL > 1 (where the N load exceeds the basin’s assimilation capacity), cover about 17% of theglobal land area, contribute about 9% of the global river discharge, and provide residence to 48% of the global population.
■ INTRODUCTION
Increased use of nitrogen (N) has both positive and negativeeffects.1 The increase in crop yields over the past decades ispartly due to the increased use of fertilizer in agriculture.However, a large fraction of N applied to croplands in the formof fertilizer and manure ends up entering the freshwater systemcausing degradation of the water quality and eutrophication ofgroundwater, rivers, lakes, and coastal and marine ecosystems.2
Human-induced eutrophication of rivers, lakes, estuaries andcoastal seas has already resulted in loss of biodiversity, hypoxiaand fish kills in many parts of the world.3−11
As a measure to quantify the pressure that additional N putson freshwater resources, we use the gray water footprint(GWF). More broadly, the water footprint is an indicator ofhuman appropriation of freshwater resources. It measures boththe direct and indirect “water use” of consumers and producers.The term “water use” refers to two different components:consumptive water use (of rainwater−the green water foot-print−and of surface and groundwater−the blue waterfootprint) and degenerative water use (the gray waterfootprint). GWF is measured as the volume of water requiredto assimilate pollution and can be interpreted as a dilutionwater requirement, a concept that can be traced back to Postelet al.12 and Chapagain et al.13 The “gray water footprint” wasfirst introduced by Hoekstra and Chapagain14 and defined asthe volume of fresh water that is required to assimilate the loadof pollutants based on natural background concentration andexisting ambient water quality standards.15 The advantage ofexpressing water pollution in terms of the water volume
required for assimilating the pollutants, rather than in terms ofconcentrations of contaminants, is that this brings waterpollution into the same unit as consumptive use, as shown byHoekstra and Mekonnen.16 In this way, the use of water as adrain and the use of water as a resource, two competing uses,become comparable.We will use the concept of water pollution level (WPL) to
express the effect of a GWF per river basin on the water qualityin this basin. WPL is defined as the GWF in a river basindivided by the river basin runoff.15 The GWF refers to thevolume of water (m3/y) required for the assimilation(“dilution”) of the load of pollutants; the maximum sustainableGWF (the “waste assimilation capacity”) is given by the actualvolume of water available, which is the river basin runoff (m3/y). WPL thus shows the fraction of the waste assimilationcapacity in a river basin that has been actually consumed. IfWPL = 1, the waste assimilation capacity has been fullyconsumed. WPL > 1 implies that waste assimilation capacity ofthe basin is insufficient to take up the actual pollution, resultingin a violation of water quality standards.There are a few previous global studies that quantify the
global anthropogenic N load to fresh water from all sectors(agricultural, domestic and industrial) at a high spatialresolution.16−28 Some other global high-resolution studies
Received: July 1, 2015Revised: September 23, 2015Accepted: October 6, 2015Published: October 6, 2015
Article
pubs.acs.org/est
© 2015 American Chemical Society 12860 DOI: 10.1021/acs.est.5b03191Environ. Sci. Technol. 2015, 49, 12860−12868

focused on one sector only, for example, agriculture29 ordomestic waste.30,31 Only two earlier studies quantified theglobal N-related GWF,16,25 and only one previous studyestimated N-related WPLs across the globe.25 Mekonnen andHoekstra32 made the first estimate of the global N-related GWFfor a large number of crops at a spatial resolution of 5 by 5 arc-minute, using a simple model with a fixed N leaching-runofffraction, thus leaving out local factors such as crop type grown,soil type and agricultural practices that can influence processesof leaching and runoff. Hoekstra and Mekonnen16 made thefirst estimate of the overall N-related GWF, by supplementingthe agriculture-focused data from Mekonnen and Hoekstra32
with estimates of the GWF’s from the domestic and industrialsector. The GWF was estimated roughly by assuming it to beequal to untreated return flows from the two sectors. Liu et al.25
made another, independent estimate of the global N-relatedGWF, including all three sectors, and was the first to estimateresultant WPLs per river basin. The study focused on showingthe geographical spread of WPLs and did not relate the waterpollution to specific sectors (agriculture, domestic, industrial),or, with respect to the water pollution from agriculture, tospecific crops.The present study estimates gray water footprints and water
pollution levels associated with anthropogenic N loads at globalscale at a 5 by 5 arc minute resolution and relates the pollutionto specific sectors and crops. The analysis is carried out for theperiod 2002−2010. The novelty of the study is that, for the firsttime, N-related water pollution levels are estimated at a highspatial resolution level and related to specific sectors, and tospecific crops in the case of the agricultural sector. We achievethis by combining the strengths of three earlier studies: (1)Hoekstra and Mekonnen16 who estimate N-related loads andgray water footprints per sector and crop, but assuming simpleleaching-runoff ratios for diffuse pollution and not comparinggray water footprints to sustainable levels; (2) Bouwman etal.,17 who use a more advanced soil balance approach forestimating diffuse N loads; and (3) Liu et al.25 who comparegray water footprints to maximum sustainable levels at riverbasin level in order to calculate water pollution levels, but donot specify gray water footprints and water pollution levels bysector or crop.
■ MATERIALS AND METHODSThe Anthropogenic Nitrogen Load to Fresh Water.
Diffuse N loads to fresh water from agriculture were estimatedfor 126 crops separately. We took spatial crop distributionsfrom Monfreda et al.33 The application rate of artificial fertilizerper crop per country was calculated using three sources ofartificial fertilizer data. Primarily, we used the data set of IFA etal.,34 which provides artificial fertilizer application rates per cropfor 88 countries. We used FAO35 and Heffer36 to complementthis data set. Since the application rates provided in these datasources refer to different years, these were adjusted to fit FAO37
country average artificial fertilizer consumption per year for theperiod 2002−2010. The manure input was calculated at gridcell level by multiplying livestock density (taken from FAO38)by the animal-specific excretion rates. The animal-specificexcretion rate per animal category, production system andcountry was calculated by combining global average manureexcretion rates from Sheldrick et al.39 with the slaughter weightof animals per production system and per country, as takenfrom FAO.37 The volume of manure actually applied oncropland was estimated by accounting for the collection rate
and the allocation of collected manure over croplands versuspasture. In this study, we considered manure inputs oncroplands (including managed grasslands), but did not furtherstudy manure inputs on grazing lands. We grouped the cropsinto leguminous, irrigated and nonleguminous in order toestimate the N input through biofixation. Atmospheric Ndeposition rates for the year 2000 were taken from Dentener etal.40 The nutrient input through irrigation water was calculatedfor irrigated croplands by multiplying the N content ofirrigation water (in kg of N per cubic meter) by the irrigationapplication rate (in m3/ha per year). We adopted the average Ncontent of irrigation water as provided by Lesschen et al.:41 3.3mg/L. The irrigation application rates at 5 × 5 arc minutespatial resolution for all crops under irrigation were obtainedfrom Mekonnen and Hoekstra.42 The N removal withharvested crops was estimated by multiplying the crop yieldby the crop-specific N content. The N removal with cropresidues was calculated by multiplying the yield of crop residueby the nutrient content of the crop residue and a residualremoval factor. We adopted the approach of Liu et al.29 tocalculate the nutrient loss through erosion. We employed theempirical model of Bouwman et al.43 to calculate ammoniavolatilization and Bouwman et al.44 to estimate N loss throughN2O and NO from the application of animal manure andartificial fertilizers. Denitrification (emission of N2) in the soilwas calculated as a fraction of the N surplus after accounting forammonia volatilization and N removal with the harvest of cropand crop residue.27 Leaching and runoff of Nthe movementof N from the soil to ground or surface waterswas estimatedby assuming balance of N in the soil in the long term. Finally,we estimated, still at grid cell level, the anthropogenic N load tofresh water (i.e., the load due to artificial fertilizer and manureapplication) by multiplying the total leached volume by thefraction of N input from artificial fertilizer and manure to thetotal N input (which also includes the amounts of N addedthrough biofixation, deposition and irrigation water).To estimate N loads from diffuse sources, we followed the
approach of Bouwman et al.,17 which uses a full soil balanceapproach, accounting for precipitation and soil properties forestimating gaseous losses from the soil. The soil parameterswere obtained from Batjes.45 The precipitation data for theperiod 2002−2010 were obtained from the Climate ResearchUnit of the University of East Anglia.46 The rooting depths forindividual crops were obtained from Allen et al.47
N loads from point sources were estimated based on dietaryper capita protein consumption per country over the periodfrom 2002 to 2010, using data from FAOSTAT,37 following theapproach of Van Drecht et al.30 The N intake through food isestimated by assuming an average of 16% N content in theprotein consumed.48,49 About 97% of the N intake is assumedto be excreted in the form of urine and faeces and theremainder 3% is lost via sweat, skin, hair, blood, andmiscellaneous.31,50−52 Data on connection to public seweragesystem and the distribution of the different treatment types wascollected from different sources.30,53−55 Since there is lack ofdata on industrial emissions, we have estimated the N loadfrom the industrial sector as a function of the urban domesticload by assuming a ratio of industrial to urban households Nload of 0.10.56−60
An extended description of the method and the data used inestimating N loads is presented in the Supporting Information.
Gray Water Footprint. Following Hoekstra et al.,15 thegray water footprint (GWF, m3/y) is calculated by dividing the
Environmental Science & Technology Article
DOI: 10.1021/acs.est.5b03191Environ. Sci. Technol. 2015, 49, 12860−12868
12861

N load (Load, kg/y) by the difference between the ambientwater quality standard for N (the maximum acceptableconcentration cmax, mg/L) and the natural concentration of Nin the receiving water body (cnat, in mg/L):
=−
LoadC C
GWF( )max nat (1)
The natural concentration is the concentration in a waterbody if it were in pristine condition, before human disturbancesin the catchment. In the literature we can find different valuesfor maximum allowable and natural concentrations. Liu et al.25
use 3.1 mg N/L for the maximum concentration and 1.5 mg N/L for the natural concentration. For this study we have takenthe maximum acceptable value provided by the GWFguidelines,61 2.9 mg N/L, which again is based on the guidelinefor the protection of aquatic life as proposed by the CanadianCouncil of Ministers of the Environment.62 The GWFguidelines from the Water Footprint Network suggest a naturalconcentration value for total N of 0.36 mg N/L,61 which isclose to the average natural concentration of N in rivers of0.375 mg N/L reported by Meybeck.63 In this study, weassumed a rounded off value of 0.4 mg N/L.Water Pollution Level. The water pollution level (WPL),
which measures the degree of pollution within a catchment, isestimated as the ratio of the total of GWF in a catchment to theactual runoff from that catchment (Ract, m
3/y):
=R
WPLGWF
act (2)
The annual actual runoff data at a 30 by 30 arc minuteresolution were obtained from the Composite Runoff V1.0database.64
Since many model inputs and parameters are uncertain, weassessed the sensitivity of the GWF estimation to uncertaintiesin input data. We used Latin hypercube sampling (LHS)65 andassumed uncertainty ranges of ±20% for the major modelinputs and parameters (artificial fertilizer and manureapplication rate, N biofixation rate, atmospheric deposition, Ninput with irrigation water, N removal with harvested crops andcrop residues, protein intake, urban population, sewerconnection, N removal in sewerage treatment, and themaximum allowable and natural concentrations). We did1000 runs for the two nutrient loads (diffuse and pointsources) and estimated resultant GWF ranges by accounting forthe uncertainty ranges (±20%) for all the major parametersmentioned above.
■ RESULTS
Gray Water Footprint Related to Nitrogen. The totalleaching and runoff of N from the world’s croplands isestimated at 35 million tonne N/y, of which 70% (24.4 milliontonne N/y) originated from anthropogenic sources (fertilizers,manure). The global N load to freshwater bodies from pointsources was about 8.2 million tonne of N per year (91%domestic and 9% industry). Thus, the global anthropogenic Nload to fresh water systems from both diffuse and point sourcesin the period 2002−2010 was 32.6 million tonnes per year. TheSupporting Information provides further details on theestimated global anthropogenic N load from agriculture tofresh water. The global GWF related to the total anthropogenicN load−from both diffuse and point sources−was 13 × 1012
m3/y (Table 1). China contributed about 45% to this globaltotal, the U.S. about 7%, Russia 6% and India 5%.
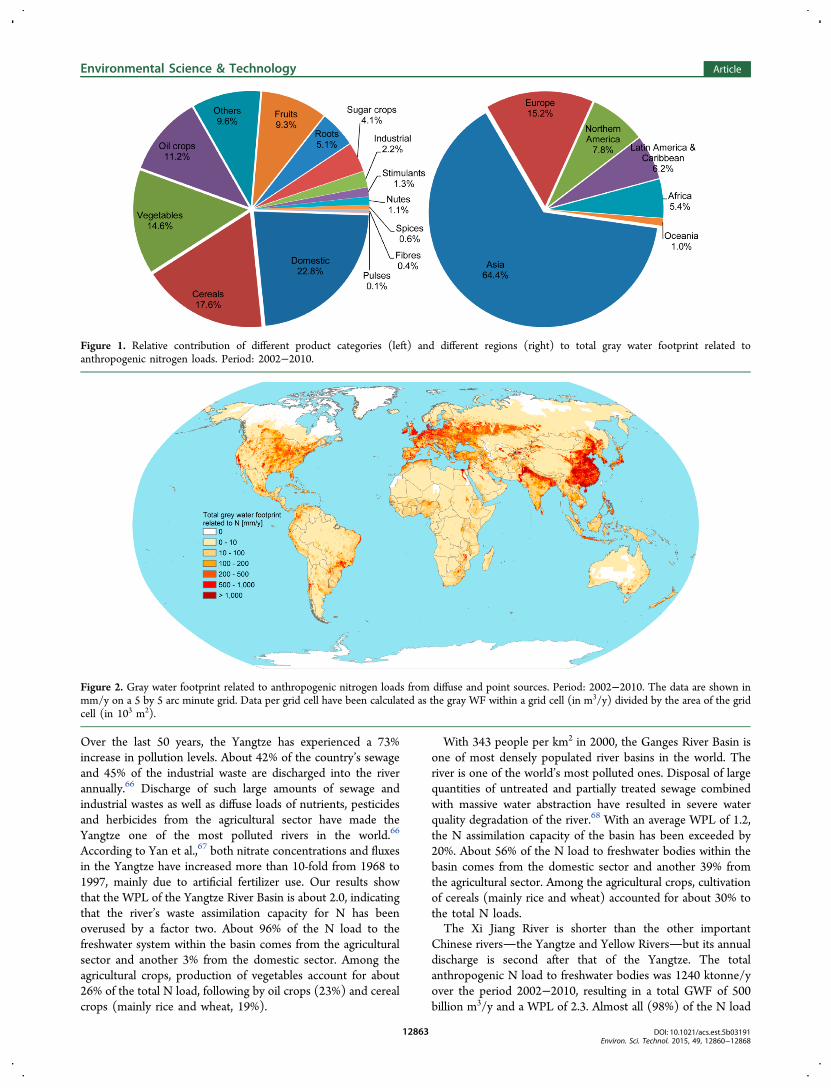
The contributions of different product categories anddifferent regions to the global GWF related to anthropogenicN loads to fresh water are presented in Figure 1. The largestshare (75%) comes from diffuse sources, that is, N leaching andrunoff from croplands. Cereal production contributes 18% tothe global N-related GWF (wheat 7% and maize 6%),production of vegetables 15% (tomatoes 1.1%) and oil crops11% (soybean and rapeseed 3.1% each and cotton 2.4%). Nloads from the domestic sector account for 23% of the total andthe industrial sector 2%. Looking at the regional contribution,we find that Asia (mainly China) contributed almost two-thirdsto the total GWF, followed by Europe (15%), NorthernAmerica (8%) and Latin America and the Caribbean (6%).Figure 2 shows the global GWF at high spatial resolution.
The spatial variation of GWF correlates to the spatial variationof the nutrient loads, which are highest in areas of intensiveagriculture and densely populated areas. Large GWFs areobserved in Southeastern China, Northern India, WesternEurope, Midwestern U.S., the Nile delta in Egypt, South EastBrazil and the Central Valley in Chile.
Water Pollution Level. The water pollution level (WPL)related to anthropogenic N loads is shown in Figure 3. Thebasins with WPL > 1, together cover about 17% of the globalland area (excluding Antarctica), 9% of the global riverdischarge, and provide residence to about 48% of the globalpopulation. River basins in most parts of Asia, Western Europe,Southwestern U.S., Northern and Southern Africa, Argentina,and Australia have WPL > 1. In most of these basins, the largehuman induced N loads are responsible for the high WPL, butthe high WPL levels observed in the Saharan desert, ArabianPeninsula, and large parts of Australia are due to the very lowrunoff levels in these basins to assimilate N.Table 2 presents the GWF and WPL related to
anthropogenic N loads for the major river basins of theworld. Out of the 20 river basins listed, seven basins have aWPL > 1. In order to identify to what extent each economicsector and different agricultural products contribute to thenutrient loads, we will present a detailed analysis of the nutrientloads and the WPL in these seven basins in the next section.
Water Pollution Level in Selected River Basins. TheYangtze River, or Chang Jiang (“Long River”), is world’s thirdlongest river, ranking behind the Nile and the Amazon Rivers.
Table 1. Global Gray Water Footprint Related to NitrogenLoads to Fresh Water Per Sector and Specification for theTen Countries with the Largest Contribution (Billion m3/y)
region agriculture domestic industry total
China 4916 891 68 5875U.S. 636 224 21 881Russia 616 107 10 733India 458 192 23 674Pakistan 262 23 3 288Brazil 195 102 16 312Egypt 149 28 4 181Japan 41 114 12 167Germany 107 26 2 134Ukraine 112 32 3 147others 2275 1235 127 3637world total 9767 2974 288 13 029
Environmental Science & Technology Article
DOI: 10.1021/acs.est.5b03191Environ. Sci. Technol. 2015, 49, 12860−12868
12862
Over the last 50 years, the Yangtze has experienced a 73%increase in pollution levels. About 42% of the country’s sewageand 45% of the industrial waste are discharged into the riverannually.66 Discharge of such large amounts of sewage andindustrial wastes as well as diffuse loads of nutrients, pesticidesand herbicides from the agricultural sector have made theYangtze one of the most polluted rivers in the world.66
According to Yan et al.,67 both nitrate concentrations and fluxesin the Yangtze have increased more than 10-fold from 1968 to1997, mainly due to artificial fertilizer use. Our results showthat the WPL of the Yangtze River Basin is about 2.0, indicatingthat the river’s waste assimilation capacity for N has beenoverused by a factor two. About 96% of the N load to thefreshwater system within the basin comes from the agriculturalsector and another 3% from the domestic sector. Among theagricultural crops, production of vegetables account for about26% of the total N load, following by oil crops (23%) and cerealcrops (mainly rice and wheat, 19%).
With 343 people per km2 in 2000, the Ganges River Basin isone of most densely populated river basins in the world. Theriver is one of the world’s most polluted ones. Disposal of largequantities of untreated and partially treated sewage combinedwith massive water abstraction have resulted in severe waterquality degradation of the river.68 With an average WPL of 1.2,the N assimilation capacity of the basin has been exceeded by20%. About 56% of the N load to freshwater bodies within thebasin comes from the domestic sector and another 39% fromthe agricultural sector. Among the agricultural crops, cultivationof cereals (mainly rice and wheat) accounted for about 30% tothe total N loads.The Xi Jiang River is shorter than the other important
Chinese riversthe Yangtze and Yellow Riversbut its annualdischarge is second after that of the Yangtze. The totalanthropogenic N load to freshwater bodies was 1240 ktonne/yover the period 2002−2010, resulting in a total GWF of 500billion m3/y and a WPL of 2.3. Almost all (98%) of the N load
Figure 1. Relative contribution of different product categories (left) and different regions (right) to total gray water footprint related toanthropogenic nitrogen loads. Period: 2002−2010.
Figure 2. Gray water footprint related to anthropogenic nitrogen loads from diffuse and point sources. Period: 2002−2010. The data are shown inmm/y on a 5 by 5 arc minute grid. Data per grid cell have been calculated as the gray WF within a grid cell (in m3/y) divided by the area of the gridcell (in 103 m2).
Environmental Science & Technology Article
DOI: 10.1021/acs.est.5b03191Environ. Sci. Technol. 2015, 49, 12860−12868
12863

within the basin was due to intensive agriculture, mainly relatedto the production of rice, maize, and vegetables.The Indus River Basin is a densely populated basin facing
severe water scarcity almost three-quarters of the year69 andhigh nutrient pollution due to intensive agricultural activities.The total N load to fresh water in the basin was 1100 ktonne/y.A large part (59%) of the N load came from agriculture; thedomestic sector contributed 38%. Cultivation of cereal crops(wheat and rice) contributes about 34% to the totalanthropogenic N load in the basin; oil crops contribute 14%.The total GWF within the basin related to N was 440 billionm3/y, resulting in a WPL of 3.0.
The Drainage Basin of the Aral Sea is shared by Uzbekistan,Turkmenistan, Kazakhstan, Afghanistan, Tajikistan, and Kyr-gyzstan. Due to intensive use of the rivers flowing to the AralSea for irrigation, the sea has been shrinking since the 1960s.70
Three quarters of the anthropogenic N load within the basin isdue to the untreated sewage from the domestic sector. A totalof 700 ktonne/y was emitted in the basin. The total GWF inthe basin was 280 billion m3/y, which is close to 4 times largerthan the actual runoff of the river basin, indicating that theassimilation capacity of the basin was overused by a factor of 4.The Yellow River, China’s second longest river, originates in
the Bayankala Mountains in Qinghai province in western Chinaand flows through nine provinces of China before it drains intothe Bohai Sea. The Yellow River is the water source forNorthwest and North China. Deterioration of water quality is avery serious issue in the basin.71 During the period 2002−2010,a total of 1000 ktonne/y N was emitted to freshwater bodies inthe basin. The agricultural sector (mainly wheat, maize, andvegetables) accounted for 95% of the total N load and thedomestic sector 5%. The total GWF associated with theanthropogenic N load was 410 billion m3/y, resulting in a WPLof 8.3, indicating that the GWF exceeded the assimilationcapacity by more than a factor of 8.The Murray-Darling Basin is Australia’s most important
agricultural area, known as the country’s breadbasket. Thesurface waters of the basin have exhibited toxic blue-green algalblooms due to excessive nutrient levels.72 During the period2002−2010, the total anthropogenic N load in the basin was 80ktonne/y. The agricultural sector (mainly cultivation of fruits,cereals and “other crops”), accounted for 96% of the total Nload. The domestic sector contributed a further 3%. The totalGWF was 1.8 times larger than the actual runoff of the basin,resulting a WPL about 1.8.
■ DISCUSSION
Our estimate of the global N leaching-runoff from diffusesources is 52% larger than the estimate by Liu et al.29 and 15−39% smaller than the estimates by Bouwman et al.17,20 (Table3). The two studies by Bouwman et al.17,20 include values for
Figure 3. Water pollution level per river basin related to anthropogenic N loads from diffuse and point sources. Period: 2002−2010.
Table 2. Gray Water Footprint and Water Pollution LevelRelated to Anthropogenic N Loads for 20 Major RiverBasins, Period: 2002−-2010
basinannual runoff(billion m3/y)
population(million)
GWF (billionm3/y) WPL
Amazon 6590 26 60 0.009Congo 1270 66 13 0.01Yangtze 903 384 1800 2.0Mississippi 623 73 410 0.65Parana 542 69 170 0.30Mekong 482 52 70 0.15Ganges 397 417 480 1.2Ob 396 26 160 0.39Amur 362 66 290 0.80Niger 330 74 50 0.15Nile 326 145 130 0.39Zambezi 325 30 44 0.14Volga 269 59 240 0.90Xi Jiang 221 63 500 2.3Danube 208 82 130 0.64Indus 148 150 440 3.0Rhine 76 50 55 0.71Aral Drainage 70 27 280 4.0Huang He(Yellow)
49 121 410 8.3
Murray-Darling
18 2 32 1.8
Environmental Science & Technology Article
DOI: 10.1021/acs.est.5b03191Environ. Sci. Technol. 2015, 49, 12860−12868
12864

grassland in addition to croplands, which may explain theirhigher values.
There is a large difference between the global GWF estimatein the current study and the earlier conservative estimate byHoekstra and Mekonnen.16 The GWF estimate related todiffuse N sources in the current study is about 13 times largerthan the earlier estimate, which can be explained by a numberof factors: (1) in the current study we have taken a 4× stricterassumption on the assimilation capacity of freshwater bodies (adifference between the maximum allowable and natural Nconcentration of 2.5 mg/L instead of 10 mg/L); (2) thecomputed global-average leaching-runoff fraction of applied Nin the current study was 1.8× larger than the assumed constantfraction in the earlier study (leaching-runoff of 18% of the Napplication instead of 10%); (3) the global artificial fertilizerapplication in the current study is 1.3× larger (partly because amore recent period of analysis was taken); and (4) in contraryto the earlier study, the current study includes the contributionof manure, which results in a 1.4× higher total N application.The GWF estimate related to N from domestic wastewater inthe current study is about ten times larger than the earlierestimate, which can be explained by the fact that the currentstudy is based on a model accounting for protein consumptionper country, wastewater treatment coverage and N removalratios, while the earlier study made a rough, conservativeestimate based on the assumption of a dilution factor of 1 foruntreated wastewater discharged to the freshwater systems. TheGWF estimate related to N from the industrial sector in thecurrent study is about 80% of the earlier estimate.The spatial distribution of the WPLs estimated in the current
study is roughly in line with the earlier study by Liu et al.,25 butin many river basins, estimates differ substantially. The twostudies differ in many respects−in both model and data sourcesused−so that at this stage it is difficult to explain specificdifferences in outcomes. A more detailed comparative analysisof different approaches will be necessary.The estimated N loads to fresh water from both diffuse and
point sources are based on a number of assumptions and globaldata sets, leading to significant uncertainties. First, due to a lackof spatially distributed data, a number of assumptions had to bemade regarding, for example, artificial fertilizer application ratesper crop and per country, nutrient removal by crop harvest andremoved crop residues, and manure production and applicationrates. Second, to estimate N leaching and runoff, the studyassumed a long-term steady state condition in the soil regardingN content, which might not hold true in all places. Third,emissions from domestic sources were based on proteinconsumption, wastewater treatment coverage and nutrientremoval in the wastewater treatment plants, while other point
sources such as household solid waste, urban livestock andother domestic animal wastes were not included. Fourth, due toa lack of data, the emission from the industrial sector wasestimated as a certain fraction of that from the domestic sector.The GWF and WPL estimates are subject to the assumed
maximum allowable and natural concentration values. BothGWF and WPL relate linearly to the assimilation capacity of afreshwater system, that is, the difference between the maximumallowable and natural concentration. Natural concentrationsvary from basin to basin and different ecosystems may have adifferent response to N loads, requiring different maximumallowable concentration values. However, obtaining orestimating basin-specific values is an elaborate task and in thisstage impossible for a global study like this one, which has beenthe reason why we have taken single values for both themaximum allowable and natural concentrations for the wholeworld. The WPL estimates from this study can be improvedonce better spatially distributed data on natural and maximumallowable concentrations become available. A complicationthough with differentiating maximum allowable concentrationsper basin or country is that different governments applydifferent methods to establish water quality standards, so thatdifferences in standards among countries do not only reflectdifferences in the sensitivity of basins, but also subjectivechoices regarding the method to establish the standard. Thishas been another reason for us to use one standard in thecurrent study for the whole world rather than differentstandards per country.We note that WPLs inversely relate to basin runoff, which
can lead to high values and great sensitivity in dry basins.Further, we observe that we measure GWFs at the point whereanthropogenic N loads enter the water system, not based onwhat is left of anthropogenic loads downstream. WPL thusreflects total load divided by critical load, measured at the pointwhere loads enter the water system. When measureddownstream, WPL could be lower than estimated in thisstudy due to the effect of in-stream retention and trans-formation of N. Besides, the study does not account for spatialheterogeneities within catchments and variability within theyear, which means that the data presented are annual averagesat catchment level.If we assume uncertainty ranges of ±20% for all important
inputs and parameter values (artificial fertilizer and manureapplication rate, N biofixation rate, atmospheric deposition, Ninput with irrigation water, N removal with harvested crops andcrop residues, protein intake, urban population, sewerconnection, N removal in sewerage treatment, and themaximum allowable and natural concentrations), we find anuncertainty range of −33% to +60% in the overall global GWFestimate.In this study we have focused on water pollution levels
through anthropogenic N loads. It is important to note that amore comprehensive picture of water pollution can be obtainedonly if other pollutants are considered as well and if thepossible interaction of pollutants is taken into account.Through its focus on N loads, the study provides informationabout the pressure on the water system from nitrogen ratherthan about the final impacts within the system, which dependon various processes within the water system.The nitrogen-related gray water footprint has some similarity
to the more recently introduced nitrogen footprint concept,which is generally defined as the total amount of reactivenitrogen (all forms of N except N2) released to the
Table 3. Comparison of the Estimated Overall Diffuse NLoad from the World’S Croplands to Fresh Water with theResults from Previous Studies
studyN leaching and runoff to fresh water from
diffuse sources (million tonne N/y) study period
Liu et al.29 23 2000Bouwman etal.20
41 2000
Bouwman etal.17
57 2000
currentstudy
35 2002−2010
Environmental Science & Technology Article
DOI: 10.1021/acs.est.5b03191Environ. Sci. Technol. 2015, 49, 12860−12868
12865

environment in relation to a specific product or consumptionpattern.73,74 The difference is that the N-related gray WFfocuses on release of N to freshwater systems and translates theN load into a volume of water to assimilate. In this way, thegray WF concept allows different forms of water pollution beexpressed in one unit, namely the volume of water needed forassimilation. Both the gray water footprint and the nitrogenfootprint concept focus on pressure on the environment, ratherthan at impacts, which will depend on the scale of the overallemission and processes of dispersion and removal later on.With the growth in international trade of agricultural
products, importing countries increasingly externalize waterpollution to the producing countries.16,75 In the current studywe have quantified gray WFs within geographies; the resultsfrom this study can be taken forward to study the gray WF froma consumer perspective by linking consumption volumes incertain countries to the places of production and to the relatedgray WFs in these places of production.Despite the uncertainties, our results provide an insight into
the magnitude and spatial distribution of the N-related GWFsand WPLs. The study shows that the total GWF related to aglobal anthropogenic N load of 32.6 million tonnes per yearwas 13 × 1012 m3/y. Close to half of this (45%) wascontributed by China; the U.S., Russia, and India togethercontributed another 18%. The study also shows that the WPLin a large number of river basins was above 1, which means thatthe waste assimilation capacity in these basins has been fullyconsumed just by N pollution alone. The river basins with WPL> 1 cover about 17% of the global land area, 9% of the globalriver discharge, and provide residence to about 48% of theglobal population.In some developing countries (particularly in Africa), raising
crop yield may require additional N input, whereas in manyregions of the world, crops receive excessive amounts of N. Inthese regions, excessive application of N can be reducedwithout affecting agricultural productivities.2 Besides, waste-water treatment coverage and N removal rates can dramaticallyincrease in many parts of the world by applying advancedtertiary treatment techniques. Nevertheless, in a business-as-usual scenario, N-related water pollution is expected to increaseover the coming decades.25 We propose that nationalgovernments develop GWF reduction targets that account forthe assimilation capacity of river basins. Trans-boundary riverbasin will require international cooperation in formulating andimplementing such targets.
■ ASSOCIATED CONTENT*S Supporting InformationThe Supporting Information is available free of charge on theACS Publications website at DOI: 10.1021/acs.est.5b03191.
Additional information as noted in the text (PDF)
■ AUTHOR INFORMATIONCorresponding Author*Phone: +31-53-4896879; fax: +31-53-4895377; e-mail: [email protected] authors declare no competing financial interest.
■ ACKNOWLEDGMENTSThis research was partly supported by the EuropeanCommunity FP7 project CREEA (Compiling and Refining
Environmental and Economic Accounts), grant agreement no.:265134. This study was partially developed within theframework of the Panta Rhei Research Initiative of theInternational Association of Hydrological Sciences (IAHS).
■ REFERENCES(1) Galloway, J. N.; Cowling, E. B. Reactive Nitrogen and TheWorld: 200 Years of Change. Ambio 2002, 31 (2), 64−71.(2) Vitousek, P. M.; Naylor, R.; Crews, T.; David, M. B.; Drinkwater,L. E.; Holland, E.; Johnes, P. J.; Katzenberger, J.; Martinelli, L. A.;Matson, P. A.; Nziguheba, G.; Ojima, D.; Palm, C. A.; Robertson, G.P.; Sanchez, P. A.; Townsend, A. R.; Zhang, F. S. Nutrient Imbalancesin Agricultural Development. Science 2009, 324 (5934), 1519−1520.(3) Smith, V. Eutrophication of freshwater and coastal marineecosystems a global problem. Environ. Sci. Pollut. Res. 2003, 10 (2),126−139.(4) Landsberg, J. H. The Effects of Harmful Algal Blooms on AquaticOrganisms. Rev. Fish. Sci. 2002, 10 (2), 113−390.(5) Lewitus, A. J.; Horner, R. A.; Caron, D. A.; Garcia-Mendoza, E.;Hickey, B. M.; Hunter, M.; Huppert, D. D.; Kudela, R. M.; Langlois,G. W.; Largier, J. L.; Lessard, E. J.; RaLonde, R.; Jack Rensel, J. E.;Strutton, P. G.; Trainer, V. L.; Tweddle, J. F. Harmful algal bloomsalong the North American west coast region: History, trends, causes,and impacts. Harmful Algae 2012, 19 (0), 133−159.(6) Anderson, D.; Glibert, P.; Burkholder, J. Harmful algal bloomsand eutrophication: Nutrient sources, composition, and consequences.Estuaries 2002, 25 (4), 704−726.(7) Vitousek, P. M.; Aber, J. D.; Howarth, R. W.; Likens, G. E.;Matson, P. A.; Schindler, D. W.; Schlesinger, W. H.; Tilman, D. G.Technical Report: Human Alteration of the Global Nitrogen Cycle:Sources and Consequences. Ecological Applications 1997, 7 (3), 737−750.(8) Bennett, E. M.; Carpenter, S. R.; Caraco, N. F. Human Impact onErodable Phosphorus and Eutrophication: A Global Perspective.BioScience 2001, 51 (3), 227−234.(9) Tilman, D. Global environmental impacts of agriculturalexpansion: The need for sustainable and efficient practices. Proc.Natl. Acad. Sci. U. S. A. 1999, 96 (11), 5995−6000.(10) Tilman, D.; Fargione, J.; Wolff, B.; D’Antonio, C.; Dobson, A.;Howarth, R.; Schindler, D.; Schlesinger, W. H.; Simberloff, D.;Swackhamer, D. Forecasting Agriculturally Driven Global Environ-mental Change. Science 2001, 292 (5515), 281−284.(11) USEPA. Reactive Nitrogen in the United States: An Analysis ofInputs, Flows, Consequences, and Management OptionsA Report of theScience Advisory Board; United States Environmental ProtectionAgency (US EPA): Washington, DC, 2011.(12) Postel, S. L.; Daily, G. C.; Ehrlich, P. R. Human Appropriationof Renewable Fresh Water. Science 1996, 271 (5250), 785−788.(13) Chapagain, A. K.; Hoekstra, A. Y.; Savenije, H. H. G.; Gautam,R. The water footprint of cotton consumption: An assessment of theimpact of worldwide consumption of cotton products on the waterresources in the cotton producing countries. Ecological Economics2006, 60 (1), 186−203.(14) Hoekstra, A. Y.; Chapagain, A. K. Globalization of Water: Sharingthe Planet’S Freshwater Resources; Blackwell: Oxford, UK, 2008.(15) Hoekstra, A. Y.; Chapagain, A. K.; Aldaya, M. M.; Mekonnen,M. M. The Water Footprint Assessment Manual: Setting the GlobalStandard; Earthscan: London, UK, 2011.(16) Hoekstra, A. Y.; Mekonnen, M. M. The water footprint ofhumanity. Proc. Natl. Acad. Sci. U. S. A. 2012, 109 (9), 3232−3237.(17) Bouwman, L.; Goldewijk, K. K.; Van Der Hoek, K. W.; Beusen,A. H. W.; Van Vuuren, D. P.; Willems, J.; Rufino, M. C.; Stehfest, E.Exploring global changes in nitrogen and phosphorus cycles inagriculture induced by livestock production over the 1900−2050period. Proc. Natl. Acad. Sci. U. S. A. 2013, 110 (52), 20882−20887.(18) Bouwman, A. F.; Van Drecht, G.; Van Der Hoek, K. W. Globaland regional surface nitrogen balances in intensive agricultural
Environmental Science & Technology Article
DOI: 10.1021/acs.est.5b03191Environ. Sci. Technol. 2015, 49, 12860−12868
12866

production systems for the period 1970−2030. Pedosphere 2005, 15(2), 137−155.(19) Bouwman, A. F.; Van Drecht, G.; Knoop, J. M.; Beusen, A. H.W.; Meinardi, C. R. Exploring changes in river nitrogen export to theworld’s oceans. Glob. Biogeochem. Cycle 2005, 19 (1), GB1002.(20) Bouwman, A. F.; Beusen, A. H. W.; Billen, G. Human alterationof the global nitrogen and phosphorus soil balances for the period1970−2050. Glob. Biogeochem. Cycle 2009, 23, GB0A04.(21) Kroeze, C.; Bouwman, L.; Seitzinger, S. Modeling globalnutrient export from watersheds. Current Opinion in EnvironmentalSustainability 2012, 4 (2), 195−202.(22) Seitzinger, S. P.; Harrison, J. A.; Dumont, E.; Beusen, A. H. W.;Bouwman, A. F. Sources and delivery of carbon, nitrogen, andphosphorus to the coastal zone: An overview of Global NutrientExport from Watersheds (NEWS) models and their application. Glob.Biogeochem. Cycle 2005, 19 (4), GB4S01.(23) Seitzinger, S. P.; Mayorga, E.; Bouwman, A. F.; Kroeze, C.;Beusen, A. H. W.; Billen, G.; Van Drecht, G.; Dumont, E.; Fekete, B.M.; Garnier, J.; Harrison, J. A. Global river nutrient export: A scenarioanalysis of past and future trends. Glob. Biogeochem. Cycle 2010, 24,GB0A08.(24) Mayorga, E.; Seitzinger, S. P.; Harrison, J. A.; Dumont, E.;Beusen, A. H. W.; Bouwman, A. F.; Fekete, B. M.; Kroeze, C.; VanDrecht, G. Global Nutrient Export from WaterSheds 2 (NEWS 2):Model development and implementation. Environmental Modelling &Software 2010, 25 (7), 837−853.(25) Liu, C.; Kroeze, C.; Hoekstra, A. Y.; Gerbens-Leenes, W. Pastand future trends in grey water footprints of anthropogenic nitrogenand phosphorus inputs to major world rivers. Ecol. Indic. 2012, 18 (0),42−49.(26) Kroeze, C.; Seitzinger, S. P. Nitrogen inputs to rivers, estuariesand continental shelves and related nitrous oxide emissions in 1990and 2050: a global model. Nutr. Cycling Agroecosyst. 1998, 52 (2),195−212.(27) Van Drecht, G.; Bouwman, A. F.; Knoop, J. M.; Beusen, A. H.W.; Meinardi, C. R. Global modeling of the fate of nitrogen from pointand nonpoint sources in soils, groundwater, and surface water. Glob.Biogeochem. Cycle 2003, 17 (4), 1115.(28) Seitzinger, S. P.; Kroeze, C. Global distribution of nitrous oxideproduction and N inputs in freshwater and coastal marine ecosystems.Glob. Biogeochem. Cycle 1998, 12 (1), 93−113.(29) Liu, J.; You, L.; Amini, M.; Obersteiner, M.; Herrero, M.;Zehnder, A. J. B.; Yang, H. A high-resolution assessment on globalnitrogen flows in cropland. Proc. Natl. Acad. Sci. U. S. A. 2010, 107(17), 8035−8040.(30) Van Drecht, G.; Bouwman, A. F.; Harrison, J.; Knoop, J. M.Global nitrogen and phosphate in urban wastewater for the period1970 to 2050. Glob. Biogeochem. Cycle 2009, 23, GB0A03.(31) Moree, A. L.; Beusen, A. H. W.; Bouwman, A. F.; Willems, W. J.Exploring global nitrogen and phosphorus flows in urban wastesduring the twentieth century. Glob. Biogeochem. Cycle 2013, 27 (3),836−846.(32) Mekonnen, M. M.; Hoekstra, A. Y. The green, blue and greywater footprint of crops and derived crop products. Hydrol. Earth Syst.Sci. 2011, 15 (5), 1577−1600.(33) Monfreda, C.; Ramankutty, N.; Foley, J. A. Farming the planet:2. Geographic distribution of crop areas, yields, physiological types,and net primary production in the year 2000. Glob. Biogeochem. Cycle2008, 22 (1), GB1022.(34) IFA; IFDC; IPI; PPI; FAO. Fertilizer Use by Crops; Food andAgriculture Organization: Rome, Italy, 2002.(35) FAO. Fertistat On-Line Database; Food and AgricultureOrganization: 2012.(36) Heffer, P. Assessment of Fertilizer Use by Crop at the Global Level2006/07−2007/08; International Fertilizer Industry Association: Paris,2009.(37) FAO. FAOSTAT On-Line Database; Food and AgricultureOrganization, 2012.(38) FAO. Global Livestock Densities, 2012.
(39) Sheldrick, W.; Keith Syers, J.; Lingard, J. Contribution oflivestock excreta to nutrient balances. Nutr. Cycling Agroecosyst. 2003,66 (2), 119−131.(40) Dentener, F.; Stevenson, D.; Ellingsen, K.; van Noije, T.;Schultz, M.; Amann, M.; Atherton, C.; Bell, N.; Bergmann, D.; Bey, I.;Bouwman, L.; Butler, T.; Cofala, J.; Collins, B.; Drevet, J.; Doherty, R.;Eickhout, B.; Eskes, H.; Fiore, A.; Gauss, M.; Hauglustaine, D.;Horowitz, L.; Isaksen, I. S. A.; Josse, B.; Lawrence, M.; Krol, M.;Lamarque, J. F.; Montanaro, V.; Muller, J. F.; Peuch, V. H.; Pitari, G.;Pyle, J.; Rast, S.; Rodriguez, J.; Sanderson, M.; Savage, N. H.; Shindell,D.; Strahan, S.; Szopa, S.; Sudo, K.; Van Dingenen, R.; Wild, O.; Zeng,G. The Global Atmospheric Environment for the Next Generation.Environ. Sci. Technol. 2006, 40 (11), 3586−3594.(41) Lesschen, J.; Stoorvogel, J.; Smaling, E.; Heuvelink, G.;Veldkamp, A. A spatially explicit methodology to quantify soil nutrientbalances and their uncertainties at the national level. Nutr. CyclingAgroecosyst. 2007, 78 (2), 111−131.(42) Mekonnen, M. M.; Hoekstra, A. Y. The Green, Blue and GreyWater Footprint of Crops and Derived Crop Products; 47; UNESCO-IHE: Delft, 2010.(43) Bouwman, A. F.; Boumans, L. J. M.; Batjes, N. H. Estimation ofglobal NH3 volatilization loss from synthetic fertilizers and animalmanure applied to arable lands and grasslands. Glob. Biogeochem. Cycle2002, 16 (2), 1024.(44) Bouwman, A. F.; Boumans, L. J. M.; Batjes, N. H. Modelingglobal annual N2O and NO emissions from fertilized fields. Glob.Biogeochem. Cycle 2002, 16 (4), 1080.(45) Batjes, N. H. ISRIC-WISE derived soil properties on a 5 by 5 arc-minutes global grid (ver 1.2b); 2012/01; ISRIC − World SoilInformation: Wageningen, The Netherlands, 2012.(46) Mitchell, T. D.; Jones, P. D. An improved method ofconstructing a database of monthly climate observations andassociated high-resolution grids. International Journal of Climatology2005, 25 (6), 693−712.(47) Allen, R. G.; Pereira, L. S.; Raes, D.; Smith, M. CropEvapotranspiration: Guidline for Computing Crop Water Requirement;Rome, 1998.(48) Block, R. J.; Bolling, D. The Amino Acid Composition ofProteins and Foods. Science 1946, 103 (2675), 431−432.(49) FAO Food EnergyMethods of Analysis and Conversion Factors;77; Food and Agricultural Organization: Rome, Italy, 2003.(50) FAO; WHO; UNU. Energy and Protein Reqiurements; 724; Foodand Agriculture Organization (FAO), World Health Organization(WHO), and UNU: Geneva, 1985.(51) Calloway, D. H.; Odell, A. C. F.; Margen, S. Sweat andMiscellaneous Nitrogen Losses in Human Balance Studies. Journal ofNutrition 1971, 101 (6), 775−786.(52) Kimura, S. D.; Liang, L.; Hatano, R. Influence of long-termchanges in nitrogen flows on the environment: a case study of a city inHokkaido, Japan. Nutr. Cycling Agroecosyst. 2004, 70 (3), 271−282.(53) UNSD. Environmental Indicators and Selected Time SeriesPopulation Connected to Wastewater Collecting and Treatment System,2014.(54) European Commission. EurostatWastewater Collection andTreatment, 2014.(55) OECD. OECD Environmental Data, Compendium 2006−2008:Inland Waters, 2014.(56) Billen, G.; Garnier, J.; Deligne, C.; Billen, C. Estimates of early-industrial inputs of nutrients to river systems: implication for coastaleutrophication. Sci. Total Environ. 1999, 243−244 (0), 43−52.(57) Luu, T.; Garnier, J.; Billen, G.; Le, T.; Nemery, J.; Orange, D.;Le, L.; N, P. Si budgets for the Red River Delta (northern Vietnam):how the delta affects river nutrient delivery to the sea. Biogeochemistry2012, 107 (1−3), 241−259.(58) Brion, N.; Jans, S.; Chou, L.; Rousseau, V. Nutrient loads to theBelgian coastal zone. Current Status of Eutrophication in the BelgianCoastal Zone; Rousseau, V, Lancelot, C, Cox, D (eds), PressesUniversitaires de Bruxelles, Brussels, Ndepot legal: D/2006/1191/45,2008.
Environmental Science & Technology Article
DOI: 10.1021/acs.est.5b03191Environ. Sci. Technol. 2015, 49, 12860−12868
12867

(59) Quynh, L. T. P.; Billen, G.; Garnier, J.; Thery, S.; Fezard, C.;Minh, C. V. Nutrient (N, P) budgets for the Red River basin (Vietnamand China). Glob. Biogeochem. Cycle 2005, 19 (2), GB2022.(60) Liu, Y. Phosphorus Flows in China: Physical Profiles andEnvironmental Regulation; Wageningen Universiteit, 2005.(61) Franke, N. A.; Boyacioglu, H.; Hoekstra, A. Y. Grey WaterFootprint Accounting: Tier 1 Supporting Guidlines; 65; UNESCO-IHE:Delft, the Netherlands, 2013.(62) CCME Canadian Water Quality Guidelines for the Protection ofAquatic Life; Canadian Council of Ministers of the Environment:Winnipeg, Canada, 2013.(63) Meybeck, M. Carbon, nitrogen and phosphorus transport byworld rives. Am. J. Sci. 1982, 282, 401−450.(64) Fekete, B. M.; Vorosmarty, C. J.; Grabs, W. High-resolutionfields of global runoff combining observed river discharge andsimulated water balances. Glob. Biogeochem. Cycle, 2002, 16 (3),DOI: 10.1029/1999gb001254.(65) Stein, M. Large Sample Properties of Simulations Using LatinHypercube Sampling. Technometrics 1987, 29 (2), 143−151.(66) Wong, C. M.; Williams, C. E.; Pittock, J.; Collier, U.; Schelle, P.World’s Top 10 Rivers at Risk; WWF International: Gland, 2007.(67) Yan, W.; Zhang, S.; Sun, P.; Seitzinger, S. P. How do nitrogeninputs to the Changjiang basin impact the Changjiang River nitrate: Atemporal analysis for 1968−1997. Glob. Biogeochem. Cycle 2003, 17(4), 1091.(68) Trivedi, R. C. Water quality of the Ganga River − An overview.Aquat. Ecosyst. Health Manage. 2010, 13 (4), 347−351.(69) Hoekstra, A. Y.; Mekonnen, M. M.; Chapagain, A. K.; Mathews,R. E.; Richter, B. D. Global Monthly Water Scarcity: Blue WaterFootprints versus Blue Water Availability. PLoS One 2012, 7 (2),e32688.(70) UNECE. Our Waters: Joining Hands Across Borders, FirstAssessment of Transboundary Rivers, Lakes and Groundwaters; EconomicCommission for Europe, Convention on the Protection and Use ofTransboundary Watercourses and International Lakes: Geneva, 2007.(71) Hao, F.-b.; Zhang, X.-s.; Yang, Z.-f. A distributed non-pointsource pollution model: calibration and validation in the Yellow RiverBasin. J. Environ. Sci. 2004, 16 (4), 646−650.(72) Atech Group. Aggregate Nutrient Emissions Study for the Murray-Darling Basin; National Pollutant Inventory, Environment Australia:Canberra, 2000.(73) Leip, A.; Weiss, F.; Lesschen, J. P.; Westhoek, H. The nitrogenfootprint of food products in the European Union. J. Agric. Sci. 2014,152 (SupplementS1), 20−33.(74) Galloway, J. N.; Wilfried, W.; Adrian, L.; Allison, M. L.; Albert,B.; Jan Willem, E. Nitrogen footprints: past, present and future.Environ. Res. Lett. 2014, 9 (11), 115003.(75) O’Bannon, C.; Carr, J.; Seekell, D. A.; D’Odorico, P.Globalization of agricultural pollution due to international trade.Hydrol. Earth Syst. Sci. 2014, 18 (2), 503−510.
Environmental Science & Technology Article
DOI: 10.1021/acs.est.5b03191Environ. Sci. Technol. 2015, 49, 12860−12868
12868